meta-analysis - uc davis health€¦ · – must strike a balance that is appropriate to your ......
TRANSCRIPT

Meta-Analysis
Susan Stewart, Ph.D. Division of Biostatistics
Department of Public Health Sciences May, 2017

Acknowledgements Jimmy Hwang, Ph.D.
UCSF Biostatistics Core
2

Topics Covered
• Definitions: systematic review and meta-analysis • PRISMA checklist: guide to good practice • Example 1: Recently published meta-analysis • Example 2: Meta-analysis calculations
3
Systematic Review
• Attempts to collate all empirical evidence that fits pre-specified eligibility criteria in order to answer a specific research question.
• Uses explicit, systematic methods that are selected with a view to minimizing bias, thus providing more reliable findings from which conclusions can be drawn and decisions made.
4
Cochrane Handbook for Systematic Reviews of Interventions. Version 5.1.0. Updated March 2011.
Key Characteristics
• Clearly stated set of objectives with pre-defined eligibility criteria for studies
• Explicit, reproducible methodology • Systematic search that attempts to identify all
studies that would meet the eligibility criteria • Assessment of the validity of the findings of the
included studies • Systematic presentation and synthesis of the
characteristics and findings of the included studies.
5

What is meta-analysis?
• Meta-analysis is the use of statistical methods to summarize the results of independent studies. – Many systematic reviews contain meta-
analyses, but not all. – Can provide more precise estimates than
individual studies. • Purpose: arrive at conclusions about the
body of research 6
The Logic of Meta-Analysis
• Traditional methods of review focus on statistical significance testing
• Meta-analysis changes the focus to the direction and magnitude of the effects across studies
7

When Can We Do Meta-Analysis?
• Meta-analysis is applicable to collections of research that – examine the same constructs and relationships – have findings that can be configured in a comparable
statistical form (e.g., as effect sizes, correlation coefficients, odds-ratios, etc.)
– are “comparable” given the question at hand • Objective of study (effect or variability) • Population of study • Type of study (RCT, Case-Control, or Case Report) • Patient Characteristics
8
Research Findings Suitable to Meta-Analysis
• Central Tendency Research: prevalence rates • Pre-Post Contrasts: growth rates • Group Contrasts
– experimentally created groups – naturally occurring groups
• Association Between Variables
9

Effect Size: The Key to Meta-Analysis • The effect size makes meta-analysis possible
– it standardizes findings across studies such that they can be directly compared
• Any standardized index can be an “effect size” (e.g., standardized mean difference, correlation coefficient, odds-ratio) as long as it :
– is comparable across studies (generally requires standardization)
– represents the magnitude and direction of the relationship of interest
– is independent of sample size
10

Examples of Different Types of Effect Sizes
• Standardized Mean Difference – group contrast research
• treatment groups • naturally occurring groups
– inherently continuous construct • Odds Ratio
– group contrast research • treatment groups • naturally occurring groups
– inherently dichotomous construct • Correlation Coefficient
– association between variables research 11

Interpreting Effect Size Results • “Rules-of-Thumb”:
– standardized mean difference effect size small = 0.20 medium = 0.50 large = 0.80
– correlation coefficient small = 0.10 medium = 0.25 large = 0.40
– odds-ratio small = 1.50 medium = 2.50 large = 4.30
• A small effect may still be meaningful, depending on the context
12

Preferred Reporting Items for Systematic reviews and Meta-analyses (PRISMA)
• Developed by 29 review authors, methodologists, clinicians, medical editors, and consumers.
• PRISMA statement with 27 item checklist (2009)
• PRISMA-P for systematic review and meta-analysis protocols (17 items, 2015)
13

PRISMA 2009 Checklist
• Title 1. Title: Identify the report as a systematic review,
meta-analysis, or both.
• Abstract 2. Structured summary: Provide a structured
summary including, as applicable: background; objectives; data sources; study eligibility criteria, participants, and interventions; study appraisal and synthesis methods; results; limitations; conclusions and implications of key findings; systematic review registration number.
14

Example 1: Tai et al., 2015
• Calcium intake and bone mineral density: systematic review and meta-analysis – Examined RCTs of dietary sources of calcium or
calcium supplements in older adults to determine whether increasing calcium intake has effects on bone mineral density, and whether the effects differ by calcium source (dietary or supplement).
15
Tai V, Leung W, Grey A, Reid IR, Bolland MJ. BMJ 351:h4183, 2015. doi: 10.1136/bmj.h4183.

Checklist (continued)
• Introduction 3. Rationale: Describe the rationale for the review in
the context of what is already known.
4. Objectives: Provide an explicit statement of questions being addressed with reference to participants, interventions, comparisons, outcomes, and study design (PICOS).
16
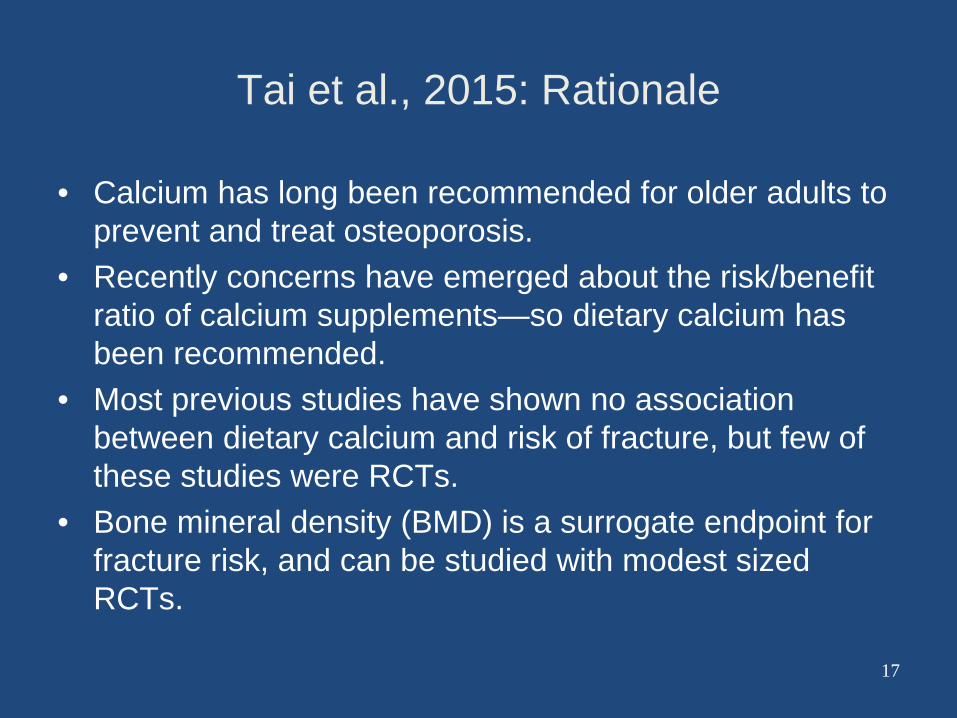
Tai et al., 2015: Rationale
• Calcium has long been recommended for older adults to prevent and treat osteoporosis.
• Recently concerns have emerged about the risk/benefit ratio of calcium supplements—so dietary calcium has been recommended.
• Most previous studies have shown no association between dietary calcium and risk of fracture, but few of these studies were RCTs.
• Bone mineral density (BMD) is a surrogate endpoint for fracture risk, and can be studied with modest sized RCTs.
17

Checklist (continued)
• Methods 5. Protocol and registration: Indicate if a review
protocol exists, if and where it can be accessed (e.g., Web address), and, if available, provide registration information including registration number.
6. Eligibility criteria: Specify study characteristics (e.g., PICOS, length of follow-up) and report characteristics (e.g., years considered, language, publication status) used as criteria for eligibility, giving rationale.
18
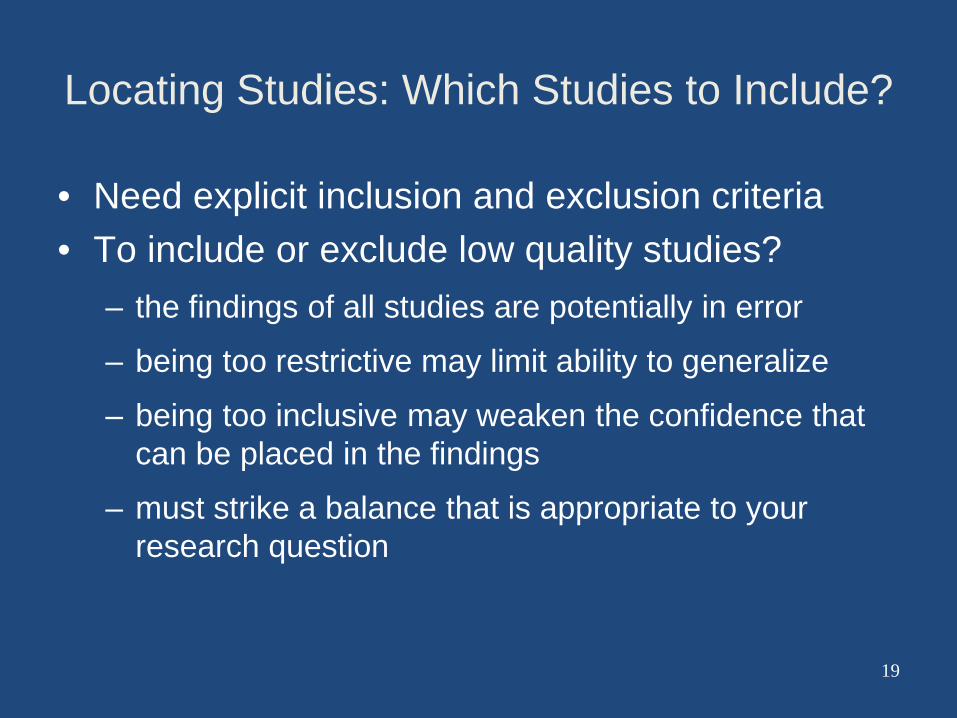
Locating Studies: Which Studies to Include?
• Need explicit inclusion and exclusion criteria • To include or exclude low quality studies?
– the findings of all studies are potentially in error
– being too restrictive may limit ability to generalize
– being too inclusive may weaken the confidence that can be placed in the findings
– must strike a balance that is appropriate to your research question
19

Which Studies to Include? • Want to avoid publication bias • Try to identify and retrieve all studies that
meet the eligibility criteria • Potential sources
– computerized bibliographic databases – authors working in the research domain – conference programs – dissertations – review articles – hand searching relevant journals – government reports, bibliographies,
clearinghouses 20

Tai et al. , 2015: Inclusion/Exclusion Criteria
• Participants aged >50 at baseline • BMD measured by DXA or precursor technology • Included
– Studies reporting bone mineral content (BMC) – Studies of calcium supplements + other treatment, if other
treatment was in both arms – Studies of calcium supplements with vitamin D – Studies of hydroxyapatite as dietary calcium
• Excluded • Studies where most participants had major systemic pathology
other than osteoporosis
21

Checklist (continued)
• Methods 7. Information sources: Describe all information
sources (e.g., databases with dates of coverage, contact with study authors to identify additional studies) in the search and date last searched.
8. Search: Present full electronic search strategy for at least one database, including any limits used, such that it could be repeated.
22

23
Tai et al., 2015—beginning of Appendix 1—Search

Methods 9. Study selection:
State the process for selecting studies (i.e., screening, eligibility, included in systematic review, and, if applicable, included in the meta-analysis).
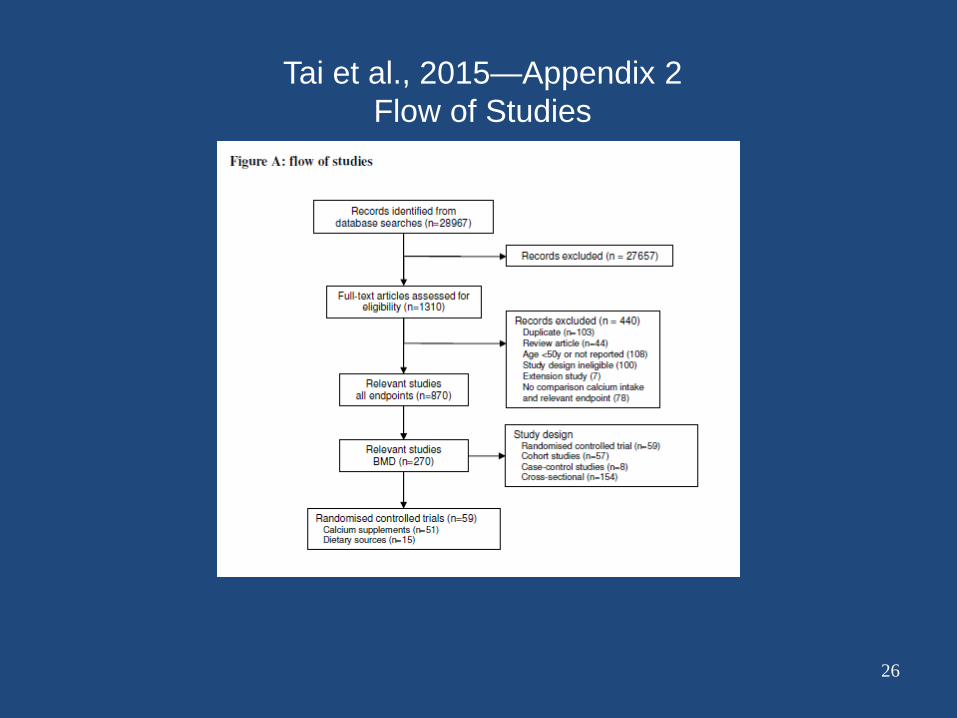
Results 17.Study selection:
Give numbers of studies screened, assessed for eligibility, and included in the review, with reasons for exclusions at each stage, ideally with a flow diagram.
24

Figure 1. Flow of information through the different phases of a systematic review.
Liberati A, Altman DG, Tetzlaff J, Mulrow C, Gøtzsche PC, et al. (2009) The PRISMA Statement for Reporting Systematic Reviews and Meta-Analyses of Studies That Evaluate Health Care Interventions: Explanation and Elaboration. PLoS Med 6(7): e1000100. doi:10.1371/journal.pmed.1000100 http://journals.plos.org/plosmedicine/article?id=info:doi/10.1371/journal.pmed.1000100
26
Tai et al., 2015—Appendix 2 Flow of Studies

Methods 10. Data collection
process: Describe method of data extraction from reports (e.g., piloted forms, independently, in duplicate) and any processes for obtaining and confirming data from investigators.
11. Data items: List and define all variables for which data were sought (e.g., PICOS, funding sources) and any assumptions and simplifications made.
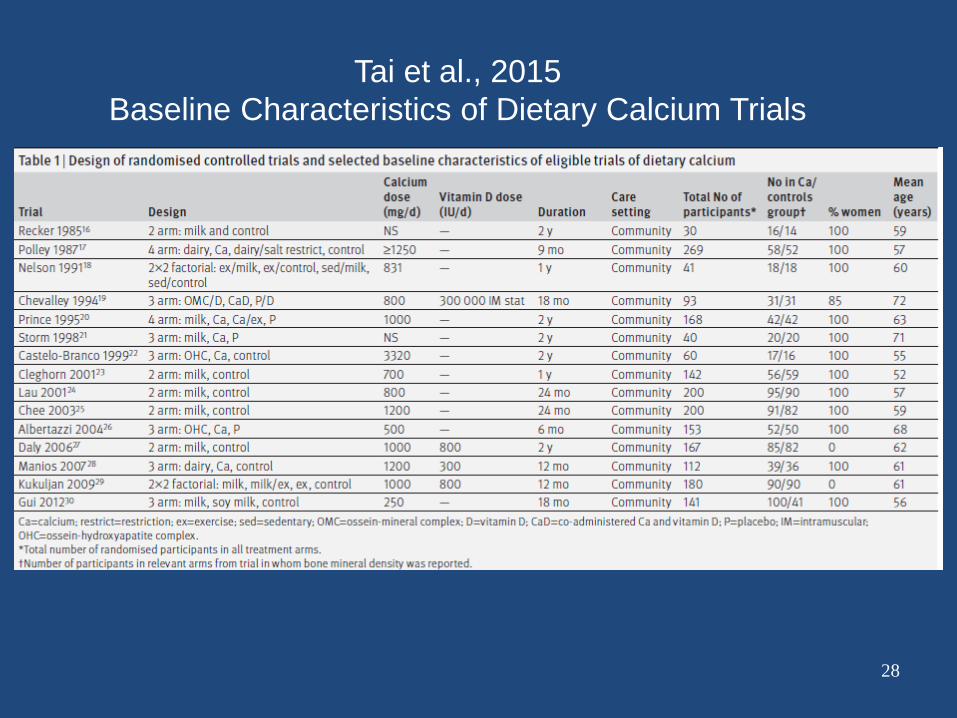
Results 18. Study characteristics:
For each study, present characteristics for which data were extracted (e.g., study size, PICOS, follow-up period) and provide the citations.
27
28
Tai et al., 2015 Baseline Characteristics of Dietary Calcium Trials

Methods 12. Risk of bias in
individual studies: Describe methods used for assessing risk of bias of individual studies (including specification of whether this was done at the study or outcome level), and how this information is to be used in any data synthesis.
Results 19. Risk of bias within
studies: Present data on risk of bias of each study and, if available, any outcome level assessment (see item 12).
29

30
Tai et al., 2015—Appendix 2 Risk of bias—Dietary Calcium Studies
Risk of bias considerations: lack of blinding, high/differential dropout, small study, non-random selection of participants for BMD measurement. IF=independent funders, Ind=industry, Tab=tablets/milk provided by industry

Methods 13.Summary measures:
State the principal summary measures (e.g., risk ratio, difference in means).
Results 20.Results of individual
studies: For all outcomes considered (benefits or harms), present, for each study: (a) simple summary data for each intervention group (b) effect estimates and confidence intervals, ideally with a forest plot.
31

Tai et al., 2015—Primary Endpoints
• % changes in BMD from baseline • 5 BMD sites
– Lumbar spine – Femoral neck – Total hip – Forearm – Total body
• 3 durations – 1 year (< 18 months) – 2 years (18 months – 2.5 years) – > 2.5 years
32

Methods 14.Synthesis of results:
Describe the methods of handling data and combining results of studies, if done, including measures of consistency (e.g., I2) for each meta-analysis.
Results 21.Synthesis of results:
Present results of each meta-analysis done, including confidence intervals and measures of consistency.
33
Combining Individual Study Results • Must be able to calculate a standard error for the
effect size (ES) – the standard error is needed to calculate the
ES weights, called inverse variance weights – all meta-analytic analyses are weighted
34
The Inverse Variance Weight
• Studies generally vary in size. • An ES based on 100 subjects is assumed to be
a more “precise” estimate of the population ES than is an ES based on 10 subjects.
• Therefore, larger studies should carry more “weight” in our analyses than smaller studies.
• Simple approach: weight each ES by its sample size.
• Better approach: weight by the inverse variance.
35

What is the Inverse Variance Weight?
• The standard error (SE) is a direct index of ES precision.
• SE is used to create confidence intervals. • The smaller the SE, the more precise the ES. • The optimal weights for meta-analysis are:
36
2
1SE
w =

Example 2: Weighted Mean Effect Size
• Start with the effect size (ES) and inverse variance weight (w) for 10 studies.
• Next, multiply w by ES. • Repeat for all effect sizes. • Sum the columns, w and
ES. • Divide the sum of (w*ES)
by the sum of (w).
37
Study ES w w*ES1 -0.33 11.91 -3.932 0.32 28.57 9.143 0.39 58.82 22.944 0.31 29.41 9.125 0.17 13.89 2.366 0.64 8.55 5.477 -0.33 9.80 -3.248 0.15 10.75 1.619 -0.02 83.33 -1.67
10 0.00 14.93 0.00269.96 41.82
15.096.26982.41)(
==×
=∑
∑wESw
ES

The Standard Error of the Mean ES
• The standard error of the mean is the square root of (1 divided by the sum of the weights).
38
Study ES w w*ES1 -0.33 11.91 -3.932 0.32 28.57 9.143 0.39 58.82 22.944 0.31 29.41 9.125 0.17 13.89 2.366 0.64 8.55 5.477 -0.33 9.80 -3.248 0.15 10.75 1.619 -0.02 83.33 -1.67
10 0.00 14.93 0.00269.96 41.82
061.096.269
11===
∑wseES

Mean, Standard Error, Z-test and Confidence Intervals
39
15.096.269
82.41)(==
×=
∑∑
wESw
ES
061.096.269
11===
∑wseES
46.2061.015.0
===ESse
ESZ
27.0)061(.96.115.0)(96.1 =+=+= ESseESUpper
03.0)061(.96.115.0)(96.1 =−=−= ESseESLower
Mean ES
SE of the Mean ES
Z-test for the Mean ES
95% Confidence Interval

Homogeneity Analysis
• Homogeneity analysis tests whether the assumption that all of the effect sizes are estimating the same population mean is a reasonable assumption.
• If homogeneity is rejected, the distribution of effect sizes is assumed to be heterogeneous. – Single mean ES not a good descriptor of the
distribution – There are real between study differences, that is,
different population mean effect sizes. – Two options:
• model between study differences • fit a random effects model
40

Q - The Homogeneity Statistic
• Calculate a new variable that is the ES squared multiplied by the weight.
• Sum new variable.
41
Study ES w w*ES w*ES^21 -0.33 11.91 -3.93 1.302 0.32 28.57 9.14 2.933 0.39 58.82 22.94 8.954 0.31 29.41 9.12 2.835 0.17 13.89 2.36 0.406 0.64 8.55 5.47 3.507 -0.33 9.80 -3.24 1.078 0.15 10.75 1.61 0.249 -0.02 83.33 -1.67 0.03
10 0.00 14.93 0.00 0.00269.96 41.82 21.24

Calculating Q
42
There are 3 sums:
( )[ ]76.1448.624.21
96.26982.4124.21)(
222 =−=−=
×−×=∑ ∑∑
wESw
ESwQ
24.21)(
82.41)(
96.269
2 =×
=×
=
∑∑∑
ESw
ESw
w
Q is can be calculated using these 3 sums:

Interpreting Q
43
• Q is distributed as a Chi-Square • df = number of ES’s - 1 • Running example has 10 ES’s, therefore, df = 9 • Critical Value for a Chi-Square with df = 9 and p = .05
is: 16.92 • Since the calculated Q (14.76) is less than 16.92, we
fail to reject the null hypothesis of homogeneity. • Thus, the variability across effect sizes does not
exceed what would be expected based on sampling error.

Another Statistic for Assessing Heterogeneity: I2
• I2 = (Q - df) / Q * 100, if Q > df • I2 = 0, if Q < df • Quantifies the amount of variation across studies
beyond that expected by chance • In the previous example, I2 = (14.76 – 9) / 14.76 = 39%.
44

Interpretation of I2
• 0% to 40%: might not be important; • 30% to 60%: may represent moderate
heterogeneity*; • 50% to 90%: may represent substantial
heterogeneity*; • 75% to 100%: considerable heterogeneity*. *The importance of the observed value of I2 depends on (i) magnitude and direction of effects and (ii) strength of evidence for heterogeneity
Cochrane Handbook 45

Heterogeneous Distributions
• Analyze excess between-study (ES) variability – categorical variables with the analog to the one-way
ANOVA – continuous variables and/or multiple variables with
weighted multiple regression • Assume variability is random and fit a random
effects model.
46

The Logic of a Random Effects Model
• Fixed effects model assumes that all of the variability between effect sizes is due to sampling error.
• Random effects model assumes that the variability between effect sizes is due to sampling error plus variability in the population of effects (unique differences in the set of true population effect sizes).
47

The Basic Procedure of a Random Effects Model
• Fixed effects model weights each study by the inverse of the sampling variance.
• Random effects model weights each study by the inverse of the sampling variance plus a constant that represents the variability across the main effects.
48
2
1
ii se
w =θvse
wi
i ˆ1
2 +=
This is the random effects variance component.

How To Estimate the Random Effects Variance Component
• The random effects variance component is based on Q. • The formula is:
49
∑ ∑∑
−
−−=
ww
w
kQv2
)1(θ̂

Calculation of the Random Effects Variance Component
• Calculate a new variable that is the w squared.
• Sum new variable.
50
Study ES w w*ES w*ES^2 w^21 -0.33 11.91 -3.93 1.30 141.732 0.32 28.57 9.14 2.93 816.303 0.39 58.82 22.94 8.95 3460.264 0.31 29.41 9.12 2.83 865.075 0.17 13.89 2.36 0.40 192.906 0.64 8.55 5.47 3.50 73.057 -0.33 9.80 -3.24 1.07 96.128 0.15 10.75 1.61 0.24 115.639 -0.02 83.33 -1.67 0.03 6944.39
10 0.00 14.93 0.00 0.00 222.76269.96 41.82 21.24 12928.21

Calculation of the Random Effects Variance Component
• The total Q for this data was 14.76 • k is the number of effect sizes (10) • The sum of w = 269.96 • The sum of w2 = 12,928.21
51
026.089.4796.269
76.5
96.26921.928,1296.269
)110(76.14)1(ˆ2
=−
=−
−−=
−
−−=
∑ ∑∑
ww
w
kQvθ

Rerun Analysis with New Inverse Variance Weight
• Add the random effects variance component to the variance associated with each ES.
• Calculate a new weight. • Rerun analysis.
52
θvsew
ii ˆ
12 +
=

Comparison of Random Effect with Fixed Effect Results
• The biggest difference is in the significance levels and confidence intervals. – Confidence intervals will get bigger.
– Effects that were significant under a fixed effect model may no longer be significant.
• Random effects models are more conservative.
53

54
Tai et al., 2015—Table 1: Lumbar Spine

Methods 15. Risk of bias across
studies: Specify any assessment of risk of bias that may affect the cumulative evidence (e.g., publication bias, selective reporting within studies).
Results 22. Risk of bias across
studies: Present results of any assessment of risk of bias across studies (see Item 15).
55
Funnel Plots—a Tool for Detecting Bias
• Scatter plots of precision (e.g., 1/SE) or sample size vs. effect size.
• If no bias – Small studies should have a wide range of
effect sizes – Large studies should have a narrow range of
effect sizes
56


Methods 16. Additional analyses:
Describe methods of additional analyses (e.g., sensitivity or subgroup analyses, meta-regression), if done, indicating which were pre-specified.
Results 23. Additional analyses :
Give results of additional analyses, if done (e.g., sensitivity or subgroup analyses, meta-regression [see Item 16]).
59

60
Tai et al., 2015- 2 Subgroup Analyses
Checklist (continued) • Discussion
24. Summary of evidence: Summarize the main findings including the strength of evidence for each main outcome; consider their relevance to key groups (e.g., healthcare providers, users, and policy makers).
25. Limitations: Discuss limitations at study and outcome level (e.g., risk of bias), and at review-level (e.g., incomplete retrieval of identified research, reporting bias).
26. Conclusions: Provide a general interpretation of the results in the context of other evidence, and implications for future research.
• Funding 27. Funding: Describe sources of funding for the systematic
review and other support (e.g., supply of data); role of funders for the systematic review.
61

Tai et al., 2015 Findings, Limitations, Conclusions , Funding
• Findings: Increasing calcium intake slightly increased BMD over 1-2 years. – Dietary calcium: 0.6-1.8% – Calcium supplements: 0.7-1.8%
• Limitations – BMD is only a surrogate for fracture – High heterogeneity between studies
• Conclusions – Small effects on BMD are unlikely to produce clinically important
reductions in fracture risk (5-10%). – Increasing calcium intake is unlikely to be beneficial for persons
concerned about their bone density.
• Funding: Health Research Council of New Zealand 62

Strengths of Meta-Analysis
• Imposes a discipline on the process of summing up research findings
• Capable of finding relationships across studies that are obscured in other approaches
• Protects against over-interpreting differences across studies
• Can handle a large numbers of studies
63

Weaknesses of Meta-Analysis • Requires a good deal of effort • “Apples and oranges”; comparability of
studies is often in the “eye of the beholder” • Most meta-analyses include “blemished”
studies • Selection bias poses continual threat
– negative and null finding studies that you were unable to find
– outcomes for which there were negative or null findings that were not reported
64

In conclusion, meta-analysis:
• Is a replicable and defensible method of synthesizing findings across studies
• Often points out gaps in the research literature, providing a solid foundation for the next generation of research on that topic
• Illustrates the importance of replication • Facilitates generalization of the knowledge
gained through individual evaluations
65