mestrado integrado em engenharia química - core.ac.uk filei want to express my gratitude to my...
TRANSCRIPT
Mestrado Integrado em Engenharia Química
High-pressure phase equilibria for product and process design
Tese de Mestrado
de
Bárbara Muge de Almeida Libório
Desenvolvida no âmbito da unidade curricular de Dissertação
realizado em
Orientador na FEUP: Prof. Dr.Domingos Barbosa
Orientador na BTS GmbH: Dr. José Fonseca
Departamento de Engenharia Química
Leverkusen, Alemanha, Julho de 2013

High-pressure phase equilibria for product and process design
i
"If I have seen further it is only by standing on the shoulders of Giants."
Isaac Newton (1643-1727)
Philosophiae Naturalis Principia Mathematica, 1687
High-pressure phase equilibria for product and process design
ii
Acknowledgments
I would like to express my thanks to some people, who made a valuable contribution during
this period.
My first and sincere appreciation goes to my supervisor, Dr. José Fonseca, for all the support,
suggestions and comments given, in all stages of this master thesis. I am grateful to him for
all the knowledge sharing and continuous help. I would like to express my gratitude to Prof.
Dr. Ralf Dohrn for welcoming me in his research group and giving me the opportunity to
complete my studies in this demanding and successful group. I am also thankful to all
technicians, in special, Mr. Thomas Nicke and Mr. Stefan David, for all the help and patience
while performing the experiments. In addition, I would like to thanks my colleague Ximena
Rodriguez, for all the friendship and pleasant environment since her first day at the
laboratory.
My gratitude goes also to Prof. Dr. Domingos Barbosa, from Porto University, for all
willingness to help and guidance, not only during those 6 months of internship, but also during
the previous period.
My greatest appreciation and friendship goes to my friends, Nuno Garrido and Miguel Teixeira,
who have always been a great support during these years. I also would like to thank, André
Calatré, Eduardo Basto and Tiago Costa, for all the friendship and fruitful
discussions/contributions in different areas of engineering.
I want to express my gratitude to my closest friends, Joana Vieira, Marlene Faria and Telma
Luis, who were always a great support in all my struggles and frustrations. Thanks for all the
love, good moments and helping me thinking rationally. A big “thank you”, Flávia Figueiredo,
Filipa Coelho and Marcelo Costa, for your help and fellowship during the entire course.
To my family, for all the support through these years, and specially my mother, who always
encouraged and supported me in my decisions, thanks for believing in me and for being
always there for me. I also would like to thank Abdessamad Rafia for all the constant support,
companionship and patience during those months.
Finally I want to express all my gratitude to the people that in one way or another have
contributed to the success of this thesis. Unfortunately I am not able to put all your names
here, once only 50 pages are allowed, but I will always remember you for motivation and
experience.
High-pressure phase equilibria for product and process design
iii
Sumário
Foi desenvolvido um novo equipamento para o estudo do equilíbrio de fases a alta pressão e a
temperaturas elevadas, utilizando um método sintético com mudança de fase. O equipamento
foi especialmente desenvolvido para o estudo de sistemas com misturas gasosas, a pressões
até 20 MPa. A componente principal do equipamento desenvolvido é uma célula de equilíbrio
de volume variável, equipado com duas janelas de safira de 360º.
Foram ainda re-desenhadas duas células de equilíbrio já existentes no Laboratório de
Propriedades Físicas e Termodinâmica, até agora aplicáveis para pressões até 0.6 MPa. Os
componentes de vidro foram substituidos por elementos de safira, e as partes de aço re-
desenhadas, para suportar pressões até 10 MPa.
O presente trabalho inclui ainda a participação, através de estudos experimentais de
equilibrio de fases, num projeto de grande importância para a Bayer, que visa a utilização de
CO2 como matéria-prima na produção de poliuretanos. Como parte da otimização do processo
de produção, foram medidas solubilidades de dióxido de carbono e de óxido de propileno no
polímero a pressões até 10 MPa e até 0.6 MPa, respectivamente, e verificada a influência da
presença de carbonato de propileno nestes valores de solubilidade.
Por último, a solubilidade de azoto no polímero à temperatura ambiente e pressão
atmosférica foi também determinada.
Keywords Equilíbrio de fases, Dióxido de carbono, Solubilidade, alta
pressão, design de processos
High-pressure phase equilibria for product and process design
iv
Abstract
A new apparatus for the study of high-pressure phase equilibrium at high temperatures using
a synthetic visual method with phase change was designed. The apparatus was specially
developed for the study of systems with gas mixtures, at pressures up to 20 MPa. The core of
the apparatus is a variable-volume equilibrium cell, equipped with two 360◦ sapphire
windows.
Two equilibrium cells already existent on the laboratory of Property Data and
Thermodynamics of BTS, applicable for pressures up to 0.6 MPa, were re-designed and
developed. The glass parts were exchanged for sapphire and the stainless steel parts re-
designed in order to cope with pressures up to 10 MPa.
This work also includes the collaboration, through experimental studies of phase equilibria, in
a project of great importance for Bayer, focusing on the use of CO2 as raw material for the
production of polyurethanes. As part of the process optimization, solubilites of carbon dioxide
and of propylene oxide in the polymer were measured at pressures up to 10 MPa and 0.6 MPa,
respectively. The influence of propylene carbonate (also present in the process) on these
solubilities was also determined.
Finally, the solubility of nitrogen in the polymer at room temperature and ambient pressure
was also determined.
Keywords Phase equilibria, Carbon dioxide, Solubility, High-
pressure, Process design
High-pressure phase equilibria for product and process design
v
Declaração
Bárbara Muge de Almeida Libório declara, sob compromisso de honra, que este
trabalho é original e que todas as contribuições não originais foram devidamente
referenciadas com identificação da fonte.
Bárbara Muge de Almeida Liborio states, on honor, that this work is original and that
all non-original contributions were properly referenced with source identification.
High-pressure phase equilibria for product and process design
vi
Contents
Acknowledgments .............................................................................................................................. ii
Sumário ............................................................................................................................................... iii
Abstract............................................................................................................................................... iv
Declaração ........................................................................................................................................... v
Contents .............................................................................................................................................. vi
List of Figures ..................................................................................................................................... 1
List of Tables....................................................................................................................................... 3
Nomenclature ..................................................................................................................................... 4
Preface ................................................................................................................................................. 6
1 Introduction ..................................................................................................................................... 7
2 Phase equilibrium measurements – A review ........................................................................... 10
2.1. Analytical Methods................................................................................................................... 12
2.2. Synthetic Methods .................................................................................................................... 14
2.2.1. Synthetic Methods with phase transition ......................................................................... 14
2.2. Synthetic methods without phase transition ...................................................................... 17
3 Design and development of a new apparatus - Synthetic visual method with phase
change ................................................................................................................................................ 19
3.1. Preliminary steps ..................................................................................................................... 19
3.2. New apparatus .......................................................................................................................... 20
4 New equilibrium cells - Synthetic isothermal method without phase change ................... 26
5 Solubility of CO2 and propylene oxide in polymers derived from CO2 ................................. 28
5.1. Experimental procedure ......................................................................................................... 29
5.2. Experimental Results ............................................................................................................... 32
6 Conclusions and Further work .................................................................................................... 38
7 References ..................................................................................................................................... 39
Appendixes 1 ..................................................................................................................................... 42
High-pressure phase equilibria for product and process design
1
List of Figures
Figure 1 - Different stages of a process that are dependent on phase equilibria
data. 7
Figure 2 - Classification of the experimental methods available for the
measurement of high-pressure phase equilibrium [14]. 12
Figure 3 - Determination of a boiling point with a synthetic method with phase
transition. Left: pressure vs. volume diagram; Right: mole fraction diagram [2]. 15
Figure 4 - Equilibrium cell for visual determination of phase transitions from TU
Delft [31]. 16
Figure 5 – Experimental procedure, synthetic isothermal method [2]. 18
Figure 6 – Schematic representation of the new experimental set-up for the
measurement of multi-phase equilibria at high-pressures. 20
Figure 7 - 3D computer generated images of the new high-pressure equilibrium cell.
– On the left: overview of the cell. On the right: cut of the cell showing the interior. 22
Figure 8 – Fiber optic pressure sensor. Left: schematic pressure sensor; Right: photo
[37]. 23
Figure 9 - Pressure sensor’s configuration. Fabry-Perot Cavity in MEMS Pressure
Sensor [37]. 24
Figure 10 - Stirring mechanism specially designed for this specific equilibrium cell. 25
Figure 11 - Existing glass cell for phase equilibria measurements, synthetic visual
method. 26
Figure 12 - 3D computer generated images of the new high-pressure equilibrium
cells. Left: overview of the cell. Right: cut of the cell showing the interior. 27
Figure 13 - CO2 as raw material for the production of polyurethanes [39]. 29
Figure 14 - Apparatus where the experiments for the study of solubility of CO2 and
PO were performed [35] 30
High-pressure phase equilibria for product and process design
2
Figure 15 - Schematic representation of the apparatus used for the solubility
measurements of N2 [39] 32
Figure 16 - Solubility of CO2 in PPP type1 at two different temperatures. 33
Figure 17 - Solubility of CO2 in PPP type2 at two different temperatures. 34
Figure 18 - Solubility of CO2 in a mixture of PPP (type1) and propylene carbonate at
373 K. 35
Figure 20 - Solubility of PO in a mixture of PPP (type 1) and propylene carbonate at
373 K. 36
Figure 21 - Solubility of PO in a mixture of PPP (type 1) and propylene carbonate at
373 K, repetition of the experiment. 37
Figure 22 - Solubility of N2 in PPP (type 1) at room temperature, 298 K. 37
High-pressure phase equilibria for product and process design
3
List of Tables
Table 1 - Solubility of CO2 in PPP type1 at two different temperatures. 43
Table 2 - Solubility of CO2 in PPP type2 at two different temperatures. 43
Table 3 - Solubility of CO2 in a mixture of PPP and propylene carbonate at 373 K. 44
Table 4 - Solubility of PO in PPP at two different temperatures. 45
Table 5 - Solubility of PO in a mixture of PPP and propylene carbonate at 373 K, 2
trials. 46
Table 6 - Solubility of N2 in PPP at room temperature, 298 K. 47
High-pressure phase equilibria for product and process design
4
Nomenclature
Parameter Definition SI Units
p Pressure MPa
T Temperature K
Ra Roughness average µm
High-pressure phase equilibria for product and process design
5
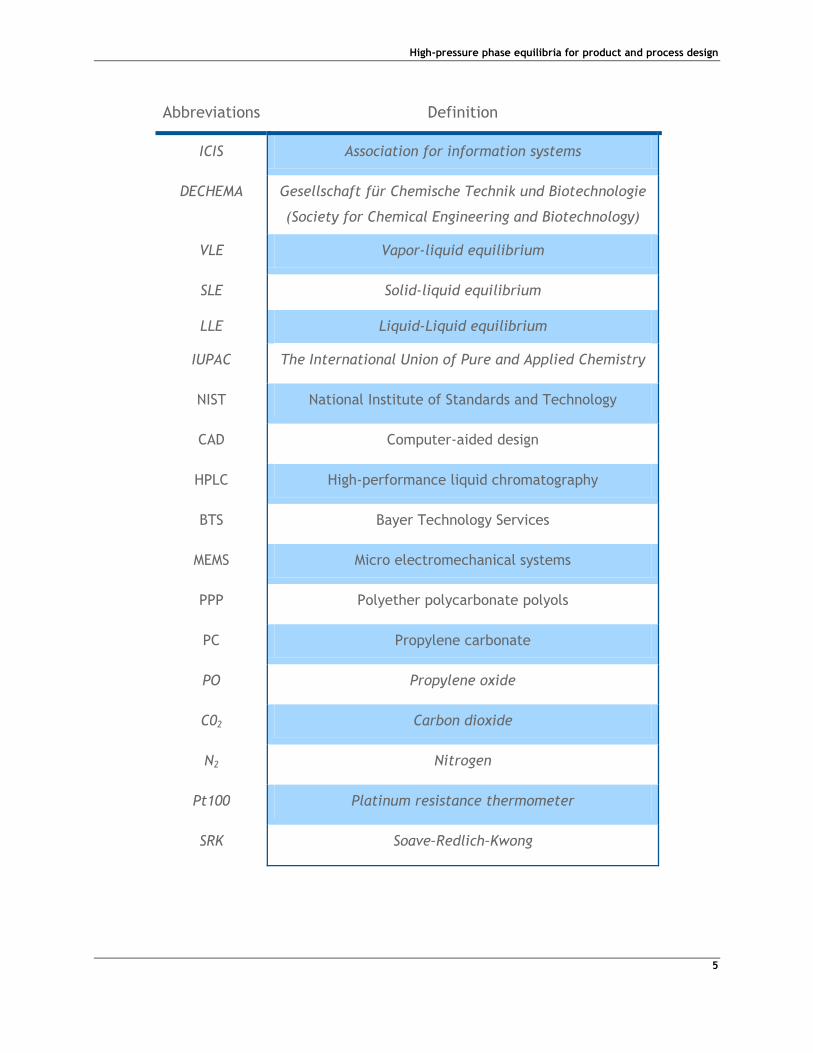
Abbreviations Definition
ICIS Association for information systems
DECHEMA Gesellschaft für Chemische Technik und Biotechnologie
(Society for Chemical Engineering and Biotechnology)
VLE Vapor-liquid equilibrium
SLE Solid-liquid equilibrium
LLE Liquid-Liquid equilibrium
IUPAC The International Union of Pure and Applied Chemistry
NIST National Institute of Standards and Technology
CAD Computer-aided design
HPLC High-performance liquid chromatography
BTS Bayer Technology Services
MEMS Micro electromechanical systems
PPP Polyether polycarbonate polyols
PC Propylene carbonate
PO Propylene oxide
C02 Carbon dioxide
N2 Nitrogen
Pt100 Platinum resistance thermometer
SRK Soave–Redlich–Kwong
High-pressure phase equilibria for product and process design
6
Preface
“These days, record numbers of students are studying abroad all over the world. According to
the international Organization for Economic Co-operation and Development, the number of
international students worldwide rose from 0.8 million in 1975 to 3.7 million in 2009. In
addition, UNESCO’s Institute for Statistics finds that the number is increasing by about 12%
each year 1.”
In order to complete the master Program at Faculty of Engineering of Porto University, during
the last semester of studies, the students must develop a research project that subsequently
will be presented at the university. Since the opportunity of studying abroad was provided by
the Erasmus Program, I decided to apply for an Internship in Bayer Technology Services
GmbH, in Leverkusen, Germany, to develop my final master project and being trained in a
company of excellence. This period, spent abroad, enriched my student life in the academic
and professional levels, but also in terms of language and intercultural skills, self-confidence
and self-awareness. Competences in the field of experimental thermodynamics, namely in the
experimental study of high-pressure phase equilibrium by means of different methods and the
understanding of the role of R&D in a global company such as Bayer, were enhanced.
Bayer is a German chemical and pharmaceutical company founded in Wuppertal in 1863 by
Friedrich Bayer and Johann Weskott and its global headquarter is in the Chempark, in
Leverkusen. Presently there are 285 Bayer companies all over the world. In 1897 Bayer
invented Aspirin, which made them extremely successful. Currently, in addition to aspirin,
products such as veterinary drugs, diagnostic imaging, general and specialty medicines,
women’s health care products, agrochemicals, polymers, coatings and adhesives, between
others, have being developed by all subgroups of Bayer (Bayer HealthCare, Bayer Material
Science, Bayer CropScience, Currenta). According to official Bayer website [1], by the end of
2012, Bayer employed 110,500 people (from which 34,600 employees were located in
Germany). The group achieved in 2012 €39.8 billion in sales (8.8% more than previous year)
and the R&D expenses amounted to €3 billion. Bayer has stringent politics in respect to safety
at work. By this reason, only a big accident can be reported in 150 years all over the world.
1 Extracted from http://www.bbc.com/travel/blog/20120926-the-statistics-of-studying-abroad
High-pressure phase equilibria for product and process design
7
1 Introduction
Phase equilibrium has always had a crucial role in chemical industry. Nowadays, high-quality
phase equilibrium data is essential for the design and optimization of industrial processes,
including both reaction (e.g. measurement of solubilities, distribution of components in the
different phases) and separation processes (e.g. distillation, extraction, etc.). This includes
various areas of application such as refrigeration and heat-pump cycles, petroleum reservoir
simulation, enhanced oil recovery, geological processes, gas processing, applications involving
supercritical fluids, as well as new fields such as molecular simulation, ionic liquids, carbon
dioxide capture and storage, hydrate formation, or polymer processing [2]. All these
processes require design and optimization steps which are dependent on the precision and
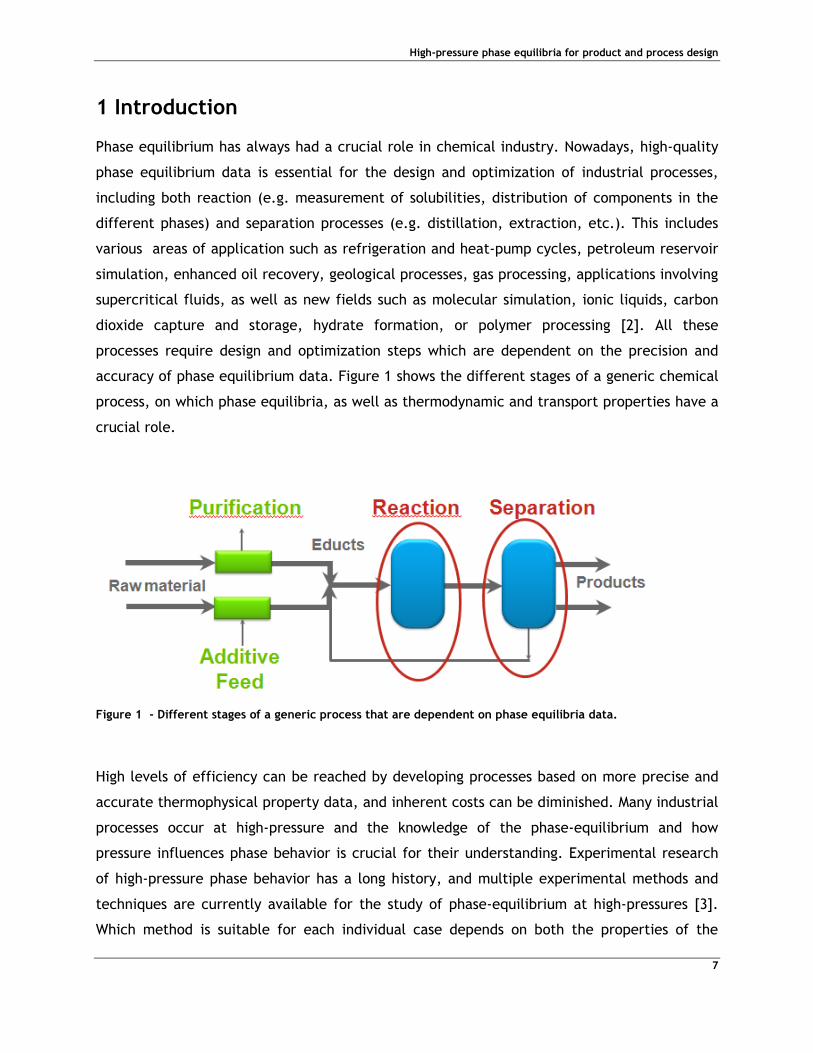
accuracy of phase equilibrium data. Figure 1 shows the different stages of a generic chemical
process, on which phase equilibria, as well as thermodynamic and transport properties have a
crucial role.
Figure 1 - Different stages of a generic process that are dependent on phase equilibria data.
High levels of efficiency can be reached by developing processes based on more precise and
accurate thermophysical property data, and inherent costs can be diminished. Many industrial
processes occur at high-pressure and the knowledge of the phase-equilibrium and how
pressure influences phase behavior is crucial for their understanding. Experimental research
of high-pressure phase behavior has a long history, and multiple experimental methods and
techniques are currently available for the study of phase-equilibrium at high-pressures [3].
Which method is suitable for each individual case depends on both the properties of the
High-pressure phase equilibria for product and process design
8
components and also the phenomena to be investigated [4]. In this master thesis,
experimental methods for the study of phase equilibrium at high pressures are briefly
reviewed, as well as their relative advantages and disadvantages and their main specific error
sources.
During the last decades, computational methods for the prediction of phase equilibrium have
made considerable development, and they can reduce the experimental data points to be
measured, however, the experimental determination of phase equilibrium data will always
have a determining role in the validation of theoretical methods and in the adjustment of
parameters in correlations [4]. However, reliable and precise data can be difficult to
measure, it is often expensive to achieve and it consumes considerable time, thereby
representing a serious investment, not only concerning the acquisition or development of new
experimental equipment but also regarding human resources. Nevertheless, the costs for a
company using non-trustworthy data can be much higher, and might have serious
consequences in what safety is concerned. According to many researchers from both
academia and industry there is a worrying lack of experimentalists [5].
The purpose of the present work, carried out on the group of Property Data and
Thermodynamics in Bayer Technology Services GmbH (BTS), is to make a humble but robust
contribution to the field, not only by measuring new data required for process design, but
also by developing new experimental equipment for the study of phase equilibrium at high
pressures. During these 6 months internship, the methodology used to perform the work
included four main stages: gathering and critical analysis of existing information, meetings
with experts of different areas, experimenting and preparation of final documents. By
accessing databases and literature, the existing information regarding experimental methods
was critically evaluated and meetings with experts from various fields provided help and
added knowledge, useful for the multidisciplinary task of designing a new apparatus. This
development process of the new equipment comprises a number of time consuming steps,
from designing, searching for suppliers, machining and building. The time scale of some of
these steps depends on third parties, and in the case of this work, some took much longer
than predicted. Due to this, it was not possible to generate data with the new cell.
Nevertheless, after its completion, the quality of the new equipment will be verified through
the study of the reference systems, and through the comparison of the results with values
from the literature.
High-pressure phase equilibria for product and process design
9
Another part of this work included the participation in a project of great importance for
Bayer. Around 10% of the production of crude oil is used in the production of chemicals, such
as polymers. This highly innovative project consists in the use of CO2 as raw material for the
production of polyurethanes. On one hand, this allows decreasing the current dependency of
crude oil and thus reduces the influence of oil prices in production costs. Simultaneously, it
gives value to CO2, providing an alternative to the storage possibilities after carbon capture in
flue gases in pilot plants, bringing added value to the chemical industry. The project is a
partnership of Bayer Material Science AG and Bayer Technology Services GmbH, and the
Property Data and Thermodynamics group has had an important participation in the study of
relevant systems, from phase equilibrium at high pressure for the optimization of the reaction
process, to phase equilibrium at low pressure for the separation process, where the final
product needs to meet the demanded specifications, including the full characterization of
pure substances and relevant mixtures in terms of thermodynamic and transport properties.
The subsequent chapters are organized as following:
In Chapter 2, a smooth approach focusing on the experimental methods for the measurement
of phase equilibrium is presented, with special attention given to the methods of interest for
this thesis.
In Chapter 3, the design of a new experimental set-up for the measurement of solubilities by
using the visual method with phase change is presented.
Chapter 4 focuses on the re-design of existing view-cells, which were further developed for
application at higher pressures.
In Chapter 5, the results obtained in experimental studies of phase equilibria, performed as
part of a project of wide importance for Bayer, are presented.
Finally, in Chapter 6, conclusions were made and considerations concerning future
prospections are presented.
High-pressure phase equilibria for product and process design
10
2 Phase equilibrium measurements – A review
Phase equilibrium is a subject of wide importance in many industrial and scientific areas as
introduced in the previous chapter. Nowadays, it is possible to find a large number of
databases, books and reviews in the literature published over the years by several authors,
containing important information on this area. Examples of databases include DECHEMA
Chemistry Data Series, a German collection of 15 volumes, each one dedicated to a specific
set of data (VLE, SLE, LLE, critical data, etc.), or the IUPAC Solubility Data Series, an
American collection of 98 volumes published since 1979. Since volume 66 their data is also
appearing in the Journal of Physical Chemistry and Reference Data.
In 1967 Hála et al [6] published an extensive record of systems for which experimental VLE
data at moderate pressures had been published up to May of 1965. The work of Bartle et al
[7] focused on solids and liquids of low volatility. Sawamura [8] published a work which
focuses on solubility of organic and inorganic compounds in liquids at high pressures and
Esperança et al. [9] presented a complete review between 2003 and 2008 about the volatility
of aprotic ionic liquids. Another two interesting works that must be mentioned are the
publications of Keskin et al [10] on phase behavior of ionic liquids with supercritical fluids and
of Marsh et al [11] focusing the critical properties of elements and compounds. Examples of
reviews of phase equilibrium measurements for one particular system are the works of
Diamond and Akenfiev [12] or Spycher [13], who studied the binary system of carbon dioxide +
water. Dohrn and co-workers gathered the systems published between 2000-2004 [14] and
2005-2008 [15] and presented a classification for experimental methods. These works belong
to a series of reviews that have been done focusing on the data published between 1978-1987
[16] 1988-1993 [17] and 1994-1999 [18].
The interest in studying the phase behavior at high-pressures is not recent. In 1822, Charles
Cagniard de la Tour [19] discovered the critical point of a compound by using a synthetic non-
visual method. The experiments were performed in a sealed cannon filled with fluids at
different temperatures. Inside the cannon there was a rolling flint ball, by listening to the
discontinuities in the sound in it as the cannon was tilted, he observed the critical
temperatures.
Over time, certain systems have been studied several times by different authors. But the
existence of experimental data from different sources for one same system does not
necessarily imply a lower uncertainty in the phase equilibrium, since there are often
High-pressure phase equilibria for product and process design
11
discrepancies between authors. Due to this, the need of reliable and accurate data in
extended ranges of experimental conditions is still a reality, even for some systems that have
been the object of previous studies, since wrong data may erroneously influence industries
and processes. A reason for many of these discrepancies is related to the fact that reliable
data and accurate measurements are difficult to achieve and often the quality of the
operators and the supervising of the experiment can have higher impact on the results than
the equipment to be tested [15].
If some reviews focus on certain systems, or on the data published for certain types of
compounds, others provide a more instrumental perspective.
The work of Smith and Fang [20] for example, focused on the application of diamond anvil
cells. The review presented by Richon [5] focus on equipment developed in his laboratory
using analytical methods with sampling. In 2012, Fonseca [21] presented the development
and test results of new experimental set-ups for the measurement of phase equilibrium at
high-pressure and low temperatures using different methods, and then comparing the results
obtained by the different apparatus.
In experimental studies of phase equilibrium at high pressures a wide variety of methods can
be performed. The main reason of this diversity is because there is no way to define which
method is the best suitable for each measurement, as this depends on both the properties of
the components and the phenomena to be investigated. For the selection of the best method,
or for the critical evaluation of experimental literature data, a detailed knowledge and
understanding of the different methods is necessary, since each method has different
advantages and disadvantages as well as specific error sources. A possible categorization will
be presented on the figure bellow [2]. This nomenclature was previous presented by Dohrn
and co-workers in recent reviews [14 -15].
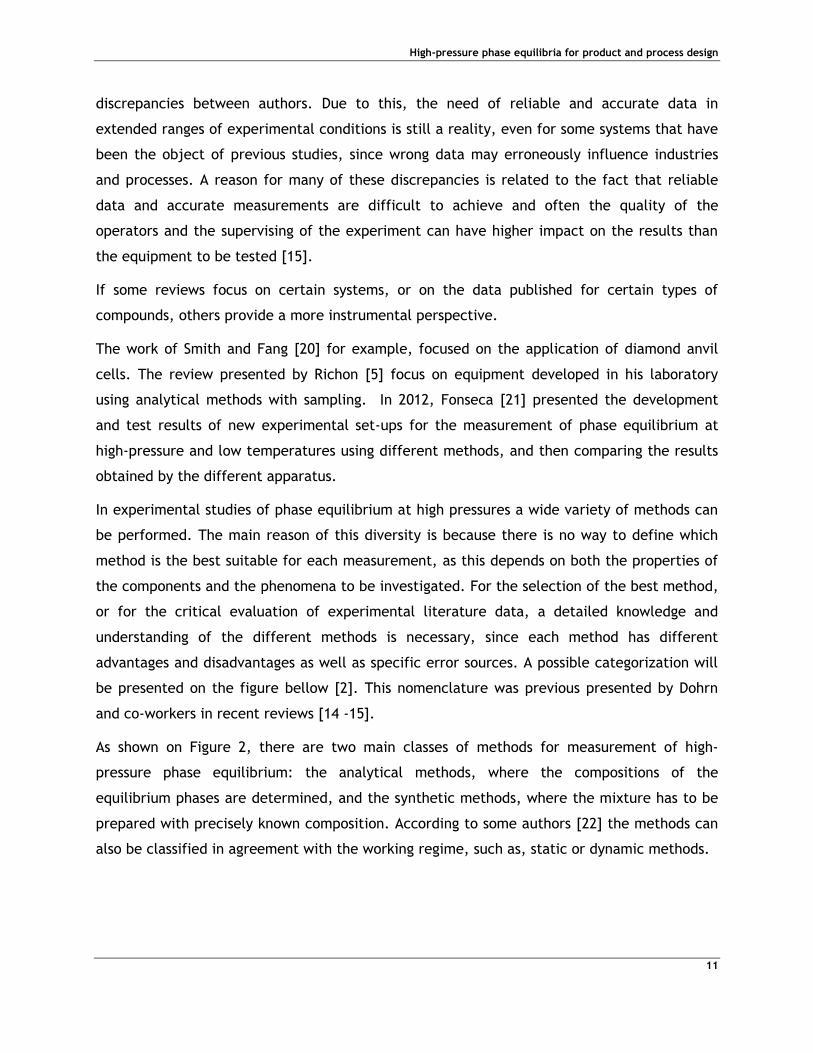
As shown on Figure 2, there are two main classes of methods for measurement of high-
pressure phase equilibrium: the analytical methods, where the compositions of the
equilibrium phases are determined, and the synthetic methods, where the mixture has to be
prepared with precisely known composition. According to some authors [22] the methods can
also be classified in agreement with the working regime, such as, static or dynamic methods.
High-pressure phase equilibria for product and process design
12
Figure 2 - Classification of the experimental methods available for the measurement of high-pressure phase equilibrium [14].
2.1. Analytical Methods
In analytical methods, the equilibrium cell is charged with the components of the system to
be studied without requiring precise information of the total composition of the system. The
experimental conditions such as temperature and pressure are then set. Once the equilibrium
is achieved, there are two typical ways to determine the composition of the different phases:
withdrawing a sample for subsequent analysis, or applying a suitable physicochemical
technique for an in situ analysis.
Apparatus for the study of phase equilibrium by analytical methods can be significantly
complex since they must include an analytical part, and often it requires calibration and
previous optimization of the analytical technique(s).
Analytical methods can be distinguished by having samplings withdraw or not. These methods
are based on different principles and have different requirements in terms of experimental
procedure and error minimization. Methods in which samples are withdrawn from the
equilibrium cell can be classified, depending on the procedure used to achieve the
equilibrium, into isothermal, isobaric or isobaric-isothermal methods [2]. The main advantage
measurement of high-pressure phase equilibria
analytical methods
with sampling
isothermal
isobaric
isobaric-isothermal
without sampling
spectroscopic
gravimetric
others
synthetic methods
with a phase change
visual
non-visual
without a phase change
isothermal
isobaric
others
High-pressure phase equilibria for product and process design
13
of the analytical methods with sampling is the possibility of application in multi-component
systems which allow the study of systems of industrial interest. However, these methods
present some disadvantages, such as the possibility of the occurrence of significant pressure
drops when samples are withdrawn [23]. Nevertheless, many techniques can be performed in
order to avoid or reduce this problem.
Probably the most basic solution for this is the use of cells with larger volumes, so that the
volume of the sample withdrawn has a lower influence on the pressure of the system.
Apparatus using analytical method with sampling where the volume of the equilibrium cell is
small may, nevertheless, be found in literature. However their applications are scarce.
A considerable advantage for most of the methods, whilst it can increase the price of the
experimental set-up, is the use of windows for visual observation of the contents of the
equilibrium cell, interfaces between phases, among other phenomena. Depending on the
pressure range for the application, among other factors, these windows can be made of glass
or quartz, but most commonly sapphire is used. Although more expensive, sapphire is much
strong than glass and it is characterized by a good chemical resistance, thermal conductivity
and thermal stability. Another possible approach for circumventing the problem of the
pressure drop associated with sampling processes is to avoid sampling, performing the
analysis in situ through the use of a convenient physicochemical method. Several
spectroscopy techniques can be used, as shown by Andersen et al. [24] where the sapphire
windows assumes a critical importance, due to a good transmission characteristics of the
visible, near IR and UV spectrum of this material, such as Raman spectroscopy as used by
Khanna et al. [25] A disadvantage is that often these methods of analysis only permit the
determination of the concentration of a particular compound in different phases, which may
be a limiting factor in the study of multi-component systems [26]. Calibrations under
different experimental conditions are time-consuming, which could be a negative aspect to
take in consideration. Among analytical methods without sampling, there are also gravimetric
methods as well as other types of methods.
High-pressure phase equilibria for product and process design
14
2.2. Synthetic Methods
While in analytical methods phase equilibrium is determined by analysis of the equilibrium
phases, as previously explained, the basics of synthetic methods consists on the preparation
of a mixture of precisely known composition and subsequently observe its phase behavior in
an equilibrium cell, measuring only properties such as pressure and temperature in the
equilibrium state. Synthetic methods can be applied in situations in which analytical methods
are not convenient. Nevertheless, the problem of analyzing the fluid mixtures is replaced by
the problem of carefully preparing (synthesizing) them [3].
Since no sampling is necessary, experimental set-ups using synthetic methods are usually
smaller and require few components than the equilibrium apparatus used in analytical
methods. However, as well as in analytical methods, a larger cell volume can be
advantageous. For example, Nieuwoudt and co-workers [27] increased the volume of a high-
pressure equilibrium cell to the double, which lead to an increased accuracy on the
composition determinations.
One possible classification for synthetic methods is based on the existence, or not, of a phase
transition.
2.2.1. Synthetic Methods with phase transition
In synthetic methods with phase transition, variations on pressure or temperature can be used
to promote the appearance or disappearance of a new phase. The moment when a second
(gaseous) phase appears, the composition of the condensed phase can be considered to be
equal to the global composition of the system. Each experiment yields one point of the pTx
phase envelope. Alternatively to varying the pressure or temperature of the system, the
overall composition can also be changed in order to promote the appearance / disappearance
of a new phase.
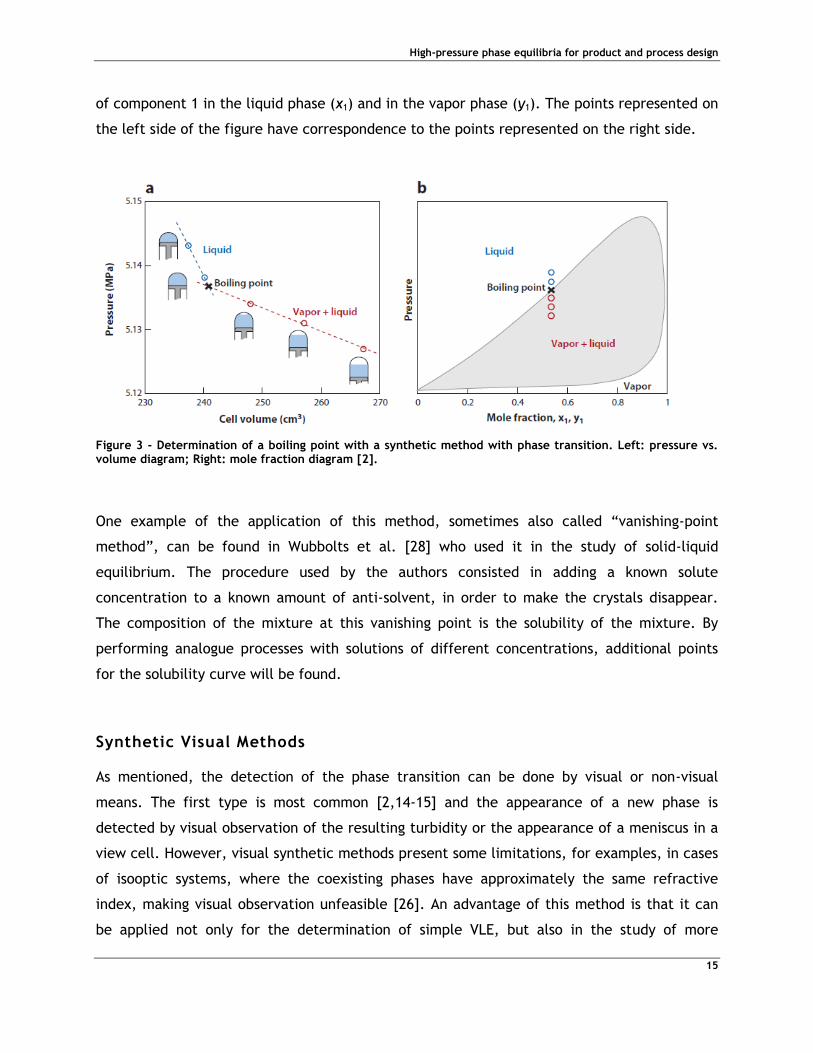
Figure 3 shows the determination of a boiling point with a phase transition methods. As
showed on the left side, the pressure is measured as the volume of the cell changes. The
phase transition is detected visually by observing at what pressure the vapor phase appears or
disappears. The phase transition can also be detected non-visually by observing the change in
the slope of the pV curve. On the right side of the figure is it possible to see the results of a
boiling-point determination in a pressure-composition diagram: pressure versus mole fraction
High-pressure phase equilibria for product and process design
15
of component 1 in the liquid phase (x1) and in the vapor phase (y1). The points represented on
the left side of the figure have correspondence to the points represented on the right side.
Figure 3 - Determination of a boiling point with a synthetic method with phase transition. Left: pressure vs. volume diagram; Right: mole fraction diagram [2].
One example of the application of this method, sometimes also called “vanishing-point
method”, can be found in Wubbolts et al. [28] who used it in the study of solid-liquid
equilibrium. The procedure used by the authors consisted in adding a known solute
concentration to a known amount of anti-solvent, in order to make the crystals disappear.
The composition of the mixture at this vanishing point is the solubility of the mixture. By
performing analogue processes with solutions of different concentrations, additional points
for the solubility curve will be found.
Synthetic Visual Methods
As mentioned, the detection of the phase transition can be done by visual or non-visual
means. The first type is most common [2,14-15] and the appearance of a new phase is
detected by visual observation of the resulting turbidity or the appearance of a meniscus in a
view cell. However, visual synthetic methods present some limitations, for examples, in cases
of isooptic systems, where the coexisting phases have approximately the same refractive
index, making visual observation unfeasible [26]. An advantage of this method is that it can
be applied not only for the determination of simple VLE, but also in the study of more
High-pressure phase equilibria for product and process design
16
complex phase behavior, such as SLE, critical curves mixtures, gas hydrate formation, cloud-
point determinations or phase equilibria in polymer solvent systems [26].
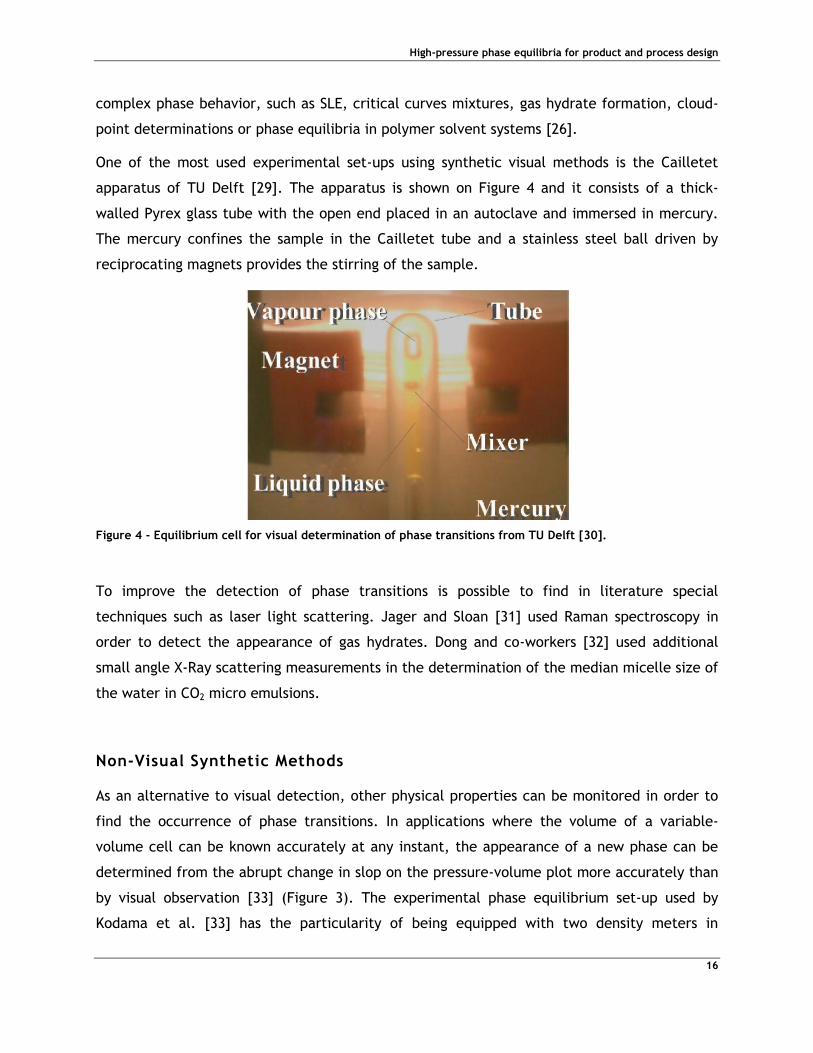
One of the most used experimental set-ups using synthetic visual methods is the Cailletet
apparatus of TU Delft [29]. The apparatus is shown on Figure 4 and it consists of a thick-
walled Pyrex glass tube with the open end placed in an autoclave and immersed in mercury.
The mercury confines the sample in the Cailletet tube and a stainless steel ball driven by
reciprocating magnets provides the stirring of the sample.
Figure 4 - Equilibrium cell for visual determination of phase transitions from TU Delft [30].
To improve the detection of phase transitions is possible to find in literature special
techniques such as laser light scattering. Jager and Sloan [31] used Raman spectroscopy in
order to detect the appearance of gas hydrates. Dong and co-workers [32] used additional
small angle X-Ray scattering measurements in the determination of the median micelle size of
the water in CO2 micro emulsions.
Non-Visual Synthetic Methods
As an alternative to visual detection, other physical properties can be monitored in order to
find the occurrence of phase transitions. In applications where the volume of a variable-
volume cell can be known accurately at any instant, the appearance of a new phase can be
determined from the abrupt change in slop on the pressure-volume plot more accurately than
by visual observation [33] (Figure 3). The experimental phase equilibrium set-up used by
Kodama et al. [33] has the particularity of being equipped with two density meters in
High-pressure phase equilibria for product and process design
17
recirculation loops, for measuring the density of different phases. It also employs a very
simple system for the variation of the volume of the cell, in which a piston is manually and
directly actuated, without the use of a pressure transmitter medium. This allows the exact
position of the piston to be determined with higher precision, and consequently the total
volume of the cell, at any instant during the experiment.
2.2. Synthetic methods without phase transition
The application of synthetic methods without phase transition is based on the measurements
of a number of equilibrium properties, such as, pressure, temperature, phase volumes and
densities, which are subsequently used in calculations involving material balances in order to
determine the phase compositions [26].
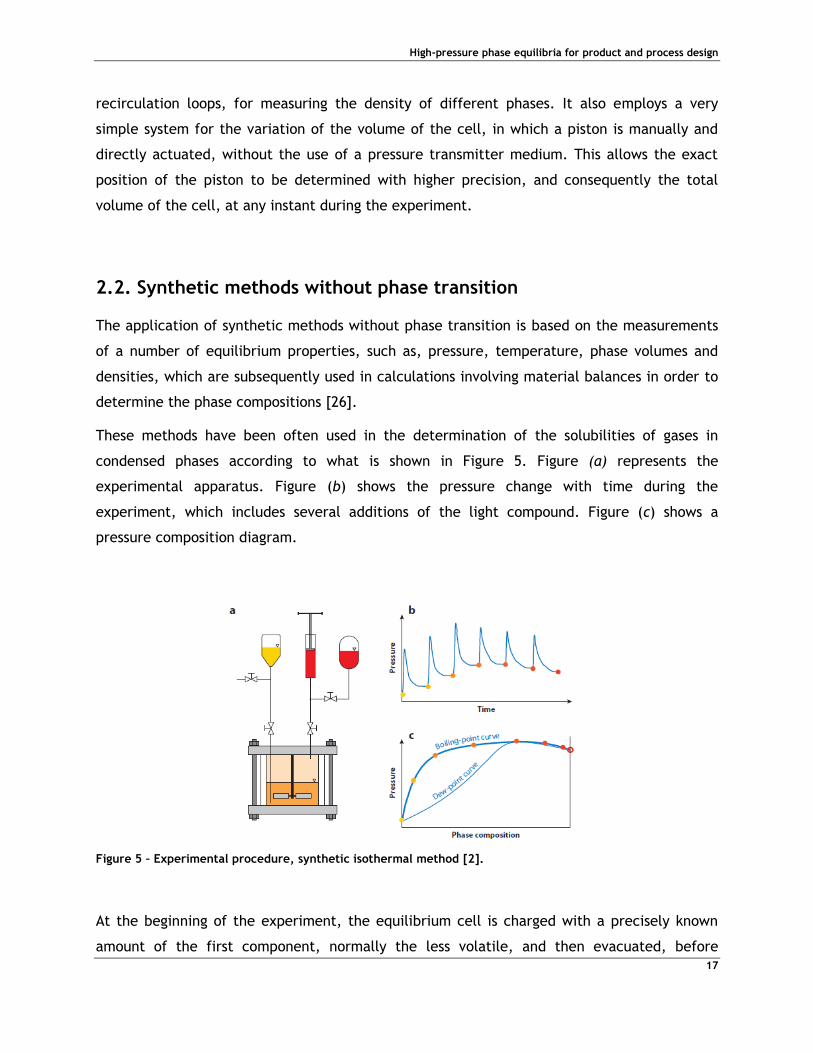
These methods have been often used in the determination of the solubilities of gases in
condensed phases according to what is shown in Figure 5. Figure (a) represents the
experimental apparatus. Figure (b) shows the pressure change with time during the
experiment, which includes several additions of the light compound. Figure (c) shows a
pressure composition diagram.
Figure 5 – Experimental procedure, synthetic isothermal method [2].
At the beginning of the experiment, the equilibrium cell is charged with a precisely known
amount of the first component, normally the less volatile, and then evacuated, before
High-pressure phase equilibria for product and process design
18
applying to the system the desired temperature. Then, an exactly known amount of the more
volatile component is added to the cell with the help of a syringe pump (Figure 5a), leading
to an increase of the pressure in the system. As the gas dissolves into the liquid phase, the
pressure inside the equilibrium cell decreases, eventually reaching an equilibrium value
(Figure 5b). For this reason, this method is also called “pressure-decay method” in the
literature. After the equilibrium is achieved, the pressure and temperature are registered, as
well as the volumes of both phases when available, and the composition of the vapor phase is
calculated with a phase equilibrium model. The composition of the liquid phase is then
calculated by material balance from the known total composition, the composition of the
vapor phase and the phase densities and volumes [34], yielding a point in the boiling point
curve of the phase diagram. Successive additions are performed, repeating the procedure,
and allowing the determination of more points in the boiling point line (Figure 5b and 5c).
This method is particularly practical in cases where the high-boiling compound has a
negligible vapor pressure, and the composition of the gas phase can be assumed as being the
pure light-boiling compound.
High-pressure phase equilibria for product and process design
19
3 Design and development of a new apparatus - Synthetic visual method with phase change
The laboratory of Property Data and Thermodynamics is equipped with several experimental
set-ups for the study of phase equilibria by means of synthetic isothermal methods. Cells are
available for different ranges of pressure and for different requirements. However, for the
study of multicomponent in gaseous phase, the existing equipment is not ideal, requiring
time-consuming experiments. The demand for accurate high-pressure phase equilibria data
including systems with gas mixtures in several areas of industry, led to the need for the
development of a new apparatus, using a method optimal for the measurements in question,
and which allows the experiments to be done in a shorter time when compared to the existing
equipment.
Nowadays, it is very common the use of processes with reactions in gas phase making the
process greener and more economic due to the reductions in the use of solvents. The
challenge in this kind of systems entails the fact that some of these compounds present a
considerable vapor pressure. Solubilities at high pressures have a preponderant role, not only
in the process optimization, but also in terms of safety.
3.1. Preliminary steps
Equipment design includes preliminary steps which consume considerable time. However,
these are extremely important to achieve high quality on the desired apparatus.
A detailed knowledge of the main purpose and the goals to achieve must be done, followed by
a critical evaluation of existent experimental set-ups in the literature and in the laboratory as
well. Analyzing the existing problems, limitations and possible sources of errors will allow a
clearly comprehension of the aspects which can be improved. To help the design process and
a better comprehension of the necessary parts to be manufactured, computer-aided design
(CAD) had become an indispensable tool, allowing the virtually build of the apparatus (e.g.
mechanical details and physical properties). From a management point of view it should be
considered that projects have a limited duration and due to the cost and complexity of some
experimental set-ups, the apparatus must be adaptable for other applications. If a general
designed of the apparatus is not possible, an eventual decommissioning of the equipment
High-pressure phase equilibria for product and process design
20
should ensure the possibility of using all, or almost all, parts from the apparatus in other
applications.
3.2. New apparatus
The new experimental set-up, intended to be used in a wide range of temperatures (up to
200°C) at pressures up to more than 20 MPa, was entirely designed and built “in house”, and
it is schematically represented in Figure 6.
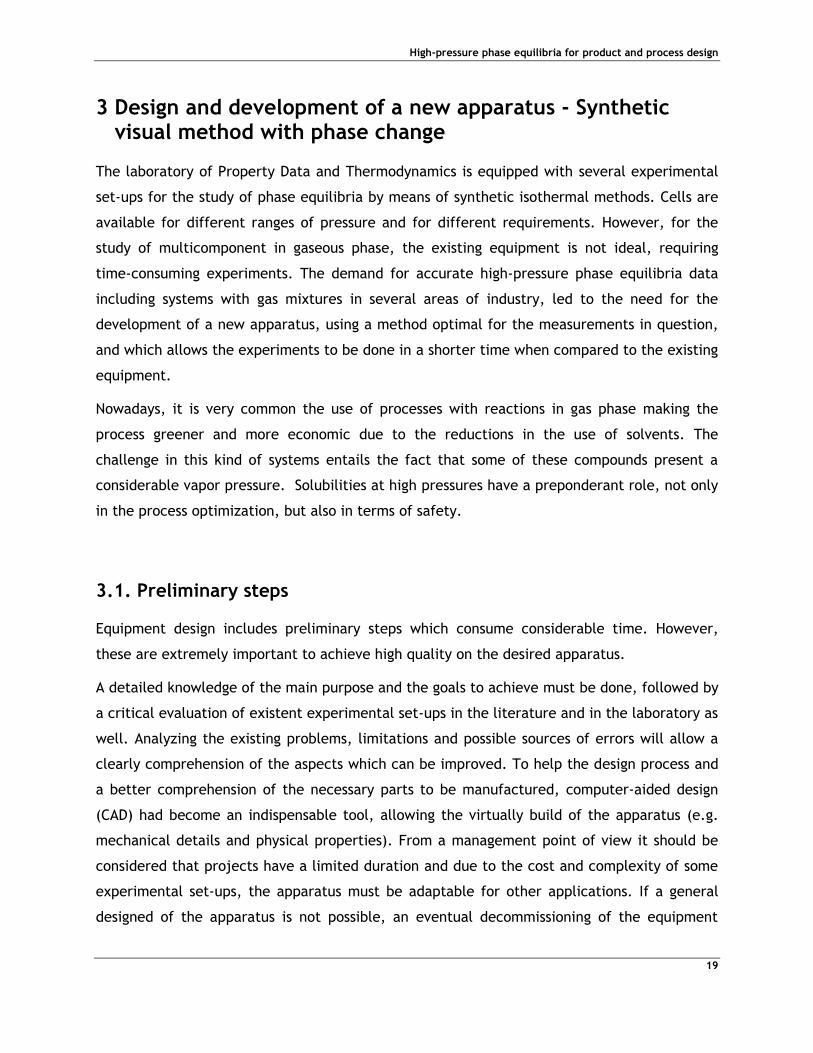
Figure 6 – Schematic representation of the new experimental set-up for the measurement of multi-phase equilibria at high-pressures. – A: Equilibrium cell; B: Liquid thermal bath; C: temperature controller; D: motor for stirring mechanism; E: Platinum resistance thermometer (Pt 100); F: Pressure sensor; G: Data logger; H: Computer; J: high-pressure syringe pumps; K: Video camera; L: ports for liquid and gas.
The main part of the apparatus is the variable-volume high-pressure equilibrium cell specially
projected for this application and equipped with two 360° sapphire windows which allow high
visibility of the top of the cell, where the last bubble of gas phase disappears. One of the
sapphire tubes presents a superior cavity, which will allow high-visibility of the appearance or

High-pressure phase equilibria for product and process design
21
disappearance of gas bubbles. The temperature is monitored by platinum resistance
thermometers (Pt100) and it is recorded over time through a computer. The cell is placed
inside a liquid thermal bath for a better temperature control. For the pressure measurement,
the need of an accurate pressure sensor able to measure pressures up to more than 20 MPa
and suitable to high-temperatures led to an innovated solution. A stirring mechanism with the
main requirement of perturbing the interface between liquid and gas was also designed and
built.
3.2.1 The equilibrium cell
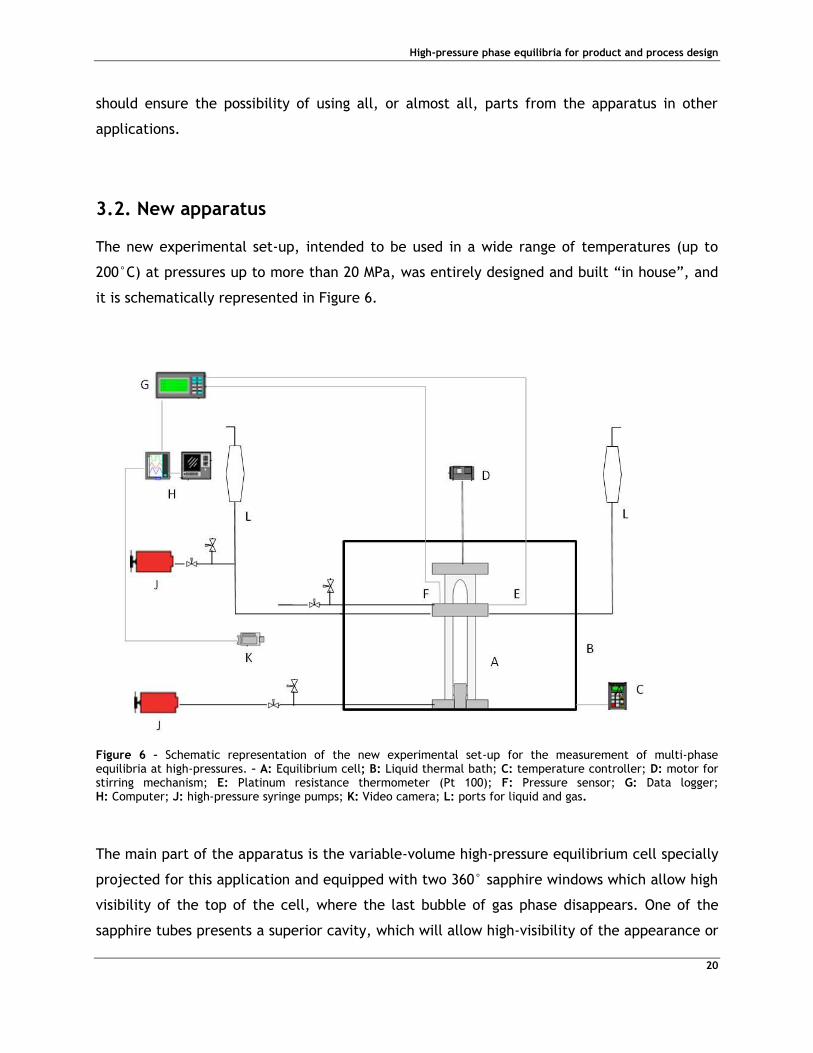
The high-pressure equilibrium cell was entirely designed and developed “in house”, in
Stainless Steel 316, equipped with two 360° sapphire windows. The cell contains a floating
piston for the regulation of the internal volume, which can vary from 20.8 cm3 to 50.6 cm3.
The piston can be operated by applying pressure under it, through a pressure transmitter
medium, and a high-pressure syringe pump. The piston is used to set a specific value of
pressure in the cell, for example to promote the appearance or disappearance of a new
phase, or the observation of critical phenomena.
The cell was planned and designed through the use of SolidWorks 3D CAD Design Software and
the files were posteriorly handed to the workshop for the building process. Figure 7 shows the
details of the cell’s body. The metallic part between the two sapphire tubes concentrates all
the connections. Two ports are used for the pressure and temperature measurements, while
the others can be connected to the vacuum, and to the different substances to be injected in
the cell.
The sapphire tubes have a wall thickness of 15 mm and they were dimensioned according the
properties of the material provided by the supplier, GoodFellow Cambridge Ltd., UK. The
synthetic sapphire single crystal has a polishing better than 0.1µm Ra (the average radius of
the irregularities or cavities in the surface is inferior 0.1µm).
The sealing in the cell is assured by O-rings made of polymer appropriate for high
temperature applications, placed between the parts of stainless steel and the sapphires.
Thanks to the large windows, it is possible to have a good visibility of the entire interior of
the cell during the experiments, and particularly of its upper end, where the gaseous phase
disappear.
High-pressure phase equilibria for product and process design
22
Figure 7 - 3D computer generated images of the new high-pressure equilibrium cell. – On the left: overview of the cell. On the right: cut of the cell showing the interior
Thermostatization of the equilibrium cell
One of the main objectives for this apparatus is its extensive temperature range operation
(from 0ºC up to 200ºC). To achieve this goal, different solutions were considered for the
thermostatization of the cell, namely the use of a liquid or an air thermal bath. Despite the
fact that air baths are much more practical, since they do not present special requirements
for the position of the electronic components, liquid baths provide better temperature
stability. A Lauda PV36 bath, supplied by Lauda Dr. R. Wobser GmbH & CO. KG, was used, to
control the temperature with a stability of ± 0.01 °C.
Temperature and pressure measurements
Pressure and temperature are, probably, the most important parameters to be measured in
any thermodynamic measurement. The temperature of the cell is monitored with a platinum
resistance thermometer Pt100, which is connected to a data acquisition system for monitoring
and recording of the data.
In this specific apparatus, measuring the pressure presented several challenges. Adding to the
high-accuracy, and to the requirement to measure high-pressures in an extensive range of
High-pressure phase equilibria for product and process design
23
temperatures, there were also space limitations, the fact that the cell is immersed in a liquid
bath, and considerations to the position of the sensor, so as to avoid that when the gas phase
disappears in the cell, no gas bubbles remain in an eventual connection to the pressure
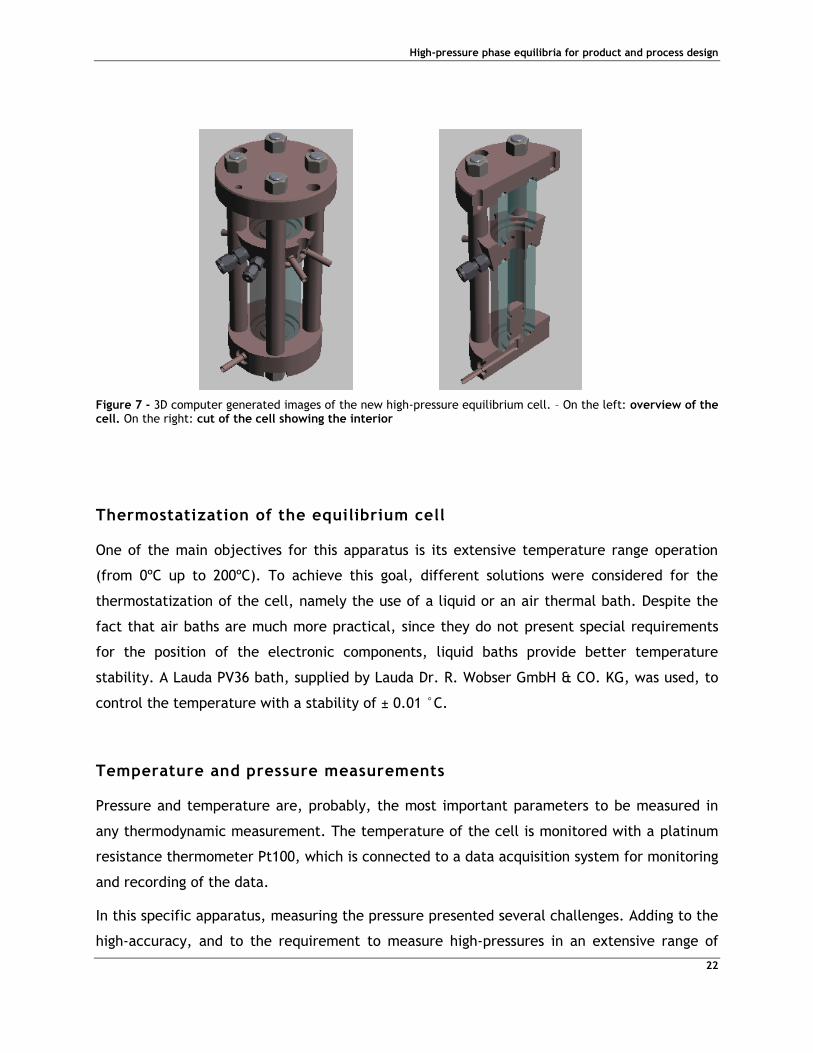
sensor. Therefore, a search on literature and market was made, in order to find the optimal
solution for pressure measurement. The choice was to measure the pressure inside the cell
with an optical fiber pressure sensor that uses Fabry-Perot interferometer technology. Figure
8 shows the scheme and a photo of the pressure sensor.
Figure 8 – Fiber optic pressure sensor. Left: schematic pressure sensor; Right: photo [35].
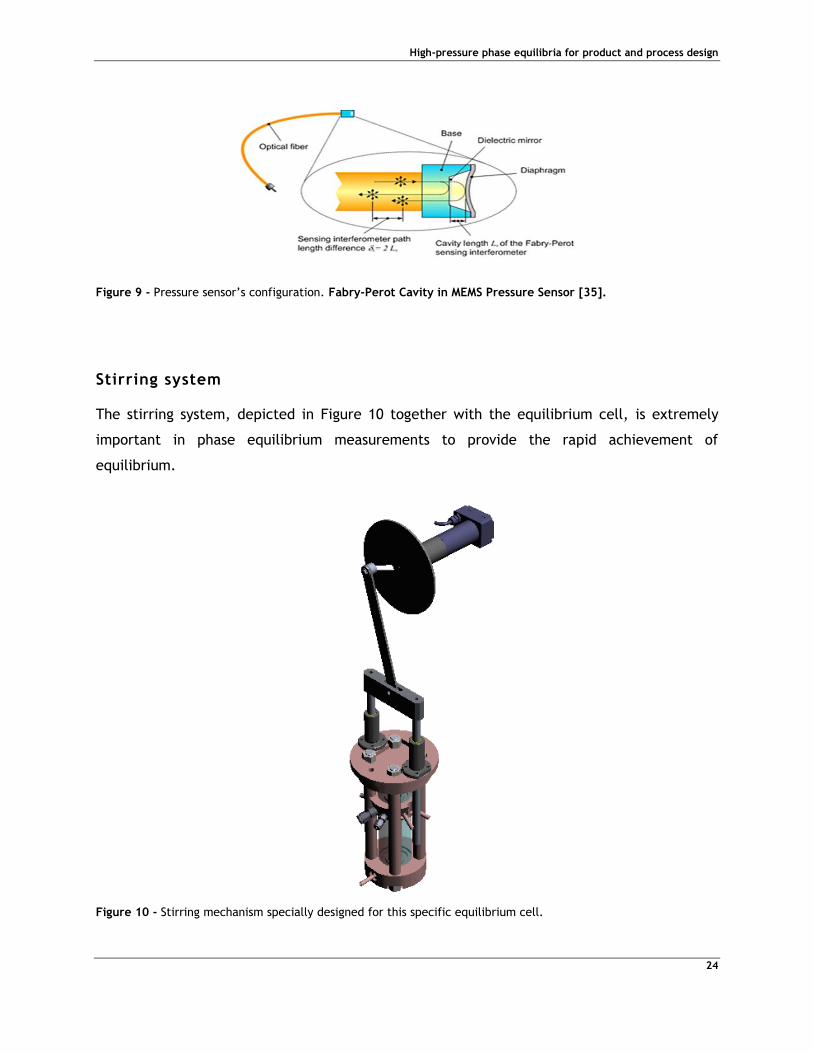
The Fabry-Perot Interferometer is an optical component consisting of two reflecting parallel
mirrors separated by a gap. The gap between the two mirrors is the Fabry-Perot Cavity. The
transmitted beam will reflect several times between the cavity walls, yielding multiple
interferences. The light interfered is coupled into the pressure sensor through the optical
fiber and reflected by each interface. The length of the gap varies with the pressure applied
due to the deflection of the diaphragm. There is a direct relation between the length of the
gap and the reflection spectrum; one can know the applied pressure by measuring the
spectrum shift [35]. In Figure 9 the configuration of this MEMS (Microeletromechanical
systems) pressure sensor can be observed.
High-pressure phase equilibria for product and process design
24
Figure 9 - Pressure sensor’s configuration. Fabry-Perot Cavity in MEMS Pressure Sensor [35].
Stirring system
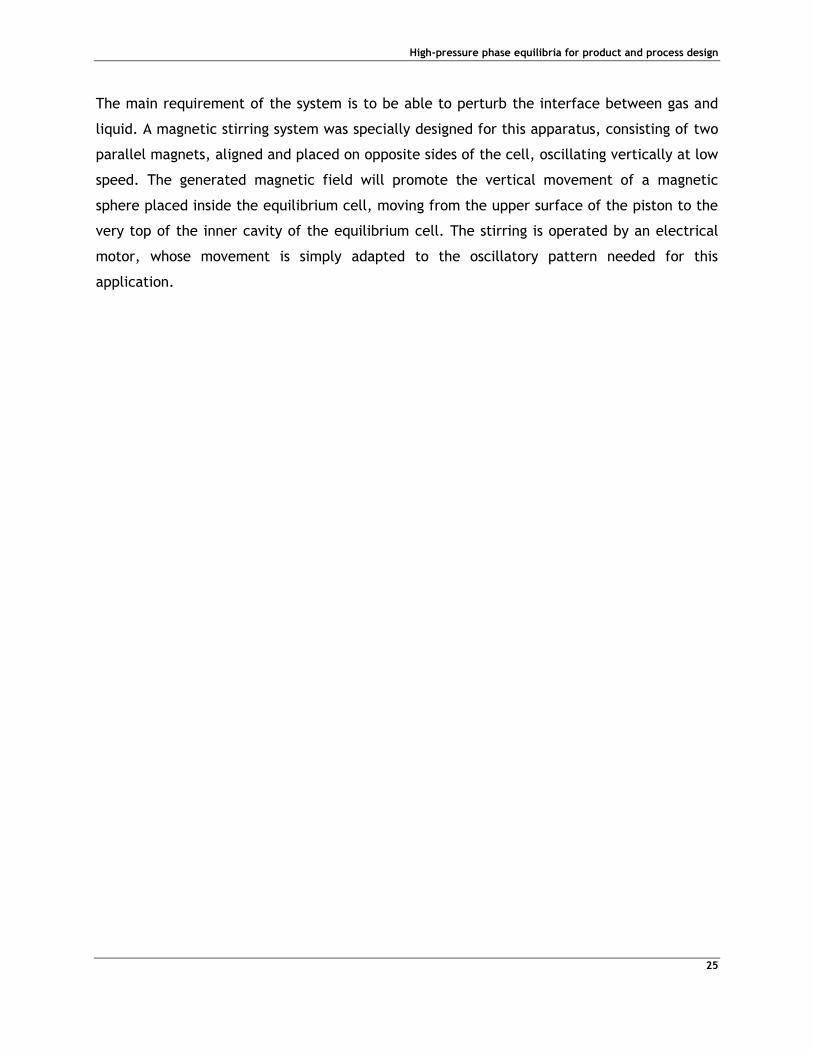
The stirring system, depicted in Figure 10 together with the equilibrium cell, is extremely
important in phase equilibrium measurements to provide the rapid achievement of
equilibrium.
Figure 10 - Stirring mechanism specially designed for this specific equilibrium cell.
High-pressure phase equilibria for product and process design
25
The main requirement of the system is to be able to perturb the interface between gas and
liquid. A magnetic stirring system was specially designed for this apparatus, consisting of two
parallel magnets, aligned and placed on opposite sides of the cell, oscillating vertically at low
speed. The generated magnetic field will promote the vertical movement of a magnetic
sphere placed inside the equilibrium cell, moving from the upper surface of the piston to the
very top of the inner cavity of the equilibrium cell. The stirring is operated by an electrical
motor, whose movement is simply adapted to the oscillatory pattern needed for this
application.
High-pressure phase equilibria for product and process design
26
4 New equilibrium cells - Synthetic isothermal method without phase change
The laboratory of Property Data and Thermodynamics of BTS has several equilibrium cells for
VLE studies based on the synthetic isothermal method. Most of the high-pressure cells
available are made of stainless steel, for economical and safety reasons.
Given the already mentioned advantages of view-cells, it was decided to develop two new
equilibrium cells, inspired in the view-cells existent in the laboratory, but which have
limitations concerning the pressure, as they are made of glass.
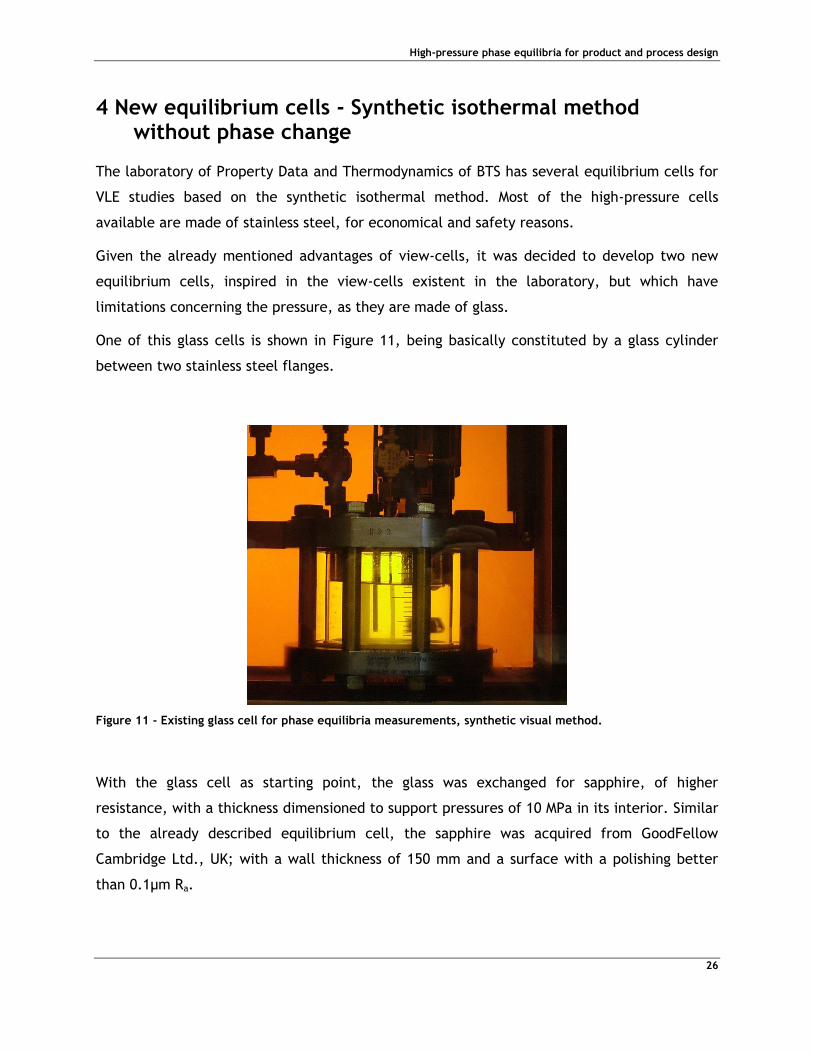
One of this glass cells is shown in Figure 11, being basically constituted by a glass cylinder
between two stainless steel flanges.
Figure 11 - Existing glass cell for phase equilibria measurements, synthetic visual method.
With the glass cell as starting point, the glass was exchanged for sapphire, of higher
resistance, with a thickness dimensioned to support pressures of 10 MPa in its interior. Similar
to the already described equilibrium cell, the sapphire was acquired from GoodFellow
Cambridge Ltd., UK; with a wall thickness of 150 mm and a surface with a polishing better
than 0.1µm Ra.
High-pressure phase equilibria for product and process design
27
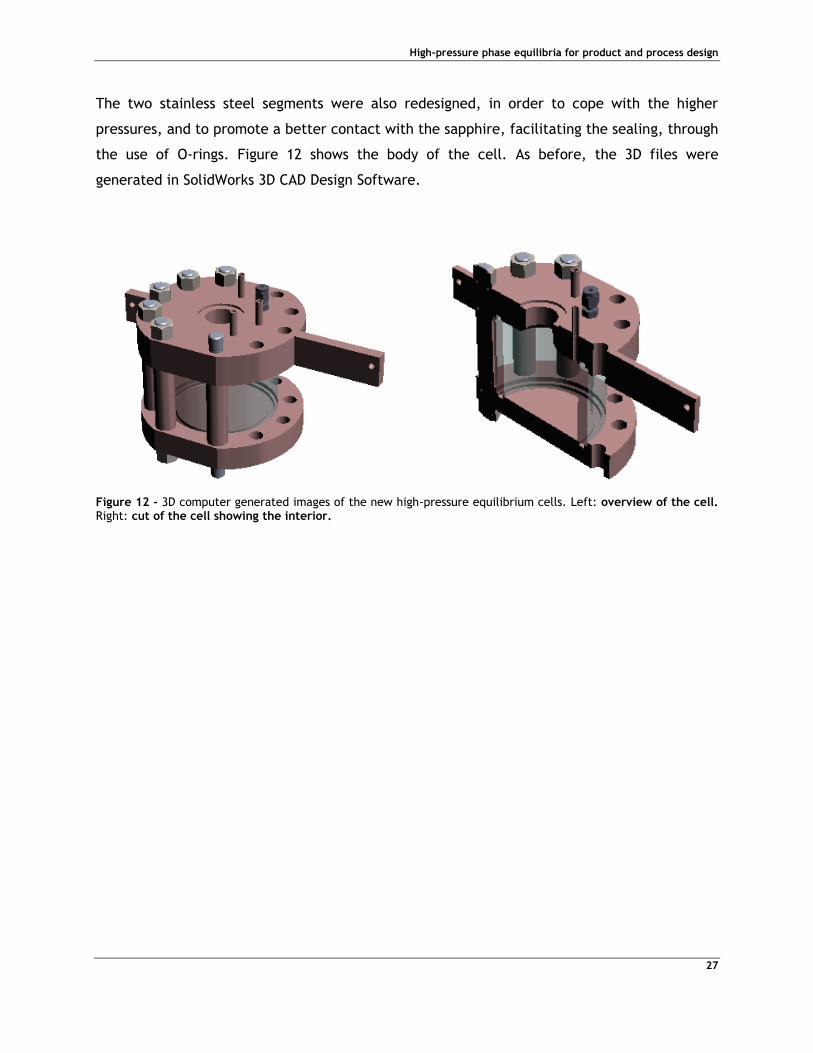
The two stainless steel segments were also redesigned, in order to cope with the higher
pressures, and to promote a better contact with the sapphire, facilitating the sealing, through
the use of O-rings. Figure 12 shows the body of the cell. As before, the 3D files were
generated in SolidWorks 3D CAD Design Software.
Figure 12 - 3D computer generated images of the new high-pressure equilibrium cells. Left: overview of the cell. Right: cut of the cell showing the interior.
High-pressure phase equilibria for product and process design
28
5 Solubility of carbon dioxide and propylene oxide in polymers derived from carbon dioxide
Crude oil is a raw material widely used in the chemical industry as source of carbon. More
than half a million tons of crude oil are processed for the production of polymers every day
[36].
Ideally, carbon dioxide could be integrated into the molecular structure of polymers, reducing
the consumption of crude oil to produce these indispensable materials. This would lower the
dependence of the chemical industry on this fossil raw material, making it also less
susceptible to oscillations in the oil prices, which present a long term tendency to increase.
For a long time, scientists considered the use of carbon dioxide (CO2) as raw material in the
production of polymers, but the reaction of CO2 revealed to be extremely unfavorable from
an energetic point of view. However, in combination with “high-energy” monomers like
epoxides, the energy balance of the CO2 reaction could be turned into a favorable direction.
Additionally, the development of a new appropriate catalyst was crucial in making this
copolymerization possible [37].
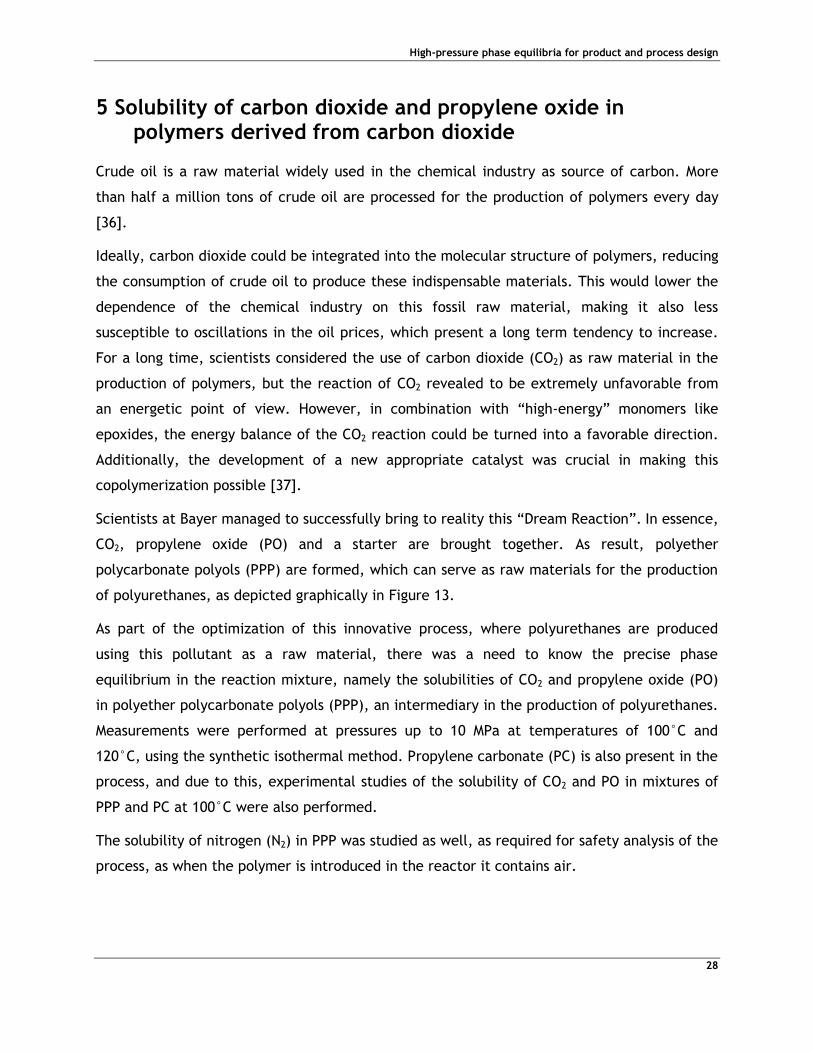
Scientists at Bayer managed to successfully bring to reality this “Dream Reaction”. In essence,
CO2, propylene oxide (PO) and a starter are brought together. As result, polyether
polycarbonate polyols (PPP) are formed, which can serve as raw materials for the production
of polyurethanes, as depicted graphically in Figure 13.
As part of the optimization of this innovative process, where polyurethanes are produced
using this pollutant as a raw material, there was a need to know the precise phase
equilibrium in the reaction mixture, namely the solubilities of CO2 and propylene oxide (PO)
in polyether polycarbonate polyols (PPP), an intermediary in the production of polyurethanes.
Measurements were performed at pressures up to 10 MPa at temperatures of 100°C and
120°C, using the synthetic isothermal method. Propylene carbonate (PC) is also present in the
process, and due to this, experimental studies of the solubility of CO2 and PO in mixtures of
PPP and PC at 100°C were also performed.
The solubility of nitrogen (N2) in PPP was studied as well, as required for safety analysis of the
process, as when the polymer is introduced in the reactor it contains air.
High-pressure phase equilibria for product and process design
29
Figure 13 - CO2 as raw material for the production of polyurethanes [37].
In 2012, the first experimental results of this project were publish by Fonseca et al. [37], but
further measurements are needed, since the process is being developed and there is a
permanent evolution in the reaction process, with new polymers with improved
characteristics and different properties being prepared.
5.1. Experimental procedure
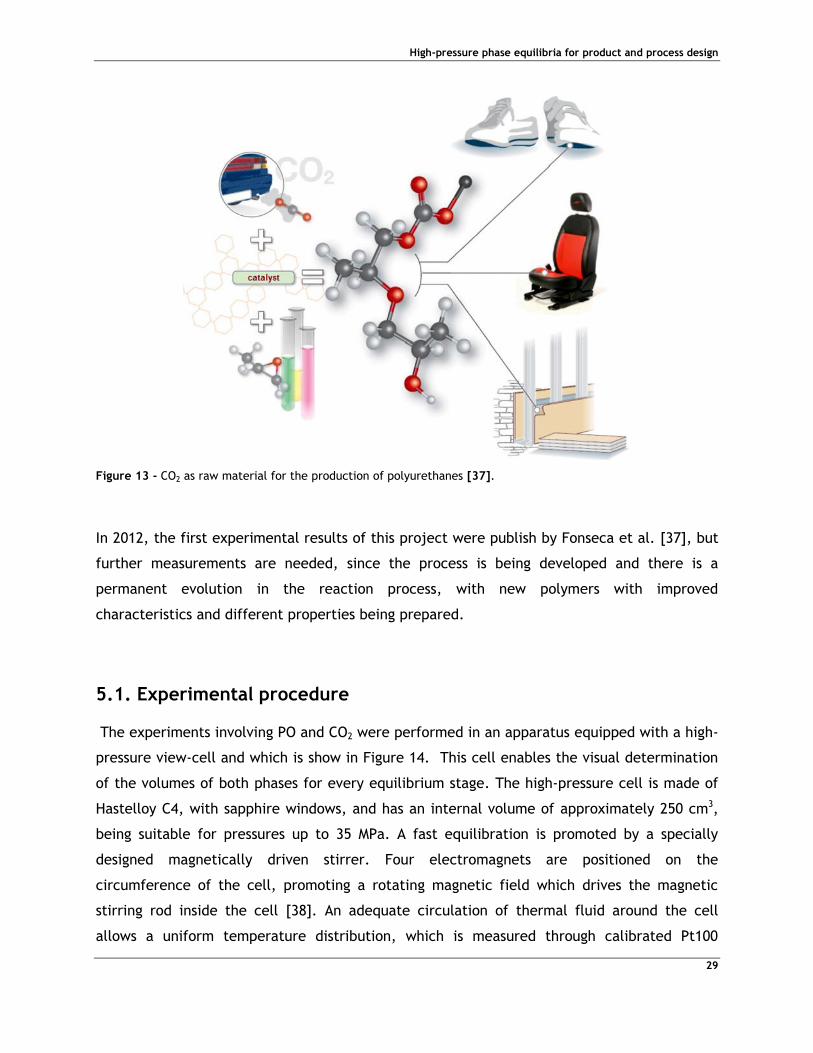
The experiments involving PO and CO2 were performed in an apparatus equipped with a high-
pressure view-cell and which is show in Figure 14. This cell enables the visual determination
of the volumes of both phases for every equilibrium stage. The high-pressure cell is made of
Hastelloy C4, with sapphire windows, and has an internal volume of approximately 250 cm3,
being suitable for pressures up to 35 MPa. A fast equilibration is promoted by a specially
designed magnetically driven stirrer. Four electromagnets are positioned on the
circumference of the cell, promoting a rotating magnetic field which drives the magnetic
stirring rod inside the cell [38]. An adequate circulation of thermal fluid around the cell
allows a uniform temperature distribution, which is measured through calibrated Pt100
High-pressure phase equilibria for product and process design
30
resistance thermometers. The pressure is measured with a precision pressure transducer,
directly coupled to the cell and calibrated before each experiment. A more detailed
description of this apparatus can be found in the literature published by Peper et al [39].
Figure 14 – High-pressure equilibrium view-cell where the experiments for the study of solubility of CO2 and PO in the polymer were performed [39].
The experimental procedure used corresponds to the synthetic isothermal method, also
known as “pressure decay method” already presented. A precisely determined amount of the
polymer is introduced into a previously evacuated equilibrium cell. Using a high-pressure
syringe pump at constant temperature, a small, well known amount of the volatile component
(C02 or PO) is added, leading to a pressure increase in the cell [2]. For every addition, the
difference in the volume of the syringe is recorded, and the amount of compound injected in
the cell is calculated from its density at the temperature of the syringe. Contrary to N2 or to
propylene oxide, CO2 was kept at low temperature in the syringe pump, further away from its
critical point, in order to reduce the uncertainty in the amounts injected. Closer to its critical
point, the density of the liquid carbon dioxide varies significantly with temperature, and
High-pressure phase equilibria for product and process design
31
oscillations in the temperature of the syringe pump would lead to a larger error in the
calculation of the amount added to the cell.
The density of gaseous PO, at pressure and temperature conditions of the equilibrium
measurements, were calculated using the SRK equation of state, which at the moderate
pressures in question usually provides results with an accuracy between 1% and 2%. The
densities of CO2 were calculated through a reference equation of state [40]. After adding the
gas to the cell, the pressure inside the cell decreases as the gas dissolves into the polymer,
eventually reaching an equilibrium value. Once equilibrium is achieved, the solubility of the
volatile component in the liquid phase is calculated through a mass balance, considering the
equilibrium pressure, the total composition in the cell, and the volumes of the two phases.
Thereafter, a new addition of gas is done and the process must be repeated until reached the
desired gas concentration.
Due to the low volatility of PPP and propylene carbonate, the vapor phase is considered to
consist of pure gas, CO2 or PO. Using equations of state, the density of the gases at
equilibrium pressures can be determined. Knowing the volume of the gas phase, it is possible
to calculate the amount of gas in the gas phase, and by difference the amount of gas
dissolved in the polymer.
In the measurements in question, where a high solubility is expected, due to the nature of the
compounds involved, the use of a view-cell becomes very important. High solubility can result
in variations on volume of the condensed phase, which will influence the material balance
used in the calculation of the solubility, which is based on the volume and density of the gas
phase. In the study of the solubility of CO2 for example, the volume of the condensed phase
increased on average 1.5% per every 1 wt% of CO2 dissolved in the polymer.
Some experiments were repeated in order to verify the repeatability of the method and
procedure. A very good agreement among the results was found.
The measurements with N2 were performed in the phase equilibrium apparatus represented
schematically in Figure 15. The stainless steel equilibrium cell, displayed in the figure, has an
internal volume of 312 cm3 and it can be used for pressures up to 6 MPa. A Pt100 resistance
thermometer and a high-precision pressure transducer were used in the apparatus, calibrated
before each experiment for a specific temperature and for the entire relevant pressure range
using a pressure balance calibrated in regular intervals. The equilibrium cell is placed in a
High-pressure phase equilibria for product and process design
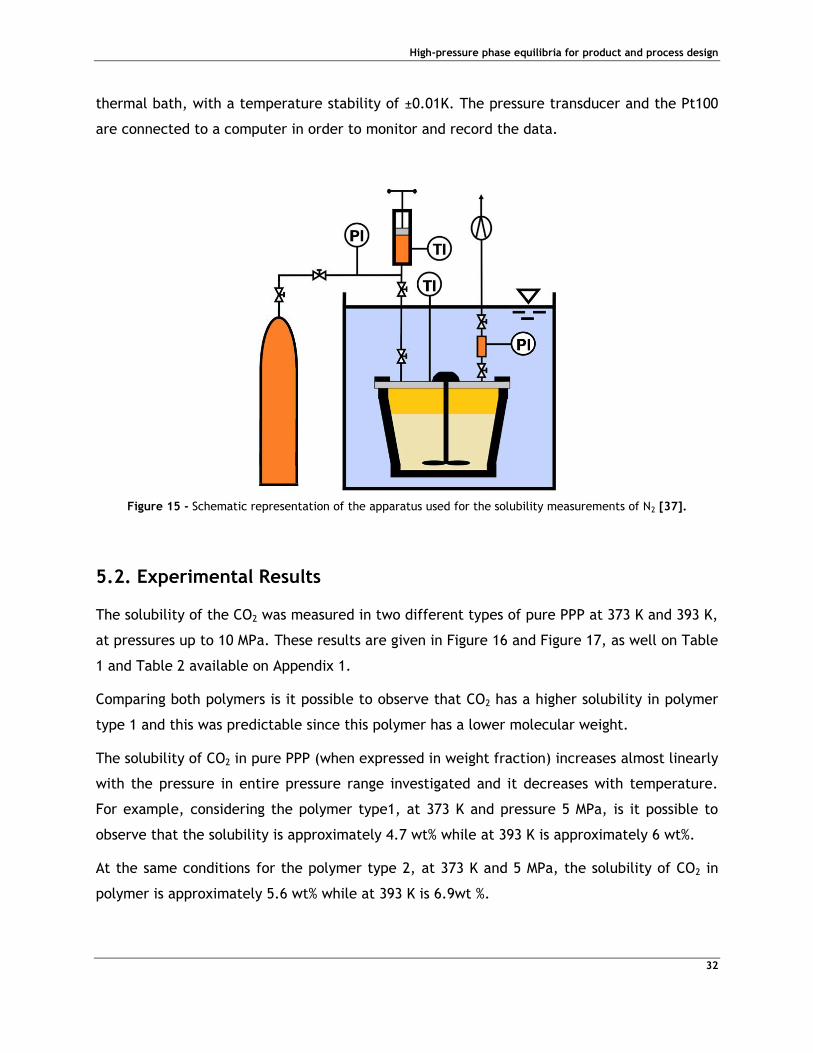
32
thermal bath, with a temperature stability of ±0.01K. The pressure transducer and the Pt100
are connected to a computer in order to monitor and record the data.
Figure 15 - Schematic representation of the apparatus used for the solubility measurements of N2 [37].
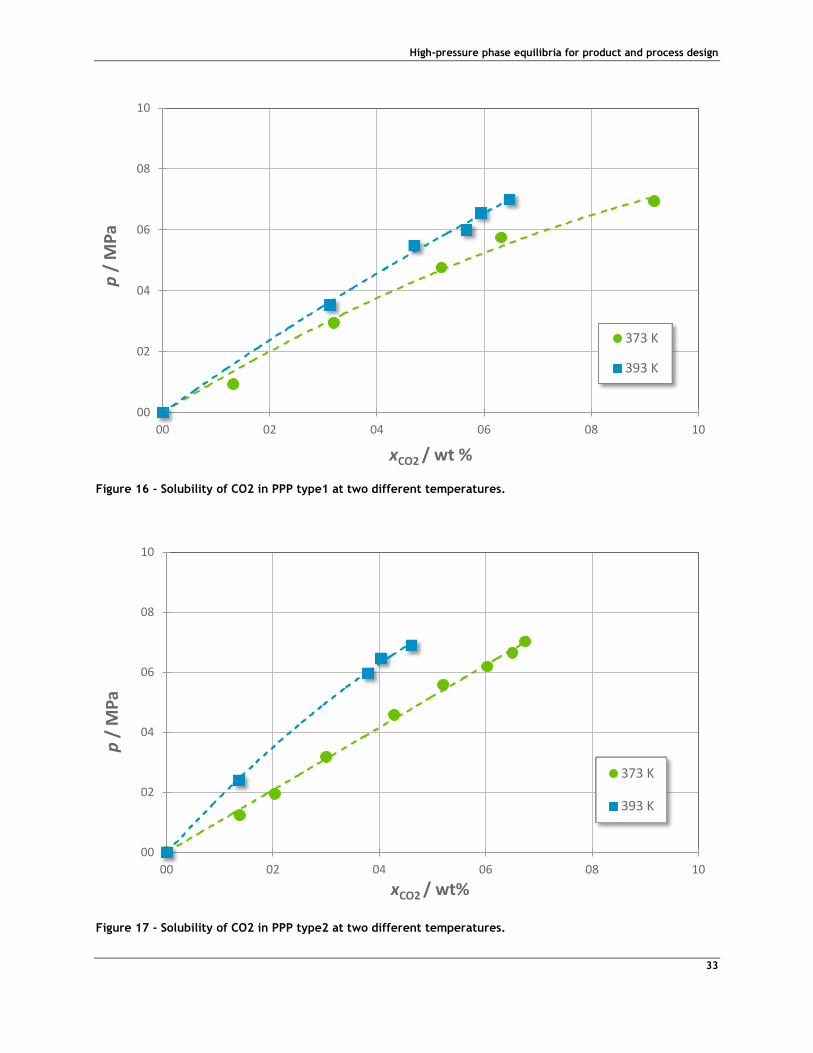
5.2. Experimental Results
The solubility of the CO2 was measured in two different types of pure PPP at 373 K and 393 K,
at pressures up to 10 MPa. These results are given in Figure 16 and Figure 17, as well on Table
1 and Table 2 available on Appendix 1.
Comparing both polymers is it possible to observe that CO2 has a higher solubility in polymer
type 1 and this was predictable since this polymer has a lower molecular weight.
The solubility of CO2 in pure PPP (when expressed in weight fraction) increases almost linearly
with the pressure in entire pressure range investigated and it decreases with temperature.
For example, considering the polymer type1, at 373 K and pressure 5 MPa, is it possible to
observe that the solubility is approximately 4.7 wt% while at 393 K is approximately 6 wt%.
At the same conditions for the polymer type 2, at 373 K and 5 MPa, the solubility of CO2 in
polymer is approximately 5.6 wt% while at 393 K is 6.9wt %.
High-pressure phase equilibria for product and process design
33
Figure 16 - Solubility of CO2 in PPP type1 at two different temperatures.
Figure 17 - Solubility of CO2 in PPP type2 at two different temperatures.
00
02
04
06
08
10
00 02 04 06 08 10
p /
MP
a
xCO2 / wt %
373 K
393 K
00
02
04
06
08
10
00 02 04 06 08 10
p /
MP
a
xCO2 / wt%
373 K
393 K
High-pressure phase equilibria for product and process design
34
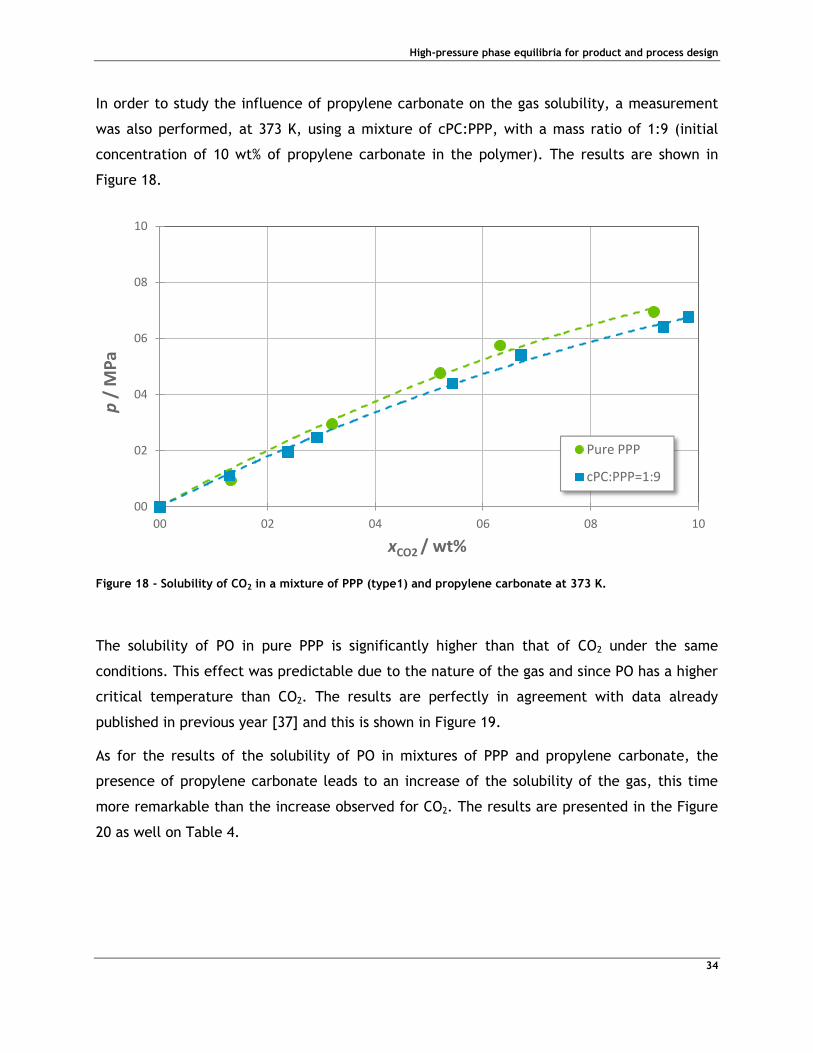
In order to study the influence of propylene carbonate on the gas solubility, a measurement
was also performed, at 373 K, using a mixture of cPC:PPP, with a mass ratio of 1:9 (initial
concentration of 10 wt% of propylene carbonate in the polymer). The results are shown in
Figure 18.
Figure 18 - Solubility of CO2 in a mixture of PPP (type1) and propylene carbonate at 373 K.
The solubility of PO in pure PPP is significantly higher than that of CO2 under the same
conditions. This effect was predictable due to the nature of the gas and since PO has a higher
critical temperature than CO2. The results are perfectly in agreement with data already
published in previous year [37] and this is shown in Figure 19.
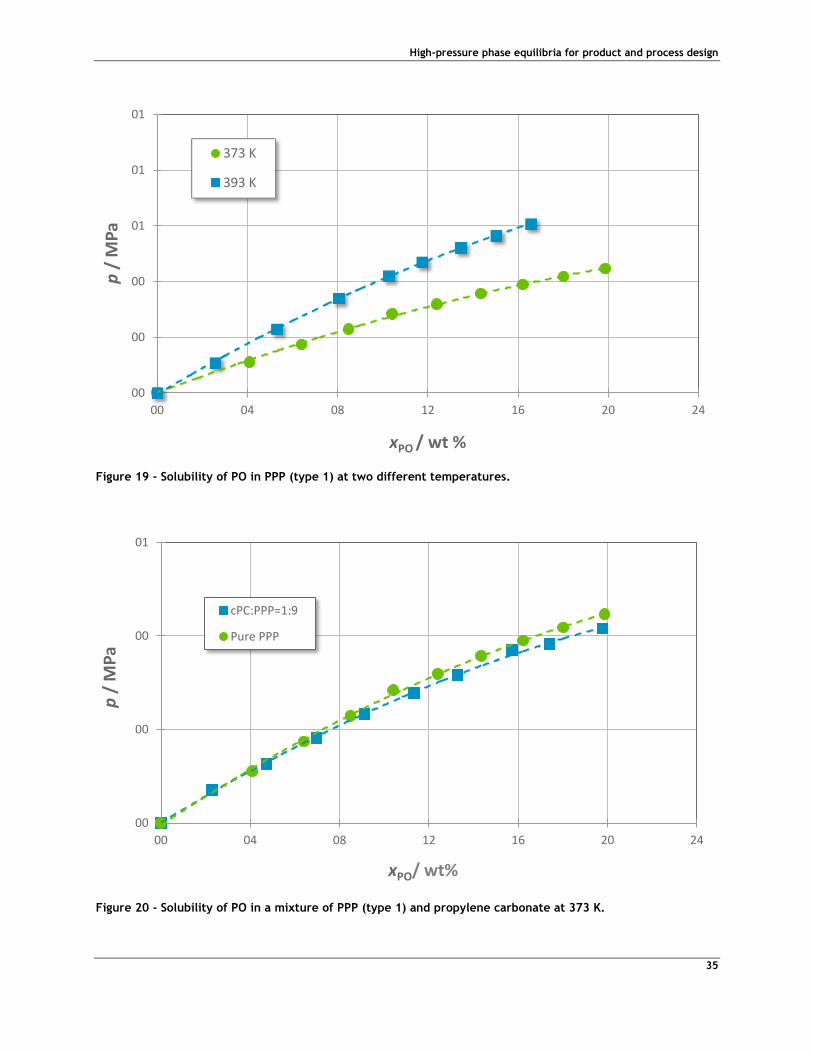
As for the results of the solubility of PO in mixtures of PPP and propylene carbonate, the
presence of propylene carbonate leads to an increase of the solubility of the gas, this time
more remarkable than the increase observed for CO2. The results are presented in the Figure
20 as well on Table 4.
00
02
04
06
08
10
00 02 04 06 08 10
p /
MP
a
xCO2 / wt%
Pure PPP
cPC:PPP=1:9
High-pressure phase equilibria for product and process design
35
Figure 19 - Solubility of PO in PPP (type 1) at two different temperatures.
Figure 20 - Solubility of PO in a mixture of PPP (type 1) and propylene carbonate at 373 K.
00
00
00
01
01
01
00 04 08 12 16 20 24
p /
MP
a
xPO / wt %
373 K
393 K
00
00
00
01
00 04 08 12 16 20 24
p /
MP
a
xPO/ wt%
cPC:PPP=1:9
Pure PPP
High-pressure phase equilibria for product and process design
36
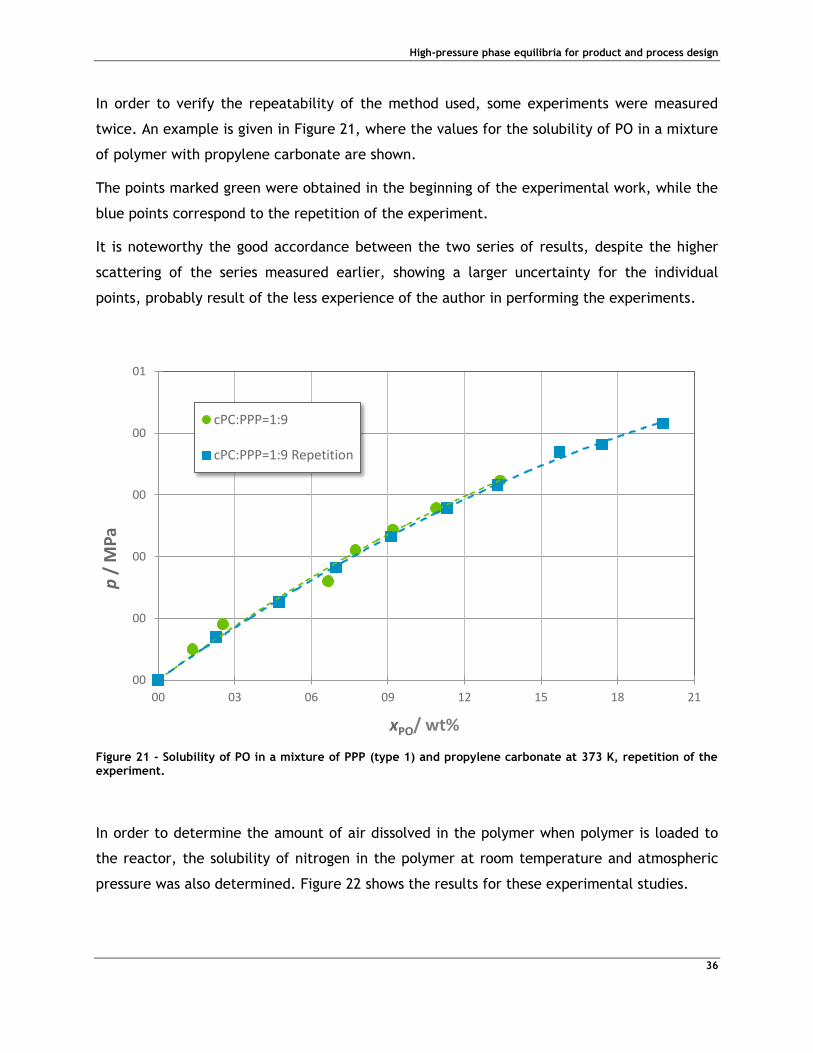
In order to verify the repeatability of the method used, some experiments were measured
twice. An example is given in Figure 21, where the values for the solubility of PO in a mixture
of polymer with propylene carbonate are shown.
The points marked green were obtained in the beginning of the experimental work, while the
blue points correspond to the repetition of the experiment.
It is noteworthy the good accordance between the two series of results, despite the higher
scattering of the series measured earlier, showing a larger uncertainty for the individual
points, probably result of the less experience of the author in performing the experiments.
Figure 21 - Solubility of PO in a mixture of PPP (type 1) and propylene carbonate at 373 K, repetition of the experiment.
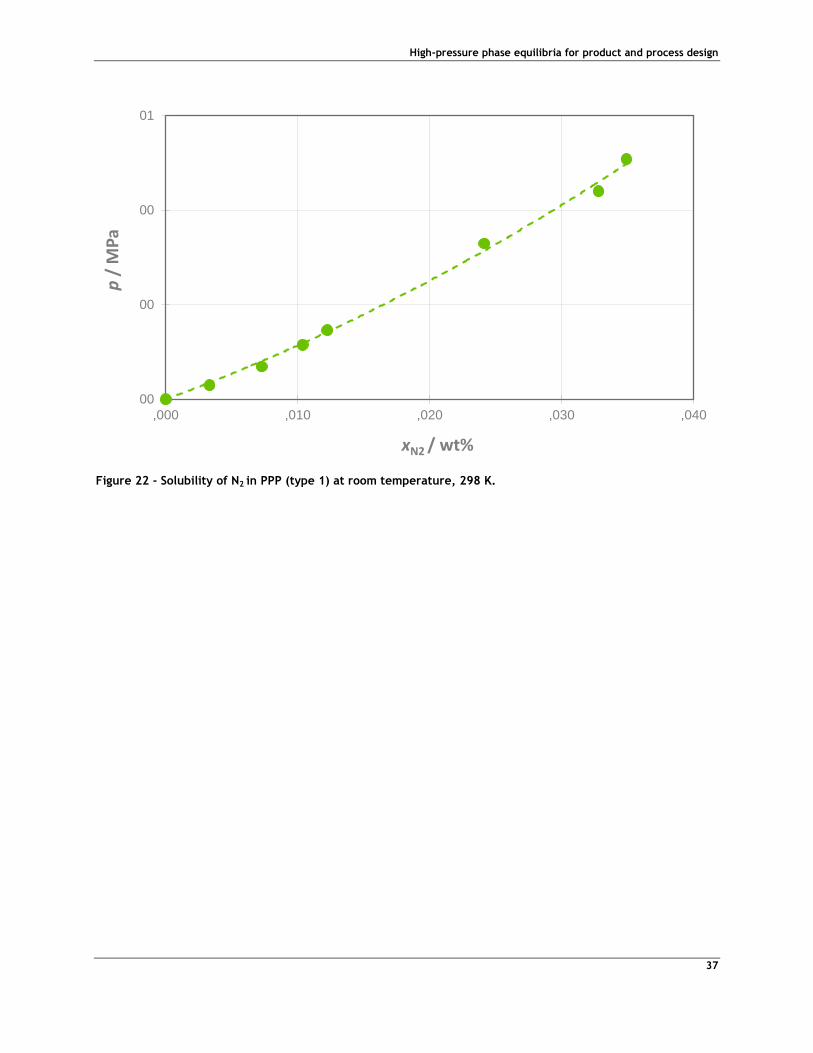
In order to determine the amount of air dissolved in the polymer when polymer is loaded to
the reactor, the solubility of nitrogen in the polymer at room temperature and atmospheric
pressure was also determined. Figure 22 shows the results for these experimental studies.
00
00
00
00
00
01
00 03 06 09 12 15 18 21
p /
MP
a
xPO/ wt%
cPC:PPP=1:9
cPC:PPP=1:9 Repetition
High-pressure phase equilibria for product and process design
37
Figure 22 - Solubility of N2 in PPP (type 1) at room temperature, 298 K.
00
00
00
01
,000 ,010 ,020 ,030 ,040
p /
MP
a
xN2 / wt%
High-pressure phase equilibria for product and process design
38
6 Conclusions and Further work
The goals initially planned for these 6 months were not completely achieved. The assembly
and testing of the quality of new cells were not possible to perform during this short period of
time. The delivery of custom made parts for the equilibrium cells was delayed by the
suppliers, namely in the case of the sapphire tubes. This time was directed for other
activities such as the participation in other projects and in performing additional
measurements of physical properties, such as surface tensions, calorimetry and viscosity
measurements, which were of great importance to the further development of the
experimental knowledge and skills of the author.
Nevertheless, the main purpose of the work was achieved, with the successful development
of 3 new high-pressure equilibrium cells, and the experimental study of phase equilibria
systems using different experimental methods, with results which are essential to a project of
great importance to Bayer, and in particular to Bayer Material Science and Bayer Technology
Services.
In this thesis, and despite the limitations on its extension, an effort was made to completely
describe the developed apparatus, in a comprehensively manner, highlighting the reasons for
the design or selection of any parts used.
As further work, several experimental tests can be done in order to test the quality of new
equipment and respectively validation. Further improvements for the developed apparatus
are dependent on the future applications as well as the available technology advancements.
Concerning the “Dream Production” project, polyurethanes are already being produced at
pilot-plant scale using carbon from CO2 on their structure. The success of this project is
depending on its optimization, for which the data measured and here presented, as well as
other physical property data, have a preponderant role.
High-pressure phase equilibria for product and process design
39
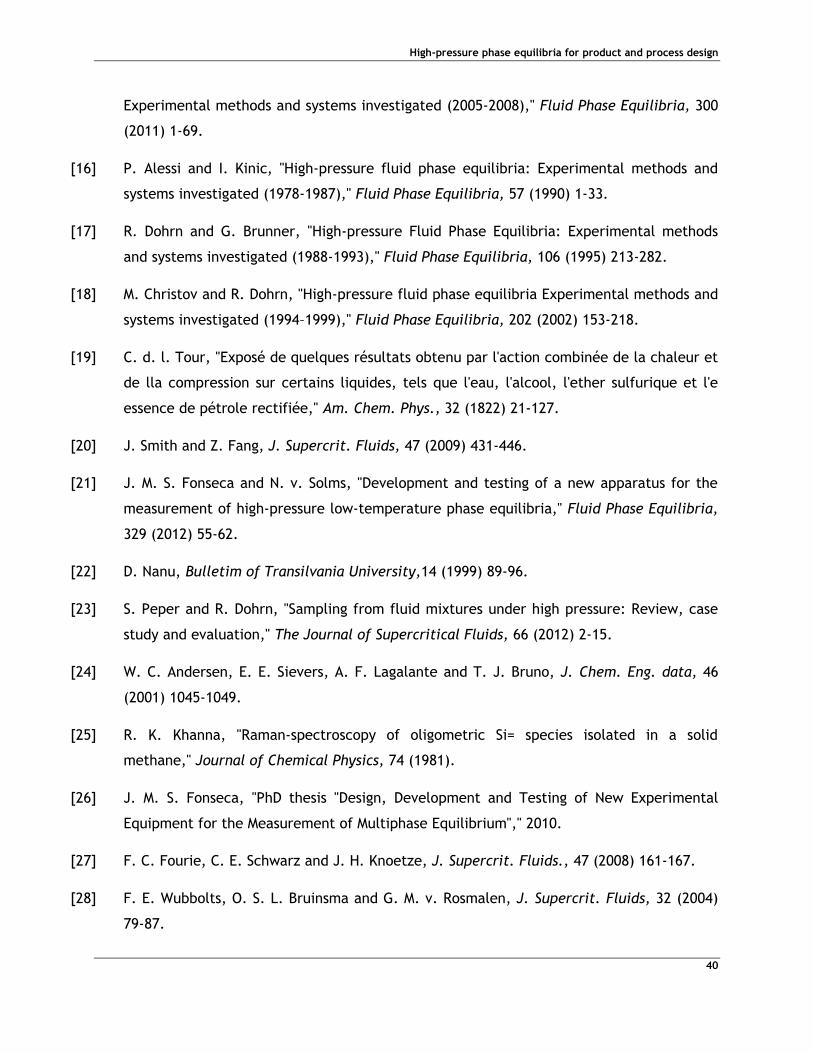
7 References
[1] "Bayer website," [Online]. Available: www.bayer.com. [Accessed 21 April 2013].
[2] R. Dohrn, J. M. S. Fonseca and S. Peper, "Experimental Methods for phase Equilibria at
High-pressures," Annu.Rev.Chem.Biomol. Eng., 3 (2012) 347-367.
[3] S. G. Deiters UK, "High pressure phase equilibria: experimental methods," Fluid phase
Equilibria, 60, (1986) 29-145.
[4] R. Dohrn, "Berechnung von Phasengleichgewichten," Vieweg-Verlag, Wiesbaden, 1994.
[5] D. Richon, Pure Appl. Chem., 81 (2009) 1769-1782.
[6] E. Hála, J. Pick and O. Vilím, "Vapour Liquid Equilibrium, 2nd ed," Pergamon Press, 1967.
[7] K. D. Bartle, S. A. Jafar, A. A. Clifford and G. F. Shilstone, J. Phys. Chem. Refe. Data,
(1991) 713-756.
[8] S. Sawamura, Pure Appl. Chem., 79 (2007) 861-874.
[9] J. M. S. S. Esperança, J. N. C. Lopes, M. Tariq, L. M. M. B. Santos, J. W. Magee and L. P.
N. Rebelo, "Pressure, isotope, and water co-solvent effects in liquid−liquid equilibria of
(ionic liquid + alcohol) systems," J. Chem. Eng. Data, 55 (2000) 3-12.
[10] S. Keskin, D. Kayrak-Talay, U. Akman and Í. Hortatsu, J. Supercrit. FLuids, 43 (2007) 150-
180.
[11] D. W. Morton, D. Ambrose, C. Tsonopoulos, K. N. Marsh and C. L. Young, J. Chem. Eng.
Data, 51 (2006) 305-314.
[12] L. Diamond and N. N. Akinfiev, Fluid Phase Equilib., 208 (2003) 265-290.
[13] N. Spycher, K. Pruess and J. Ennis-King, Geochim. Cosmochim, Acta 67 (2003) 3015-3031.
[14] R. Dohrn, S. Peper and J. M. S. Fonseca, "High-pressure fluid phase equilibria:
Exoperimental methods and systems investigated (2000-2004)," FLuid Phase Equilibria,
2008 (2010) 1-54.
[15] J. M. S. Fonseca, R. Dohrn and S. Peper, "High-pressure fluid-phase equilibria:
High-pressure phase equilibria for product and process design
40
Experimental methods and systems investigated (2005-2008)," Fluid Phase Equilibria, 300
(2011) 1-69.
[16] P. Alessi and I. Kinic, "High-pressure fluid phase equilibria: Experimental methods and
systems investigated (1978-1987)," Fluid Phase Equilibria, 57 (1990) 1-33.
[17] R. Dohrn and G. Brunner, "High-pressure Fluid Phase Equilibria: Experimental methods
and systems investigated (1988-1993)," Fluid Phase Equilibria, 106 (1995) 213-282.
[18] M. Christov and R. Dohrn, "High-pressure fluid phase equilibria Experimental methods and
systems investigated (1994–1999)," Fluid Phase Equilibria, 202 (2002) 153-218.
[19] C. d. l. Tour, "Exposé de quelques résultats obtenu par l'action combinée de la chaleur et
de lla compression sur certains liquides, tels que l'eau, l'alcool, l'ether sulfurique et l'e
essence de pétrole rectifiée," Am. Chem. Phys., 32 (1822) 21-127.
[20] J. Smith and Z. Fang, J. Supercrit. Fluids, 47 (2009) 431-446.
[21] J. M. S. Fonseca and N. v. Solms, "Development and testing of a new apparatus for the
measurement of high-pressure low-temperature phase equilibria," Fluid Phase Equilibria,
329 (2012) 55-62.
[22] D. Nanu, Bulletim of Transilvania University,14 (1999) 89-96.
[23] S. Peper and R. Dohrn, "Sampling from fluid mixtures under high pressure: Review, case
study and evaluation," The Journal of Supercritical Fluids, 66 (2012) 2-15.
[24] W. C. Andersen, E. E. Sievers, A. F. Lagalante and T. J. Bruno, J. Chem. Eng. data, 46
(2001) 1045-1049.
[25] R. K. Khanna, "Raman-spectroscopy of oligometric Si= species isolated in a solid
methane," Journal of Chemical Physics, 74 (1981).
[26] J. M. S. Fonseca, "PhD thesis "Design, Development and Testing of New Experimental
Equipment for the Measurement of Multiphase Equilibrium"," 2010.
[27] F. C. Fourie, C. E. Schwarz and J. H. Knoetze, J. Supercrit. Fluids., 47 (2008) 161-167.
[28] F. E. Wubbolts, O. S. L. Bruinsma and G. M. v. Rosmalen, J. Supercrit. Fluids, 32 (2004)
79-87.
High-pressure phase equilibria for product and process design
41
[29] A. Shariati and C. J. Peters, J. Supercrit. Fluids, 23 (2002) 195-208.
[30] "Thermodynamic Laboratory TU Delft," [Online]. Available:
http://homepage.tudelft.nl/v9k6y/ETh/Website/thermolab.html. [Accessed Março
2013].
[31] M. D. Jager and E. D. J. SLoan, FLuid Phase Equilib., 185 (2001) 88-89.
[32] X. Dong, C. erkey, H. J. Dai, H. C. Li, H. D. Cochran and J. S. Lin, Ind. Eng. Chem. Res.,
41 (2002) 1038-1042.
[33] D. Kodama, J. Miyazaki, M. Kato and T. Sako, Fluid Phase Equilib, 219 (2004) 19-23.
[34] K. Fischer and M. Wilken, "Experimental determination of oxygen and nitrogen solubility
in organic solvents up to 10 MPa at temperatures between 298 K and 398 K.," J. Chem.
Thermodyn.,33 (2001) 285-1308.
[35] Opsens, "White-light polarization Interferometry technology".
[36] T. Solutions, "The raw material carbon dioxide," (2010).
[37] J. M. S. Fonseca, R. Dohrn, A. Wolf and R. Bachmann, "The solubility of carbon dioxide
and propylene oxide in polymers derived from carbon dioxide," Fluid Phase Equilibria,
318 (2012) 83-88.
[38] C. Braden and R. Dohrn, "Magnetrührer im Hochdruckreaktor, Patent LE A 31 453 , Bayer
AG," 1996.
[39] H. V. D. R. Peper S., "Measurement of phase equilibria of the systems CO2 + styrene and
CO2 + vinyl acetate using different experimental methods," J. Supercrit. Fluids, 55 (2010)
537-544.
[40] R. W. W. Span, "A new equation of state for carbon dioxide covering the fluid region from
the triple-point temperature to 1100 K at pressures up to 800 MPa.," J. Phys. Chem. Ref.
Data,25 (1996) 1509-1596.
High-pressure phase equilibria for product and process design
42
Appendix 1
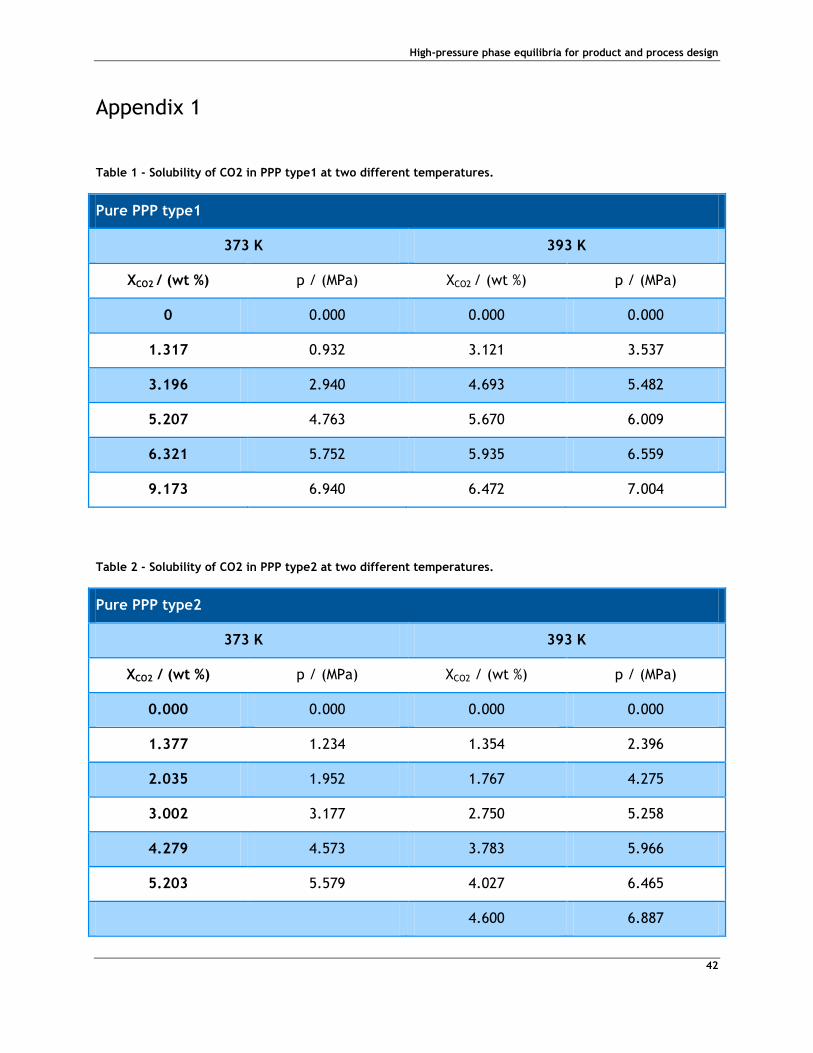
Table 1 - Solubility of CO2 in PPP type1 at two different temperatures.
Pure PPP type1
373 K 393 K
XCO2 / (wt %) p / (MPa) XCO2 / (wt %) p / (MPa)
0 0.000 0.000 0.000
1.317 0.932 3.121 3.537
3.196 2.940 4.693 5.482
5.207 4.763 5.670 6.009
6.321 5.752 5.935 6.559
9.173 6.940 6.472 7.004
Table 2 - Solubility of CO2 in PPP type2 at two different temperatures.
Pure PPP type2
373 K 393 K
XCO2 / (wt %) p / (MPa) XCO2 / (wt %) p / (MPa)
0.000 0.000 0.000 0.000
1.377 1.234 1.354 2.396
2.035 1.952 1.767 4.275
3.002 3.177 2.750 5.258
4.279 4.573 3.783 5.966
5.203 5.579 4.027 6.465
4.600 6.887
High-pressure phase equilibria for product and process design
43
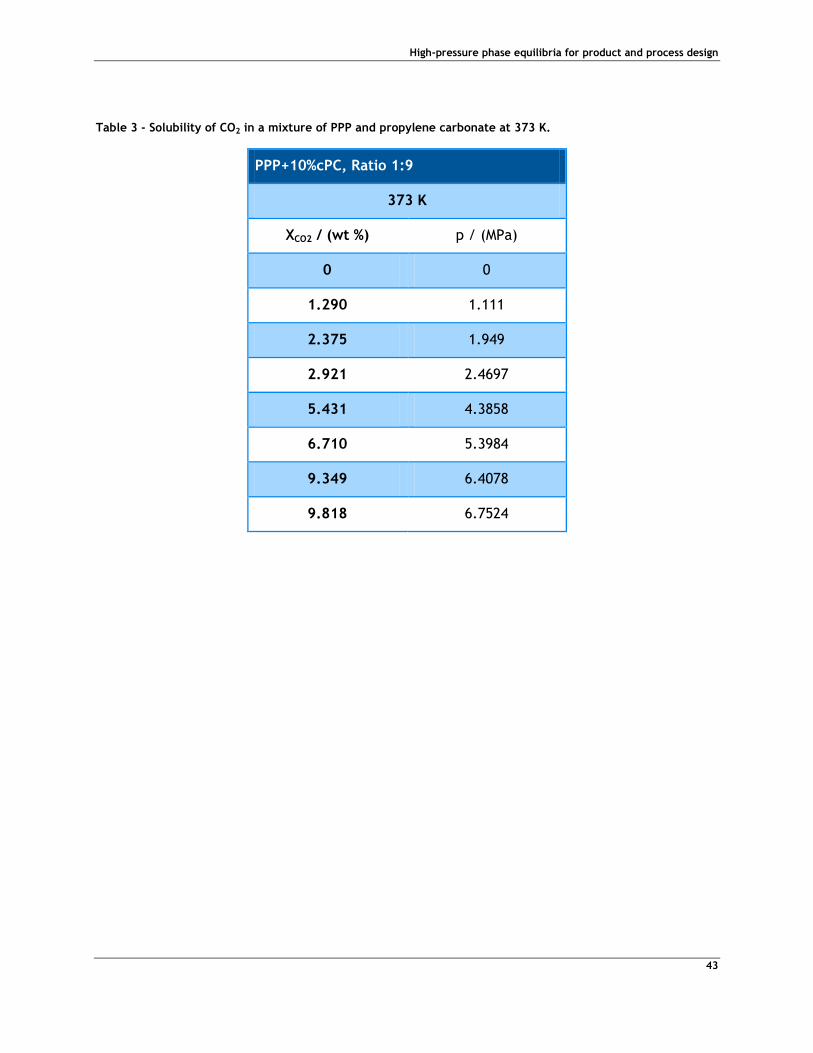
Table 3 - Solubility of CO2 in a mixture of PPP and propylene carbonate at 373 K.
PPP+10%cPC, Ratio 1:9
373 K
XCO2 / (wt %) p / (MPa)
0 0
1.290 1.111
2.375 1.949
2.921 2.4697
5.431 4.3858
6.710 5.3984
9.349 6.4078
9.818 6.7524
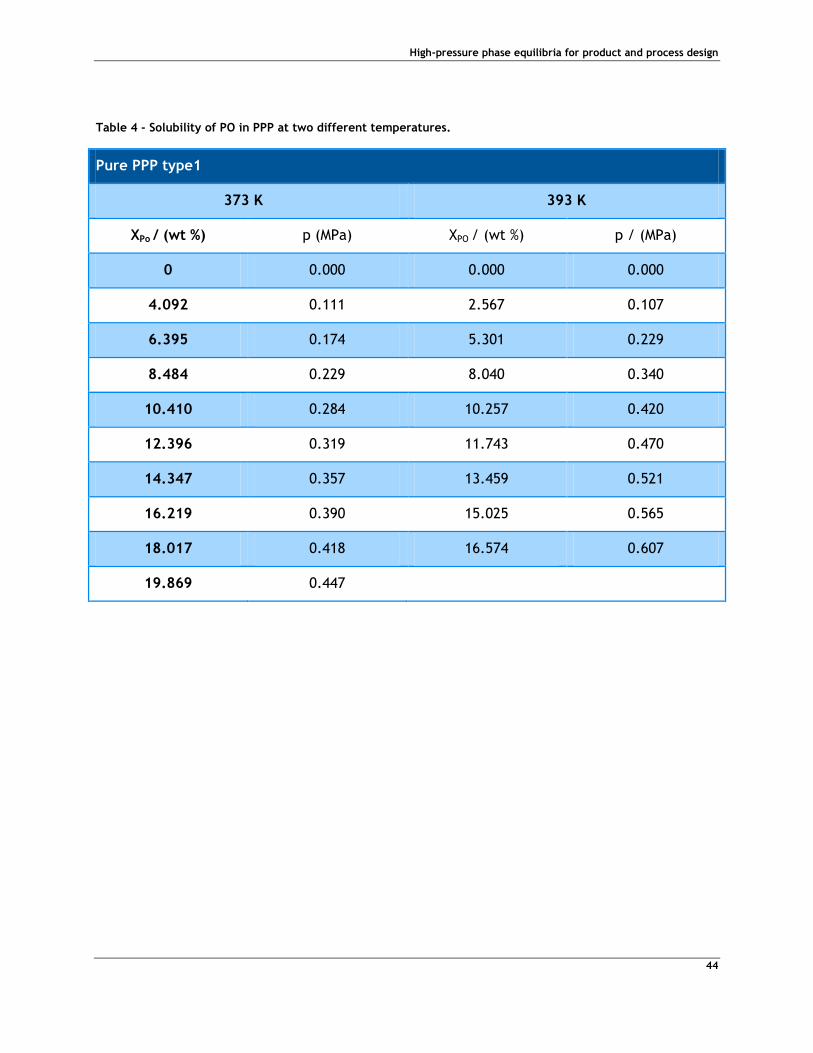
High-pressure phase equilibria for product and process design
44
Table 4 - Solubility of PO in PPP at two different temperatures.
Pure PPP type1
373 K 393 K
XPo / (wt %) p (MPa) XPO / (wt %) p / (MPa)
0 0.000 0.000 0.000
4.092 0.111 2.567 0.107
6.395 0.174 5.301 0.229
8.484 0.229 8.040 0.340
10.410 0.284 10.257 0.420
12.396 0.319 11.743 0.470
14.347 0.357 13.459 0.521
16.219 0.390 15.025 0.565
18.017 0.418 16.574 0.607
19.869 0.447
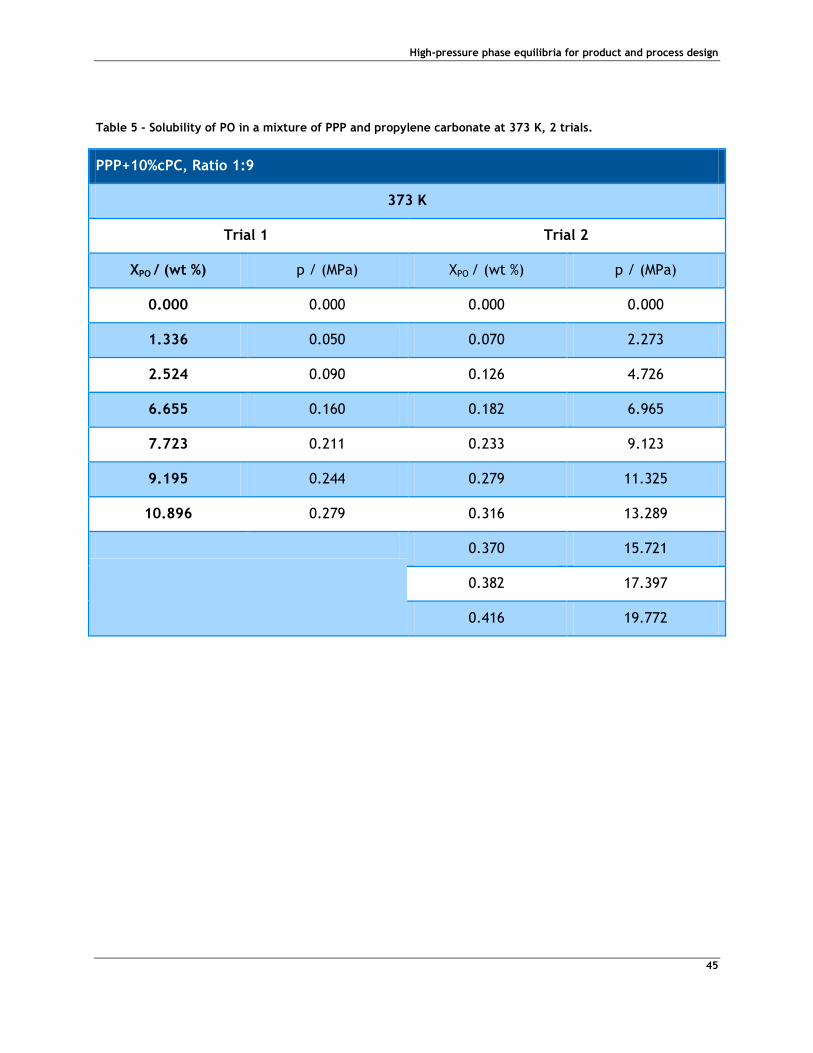
High-pressure phase equilibria for product and process design
45
Table 5 - Solubility of PO in a mixture of PPP and propylene carbonate at 373 K, 2 trials.
PPP+10%cPC, Ratio 1:9
373 K
Trial 1 Trial 2
XPO / (wt %) p / (MPa) XPO / (wt %) p / (MPa)
0.000 0.000 0.000 0.000
1.336 0.050 0.070 2.273
2.524 0.090 0.126 4.726
6.655 0.160 0.182 6.965
7.723 0.211 0.233 9.123
9.195 0.244 0.279 11.325
10.896 0.279 0.316 13.289
0.370 15.721
0.382 17.397
0.416 19.772
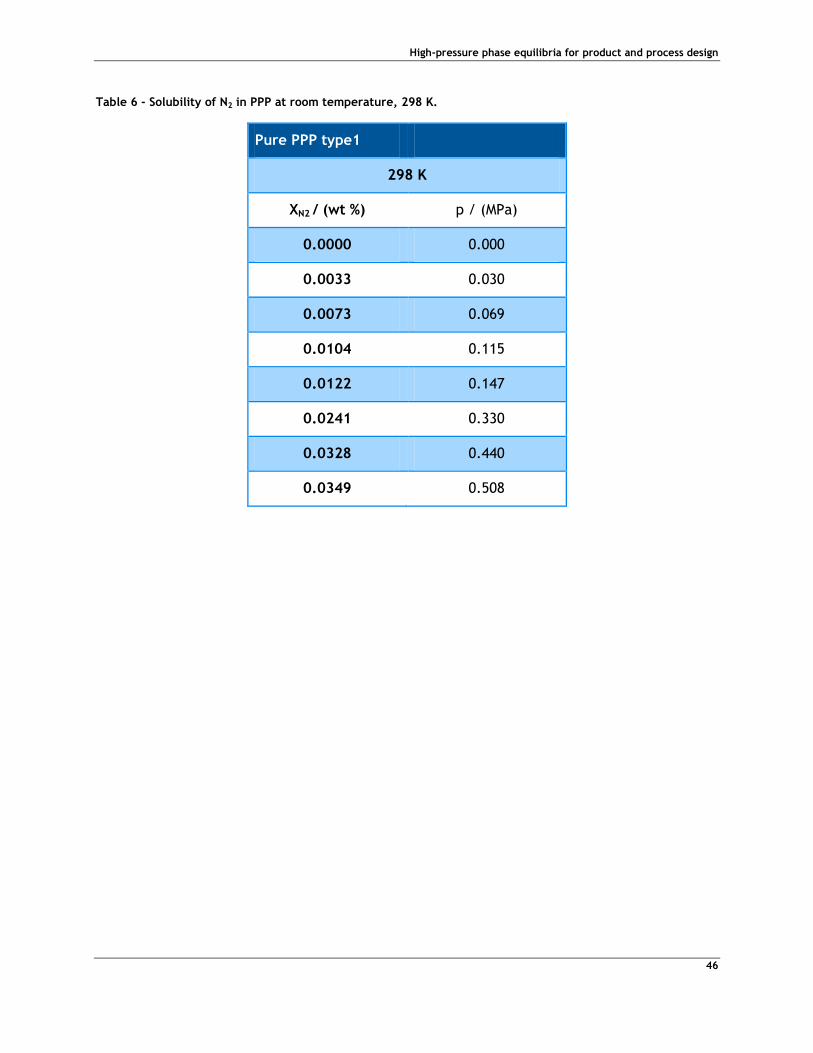
High-pressure phase equilibria for product and process design
46
Table 6 - Solubility of N2 in PPP at room temperature, 298 K.
Pure PPP type1
298 K
XN2 / (wt %) p / (MPa)
0.0000 0.000
0.0033 0.030
0.0073 0.069
0.0104 0.115
0.0122 0.147
0.0241 0.330
0.0328 0.440
0.0349 0.508