mert thesis final - middle east technical...
TRANSCRIPT

.
PROBABILISTIC SEISMIC HAZARD ASSESSMENT OF ILGAZ - ABANT SEGMENTS OF NORTH ANATOLIAN FAULT USING IMPROVED SEISMIC SOURCE MODELS
A THESIS SUBMITTED TO THE GRADUATE SCHOOL OF NATURAL AND APPLIED SCIENCES
OF MIDDLE EAST TECHNICAL UNIVERSITY
BY
MERT LEVENDOĞLU
IN PARTIAL FULFILLMENT OF THE REQUIREMENTS FOR
THE DEGREE OF THE MASTER OF SCIENCE IN
CIVIL ENGINEERING
JANUARY 2013

.

.
Approval of the thesis:
PROBABILISTIC SEISMIC HAZARD ASSESMENT OF ILGAZ – ABANT SEGMENTS OF NORTH ANATOLIAN FAULT USING IMPROVED SEISMIC SOURCE MODELS
submitted by MERT LEVENDOĞLU in partial fulfillment of the requirements for the degree of Master of Science in Civil Engineering Department, Middle East Technical University by, Prof. Dr. Canan Özgen Dean, Graduate School of Natural and Applied Science
_____________
Prof. Dr. Ahmet Cevdet Yalçıner Head of Department, Civil Engineering
_____________
Asst. Prof. Dr. Zeynep Gülerce Supervisor, Civil Engineering Dept., METU
_____________
Examining Committee Members:
Prof. Dr. M. Yener Özkan Civil Engineering Dept., METU
_____________
Assoc. Prof. Dr. Zeynep Gülerce Civil Engineering Dept., METU
_____________
Prof. Dr. Kemal Önder Çetin Civil Engineering Dept., METU
_____________
Assoc. Prof. Dr.Aysegül Askan Gündoğan Civil Engineering Dept., METU
_____________
Dr. Fuat Şaroğlu Kayen Kayı Energy Investments Inc.
_____________
Date:
28.01.2013

iv
I hereby declare that all information in this document has been obtained and presented in accordance with academic rules and ethical conduct. I also declare that, as required by these rules and conduct, I have fully cited and referenced all material and results that are not original to this work.
Name, Last name : Mert Levendoğlu Signature :

v
ABSTRACT
PROBABILISTIC SEISMIC HAZARD ASSESSMENT OF ILGAZ - ABANT SEGMENTS OF NORTH ANATOLIAN FAULT USING IMPROVED SEISMIC SOURCE MODELS
Levendoğlu, Mert M.Sc., Department of Civil Engineering
Supervisor: Asst. Prof. Dr. Zeynep Gülerce
January 2013, 85 pages
Bolu-Ilgaz region was damaged by several large earthquakes in the last century and the structural damage was substantial especially after the 1944 and 1999 earthquakes. The objective of this study is to build the seismic source characterization model for the rupture zone of 1944 Bolu-Gerede earthquake and perform probabilistic seismic hazard assessment (PSHA) in the region. One of the major improvements over the previous PSHA practices accomplished in this study is the development of advanced seismic source models in terms of source geometry and reoccurrence relations. Geometry of the linear fault segments are determined and incorporated with the help of available fault maps. Composite magnitude distribution model is used to properly represent the characteristic behavior of NAF without an additional background zone. Fault segments, rupture sources, rupture scenarios and fault rupture models are determined using the WG-2003 terminology. The Turkey-Adjusted NGA-W1 (Gülerce et al., 2013) prediction models are employed for the first time on NAF system. The results of the study is presented in terms of hazard curves, deaggregation of the hazard and uniform hazard spectrum for four main locations in the region to provide basis for evaluation of the seismic design of special structures in the area. Hazard maps of the region for rock site conditions and for the proposed site characterization model are provided to allow the user perform site-specific hazard assessment for local site conditions and develop site-specific design spectrum. The results of the study will be useful to manage the future seismic hazard in the region.
Keywords: Probabilistic Seismic Hazard Assessment, Seismic Source Modeling, Ground Motion Prediction Equations, North Anatolian Fault, 1944 Bolu-Gerede Earthquake

vi
ÖZ
GELİŞTİRİLMİŞ SİSMİK KAYNAK MODELLERİ OLUŞTURULARAK KUZEY ANADOLU FAY HATTI BOLU-ILGAZ BÖLÜMUNUN OLASILIKSAL SİSMİK TEHLİKE ANALİZİ
Levendoğlu, Mert Yüksek Lisans, İnşaat Mühendisliği Bölümü
Tez Yöneticisi: Yrd. Doç. Dr. Zeynep Gülerce
Ocak 2013, 85 sayfa
Bolu-Ilgaz Bölgesi geçen yüzyıl boyunca çok sayıda büyük depremler ile sarsılmıştır, özellikle 1944 Bolu-Gerede ve 1999 Düzce depremlerinden sonra gözlenen yapısal hasar oldukça büyüktür. Bu çalışmanın amacı, 1944 Bolu-Gerede depreminin kırılma bölgesi için sismik kaynak karakteristiği modelinin oluşturması ve bölgede olasılıksal sismik tehlike analizinin (OSTA) yapılmasıdır. Bu çalışmanın bölgede daha önce yapılmış OSTA çalışmalarına göre en önemli üstünlüğü, geliştirilmiş çizgisel kaynak geometrisi ve tekrarlanma ilişkisi modellerinin ve Türkiye’ye uyarlanmış kuvvetli yer hareketi tahmin denklemlerinin kullanılmasıdır. Çalışma kapsamında düzlemsel fay segmentlerinin geometrisi belirlenmiş ve varolan fay haritaları yardımıyla Coğrafi Bilgi Sistemi’ne aktarılmıştır. Kompozit deprem büyüklüğü dağılımı modeli, ek bir arkaplan sismik kaynağı olmaksızın, Kuzey Anadolu Fay (KAF) Hattı’nın karakteristik davranışını yansıtmaya olanak tanımıştır. Fay segmentleri, kırılma kaynakları, kırılma senaryoları ve fay kırılma modeli USGS Çalışma Grubu-2003 terminolojisi kullanılarak belirlenmiştir. Türkiye’ye uyarlanmış yeni nesil (NGA-W1) (Gülerce ve diğerleri, 2013) kuvvetli yer hareketi tahmin denklemleri ilk olarak bu çalışma kapsamında KAF sisteminde kullanılmıştır. Bölgedeki özel yapıların depreme dayanıklı tasarımı ve değerlendirilmesi için temel oluşturmak amacıyla dört ana nokta için OSTA eğrileri ve tasarım spekturumları verilmiştir. Kullanıcının yerel bölge koşullarında sismik tehlike değerlendirmesi yapabilmesi ve bölgeye özgü tasarım spektrumu geliştirebilmesi için yerel kaya sınıflandırması modeli önerilmiş ve yerel zemin koşullarını içeren sismik tehlike haritaları yapılmıştır. Bu çalışma sonuçlarının bölgedeki gelecek sismik hazardinin değerlendirilmesi ve yönetilebilmesi için yararlı olacağı düşünülmektedir.
Anahtar Kelimeler: Olasılıksal Sismik Tehlike Analizi, Sismik Kaynak Modeli, Kuvvetli Yer Hareketi Tahmin Denklemleri, Kuzey Anadolu Fay (KAF) Hattı, 1944 Bolu-Gerede Depremi

vii
To My Beloved Family

viii
ACKNOWLEDGEMENTS
I would like to thank my advisor Asst. Prof. Dr. Zeynep Gülerce for her guidance, support and understanding of working in private sector throughout the preparation of this thesis. I would also like to thank Dr. Norman Abrahamson, for his invaluable guidance in providing the hazard code.
I am very grateful to our geologist consultant Dr. Fuat Şaroğlu, especially for preparation of the chapter-2, source model used in this study and the motivation throughout the preparation this study.
I thank to Prof. Dr. Kemal Önder Çetin who educated me about geotechnical science in my undergraduate and graduate education.
I am very grateful to my colleagues Cemre Harzem Yardım and Soner Ocak for their priceless help about taking the courses together and the preparation of this study. I would also thank to Burcu Çamtekne, Altuğ Şahin and Emre Değirmenci for their support at even the most desperate times during the preparation of this thesis.
Special thanks to my ex-general manager Dr. A. Nihat Dilek, for his understanding and tolerance throughout taking the graduate courses. Also, special thanks to my bosses Rıfat Göksu and Ahmet Oktay Kavas for their understanding throughout the preparation of this thesis.
I thank to unknown robber, who steal my laptop and hard disc including my thesis from my car during the preparation of this thesis. If this never happened, I would never finish this study.
At last but truly the first, sincere thanks to my beloved family Mine Engineer R. Engin Levendoğlu and Civil Engineer Sibel Levendoğlu who grow me up until now and who do not avoid their help, support, guidance, understanding and protection at any time during my life.
ix
TABLE OF CONTENTS
ABSTRACT ............................................................................................................................... v
ÖZ ............................................................................................................................................ vi
ACKNOWLEDGEMENTS ...................................................................................................... viii
TABLE OF CONTENTS ...........................................................................................................ix LIST OF TABLES ..................................................................................................................... x
LIST OF FIGURES ................................................................................................................. .xi CHAPTERS
1. INTRODUCTION ................................................................................................................ 15
1.1 Research Statement and Problem Significance ....................................................... 16 1.2 Scope of the Work ..................................................................................................... 17
2. GENERAL GEOLOGY, GEOMORPHOLOGY AND TECTONIC SETTINGS OF NAF BOLU- ILGAZ SEGMENT ...................................................................................................... 18
2.1 General Geology and Tectonic Settings of NAF Bolu-Ilgaz Segment ...................... 18 2.1.1 Ilgaz – Ismetpaşa Segment .............................................................................. 19 2.1.2 Ismetpaşa – Yeniçağa Segment ...................................................................... 19 2.1.3 Yeniçağa – Abant Segment .............................................................................. 23
2.2 Seismo-tectonics of NAF Bolu-Ilgaz Segment .......................................................... 24 2.3 General Geomorphologic Features of the NAF Bolu-Ilgaz Segment ........................ 26 2.4 Discussion and Conclusion ....................................................................................... 27
2.4.1 Rock Classification ........................................................................................... 28 3. SEISMIC SOURCE CHARACTERIZATION OF ILGAZ-ISMETPAŞA SEGMENTS (1944 RUPTURE) OF NORTH ANATOLIAN FAULT ............................................................ 30
3.1 Source Geometry of 1944 Bolu Earthquake Rupture Zone ...................................... 30 3.2 Source-Epicenter Matching and Magnitude Distribution Models .............................. 36 3.3 Fault Rupture Model .................................................................................................. 40 3.4 Activity Rates and Recurrence Relations .................................................................. 42
4. PROBABILISTIC SEISMIC HAZARD ASSESSMENT METHODOLOGY AND RESULTS ..............................................................................................................................45
4.1 Probabilistic Seismic Hazard Assessment Methodology .......................................... 45 4.2 PSHA Results for Example Sites in the Study Area ................................................. 48 4.3 Uniform Hazard Spectrum and TEC 2007 Comparison ............................................ 61 4.4 Hazard Maps for Study Area ..................................................................................... 64
5. SUMARY AND CONCLUSION .......................................................................................... 75
REFERENCES ....................................................................................................................... 81

x
LIST OF TABLES
TABLES
Table 3.1 Segment Geometry of 1944 Bolu-Gerede earthquake proposed by Kondo et al. (2005) ............................................................................................ 31
Table 3.2 Segment geometry, assigned slip rate and characteristic magnitude for each segment .................................................................................................................................. 33
Table 3.3 The reference studies of the calculation of Ismetpaşa Creep Rate ....................... 35
Table 3.4 Distribution of magnitudes of the earthquakes within the catalog in the study area ........................................................................................ 38
Table 3.5 Maximum likelihood estimation of the recurrence parameter b ............................. 39
Table 3.6 Seismic Sources and Rupture Scenarios considered for study area .................... 42
Table 4.1 Acceptable hazard levels in TEC-2007 and other design codes ........................... 48
Table 4.2 PGA for different exceedance levels at four locations at rock site conditions ....... 56
Table 4.3 PGA for different exceedance levels at four locations at soil site conditions......... 56

xi
LIST OF FIGURES
FIGURES
Figure 1.1 1939-199 earthquake sequence on North Anatolian Fault (Şaroğlu, 2010) ......... 15
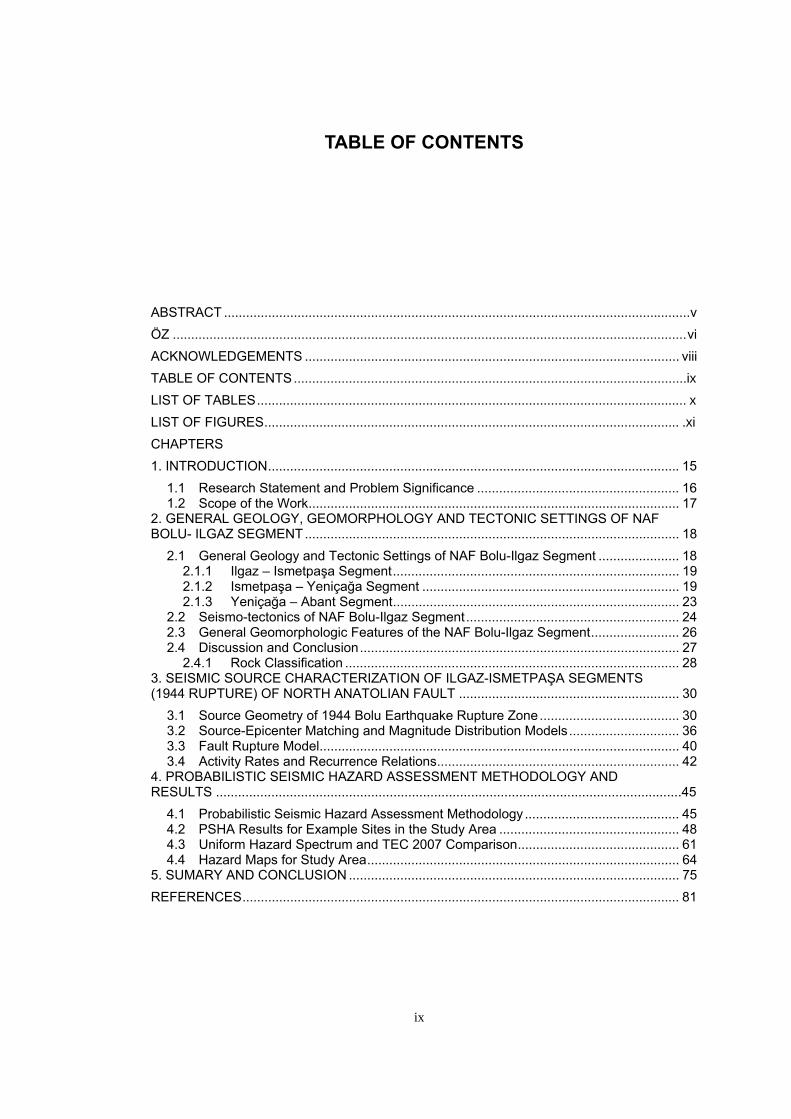
Figure 2.1 Rupture zones of 1939 to 1967 earthquakes along NAF (after Barka 1996) ....... 19
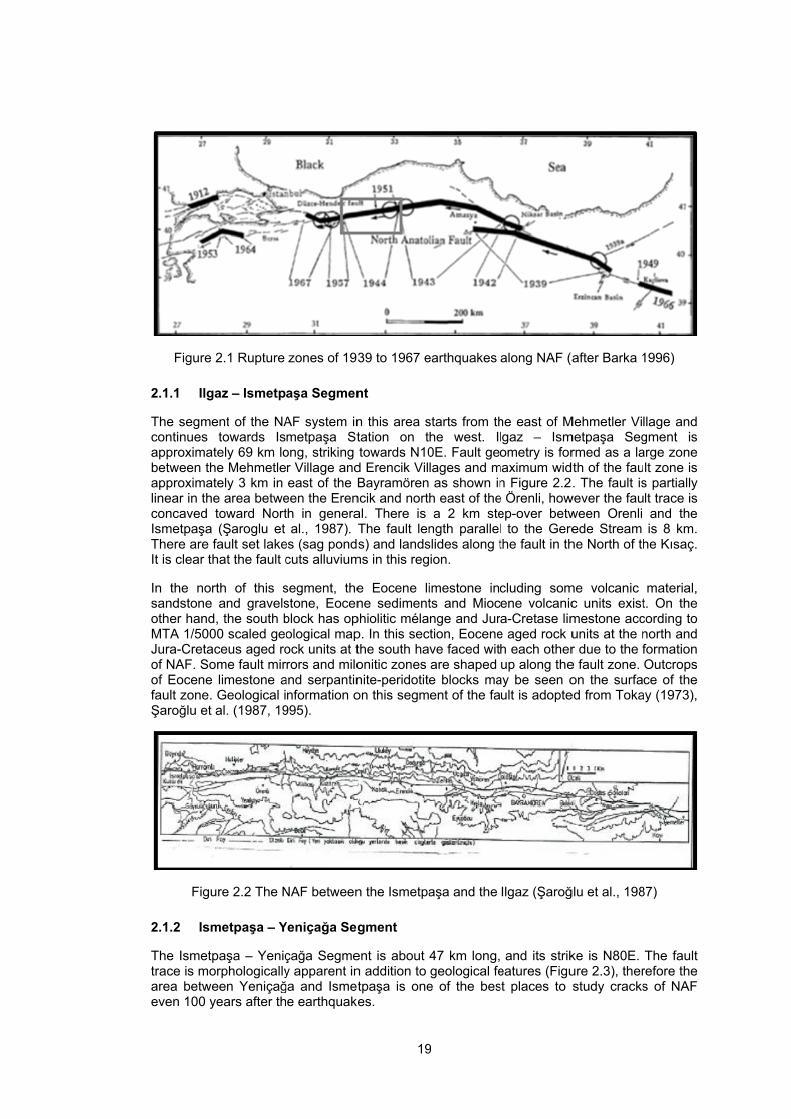
Figure 2.2 The NAF between the Ismetpaşa and the Ilgaz (Şaroğlu et al., 1987) ................. 19
Figure 2.3 NAF segment between the Yeniçağa and the Ismetpaşa (Şaroğlu et al., 1987) . 20
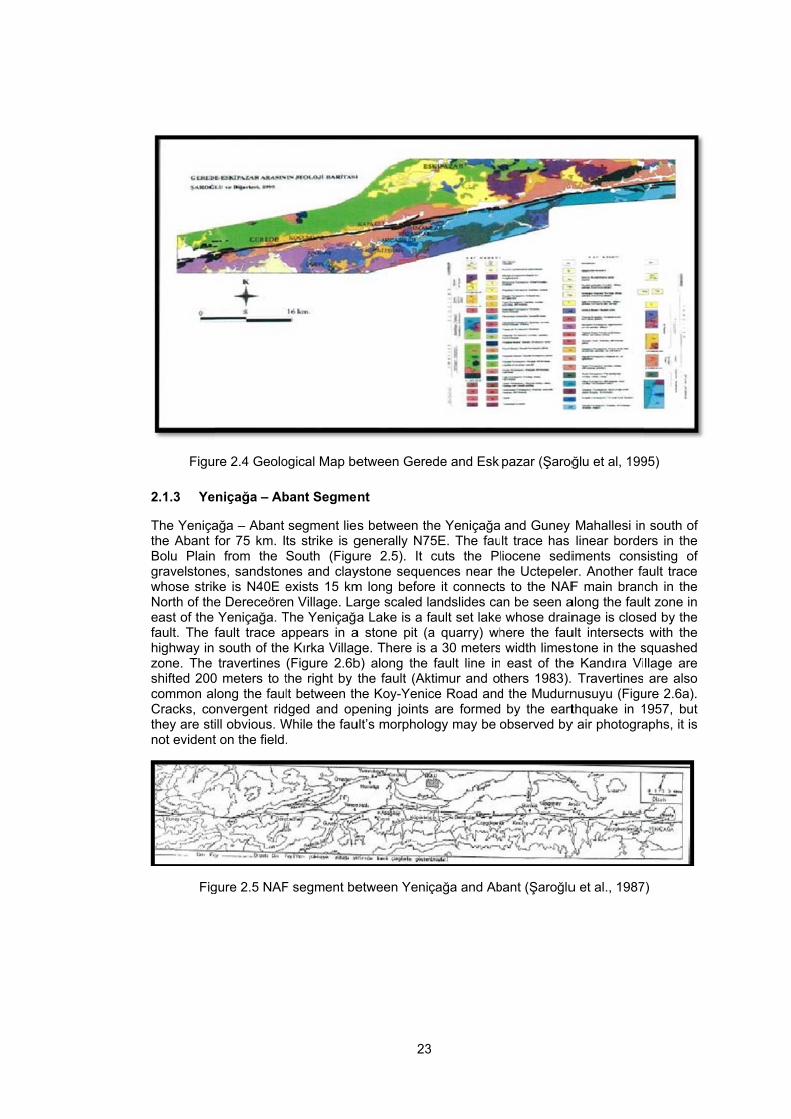
Figure 2.4 Geological Map between Gerede and Eskipazar (Şaroğlu et al, 1995) ............... 23
Figure 2.5 NAF segment between Yeniçağa and Abant (Şaroğlu et al., 1987) ..................... 23
Figure 2.6 General features of the NAF Segment between Gerede and Ismetpaşa (Photos taken from Şaroğlu, TPAO Seminar, 2010) .............................................................. 24
Figure 2.7 The geomorphologic shapes which was formed by the NAF at east of the Gerede (Şaroğlu, 2010) ................................................................................... 25
Figure 2.8 Geological map and total offsets in study area (Şaroğlu, 2010) ........................... 28
Figure 2.9 Rock classification map of the study area ............................................................ 29
Figure 3.1 Fault segmentation of 1944 Bolu-Gerede Earthquake Rupture (After Kondo et al., 2005) ....................................................................................................... 31
Figure 3.2 Rupture trace of 1944 Bolu-Gerede earthquake and various right-lateral offsets measured on it (After Koçyiğit and Ayhan, 2009) ................ 32
Figure 3.3 The general layout of the fault segments and the slip rates assigned to each source ..................................................................................................................................... 33
Figure 3.4 Slip rate vectors along NAFZ by Tatar et al (2011) .............................................. 34
Figure 3.5 Slip Distribution along the rupture zone of the 1944 Bolu-Gerede earthquake (After Barka, 1996) ................................................................................................................. 35
Figure 3.6 Measurements for Ismetpaşa creep rate given in Table 3.3. ............................... 35
Figure 3.7 Magnitude distribution functions used in PSHA, truncated exponential, truncated normal (characteristic) and composite models (Y&C (1985) (After Ocak, 2011) .. 37
Figure 3.8 Spatial distribution of the earthquakes in the study area. ..................................... 38
Figure 3.9 Hazard Curves for Bolu City Centre for different b values ................................... 40
Figure 3.10 Illustration of the segment, source and scenario concepts ................................ 41
Figure 3.11 Comparison of rupture scenarios and weighted average scenario including Weichert (1980) error bars ..................................................................................................... 43
Figure 3.12 The sensitivity analysis results for selected weighted average ratio combinations (Bolu City Centre, T=1.0 sec) ................. 44
Figure 4.1 The hazard curves for PGA developed using TR Adjusted NGA-W1 models individually for Bolu City Centre with rock site conditions. ..................................................... 47
Figure 4.2 Comparison of the results of TR Adjusted NGA-W1 and NGA models hazard curves for PGA for Bolu City Centre ...................................................................................... 47

xii
Figure 4.3 The four locations where the analysis are performed........................................... 49
Figure 4.4 Hazard Curves for T = 0 second, (Vs30 = 760 m/s) ............................................... 49
Figure 4.5 Hazard Curves for T = 0 second, (Vs30 = 270 m/s) ............................................. 50
Figure 4.6 Hazard Curves for T = 0.05 second, (Vs30 = 760 m/s) .......................................... 50
Figure 4.7 Hazard Curves for T = 0.05 second, (Vs30 = 270 m/s) .......................................... 50
Figure 4.8 Hazard Curves for T = 0.10 second, (Vs30 = 760 m/s) .......................................... 51
Figure 4.9 Hazard Curves for T = 0.10 second, (Vs30 = 270 m/s) .......................................... 51
Figure 4.10 Hazard Curves for T = 0.50 second, (Vs30 = 760 m/s) ........................................ 51
Figure 4.11 Hazard Curves for T = 0.50 second, (Vs30 = 270 m/s) ........................................ 52
Figure 4.12 Hazard Curves for T = 1.00 second, (Vs30 = 760 m/s) ...................................... 52
Figure 4.13 Hazard Curves for T = 1.00 second, (Vs30 = 270 m/s) ...................................... 52
Figure 4.14 Hazard Curves for T = 3.00 second, (Vs30 = 760 m/s) ...................................... 53
Figure 4.15 Hazard Curves for T = 3.00 second, (Vs30 = 270 m/s) ...................................... 53
Figure 4.16 Hazard Curves for T = 5.00 second, (Vs30 = 760 m/s) ...................................... 53
Figure 4.17 Hazard Curves for T = 5.00 second, (Vs30 = 270 m/s) ...................................... 54
Figure 4.18 Hazard Curves for T = 7.5 second, (Vs30 = 760 m/s) ........................................ 54
Figure 4.19 Hazard Curves for T = 7.5 second, (Vs30 = 270 m/s) ........................................ 54
Figure 4.20 Hazard Curves for T = 10.0 second, (Vs30 = 760 m/s) ...................................... 55
Figure 4.21 Hazard Curves for T = 10.0 second, (Vs30 = 270 m/s) ...................................... 55
Figure 4.22 Deaggregation for Bolu City Centre for 2% probability of exceedance in 50 years hazard level (Vs30 = 760 m/sec, PGA) ......... 56
Figure 4.23 Deaggregation for Bolu City Centre for 10% probability of exceedance in 50 years hazard level (Vs30 = 760 m/sec, PGA) ....... 57
Figure 4.24 Deaggregation for Bolu City Centre for 50% probability of exceedance in 50 years hazard level (Vs30 = 760 m/sec, PGA) ....... 57
Figure 4.25 Deaggregation for Bolu Mountain Tunnel for 2% probability of exceedance in 50 years hazard level (Vs30 = 760 m/sec, PGA) ......... 57
Figure 4.26 Deaggregation for Bolu Mountain Tunnel for 10% probability of exceedance in 50 years hazard level (Vs30 = 760 m/sec, PGA) ....... 58
Figure 4.27 Deaggregation for Bolu Mountain Tunnel for 50% probability of exceedance in 50 years hazard level (Vs30 = 760 m/sec, PGA) ....... 58
Figure 4.28 Deaggregation for Hasanlar Dam for 2% probability of exceedance in 50 years hazard level (Vs30 = 760 m/sec, PGA) ......... 58
Figure 4.29 Deaggregation for Hasanlar Dam for 10% probability of exceedance in 50 years hazard level (Vs30 = 760 m/sec, PGA) ....... 59
Figure 4.30 Deaggregation for Hasanlar Dam for 50% probability of exceedance in 50 years hazard level (Vs30 = 760 m/sec, PGA) ....... 59
Figure 4.31 Deaggregation for Sarıyar Dam for 2% probability of exceedance in 50 years hazard level (Vs30 = 760 m/sec, PGA) ......... 59
Figure 4.32 Deaggregation for Sarıyar Dam for 10% probability of exceedance in 50 years hazard level (Vs30 = 760 m/sec, PGA) ....... 60

xiii
Figure 4.33 Deaggregation for Sarıyar Dam for 50% probability of exceedance in 50 years hazard level (Vs30 = 760 m/sec, PGA) ....... 60
Figure 4.34 Uniform Hazard Spectra for 4 critical location, 2% probability of exceedance hazard level, Vs30 = 760 m/sec ............................................ 62
Figure 4.35 Uniform Hazard Spectra for 4 critical location, 10% probability of exceedance hazard level, Vs30 = 760 m/sec .......................................... 62
Figure 4.36 Uniform Hazard Spectra for 4 critical location, 50% probability of exceedance hazard level, Vs30 = 760 m/sec .......................................... 62
Figure 4.37 Uniform Hazard Spectra for 4 critical location, 2% probability of exceedance hazard level, Vs30 = 270 m/sec ............................................ 63
Figure 4.38 Uniform Hazard Spectra for 4 critical location, 10% probability of exceedance hazard level, Vs30 = 270 m/sec .......................................... 63
Figure 4.39 Uniform Hazard Spectra for 4 critical location, 50% probability of exceedance hazard level, Vs30 = 270 m/sec .......................................... 63
Figure 4.40 Grids and sources assigned to region ................................................................ 64
Figure 4.41 Hazard Map for PGA and Vs30 = 760 m/sec at 2% probability of exceedence hazard level........................................................................64
Figure 4.42 Hazard Map for PGA and Vs30 = 270 m/sec at 2% probability of exceedence hazard level........................................................................64
Figure 4.43 Hazard Map for PGA and Vs30 = 760 m/sec at 10% probability of exceedence hazard level......................................................................65
Figure 4.44 Hazard Map for PGA and Vs30 = 270 m/sec at 10% probability of exceedence hazard level......................................................................65
Figure 4.45 Hazard Map for PGA and Vs30 = 760 m/sec at 50% probability of exceedence hazard level......................................................................66
Figure 4.46 Hazard Map for PGA and Vs30 = 270 m/sec at 50% probability of exceedence hazard level......................................................................66
Figure 4.47 Hazard Map for T = 0.2 second Vs30 = 760 m/sec at 2% probability of exceedence hazard level........................................................................67
Figure 4.48 Hazard Map for T = 0.2 second Vs30 = 270 m/sec at 2% probability of exceedence hazard level........................................................................67
Figure 4.49 Hazard Map for T = 0.2 second Vs30 = 760 m/sec at 10% probability of exceedence hazard level......................................................................68
Figure 4.50 Hazard Map for T = 0.2 second Vs30 = 270 m/sec at 10% probability of exceedence hazard level......................................................................68
Figure 4.51 Hazard Map for T = 0.2 second Vs30 = 760 m/sec at 50% probability of exceedence hazard level......................................................................69
Figure 4.52 Hazard Map for T = 0.2 second Vs30 = 270 m/sec at 50% probability of exceedence hazard level......................................................................69
Figure 4.53 Hazard Map for T = 1.0 second Vs30 = 760 m/sec at 2% probability of exceedence hazard level........................................................................70
Figure 4.54 Hazard Map for T = 1.0 second Vs30 = 270 m/sec at 2% probability of exceedence hazard level........................................................................70
Figure 4.55 Hazard Map for T = 1.0 second Vs30 = 760 m/sec at 10% probability of exceedence hazard level......................................................................71

xiv
Figure 4.56 Hazard Map for T = 1.0 second Vs30 = 270 m/sec at 10% probability of exceedence hazard level......................................................................71
Figure 4.57 Hazard Map for T = 1.0 second Vs30 = 760 m/sec at 50% probability of exceedence hazard level......................................................................72
Figure 4.58 Hazard Map for T = 1.0 second Vs30 = 270 m/sec at 50% probability of exceedence hazard level......................................................................72
Figure 5.1 Site specific hazard map for PGA at 2% probability of exceedance hazard level........................................................................75
Figure 5.2 Site specific hazard map for PGA at 10% probability of exceedance hazard level......................................................................76
Figure 5.3 Site specific hazard map for PGA at 50% probability of exceedance hazard leve.......................................................................79

Earthquaketectonic strearthquakeis in one oalong the mhuge and don-going alarge and dapproximatEarthquakewhere NAF
Figure
Accurate enumber of Previously,hazard asprobabilistiassessmenlocation ancharacteriscomplete a
The publishbefore the hazard for al. 2004; characterizseismic hawere mode2004; Crowdefining lin
es are natuructures aroues while somf the most amajor fault sydestructive eaccumulatingdestructive etely 900 kiloes in 1999 ruF system is d
1.1 1939-19
evaluation off special pro, determinist
ssessment hc in these nt (PSHA) and rate of rstics explicitlyand reliable b
hed PSHA s1999 event
Marmara ReCrowley and
zation was bazard assesseled with truwley and Boear fault seg
I
ral events wund the glob
me of them arctive tectoniystems of Tu
earthquakes strain are aarthquakes iometers of uptured a totadivided into a
99 earthqua
f the seismioject (i.e. nutic seismic hhowever the
days. Krampproach allorecurrence oy in the evaby means of a
studies for Tuts. Several region and fod Bommer based on easment studiencated expo
ommer 2006;gments with
15
CHAPT
NTRODU
with randombe, some core seismicallyc regions of urkey, especin the past aa certainty. n the last cea uniform al fault spray
a number of b
ke sequence
ic hazard inuclear powehazard assese common mer (1996)ows the expeof earthquakluation of seassessing th
urkey were lresearchers
or Istanbul af2006; Kalkaarthquake cs and the monential (GR; Kalkan et athe assump
5
TER 1
UCTION
m characterisuntries are ay quiet. Locaf the world. Acially the Noand future larNAF system
entury; eventseastern tracy of approximbranches as
e on North A
n Turkey is er plants, higssment was method in explained therts to consikes and in eismic hazarhe seismic ha
limited (Erdikpublished e
fter these evan et al. 20
catalogue damagnitude disR) relationshial. 2009), setion that the
stics. Due taffected by l
ation of nationAccumulationrth Anatolianrge earthqua
m ruptured ps between 19ce whereas mately 200 kishown in Fig
natolian Fau
essential begh rise build
the commoseismic haz
hat probabilder the uncethe variatio
ds. Thus, PSazard.
k et al. 1985estimates of ents (Atakan009). The mata using arstributions ofp. In recent
eismic sourcseismic ene
to the distrilarge and denal borders on of the strain Fault (NAFakes to dischprogressively 939-1967 haKocaeli an
ilometers ongure 1.1.
ult (Şaroğlu, 2
ecause of indings, viaduon method inazard assesslistic seismicertainties in
on of groundSHA studies
5; Gülkan et f seismic han et al. 2002main seismireal sourcesf these areat studies (Erces were moergy along th
bution of estructive of Turkey in energy
F) caused harge this
by eight ad broken d Düzce the west
2010)
ncreasing cts, etc.)
n seismic sment is c hazard the size,
d motion s become
al. 1993) zard and ; Erdik et c source in early l sources rdik et al. odeled by hese fault

16
segments was released by characteristic events. The magnitude distribution functions of linear sources were considered to be fully characteristic. In addition, a background source representing the small-to-moderate magnitude earthquakes were added to the source model and the earthquake reoccurrence of the background source was modeled using truncated exponential magnitude distribution model. Due to the lack of local predictive models, early-stage global ground motion prediction equations (GMPEs) such as Boore et al. (1997), Campbell (1997), and Sadigh et al. (1997) were used in earlier studies to represent the ground motion variability. A only the recent study by Kalkan et al. (2009) used NGA-W1 ground motion prediction models along with a regional GMPE developed for Turkey after the 1999 events by Kalkan and Gülkan (2004).
The main components of PSHA methodology and framework for PSHA are rapidly improving by increase in the number of studies about seismic source and ground motion characterization for special structures and awareness of earthquake hazard reduction. The primary objective of this study is to evaluate the seismic hazard around the 1944 Bolu-Gerede Earthquake Rupture Zone using improved seismic source models and regionalized global ground motion prediction equations within a probabilistic framework. Once published, this study will be one of the foremost probabilistic seismic hazard analysis studies performed on the rupture zones of 1939-1944 earthquake sequence on NAF system.
1.1 Research Statement and Problem Significance
Bolu is one of the industrialized cities of Turkey, located on the second degree earthquake zone according to the earthquake zonation map of Turkish Earthquake Code (2007). Being in the cross section of Düzce, Bolu-Gerede and Mudurnu-Abant segments of NAF, the city was damaged by several large earthquakes in the last century, however the structural damage in the city and its surroundings were substantial especially after the 1944 Bolu-Gerede Earthquake (Mw = 7.2) and 1999 Düzce Earthquake (Mw = 7.1). Therefore, to reduce the damage in the structures and loss of lives in future earthquakes beside a sensible and economical design practice, accurate evaluation of seismic hazard for this region is vital. When compared to the Marmara Region and İstanbul Metropolitan Area on the west, the number of PSHA studies in the Bolu-Gerede Region is quite limited, only available PSHA study covering the region was performed decades ago by Erdik et al. (1985).
One of the major improvements over the previous seismic hazard assessment practice accomplished in this study; is the development of advanced seismic source models in terms of source geometry and reoccurrence relations. Linear fault segments are defined for 1944 earthquake rupture zone, geometry of the sub-segments (length, width, and segmentation points) are determined and incorporated with the help of updated active fault maps of General Directorate of Mineral Research and Exploration (2012).In this study, to represent the characteristic behavior of NAF, composite magnitude distribution model by Youngs and Coppersmith (1985) is used for all seismic sources without an additional background zone. Fault segments, rupture sources, rupture scenarios and fault rupture models are determined using the WG-2003 terminology and multi-segment rupture scenarios are considered. Events in the earthquake catalogue are attributed to the individual seismic sources and scenario weights are determined by balancing the accumulated seismic energy by the catalog (Statistical evaluation of Turkey earthquake catalog, Kalafat, 2010) seismicity.
Gülerce et al. (2013) proposed that next generation Attenuation (NGA-W1) models are new and improved in terms of additional prediction parameters (such as depth of the source, basin effects, magnitude dependent standard deviations, etc.), statistical approach, and a well constrained global database. The applicability of the NGA-W1 models developed for California (US) is a controversial topic for PSHA studies conducted in other tectonic environments. Said study modified and used the recently developed Turkish Strong Motion Database (TSMD, Akkar et al., 2010) to check the compatibility of the magnitude, distance, and site amplification scaling of NGA-W1 horizontal prediction models with the ground motions recorded in Turkey and adjusted necessary coefficients of these models to reflect

17
the regional characteristics for the PSHA applications in Turkey. Within the contents of this study, the Turkey-Adjusted NGA-W1 prediction models are employed for the first time on NAF system.
The results of the study is presented in terms of hazard curves, deaggregation of the hazard and uniform hazard spectrum for four main locations in the region (Bolu City Centre, Bolu Mountain Tunnel, Sarıyar Dam, and Hasanlar Dam) to provide basis for evaluation of the seismic design of special structures in the area. To perform site specific hazard assessment and to develop design spectrum for local site conditions, the site characterization model at the accepted hazard levels by TEC-2007 and the region’s hazard maps for rock and soil site conditions are provided. Moreover, the uniform hazard spectrum for selected locations compared with the results of TEC-2007 design spectrum.
1.2 Scope of the Work
Contents of the chapters of this study can be summarized to reveal the scope of this thesis as follows;
In Chapter 1, the research statement and the scope of the study is provided with an emphasis on the problem significance and limitations of the previous PSHA procedures in the region.
Chapter 2 briefly summarizes the geology of the study area and seismo-tectonic characteristics of the Ilgaz-Ismetpaşa Segment (1944 Rupture) of North Anatolian Fault System. Site characteristics model based on the 1/1,000,000 scaled geology map is also introduced in this section.
The seismic source characterization model developed for the PSHA analysis is provided in Chapter 3. Source geometry, segmentation points, slip rates and moment accumulation in each sub-segment, magnitude recurrence relations and activity rates are detailed within the content of this chapter.
Chapter 4 briefly introduces the PSHA framework and selection of the ground motion prediction models. Results of the study are presented in terms of hazard maps at selected hazard levels for general rock and soil site conditions. Site-specific design spectra for a few special locations in the region are also provided in this chapter.
Chapter 5 includes a brief summary of the study and discussion of the result. The site characterization map given in Chapter 2 and the hazard maps at selected hazard levels for rock and soil site conditions given in Chapter 4 are interconnected and site specific hazard maps for different hazard levels are also presented in this chapter.


18
CHAPTER 2
GENERAL GEOLOGY, GEOMORPHOLOGY AND TECTONIC SETTINGS OF NAF BOLU- ILGAZ SEGMENT
The objective of this chapter is to present the seismo-tectonic features of the Bolu- Ilgaz Segment of North Anatolian Fault (NAF) for building a solid background on the seismic source characterization. A brief summary of the geology and geomorphology of Bolu Region is also provided to implement a general site characterization model on top of the probabilistic seismic hazard assessment (PSHA) results for rock site conditions. Starting from early 1940s, many geological investigations were performed in Bolu-Gerede region (Blumenthal, 1948, Tokay, 1952, Pınar, 1953, Abdüsselamoğlu, 1959). Currently, the main sources for any PSHA study performed in Turkey are the general geology map articulated on a 1/500000 scale by the MTA General Directorate in 2002 and North Anatolian Fault Inventory published in 2003 (Herece and Akay, 2003). Within the contents of this chapter, studies by Tokay et al. (1973) and Şaroğlu et al. (1987, 1995) are utilized in addition to these sources for a detailed evaluation.
There are several rock units in Bolu-Gerede region, whose ages are different but they came together lastly in Eocene as a result of the close up of continents and oceans among them. Consequently, rock units in the area are separated into some packets such as the Istanbul Paleozoic, Pontites, the Sakarya Continent Sequence and Suture Zone, which are similar to ophiolitic sequences. Sediments coming after these four sequences are described as cap rocks. The Istanbul Paleozoic consists of Archeozoic sediments, sandstones and shale, and its age is lower Paleozoic. The Pontites are composed of Mesozoic limestone, sandstone, claystone and volcanite. Additionally, the Sakarya continent sequence has Mesozoic sandstone, siltstone at the bottom, gravelstone, limestone, clayed limestone and volcanites at the upper part of it. Lastly, the suture zone rock units consist of ophiolite, ophiolitic mélange and relatively big scaled limestone blocks among them, whose age is Mesozoic. Different kind of lithologies have been developed within the cap rocks starting from upper cretase until today; Eocene sandstone, siltstone, gravelstone, tuff, andesites and basaltic lavas; Miocene sandstone, gravelstone, claystone; Quaternary alluviums, lacustrine sediments, stream sediments and landslides, from bottom to the upper.
The units described above are deformed, folded and faulted in different times. They have been deformed by the earthquakes caused by the NAF for the last 4 million years. Details of these units will be described later in this chapter.
2.1 General Geology and Tectonic Settings of NAF Bolu-Ilgaz Segment
The part of North Anatolian Fault (NAF) between Abant and Ilgaz (Figure 2.1) was ruptured during 1944 Bolu Earthquake. The surface trace of the rupture starts at Ilgaz-Mehmetler village continues until Bolu Plain. In some areas the surface trace of the rupture is divided into a few branches forming a fault zone up to 5 kms. Between Ilgaz and Abant Lake, the surface traces of the fault segment cannot be observed significantly. Large magnitude earthquakes occurred in last 100 years (1944 Gerede, 1953 Cerkes, 1957 Abant and 1967 Dokurcun), on the NAF Bolu – Ilgaz segment are shown on Figure 2.1. Within the contents of this study, the fault segment between Abant and Ilgaz (1944 Rupture) is considered as a whole fault segment and divided into three sub-segments: Ilgaz-Ismetpaşa Segment, Ismetpaşa-Yenicağa Segment, and Yeniçağa-Abant Segment.
Figure
2.1.1 Ilg
The segmecontinues approximatbetween thapproximatlinear in theconcaved Ismetpaşa There are fIt is clear th
In the norsandstone other handMTA 1/500Jura-Cretacof NAF. Soof Eocene fault zone. Şaroğlu et
Figu
2.1.2 Ism
The Ismetptrace is moarea betweeven 100 y
2.1 Rupture
az – Ismetp
ent of the NAtowards Is
tely 69 km lohe Mehmetletely 3 km in e area betwetoward Nort(Şaroglu et
fault set lakehat the fault c
rth of this sand gravels, the south b
00 scaled geoceus aged ro
ome fault mirlimestone aGeological ial. (1987, 19
ure 2.2 The N
metpaşa – Y
paşa – Yeniçorphologicallyeen Yeniçağyears after th
zones of 19
aşa Segmen
AF system inmetpaşa St
ong, striking r Village andeast of the B
een the Erenth in genera
al., 1987). es (sag pondcuts alluvium
segment, thestone, Eocenblock has opological mapock units at trors and milo
and serpantinnformation o
995).
NAF between
Yeniçağa Seg
çağa Segmey apparent inğa and Ismete earthquake
19
39 to 1967 e
nt
n this area station on ttowards N10
d Erencik VilBayramören
ncik and nortal. There is The fault lens) and lands
ms in this reg
e Eocene line sediment
phiolitic mélap. In this secthe south haonitic zones nite-peridotiton this segm
n the Ismetpa
gment
ent is about n addition to tpaşa is onees.
9
earthquakes
starts from thhe west. Il0E. Fault geolages and m as shown inh east of thea 2 km ste
ngth parallelslides along tion.
imestone incts and Miocnge and Jur
ction, Eoceneve faced witare shaped e blocks maent of the fa
aşa and the
47 km long,geological fe
e of the bes
along NAF (a
he east of Mlgaz – Ismometry is for
maximum widn Figure 2.2
e Örenli, howep-over betwl to the Gerethe fault in th
cluding somene volcanica-Cretase lim
e aged rock uh each otherup along the
ay be seen oult is adopte
Ilgaz (Şaroğ
and its strikeatures (Figust places to
after Barka 1
Mehmetler Vimetpaşa Segrmed as a la
dth of the fau. The fault is
wever the fauween Orenli ede Stream he North of th
me volcanic c units existmestone accunits at the nr due to the fe fault zone. on the surfa
ed from Toka
ğlu et al., 198
ke is N80E. ure 2.3), therstudy cracks
1996)
llage and gment is arge zone lt zone is
s partially lt trace is and the is 8 km.
he Kısaç.
material, t. On the cording to north and formation Outcrops ce of the
ay (1973),
87)
The fault refore the s of NAF

Figure 2.
The NAF ikinds of rocand North Beykoy Grsediments starts withcontinues wby red limPaleoceneformation, respectivelformation wThe Pazarbthe Budaklbasalts andon the map In the soutformation, Kadak formcharacterizEocene Taunconformformations gravelstoneTazaklar foand basaltsformation. Selkoğlu Fin the fieldPinarbaşi fresult, the u The format
a) Thsiltforareof gGraintean Ge
.3 NAF segm
n this field cks units. Thof the NAF. ranite, the at the botto
h flish charawith Arkotdağestone and , Limestone the Yazıkavy. Eocene T
with volcanitebasi Formatilar formationd agglomerap.
th of this regthe Kayaba
mation, limezed as flisheaşlık formatiity. Late Mwhich are c
es is at the bormation is ss are namedPlioquaternaormation andd. Stratigrapformation in units above t
tion types se
e Pazarbaştstones and mation has ve amalgamatgravelstonesains are looserpreted as aangular unc
enerally, the
ment between
has right latherefore, two
In the NorthCankurtaran
om exists. Thacterized, eağ group at thclayed limeresifs, sandsak formation
Taşlık formates are considon which for
n is compriseates. Quatern
gion, Upper Jaşı formationstone and s
es is in the on and the
Miocene andclosely relatbottom. Limeshown on thd as the Manary units, whd the Kavak
phy of the athe North, ththe unconfor
en in Ismetp
ı Formationmudstones
very large scted with gravs, grey blue se, un-layerea fault or as conformity. unit represe
20
n the Yeniça
teral strike so different strh of this regin limestone he Mesozoicarly Cretase
he top. The uestone. Thestone, and sn, the Kızıkytion which isdered as tworms the unitsed of lake limnary travertin
Jura rock unn and the Asediments aage of SantAkcagil for
d Early Plioted to one aestone as the map (Figu
ngallar formahich are in tklar formationarea indicatehe Akçaşehirrmity are clos
paşa – Yeniça
n: The unit ws is really ccaled outcro
velstones aromudstones w
ed and nearlya fold. The PIts age is Eents contine
0
ğa and the Is
slip fault chaatigraphic seon, Devonieand the C
c aged units e aged Ulusupper Cretas
sediments wandy limestoayla formatios representeo different fors at the bottomestone andne and alluvi
nits can be sAkbaş formatat the uppertonien-Kampmation over
ocene are another. Thehe Kayabaşı ure 2.4). Volcation, the Orthe south of n. Also, Quates that the r formation insely related t
ağa area are
which has recommon on ops on southound the Yıprwith siltstoney horizontal. Pazarbaşı foEarly Pliocenental conditio
smetpaşa (Ş
aracteristics tequences areen aged Yumapak Formawhich obse
s formation e Gücük formwhich formeones are namon and the Sed by sedimermations on om is compod the Meydaums are big
seen at the btion are volc. The Örenl
panien-Meastrlap lower useparated i
e Akçaşehir formation, recanic agglomtadag formatthe NAF, arternary travelast unconfo
n the South to the evoluti
e:
ed gravelstothe center
h of Eskipazarak Village. Tes and sandsNone of the rmation cove
ne accordingons, and ha
Şaroğlu et al.
that gatherse found in bo
maktepe Quaation which erved in this
at the botmation is rep
ed in Upper med as the ESafranbolu foents and thethe map (Figosed of gravan formationg enough to b
bottom. The canic, whichli formation trihtiene. Th
units with aninto some formation wed mudstonemerates as ation, and there separatedertine sedimeormity is amand older union of NAF.
ones with claof the reg
ar. Volcanic This unit is cstones at the
e deformationers all older ug to collecteaving mudsto
, 1987)
different oth South arsite, the
contains segment
ttom and presented
Cretase- Eskipazar ormation, e Akçagil gure 2.4). velstones, includes be drawn
Enseliler h cut the which is
he middle n angular transitive
which has es as the andesites
e Karakuz d into the ents exist mong the nits. As a
aystones, gion. The
products omposed e bottom. ns can be units with d fossils. ones and

21
limestone show that it is relevant to lacustrine facieses. The average thickness of this formation is about 250-300 meters.
b) The Bahçepınar Formation: This approximately 150 meters thick formation which expands in the middle of the region is represented by limestone and travertines. It is represented by lacustrine limestone which is thick or thin layered in some regions. Its porous levels are unfilled by travertines. Layers are horizontal, and important structural units cannot be seen on the surface. Its age is probably Early Pliocene according to the Pazarbaşı formation.
c) The Meydan Formation: The unit settled in a large area from the Eskipazar- Gerede way to the East. It includes basalts and basaltic agglomerates. Tuff and agglomerates are seen together with coaled sediments in the west of Meydan Village and North of Yıpracık Village. The age of volcanic activity in the region is Pliocene.
d) Unnamed Units: Quaternary travertines are not named even though they are drawn on the map (Figure 2.4). Vertebrate animal fossils which are denoted as Quaternary Sediments on the map (Figure 2.4) were found along the Gerede-Cerkes Road. Their age is Steinhenien (400,000 years old) to today.
e) The Akçaşehir Formation: The Akçaşehir formation is generally composed of red gravelstones which expand toward the south of area (Figure 2.4). There are some parts of tuff, tuffites and lacustrine limestone at the upper part of unit. The Kayabasi and the Tozaklar, which are big enough to be mapped, are mapped seperately as lacustrine limestone (Figure 2.4). The thickness of Akçaşehir formation is about 250 meters and its age is interpreted as Lower Pliocene according to fossils in clayed limestone. This unit is a product of continental facieses, and it is comprised of fans with lacustrine sediments.
f) The Limestone Member: Lacustrine limestone that exists in the Akcaşehir Formation is mapped as a distinctive member in Figure 2.4. Its bedding is obvious and similar structures to pysolites are seen in the lower parts of the layer. Its clayed levels have gastropods and plant fossils. The Kayabaşı formation covers other layers discontinuously. It is about 50 meters thick, and its age is Early Pliocene. The limestone is created in lacustrine facieses.
g) The Tozaklar Member: Red clays and mudstones in the Akçaşehir formation are drawn on the map as a seperate unit (Figure 2.4). It is composed of red or brown claystones, siltstones and mudstones. Borders of this layer are generally not clear. The Tozaklar member is mainy sedimented in laguner conditions and it is likely to cause landslides. There are many fossils seen in limestone, mudstone at the lower levels which has 80 meters thickness. From the fossil samples, its age is Early Pliocene.
h) The Mangallar Agglomerates:Tertiary volcanites, expanding mainly from the East to the West in south block of the NAF, have these agglomerates. Its matrix is well attached ash, so it has many landslides. Besides, it has a little tuff and gravelstone which participated to the unit by basalt and andesitic lava flaws. Its layers are not clear. Silicate infillings exist in some joints. Its thickness is about 500 meters and its age is Pliocene due to its relationships with the Akçaşehir formation, but its lower levels may be Upper Miocene.
i) The Ortadag Andesites: They are Tertiary andesites in south of the study area. The Ortadağ andesites are mostly settled down like lava flows in atmospheric

22
conditions and doms. These lava flows’ centers are distributed on the area rather than a single point. The main outflow center is near the Ortadağ.
j) The Karakuz Basalts: They are the third group of Tertiary volcanism which expands through large areas. Basalts’ color is determined as dark grey or black and light minerals cannot be observed. Its age is approximately Upper Miocene- Pliocene. They came over the Akçaşehir formation in Early Pliocene by cutting some areas; hence, the age of lavas- Pliocene- is certain.
k) The IIgaz Formation: Limited outcrops of this continental facieses in the south east path of study area are sequences of sandstones, siltstones and gravelstone. East part of this layer is Pliocene. It is reasonable to think that the formation is sedimented like a meandrous river, and then it turns to lacustrine conditions.
l) The Selkeoglu Alluvium Fans: These alluvium fans, whose geometrical shapes are still preserved, are mapped as a different unit in the middle of study area (Figure 2.4). This unit has an importance about both age and slip of the NAF. It is well compacted with the elements of sandstones, gravelstones and siltstones. Thus, it causes many landslides in the region. The main color is grey and dirty brown, gravels are not well rounded. The recharge area is not clear because the tectonic activity in the area distributed geometrical shapes of fans. It covers all units with angular unconformity. Its average thickness is about 100 meters, and its age is Late Pliocene-Quaternary
m) The Kavaklar Alluvium Fan: This layer expands from the edge of NAF zone to Gerede. Its typical sections are not able to be determined because it is not well compacted, and it could easily be altered. The main color of this layer is red and can only be seen along the Ankara-Istanbul way. This fan which has gravelstone, siltstone and sandstone material preserves its original shape. It is aged as Plioquaternary, and its thickness is about 50 meters.
n) The Unseparated Quaternary Sediments: There are a lot of sediment stocks which are related to today’s sedimentary system on a large area between the Yeniçağa and the Çerkeş. They are fans, which are developed along the fault valley, are transitional to lacustrine sediments. Only travertines in south west of the Yeniçağa Lake among these sediment stocks are mapped (Figure 2.4). Its thickness is about 100 meters.
o) The Asagikuldan Travertines: The travertines in the south east part of the Yeniçağa are mapped with this geographical name (Figure 2.4). These rarely massive light colored travertines are about 50 meters thick. Quaternary travertines are still produced by outflows of mineral water on today.
Figu
2.1.3 Ye
The Yeniçathe Abant Bolu Plaingravelstonewhose strikNorth of theeast of the fault. The highway in zone. The shifted 200common aCracks, cothey are stnot evident
Fig
re 2.4 Geolo
eniçağa – Ab
ağa – Abant for 75 km. I
n from the es, sandstonke is N40E ee DereceöreYeniçağa. Tfault trace asouth of thetravertines
0 meters to tlong the faul
onvergent ridill obvious. Wt on the field.
gure 2.5 NAF
ogical Map be
bant Segme
segment liests strike is gSouth (Figu
nes and clayexists 15 km
en Village. LaThe Yeniçağaappears in ae Kırka Villag(Figure 2.6bthe right by tlt between th
dged and opWhile the fau.
F segment be
23
etween Gere
nt
s between thgenerally N7ure 2.5). It ystone sequem long beforearge scaled la Lake is a f
a stone pit (age. There is b) along the the fault (Akhe Koy-Yenicpening joints ult’s morpholo
etween Yeni
3
ede and Eski
he Yeniçağa75E. The fau
cuts the Plences near te it connectsandslides cafault set lakea quarry) wha 30 metersfault line in
ktimur and otce Road andare formed
ogy may be
çağa and Ab
pazar (Şaroğ
and Guney lt trace has liocene sedihe Uctepeles to the NAFan be seen ae whose drainhere the fau width limest east of thethers 1983). d the Mudurn
by the eartobserved by
bant (Şaroğlu
ğlu et al, 199
Mahallesi inlinear borde
iments conser. Another faF main branalong the faunage is close
ult intersectsstone in the se Kandıra Vi Travertinesnusuyu (Figuthquake in 1
y air photogra
u et al., 1987
95)
n south of ers in the sisting of ault trace ch in the lt zone in ed by the with the squashed llage are are also
ure 2.6a). 1957, but aphs, it is
7)
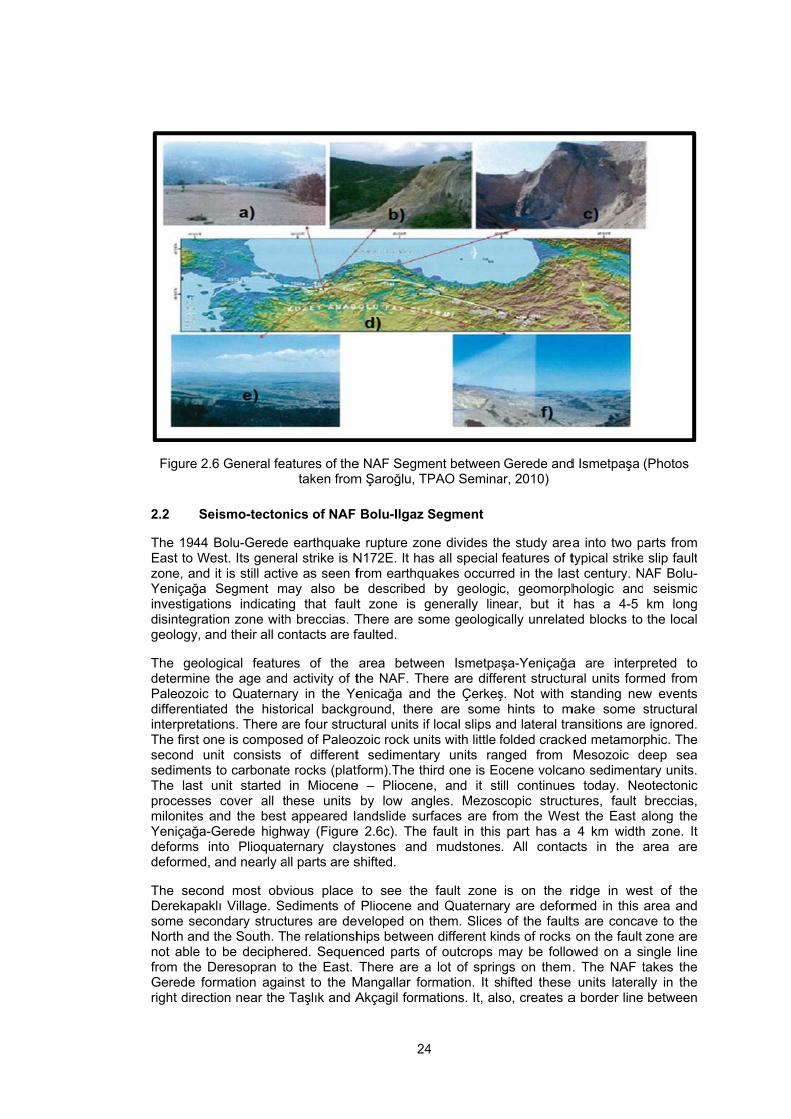
Figure 2.6
2.2 Se
The 1944 BEast to Wezone, and Yeniçağa investigatiodisintegratigeology, an
The geolodetermine Paleozoic differentiateinterpretatioThe first onsecond unsediments The last uprocesses milonites aYeniçağa-Gdeforms indeformed,
The seconDerekapaksome secoNorth and tnot able tofrom the DGerede forright direct
6 General fea
eismo-tecton
Bolu-Geredeest. Its generit is still activSegment m
ons indicatinon zone withnd their all co
ogical featurthe age andto Quaternaed the histoons. There ane is composnit consists to carbonate
unit started cover all t
and the bestGerede highnto Plioquatand nearly a
nd most obvklı Village. Seondary structthe South. T
o be decipheDeresopran trmation agaiion near the
atures of thetaken from
nics of NAF
e earthquakeral strike is Nve as seen f
may also beng that faulth breccias. Tontacts are fa
res of the d activity of tary in the Yeorical backgare four strucsed of Paleoz
of differente rocks (platfin Miocenehese units appeared la
way (Figureternary claysall parts are s
vious place ediments of tures are devhe relationsh
ered. Sequeno the East. inst to the MTaşlık and A
24
e NAF Segmem Şaroğlu, TP
Bolu-Ilgaz S
e rupture zonN172E. It hasfrom earthque described t zone is gThere are sofaulted.
area betwethe NAF. Thenicağa andround, therectural units ifzoic rock unit sedimentaform).The th
e – Plioceneby low angandslide sur
e 2.6c). The stones and shifted.
to see the Pliocene anveloped on hips betweennced parts oThere are a
Mangallar forAkçagil form
4
ent between PAO Semina
Segment
ne divides ths all special
uakes occurrby geologic
generally lineome geologic
een Ismetpaere are diffe
d the Çerkeşe are some f local slips aits with little fry units ranird one is Eo
e, and it stgles. Mezosrfaces are frfault in thismudstones
fault zone nd Quaternathem. Slicesn different kinof outcrops ma lot of sprinrmation. It sations. It, als
Gerede andar, 2010)
he study areafeatures of t
red in the lasc, geomorphear, but it cally unrelate
şa-Yeniçağaerent structurş. Not with s
hints to mand lateral trafolded crackenged from ocene volcanill continuescopic structom the Wespart has a
. All contac
is on the rry are deform
s of the faultnds of rocks may be follongs on themhifted these so, creates a
d Ismetpaşa
a into two ptypical strikest century. Nhologic andhas a 4-5 ed blocks to
a are interpral units formstanding new
make some ansitions are
ked metamorMesozoic dno sediments today. Netures, fault st the East a
4 km widthcts in the
ridge in wesmed in this ts are concaon the fault
owed on a s. The NAF t units lateraa border line
(Photos
arts from slip fault
NAF Bolu- seismic km long the local
preted to med from w events structural
e ignored. phic. The
deep sea ary units.
eotectonic breccias, along the h zone. It area are
st of the area and ve to the zone are ingle line takes the
ally in the between

the Akçagformations did not affeunits are dareas of thfans and sare control
All special where the beginning Akçabey VEast. RidgThe fault sshaping a n
Many stresNAF zone. with acute normal comvalley shapthe NAF. Aby Şaroğluthe fault in the fault wan existencstructure beconcaved tThe Keçi, Kfrom the Nthe last ear
Figure 2.7
il formation are the youn
ect them. It deformed by hese units, ssediments arled by the NA
morphologiclinear surfacof the NAF.
Village. A simes and eros
splays from tnew valley.
ss points areThe Yeniçaangles to th
mponent. It iped by erosioA rising stressu, 2010 (Figu
this area. Ahich is a since of a right esides to theto the NorthKoç and Sul
North to the Srthquake.
The geomor
and the Kngest ones ais likely to va new tecto
sediments anre consistentAF.
cal features rce trace of NA
The most tymilar one is sions on the the Gerede S
observed wğa Lake is ae main faultsis possible toons, and thes area was oure 2.7). TypA sample of agle line in thlateral strike
e forming a fa, and the riduk Lakes arSouth in this
rphologic sha
25
Kandak formamong units erbalize thatonic processnd outflow cet on expand
related with tAF can be oypical fault vabout 10 kmfault are ob
Stream to th
where the fauan example tos, which areto propose the south part observed betpical fault laka fault valleyhis area. Gee slip fault (Fault valley indges in southre examples s area accor
apes which w(Şaroğlu
5
ation in thewhich are det the Akçaşes instead of enters of voling area, se
typical strike bserved. Thevalley settlesm from southbvious along he South alo
ult pieces foro these area concave to hat the northof it is a fautween Geredkes and ridgy has a drainometrical shFigures 2.6f east of the h of the Derof fault set ding to the f
was formed b, 2010)
e East. Theeveloped ind
ehir formationthe NAF acclcanic seque
ediments and
slip faults arere are fault s from east h west of ththe Gerede
ng the last 2
rmed jumps aas, and there
the North. Th of Yeniçağlt lake formede and east oes with sedinage systemapes of fansand 2.6e). T
Derekapaklı rekapaklı arelakes. Faultsfans and the
by the NAF a
e Taşlik anddependently n and its cocording to eences. Plioqud deformatio
re developedvalleys, ridgof the Gered
he Derekapae Stream to 25 km in the
and curves ae are secondThey do not ğa Collapse ed by a set sof the Yeniçaiments are p
m, and fans ss and drainaThe fault hasRoad. Slices
e parallel to s are gettingeir movemen
at east of the
d Akçagil and NAF eval rock xpanding uaternary
ons which
d in areas ges at the de to the klı to the the East.
e East as
along the ary faults have any is an old
shifted by ağa Lake
parallel to shifted by age prove s a zonal s of it are the fault.
g younger nts during
e Gerede

26
The fault has a compression effect between the Imamlar and the Gerede Stream, the rocks in the area are mostly deformed. This field is higher than its west and its east. The fault is linear in the East. There are ridges, fault lakes and landslides. It is suggested that the south block of it is higher than its north because it spreads to the far eastern from the Gerede Stream, and it shaped a new valley. There are a lot of right lateral slips on morphological features along the fault as long as a range from a meter to a kilometer.
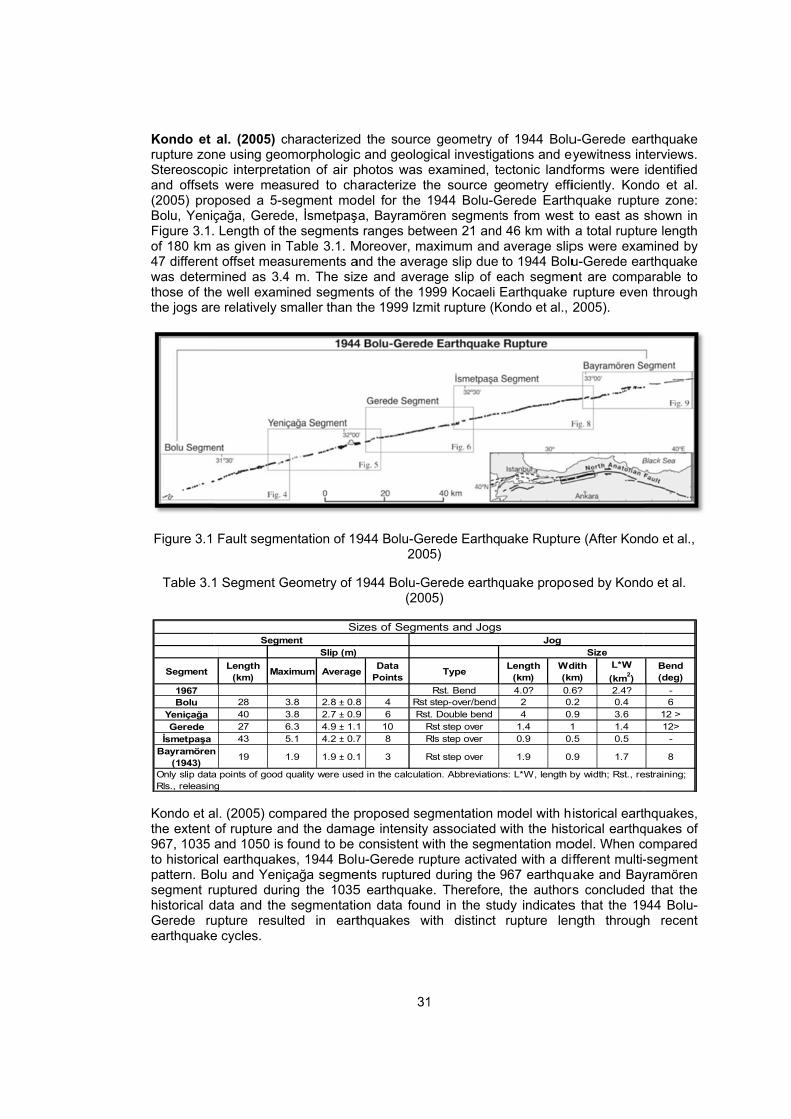
Two large scaled earthquakes occurred in the area in 1944 and 1953, measuring 7.4 and 6.0 on the Richter scale. A 2 meters long a right-lateral strike slip as related to the fault near the Bolu and a 2 meters long right-lateral strike slip near east of the Gerede were observed as a result of the earthquake in 1944. The creep measurements on the wall of the Ismetpaşa General Directorate of Highways Treatment Station show that the movement of the fault is still going on. These observations show that sedimentation of the Akçaşehir formation has a new active tectonic regime. This tectonic age started in the Middle and Upper Miocene before Early Pliocene.
2.3 General Geomorphologic Features of the NAF Bolu-Ilgaz Segment
The geomorphological structures of the area are governed by NAF zone. The age and slip rate of the NAF can be inferred by the distinctive ground shapes that are formed by erosions and sedimentation of shifted river beds. The length of NAF between the Yeniçağa and the Kabak Villages in the North of Cerkes is about 85 km as cutting through the area, which improves morphological structures (Figure 2.6). The area may be evaluated as two different sections; Gerede-Bayındır and the Bayındır-Kabak, due to their distinctive geomorphologic structures. While the north block of fault is morphologically lower in east of the area, the north block of it between the Gerede and the Bayındır is higher than the other in the South. This reversal structure is generally a product of the right strike slip fault, or the NAF, and it is closely related to contacts of different units each other.
Upper Pliocene can be identified by geomorphologic erosion units in the area. In this epoch, erosion features were shaped apparently upon Lower Pliocene sediments and volcanic features. This activity eroded old structural features in the area. Upper Pliocene erosion surfaces along the Bayındır-Eskipazar-Dağlacık in the north block of NAF, along the Gerede and the Gerede Stream in the south block may clearly be seen on 1000-1300 meters altitudes. These erosion surfaces are really interesting along the NAF zone. The south border of plains, which Upper Pliocene erosion features shaped between the east part of the Bayındır-Eskipazar and the north block of NAF, is determined by the NAF. This border is about 1500-1600 meters long in the south part of it. The north border of these erosion surfaces between the Ismetpaşa and the Gerede ends up along the NAF zone. There are discordances between the Upper Pliocene drainage which shaped erosion surfaces and the Quaternary drainage which has been affected by the NAF. Erosion surfaces in the south block may be seen between the Ismetpaşa and the Gerede like they are in the north block.
These observations indicate that the NAF does not have any effect on geomorphologic activities in the Upper Pliocene; Erosion plains in east of the Bayındır were formed in the same facieses; the drainage was shaped from the South to the North. The NAF shifted these erosion surfaces about 20 km along the right lateral, and it carried them against high morphologies. The upper Pliocene drainage is deformed along the NAF zone shows that the onset of NAF is the end of Upper Pliocene, or the beginning of Quaternary Age. Quaternary morphology of the NAF has apparently most of morphological features of the active right lateral strike slip fault. The forms of units, the width of the fault zone, organizations of cracks forming the fault zone and drainage-fault relationships may differ. Travertines may be seen besides many springs along the fault 6 km away from the east Hamamlı. Many right lateral offsets, which the most obvious one is in the Kabak valley, are formed along additional valleys combining to the Gerede Stream. The Akdere Valley is shifted to the right lateral about 1 km by the NAF. Some sediments of landslides in the east part of the Hamamlı are shifted laterally in right direction. Convergent ridges and sag ponds which were shaped by

27
the earthquake in 1944 are still obvious. The NAF between the Ismetpaşa and the Gerede has geomorphologic features about right lateral strike slip. The NAF zone is about 25 km in east of the Gerede, and it looks like a dry valley because it does not have any drainage area. This channel, which is formed how valleys from the North are blocked in the south block of the fault, has many fault-set basins. It has some lakes created by this activity. This morphological channel along the NAF zone is filled with sediments of Quaternary alluvium fans. As the older fans were deformed by the NAF, younger fans are able to preserve their morphologies. Parallel ridges to the fault are really apparent in the fault zone between the Kapaklı and the Deresaplan. Right lateral separations may be observed on the streams which are perpendicular to the fault’s strike. The most obvious one is near Imanlar. The Akdere Valley is shifted about 1.5 km in right lateral. The south block of the fault is morphologically higher between the Kapaklı and Gerede. Units in the north generally consist of alluvium fans. Many cut and shifted ridges are in the south of the fault. The most spectacular examples of these ridges is upon the plains formed by alluviums in west of the Kapaklı. A recently shaped very young hill may be observed in north-east of the ridge which the fault cut. The slope of east parts the stream valleys which are perpendicular to the fault in east of the Gerede is much more than the west part of it. This information shows that Quaternary drainage along the NAF is formed by the effect of a right lateral strike slip fault. The Yeniçaga Lake basin is bordered by the NAF in the South.
All deformations of geomorphologic units of geomorphologic units and inversions on slopes of units show that the NAF is really active in Quaternary, and they have been formed for a long time. The morphological features shaped by the earthquake in 1944 prove this differentiation. Its micromorphology can be easily determined because of the terrains used for agricultural aims.
2.4 Discussion and Conclusion
The geology, tectonics, geomorphology and seismicity of the study area is investigated and the results of previous field investigations are summarized in terms of the age, length, slip rate and fault mechanism of NAF. The NAF is younger than the Akçasehir formation since it cuts the formation. The age of the NAF is relatively Late Pliocene. The amount of its slip is determined by comparing the same rock units on both sides of the fault each other. The most obvious slip of it is about 28 km on the contact of the Akçagil formation. The Pazarbaşi formation in north of the fault and the Akçasehir formation in south of it seems like the shifted parts of the same unit. The average slip from both sides of the fault is about 25 km. It is about 29 km if the Kavaklar formation in the South and the Cretase Ulus formation are accepted as the same unit. There is coeval erosion plain in the South, which cuts the Akçasehir formation. The slip is approximately 25 km in this field (Figure 2.8). Following interpretations can be made:
The age of the NAF is about 3 million years. Total offset according to Eosen formation, pliosen Akçasehir formation, erosional
surfaces, and drainage systems with en error of ±30 km. The average annual movement is 30 km/ 3 million years (1 cm / year). (This value is
due to long time measurements, for the critical 100 years periods the value will change).

F
2.4.1 Ro
Detailed inclassificatioan empiricahard rock (map providpublished specific meperiod or pthat did notrocks fromclassified a
However, aSome basaFor some classified aonly to givesite specific
Figure 2.8 Ge
ock Classific
n-situ geotecon. Howeveral rock class(denoted by ded in Figurby General
easurementspaleotectonict face enoug
m the paleotas hard rock
a few excepalts can be clandslide ar
as soft rockse a general ic characteris
eological ma
cation
chnical testsr, using the gification modA in Figure 2re 2.9 is takDirectorate
s are availablc period. Theh diyasine aectonic perion the map.
ptions can bclassified as eas, highly s. It should bidea to the rstics should b
28
ap and total o
s are definitegeology, tectdel is constru2.9) and softken from Zoof Mineral
le the rocks e rocks from nd classifiedod assumed
be considerehard rocks ealtered areabe noted witreader aboutbe determine
8
offsets in stud
ely requiredtonics and g
ucted by dividt rock (denotonguldak anResearch a
are classifiedthe neotecto
d as soft rockd as units t
ed on the preven they we
as and regioth great impt site classificed by the hel
dy area (Şaro
to make ageomorpholoding the studted by B in F
nd Sinop citiand Exploratd with respeconic period ak on the mapthat faced e
roposed genere formed ins with high
portance, thacation of the p of in-situ g
roğlu, 2010)
a compherenogy of the study area into tFigure 2.9). Ties’ geologictions. Sincect to their neare assumedp. On the conenough diya
neral rock den neotecton
h water tableat Figure 2.9e study area.geotechnical
nsive site udy area, two parts; The base cal maps , no site
eotectonic d as units ntrary, the sine and
efinitions. ic period. e can be
9 is given The real tests.

Figure 2.9 Ro
29
ock classification mmap of the study aarea
30
CHAPTER 3
SEISMIC SOURCE CHARACTERIZATION OF ILGAZ-ISMETPAŞA SEGMENTS (1944 RUPTURE) OF NORTH
ANATOLIAN FAULT
Probabilistic Seismic Hazard Assessment (PSHA) described as a procedure of four steps: i) identification of the seismic sources and source geometry, ii) characterizing the seismic sources in terms of magnitude recurrence models, iii) estimation of ground motion intensity measures and its variability for each scenario, iv) constructing the hazard curve. The first two steps in the PSHA framework includes; the definition of the source geometry in terms of length, width, dip and strike angles of the fault plane, identification of the segmentation point locations, and modeling the earthquake recurrence relations of the source with the help of historic seismicity and available geological information. This is a critical part of PSHA since the estimated magnitudes of the future earthquake scenarios depend on this information (Reiter, 1990).
Since speciality on structural geology, tectonics and seismology is a necessity to achieve an accurate and proper modeling of the seismic sources as an input to PSHA, expert evaluation of Dr. Şaroğlu for the fault geometry and source-epicenter matching for 1944 rupture zone is adopted for this study. General geological and tectonic features of the NAF system in the study area was presented in Chapter 2, however, contribution of this information to building the source model is summarized in this chapter. Furthermore, activity rates estimation and the reoccurrence relations are also included in this chapter whereas the use of seismic source models in probabilistic seismic hazard assessment will be discussed in details at Chapter 4.
3.1 Source Geometry of 1944 Bolu Earthquake Rupture Zone
On 1 February 1944, a destructive earthquake occurred in the Bolu and Gerede regions along the west-central portion of the NAF. The magnitude of this earthquake was recalculated as Ms=7.3 (Dewey, 1976) using seismogram records and as Mw=7.4 based on an empirical magnitude-slip relation and the assumed mean slip (Barka, 1996). Rupture trace of the earthquake was first examined by Taşman (1944) who reported the length of rupture as 180 km, the right-lateral strike-slip as 3.5 m, and vertical displacements as 0.4–1.0 m. Later on, various aspects of the 1944 Bolu-Gerede earthquake were reexamined by several other authors (Ketin 1948, 1969; Ambraseys 1970; Lienkaemper 1984; Ozturk et al. 1984; Wells and Coppersmith 1994; Barka 1996; Ambraseys and Jackson 1998; Demirtaş 2000; Herece 2005; Kondo et al. 2005). The rupture zone extended from north of Kurşunlu (Bayramören) to the Abant Lake (Ketin, 1969; Ambraseys, 1970; Ozturk et al., 1984) for 165 kilometers. The epicenter was located near the eastern end of the rupture zone (Dewey, 1976) and depth of the 1944 Bolu-Gerede earthquake was estimated to be 21.6 km by Jackson & McKenzie (1988). The thicknesses of the seismogenic layer and the crust in this area were reported to be 17 km (Ozalaybey et al. 2002) and 31 ± 2 km (Zor et al. 2006), respectively. It was also suggested that the locking depth is between 15 and 21 km along the ruptured section of the Gerede fault zone (Nakiboğlu et al. 1998; Meade et al. 2002; Kocyiğit et al. 2006; Reilinger et al. 2006).
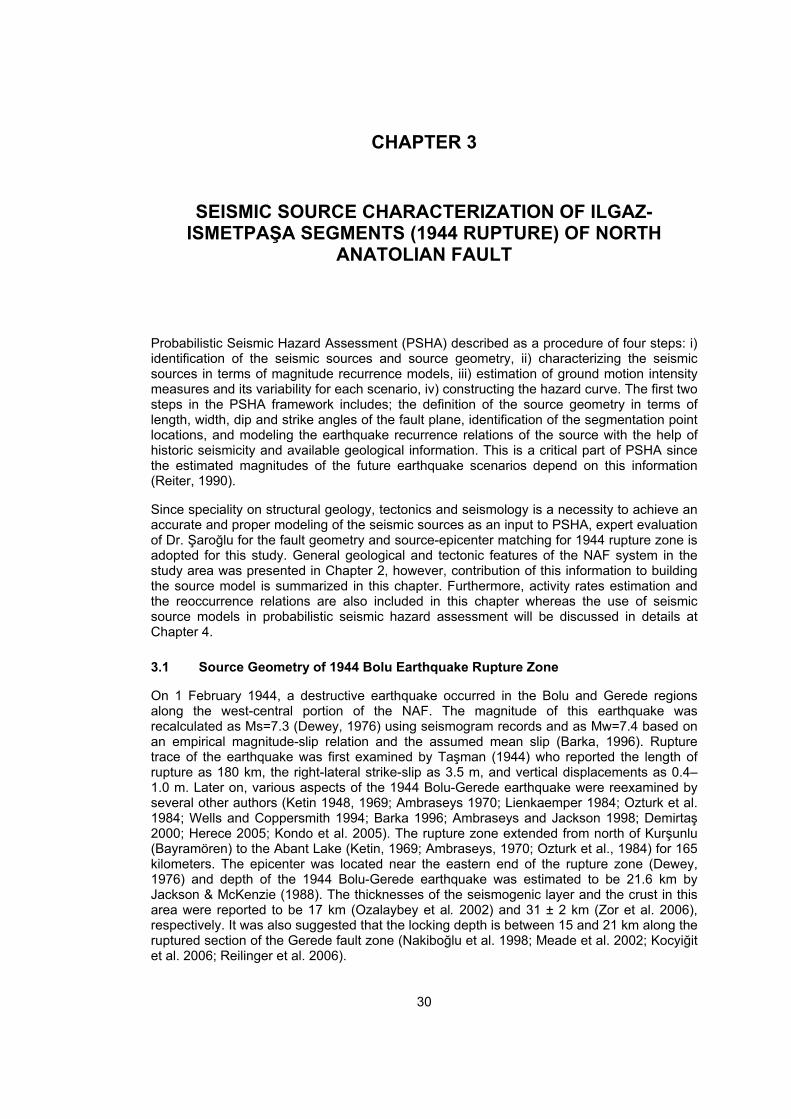
Kondo et rupture zonStereoscopand offsets(2005) proBolu, YeniçFigure 3.1.of 180 km 47 differentwas determthose of ththe jogs are
Figure 3.1
Table 3.1
Kondo et athe extent 967, 1035 to historicapattern. Bosegment ruhistorical dGerede ruearthquake
Segment
1967Bolu
YeniçağaGerede
İsmetpaşaBayramören
(1943)Only slip dataRls., releasing
al. (2005) cne using geopic interpretas were meaposed a 5-sçağa, Gered Length of thas given in t offset meas
mined as 3.4e well exame relatively s
Fault segme
1 Segment G
al. (2005) comof rupture anand 1050 is
al earthquakeolu and Yeniçuptured duridata and the upture resule cycles.
Length (km)
Max
28 340 327 643 5
n 19
a points of good g
Segm
characterizedomorphologication of air psured to ch
segment modde, İsmetpaşhe segmentsTable 3.1. Msurements a4 m. The sizined segmen
smaller than t
entation of 19
Geometry of 1
mpared the pnd the damafound to be
es, 1944 Bolçağa segmeng the 1035segmentatio
ted in eart
ximum Average
3.8 2.8 ± 0.83.8 2.7 ± 0.96.3 4.9 ± 1.15.1 4.2 ± 0.7
1.9 1.9 ± 0.1
quality were use
Siment
Slip (m)
31
d the sourcec and geologphotos was earacterize thdel for the 1a, Bayramör
s ranges betwMoreover, maand the averaze and averants of the 19the 1999 Izm
944 Bolu-Ge200
1944 Bolu-G(200
proposed segage intensity consistent wu-Gerede ru
ents ruptured5 earthquakeon data founthquakes w
eData
Points
8 4 Rst 9 6 Rst1 10 R7 8 R
1 3 R
ed in the calculati
izes of Segme
1
e geometry ogical investigaexamined, tehe source g1944 Bolu-Gren segmentween 21 andaximum and age slip due age slip of e999 Kocaeli mit rupture (K
erede Earthq5)
Gerede earthq05)
gmentation massociated
with the segmpture activat
d during the e. Thereforend in the stu
with distinct
Type
Rst. Bendstep-over/bendt. Double bendRst step overRls step over
Rst step over
ion. Abbreviation
ents and Jogs
of 1944 Boluations and eectonic landfeometry effi
Gerede Earthts from westd 46 km with
average slipto 1944 Bolu
each segmenEarthquake
Kondo et al.,
uake Ruptur
quake propos
model with hwith the hist
mentation moted with a dif967 earthqu, the authors
udy indicatesrupture len
Length (km)
Wd(km
4.0? 0.62 0.4 0.
1.4 10.9 0.
1.9 0.
ns: L*W, length b
Jog
s
u-Gerede eaeyewitness informs were iciently. Konhquake ruptut to east as a total ruptu
ps were exau-Gerede eant are comprupture even2005).
re (After Kon
osed by Kond
istorical earttorical earthqodel. When cfferent multi-ake and Bay
rs concludeds that the 19ngth throug
dith m)
L*W
(km2)
6? 2.4?.2 0.4.9 3.61 1.4.5 0.5
.9 1.7
by width; Rst., re
Size
arthquake nterviews. identified
ndo et al. ure zone: shown in
ure length mined by
arthquake parable to n through
do et al.,
do et al.
thquakes, quakes of compared -segment yramören
d that the 944 Bolu-h recent
Bend (deg)
-6
12 >12>
-
8
estraining;

Koçyiğit aearthquakelocation, mrupture zonauthors prothe ruptureis located northward geodetic scm., M0 = 4.offset meas
Figure 3.2
and Ayhan e and stated
magnitude, gne, total geooposed a 3-se is found as between Laand southwacalar momen02 x 1020 Nmsurements a
2 Rupture tram
(2009) alsothat serious round rupturlogic offset, segment mod191km and
ke Abant in ard 85°± 5°. nt and momem, and Mw = nd geodetic
ace of 1944 Bmeasured on
32
o examined uncertaintiere and its gslip rates andel for the swidth of thethe west an
Its right-laterent magnitud 7.74, respedata.
Bolu-Gereden it (After Koç
2
the source es are involveeometry, co
nd the return ource as sho
e fault is estimnd Osmangöral strike slipde are foundctively, using
e earthquakeçyiğit and Ay
geometry oed in the sou-seismic offsperiod of lar
own in Figurmated as 16 öl (Bayramör
and normal d as 4.40 ± 0g triangulatio
e and variousyhan, 2009)
of 1944 Boluurce model; set along thrge earthquare 3.2. Total
6 km. Ruptureren) in the edip-slip com
0.11 m., 1.02on, GPS and
s right-lateral
u-Gerede epicenter e ground
akes. The length of e surface east, dips mponents, 2 ± 0.17 geologic
l offsets

Koçyiğit an7.41 m., wproposed tgeologic rezone. Considerinet al. (200shown in Fsegments Segment (Susing the Wzone are ca Mchar 3 where RA Earthquake16 km. Thestudies. Thcharacteris
Figure 3
Table 3
1 2 İs
3 Y
nd Ayhan (20which are higthe geodetic ecurrence in
g the fault se05), 1944 BoFigure 3.3. Ain the area Segment - 2Wells and Calculated as
.98 1.02 lo
is the ruptue as 17 km aerefore, the whe segmentsstic magnitud
3.3 The gene
.2 Segment
Segment Na
Ilgaz - İsmesmetpaşa - Y
Yeniçağa – Ab
009) obtainegher than the
recurrence terval of 26
egmentationolu-Gerede eAccording toare; Ilgaz -İ
2), and YeniçCoppersmith 16 km.
g RA 0.2
ure area. Baand Koçyiğit width value us, rupture lende values use
eral layout of
geometry, as
ame
etpaşa Yeniçağa
bant Lake
33
ed the geologe values prointerval as 26 ± 35 yr. f
models defiearthquake o Figure 3.3İsmetpaşa Sçağa - Aban
(1994), are
23
arka et al. (and Ayhan (
used in this sngth and wied in this stu
f the fault segsour
ssigned slip segm
Length (km)
69 47
75
3
gic and geodoposed by K232 ± 25 yr. for characte
ned by Koçyrupture zone
3, from westSegment (Set Segment (
ea-magnitude
(2002) calcu(2009) estimstudy is logicdth values fdy are listed
gments and trce
rate and chament
Width (km)
16 16
16
detic peak ofKondo et al.
which agreeristic earthqu
yiğit and Ayhe is divided t to east the
egment - 1), Segment - 3e relations t
lated the wated the widal when comfor each seg in Table 3.2
the slip rates
aracteristic m
Slip Rate
(mm/yr) 20 12
20
ffsets as 7.1(2005). The
es with the uakes from
an (2009) aninto 3 segm
e three primİsmetpaşa-Y
3). In equatiothe width of
width of 1999dth of this segmpared with tgment, slip r2.
s assigned to
magnitude for
CharacterEarthqua
(Mchar)7.08 6.91
7.12
6 m. and e authors proposed this fault
nd Kondo ments as
mary fault Yeniçağa on 3.1 by the fault
3.1
9 Kocaeli gment as these two rates and
o each
r each
ristic ake )

Using geol1988; KasaPınar et althe long-temeasuremecalculation the long-te(2000) usemm/year torate as 25 Ilgaz. The between 1along NAF taken as 20
Apart from showing thBolu-Geredfault segmeBolu-Geredsurficial sli(Doğan et earthquake3.5; open Open trianby Taşmanrate of Ismproposed ifrom 1957
logical, seismapoğlu and ., 1996; Pipeerm slip rateents along tof short-termrm measured the Euler po 24 mm/yeamm/year. YGPS netwo8.7 ± 1.6 mis generally
0 mm/year e
Figure
the studies at there is a
de earthquakent was prode Earthquaps by recenal., 2003; Ç
e has a restrcircles indicgles show m
n (1944), Ketmetpaşa-Yeni
n the previoto 2010 prep
mological anToksöz, 198
er et al., 199e of NAF bhe central am geological
ements withinpole estimatiar. Reilinger avaşoğlu et
ork observatim/year and shown in Figxcept for the
3.4 Slip rate
on the meaa creeping fake. Kondo etbably re-rupke, the slip o
nt large eartÇakır et al., 2raining bendcate measuremeasurementtin (1948, 19içağa segme
ous studies fpared as give
34
nd paleo-ma83; Kiratzi a
97; Tatar et abetween 10 and the westl slip rate. Sn a range of on and mentet al. (2006al. (2011) u
ions along f21.5 ± 2.1 gure 3.4. In
e Ismetpaşa –
e vectors alon
asurement ofault around Ist al. (2005) a
ptured duringof the 1951 hquakes are2005). Barka
d (creep) at tements donts reported s69) and Ambent, creep amfor the regioen in Table 3
4
agnetic methand Papazacal., 1995; anmm/year an
tern segmentraub (1996)
f 24 mm/yeationed the lo) used the bsed a local Give years esmm/year. Ththis study, th– Yeniçağa s
ng NAFZ by
f general slipsmetpaşa fauand Çakır et
g the 1951 eKurşunlu Ea
e the main ea (1996) shothe East of Ie by Allen (soon after thbraseys (197mount, time n are collec
3.3 and Figur
hods, Barka chos, 1999; nd Taymaz end 20.5 mmnts of the NA) proposed ar to 28 mm/yng-term slip
block modelinGPS networstimated the he distributiohe slip rate osegment.
Tatar et al (2
p rate of NAFult segment t al. (2005) sarthquake. A
arthquake anexplanationsowed that thsmetpaşa (F(1969) and he 1944 Bolu70). In order period, and ted and a care 3.6.
and KadinsKozacı et a
et al., 1991 mm/year. The AFZ are usea larger slip year. McClurate as a ran
ng and foundrk between L slip rate as
on of the slipof the fault se
2011)
FZ, there arin the region
stated that IsAfter the slipnd remotely s of Ismetpahe 1944 BoluFigure 3.5). Öztürk et au-Gerede eato estimate tmeasureme
atalog of cre
sky-Cade, al., 2007; measured
geodetic ed for the rate than sky et al. nge of 22 d the slip Ladik and s ranging p vectors egment is
e studies n of 1944 smetpaşa p of 1944 triggered
aşa creep u-Gerede In Figure l. (1985).
arthquake the creep ent errors eep rates
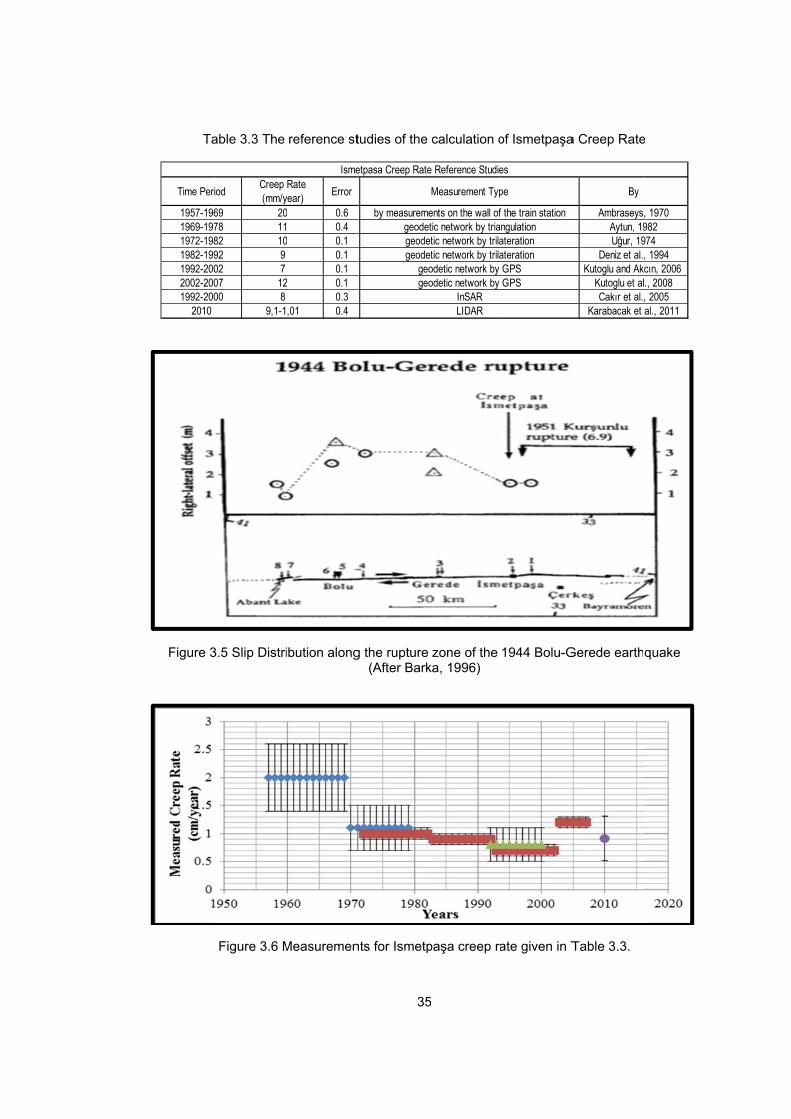
Ta
Figure 3
Time Peri
1957-1961969-1971972-1981982-1991992-2002002-2001992-200
2010
able 3.3 The
3.5 Slip Distri
Figure 3.6 M
iodCreep (mm/y
69 2078 1182 1092 902 707 1200 8
9,1-1
reference st
ibution along
Measuremen
Rate year)
Error
0 0.61 0.40 0.1
0.10.1
2 0.10.3
,01 0.4
Isme
35
tudies of the
g the rupture (After Bark
nts for Ismetp
by measuremegeodegeodegeode
geogeo
etpasa Creep Rate
5
calculation o
zone of the ka, 1996)
paşa creep ra
Measurement Typ
ents on the wall oftic network by tria
etic network by trilaetic network by trilaodetic network by odetic network by
InSARLIDAR
e Reference Studie
of Ismetpaşa
1944 Bolu-G
ate given in T
pe
f the train stationngulationaterationaterationGPSGPS
es
a Creep Rate
Gerede earth
Table 3.3.
By
AmbraseysAytun, 19Uğur, 19
Deniz et al.Kutoglu and Ak
Kutoglu et alCakır et al.
Karabacak et
e
quake
, 1970982974, 1994
kcın, 2006 l., 2008, 2005al., 2011

36
Figure 3.6 indicates that the average creep rate measured by recent studies is approximately 8 mm/year. The slip rate assigned to the fault segment is reduced by this value for Ismetpaşa-Yeniçağa Segment and a total slip rate of 12 mm/year is assigned to that segment as shown in Figure 3.3.
3.2 Source-Epicenter Matching and Magnitude Distribution Models
A range of earthquake magnitudes will occur by a seismic source. The relative number of different magnitude earthquakes which occur on the seismic source is described by the magnitude distributions. Typical magnitude distributions used in PSHA are;
1. Truncated Exponential Model 2. Truncated Normal Model (Characteristic Model) 3. Composite Model (Youngs and Coppersmith, 1985)
The basic magnitude recurrence relation proposed by Gutenberg – Richter (G-R) (1944) is;
LogN M a bM3.2
In equation 3.2, the constants “a” and “b” represent the rate and relative frequency of earthquakes and the cumulative number of earthquakes greater than M is represented by N (M). Since there is a maximum magnitude for the source and a minimum magnitude for engineering interest, the G – R (1944) distribution is typically truncated at both ends and renormalized so that it integrates to unity. The truncated exponential model is limited at the minimum and maximum magnitude values and equation 3.3 shows that the distribution function is normalized to set the total probability value to unity.
β exp β Mw Mmin
1 exp β Mmax Mmin3.3
Where β is ln(10) times the b value.
Youngs and Coppersmith (1985) proposed that the truncated exponential distribution is suitable for large regions or regions with multiple faults but in most cases does not work well for fault zones. Recent earthquakes and advances in understanding of earthquake generation process have indicated that EQ recurrence on individual faults may not conform to the exponential model developed from regional historical observations (Ocak, 2011).
Instead, individual faults or fault segments may tend to rupture in what have been termed “characteristic” size events at or near. The characteristic magnitude distribution model in which the faults tend to generate only characteristic (or maximum) size events depends on the fault geometry. The general form of the fully characteristic model is represented by truncated normal distribution (Schwartz and Coppersmith, 1984). Truncation is done according to the standard deviation in magnitude – rupture area relation as shown in Figure 3.7 (Ocak, 2011)
Composite models combine the truncated exponential model and the characteristic model. The earthquakes whose sizes are small represented with the truncated exponential model whereas the earthquakes whose sizes are large represented with characteristic model in Composite Model. Equations 3.4 and 3.5 shows that 94% of seismic moment is released by the characteristic earthquakes whereas the rest of the total seismic moment is released by the smaller size earthquakes due to the constraints of the distribution equation.

1
β exp
1 e
In these eq
β exp
1 e
Figure 3.7n
This study events for exponentiafrequency obtained frwhen the rerecurrencesomewhat recover the
β exp
exp β M
β Mmax
exp β Mm
quations;
β Mmax
exp β Mm
7 Magnitude normal (char
selects com1944 Bolu-
al or composof smaller mrom analysisegional b-va rate obtainedifferent b-v
e observed
β Mw Mm
Mmax ∆M
∆M ∆M
max ∆M
∆M ∆M
max ∆M
∆M
distribution facteristic) an
posite mode-Gerede Earsite model remagnitude evs of the regilue is used fed by combivalue due toregional b-v
37
in
Mminx
Mmin
Mminx
Mmin
Mminx
M 1.0,
functions usend composite
el to represenrthquake Ruequires specvents. In theional seismicfor fault specning recurre
o varying mavalue, a som
7
11 c
,
11 c
,
∆M
∆M 0.5
ed in PSHA, e models (Y&
nt the relativeupture Zonecification of e absence ocity is usualcific recurrenence estimateaximum mag
mewhat smal
truncated ex&C (1985) (O
e rates of diff. Applicationa b-value in
of fault specly used (Occe models, tes for all thegnitudes of dler b-value s
0.5∆ 2
0.5∆ 2
xponential, trOcak, 2011)
ferent size mn of either tn order to dcific data, thecak, 2011). Hthe predictede sources wdifferent soushould be us
3.4
3.5
runcated
magnitude truncated efine the e b-value However, d regional ill have a urces. To sed on a

fault specifbe used wi
To calculatfiltration ofwhole TurkObservator(2010). Kalb-value is calculated Kalafat (20given in Ta
Table 3.4 D
fic basis withth the charac
te the b-valuf the foreshokey, the Integry and Earthlafat (2010) sas 1.00 – specifically
010) is compable 3.4. Spa
Distribution o
Figure 3.8
M
h truncated ecteristic mod
e for the regocks, aftershgrated Homohquake Resesearched the1.25 for diffor the studosed of 166
atial distributio
of magnitudes
8 Spatial dist
≥ 4 - < 4.5
≥ 4.5 - < 5.
≥ 5.0 - < 5.
≥ 5.5 - < 6.
≥ 6.0 - < 6.
≥ 6.5 - < 7
≥ 7.0
TOTAL
MAGNITUDE
38
exponential mdel.
gion, using ohocks and eogeneous Tuearch Centere time periodfferent regiody area. Thevents with on of the eve
s of the earth
ribution of th
5
.0
5
.0
.5
7.0
# OBIN
8
model and a
of the earthquexplosions tourkey Earthqur (Boğaziçi Ud of 1900-20ons of Turkee remainingmoment ma
ents in Table
hquakes with
he earthquak
10
OF EARTHQ
166
78
46
26
2
2
2
somewhat l
uake catalogo represent uake CatalogUniversity) is10 (110 yearey. In this sg database aagnitudes bete 3.4 is prese
hin the catalo
es in the stu
QUAKES
larger b-valu
g is a necessthe seismicig provided bs prepared brs) and calcustudy, the bafter declustween 4.0 an
ented in Figu
og in the stud
dy area.
ue should
sity. After ity of the y Kandilli
by Kalafat ulated the b-value is tering by nd 7.5 as
ure 3.8.
dy area

Aki (1965) given in eq
1β
M M
Where M iscomplete. the variabi(Weichert, magnitude
MΣM RΣR
RNT
In these eqrepresenteeach magnrepresentesummarizinAccording value of thstudies in tused by ErMarmara w
M
4
4
5
5
6
7
In order to recurrence0.5, 0.6, 0vicinity of Y3.9 indicatehigh hazar
proposed thuation 3.6:
M
s the averagIn this studylity of the co1980). The bins:
quations, thed by M , ratenitude bin isd by T whng of the reto this study
he recurrencthe literaturerdik et al., 20were 0.80, 0.7
Table 3.5 Ma
M1 M
4.0 4.
4.5 5.
5.0 5.
5.5 6.
6 6.
6.5 7.
7.0 7.
evaluate the model, a se.7, 0.8, 0.9, Yeniçağa-Abes that the hrd levels. Yo
he basic max
ge magnitudey, the modifieompleteness
average m
e average mae for each ins represente
hich the catasults of the y, β paramee parameter
e are in cons004, Kalkan e72, and 0.69
aximum likel
2 Mi
5 4.25
0 4.75
5 5.25
0 5.75
5 6.25
0 6.75
5 7.25
SU
Mo
e contributionensitivity ana1.0. PSHA ant Segmen
hazard resultoungs and C
39
ximum likelih
e and M is ed maximums in the cata
magnitude (M
agnitude of enterval is reped N and talogue is amaximum li
eter equals tr, calculatedsistent with tet al., 2009,
9, respectivel
ihood estima
Ni
5 78
5 46
5 26
5 10
5 2
5 2
5 2
UM =
=
o =
n of the variaalysis is perare conduct
nt), and hazats are insensCoppersmith
9
ood method
the lowest mm likelihood malog for the M) is found b
each magnitpresented bythe time inte
assumed to ikelihood meto 1.38 lead as 0.60. Ththe value esand Crowleyy.
ation of the re
TimeInterv
110
110
110
110
110
110
110
ability in the rformed by ated for Bolu
ard curves arsitive to the
(1985) exp
to estimate
magnitude atmethod whicdifferent maby consideri
tude bin (eg.y R , the numerval for eabe complet
ethod analysing to b parhe b-value utimated in thy and Bomm
ecurrence pa
e al Ri
0.71
0.42
0.24
0.09
0.02
0.02
0.02
1.5
b value for carbitrarily choCity Centre
re comparedchanges in blains the ch
the b-value,
t which the cch takes intoagnitude binsing the rate
. 4-4.5, 4.5–5mber of evench magnitudte. Table 3.sis in a taburameter, whiused by the his study, the
mer (2006) fo
arameter b
Mi * R
1 3.0
2 2.0
4 1.2
9 0.5
2 0.1
2 0.1
2 0.1
5 7.1
4.7
4.0
composite mosing the b
e (located in in Figure 3.b value espe
hanges in b
, which is
3.6
catalog is o account s is used s for the
3.7
3.8
5.0 …) is nts within de bin is 5 shows
ular form. ch is the previous
e b-value or eastern
Ri
magnitude value as the near 9. Figure
ecially for value as

40
follows; “The changes in the b-value have an insignificant effect on the recurrence relation but the function is more sensitive to the changes in upper bound magnitude”. The magnitude distribution function for each source is bounded with a minimum magnitude considering the engineering interest. The minimum magnitude is set to magnitude 4.5 for all sources considering the historical seismicity of the source. The upper bound for the magnitude distribution functions is calculated by adding 0.25 to the characteristic magnitude for each source (Youngs and Coppersmith, 1985).
Figure 3.9 Hazard Curves for Bolu City Centre for different b values
3.3 Fault Rupture Model
Two types of sources can be defined in PSHA; areal sources and linear sources. Areal sources are based on the historical seismicity and these type of sources are used commonly in regions with unknown faults. Linear and multi-planar fault sources can be defined in the regions where trustable tectonic information on the fault geometry is available. Within the contents of this study, the definitions of USGS Working Group for Earthquake Probabilities (2003) (USGS_WG (2003)) are adopted for the first time for 1944 Bolu-Gerede earthquake rupture zone. The shortest fault capable of rupture to produce large earthquakes repeatedly defined as a segment by USGS_WG (2003). Three non-overlapping segments are defined above for 1944 Bolu-Gerede earthquake rupture zone. Furthermore, fault segment or a combination of multiple adjacent fault segments that are possible to rupture and produce an earthquake in the future defined as source by USGS_WG (2003). These three segments are combined into six different rupture sources such as;
a. Fault segments rupturing individually (Source 1,2 and 3 in Figure 3.10b), b. Combined rupture of two adjacent segments (Source 4 and 5 in Figure 3.10b) c. Combined rupture of three adjacent segments (Source 6 in Figure 3.10b).
A scenario is defined as any possible combination of sources that describes a possible failure mode. Rupture scenario covers the decision of assigning either a single or a set of faults to be involved in rupture. Six rupture sources creates four rupture scenarios as:
0.0001
0.0010
0.0100
0.1000
1.0000
0 0.05 0.1 0.15 0.2 0.25 0.3 0.35 0.4
Ann
ual F
requ
ency
of E
xcee
denc
e
Acceleration (g)
b=0.50 b=0.60 b=0.70
b=0.80 b=0.90 b=1.00
MEAN
BOLU CITY CENTRE

1) Ru(Fi
2) Ru(Se
3) Ru(Se
4) Ru
The weighdefined assource is vscenarios g3.6. The ssources tha
upture of thegure 3.10c)
upture of theegment 1+2,upture of thegment-1, Seupture of the
hted combinas a rupture vital to assiggenerated fo
sources that at did not rup
Figure 3.10
e three segm
e first two Segment-3)e last two egment 2+3)three segme
ation of all model. Pre
gn the weigor 1944 Bolu
ruptured in pture are den
0 Illustration o
41
ments indivi
segments t) (Figure 3.10segments t
) (Figure 3.10ents together
possible scecise knowlehts to each u-Gerede ea a particulanoted by 0 in
of the segme
1
idually (Seg
together and0c) together wit0c) r (Segment 1
cenarios proedge on the
scenario. Tarthquake rupr rupture sc
n Table 3.6.
ent, source a
ment-1, Seg
d the third
th the first
+2+3)(Figur
duced from historical se
The seismic pture zone is
cenario is de
and scenario
gment-2, Se
segment s
segment s
re 3.10c)
the seismieismic activisources ands presentedenoted by 1
concepts
egment-3)
eparately
eparately
c source ity of the d rupture in Table
and the
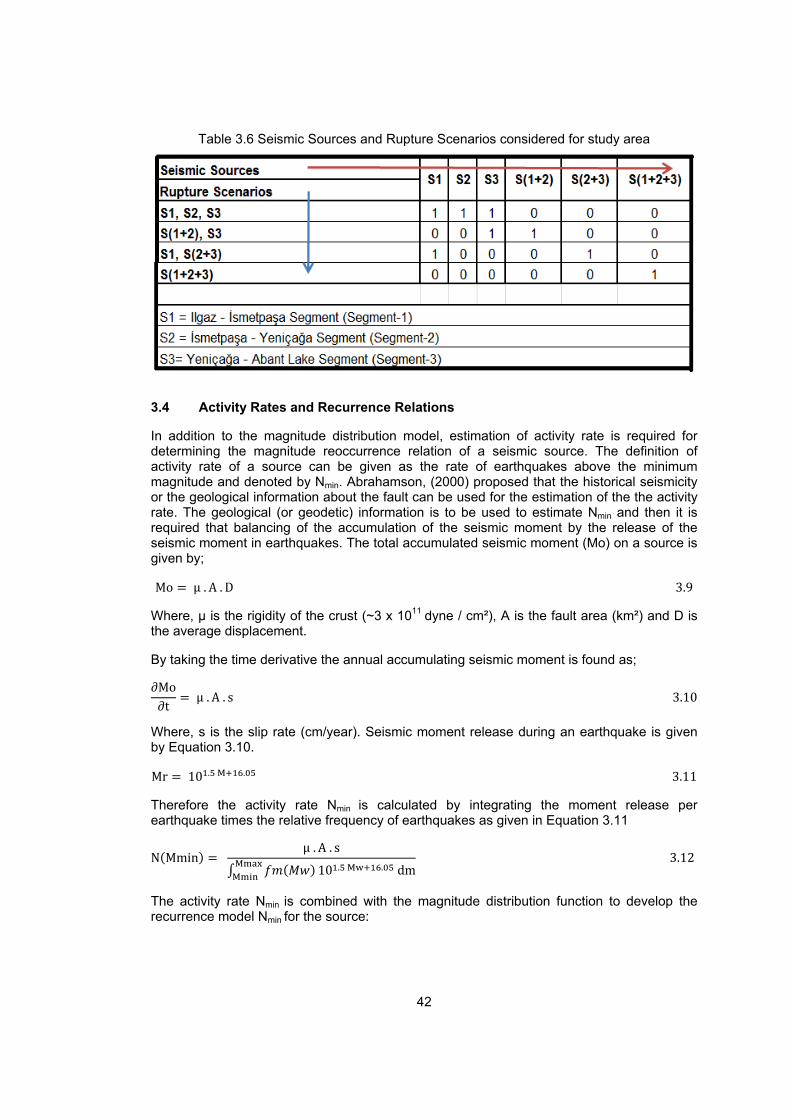
42
Table 3.6 Seismic Sources and Rupture Scenarios considered for study area
3.4 Activity Rates and Recurrence Relations
In addition to the magnitude distribution model, estimation of activity rate is required for determining the magnitude reoccurrence relation of a seismic source. The definition of activity rate of a source can be given as the rate of earthquakes above the minimum magnitude and denoted by Nmin. Abrahamson, (2000) proposed that the historical seismicity or the geological information about the fault can be used for the estimation of the the activity rate. The geological (or geodetic) information is to be used to estimate Nmin and then it is required that balancing of the accumulation of the seismic moment by the release of the seismic moment in earthquakes. The total accumulated seismic moment (Mo) on a source is given by;
Mo μ. A. D3.9
Where, µ is the rigidity of the crust (~3 x 10¹¹ dyne / cm²), A is the fault area (km²) and D is the average displacement.
By taking the time derivative the annual accumulating seismic moment is found as;
∂Mo∂t
μ. A. s3.10
Where, s is the slip rate (cm/year). Seismic moment release during an earthquake is given by Equation 3.10.
Mr 10 . . 3.11
Therefore the activity rate Nmin is calculated by integrating the moment release per earthquake times the relative frequency of earthquakes as given in Equation 3.11
N Mmin μ. A. s
10 . . dm3.12
The activity rate Nmin is combined with the magnitude distribution function to develop the recurrence model Nmin for the source:
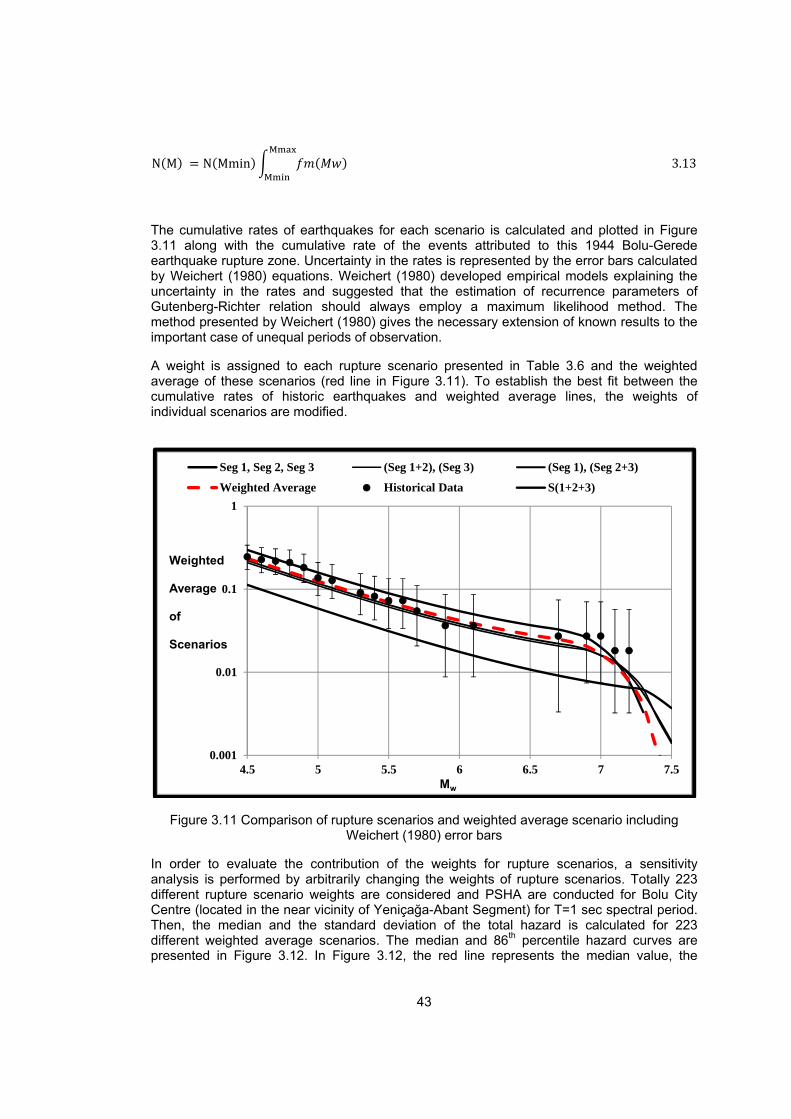
43
N M N Mmin 3.13
The cumulative rates of earthquakes for each scenario is calculated and plotted in Figure 3.11 along with the cumulative rate of the events attributed to this 1944 Bolu-Gerede earthquake rupture zone. Uncertainty in the rates is represented by the error bars calculated by Weichert (1980) equations. Weichert (1980) developed empirical models explaining the uncertainty in the rates and suggested that the estimation of recurrence parameters of Gutenberg-Richter relation should always employ a maximum likelihood method. The method presented by Weichert (1980) gives the necessary extension of known results to the important case of unequal periods of observation.
A weight is assigned to each rupture scenario presented in Table 3.6 and the weighted average of these scenarios (red line in Figure 3.11). To establish the best fit between the cumulative rates of historic earthquakes and weighted average lines, the weights of individual scenarios are modified.
Figure 3.11 Comparison of rupture scenarios and weighted average scenario including Weichert (1980) error bars
In order to evaluate the contribution of the weights for rupture scenarios, a sensitivity analysis is performed by arbitrarily changing the weights of rupture scenarios. Totally 223 different rupture scenario weights are considered and PSHA are conducted for Bolu City Centre (located in the near vicinity of Yeniçağa-Abant Segment) for T=1 sec spectral period. Then, the median and the standard deviation of the total hazard is calculated for 223 different weighted average scenarios. The median and 86th percentile hazard curves are presented in Figure 3.12. In Figure 3.12, the red line represents the median value, the
0.001
0.01
0.1
1
4.5 5 5.5 6 6.5 7 7.5
Seg 1, Seg 2, Seg 3 (Seg 1+2), (Seg 3) (Seg 1), (Seg 2+3)
Weighted Average Historical Data S(1+2+3)
Mw
Weighted
Average
of
Scenarios
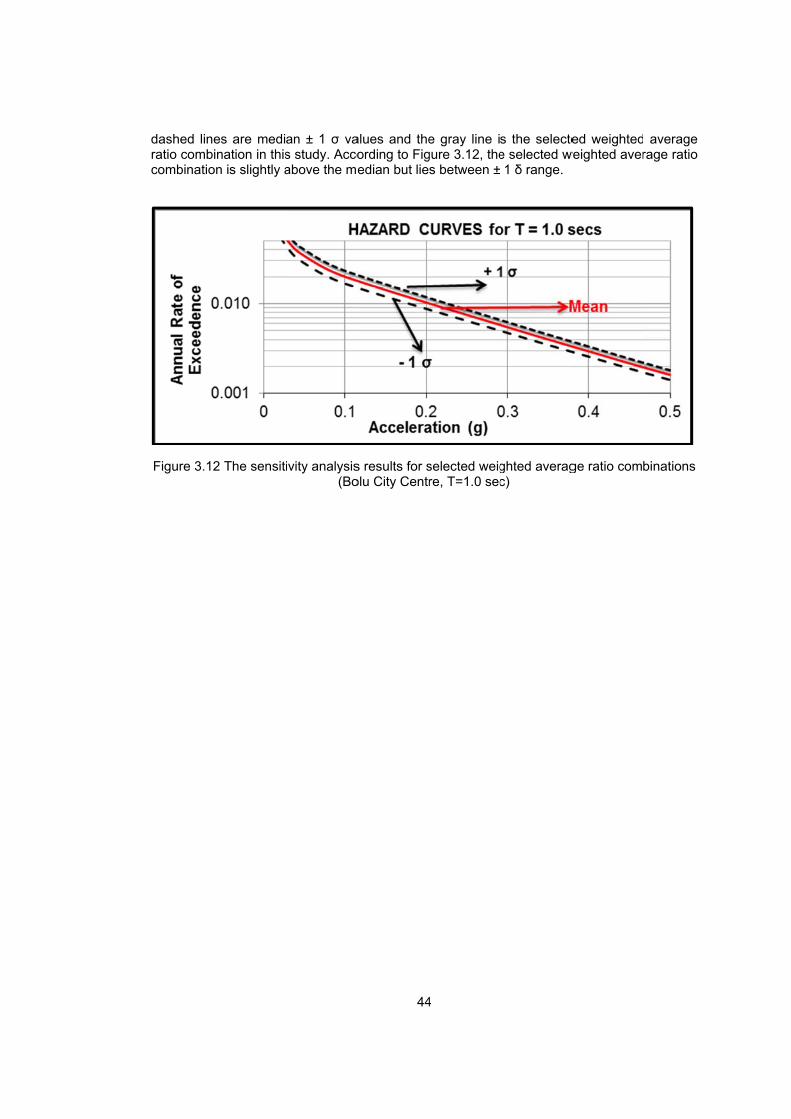
dashed lineratio combicombinatio
Figure 3.12
es are mediination in this
on is slightly a
2 The sensit
an ± 1 σ vas study. Accoabove the me
ivity analysis(Bo
44
alues and theording to Figedian but lie
s results for solu City Centr
4
e gray line igure 3.12, thes between ±
selected weigre, T=1.0 sec
s the selectee selected w1 δ range.
ghted averagc)
ed weightedweighted aver
ge ratio com
average rage ratio
binations


45
CHAPTER 4
PROBABILISTIC SEISMIC HAZARD ASSESSMENT METHODOLOGY AND RESULTS
The seismic source models to be used in probabilistic seismic hazard assessment (PSHA) were developed for the fault zones in study area and presented in Chapter 3. The activity rates, magnitude distribution functions, reoccurrence models and activity rates from the seismic source models were connected in hazard assessment analyses. Within the contents of this chapter, the probabilistic seismic hazard assessment methodology used for this study is summarized in terms of the hazard integral and its main ingredients. The selected ground motion prediction models and the evaluated hazard code are explained. The hazard curves, deaggregation of the hazard and uniform hazard spectrum for four selected sites in the region are offered. Acceptable hazard levels in Turkish Earthquake Code (TEC-2007) are presented and the uniform hazard spectra for selected four sites at rock and soil site conditions are compared to the TEC-2007 requirements. Hazard maps developed for rock and soil site conditions for PGA, T=0.2 and T=1 second spectral accelerations are offered. The rock classification map proposed in Chapter 2 is interconnected with the PSHA results and a site specific hazard map is given for future reference. The results provided in this chapter are discussed sufficiently in Chapter 5.
4.1 Probabilistic Seismic Hazard Assessment Methodology
The basic methodology of probabilistic seismic hazard analysis (PHSA) (Cornell 1968 and McGuire 2004 approach) requires the computation of how often a specific level of ground motion will be exceeded at the site. In other words, in a PSHA, the annual rate of events that produce a ground motion intensity measure, IM that exceeds a specified level, L, at the site is computed. This annual rate, , is also called the “annual rate of exceedence”. Traditionally, the equation for a seismic hazard analysis due to a single source has been given by:
4.1
where the distance from the source to site is the R, earthquake magnitude M is the; the annual rate of earthquakes with magnitude bigger than or equal to the minimum magnitude is the Nmin, the probability density functions for the magnitude and distance are fM(M) and fR(M,R) and the probability of beholding a ground motion greater than L for a given earthquake magnitude and distance is the P(IM>L│M,R).
Gülerce and Abrahamson (2010) explained that the probabilistic seismic hazard analysis comprises of identifying a set of earthquake scenarios, forecasting the range of ground motions for each earthquake scenario, and calculating the rate of each combination of earthquake scenario and ground motion. Each scenario is identified by the size of the earthquake (magnitude, M) and the location which defines the distance, R, from the site. The ground motion variability is contained in the P(IM>L│M,R) term such as:
dRMLIMPfRMLIMP ),,|()(),|( 4.2
dRdMRMLIMPRMfMfNLIM R
M R
M ),(),()()( min
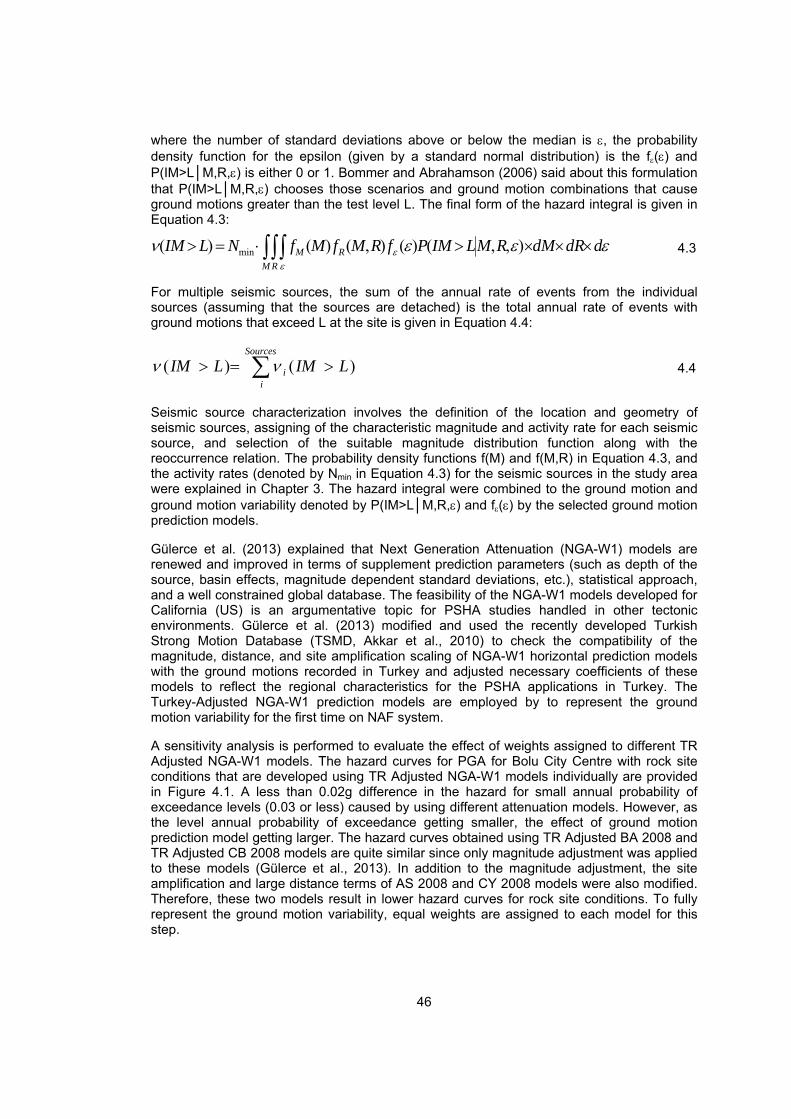
46
where the number of standard deviations above or below the median is , the probability density function for the epsilon (given by a standard normal distribution) is the f() and P(IM>L│M,R,) is either 0 or 1. Bommer and Abrahamson (2006) said about this formulation that P(IM>L│M,R,) chooses those scenarios and ground motion combinations that cause ground motions greater than the test level L. The final form of the hazard integral is given in Equation 4.3:
4.3
For multiple seismic sources, the sum of the annual rate of events from the individual sources (assuming that the sources are detached) is the total annual rate of events with ground motions that exceed L at the site is given in Equation 4.4:
Sources
ii LIMLIM )()( 4.4
Seismic source characterization involves the definition of the location and geometry of seismic sources, assigning of the characteristic magnitude and activity rate for each seismic source, and selection of the suitable magnitude distribution function along with the reoccurrence relation. The probability density functions f(M) and f(M,R) in Equation 4.3, and the activity rates (denoted by Nmin in Equation 4.3) for the seismic sources in the study area were explained in Chapter 3. The hazard integral were combined to the ground motion and ground motion variability denoted by P(IM>L│M,R,) and f() by the selected ground motion prediction models.
Gülerce et al. (2013) explained that Next Generation Attenuation (NGA-W1) models are renewed and improved in terms of supplement prediction parameters (such as depth of the source, basin effects, magnitude dependent standard deviations, etc.), statistical approach, and a well constrained global database. The feasibility of the NGA-W1 models developed for California (US) is an argumentative topic for PSHA studies handled in other tectonic environments. Gülerce et al. (2013) modified and used the recently developed Turkish Strong Motion Database (TSMD, Akkar et al., 2010) to check the compatibility of the magnitude, distance, and site amplification scaling of NGA-W1 horizontal prediction models with the ground motions recorded in Turkey and adjusted necessary coefficients of these models to reflect the regional characteristics for the PSHA applications in Turkey. The Turkey-Adjusted NGA-W1 prediction models are employed by to represent the ground motion variability for the first time on NAF system.
A sensitivity analysis is performed to evaluate the effect of weights assigned to different TR Adjusted NGA-W1 models. The hazard curves for PGA for Bolu City Centre with rock site conditions that are developed using TR Adjusted NGA-W1 models individually are provided in Figure 4.1. A less than 0.02g difference in the hazard for small annual probability of exceedance levels (0.03 or less) caused by using different attenuation models. However, as the level annual probability of exceedance getting smaller, the effect of ground motion prediction model getting larger. The hazard curves obtained using TR Adjusted BA 2008 and TR Adjusted CB 2008 models are quite similar since only magnitude adjustment was applied to these models (Gülerce et al., 2013). In addition to the magnitude adjustment, the site amplification and large distance terms of AS 2008 and CY 2008 models were also modified. Therefore, these two models result in lower hazard curves for rock site conditions. To fully represent the ground motion variability, equal weights are assigned to each model for this step.
M R
RM ddRdMRMLIMPfRMfMfNLIM
),,()(),()()( min
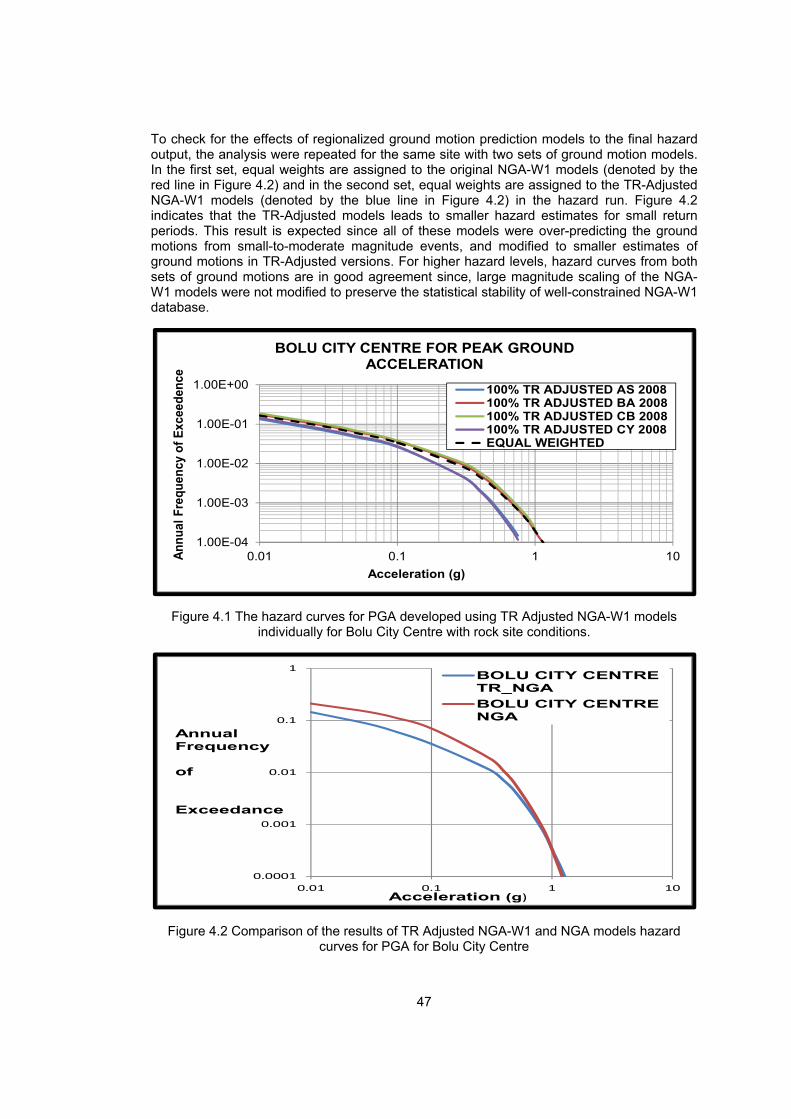
47
To check for the effects of regionalized ground motion prediction models to the final hazard output, the analysis were repeated for the same site with two sets of ground motion models. In the first set, equal weights are assigned to the original NGA-W1 models (denoted by the red line in Figure 4.2) and in the second set, equal weights are assigned to the TR-Adjusted NGA-W1 models (denoted by the blue line in Figure 4.2) in the hazard run. Figure 4.2 indicates that the TR-Adjusted models leads to smaller hazard estimates for small return periods. This result is expected since all of these models were over-predicting the ground motions from small-to-moderate magnitude events, and modified to smaller estimates of ground motions in TR-Adjusted versions. For higher hazard levels, hazard curves from both sets of ground motions are in good agreement since, large magnitude scaling of the NGA-W1 models were not modified to preserve the statistical stability of well-constrained NGA-W1 database.
Figure 4.1 The hazard curves for PGA developed using TR Adjusted NGA-W1 models individually for Bolu City Centre with rock site conditions.
Figure 4.2 Comparison of the results of TR Adjusted NGA-W1 and NGA models hazard curves for PGA for Bolu City Centre
1.00E-04
1.00E-03
1.00E-02
1.00E-01
1.00E+00
0.01 0.1 1 10An
nu
al F
requ
ency
of
Exc
eed
ence
Acceleration (g)
BOLU CITY CENTRE FOR PEAK GROUND ACCELERATION
100% TR ADJUSTED AS 2008100% TR ADJUSTED BA 2008100% TR ADJUSTED CB 2008100% TR ADJUSTED CY 2008EQUAL WEIGHTED
0.0001
0.001
0.01
0.1
1
0.01 0.1 1 10
BOLU CITY CENTRETR_NGA
BOLU CITY CENTRENGA
Acceleration (g)
AnnualFrequency
of
Exceedance
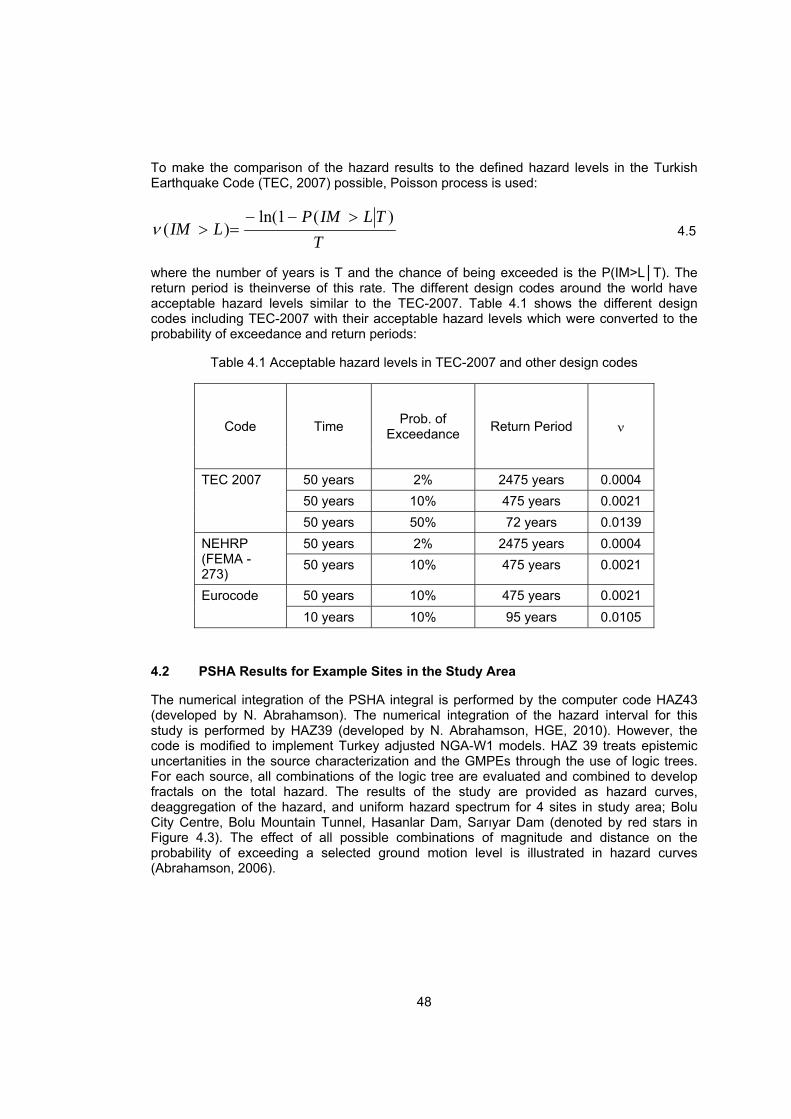
48
To make the comparison of the hazard results to the defined hazard levels in the Turkish Earthquake Code (TEC, 2007) possible, Poisson process is used:
T
TLIMPLIM
)(1ln()(
4.5
where the number of years is T and the chance of being exceeded is the P(IM>L│T). The return period is theinverse of this rate. The different design codes around the world have acceptable hazard levels similar to the TEC-2007. Table 4.1 shows the different design codes including TEC-2007 with their acceptable hazard levels which were converted to the probability of exceedance and return periods:
Table 4.1 Acceptable hazard levels in TEC-2007 and other design codes
Code Time Prob. of
Exceedance Return Period
TEC 2007 50 years 2% 2475 years 0.0004
50 years 10% 475 years 0.0021
50 years 50% 72 years 0.0139
NEHRP (FEMA - 273)
50 years 2% 2475 years 0.0004
50 years 10% 475 years 0.0021
Eurocode 50 years 10% 475 years 0.0021
10 years 10% 95 years 0.0105
4.2 PSHA Results for Example Sites in the Study Area
The numerical integration of the PSHA integral is performed by the computer code HAZ43 (developed by N. Abrahamson). The numerical integration of the hazard interval for this study is performed by HAZ39 (developed by N. Abrahamson, HGE, 2010). However, the code is modified to implement Turkey adjusted NGA-W1 models. HAZ 39 treats epistemic uncertanities in the source characterization and the GMPEs through the use of logic trees. For each source, all combinations of the logic tree are evaluated and combined to develop fractals on the total hazard. The results of the study are provided as hazard curves, deaggregation of the hazard, and uniform hazard spectrum for 4 sites in study area; Bolu City Centre, Bolu Mountain Tunnel, Hasanlar Dam, Sarıyar Dam (denoted by red stars in Figure 4.3). The effect of all possible combinations of magnitude and distance on the probability of exceeding a selected ground motion level is illustrated in hazard curves (Abrahamson, 2006).

The analysT=0.075, TT=6, T=6.5chosen spe(Vs30 = 270
Figure 4
ses are perfT=0.1, T=0.2,5, T=7, T=7.ectral period
0 m/s) are pr
Figure
4.3 The four l
formed for P, T=0.5, T=1.5, and T=10
ds assuming resented in F
4.4 Hazard
49
locations wh
PGA and 22, T=1.5, T=20 seconds) rock site co
Figure 4.4 to
Curves for T
9
ere the analy
2 spectral p2, T=2.5, T=3and hazard
onditions (Vs3
Figure 4.21.
T = 0 second
ysis are perfo
eriods (T=0.3, T=3.5, T=4
curves at f30 = 760 m/s
, (Vs30 = 760
formed
.01, T=0.03,4, T=4.5, T=four selecteds) and soil c
m/s)
, T=0.05, =5, T=5.5, d sites at conditions

Figure 4
Figure 4
Figure 4
4.5 Hazard C
.6 Hazard C
.7 Hazard C
50
Curves for T
Curves for T =
Curves for T =
0
= 0 second,
= 0.05 secon
= 0.05 secon
(Vs30 = 270
d, (Vs30 = 76
d, (Vs30 = 27
0 m/s)
60 m/s)
70 m/s)
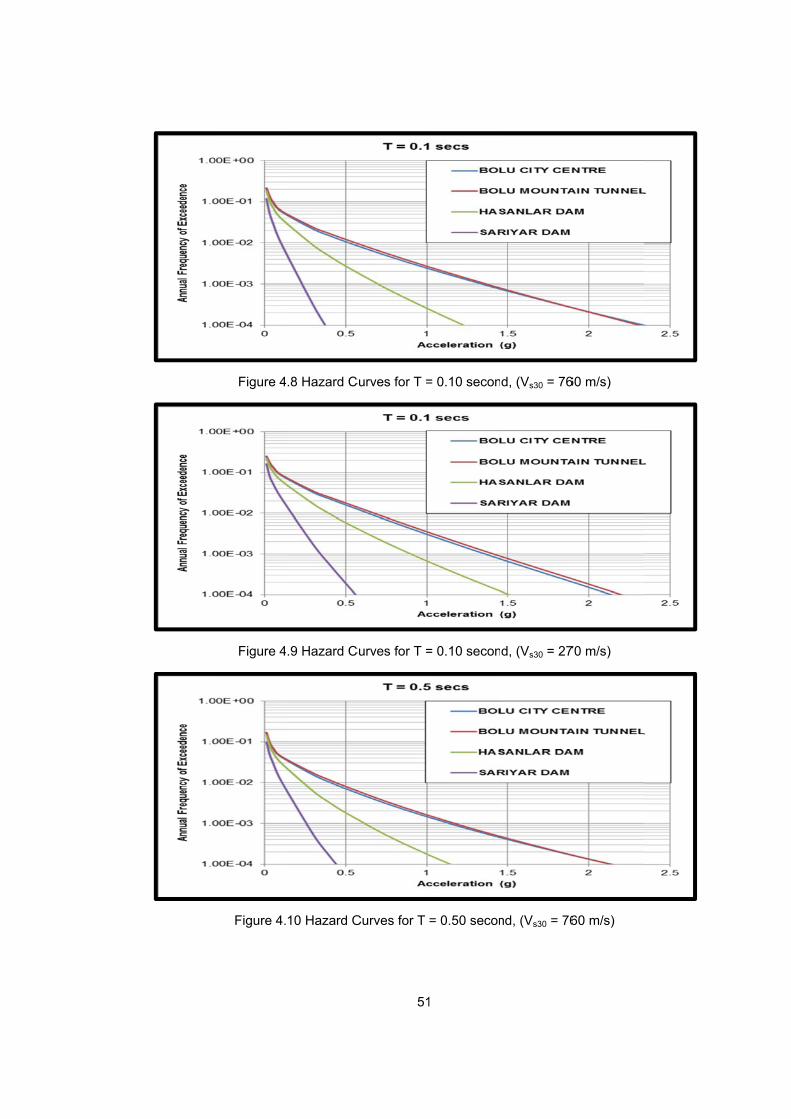
Figure 4
Figure 4
Figure 4.
.8 Hazard C
.9 Hazard C
10 Hazard C
51
Curves for T =
Curves for T =
Curves for T
1
= 0.10 secon
= 0.10 secon
= 0.50 secon
d, (Vs30 = 76
d, (Vs30 = 27
nd, (Vs30 = 76
60 m/s)
70 m/s)
60 m/s)

Figure 4.
Figure 4.1
Figure 4.1
11 Hazard C
12 Hazard C
13 Hazard C
52
Curves for T
urves for T =
urves for T =
2
= 0.50 secon
= 1.00 secon
= 1.00 secon
nd, (Vs30 = 27
d, (Vs30 = 7
d, (Vs30 = 2
70 m/s)
760 m/s)
270 m/s)

Figure 4.1
Figure 4.1
Figure 4.1
14 Hazard C
15 Hazard C
16 Hazard C
53
urves for T =
urves for T =
urves for T =
3
= 3.00 secon
= 3.00 secon
= 5.00 secon
d, (Vs30 = 7
d, (Vs30 = 2
d, (Vs30 = 7
760 m/s)
270 m/s)
760 m/s)

Figure 4.1
Figure 4.
Figure 4.
17 Hazard C
18 Hazard C
19 Hazard C
54
urves for T =
Curves for T
Curves for T
4
= 5.00 secon
= 7.5 second
= 7.5 second
d, (Vs30 = 2
d, (Vs30 = 76
d, (Vs30 = 27
270 m/s)
60 m/s)
70 m/s)
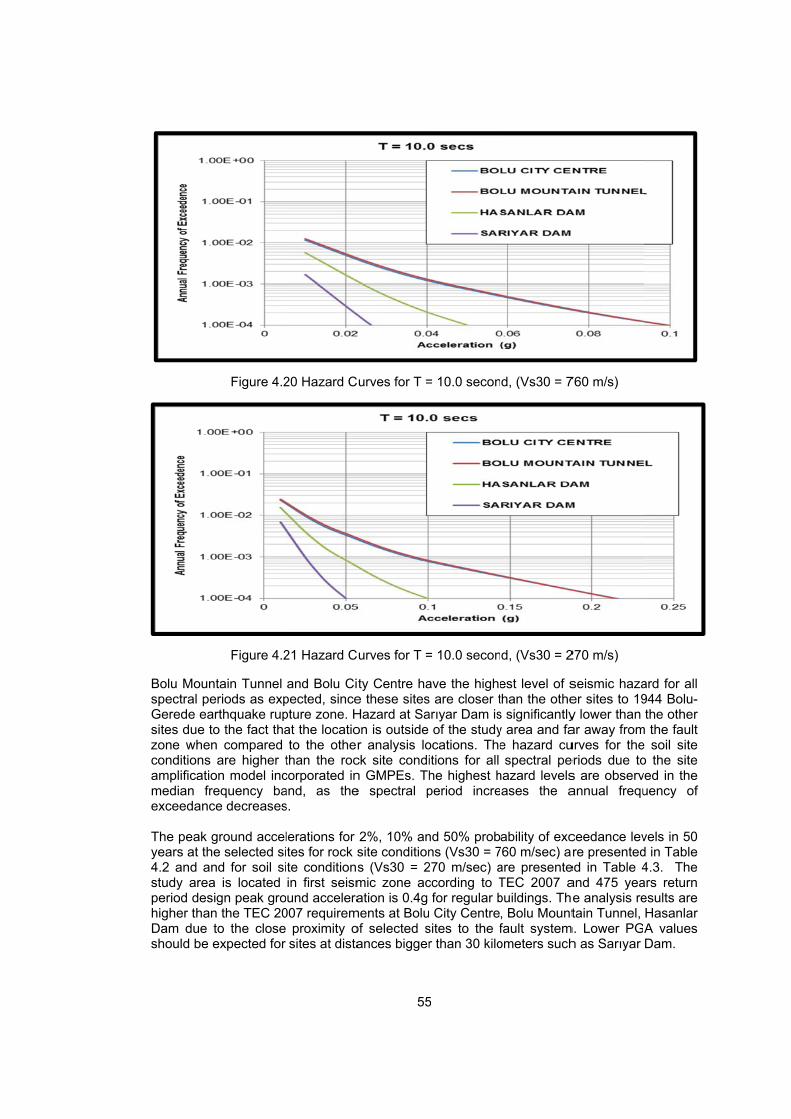
Bolu Mounspectral peGerede easites due tozone whenconditions amplificatiomedian freexceedanc The peak gyears at the4.2 and anstudy areaperiod desihigher thanDam due tshould be e
Figure 4.2
Figure 4.2
ntain Tunnel eriods as exprthquake rupo the fact than compared are higher t
on model incequency ba
ce decreases
ground accele selected sind for soil sia is located ign peak gron the TEC 20to the closeexpected for
20 Hazard C
21 Hazard C
and Bolu Cipected, sincepture zone. Hat the locatioto the other
than the roccorporated inand, as thes.
lerations for tes for rock ste conditionsin first seism
ound accelera007 requirem
proximity osites at dista
55
urves for T =
urves for T =
ty Centre hae these sitesHazard at Saon is outside r analysis lo
ck site condin GMPEs. The spectral p
2%, 10% ansite conditions (Vs30 = 2mic zone acation is 0.4g
ments at Boluof selected sances bigger
5
= 10.0 secon
= 10.0 secon
ave the highes are closer tarıyar Dam is
of the studyocations. Theitions for all he highest hperiod incre
nd 50% probns (Vs30 = 7
270 m/sec) according to Tfor regular b City Centre
sites to the fr than 30 kilo
d, (Vs30 = 7
d, (Vs30 = 2
est level of sthan the othes significantlyy area and fae hazard cuspectral pe
hazard levelsases the a
ability of exc760 m/sec) aare presenteTEC 2007 abuildings. Th, Bolu Mountfault systemometers such
760 m/s)
270 m/s)
seismic hazaer sites to 19y lower than ar away fromurves for theeriods due tos are observannual frequ
ceedance levre presented
ed in Table 4and 475 yeae analysis retain Tunnel,
m. Lower PGh as Sarıyar
ard for all 944 Bolu-the other
m the fault e soil site o the site ved in the uency of
vels in 50 d in Table 4.3. The ars return esults are Hasanlar A values Dam.

Table 4
Table 4
Gülerce anon the procurve. It isbecause alCornell (19scenarios tground moshows the years at the
Figur
4.2 PGA for d
Hazard Le
2% in 50 ye
10% in 50 y
50% in 50 y
4.3 PGA for
Hazard Le
2% in 50 ye
10% in 50 y
50% in 50 y
nd Abrahamsobability of es hard to reall of the sour999) brake dto obtain a tion level. Thdeaggregat
e selected fo
re 4.22 Deag
different exce
evel BoluCen
ears 0.8
years 0.5
years 0.2
different exc
evel BoluCen
ears 1.0
years 0.6
years 0.3
son (2010) saexceeding thalize what isces, magnituown the hazsense into whey called thtion plots forour sites for r
ggregation fo(V
56
eedance lev
u City ntre
Bolu
850
550
225
ceedance lev
u City ntre
Bolu
000
675
300
aid that the mhe specified s controllingudes, and diszard curve inwhich eventshis operationr 2%, 10%, rock site con
r Bolu City CVs30 = 760 m
6
els at four lo
u Mountain Tunnel
0.850
0.600
0.250
vels at four lo
u Mountain Tunnel
1.000
0.700
0.310
merged effecground mot the hazardstances are nto its contribs are most cas deaggreg50% probabditions at PG
Centre for 2%m/sec, PGA)
cations at ro
Hasanlar Dam
0.450
0.270
0.110
ocations at so
Hasanlar Dam
0.700
0.450
0.200
ct of all magnion level is from the ha
combined tobutions fromcritical for thgation. Figurbility of exce
GA.
% of exceeda
ock site cond
Sarıyar Dam
0.160
0.100
0.050
oil site condi
Sarıyar Dam
0.260
0.200
0.075
nitudes and dgiven by thazard curve
ogether. Bazzm different eahe hazard are 4.22 to Figeedance lev
ance in 50 ye
itions
tions
distances e hazard by itself zurro and arthquake t a given gure 4.33 els in 50
ears

Figure 4
Figure 4
Figure 4.2
4.23 Deaggre
4.24 Deaggre
5 Deaggrega
egation for Boyears haza
egation for Boyears haza
ation for Boluyears haza
57
olu City Cenard level (Vs3
olu City Cenard level (Vs3
u Mountain Tard level (Vs3
7
tre for 10% p30 = 760 m/s
tre for 50% p30 = 760 m/s
Tunnel for 2%30 = 760 m/s
probability ofsec, PGA)
probability ofsec, PGA)
% probability sec, PGA)
f exceedance
f exceedance
of exceedan
e in 50
e in 50
nce in 50
Figure 4.2
Figure 4.2
Figure 4.2
26 Deaggreg5
27 Deaggreg5
28 Deaggreg
gation for Bo50 years haz
gation for Bo50 years haz
gation for Hashazard l
58
lu Mountain zard level (Vs
lu Mountain zard level (Vs
sanlar Dam flevel (Vs30 =
8
Tunnel for 1s30 = 760 m
Tunnel for 5s30 = 760 m
for 2% proba= 760 m/sec,
0% probabili/sec, PGA)
0% probabili/sec, PGA)
ability of exce PGA)
ity of exceed
ity of exceed
eedance in 5
dance in
dance in
50 years
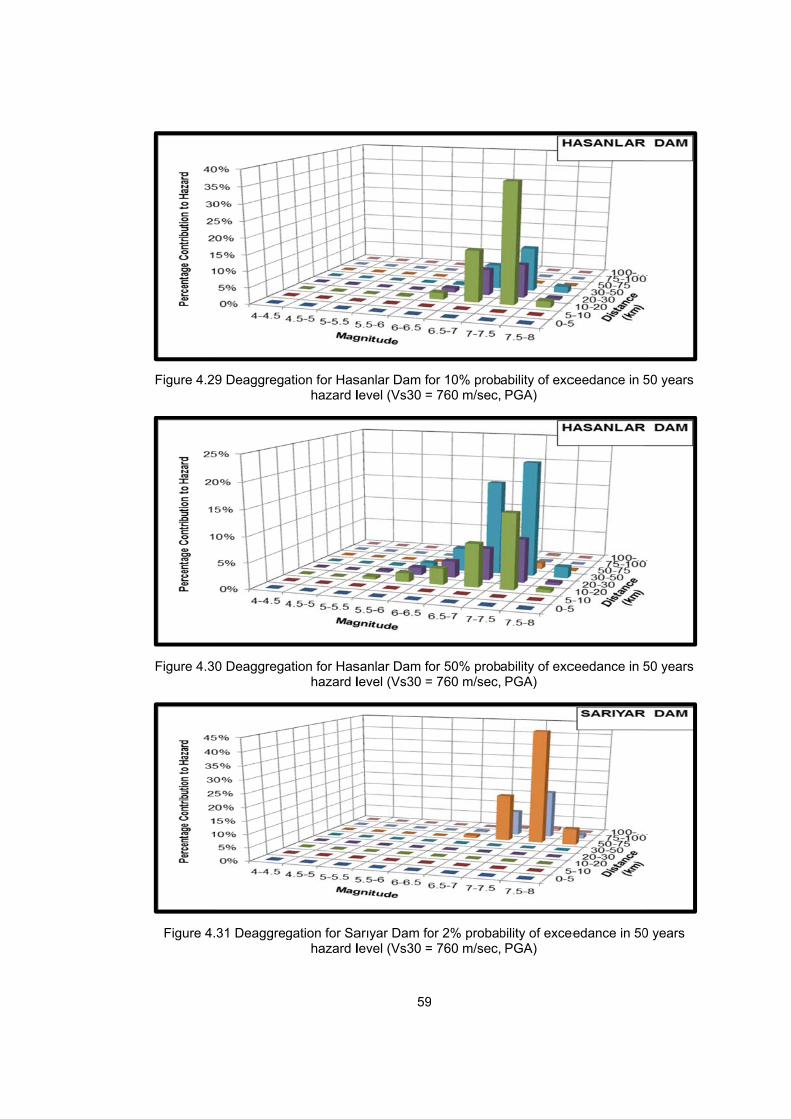
Figure 4.2
Figure 4.3
Figure 4.
9 Deaggrega
0 Deaggrega
.31 Deaggre
ation for Hashazard l
ation for Hashazard l
gation for Sahazard l
59
sanlar Dam folevel (Vs30 =
sanlar Dam folevel (Vs30 =
arıyar Dam folevel (Vs30 =
9
or 10% prob= 760 m/sec,
or 50% prob= 760 m/sec,
or 2% probab= 760 m/sec,
ability of exc PGA)
ability of exc PGA)
bility of exce PGA)
ceedance in
ceedance in
eedance in 50
50 years
50 years
0 years
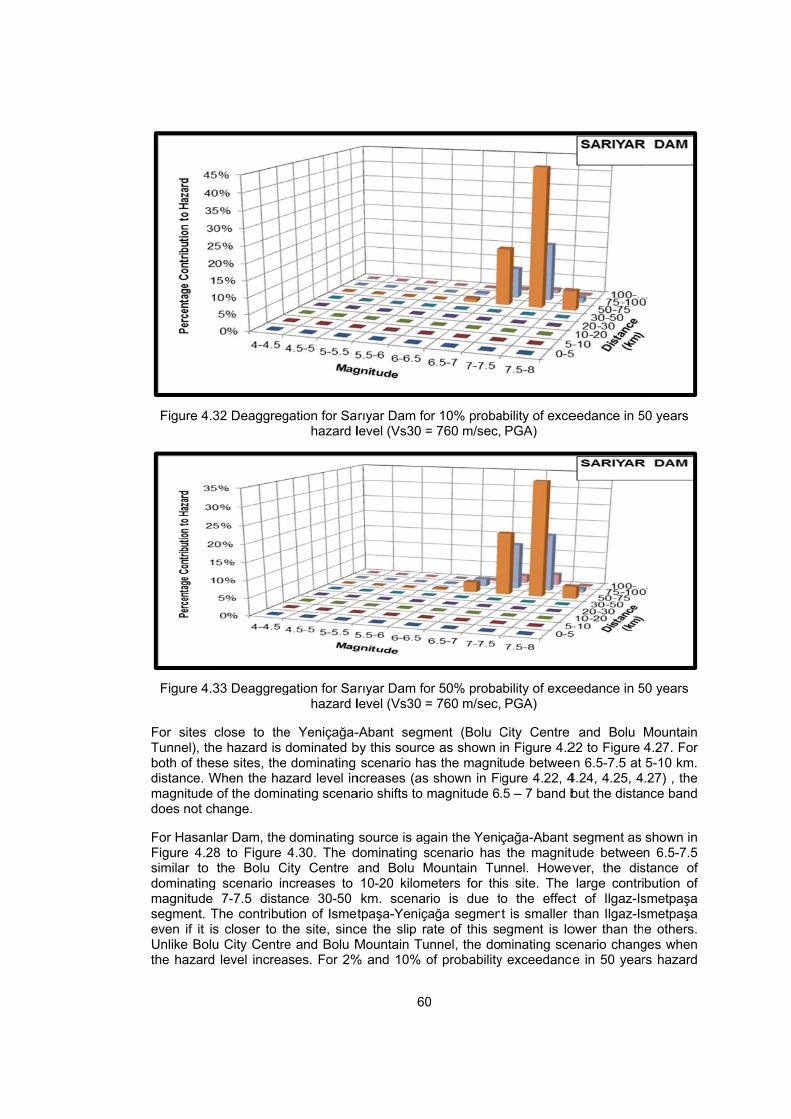
Figure 4.3
Figure 4.3
For sites Tunnel), thboth of thedistance. Wmagnitude does not ch
For HasanlFigure 4.28similar to dominatingmagnitude segment. Teven if it isUnlike Boluthe hazard
32 Deaggreg
33 Deaggreg
close to thee hazard is dse sites, the
When the haof the domin
hange.
lar Dam, the 8 to Figure the Bolu C
g scenario in7-7.5 dista
The contribus closer to tu City Centre level increa
gation for Sahazard l
gation for Sahazard l
e Yeniçağa-dominated b
e dominating zard level innating scena
dominating 4.30. The d
City Centre ncreases to ance 30-50 tion of Ismethe site, since and Bolu Mases. For 2%
60
rıyar Dam folevel (Vs30 =
rıyar Dam folevel (Vs30 =
-Abant segmby this source
scenario hancreases (asario shifts to m
source is agdominating sand Bolu M10-20 kilomkm. scenartpaşa-Yeniça
ce the slip raMountain Tu
% and 10% o
0
or 10% proba= 760 m/sec,
or 50% proba= 760 m/sec,
ment (Bolu Ce as shown
as the magnitshown in Fi
magnitude 6
gain the Yeniscenario hasMountain Tumeters for thrio is due tağa segmenate of this sennel, the doof probability
ability of exce PGA)
ability of exce PGA)
City Centre in Figure 4.2tude betweeigure 4.22, 4.5 – 7 band b
çağa-Abant the magnitunnel. Howevis site. The o the effectt is smaller egment is lominating sce
y exceedance
eedance in 5
eedance in 5
and Bolu 22 to Figure en 6.5-7.5 at 4.24, 4.25, 4but the dista
segment as tude betweever, the dislarge contri
ct of Ilgaz-Isthan Ilgaz-Is
ower than thenario chang
ce in 50 year
50 years
50 years
Mountain 4.27. For 5-10 km. .27) , the nce band
shown in n 6.5-7.5 stance of bution of
smetpaşa smetpaşa e others.
ges when rs hazard

61
levels, the dominating source is the Ilgaz-Ismetpaşa segment.. For 50% of probability of exceedance, the dominating scenario has magnitude 6.5-7.5 at the distance 30-50 kilometers (Figure 4.30).
For Sarıyar Dam, the dominating scenario again has the magnitude of 6.5-7.5 similar to the other sites (Figure 4.31 to Figure 4.33). For this site, the distance range of dominating scenario is 50-75 kilometers because of being far away from the seismic sources. When the hazard level increases, the percentage contribution of the dominating scenario to the total hazard decreases. However, the dominating scenario is always the same for different hazard levels.
4.3 Uniform Hazard Spectrum and TEC 2007 Comparison
The usage of Uniform Hazard Spectrum (UHS) is a general method for enhancing design spectra due to the probabilistic approach. The UHS is formed by calculating the hazard independently at a group of spectral periods and then calculating the ground motion for a determined probability level at each spectral period. Since the spectral acceleration value at each period has an equal opportunity of being exceeded, the term “uniform hazard spectrum” is used (Gülerce and Abrahamson, 2011).
Figure 4.34 to Figure 4.36 show the uniform hazard spectra of the selected sites (Bolu City Centre, Bolu mountain Tunnel, Hasanlar Dam and Sarıyar Dam) at 2%, 10% and 50% probability of exceedance hazard levels for rock site conditions (Vs30=760 m/s). Similarly, Figure 4.37 to Figure 4.39 show the uniform hazard spectra of the selected sites at the same probability of exceedance hazard levels for soil site conditions (Vs30=270 m/s). In order to compare the results with the TEC-2007 design specifications, the UHS plots include also the TEC-2007 design spectrum for rock or soil site conditions. According to TEC 2007 specifications, for plotting the TEC 2007 design spectrum, Z1 type soil class is assigned to represent rock site conditions (Vs30 = 760 m/s) and Z3 type is assigned to represent the soil site conditions (Vs30 = 270 m/s).
For rock site conditions of Bolu City Centre and Bolu Mountain Tunnel the UHS developed is significantly higher than TEC-2007 design spectrum for all spectral periods at the hazard level levels of 2% and 10% probability of exceedance. For 50% probability of exceedance hazard level, Bolu City Centre UHS is smaller than the TEC-2007 design spectrum after 0.25 second spectral period. Again for 50% probability of exceedance hazard level, the Bolu Mountain Tunnel UHS is smaller than the TEC-2007 design spectrum after 1 second spectral period. For the soil site conditions, the UHS developed is significantly higher than TEC-2007 design spectrum at all of the hazard levels.
For rock site conditions of Hasanlar Dam, the UHS developed is significantly lower than TEC-2007 design spectrum for all spectral periods and all of the hazard levels. However, for soil site conditions of Hasanlar dam, at 2% probability of exceedance hazard level, the UHS is higher than the TEC-2007 design spectrum up to 0.3 second spectral periods. For 10% probability of exceedance hazard level, the UHS level is approximately same as the TEC-2007 design spectrum until 0.075 second spectral period. UHS is significantly lower than the TEC-2007 design spectrum for 50% probability of exceedance hazard level.
For both rock and soil site conditions of Sarıyar Dam, the UHS developed is significantly lower than TEC-2007 design spectrum for all spectral periods and all of the different hazard levels.

Figure 4
Figure 4.
Figure 4.
.34 Uniform
35 Uniform H
36 Uniform H
Hazard Spehaza
Hazard Spechaza
Hazard Spechaza
62
ctra for 4 critard level, Vs3
ctra for 4 critard level, Vs3
ctra for 4 critard level, Vs3
2
tical location30 = 760 m/s
ical location,30 = 760 m/s
ical location,30 = 760 m/s
, 2% probabsec
10% probabsec
50% probabsec
bility of excee
bility of excee
bility of excee
edance
edance
edance

Figure 4
Figure 4.
Figure 4.
.37 Uniform
38 Uniform H
39 Uniform H
Hazard Spehaza
Hazard Spechaza
Hazard Spechaza
63
ctra for 4 critard level, Vs3
ctra for 4 critard level, Vs3
ctra for 4 critard level, Vs3
3
tical location30 = 270 m/s
ical location,30 = 270 m/s
ical location,30 = 270 m/s
, 2% probabsec
10% probabsec
50% probabsec
bility of excee
bility of excee
bility of excee
edance
edance
edance

4.4 Ha
The hazardhazard levesecond speshown in FGerede eaadopted froare presenFault South
Figure 4.41= 760 m/s)in 50 yearsexpected. Tthe seismicare made f
Foof and
Foexc0.2
Thandyeamasouhaz
azard Maps f
d maps for tels in Turkisectral period
Figure 4.40 aarthquake ruom (Gülerce nted in Figurehern Straned
F
1 to figure 4.) and soil sites hazard leveThe assignec sources arefrom the haza
r rock site coexceedenced 0.21g at 50
r soil site conceedence ha29g at 50% p
e seismic had soil site coars are provaps follow theurces and thzard level inc
for Study Ar
the region foh Earthquaks. For this pu
and PSHA wapture zone, and Ocak, 2
e 4.40 by a d) (Source-2)
igure 4.40 G
58 represene conditions els. Generalld segmentate the locatioard maps:
onditions, thee hazard leve0% probabilit
nditions, the azard level, 0probability of
azard maps fonditions at 2vided in Figue fault lines ahe overlap locrease.
64
rea
or the rock ske Code (200urpose, 108 as performedtwo more s
2013) and inblue line for
) and a red li
Grids and sou
ts the seismfor PGA at
ly, the fault ltion locations
ons where ha
e highest vael, 0.49g at ty of exceed
highest valu0.62g at 10%exceedence
for T=0.2 sec2%, 10% andure 4.51 to as expectedocations of t
4
site and soil 07) are built grid nodes w
d at each grseismic sourncluded in thr Mudurnu Ane Düzce Fa
urces assigne
mic hazard ma2%, 10% anines followeds on the souazard level in
alue of PGA 10% probabence hazard
ue of PGA is % probabilitye hazard leve
cond for rockd 50% level o
Figure 4.56. The assignthe seismic
site conditiofor PGA, T=
were definedid node. In arces close toe PSHA ana
Abant Segmeault (source-3
ed to region
aps for rock nd 50% probad by the con
urces and thencrease. Foll
is around 0.7bility of exce level.
around 0.95y of exceedael.
k site conditioof probability6. Generally,ed segmentasources are
ons at the a=0.2 second d in the studyaddition to 19o the study alysis. Theseents (North A3) in Figure 4
site conditioability of exc
ntours of the e overlap loclowing interp
77g at 2% peedence haz
5g at 2% probnce hazard
ons (Vs30 = y of exceeda the contouation locatio
e the location
applicable and T=1
y area as 944 Bolu-area are
e sources Anatolian 4.40.
ons (Vs30 ceedance maps as
cations of pretations
probability zard level
bability of level and
760 m/s) nce at 50 rs of the ns on the ns where
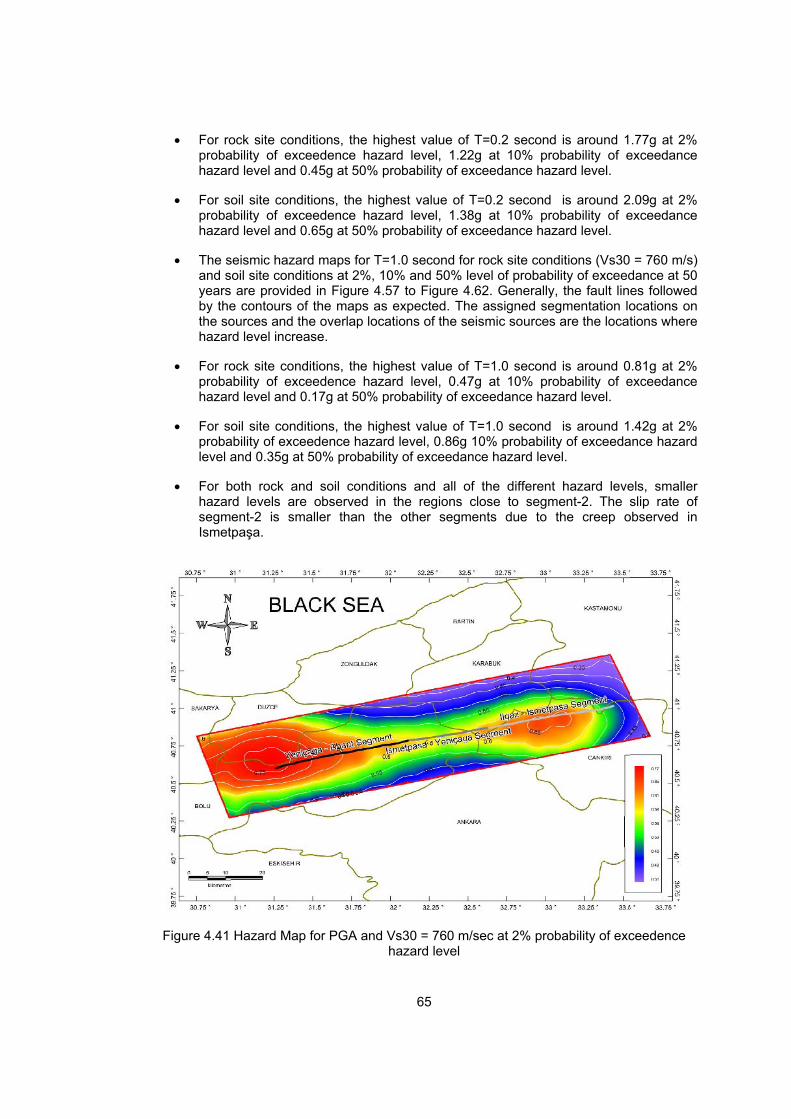
65
For rock site conditions, the highest value of T=0.2 second is around 1.77g at 2% probability of exceedence hazard level, 1.22g at 10% probability of exceedance hazard level and 0.45g at 50% probability of exceedance hazard level.
For soil site conditions, the highest value of T=0.2 second is around 2.09g at 2% probability of exceedence hazard level, 1.38g at 10% probability of exceedance hazard level and 0.65g at 50% probability of exceedance hazard level.
The seismic hazard maps for T=1.0 second for rock site conditions (Vs30 = 760 m/s) and soil site conditions at 2%, 10% and 50% level of probability of exceedance at 50 years are provided in Figure 4.57 to Figure 4.62. Generally, the fault lines followed by the contours of the maps as expected. The assigned segmentation locations on the sources and the overlap locations of the seismic sources are the locations where hazard level increase.
For rock site conditions, the highest value of T=1.0 second is around 0.81g at 2% probability of exceedence hazard level, 0.47g at 10% probability of exceedance hazard level and 0.17g at 50% probability of exceedance hazard level.
For soil site conditions, the highest value of T=1.0 second is around 1.42g at 2% probability of exceedence hazard level, 0.86g 10% probability of exceedance hazard level and 0.35g at 50% probability of exceedance hazard level.
For both rock and soil conditions and all of the different hazard levels, smaller hazard levels are observed in the regions close to segment-2. The slip rate of segment-2 is smaller than the other segments due to the creep observed in Ismetpaşa.
Figure 4.41 Hazard Map for PGA and Vs30 = 760 m/sec at 2% probability of exceedence hazard level

66
Figure 4.42 Hazard Map for PGA and Vs30 = 270 m/sec at 2% probability of exceedence hazard level
Figure 4.43 Hazard Map for PGA and Vs30 = 760 m/sec at 10% probability of exceedence hazard level

67
Figure 4.44 Hazard Map for PGA and Vs30 = 270 m/sec at 10% probability of exceedence hazard level
Figure 4.45 Hazard Map for PGA and Vs30 = 760 m/sec at 50% probability of exceedence hazard level
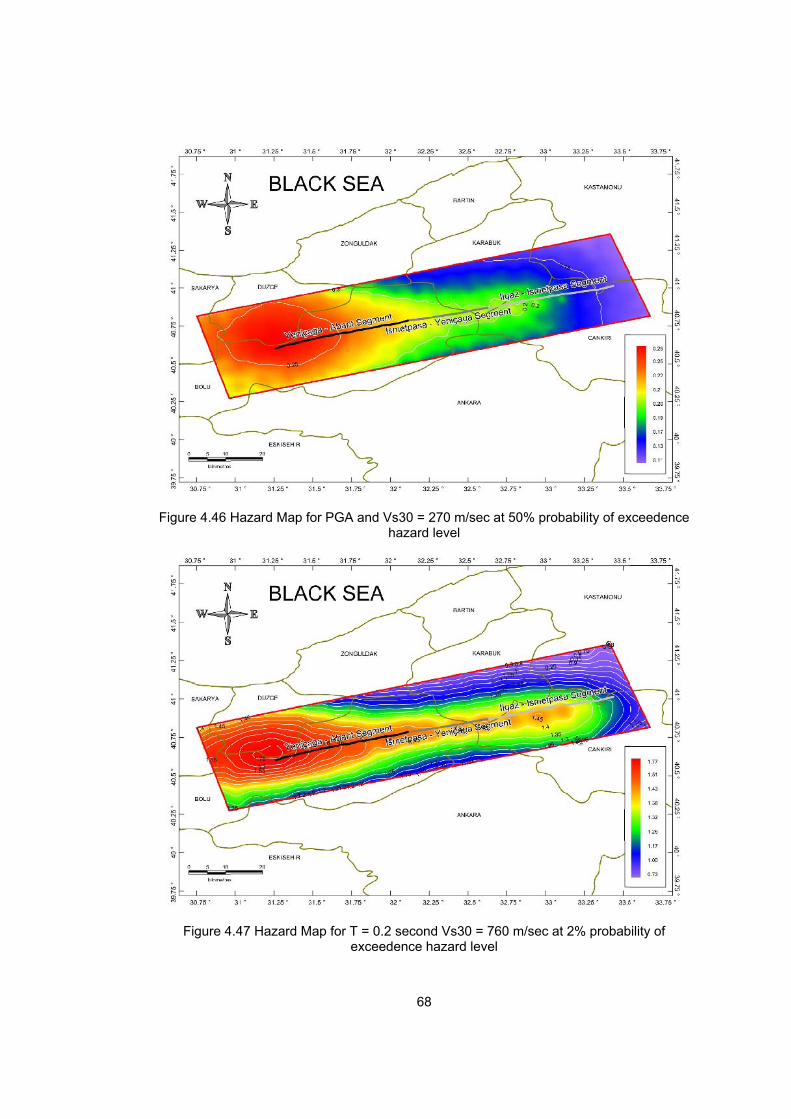
68
Figure 4.46 Hazard Map for PGA and Vs30 = 270 m/sec at 50% probability of exceedence hazard level
Figure 4.47 Hazard Map for T = 0.2 second Vs30 = 760 m/sec at 2% probability of exceedence hazard level

69
Figure 4.48 Hazard Map for T = 0.2 second Vs30 = 270 m/sec at 2% probability of exceedence hazard level
Figure 4.49 Hazard Map for T = 0.2 second Vs30 = 760 m/sec at 10% probability of exceedence hazard level

70
Figure 4.50 Hazard Map for T = 0.2 second Vs30 = 270 m/sec at 10% probability of exceedence hazard level
Figure 4.51 Hazard Map for T = 0.2 second Vs30 = 760 m/sec at 50% probability of exceedence hazard level

71
Figure 4.52 Hazard Map for T = 0.2 second Vs30 = 270 m/sec at 50% probability of exceedence hazard level
Figure 4.53 Hazard Map for T = 1.0 second Vs30 = 760 m/sec at 2% probability of exceedence hazard level

72
Figure 4.54 Hazard Map for T = 1.0 second Vs30 = 270 m/sec at 2% probability of exceedence hazard level
Figure 4.55 Hazard Map for T = 1.0 second Vs30 = 760 m/sec at 10% probability of exceedence hazard level

73
Figure 4.56 Hazard Map for T = 1.0 second Vs30 = 270 m/sec at 10% probability of exceedence hazard level
Figure 4.57 Hazard Map for T = 1.0 second Vs30 = 760 m/sec at 50% probability of exceedence hazard level
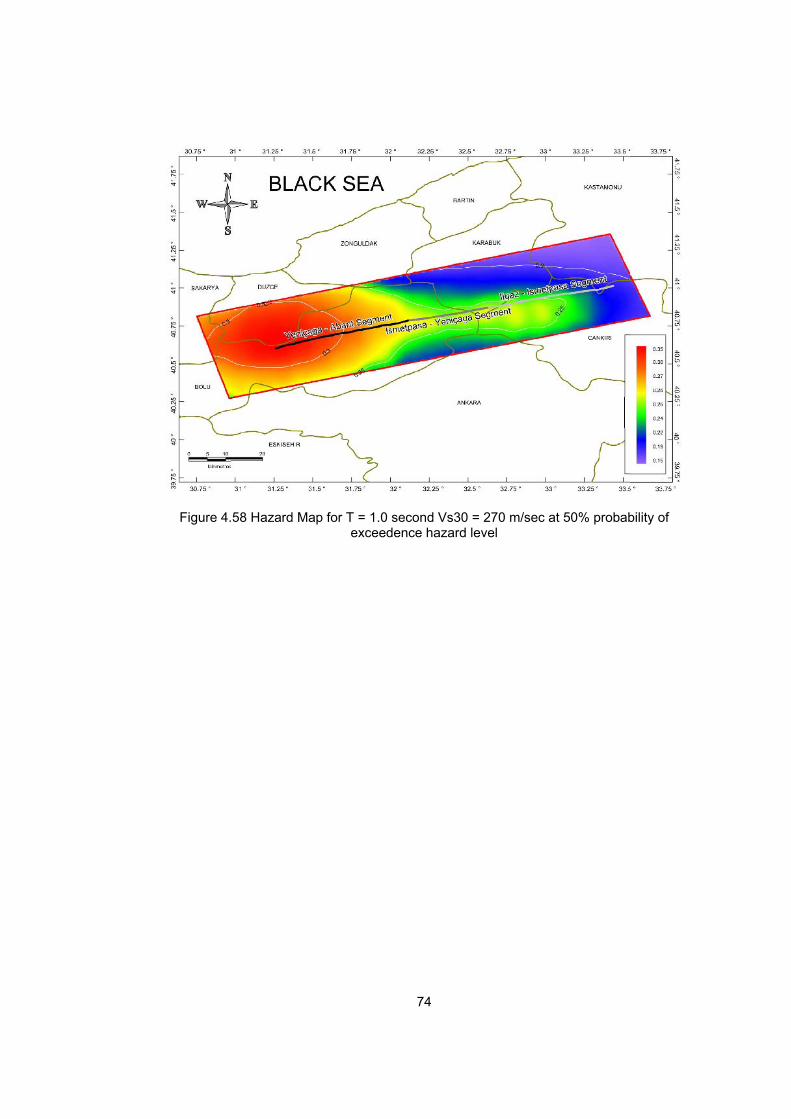
74
Figure 4.58 Hazard Map for T = 1.0 second Vs30 = 270 m/sec at 50% probability of exceedence hazard level
75
CHAPTER 5
SUMARY AND CONCLUSION
Bolu-Ilgaz is one of the seismically active regions of Turkey, located on the second degree earthquake zone according to the earthquake zonation map of Turkish Earthquake Code (2007). Being in the cross section of Düzce, Bolu-Ilgaz and Mudurnu-Abant segments of North Anatolian Fault (NAF) system, the region was damaged by several large earthquakes in the last century, however the structural damage in Bolu and its surroundings were substantial especially after the 1944 Bolu-Gerede Earthquake (Mw = 7.2) and 1999 Düzce Earthquake (Mw = 7.1). Therefore, to reduce the damage in the structures and loss of lives in future earthquakes beside a sensible and economical design practice, accurate evaluation of seismic hazard for this region is vital. When compared to the Marmara Region and Istanbul Metropolitan Area, the number of PSHA studies in the Bolu-Gerede Region is quite inadequate. Actually, published PSHA studies for Turkey were limited (Erdik et al. 1985; Gülkan et al. 1993) before the 1999 events. Several researchers published estimates of seismic hazard and hazard for Marmara Region and for Istanbul after these events. Seismic source characterization was typically based on earthquake catalogue data using areal sources in early seismic hazard assessment studies and the magnitude distributions of these areal sources were modeled with truncated exponential (GR) relationship. In more recent studies (Erdik et al. 2004; Crowley and Bommer 2006; Kalkan et al. 2009), seismic sources were modeled by defining linear fault segments with the assumption that the seismic energy along these fault segments was released by characteristic events. The magnitude distribution functions of linear sources were considered to be fully characteristic. In addition, a background source representing the small-to-moderate magnitude earthquakes were added to the source model and the earthquake reoccurrence of the background source was modeled using truncated exponential magnitude distribution model. Due to the lack of local predictive models, early-stage GMPEs such as Boore et al. (1997), Campbell (1997), and Sadigh et al. (1997) were used in earlier studies to represent the ground motion variability. Only the recent study by Kalkan et al. (2009) used NGA-W1 ground motion prediction models along with a regional GMPE developed for Turkey after the 1999 events by Kalkan and Gülkan (2004). The main components of PSHA methodology and framework for PSHA are rapidly improving by increase in the number of studies about seismic source and ground motion characterization for special structures and awareness of earthquake hazard reduction. The primary objective of this study is to evaluate the seismic hazard around the 1944 Bolu-Gerede Earthquake Rupture Zone using improved seismic source models and regionalized global ground motion prediction equations within a probabilistic framework. Once published, this study will be one of the foremost probabilistic seismic hazard analysis studies performed on the rupture zones of 1939-1944 earthquake sequence on NAF system. The development of advanced seismic source models in terms of source geometry and reoccurrence relations is one of the major improvements over the previous seismic hazard assessment practice accomplished in this study. Three linear fault segments are defined for 1944 earthquake rupture zone: Ilgaz – Ismetpaşa Segment, Ismetpaşa – Yeniçağa segment, and Yeniçağa – Abant segment. Geometry of these sub-segments (length, width, and

76
segmentation points) are determined and incorporated with the help of available studies (Kondo et al., 2005 and Koçyiğit and Ayhan, 2009) and updated active fault maps of General Directorate of Mineral Research and Exploration (2012). Since speciality on structural geology, tectonics and seismology is a necessity to achieve an accurate and proper modeling of the seismic sources as an input to PSHA, expert evaluation of Dr. Şaroğlu for the fault geometry and source-epicenter matching for 1944 rupture zone is adopted for this study. Composite magnitude distribution model (Youngs and Coppersmith, 1985) is used for all seismic sources in the study area to appropriate representing of the characteristic behavior of NAF without an additional background zone. The key feature of this model is; 94% of seismic moment is released by the characteristic earthquakes whereas the rest of the total seismic moment is released by the smaller size earthquakes due to the constraints of the distribution equation. The recurrence models for each source are bounded by minimum and maximum magnitude values. The minimum moment magnitude value is selected as 4.5 considering the engineering interest and the characteristic magnitude with one standard deviation is assigned to each source as maximum magnitude. The recurrence parameter b-value of the area is calculated as 0.60 using maximum likelihood method. The b-value used by the previous studies in the literature is in good agreement with the value estimated in this study. In order to evaluate the contribution of the variability in the b-value to the total hazard output, a sensitivity analysis is performed for Bolu City Centre and it is found that the hazard results are quite insensitive to the changes in b-value especially for high hazard levels when the composite magnitude recurrence model is employed. Fault segments, rupture sources, and rupture scenarios are determined using the WG-2003 terminology and a full rupture model is developed for each source considering single and multi-segment ruptures. Events in the earthquake catalogue are attributed to the individual seismic sources and scenario weights are determined by balancing the accumulated seismic energy by the catalog (A revised and extended earthquake catalog for Turkey since 1900 (M≥4.0), Kalafat, 2010) seismicity. Activity rates for each source should be estimated for a complete source characterization model. The annual slip rate of each source is the main parameter to be estimated for calculating activity rate. The long period slip rate of the NAF system is found as 10 mm/year using geological observations (details are provided in Chapter 2). However, the short term slip rate of NAF branch in the area is assumed as 20 mm/year based on the geodetic measurements and assigned to each sub-segment. Several studies indicated that aseismic deformation is measured in İsmetpaşa therefore, in order to estimate the creep rate of Ismetpaşa-Yeniçağa segment, creep amount, time period, and measurement errors proposed in the previous studies from 1957 to 2010 are collected in a catalog of creep rates. Average creep rate measured by recent studies is found as approximately 8 mm/year. The slip rate assigned to the fault segment is reduced by this value for Ismetpaşa-Yeniçağa Segment and a total slip rate of 12 mm/year is assigned to that segment. A weight is assigned to each rupture scenario and the weighted average of these scenarios are calculated by assigning a weight to each scenario in the logic tree. To establish the best fit between the cumulative rates of historic earthquakes and weighted average lines, the weights of individual scenarios are modified. In order to evaluate the contribution of the weights for rupture scenarios, a sensitivity analysis is performed by arbitrarily changing the weights of rupture scenarios. Analysis results showed that the selected weighted average combination is slightly above the median but lies between ± 1 δ range. Gülerce et al. (2013) explained that Next Generation Attenuation (NGA-W1) models are renewed and improved in terms of supplement prediction parameters (such as depth of the source, basin effects, magnitude dependent standard deviations, etc.), statistical approach,

77
and a well constrained global database. Turkey-Adjusted NGA-W1 prediction models are employed by to represent for the first time on NAF system. Moreover, a sensitivity analysis is performed to evaluate the effect of weights assigned to different TR Adjusted NGA-W1 models. A less than 0.02g difference in the hazard for small annual probability of exceedance levels (0.03 or less) caused by using different attenuation models. However, as the level annual probability of exceedance getting smaller, the effect of ground motion prediction model getting larger. The hazard curves obtained using TR Adjusted BA-2008 and TR Adjusted CB 2008 models are quite similar since only magnitude adjustment was applied to these models (Gülerce et al., 2013). In addition to the magnitude adjustment, the site amplification terms of AS 2008 and CY 2008 models were also modified. Therefore, these two models result in lower hazard curves for rock site conditions. To fully represent the ground motion predictability equal weights are assigned to each model. The hazard curves and uniform hazard spectra for different soil conditions (soil and rock) and for different hazard levels (2%, 10% and 50% probability of exceedence in 50 years) are provided for the four specific locations in the region (Bolu City Centre, Bolu Mountain Tunnel, Hasanlar Dam, Sarıyar Dam). In the PSHA analysis, the seismic sources on the west, Duzce Fault and NAF Southern Strand (Gülerce and Ocak, 2013), are also taken into consideration. The seismic source models of fault segments on the east are not completed yet, therefore these sources are not included in PSHA analyses. Highest hazard levels were obtained at Bolu City Centre and Bolu Mountain Tunnel and Sarıyar Dam has the lowest hazard curves for all of the different hazard levels since Sarıyar Dam is far away from the fault sources when compared with Bolu City Centre and Bolu Mountain Tunnel. The study area is located in first seismic zone according to TEC 2007 and 475 years return period design peak ground acceleration is 0.4g for regular buildings. The hazard maps for the region for the rock site and soil site conditions at the applicable hazard levels in Turkish Earthquake Code (2007) are built for PGA, T=0.2 second and T=1 second spectral periods. Generally, the fault lines followed by the contours of the maps as expected. The assigned segmentation locations on the sources and the overlap locations of the seismic sources are the locations where hazard level increase. The west of the study area always has bigger hazard values since the sources on the west are included in PSHA. The highest value of PGA is around 0.95g for 2475 years return period for soil site (Vs30 = 270 m/sec) and 0.77g for rock site (Vs30 = 760 m/sec). High spectral accelerations at 0.2 second spectral period were observed at high return periods for sites very close to the active faults. The uncertainty level assigned to the ground motions for this study is median± 3σ as the new seismic hazard practice command which is significantly higher than the uncertainty level in TEC-2007.
Detailed in-situ geotechnical tests are definitely required to make a comprehensive site classification. However, using the geology, tectonics and geomorphology of the study area, an empirical rock classification model is constructed by dividing the study area into two parts; hard rock and soft rock. Since, no site specific measurements are available; the rocks are classified with respect to their neotectonic period or paleotectonic period. The rocks from the neotectonic period are assumed as units that did not face enough diyasine and classified as soft rock on the map. On the contrary, the rocks from the paleotectonic period assumed as units that faced enough diyasine and classified as hard rock on the map. The emprical rock classification map given in Chapter-2 and the hazard maps for PGA for acceptable hazard levels given in Chapter-4 are correlated in Figures 5.1 to 5.3. The resulting site specific hazard maps for PGA at 2%, 10% and 50% probability of exceedance hazard levels in 50 years are presented in Figure 5.1, 5.2 and 5.3, respectively. In order to construct these draft site specific hazard maps, the hazard values obtained from the soil rite runs (Vs30 = 270 m/sec) are attributed to the soft rock regions and the hazard values obtained from the rock

78
rite runs (Vs30 = 760 m/sec) are attributed to hard rock regions. Following interprepations can be made:
The highest value of PGA is around 0.77g at 2% probability of exceedence hazard level, 0.49g at 10% probability of exceedence hazard level and 0.21g at 50% probability of exceedence hazard level for rock site conditions (Vs30 = 760 m/sec).
The highest value of PGA is around 0.95g at 2% probability of exceedence hazard level, 0.62g at 10% probability of exceedance hazard level and 0.29g at 50% probability of exceedence hazard level for soil site conditions (Vs30 = 270 m/sec).
In the draft site specific hazard map, the highest value of PGA is around 1.17g at 2% probability of exceedence hazard level, 0.77g at 10% probability of exceedance hazard level and 0.39g at 50% probability of exceedence hazard level. (Figure 5.1 to Figure 5.3)
The draft site specific hazard map has higher hazard levels when compared to other hazard maps. When contouring the site with full of soil or rock, the results are close to each other and in order to not having large errors, the GIS software eliminates some of extremely high values at regions close to the faults. Therefore, the resulting map does not show the result of real extremely high values at regions close to the faults.
The highest value of PGA at all of the different hazard levels are always West side of the study area for rock or soil maps since, the seismic sources on the west are taken into consideration but the seismic sources on the east are not included in PSHA analyses. As a result, the East side of the study area has smaller value of PGA at different hazard levels. However, for site specific hazard maps, the regions at the East side of the study area and close to the faults are assigned as soft rocks and assumed with Vs30 = 270 m/sec. Therefore, the resulting map shows higher PGA values at the East side of the study area.
The West side of the study area shows a huge region like a circle with higher PGA values for soil map. However, for site specific hazard maps, the West side of the study area shows again a region with large PGA values and the diameter of the circle shape get smaller. The East side is assigned as both rock and soil, the regions which are assigned as rocks resulting with lower PGA values and this is effecting the West side of the maps getting a smaller diameter circle shaped.
For both of the soil or rock maps, smaller hazard levels are observed in the regions close to segment-2. The region is the slip rate of segment-2 which is smaller than the other segments due to the creep observed in Ismetpaşa.
To say repeatedly because of big importance, detailed in-situ geotechnical tests are definitely required to make a comprehensive site classification. The results given in this study can be used to give an idea before in-situ geotechnical tests. The site specific results have larger errors for the regions close the fault because the type of soil assigned is changing in short distances. However, for the regions far away from the faults, the soil type assigned is not changing so much and generally hard rock definitions are assigned to these regions. Therefore, the results are with smaller errors when compared to the near fault sites.

79
Figure 5.1 Site specific hazard map for PGA at 2% probability of exceedance hazard level
Figure 5.2 Site specific hazard map for PGA at 10% probability of exceedance hazard level
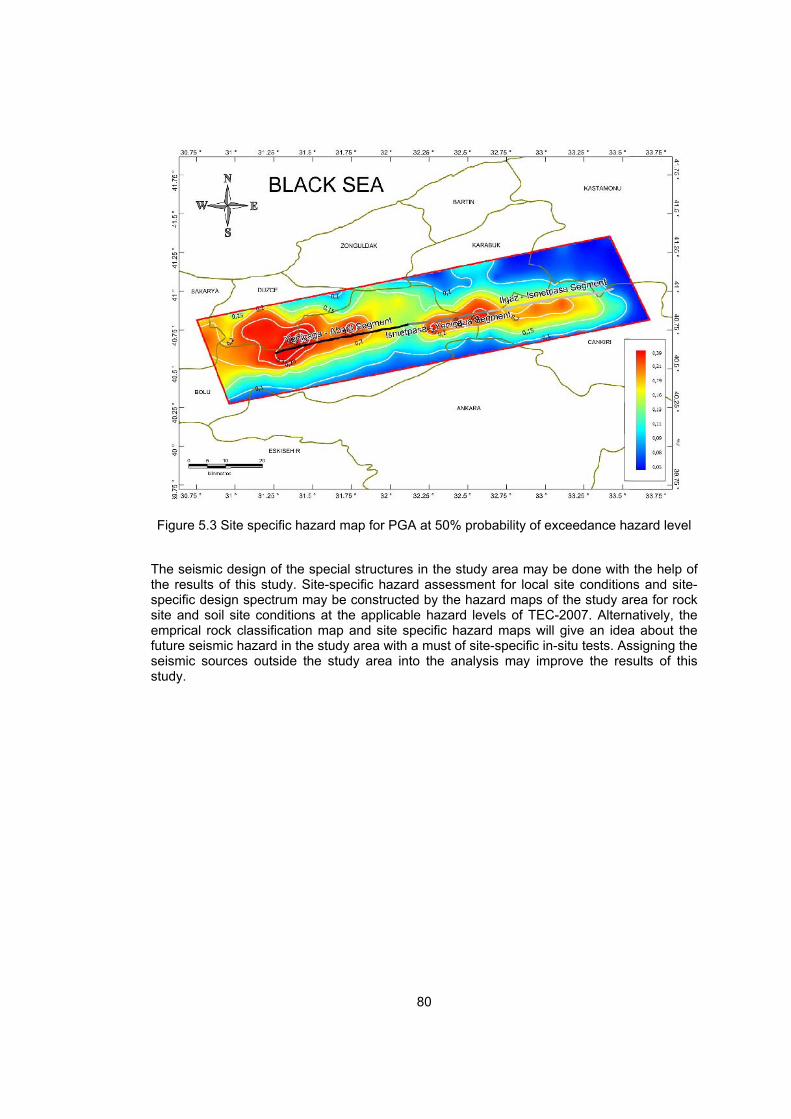
80
Figure 5.3 Site specific hazard map for PGA at 50% probability of exceedance hazard level
The seismic design of the special structures in the study area may be done with the help of the results of this study. Site-specific hazard assessment for local site conditions and site-specific design spectrum may be constructed by the hazard maps of the study area for rock site and soil site conditions at the applicable hazard levels of TEC-2007. Alternatively, the emprical rock classification map and site specific hazard maps will give an idea about the future seismic hazard in the study area with a must of site-specific in-situ tests. Assigning the seismic sources outside the study area into the analysis may improve the results of this study.

81
REFERENCES
Abdüsselamoğlu, Ş. (1959) : Yukarı Seyhan Bölgesinde Doğu Toroslar'ın Jeolojik Etüdü.
M.T.A. Rap. no. 2668 [in Turkish]. Abrahamson, N. A., State of The Practice of Seismic Hazard Evaluation, 2000 Abrahamson, N.A. (2006) Seismic Hazard Assessment: Problems With Current Practice And
Future Developments, First European Conference on Earthquake Engineering and Seismology(a joint event of the 13th ECEE & 30th General Assembly of the ESC)Geneva, Switzerland, 3-8 September 2006.
Abrahamson, N. A. and Silva, W. (2008) Summary of the Abrahamson & Silva NGA Ground-
Motion Relations, Earthquake Spectra, Volume 24, No. 1, 67 – 97. Aki, K. (1965). Maximum likelihood estimate of b in the formula log N = a - bM and its
confidencelimits, Bull. Earthquake Res. Inst., Tokyo Univ. 43, 237-239. Akkar et al. (2010) The Recently Compiled Turkish Strong Motion Database: Preliminary
Investigation for Seismological Parameters, Seismicity, Volume 14, Issue 3, 457-479. Ambraseys, N. N. (1970). Some characteristic features of the Anatolian fault zone,
Tectonophysics 9, 143–165. Ambraseys and Jackson, Faulting associated with historical and recent earthquakes in the
Eastern Mediterranean region, Geophysical Journal International, Volume 133, Issue 2, pages 390–406, May 1998.
Armijo, R., Meyer, B., Hubert, A., Barka, A. (1999) Westward propogation of the North
Anatolian fault into the nothern Aegean: Timing and kinematics, Geology, vol. 27,no. 3, 267-270.
Atakan, K., A. Ojeda, M. Meghraoui, A. A. Barka, M. Erdik, and A. Bodare (2002). Seismic
hazard in Istanbul following the 17 August 1999 Izmit and 12 November 1999 Düzce earthquakes, Bull. Seismol. Soc. Am. 92, no. 1, 466–482.
Atkinson, G. M. and Boore, D. M. (1997) Some comparisons between recent ground-motion
relations, Seism. Res. Lett. 68, 24–40. Ayhan, M.A., Demir, C., Kilicoglu, A., Sanli, I., Nakiboglu, S.M. (1999). Crustal motion around
the western segment of the northAnatolian fault zone: geodetic measurements and geophysicalinterpretation. Abstr. Int. Union Geod. Geophy. 99, 77–78.
Ayhan, M.E., Bürgmann, R., McClusky, S., Lenk, O., Aktug, B., Herece, E., Reilinger, R.E.
(2001). Kinematics of the Mw=7.2, 12November 1999, Düzce, Turkey earthquake. Geophys. Res. Lett.28 (2), 367–370.

82
Ayhan, M. E. & Koçyiğit, A. (2009). Displacements and Kinematics of the February 1, 1944 Gerede Earthquake (North Anatolian Fault System, Turkey): Geodetic and Geological Constraints: Turkish Journal of Earth Sciences (Turkish J. Earth Sci.), Vol. 19, 285–311.
Barka, A.A., and Kadinsky-Cade, K., 1988, Strike-slip fault geometry in Turkey and its
influence on earthquake activity. Tectonics, 7, 663-684. Barka, A. A. (1996), Slip distribution along the North Anatolian fault associated with large
earthquakes of the period 1939 to 1967, Bull.Seismol. Soc. Am., 86, 1234–1238. Barka, A.A.and 22 others, 2002, The surface rupture and slip distribution of the 17 August
1999 İzmit earthquake (M 7.4), North Anatolian Fault. Bulletin of the Seismological Society of America, 92, 43-60.
Bender, B. (1983) Maximum Likelihood Estimation Of b Values For MagnitudeGrouped Data,
Bull. Seism. Soc. Am. 73, no. 3, 831–851. Blumenthal, M., 1948, Bolu Civari ile Aşağı Kızılırmak Mecrası Arasında Kuzey Anadolu
Silsilelerinin Jeolojisi: MTA Pub., Serie B, No. 13, 265 [in Turkish]. Boore, D. M., Lamprey, J. W., Abrahamson, N. A. (2006) Orientation-Independent Measures
of Ground Motion, Bull. Seism. Soc. Am. 96, no. 4A, 1502 - 1511. Boore, D. M., Atkinson, G. M. (2008) Ground-Motion Prediction Equationsfor the Average
Horizontal Componentof PGA, PGV, and 5%-Damped PSAat Spectral Periods between 0.01 sand 10.0 s, Earthquake Spectra, Volume 24, No. 1, 99 – 138.
Campbell, K. W., Empirical Near-Source Attenuation Relationships for Horizontal and
Vertical Components of Peak Ground Acceleration, Peak Ground Velocity, and Pseudo-Absolute Acceleration Response Spectra, 1997
Campbell, K. W. and Bozorgnia, Y. (2008) NGA Ground Motion Model for theGeometric
Mean Horizontal Componentof PGA, PGV, PGD and 5% DampedLinear Elastic Response Spectrafor Periods Ranging from 0.01 to 10 s, Earthquake Spectra, Volume 24, No. 1, 139 – 171Balaam, N. P., & Poulos, H. G. (1983). The behavior of foundations supported by clay stabilized by stone columns. Proc. 8th European Conf. on Soil Mechanics and Foundation Engineering, Helsinki, Vol. 1, pp.199-204.
Chiou, B. Darragh, R., Gregor, N. and Silva, W. (2008) NGA Project Strong-Motion
Database, Earthquake Spectra, Volume 24, No. 1, 23 – 44. Chiou, B. S. J. and Youngs, R. R. (2008) An NGA Model for the Average
HorizontalComponent of Peak Ground Motionand Response Spectra, Earthquake Spectra, Volume 24, No. 1, 173 – 215.
Cornell, C. A. (1968) Engineering siemsic hazard analysis, Bull. Seism. Soc. Am., 58, 1583-
1606. Erratum: 59,1733. Crowley, H., and J. J. Bommer (2006). Modeling seismic hazard in earthquake loss models
with spatially distributed exposure, Bull. Eq. Eng. 4, 249–273. Çakir, A., M. Akoglu, S. Belabbes, S. Ergintav, and M. Meghraoui (2005), Creeping along the
Ismetpasa section of the North Anatolian fault (Western Turkey): Rate and extent from InSAR, Earth Planet. Sci. Lett., 238, 225–234, doi:10.1016/j.epsl.2005.06.044.

83
Dewey, J. W. (1976). Seismicity of Northern Anatolia, Bull. Seism. Soc. Am. 66, 843-868. Erdik, M., Doyuran, V., Akkas, N., and P. Gulkan (1985): A probabilistic assessment of the
seismic hazard in Turkey, Tectonophysics, No. 117, 295-344. Erdik, M., M. Demircioğlu, K. Şeşetyan, E. Durukal, and B. Siyahi (2004) Earthquake hazard
in Marmara region, Turkey, Soil Dyn. Earthq. Eng.24, 605–631. Gülkan, P., A. Koçyiğit, M.S. Yücemen, V. doyuran and N. Başöz (1993): En son verilere
göre hazırlanan Türkiye deprem bölgeleri haritası, Report No: METU/EERC 93-1 [in Turkish].
Genç, G. (2004) Probabilistic Seismic Hazard Assessment for Eskişehir. Master Thesis,
Middle East Technical University, Ankara. Herece E. and Akay E., 2003, Atlas of North Anatolian Fault (NAF). General Directorate of
Mineral Research and Exploration, Special Publication series-2, Ankara, 61 p+13 appendices as separate maps.
Herece, E. 2005. Neotectonics of the Western Section of the North Anatolian Fault Zone.
PhD Thesis, Ankara University, Ankara. Idriss I. M. (2008) An NGA Empirical Model for Estimatingthe Horizontal Spectral
ValuesGenerated By Shallow Crustal Earthquakes, Earthquake Spectra, Volume 24, No. 1, 217 – 242.
Jackson, J., and McKenzie, D., 1988, The relationship between plate motions and seismic
moment tensors, and the rates of active deformation in the Mediterranean and Middle East. Geophys. J., 93, 45-73.
Kalafat, D., Statistical Evaluation of Turkey Earthquake Catalog: Case Study, 2010 Kalkan, E. and Gülkan, P. (2004) Site-Dependent Spectra Derived from Ground Motion
Records in Turkey, Earthquake Spectra, Volume 20, No. 4, 1111 – 1138. Kalkan, E., Gülkan P., Yilmaz N. and M. Çelebi (2009): Reassessment of probabilistic
seismic hazard in the Marmara Region, Bull. Seismol. Soc. Am. 99, no. 4, 2127-2146. Karabacak, V., Altunel, E., Çakır, Z. (2011) Monitoring aseismic surface creep along the
North Anatolian Fault (Turkey) using ground-based LIDAR: Earth and Planetary Science Letters, Vol.304, Issues 1–2, 1 April 2011, Pages 64–70
Ketin, L. (1948) Son on yılda Türkiye'de vukua gelen büyük depremlerin tektonik ve mekanik
neticeleri hakkında, TJK Bült. 2/1, 1-13 [in Turkish]. Ketin, I. (1969). Uber die nordanatolishe horizontal verschiebung, Bull. Mineral Res. Explor.
Inst. Turkey 72, 1–28. Kondo, H., Awata, Y., Emre, Ö., Doğan, A., Özalp, S., Tokay, F., Yıldırım, C., Yoshioka, T.,
Okumura, K. (2005) Slip Distribution, Fault Geometry, and Fault Segmentation of the 1944 Bolu-Gerede Earthquake Rupture, North Anatolian Fault, Turkey: Bulletin of the Seismological Society of America, Vol. 95, No. 4, 1234–1249

84
Kondo, H., Özaksoy, V., Yıldırım, C. (2010) Slip history of the 1944 Bolu‐Gerede earthquake rupture along the North Anatolian fault system: Implications for recurrence behavior of multisegment earthquakes: Journal of Geophysıcal Research, vol. 115,
Kramer, S. L., Geotechnical Earthquake Engineering, Prentice Hall, 1996 Kutoğlu, H. S., Akcin, H., Kemaldere, H., Görmüş, K. S. (2008) Triggered creep rate on the
Ismetpasa segment of the North Anatolian Fault: Nat. Hazards Earth Syst. Sci., 8, 1369–1373.
Lienkaemper, J.J. (1984) Statistical relations among earthquake magnitude, surface rupture
length, and surface fault displacement, Bulletin of the Seismological Society of America , vol. 74, no. 6, 2379-2411.
McClusky, S.27 coauthors (2000). Global Positioning System constraintson plate kinematics
and dynamics in the eastern Mediterranean andCaucasus, J. Geophys. Res. 105, 5695–5719.
Meade, B.J., Hager, B.H., McClusky, S.C., Reilinger, R.E., Ergintav, S., Lenk, O., Barka, A.,
Ozener, H., 2002, Estimates of seismic potential in the Marmara Sea region from Block modles of secular deformation constrained by global positioning system measurements. Bulletin of the Seismological Society of America, 86, 1238-1254.
Ministry of Publicworks & Settlement, (2007). Turkish Earthquake Resistant Design Code -
TEDRC, Ankara, Turkey. Oztürk, A., S. Inan, and Z. Tutkun (1985). Abant-Yeniçağa Yöresinin Tektoniği, Bull. Earth
Sci. Cumhuriyet Univ. 2, 35-52. Papazachos, B.C., Papaioannou, Ch.A., Papazachos, C.B. and Savvaidis, A.S., 1999,
Rupture zones in the Aegean region. Tectonophysics, 308, 205-211 Pınar, N. (1953) : Preliminary Note on The Earthquake of Yenice - Gönen, Turkey, 18 March
1953. Bull. Seism. Soc. Am. 43, s. 307-310. Reilinger, R.; McClusky, S.; Vernant, P.; Lawrence, S.; Ergintav, S.; Cakmak, R.; Ozener, H.;
Kadirov, F.; Guliev, I.; Stepanyan, R.; Nadariya, M.; Hahubia, G.; Mahmoud, S.; Sakr, K.; ArRajehi, A.; Paradissis, D.; Al-Aydrus, A.; Prilepin, M.; Guseva, T.; Evren, E.; Dmitrotsa, A.; Filikov, S. V.; Gomez, F.; Al-Ghazzi, R.; Karam, G., 2006, GPS constraints on continental deformation in the Africa-Arabia-Eurasia continental collision zone and implications for the dynamics of plate interactions. J. Geophys. Res., Vol. 111, No. B5, B05411.
Reiter L 1990: Earthquake hazard analysis. Columbia University Press, New York Sadigh, K., Chang, C.-Y., Egan, J. A., Makdisi, F. and R.R. Youngs (1997): Attenuation
relationships for shallow crustal earthquakes based on California strong motion data, Seismological Research Letters, January/February 1997, v. 68 no. 1, 180-189
Schwartz, D. P. and K. J. Coppersmith (1984). Fault behavior and characteristic
earthquakes: examplesfrom the Wasatch and San Andreas faults, J. Geophys. Res. 89, 5681-5698.

85
Stein, R. S., Barka,A. A. and Dieterich, J. H. (1997), Progressive failure onthe North Anatolian fault since 1939 by earthquake stress triggering,Geophys. J. Int., 128, 594– 604.
Şaroğlu, F., Emre, Ö. and Boray, A., 1987, Türkiye'nin diri faylarıve depremsellikleri, MTA
Rap No 8174 (unpublished) [in Turkish]. Şaroğlu, F. (1988) Age and Offset of North Anatolian Fault: METU Journal of Pure and
Applied Sciences, Vol.31, No.1-3, 65-79. Şaroğlu, F., et al. "Yeniçağa-Gerede-Eskipazar arasının jeolojisi ve Kuzey Anadolu Fayı’nın
genel özellikleri." MTA Derleme 9873 (1995) [in Turkish]. Şaroğlu, F. (2010) Neotektonik ve Türkiye'nin Neotektoniğinden Örnekler: TPAO Arama
Daire Başkanlığı Seminer Notları, [in Turkish]. Taşman, C. E. (1944). Gerede-Bolu depremi, Bull. Mineral Res. Explor. Inst. Turkey 1/31,
134 [in Turkish]. Tatar, O., Piper, J.D.A., Gürsoy, H., and Temiz, H., 1996, Regional significance of
neotectonic counterclockwise rotation in Central Turkey. International Geology Review, 38, 697-700.
Tokay, M., 1952, Karadeniz Ereğlisi-Alaplı-Kızıltepe-Alacaağzı Bölgesi Jeolojisi: MTA Derg.,
42/43, 35-78, Ankara [in Turkish]. Tokay, M. 1973. Geologic observations along the North Anatolian Fault Zone from Gerede to
Ilgaz. In: Proceedings of the Symposium on North Anatolian Fault Zone and Earthquake Belt. Mineral Research Institute Publication, Ankara, 12–29 [in Turkish].
Weichert, D. H. (1980), Estimation Of The Earthquake Recurrence ParametersFor Unequal
Observation Periods For DifferentMagnitudes, Bull. Seismol. Soc. Am. 70, no. 4, 1337–1346.
Wells, D. L., and K. J. Coppersmith (1994). New empirical relationshipsamong magnitude,
rupture length, rupture width, rupture area, and surface displacement, Bull. Seismol. Soc. Am. 84, no. 4,974–1002.
Working Group on California Earthquake Probabilities (USGS Working Group)(2003).
EarthquakeProbabilities in the San Francisco Bay Region: 2002–2031, U.S. Geological SocietyOpen File Report 03-214.
Yılmaz Öztürk, N. (2008) Probabilistic seismic hazard analysis: a sensitivity study with
respect to different models: A Thesıs Submitted to the Graduate School of Natural and Applied Sciences of Middle East Technical University.
Yoshioka, T., Okumura, K., Kuşçu, İ., Ömer, E. (2000) Datye, K. R. (1982). Recent surface
faulting of the North Anatolian fault along the 1943 Ladik earthquake ruptures: Bulletin of Geological Survey of Japan vol.(51) (1), 29-35.
Youngs, R. R., and K. J. Coppersmith (1985). Implications of fault slip rates and earthquake
recurrence models to probabilistic seismic hazard estimates, Bull. Seismol. Soc. Am. 75, no. 4, 939–964.