merging the religious congregations and membership studies
TRANSCRIPT
RESEARCH NOTE
Merging the Religious Congregations and MembershipStudies: A Data File for Documenting AmericanReligious Change
Rachel Bacon1 • Roger Finke1 • Dale Jones2
Received: 31 October 2017 / Accepted: 25 April 2018 / Published online: 24 May 2018
� The Author(s) 2018
Abstract The decennial religious congregations and membership studies are a
popular data source for analyzing local religious composition and diversity, but
several methodological challenges hinder merging the datasets for longitudinal
analyses. In this paper, we introduce strategies for addressing four of the most
serious challenges: religious mergers and schisms, changes in membership stan-
dards within certain groups, missing data and changes in county boundaries. In
doing so we successfully merge the 1980, 1990, 2000 and 2010 collections and
build new longitudinal datasets of congregational and membership counts at the
state and county levels. These changes increase religious group representation from
48 to 76, reduce bias from missing data, allow for the more reliable inclusion of
20–23 million adherents in each year, and improve overall ease of use. We also
document instances when corrections were not possible and alert readers to the
limitations of the merged files when measuring change among certain groups. The
new longitudinal files are accessible from theARDA.com.
Keywords Religion census � Religious change � Data � Longitudinal
analyses
The decennial religious congregations and membership studies collected by the
Association of Statisticians of American Religious Bodies are perhaps the most
heavily used datasets on American religion. These data provide counts of adherents
and congregations belonging to dozens of religious groups at the state and county
levels. Scholars of varied backgrounds rely on these data to measure and analyze
& Rachel Bacon
1 The Pennsylvania State University, 211 Oswald Tower, University Park, PA 16802, USA
2 Church of the Nazarene Global Ministry Center, 17001 Prairie Star Parkway, Lenexa,
KS 66220, USA
123
Rev Relig Res (2018) 60:403–422
https://doi.org/10.1007/s13644-018-0339-4
local religious composition, diversity, and the contextual effects of religion (Lim
2013). The four most recent of these datasets (i.e. 1980, 1990, 2000, 2010) have
been collectively downloaded more than 60,000 times from the Association of
Religion Data Archives (theARDA.com) over the past 10 years. Moreover, religious
denominations and local congregations, as well as the media and community
planners, use the files extensively for research, journalism, and planning. In short,
the collections have proven invaluable to a diverse group of users for mapping and
analyzing religious variations across counties, states and the nation.
Despite the popularity of these collections, they are seldom used to measure
changes in religious group size or the composition and diversity of geographic
regions overtime. Several practical and methodological challenges deter researchers
from merging the datasets. This paper introduces methodological strategies to
address four of the most significant challenges for merging the collections: religious
mergers and schisms, changes in membership standards within certain groups,
missing data, and changes in county boundaries. Relying on these strategies we
merge the 1980, 1990, 2000 and 2010 collections and build two datasets of
congregational and membership data across time: one for counties and another for
states.1 When possible, we make corrections or offer improved estimates to
standardize measures and units of analysis over time. When corrections are not
possible, however, we alert readers to the limitations of the merged files.
Before we address the challenges of merging the data collections, however, we
begin with a brief overview of the data collection procedures used. Documenting
how the data are collected helps to clarify and identify the challenges that emerge
when we attempt to merge the collections.
Collecting Congregational and Membership Data
The congregational and membership studies conducted in 1980, 1990, 2000 and
2010 each provide a county-by-county enumeration of religious bodies in the U.S..
Although similar collections also were conducted in 1952 and 1971 (National
Council of Churches 1956; Johnson et al. 1974), we have not included them because
the level of participation was lower and the measures used were less standardized
than the later collections. The remaining four datasets relied on procedures and
measurement criteria that were largely standardized. Nevertheless, we highlight
several important differences between the remaining four collections.
In each of the decennial studies, a study representative contacted all of the major
religious groups and asked them to report on the number of congregations, members
and adherents in their religious group for each county in the U.S.. We focus on
congregational counts and total adherents because these measures are more
consistently reported across religious groups and are more standardized than
membership (membership counts are also unavailable in the online versions of the
1 Both files can be downloaded from theARDA.com at: http://www.thearda.com/Archive/Files/
Descriptions/RCMSMGCY.asp and http://www.thearda.com/Archive/Files/Descriptions/RCMSMGST.
asp.
404 Rev Relig Res (2018) 60:403–422
123
2000 and 2010 datasets). For many groups, especially Christian groups practicing
adult baptism, full membership status was reserved for adults. In contrast, adherents
is a more inclusive measure defined as ‘‘all members, including full members, their
children and the estimated number of other participants who are not considered
members’’ (Quinn et al. 1982). Not all religious groups directly reported both
membership and adherent data. When religious groups reported only adult
members, the data collectors estimated the number of total adherents using a
county-level multiplier.2 Most religious groups who directly reported adherents
agreed to the standard definition, but several groups changed their counting
methodology over the years, usually to make their adherent counts more accurate
and more comparable to other groups. Data collectors also commissioned
independent studies for groups that were difficult to count accurately, such as the
Amish and most non-Christian groups. These independent studies were not always
conducted by the same principal investigators (PIs) from one decade to the next and
employed different methodologies. Among those groups affected by changes in
measurement, therefore, counts differ substantially between the datasets and may
not reliably reflect changes in size.
We also call attention to the fact that the scope of the data collections has
expanded over time, resulting in varying levels of data collection efforts allocated to
specific groups. For the 1980 and 1990 collections the PIs appealed only to Christian
denominations and Jewish groups, capturing the vast majority of white Americans
attending local congregations. Later collections expanded to include independent
Christian congregations as well as non-Christian groups. Despite the PIs’ efforts to
include as many groups as possible, the level of participation varied across the
datasets, with 1093 participating in 1980, 133 in 1990, 149 in 2000, and 236 in 2010.
As shown in greater detail in online supplement Appendix A (all appendices are
available at theARDA.com), however, only 48 of the cumulative 302 participating
groups have both adherent and congregation data in all four decades. The
considerable variation in participation can be partly explained by the expanded
scope of the collection procedures in later decades. Furthermore, some groups
merged, split, or simply reported their data differently from one decade to the next,
while other groups simply participated in some years, but not others. The result is
that most groups have missing data for at least 1 year.
Finally, we should note that the official name of the datasets and the sponsoring
institutions have varied from year to year. The 1980 collection was assembled by
the Glenmary Research Center and the final three collections were conducted by the
Association of Statisticians of American Religious Bodies.4 The 1980 and 1990
2 Reported Church Members 9 [Total Population/(Total Population - Children 13 years and under)]. In
the 2010 collection, 85 groups reported their own adherents while an additional 58 groups reported
members and had adherents estimated by data collectors using the county-level multiplier (Grammich
et al. 2012).3 The 1980 documentation identifies 111 groups because the American Lutheran Church, Lutheran
Church in America, and Association of Evangelical Lutheran Churches reported separately in the
publication, but were merged in the stand-alone 1980 dataset available on the ARDA website.4 The organizations helping to fund one or more of the collection have included: the Lilly Endowment
Inc., John Templeton Foundation, National Council of the Churches of Christ in the U.S.A. (New York),
Rev Relig Res (2018) 60:403–422 405
123
datasets were entitled ‘‘Church and Church Membership in the United States,’’
reflecting their focus on Christian groups. The 2000 dataset was changed to
‘‘Religious Congregations and Membership Study’’ and the 2010 dataset was
revised to the ‘‘U.S. Religion Census: Religious Congregations and Membership
Study.’’ To reduce confusion, throughout this paper we refer to the four datasets as
the religion census data, and the final dataset as the merged or longitudinal file.
The religion census data offer great promise for conducting longitudinal and
spatial analyses on religious change in America, but merging the files and offering
comparable data over time poses multiple challenges. Below we review these
challenges, offer recommendations on how some can be addressed and review the
limitations that will remain.
Addressing the Challenges
In this paper, we address four major challenges in merging the four religion census
datasets. First, we devise a new scheme to address inconsistency in variable names
across the datasets because of mergers, schisms or changes in how a group’s data
were aggregated over time. Second, we document how some groups changed their
standards for reporting adherent and/or congregation counts between collections and
we clearly delineate between the counts that can be rectified and those that cannot.
Third, we reduce the amount of missing data by offering adherent estimates for
groups missing adherent and/or congregation data for a single year and by providing
comparable estimates overtime for groups involved in mergers or schisms. Fourth,
we account for changes in the geographic boundaries of counties, allowing for a
comparable unit of analysis over time. In addressing the problems, we produce a
merged dataset of the four collections that readily permit trend analysis of adherent
and congregation counts, although with some caveats that we clearly identify.
Accounting for Mergers, Schisms, and Other Aggregations
Religious group schisms occur when a group splits into two or more groups, and a
merger occurs when two or more religious groups become one group, which makes
it difficult to consistently identify the same group of adherents over time. This
problem is further compounded by measurement errors, such as accidentally
omitting one of the religious groups involved in the merger, schism or some other
aggregate group change. Since religious groups are geographically concentrated and
therefore non-randomly distributed (Land et al. 1991; Stump 1998; Finke and Stark
2005), the unintentional omission of a group in longitudinal analyses could
Footnote 4 continued
Association of Statisticians of American Religious Bodies, Glenmary Research Center, Glenmary Home
Missioners, Aid Association for Lutherans, Southern Baptist Convention, Lutheran Council in the
U.S.A., African Methodist Episcopal Zion Church, Church of the Nazarene, American Baptist Churches
in the USA, National Association of Free Will Baptists, Presbyterian Church (U.S.A.), United Church of
Christ, Wisconsin Evangelical Lutheran Synod and Evangelical Lutheran Church in America.
406 Rev Relig Res (2018) 60:403–422
123
introduce significant bias. We address both of these problems in the new
longitudinal file.
We begin by replacing the old naming scheme for variables with one that is more
consistent across the data collections. In the stand-alone versions of the religion
census data available online, the variable names assigned to individual religious
groups are different in each dataset. Data are presented in ‘‘wide’’ format (i.e. each
row is a county and the dozens of columns contain the counts of each religious
group’s adherents and congregations separately) and users must rely on the name of
the religious group to match them across datasets. Although most groups retain the
same name for each year they participated, their name can change due to mergers,
splits or changes in how the data were reported. In the case of schisms, adherents
who previously belonged to one religious group are split among two or more groups
after the schism. In mergers, the opposite occurs. In addition, some groups in the
religion census data did not formerly split or merge, but agreed to report together in
1 year and separately in another.
To alleviate the burden of identifying groups across the datasets for users, we first
replaced the old variable names with the unique three-number codes assigned to
each religious group by the religion census data collectors. Second, we created new
aggregate cases that combine all groups affected by a schism, merger, or other group
count change into a single group. The full listing of religious group names and their
accompanying codes are in Appendix A and the ‘‘notes’’ column identifies which
groups are combined on account of a merge, split or change in aggregated reporting.
Our solution resulted in eight new aggregate groups created from 27 individual
religious groups:
(a) A total of five groups present in the religion census data were affected by a
schism and were combined into two new groups for the longitudinal file.
(b) Six groups experienced a formal merger and were combined into two new
groups.
(c) Sixteen groups chose to report together in 1 year but separately in another,
and we subsequently combined them into four new groups.
Table 1 identifies the affected religious groups and their sizes. Newly combined
groups are now assigned the three-digit code that matches the largest group among
them, followed by the letter ‘‘b’’ to indicate that multiple groups were combined to
make the new group. Data in the merged file are also presented in ‘‘long’’ format
(i.e. rows now represent religious groups in a specific county and year, and only two
columns are used to identify adherent and congregation counts). Groups that would
otherwise be dropped because they do not appear to participate across the datasets
are now included, resulting in nearly two million additional adherents across all four
datasets. In this way, the longitudinal file includes both the combined groups and the
individual counts of each religious group that was included in the combined group.5
Once we identified the groups that needed to be combined, however, some data
remained missing. In five instances, one of the groups included in a combined group
5 The merged file also includes a variable that flags whether each case is included elsewhere in a
combined group or is itself a combined group.
Rev Relig Res (2018) 60:403–422 407
123
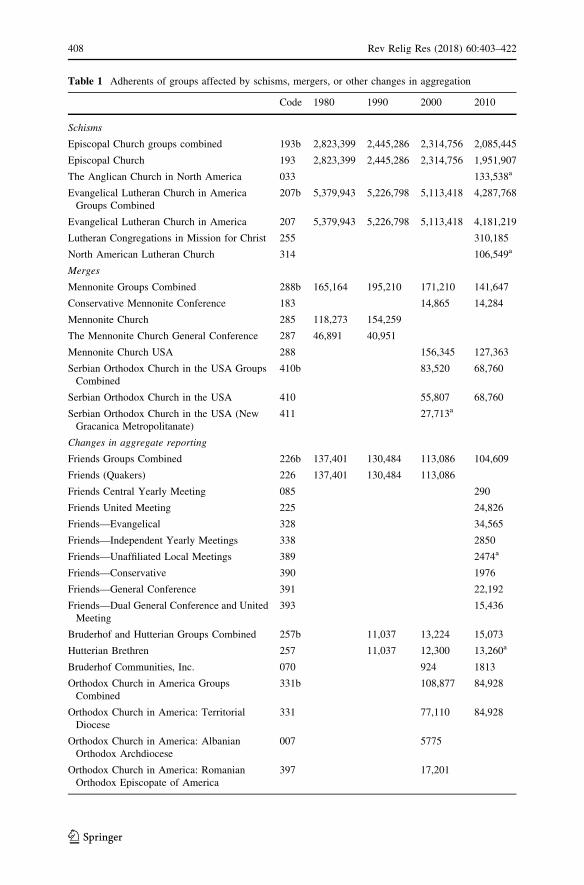
Table 1 Adherents of groups affected by schisms, mergers, or other changes in aggregation
Code 1980 1990 2000 2010
Schisms
Episcopal Church groups combined 193b 2,823,399 2,445,286 2,314,756 2,085,445
Episcopal Church 193 2,823,399 2,445,286 2,314,756 1,951,907
The Anglican Church in North America 033 133,538a
Evangelical Lutheran Church in America
Groups Combined
207b 5,379,943 5,226,798 5,113,418 4,287,768
Evangelical Lutheran Church in America 207 5,379,943 5,226,798 5,113,418 4,181,219
Lutheran Congregations in Mission for Christ 255 310,185
North American Lutheran Church 314 106,549a
Merges
Mennonite Groups Combined 288b 165,164 195,210 171,210 141,647
Conservative Mennonite Conference 183 14,865 14,284
Mennonite Church 285 118,273 154,259
The Mennonite Church General Conference 287 46,891 40,951
Mennonite Church USA 288 156,345 127,363
Serbian Orthodox Church in the USA Groups
Combined
410b 83,520 68,760
Serbian Orthodox Church in the USA 410 55,807 68,760
Serbian Orthodox Church in the USA (New
Gracanica Metropolitanate)
411 27,713a
Changes in aggregate reporting
Friends Groups Combined 226b 137,401 130,484 113,086 104,609
Friends (Quakers) 226 137,401 130,484 113,086
Friends Central Yearly Meeting 085 290
Friends United Meeting 225 24,826
Friends—Evangelical 328 34,565
Friends—Independent Yearly Meetings 338 2850
Friends—Unaffiliated Local Meetings 389 2474a
Friends—Conservative 390 1976
Friends—General Conference 391 22,192
Friends—Dual General Conference and United
Meeting
393 15,436
Bruderhof and Hutterian Groups Combined 257b 11,037 13,224 15,073
Hutterian Brethren 257 11,037 12,300 13,260a
Bruderhof Communities, Inc. 070 924 1813
Orthodox Church in America Groups
Combined
331b 108,877 84,928
Orthodox Church in America: Territorial
Diocese
331 77,110 84,928
Orthodox Church in America: Albanian
Orthodox Archdiocese
007 5775
Orthodox Church in America: Romanian
Orthodox Episcopate of America
397 17,201
408 Rev Relig Res (2018) 60:403–422
123
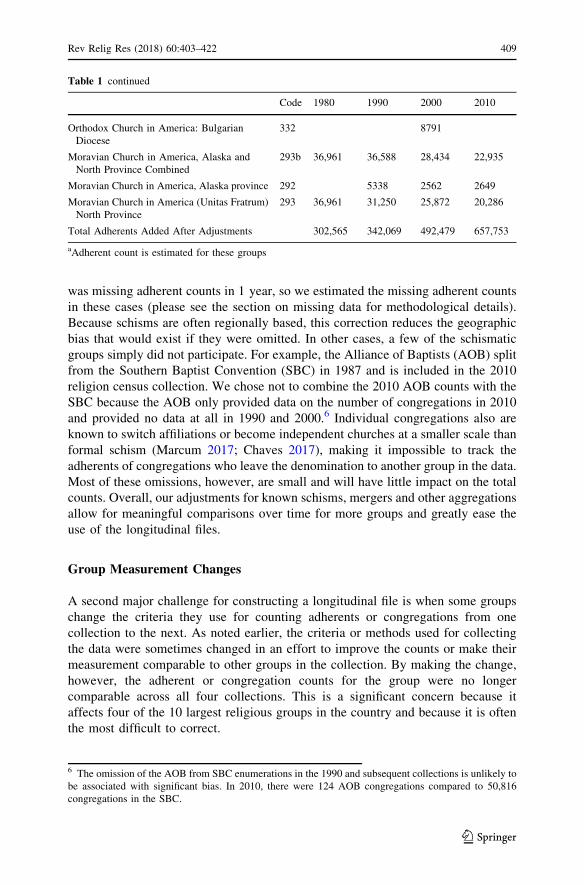
was missing adherent counts in 1 year, so we estimated the missing adherent counts
in these cases (please see the section on missing data for methodological details).
Because schisms are often regionally based, this correction reduces the geographic
bias that would exist if they were omitted. In other cases, a few of the schismatic
groups simply did not participate. For example, the Alliance of Baptists (AOB) split
from the Southern Baptist Convention (SBC) in 1987 and is included in the 2010
religion census collection. We chose not to combine the 2010 AOB counts with the
SBC because the AOB only provided data on the number of congregations in 2010
and provided no data at all in 1990 and 2000.6 Individual congregations also are
known to switch affiliations or become independent churches at a smaller scale than
formal schism (Marcum 2017; Chaves 2017), making it impossible to track the
adherents of congregations who leave the denomination to another group in the data.
Most of these omissions, however, are small and will have little impact on the total
counts. Overall, our adjustments for known schisms, mergers and other aggregations
allow for meaningful comparisons over time for more groups and greatly ease the
use of the longitudinal files.
Group Measurement Changes
A second major challenge for constructing a longitudinal file is when some groups
change the criteria they use for counting adherents or congregations from one
collection to the next. As noted earlier, the criteria or methods used for collecting
the data were sometimes changed in an effort to improve the counts or make their
measurement comparable to other groups in the collection. By making the change,
however, the adherent or congregation counts for the group were no longer
comparable across all four collections. This is a significant concern because it
affects four of the 10 largest religious groups in the country and because it is often
the most difficult to correct.
Table 1 continued
Code 1980 1990 2000 2010
Orthodox Church in America: Bulgarian
Diocese
332 8791
Moravian Church in America, Alaska and
North Province Combined
293b 36,961 36,588 28,434 22,935
Moravian Church in America, Alaska province 292 5338 2562 2649
Moravian Church in America (Unitas Fratrum)
North Province
293 36,961 31,250 25,872 20,286
Total Adherents Added After Adjustments 302,565 342,069 492,479 657,753
aAdherent count is estimated for these groups
6 The omission of the AOB from SBC enumerations in the 1990 and subsequent collections is unlikely to
be associated with significant bias. In 2010, there were 124 AOB congregations compared to 50,816
congregations in the SBC.
Rev Relig Res (2018) 60:403–422 409
123
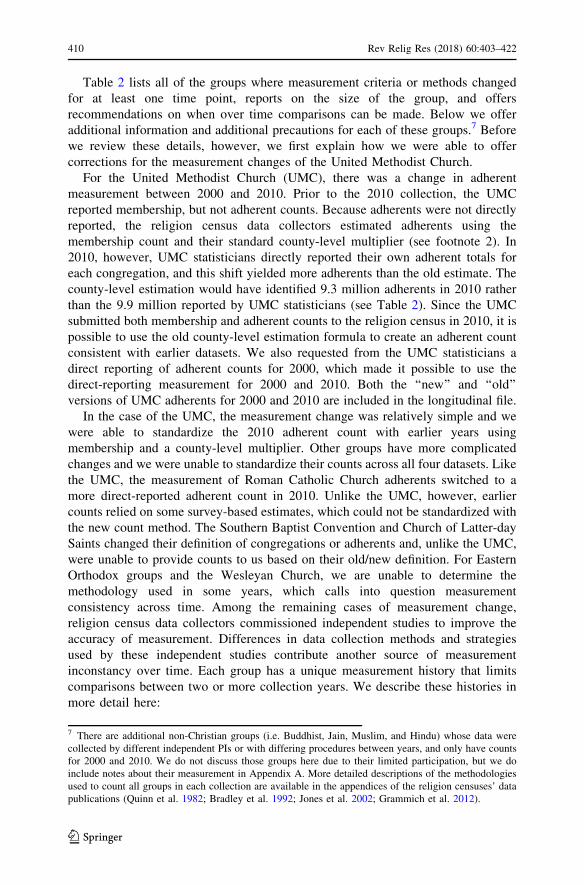
Table 2 lists all of the groups where measurement criteria or methods changed
for at least one time point, reports on the size of the group, and offers
recommendations on when over time comparisons can be made. Below we offer
additional information and additional precautions for each of these groups.7 Before
we review these details, however, we first explain how we were able to offer
corrections for the measurement changes of the United Methodist Church.
For the United Methodist Church (UMC), there was a change in adherent
measurement between 2000 and 2010. Prior to the 2010 collection, the UMC
reported membership, but not adherent counts. Because adherents were not directly
reported, the religion census data collectors estimated adherents using the
membership count and their standard county-level multiplier (see footnote 2). In
2010, however, UMC statisticians directly reported their own adherent totals for
each congregation, and this shift yielded more adherents than the old estimate. The
county-level estimation would have identified 9.3 million adherents in 2010 rather
than the 9.9 million reported by UMC statisticians (see Table 2). Since the UMC
submitted both membership and adherent counts to the religion census in 2010, it is
possible to use the old county-level estimation formula to create an adherent count
consistent with earlier datasets. We also requested from the UMC statisticians a
direct reporting of adherent counts for 2000, which made it possible to use the
direct-reporting measurement for 2000 and 2010. Both the ‘‘new’’ and ‘‘old’’
versions of UMC adherents for 2000 and 2010 are included in the longitudinal file.
In the case of the UMC, the measurement change was relatively simple and we
were able to standardize the 2010 adherent count with earlier years using
membership and a county-level multiplier. Other groups have more complicated
changes and we were unable to standardize their counts across all four datasets. Like
the UMC, the measurement of Roman Catholic Church adherents switched to a
more direct-reported adherent count in 2010. Unlike the UMC, however, earlier
counts relied on some survey-based estimates, which could not be standardized with
the new count method. The Southern Baptist Convention and Church of Latter-day
Saints changed their definition of congregations or adherents and, unlike the UMC,
were unable to provide counts to us based on their old/new definition. For Eastern
Orthodox groups and the Wesleyan Church, we are unable to determine the
methodology used in some years, which calls into question measurement
consistency across time. Among the remaining cases of measurement change,
religion census data collectors commissioned independent studies to improve the
accuracy of measurement. Differences in data collection methods and strategies
used by these independent studies contribute another source of measurement
inconstancy over time. Each group has a unique measurement history that limits
comparisons between two or more collection years. We describe these histories in
more detail here:
7 There are additional non-Christian groups (i.e. Buddhist, Jain, Muslim, and Hindu) whose data were
collected by different independent PIs or with differing procedures between years, and only have counts
for 2000 and 2010. We do not discuss those groups here due to their limited participation, but we do
include notes about their measurement in Appendix A. More detailed descriptions of the methodologies
used to count all groups in each collection are available in the appendices of the religion censuses’ data
publications (Quinn et al. 1982; Bradley et al. 1992; Jones et al. 2002; Grammich et al. 2012).
410 Rev Relig Res (2018) 60:403–422
123
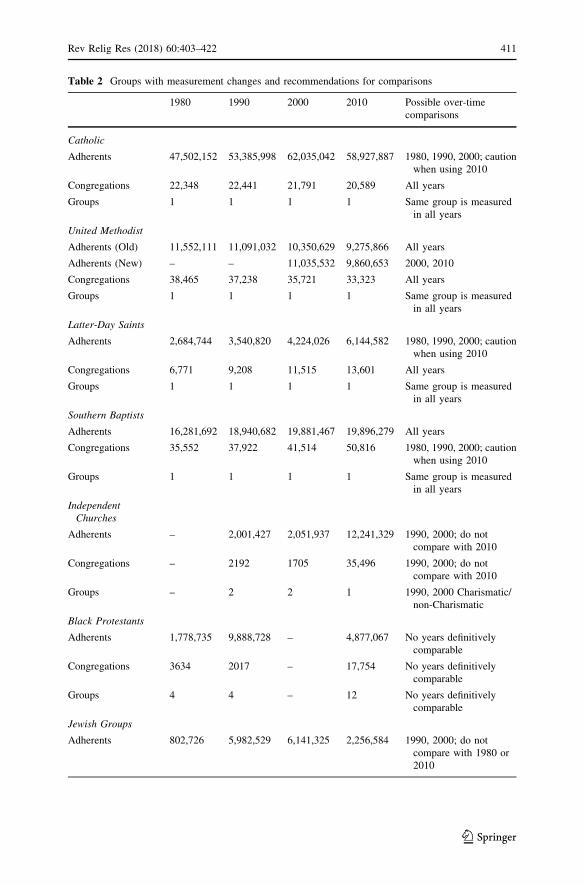
Table 2 Groups with measurement changes and recommendations for comparisons
1980 1990 2000 2010 Possible over-time
comparisons
Catholic
Adherents 47,502,152 53,385,998 62,035,042 58,927,887 1980, 1990, 2000; caution
when using 2010
Congregations 22,348 22,441 21,791 20,589 All years
Groups 1 1 1 1 Same group is measured
in all years
United Methodist
Adherents (Old) 11,552,111 11,091,032 10,350,629 9,275,866 All years
Adherents (New) – – 11,035,532 9,860,653 2000, 2010
Congregations 38,465 37,238 35,721 33,323 All years
Groups 1 1 1 1 Same group is measured
in all years
Latter-Day Saints
Adherents 2,684,744 3,540,820 4,224,026 6,144,582 1980, 1990, 2000; caution
when using 2010
Congregations 6,771 9,208 11,515 13,601 All years
Groups 1 1 1 1 Same group is measured
in all years
Southern Baptists
Adherents 16,281,692 18,940,682 19,881,467 19,896,279 All years
Congregations 35,552 37,922 41,514 50,816 1980, 1990, 2000; caution
when using 2010
Groups 1 1 1 1 Same group is measured
in all years
Independent
Churches
Adherents – 2,001,427 2,051,937 12,241,329 1990, 2000; do not
compare with 2010
Congregations – 2192 1705 35,496 1990, 2000; do not
compare with 2010
Groups – 2 2 1 1990, 2000 Charismatic/
non-Charismatic
Black Protestants
Adherents 1,778,735 9,888,728 – 4,877,067 No years definitively
comparable
Congregations 3634 2017 – 17,754 No years definitively
comparable
Groups 4 4 – 12 No years definitively
comparable
Jewish Groups
Adherents 802,726 5,982,529 6,141,325 2,256,584 1990, 2000; do not
compare with 1980 or
2010
Rev Relig Res (2018) 60:403–422 411
123
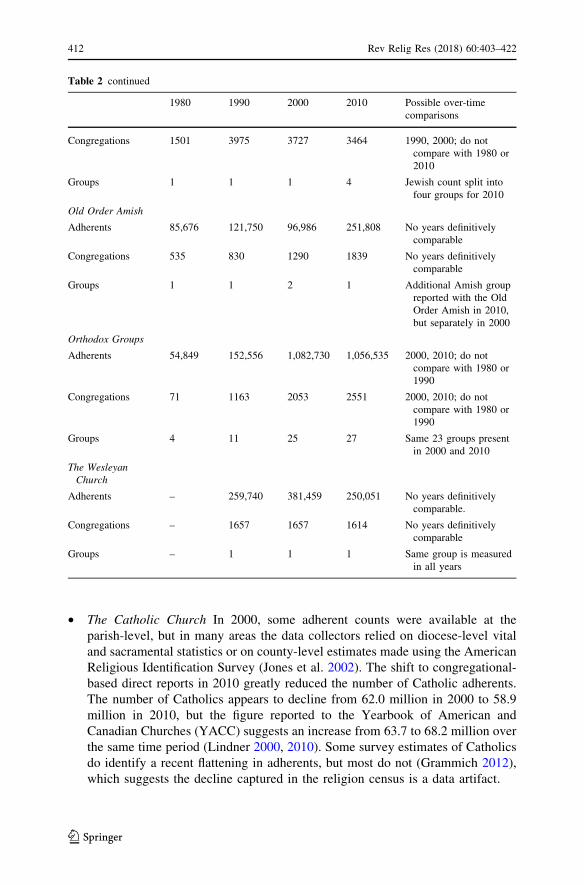
• The Catholic Church In 2000, some adherent counts were available at the
parish-level, but in many areas the data collectors relied on diocese-level vital
and sacramental statistics or on county-level estimates made using the American
Religious Identification Survey (Jones et al. 2002). The shift to congregational-
based direct reports in 2010 greatly reduced the number of Catholic adherents.
The number of Catholics appears to decline from 62.0 million in 2000 to 58.9
million in 2010, but the figure reported to the Yearbook of American and
Canadian Churches (YACC) suggests an increase from 63.7 to 68.2 million over
the same time period (Lindner 2000, 2010). Some survey estimates of Catholics
do identify a recent flattening in adherents, but most do not (Grammich 2012),
which suggests the decline captured in the religion census is a data artifact.
Table 2 continued
1980 1990 2000 2010 Possible over-time
comparisons
Congregations 1501 3975 3727 3464 1990, 2000; do not
compare with 1980 or
2010
Groups 1 1 1 4 Jewish count split into
four groups for 2010
Old Order Amish
Adherents 85,676 121,750 96,986 251,808 No years definitively
comparable
Congregations 535 830 1290 1839 No years definitively
comparable
Groups 1 1 2 1 Additional Amish group
reported with the Old
Order Amish in 2010,
but separately in 2000
Orthodox Groups
Adherents 54,849 152,556 1,082,730 1,056,535 2000, 2010; do not
compare with 1980 or
1990
Congregations 71 1163 2053 2551 2000, 2010; do not
compare with 1980 or
1990
Groups 4 11 25 27 Same 23 groups present
in 2000 and 2010
The Wesleyan
Church
Adherents – 259,740 381,459 250,051 No years definitively
comparable.
Congregations – 1657 1657 1614 No years definitively
comparable
Groups – 1 1 1 Same group is measured
in all years
412 Rev Relig Res (2018) 60:403–422
123
• Church of Latter-day Saints (LDS) For the 2000 collection, the LDS Church
reported a total of 4.2 million adherents. This total excluded members who were
baptized, but not associated with a specific congregation. A more inclusive count
is the 5.2 million members reported by the Church in its Almanac and to the
YACC (Lindner 2000). For the 2010 collection, the LDS Church changed its
procedures to include the previously excluded baptized persons and reported an
adherent total of 6.1 million, a figure more consistent with what it has reported
elsewhere (Lindner 2010) and more comparable to how other denominations
count adherents in the religion census.
• The Southern Baptist Convention (SBC) The SBC reported adherents in a
consistent way over time, but changed how they defined congregations. Prior to
2010, the congregation count did not include small ‘‘mission’’ gatherings,
although adherents attending ‘‘missions’’ were counted. The SBC revised their
2010 methodology to include their mission congregations and therefore became
consistent with other religious groups (Grammich et al. 2012). As a result, there
is a sudden increase of 9000 SBC congregations between 2000 and 2010 despite
negligible growth in the number of adherents.
• Eastern Orthodox groups In 1980 and 1990, four Orthodox groups directly
reported adherent counts and an additional seven groups provided congrega-
tional counts for 1990, but they provided no documentation regarding counting
methodology (Quinn et al. 1982; Bradley et al. 1992). For the 2000 and 2010
collections, however, data on a larger number of Eastern Orthodox groups were
collected by a single PI using a more standardized definition of ‘‘adherents that
included both adults and children known to participate in services at the local
parish’’ (Jones et al. 2002). As a result, the counts for several Orthodox groups
change suddenly between 1990 and 2000.
• The Wesleyan Church The documentation of data collection methodologies are
available for 2000 and 2010, but not for 1990, and a significant change in
estimation is suggested between decades. In 2000, the Wesleyan Church
provided adherent counts based on their own record-keeping, reflecting ‘‘those
who have some contact with the church through its various departments’’ (Jones
et al. 2002). In 2010, they estimated that adherents were simply 30 percent more
than the average attendance (Grammich et al. 2012).
• Black Protestant groups Only four historically Black Protestant groups directly
reported their own counts in the 1980 collection (Quinn et al. 1982). In 1990,
three Black Protestant groups participated and an independent study estimated
the size of Black Baptist Churches, but the estimates did not include any
congregational counts (Bradley et al. 1992). Black Protestant groups are entirely
absent in the 2000 collection, although Finke and Scheitle (2005) did create a
state-level multiplier based on survey data to estimate the size of all Black
Protestant adherents for that year. Relying on congregational estimates from the
online Infogroup database on religious organizations, the 2010 collection
included membership estimates for eight Black Protestant denominations and
congregational estimates for 12. Adherent counts were not available for all
Black Protestant congregations, and so data collectors estimated a membership
of 100 for those congregations (Grammich et al. 2012).
Rev Relig Res (2018) 60:403–422 413
123
• Jewish groups The 1980 collection included direct counts of Conservative and
Reform Judaism who were members of the United Synagogues of America
(Quinn et al. 1982). The 2010 count also has direct reporting, but from an
expanded four branches of Judaism (Conservative, Reconstructionist, Reform
and Orthodox) (Grammich et al. 2012). In 1990 and 2000, however, the data
collectors relied on the American Jewish Yearbook to identify adherents and the
Jewish Almanac Yellow Pages and phone directories to identify congregations
(Bradley et al. 1992; Jones et al. 2002).
• Independent Churches No efforts were made to count Independent Churches in
1980 and their measurement changed significantly between 2000 and 2010. In
1990 and 2000, the Megachurch Research Center gathered information on large,
independent churches for the religion census by calling the churches via
telephone, identifying about two million adherents in each year (Bradley et al.
1992; Jones et al. 2002). In 2010, a more exhaustive study using Internet listings
was possible, identifying 10 million more adherents than in the 1990 and 2000
religion censuses (Grammich et al. 2012).
• Old Order Amish Adherents in 1980 and 1990 were estimated using an arbitrary
congregational size based on the age of the church (Quinn et al. 1982; Bradley
et al. 1992).8 In 2000, the data were supplied from the Mennonite publishing
house and were more congregationally specific in estimation (Jones et al. 2002).
For 2010, an exhaustive independent study was commissioned to conduct an
accurate census using Amish settlement directories (Grammich et al. 2012).
In summary, longitudinal analyses specific to these groups is limited. Some of the
caveats against overtime comparisons are negligible, depending on research
questions and analytic plans.9 For instance, Catholic and LDS adherent data are
comparable between 1980 and 2000, and the congregational data is comparable
through 2010. Researchers who wish to include the United Methodists in their
analyses must choose between the slightly less accurate county-level UMC adherent
estimates for a full 1980–2010 comparison, or use the newer adherent reports that
are limited to 2000 and 2010. Similarly, some comparisons can be made among the
Amish between 1980 and 1990, the Jewish and Independent Church counts between
1990 and 2000, and many Orthodox groups can be compared between 2000 and
2010. We strongly advise against making any comparisons at all among Black
Protestant groups or the Wesleyan Church.
Missing Data
When merging the data, a third challenge is accounting for missing data in one or
more of the collections. The vast majority of groups in the religion census have
missing data in at least one of the datasets. Due to the expanding scope of the
8 For the 1990 collection, determined as 150 per congregation for settlements established before 1987
and those established in 1987 and 1988 were assigned 100 adherents per congregation. Settlements
established in 1989 and 1990 had 50 per congregation (Bradley et al. 1992).9 We include a flag variable in the merged file to identify groups with measurement problems that could
prevent over-time comparisons.
414 Rev Relig Res (2018) 60:403–422
123
collections as well as individual group’s partial or non-participation in one or more
years, the pattern of missing data in the religion census is diverse. Using two
missing data strategies, we were able to estimate the missing data of 40 religious
groups. Of these, 26 groups become available across all four datasets, 10 groups are
limited to a 2 or 3-year comparison, and the remaining four groups are included in
an aggregate grouping (as noted in the merger and schism section). These strategies
increased group participation10 across all four datasets from 48 to 76, and from 92 to
111 in a 2-year comparison between 2000 and 2010. Appendix B lists all the
affected groups and their new estimates.
The first missing data strategy uses simple linear interpolation and extrapolation
to estimate the number of adherents and congregations among 23 groups who are
missing both data types in only one of the four datasets. We limited our estimates to
these 23 groups in the interest of retaining as many groups as possible without
compromising the reliability and validity of the counts. Linear interpolation
estimates the values between two points in time, and extrapolation estimates values
beyond them, by continuing the line formed between the points.11 An interpolation
and extrapolation strategy is commonly used in economics research to fill in missing
data for entire variable values. Past research has used interpolation/extrapolation
with the religion census data to estimate values of total adherence in the years
between and beyond the decennial datasets (Hillary and Hui 2009; Dyreng et al.
2012; Boone et al. 2013). The main assumption in this strategy is that adherent and
congregation size has a linear relationship with time. This is the case for the vast
majority of groups in the religion census data, and studies on church growth and
decline usually observe a linear relationship with time (Finke and Stark 1986; Blau
et al. 1993; Hadaway and Roozen 1993; Marcum 2017). Because we limited our use
of the interpolation/extrapolation strategy to select groups with nearly complete
data, we believe that the estimates are reasonable within the assumption of linear
growth/decline.12 We estimated the counts of 14 groups via extrapolation for 1980
or 2010, and another nine groups had their data estimated via interpolation for either
1990 or 2000, adding a cumulative 1.5 million adherents to the longitudinal file (see
Table 3).13
The second missing data strategy was applied to 17 groups. These groups had
congregation counts but did not have adherent counts in either the 2000 or 2010
dataset. We estimated adherent counts in the missing year by multiplying their
congregation counts by the observed adherent-to-congregation ratios (i.e. congre-
gation size) within each county in the other year. We focused on the 2000–2010
time period because the majority of adherent-only missing data occurs in these
10 Full group participation is reserved for groups with both adherent and congregation data. This count
includes groups with changes in measurement (e.g. Catholics).11 We used the ‘‘ipolate’’ command with the epolate option in Stata 14, which uses the following general
formula: y ¼ y1�y0
x1�x0ðx� x0Þ þ y0:
12 For some groups, the aggregate count does not appear linear. This is because the formula is applied at
the county level. The group may be in decline in some counties, but growing in others, resulting in an
overall shift in size contrary to expectations.13 In the merged file, a flag variable identifies the counts that are estimated using each missing data
method.
Rev Relig Res (2018) 60:403–422 415
123
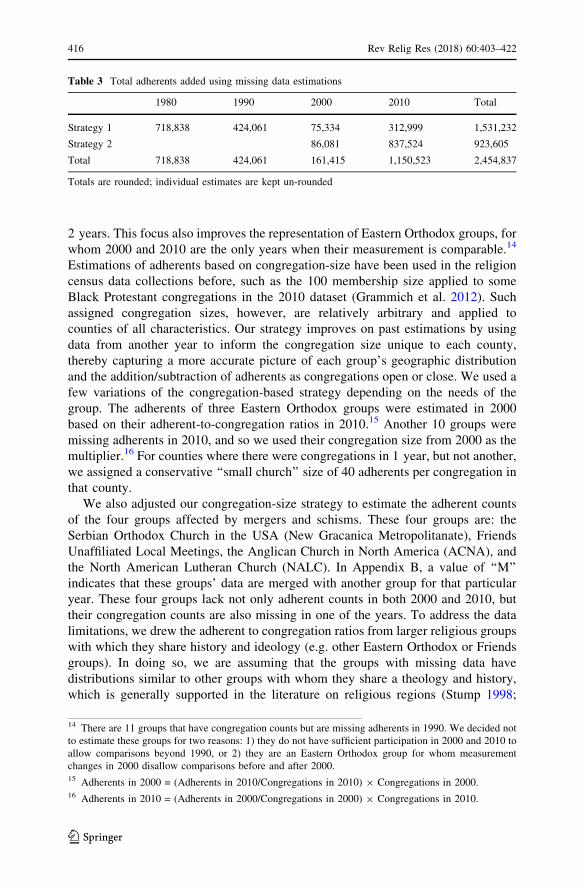
2 years. This focus also improves the representation of Eastern Orthodox groups, for
whom 2000 and 2010 are the only years when their measurement is comparable.14
Estimations of adherents based on congregation-size have been used in the religion
census data collections before, such as the 100 membership size applied to some
Black Protestant congregations in the 2010 dataset (Grammich et al. 2012). Such
assigned congregation sizes, however, are relatively arbitrary and applied to
counties of all characteristics. Our strategy improves on past estimations by using
data from another year to inform the congregation size unique to each county,
thereby capturing a more accurate picture of each group’s geographic distribution
and the addition/subtraction of adherents as congregations open or close. We used a
few variations of the congregation-based strategy depending on the needs of the
group. The adherents of three Eastern Orthodox groups were estimated in 2000
based on their adherent-to-congregation ratios in 2010.15 Another 10 groups were
missing adherents in 2010, and so we used their congregation size from 2000 as the
multiplier.16 For counties where there were congregations in 1 year, but not another,
we assigned a conservative ‘‘small church’’ size of 40 adherents per congregation in
that county.
We also adjusted our congregation-size strategy to estimate the adherent counts
of the four groups affected by mergers and schisms. These four groups are: the
Serbian Orthodox Church in the USA (New Gracanica Metropolitanate), Friends
Unaffiliated Local Meetings, the Anglican Church in North America (ACNA), and
the North American Lutheran Church (NALC). In Appendix B, a value of ‘‘M’’
indicates that these groups’ data are merged with another group for that particular
year. These four groups lack not only adherent counts in both 2000 and 2010, but
their congregation counts are also missing in one of the years. To address the data
limitations, we drew the adherent to congregation ratios from larger religious groups
with which they share history and ideology (e.g. other Eastern Orthodox or Friends
groups). In doing so, we are assuming that the groups with missing data have
distributions similar to other groups with whom they share a theology and history,
which is generally supported in the literature on religious regions (Stump 1998;
Table 3 Total adherents added using missing data estimations
1980 1990 2000 2010 Total
Strategy 1 718,838 424,061 75,334 312,999 1,531,232
Strategy 2 86,081 837,524 923,605
Total 718,838 424,061 161,415 1,150,523 2,454,837
Totals are rounded; individual estimates are kept un-rounded
14 There are 11 groups that have congregation counts but are missing adherents in 1990. We decided not
to estimate these groups for two reasons: 1) they do not have sufficient participation in 2000 and 2010 to
allow comparisons beyond 1990, or 2) they are an Eastern Orthodox group for whom measurement
changes in 2000 disallow comparisons before and after 2000.15 Adherents in 2000 = (Adherents in 2010/Congregations in 2010) 9 Congregations in 2000.16 Adherents in 2010 = (Adherents in 2000/Congregations in 2000) 9 Congregations in 2010.
416 Rev Relig Res (2018) 60:403–422
123
Bauer 2012). For the Serbian Orthodox Church, we used the ratio of all other
Orthodox groups that participated in the 2000 dataset and multiplied the ratio by the
number of Serbian congregations. For the Friends Unaffiliated Local Meetings we
used the ratio from all other participating Friends groups in 2010. For the ACNA
and NALC, we used all Evangelical Protestants.17 Both the ACNA and the NALC
have national-level statistics about their congregation and membership size on their
official websites, which provide additional insight into the size that the congrega-
tions of each group tend to be. Their national-level congregational size was
weighted by the geographical representation of other Evangelical Protestants in the
2010 dataset.18 The congregation-size estimate recovers nearly 1 million adherents
across 2000 and 2010, and both strategies together add nearly 2.5 million across all
4 years of data (Table 3).
The two missing data strategies are not without caveats. The congregation-size
strategy assumes that the average congregation size within the county for each
group is the same over two decades. In reality, it is foreseeable that the addition or
loss of a congregation could alter the average congregation size in a county, and
recent evidence suggests that smaller congregations are more likely to close than
large ones, which are becoming even larger in recent decades (Chaves 2017). These
factors indicate that change in average congregation size between decades does
occur, and our approach masks the co-existence of small and large congregations
that open or close at different rates within the same county. Among the schism/
merger groups, we further assumed that the congregation size and/or distribution of
the group matched that of ideologically similar religious groups, although there are
likely counties where this is not the case. Our interpolation and extrapolation
techniques also provide relatively simplistic estimates of missing data, where the
only relationship considered is a linear one with time. Extrapolation also cannot
predict future geographic expansion, but this problem is limited to only two groups
for whom we extrapolated values in the 2010 dataset. The simplicity of our missing
data methods, however, has future value; it is relatively easy for data users to update
them using the 2020 religion census when it becomes available. We recommend that
researchers use the missing data estimates within larger religious group traditions or
families, such as measuring the size of all Evangelical or Friends groups, rather than
to accurately represent the growth or decline of the specific religious group. Overall,
we believe our estimates improve the data by increasing group representation and
17 We chose Evangelical Protestants as the larger category for the ACNA and NALC because the groups
are more conservative than their Mainline ‘parent’ denominations, and also because the Evangelical
adjustment produced estimates closer to each group’s national membership than the Mainline adjustment
would have. Evangelical Protestants in the 2010 dataset were identified using RELTRAD categorizations
as a guide (Steensland et al. 2000).18 We used the following formula: Missing Group Adherents = Group’s National Congregation
Size 9 (County Evangelical Protestant Congregation Size/National Evangelical Protestant Congregation
Size) 9 Group Congregations. The national congregation size for each group came from their official
statistical reports available online. The ACNA’s most recent online report (Anglican Church in North
America 2017) identified 116 adherents per congregation; we used a size of 100 as a more conservative
estimate. The national congregation size for the NALC was 352 in 2015 (North American Lutheran
Church 2016); we used a size of 300 as a more conservative estimate.
Rev Relig Res (2018) 60:403–422 417
123
allowing for the adherent counts of groups involved in mergers or schisms to be
included in aggregate groupings appropriate for longitudinal analyses.
Standardizing Areal Units
Whereas the first three challenges addressed how to offer comparable counts of
congregations and adherents over time, the final challenge is concerned with the unit
of analysis. While no changes in state boundaries have occurred in many decades, a
total of 92 counties are affected by changes between 1980 and 2010 that are
problematic for data users. For instance, the creation of a county results in the re-
allocation of other counties’ population into the new county, while the dissolution of
a county results in its population being allocated to one or more surrounding
counties. The 1980 and 1990 religion census datasets also are distinct from the 2000
and 2010 datasets in how they treat independent cities in Virginia. In 1980 and
1990, many (but not all) of the religious group counts in independent cities were
attributed to their surrounding counties, making it appear that the independent cities
have missing data and that the surrounding counties had more adherents than actual
(Quinn et al. 1982; Bradley et al. 1992). In 2000 and 2010, the counts in
independent cities have adherent/congregation counts separate from their surround-
ing counties. This problem makes it impossible to compare the counts in Virginia
independent cities and surrounding counties from 1980/1990 to 2000/2010 without
aggregating them.
To keep counties consistent across all four waves, we created aggregate county
units to standardize their boundaries. For instance, the creation of Broomfield
County in Colorado in 2001 took territory from four surrounding counties. We
therefore merged all five of the counties for 1980–2010 to maintain consistent
boundaries. Likewise, counties that were dissolved over the time period were
combined with the counties they dissolved into for the years prior to their
dissolution. South Boston City and Clifton Forge City counties in Virginia were
among the counties in the U.S. that dissolved over the time period, as are several
territories in Alaska. Secondly, we addressed the problem of the independent cities
in Virginia, which affected 61 county and county-equivalents. We merged the
independent cities with their ‘parent’ counties in 2000 and 2010, just as they appear
in 1980 and 1990. Each of the county mergers are detailed in Appendix C. In the
original 2010 dataset, there are 3149 counties. After implementing the necessary
county mergers between 1980 and 2010, there are 3096 counties and county-
equivalents in the new longitudinal file.19
19 The longitudinal file is not available with de-aggregated counties. Aggregated county counts were
necessary to calculate missing data and could not be deconstructed afterwards without additional bias.
Researchers may contact the authors to inquire about altering the data to accommodate fewer
aggregations (e.g. examining only 2000–2010 data doesn’t require Virginia Independent City
aggregations).
418 Rev Relig Res (2018) 60:403–422
123
Summary of Improvements and Remaining Limitations
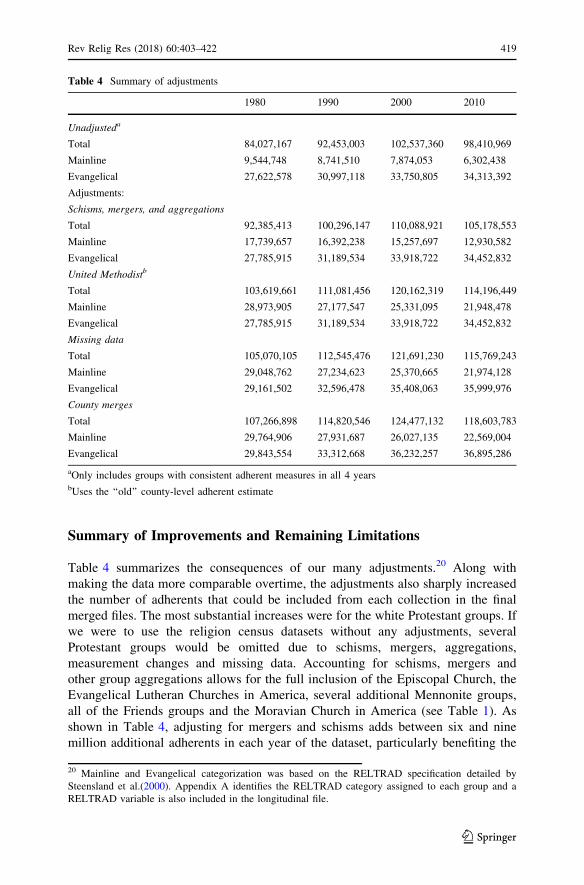
Table 4 summarizes the consequences of our many adjustments.20 Along with
making the data more comparable overtime, the adjustments also sharply increased
the number of adherents that could be included from each collection in the final
merged files. The most substantial increases were for the white Protestant groups. If
we were to use the religion census datasets without any adjustments, several
Protestant groups would be omitted due to schisms, mergers, aggregations,
measurement changes and missing data. Accounting for schisms, mergers and
other group aggregations allows for the full inclusion of the Episcopal Church, the
Evangelical Lutheran Churches in America, several additional Mennonite groups,
all of the Friends groups and the Moravian Church in America (see Table 1). As
shown in Table 4, adjusting for mergers and schisms adds between six and nine
million additional adherents in each year of the dataset, particularly benefiting the
Table 4 Summary of adjustments
1980 1990 2000 2010
Unadjusteda
Total 84,027,167 92,453,003 102,537,360 98,410,969
Mainline 9,544,748 8,741,510 7,874,053 6,302,438
Evangelical 27,622,578 30,997,118 33,750,805 34,313,392
Adjustments:
Schisms, mergers, and aggregations
Total 92,385,413 100,296,147 110,088,921 105,178,553
Mainline 17,739,657 16,392,238 15,257,697 12,930,582
Evangelical 27,785,915 31,189,534 33,918,722 34,452,832
United Methodistb
Total 103,619,661 111,081,456 120,162,319 114,196,449
Mainline 28,973,905 27,177,547 25,331,095 21,948,478
Evangelical 27,785,915 31,189,534 33,918,722 34,452,832
Missing data
Total 105,070,105 112,545,476 121,691,230 115,769,243
Mainline 29,048,762 27,234,623 25,370,665 21,974,128
Evangelical 29,161,502 32,596,478 35,408,063 35,999,976
County merges
Total 107,266,898 114,820,546 124,477,132 118,603,783
Mainline 29,764,906 27,931,687 26,027,135 22,569,004
Evangelical 29,843,554 33,312,668 36,232,257 36,895,286
aOnly includes groups with consistent adherent measures in all 4 yearsbUses the ‘‘old’’ county-level adherent estimate
20 Mainline and Evangelical categorization was based on the RELTRAD specification detailed by
Steensland et al.(2000). Appendix A identifies the RELTRAD category assigned to each group and a
RELTRAD variable is also included in the longitudinal file.
Rev Relig Res (2018) 60:403–422 419
123
Mainline aggregate count. Including the United Methodist Church after adjusting
for their measurement change also greatly increases Mainline adherents by about 10
million each year. Including the missing data estimates (net those involved in the
mergers and schisms) adds approximately 1.5 million more adherents each year. We
also can see the benefit of the county mergers in the last section of Table 4. By
including the merged county units, we added between two and three million
Protestant adherents to the dataset. Taken altogether, the changes allowed for the
more reliable inclusion of an additional 20–23 million Protestant adherents in each
year.
Despite these improvements, limitations in utilizing all 4 years of data for
longitudinal analyses remain. We did not estimate adherent and congregation counts
of all the groups who had missing data, and not all groups involved in schisms are
present in the years following their founding. The most significant limitations,
however, are the unamendable measurement changes among some of the largest
religious groups. Adherent comparisons across all 4 years are mostly limited to
predominantly white Mainline and Evangelical Christian denominations. If the
analyses are limited to fewer years of data or to congregational counts, however, the
new longitudinal files still can be used to study additional groups, such as Catholics,
Jews, Mormons, or some of the Orthodox Christian groups (see Table 2).
Unfortunately, the historically African-American denominations are not fully
represented in any of the collections. Limitations remain, but the new longitudinal
files offer important improvements for using the religions censuses for overtime
research.
Conclusion
The decennial religious censuses now collected by the Association of Statisticians
of American Religious Bodies have been used extensively by researchers; but the
complexities of merging the files have prevented most from using the files for
explaining religious change over time. Schisms and mergers, changing geographical
boundaries, modified methods of reporting and various sources of missing data have
posed challenges that made the merging both complex and time consuming. Some
of the challenges required demographic training, others required an extensive
knowledge of the specific groups being studied. Addressing these challenges
required both expertise and time.
We have made several changes to the 1980, 1990, 2000 and 2010 religion census
datasets in order to address challenges associated with merging the data collections
into a longitudinal file. These changes included alterations to variable names, the
creation of new combined groups to correct for schisms and mergers, introducing
alternative counts of the United Methodist Church, providing estimates for missing
data and merging county units in the county-level file. Collectively, these changes
produced new longitudinal files that increase religious group representation, reduce
bias from missing data, improve the file’s ease of use and are readily accessible
from theARDA.com.
420 Rev Relig Res (2018) 60:403–422
123
We have issued several warnings on the limitations of the data and on which
groups can be meaningfully compared over time, but this shouldn’t distract from the
many opportunities the merged files offer. For a core group of 70 religious groups,21
meaningful comparisons among adherents and congregations now can be made
using all four collections. For many of the remaining groups, comparable data is
now available for at least two points in time. This allows researchers to explore how
groups change in size and geography over time and how these changes are related to
other social, demographic and economic changes. Overall, we believe that our
efforts greatly improve the quality of the data by reducing missing data and making
the data more comparable over time, and will simplify the process of accessing and
using a merged file for all users.
Acknowledgements We thank Lauren Arieux for providing the alternative 2000 and 2010 United
Methodist adherent counts, and Daniel Olson for sharing information about the religion census datasets.
This project was made possible through the support of the Lilly Endowment, Inc. and the John Templeton
Foundation. The opinions expressed in this publication are those of the authors and do not necessarily
reflect the views of the Lilly Endowment, Inc. or the John Templeton Foundation. Funding was provided
by Lilly Endowment, Inc. (Grant No. 2012 1047-000), John Templeton Foundation (Grant No. 46933).
Open Access This article is distributed under the terms of the Creative Commons Attribution 4.0
International License (http://creativecommons.org/licenses/by/4.0/), which permits unrestricted use, dis-
tribution, and reproduction in any medium, provided you give appropriate credit to the original
author(s) and the source, provide a link to the Creative Commons license, and indicate if changes were
made.
References
Anglican Church in North America. 2017. About the Anglican Church in North America. http://www.
anglicanchurch.net/media/ACNA_Fact_Sheet_2-21-17.pdf. Accessed 3 Oct 2017.
Bauer, John T. 2012. U.S. Religious Regions Revisited. The Professional Geographer 64 (4): 521–539.
Blau, Judith R., Kent Redding, and Kenneth C. Land. 1993. Ethnocultural Cleavages and the Growth of
Church Membership in the United States, 1860–1930. Sociological Forum 8 (4): 1993. https://doi.
org/10.1007/BF01115214.
Boone, Jeff P., Inder K. Khurana, and K.K. Raman. 2013. Religiosity and Tax Avoidance. American
Accounting Association 35 (1): 53–84.
Bradley, Martin B., M. Norman Jr., Dale E. Green, Mac Lynn Jones, and Lou McNeil. 1992. Churches
and Church Membership in the United States. Washington, DC: Glenmary Research Center.
Chaves, Mark. 2017. American religion: Contemporary trends. Princeton: Princeton University Press.
Dyreng, Scott D., William J. Mayew, and Christopher D. Williams. 2012. Religious Social Norms and
Corporate Financial Reporting. Journal of Business Finance and Accounting 39 (7): 845–875.
Finke, Roger, and Christopher P. Scheitle. 2005. Accounting for the Uncounted: Computing Correctives
for the 2000 RCMS Data. Review of Religious Research 47 (1): 5–22. https://doi.org/10.2307/
4148278.
Finke, Roger, and Rodney Stark. 1986. Turning Pews into People: Estimating 19th Century Church
Membership. Journal for the Scientific Study of Religion 25 (2): 180–192.
21 Six religious groups provided both adherent and congregation data in all 4 years, but are excluded
from this count due to measurement changes in either adherents or congregations. The excluded groups
are: Roman Catholics, Latter-Day Saints, Southern Baptists, Old Order Amish, the Armenian Apostolic
Church of America (Eastern Prelancy), and Archdiocese of the Syrian Orthodox Church of Antioch.
Rev Relig Res (2018) 60:403–422 421
123

Finke, Roger, and Rodney Stark. 2005. The Churching of America, 1776–2005: Winners and Losers in
our Religious Economy, 2nd ed. New Brunswick: Rutgers University.
Grammich, Clifford. 2012. Sources of Change in Catholic Populations, 2000 to 2010. Paper presented at
the Joint Annual Meeting of the Religious Research Association and Society for the Scientific Study
of Religion, Phoenix, AZ.
Grammich, Clifford, C. Kirk Hadaway, Richard Houseal, Dale E. Jones, Alexei Krindatch, Richie
Stanley, and Richard H. Taylor. 2012. Census: Religious Congregations and Membership Study.
Lenexa: Association of Statisticians of American Religious Bodies.
Hadaway, Kirk C., and David A. Roozen. 1993. Church and Denominational Growth. Nashville, TN:
Abingdon Press.
Hillary, Giles, and Kai Wai Hui. 2009. Does Religion Matter in Corporate Decision Making in America?
Journal of Financial Economics 93 (3): 455–473.
Johnson, Douglas W., Paul R. Picard, and Bernard Quinn. 1974. Churches and Church Membership in the
United States: An Enumeration by Region, State, and County. Washington, DC: Glenmary Research
Center.
Jones, Dale E., Sherri Doty, Clifford Grammich, James E. Horsch, Richard Houseal, Mac Lynn, John P.
Marcum, Kenneth M. Sanchagrin, and Richard H. Taylor. 2002. Religious Congregations and
Membership in the United States 2000: An Enumeration by Region, State and County Based on Data
Reported for 149 Religious Bodies. Nashville, TN: Glenmary Research Center.
Land, Kenneth C., Glenn Deane, and Judith R. Blau. 1991. Religious Pluralism and Church Membership:
A Spatial Diffusion Model. American Sociological Review 56 (2): 237–249.
Lim, Chaeyoon. 2013. Counting the Faithful: Measuring Local Religious Contexts in the United States.
Journal for the Scientific Study of Religion 52 (2): 386–400.
Lindner, Eileen W. 2000. Yearbook of American and Canadian Churches. In Yearbook of American and
Canadian Churches, ed. National Council of the Churches of Christ. Nashville, TN: Abingdon
Press.
Lindner, Eileen W. 2010. Yearbook of American and Canadian Churches. In Yearbook of American and
Canadian Churches, ed. National Council of the Churches of Christ. Nashville, TN: Abingdon
Press.
Marcum, John P. 2017. W(h)ither the Mainline? Trends and Prospects. Review of Religious Research 59:
119–134.
National Council of Churches. 1956. Churches and Church Membership in the United States: An
Enumeration and Analysis by Counties, States and Regions. New York: National Council of
Churches.
North American Lutheran Church. 2016. About the NALC. https://www.thenalc.org/about-us-2/.
Accessed 3 Oct 2017.
Quinn, Bernard, Herman Anderson, Martin B. Bradley, Paul Goetting, and Peggy Shriver. 1982.
Churches and Church Membership in the United States, 1980. Washington, DC: Glenmary Research
Center.
Steensland, Brian, Jerry Park, Mark Regnerus, W. Lynn Robinson, Bradford Wilcox, and Robert
Woodberry. 2000. The Measure of American Religion: Toward Improving the State of the Art.
Social Forces 79: 291–318.
Stump, Roger W. 1998. The Effects of Geographical Variability on Protestant Church Membership
Trends, 1980–1990. Journal for the Scientific Study of Religion 37 (4): 636–651.
422 Rev Relig Res (2018) 60:403–422
123