mercury monitoring on the fond du lac reservation joy wiecks, air quality technician fond du lac...
TRANSCRIPT
Mercury Monitoring on the Fond du Lac
Reservation
Joy Wiecks, Air Quality TechnicianFond du Lac Band of Lake Superior Chippewa
December 15, 2005
WRAP Board Meeting
FDL Mercury Monitoring Program
Reservation OverviewEnvironmental MercuryMercury in MinnesotaMercury and FDL Natural ResourcesSite HistoryDataFDL Advisories and Other ProjectsFuture Studies

Fond du Lac Reservation
Located in Northeastern Minnesota.Rural area about 20 miles from
Duluth/Superior.Reservation has 108 water bodies,
totaling 2850 acres – lots of wetlands.Ceded Territories cover 8 million acres.


About Environmental Mercury
Silvery, liquid metal at room temperature. An element – does not break down. When released, evaporates and circulates in the
atmosphere until deposited in lakes and oceans. Bacteria and chemical reactions that take place in
water cause mercury to change into a more toxic form called methylmercury.
Methylmercury builds up in the bodies of plankton, fish, humans, and other animals and is a neurotoxin.

Mercury on the Reservation
Mercury is a concern because the boreal forest/wetland ecoregion is very sensitive to mercury deposition.
Methylation more likely to occur due to watershed characteristics.
Higher risk for bioaccumulation and human exposure due to the presence of fish-eating species.
Clean Air Mercury rule unlikely to lead to reductions in our region.

Mercury in Minnesota(Year 2005 Data)
In 2005, about 3,341 lbs will be released in Minnesota (down from 3600 lb in 2000).
98% of this was discharged to the atmosphere. Only 10-30% of deposition comes from in-state sources. 58% of mercury emitted comes from energy production (up
from 51%). 22% is from “purposeful uses”, including latex paint,
fungicides, waste combustion, fluorescent lamp breakage, dental preparations, etc (down from 28%).
20% is from materials processing (taconite mining, pulp and paper) (down from 21%).

Mercury and Fish Consumption
Consumption of large game-fish can lead to mercury poisoning in humans.
Native populations at risk because of consumption of fish as a traditional food source.
Mercury poisoning can cause damage to the nervous system and is especially harmful for small children and developing fetuses.
Animals can suffer effects, too. Threshold for effects unknown!! Advisories just a starting point. Great Lakes Indian Fish and Wildlife Commission consumption
study versus EPA’s CAMR numbers.

Natural Resources at FDL
Fish harvests (2002):From Mille Lacs, total tribal take was about
54,000 pounds of walleye. FDL harvest was about 7,142 pounds.
Rice harvested: 20,000-25,000 lb/yrMoose harvested: 38 in 2001Waterfowl harvested: est. <500/yr
Precipitation Deposition Site History
Site established in 1997 in cooperation with Glass and Sorensen at University of Minnesota – Duluth (UMD) and with Cloquet Forestry Center. Monitor – principle of operation. Analytical method is cold vapor atomic absorption. Sample collected every Tuesday and delivered to UMD.
Updates at site Replaced old M.I.C. monitor with NTN monitor (2002)
although not using NTN analysis. Started analyzing for methyl mercury in Sept. 2000.


Data
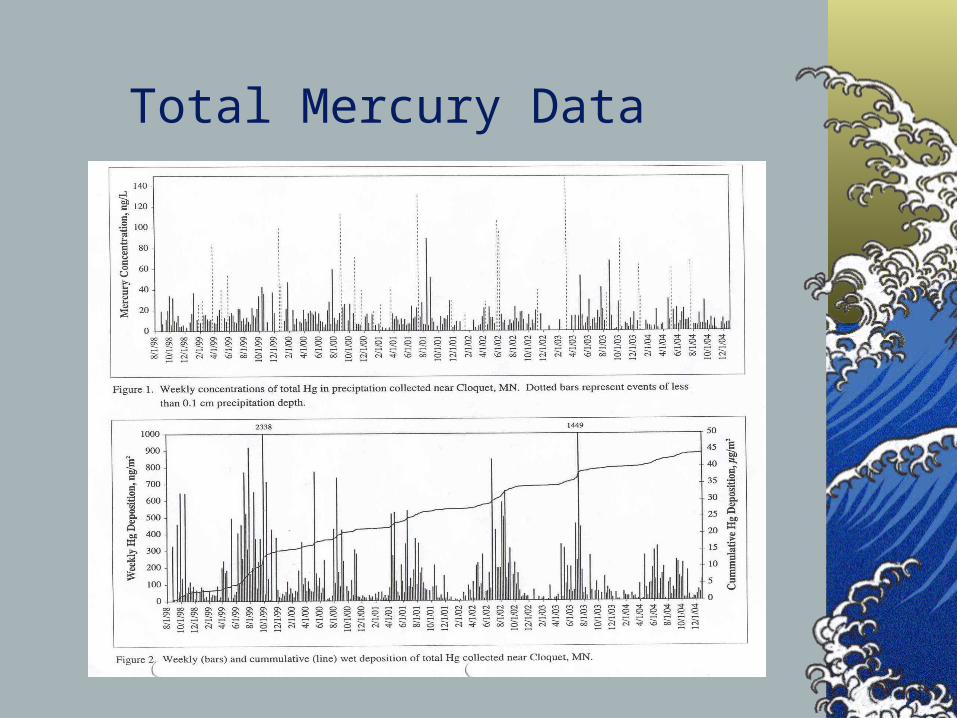
Total mercury data shows spring-thru-fall spikes.
Total mercury concentration ranges from 1.2 – 2470 ng/L.
Methylmercury data seems to show spikes in summer/fall.
Methylmercury as a percentage of total mercury ranges from 0.2% (7/01) to 16.8% (4/03).
Total Mercury Data

Methyl Mercury Data

Sediment Assessment
In 2000, GLNPO funded study of 12 reservation lakes: characterize sediments, assess contaminant levels in bioavailable portion (Hg, Pb, PCB’s), toxicity tests.
Sediment quality database developed; an additional indicator of reservation water quality.
Found higher Hg values associated with organic sediments. 30 of 96 sites had dry wt Hg exceeding Level 1 Sediment Quality
Threshold of 0.18 ug/g. Shallow lakes had consistently higher Hg levels. No PCB problems were found but some elevated Pb levels were
observed, theorized to be from lead shot in the sediment.

Phase II Sediment Study
Second GLNPO project (2002) included 12 St. Louis River sites; same parameters plus methyl mercury.
Analyzed archived samples from Phase I for meHg.Added results to database.Correlated sediment quality and water quality
parameters and watershed factors.Got a good handle on degree of Hg in water
bodies.

0
50
100
150
200
250
300
StL
R
Big
Joe
Mar
tin Los
t
Third
Wes
t Tw
in
Soph
ie
Perc
h
Pat M
artin
Ric
e Po
rtag
e
Dea
d Fi
sh
Sim
ian
Tot
al H
g C
once
ntra
tion
, ng/
g dw

Average Across Sites for Each Water Body
0.0
0.2
0.4
0.6
0.8
1.0
1.2
1.4
1.6Pa
t Mar
tin
Lost
Big
Joe
Mar
tin
StLR
Perc
h
Wes
t Tw
in
Ric
e Po
rtage
Dea
dfish
Soph
ie
Third
Sim
ian
Ave
rage
MeH
g C
onc.
(dry
wt)
, ng/
g

All Lakes
R2 = 0.31
0.01
0.10
1.00
10.00
0 50 100 150 200 250 300
Total Hg Conc., ng/g dw
MeH
g C
onc.
, ng/
g dw

West Twin
R2 = 0.66
0
50
100
150
200
250
0 1 2 3 4 5
Water Depth, m
To
tal
Hg,
ng/
g d
w
North Basin
South basin

Perch Lake
R2 = 0.53
0
50
100
150
200
250
0.0 0.5 1.0 1.5 2.0 2.5 3.0 3.5 4.0
Water Depth, m
Tot
al H
g C
onc.
, ng
/g d
w
North Basin
South Basin

Lake Averages
R2 = 0.86
0
50
100
150
200
250
0 5000 10000 15000 20000
Total Watershed
Tot
al H
g C
onc.
, ng/
g

R2 = 0.8
0
50
100
150
200
250
0.1 1.0 10.0 100.0
Wetland / Water Area
Tot
al H
g C
onc.
, ng/
g

Lake Averages
R2 = 0.839
0.0
50.0
100.0
150.0
200.0
250.0
0 50 100 150 200 250 300
Color, Pt-Co
Tot
al H
g, n
g/g

Lake Averages
R2 = 0.43
0.0
50.0
100.0
150.0
200.0
250.0
0 1 2 3 4 5 6
TSS, mg/L
Tot
al H
g, n
g/g
0.0
50.0
100.0
150.0
200.0
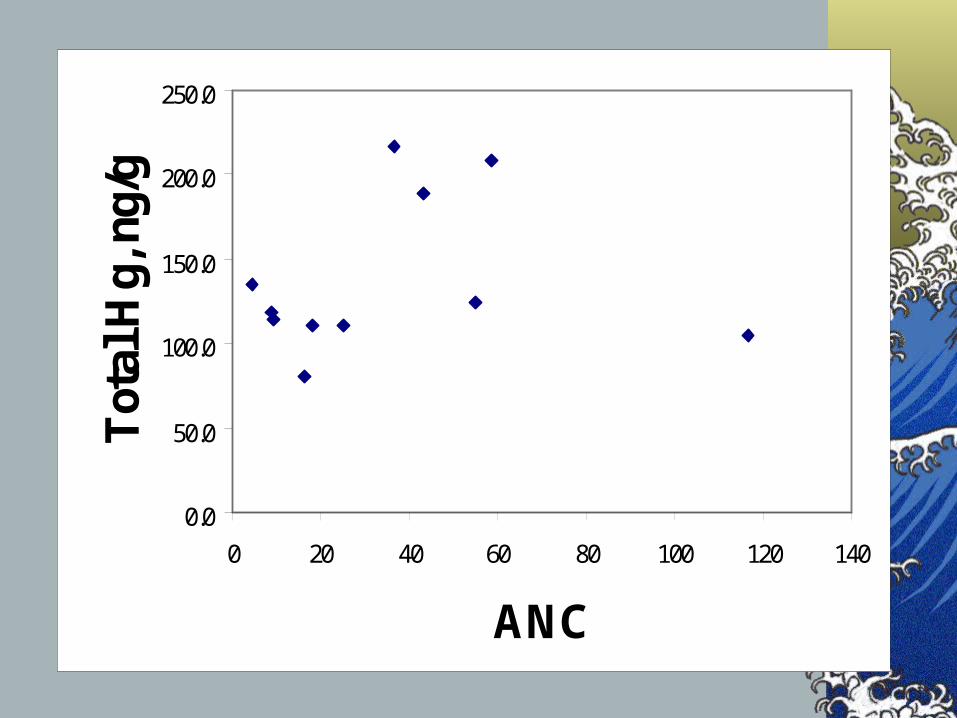
250.0
0 20 40 60 80 100 120 140
ANC
Tot
al H
g, n
g/g

Fish Tissue Samples
In 2000, FDL partnered with the MN Dept of Health to study fish contaminants, develop culturally sensitive consumption guide.
Fish collected from St. Louis River and 7 Reservation lakes; targeted species that are commonly eaten. Also lists non-native species (tuna, shark).
Mercury drives consumption restrictions (PCB’s and other contaminants ruled out).
Produced fish advisories and a guide for expectant mothers.

Wild Foods StudyComprehensive risks/benefits analysis funded by
MN Sea Grant.Cultural and nutritional benefits of wild foods (vs.
market alternatives) offset contaminant exposure.Wild rice, waterfowl, moose analyzed for Hg, Pb.Waterfowl and fish have comparable Hg.Moose livers found to be high in cadmium, no Hg
uptake found in rice..

Future Studies
Sampling more waterfowl.Continuing fish tissue analysis.Continuing atmospheric deposition
monitoring (currently total Hg only).Investigate potential sediment mercury
mitigation techniques.
