mercury ion thruster technology - nasa...(of thir report) 20. clad. (of thh paged uncl ass i f i ed...
TRANSCRIPT
~
HAC REF F3358
- 8
MERCURY ION THRUSTER TECHNOLOGY
J.R. Beattie and J.N. Matossian
Hughes Research Laboratories
3011 Malibu Canyon Road
Malibu, California 90265
March 1989
NAS3-23775
Final Report
18 February 1983 through 18 October 1984
Sponsored By
NATIONAL AERONAUTICS AND SPACE ADMINISTRATION
Lewis Research Center
2100 Brookpark Road
Cleveland, OH 44135
(NaSA-CR- 174974) BBBCWBY I C U ‘JBBGSIXR ~ a 9 - 2 1 8 3 4 IECHECLOGY Final Eeport, Pek, 1983 - O c t , 1984 [Hughes Ersrarch Labs.) 150 WSCL 215
Uaclas 63/20 0200053
https://ntrs.nasa.gov/search.jsp?R=19890012463 2020-04-25T02:05:48+00:00Z
Rv\sn U u u ~ l C S w r J Report Documentation Page h u e eqhl5tramn
I 3. Recipient's Catalog No. 1 . Repon No. I 2. Government Accessmn No.
7. Author(&
1 NASA CR-174974 1 I
8. Performing Organization Repon No.
I I I 4. Titk and Subtitle I 5. Repon Date I
9. Petforming Organization Name and A d d m Hughes Research Laboratories
Malibu, CA 90265 3011 Malibu Canyon Road
Mercury Ion Thruster Techno1 ogy
11. Contract or Grant No.
NAS 3-23775 I !
13. Type of Report and Perrod Covered
March 1989
12. Sponsoring Agency Nurw and Addmu
Lewis Research Center 21000 Brookpark Road Cleveland. OH 44135
National Aeronaut i cs and Space Admi n i s t r a t ion Final Report 2/83 - 10/84
14. Sponsoring Agency Code
I I J.R. Beat t ie and J.N. Matossian
17. Key Words (Suggested by AuthorlsH E l e c t r i c Propulsion 30-cm Ion Thruster Ion Optics Ion Propul s ion
I 10. Work Unit No. j
18. D i t i o n Sutemont
Unclassif ied - Unlimited
19. Security Classif. (of thir report) 20. Security C l a d . (of thh paged
Uncl ass i f i ed Unclassif ied 21. No. of pages 22. Price
162
I
16. Abnnct
The Mercury Ion Thruster Technology program w a s an investigation for improving the understanding of state-of-the-art mercury ion thrusters. simplifying the design of the 30-cm-diameter ring-cusp discharge chamber. Thruster performance w a s improved considerably; the baseline beam-ion-production cost of the optimized conf iguration waa reduced to e ; 2 130 eV/ion. At a discharge propellant-utilioation efficiency of 95%, the beam ion-production cost w a s reduced to about 155 eV/ion, representing a reduction of about 40 eV/ion over the corresponding value for the 30-a-diameter J-series thruster. probe surveys were obtained and compared with similu mersurements for a J-series thruster. successful volume-averaging scheme was developed to correlate thruster performance with the dominant plasma processes that prevail in the two thruster designs. The average Yaxwellian- electron temperature in the optimized ring-cusp design is as much as 1 eV higher than it is in the \ e e r i e s thruster. Advances in ion-extraction-electrode f abrication technology were made by improving materials-selection criteria, hydroforming and stress-relieving tooling, and fabrications procedures. of screen aperture sire on ion-optics performance and to verify the effectiveness of a bemm- vectoring model for three-grid ion optics. series thruster w a a completed, and operation of an 8-em IAPS thruster using a simplified power processor w a s demonstrated.
Emphasis w a s placed on optimizing the performance and
Comprehensive Langmuir- A
An ion-extraction performance study was conducted to assess the ef fact
An assessment of the technology readiness of the J-
TABLE OF CONTENTS
SECTION PAGE
1 INTRODUCTION . . . . . . . . . . . . . . . . . . . . . . . . . . . . . . . . . . . . 1
1.1 Program Goals . . . . . . . . . . . . . . . . . . . . . . . . . . . . . . 1
1.2 Program Accomplishments .................... 2
2 RING-CUSP DISCHARGE-CHAMBER TECHNOLOGY . . . . . . . . . . 5
2.1 Design Features . . . . . . . . . . . . . . . . . . . . . . . . . . . . 5
2.2 Performance Characteristics . . . . . . . . . . . . . . . . 9
2.3 Operating Characteristics . . . . . . . . . . . . . . . . . . 9
2.4 Anode Effects . . . . . . . . . . . . . . . . . . . . . . . . . . . . . . 30
2.5 Operation at Reduced Discharge Voltage . . . . . 50
2.6 Cathode Erosion . . . . . . . . . . . . . . . . . . . . . . . . . . . . 57
2.7 Cathode Location ........................... 57
3 ION-OPTICS TECHHOLOGY . . . . . . . . . . . . . . . . . . . . . . . . . . . 63
3.1 Thermomechanical Modeling . . . . . . . . . . . . . . . . . . 63
3.2 Electrode-Fabrication Technology . . . . . . . . . . . 71
3.3 Experimental Results . . . . . . . . . . . . . . . . . . . . . . . 72
4 POWER-PROCESSOR SIMPLIFICATIONS . . . . . . . . . . . . . . . . . 85
4.1 Steady-State and Transient Operation . . . . . . . 85
4.2 IAPS-Equivalent Thruster Operation . . . . . . . . . 94
5 TECHNOLOGY READINESS OF THE J-SERIES THRUSTER . . . 103
5.1 Discharge-Chamber Erosion . . . . . . . . . . . . . . . . . . 105
5.2 Insulator Materials ........................ 105
5.3 Operating Procedure ........................ 106
5.4 Cathode Heaters ............................ 106
PRECEDING PAGE BLANK NOT FILMED
iii
TABLE OF CONTENTS (Continued)
SECTION PAGE
5.5 Ion-Optics Fabrication . . . . . . . . . . . . . . . . . . . . . 113
6 ION-THRUSTER RELIABILI .......................... 119
6.1 Flight-Test References ..................... 122
6.2 Thruster Life-Test References . . . . . . . . . . . . . . 122
6.3 Component Life-Test References . . . . . . . . . . . . . 125
6.4 Lifetest Bibliography . . . . . . . . . . . . . . . . . . . . . . 126
7 CONCLUSIONS . . . . . . . . . . . . . . . . . . . . . . . . . . . . . . . . . . . . . 129
APPENDICES
A VACUUM TEST FACILI TY............................ 131
B RING-CUSP THRUSTER OPTIMIZATION . . . . . . . . . . . . . . . . . 135
C HYBRID THRUSTER ................................. 141
iv
I I I I I I I 1 I 1 1 I 1 I I I I I I

FIGURE
2-1
2-2
2-3
2-4
2-5
2-6
2-7
2-8
2-9
2-10
2-11
2-12
2-13
2-14
2-15
2-16
2-17
LIST OF ILLUSTRATIONS
PAGE
Schematic diagram of NASA/Hughes 30-cm-diameter ring-cusp and J-series thruster discharge chambers . . . . . . . . . . . . . . . . . . . . . . . . . . . . . . . . . . . . . . . . 6
Scalar magnetic field distribution comparison . . . 8
Iron filings map of magnetic field . . . . . . . . . . . . . . 10
Thruster performance comparison . . . . . . . . . . . . . . . . . 11
Volume-averaged primary electron density fractions . . . . . . . . . . . . . . . . . . . . . . . . . . . . . . . . . . . . . . . 14
Spatially varying Maxwellian electron temperature . . . . . . . . . . . . . . . . . . . . . . . . . . . . . . . . . . . . . 16
Volume-averaged Maxwellian electron temperature predictions ......................... 17
Normalized electron ionization collision frequency contours in ring-cusp thruster . . . . . . . . 18
Three-dimensional plasma potential contours. . . . . 20
Measured beam profile and calculated ion flux profile . . . . . . . . . . . . . . . . . . . . . . . . . . . . . . . . . . . . . . . . . 22
Behavior of measured beam profile . . . . . . . . . . . . . . . 22
Schematic diagram of current and voltage measurements . . . . . . . . . . . . . . . . . . . . . . . . . . . . . . . . . . . . 23
Net current collected by anode potential surfaces . . . . . . . . . . . . . . . . . . . . . . . . . . . . . . . . . . . . . . . . 26
Saturated ion current collected by sidewall/ endwall plenum . . . . . . . . . . . . . . . . . . . . . . . . . . . . . . . . . . 27
Net current collected by screen electrode . . . . . . . 29
Maxwellian electron temperature distribution functions ....................................... 31
Calculated fraction of electrons having an energy in excess of 30 eV ....................... 32
V
LIST OF ILLUSTRATIONS (Continued)
FIGURE PAGE
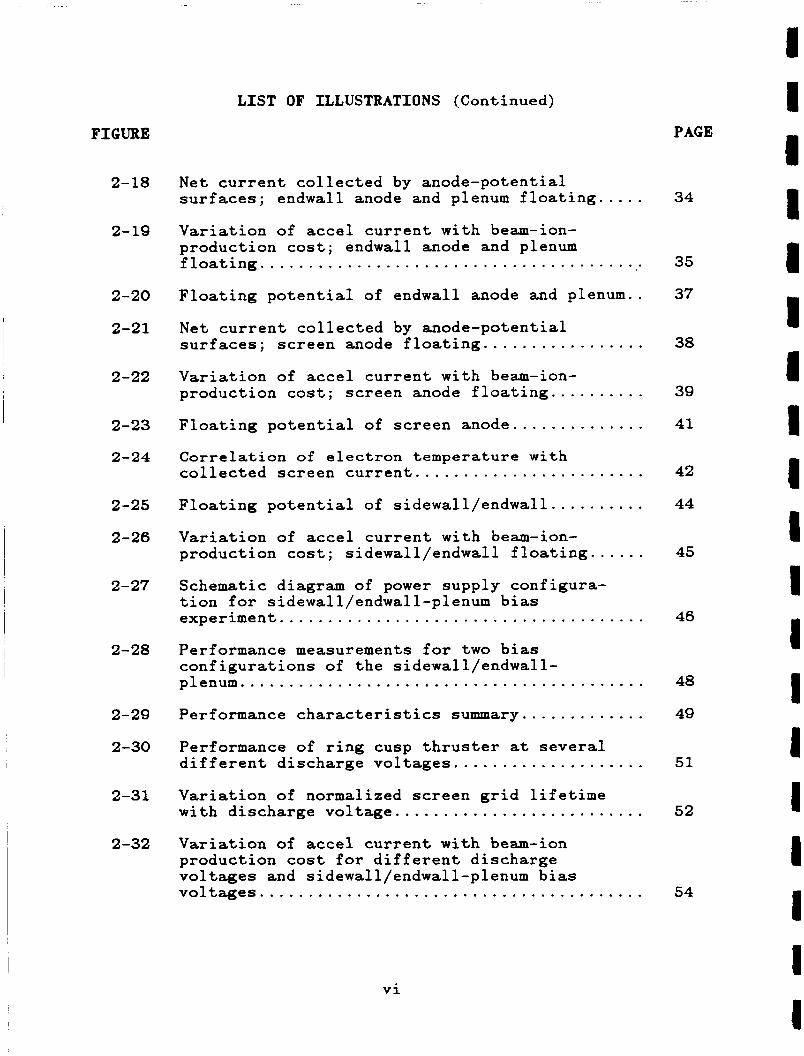
2-18 Net current collected by anode-potential surfaces; endwall anode and plenum floating . . . . . 34
2-19 Variation of accel current with beam-ion- production cost; endwall anode and plenum floating . . . . . . . . . . . . . . . . . . . . . . . . . . . . . . . . . . . . . . . . 35
2-20 Floating potential of endwall anode and plenum.. 37
2-21 Net current collected by anode-potential surfaces; screen anode floating . . . . . . . . . . . . . . . . . 38
2-22 Variation of accel current with beam-ion- production cost; screen anode floating . . . . . . . . . . 39
2-23 Floating potential of screen anode . . . . . . . . . . . . . . 41
2-24 Correlation of electron temperature with collected screen current.. ...................... 42
2-25 Floating potential of sidewall/endwall . . . . . . . . . . 44
2-26 Variation of accel current with beam-ion- production cost; sidewall/endwall floating . . . . . . 45
2-27 Schematic diagram of power supply configura- tion for sidewall/endwall-plenum bias experiment . . . . . . . . . . . . . . . . . . . . . . . . . . . . . . . . . . . . . . 46
2-28 Performance measurements for two bias configurations of the sidewall/endwall- plenum . . . . . . . . . . . . . . . . . . . . . . . . . . . . . . . . . . . . . . . . . . 48
2-29 Performance characteristics summary. . . . . . . . . . . . . 49
2-30 Performance of ring cusp thruster at several different discharge voltages .................... 51
2-31 Variation of normalized screen grid lifetime with discharge voltage .......................... 52
2-32 Variation of accel current with beam-ion production cost for different discharge voltages and sidewall/endwall-plenum bias voltages . . . . . . . . . . . . . . . . . . . . . . . . . . . . . . . . . . . . . . . . 54
vi
I I 1 1 I I I I 1 I 1 I I I I I I 1 I

LIST OF ILLUSTRATIONS (Continued)
I i 1 1 I 1 I 1 I 8 I 8 8 t I 8 I I I
FIGURE PAGE
2-33 Variation of accel current and molybdenum line intensity measurements with beam-ion-production cost for two values of discharge voltage and sidewall/endwall-plenum bias voltage . . . . . . . . . . . . 55
2-34 Variation of measured plasma potential with beam-ion-production cost for two values of discharge voltage and sidewall/endwall-plenum bias voltage . . . . . . . . . . . . . . . . . . . . . . . . . . . . . . . . . . . . 56
2-35 Photograph of cathode orifice after 694 hours of operation in the ring-cusp thruster . . . . . . . . . . 58
2-36 Variation of accel current with cathode position with respect to axial magnetic field strength . . . 59
3-1 Rigid and "flexible" ion-optics mountings . . . . . . . 64
3-2 Simplified ion-optics mounting . . . . . . . . . . . . . . . . . . 66
3-3 Finite-element models and calculated deformations . . . . . . . . . . . . . . . . . . . . . . . . . . . . . . . . . . . . 68
3-4 Finite elements employed in the stress-analysis model . . . . . . . . . . . . . . . . . . . . . . . . . . . . . . . . . . . . . . . . . . . 69
3-5 Modification to the clamping region of the hydroforming fixture for venting trapped air and preventing slippage of the grid material . . . . 73
3-6 Improved stress-annealing fixture with graphite liners . . . . . . . . . . . . . . . . . . . . . . . . . . . . . . . . . . . . . . . . . . 74
3-7 Variation of ion-machined aperture diameter for various radial locations and total accelerating voltages ........................................ 77
3-8 Variation of minimum total accelerator voltage with total accelerating voltage for grid sets C015 and C025 ................................... 78
3-9 Variation of thrust-loss factor with net-to- total accelerating voltage ratio for grid sets C015 and C027 ................................... 80
3-10 Ion current angular dispersion profiles for grid set C015 ........................................ 81
vii
LIST OF ILLUSTRATIONS (Continued)
FIGURE PAGE
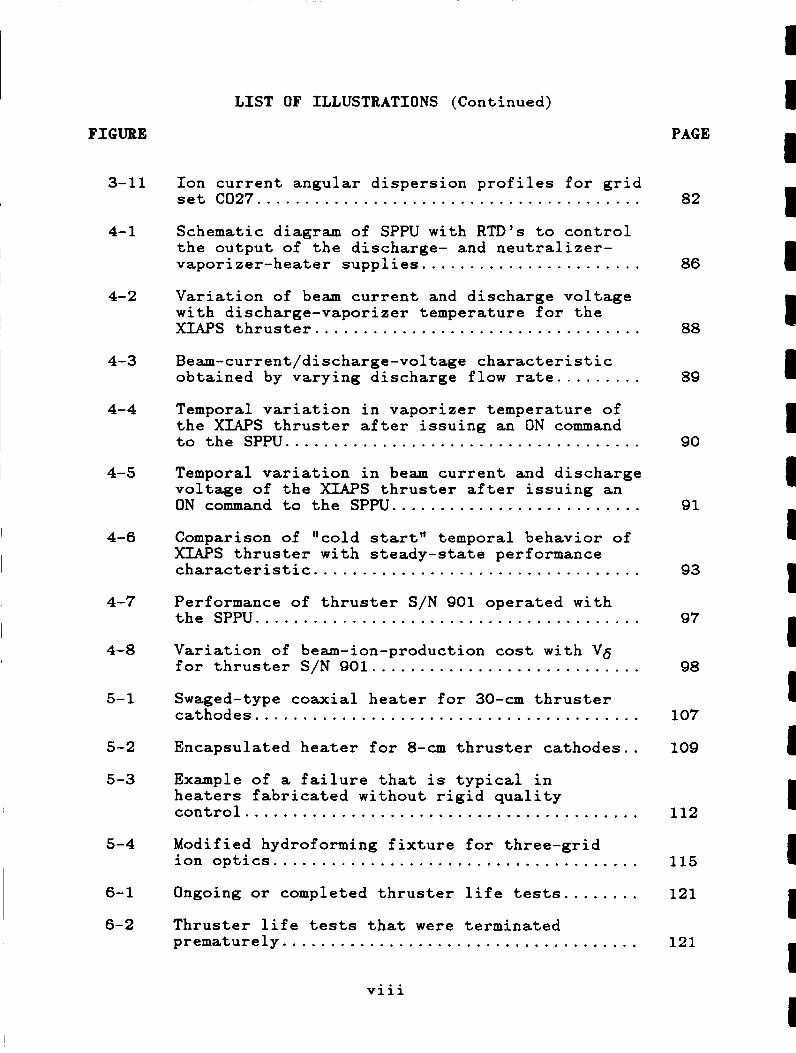
3-11 Ion current angular dispersion profiles for grid set C027 . . . . . . . . . . . . . . . . . . . . . . . . . . . . . . . . . . . . . . . . 82
4-1 Schematic diagram of SPPU with RTD's to control the output of the discharge- and neutralizer- vaporizer-heater supplies . . . . . . . . . . . . . . . . . . . . . . . 86
4-2 Variation of beam current and discharge voltage with discharge-vaporizer temperature for the XIAPS thruster . . . . . . . . . . . . . . . . . . . . . . . . . . . . . . . . . . 88
4-3 Beam-current/discharge-voltage characteristic obtained by varying discharge flow rate . . . . . . . . . 89
4-4 Temporal variation in vaporizer temperature of the XIAPS thruster after issuing an ON command to the SPPU . . . . . . . . . . . . . . . . . . . . . . . . . . . . . . . . . . . . . 90
4-5 Temporal variation in beam current and discharge voltage of the XIAPS thruster after issuing an ON command to the SPPU .......................... 91
4-6 Comparison of "cold start" temporal behavior of XIAPS thruster with steady-state performance characteristic . . . . . . . . . . . . . . . . . . . . . . . . . . . . . . . . . . 93
4-7 Performance of thruster S/N 901 operated with the SPPU . . . . . . . . . . . . . . . . . . . . . . . . . . . . . . . . . . . . . . . . 97
4-8 Variation of beam-ion-production cost with Vg for thruster S/N 901 . . . . . . . . . . . . . . . . . . . . . . . . . . . . 98
5-1 Swaged-type coaxial heater for 30-cm thruster cathodes . . . . . . . . . . . . . . . . . . . . . . . . . . . . . . . . . . . . . . . . 107
5-2 Encapsulated heater for 8-cm thruster cathodes.. 109
5-3 Example of a failure that is typical in heaters fabricated without rigid quality control . . . . . . . . . . . . . . . . . . . . . . . . . . . . . . . . . . . . . . . . . 112
5-4 Modified hydroforming fixture for three-grid ion optics . . . . . . . . . . . . . . . . . . . . . . . . . . . . . . . . . . . . . . 115
6- 1 Ongoing or completed thruster life tests . . . . . . . . 121
6-2 Thruster life tests that were terminated prematurely . . . . . . . . . . . . . . . . . . . . . . . . . . . . . . . . . . . . . 121
viii
1 1 1 I I I I 1 1 1 1 I 1 1 I I I I I
I I 1 I 1 I 1 I I 8 I I 1 I I I 1 1 I
LIST OF TABLES
TABLE PAGE
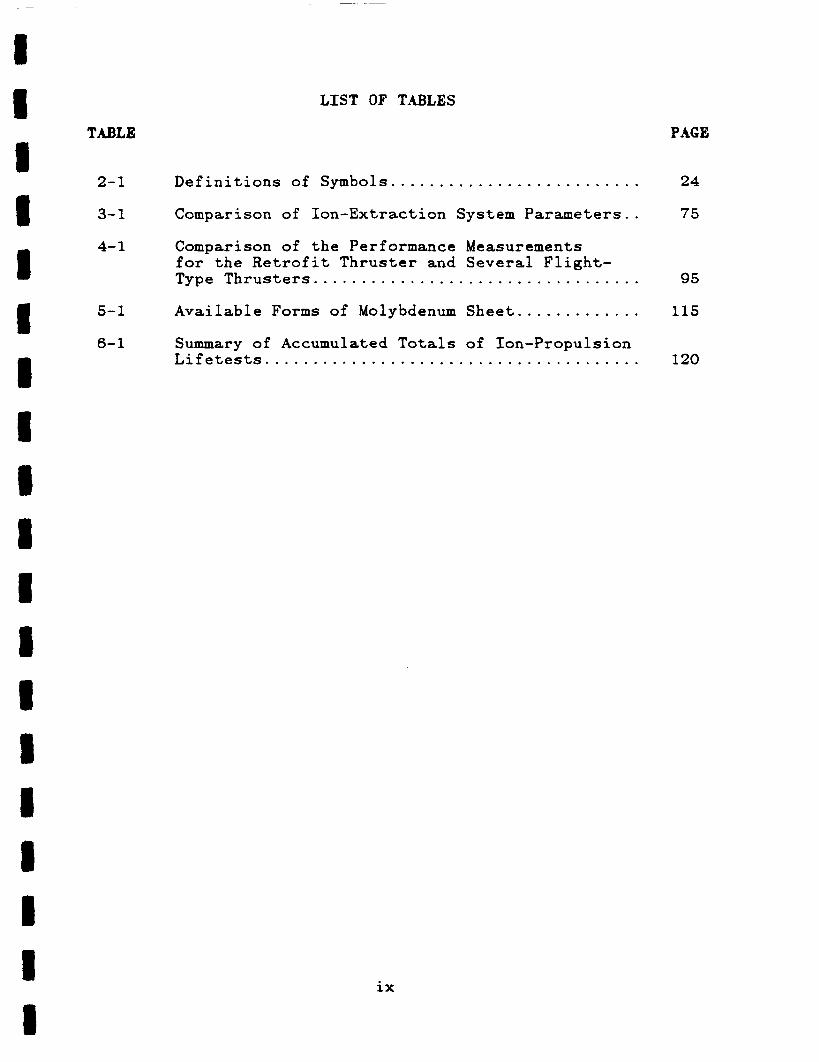
2-1 Definitions of Symbols .......................... 24
3- 1 Comparison of Ion-Extraction System Parameters.. 75
4-1 Comparison of the Performance Measurements for the Retrofit Thruster and Several Flight- Type Thrusters . . . . . . . . . . . . . . . . . . . . . . . . . . . . . . . . . . 95
5-1 Available Forms of Molybdenum Sheet . . . . . . . . . . . . . 115
6-1 Summary of Accumulated Totals of Ion-Propulsion Lifetests . . . . . . . . . . . . . . . . . . . . . . . . . . . . . . . . . . . . . . . 120
ix
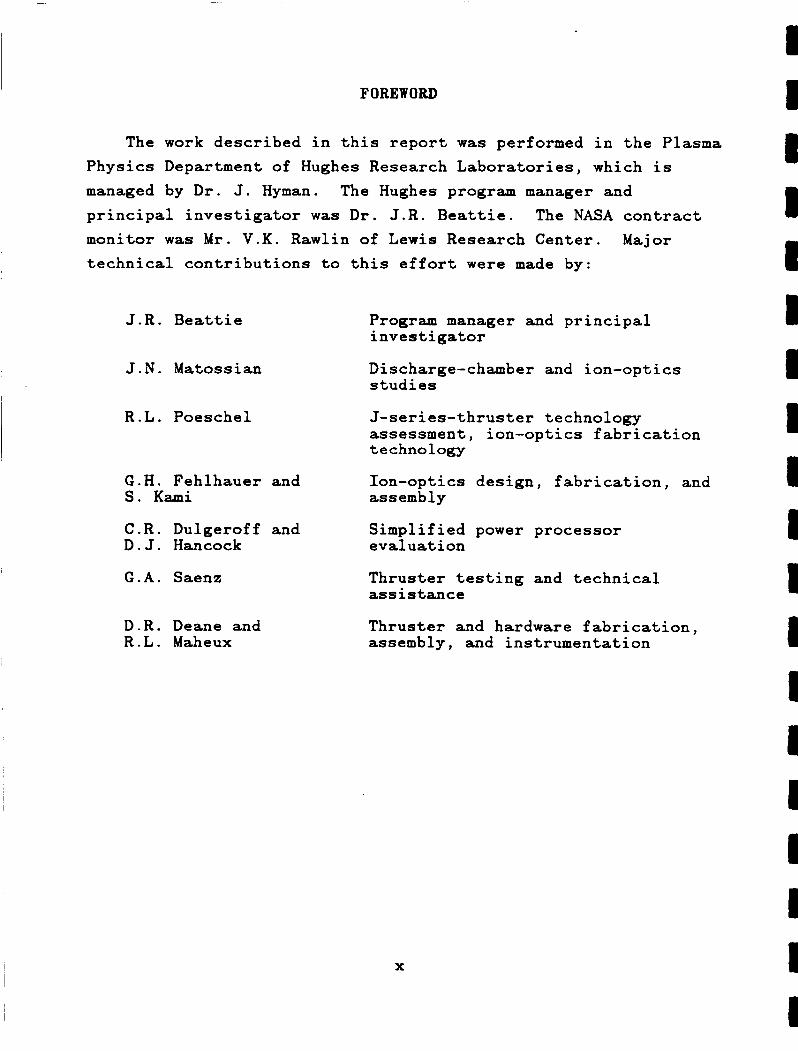
FOREWORD
The work described in this report was performed in the Plasma Physics Department of Hughes Research Laboratories, which is managed by Dr. J. Hyman. The Hughes program manager and principal investigator was Dr. J.R. Beattie. The NASA contract monitor was Mr. V . K . Rawlin of Lewis Research Center. Major
technical contributions to this effort were made by:
J.R. Beattie
J.N. Matossian
R.L. Poeschel
Program manager and principal investigator
Discharge-chamber and ion-optics studies
J-series-thruster technology assessment, ion-optics fabrication techno 1 ogy
G.H. Fehlhauer and Ion-optics design, fabrication, and S. K a m i assembly
C.R. Dulgeroff and Simplified power processor D. J. Hancock evaluation
G.A. Saena
D.R. Deane and R.L. Maheux
Thruster testing and technical assistance
Thruster and hardware fabrication, assembly, and instrumentation
X
I I I
I 1 I I 1 I 1 I I I I 1 I
SUMMARY
The Mercury Ion Thruster Technology program was an
investigation for improving the understanding of state-of-the-art mercury-ion-thruster systems. This was accomplished by comparing
and contrasting the performance characteristics of the present- generation ring-cusp thruster with the performance
characteristics of the more-mature J-series thruster. Emphasis
was placed on optimizing the performance and simplifying the design of the ring-cusp discharge chamber. The dominant
attributes characterizing the high performance of the ring-cusp thruster were identified, interpreted, and compared with those of
the J-series thruster. Additional emphasis was placed on
improving ion-optics fabrication technology. A study was conducted to identify the effect of aperture size and
displacement on ion-optics performance and thrust-vectoring
characteristics. An assessment of the technology readiness of the J-series thruster was completed, and a simplified power
processor was successfully used to operate an 8-cm-diameter
thruster that is functionally equivalent to the Ion Auxiliary Propulsion System (IAPS) thrusters.
The design of the ring-cusp discharge chamber was greatly simplified. A significant reduction in thruster mass was realized by eliminating the cathode magnet assembly and several magnet rings from t h e original thruster design. Along with the design simplifications and reduction in mass, thruster performance was improved considerably; the baseline beam-ion- production cost of the optimized configuration was reduced to E ; 21 130 eV/ion. At a discharge propellant-utilization
efficiency of 95%, the beam-ion-production cost was reduced to
about 155 eV/ion, representing a reduction of about 40 eV/ion over the corresponding value for the J-series thruster.
xi
Comprehensive Langmuir-probe surveys were obtained to
identify and correlate the performance characteristics of the
ring-cusp thruster with the prevailing plasma processes occurring
within its discharge chamber. These results were compared with
similar measurements for the J-series thruster. A volume- averaging scheme was developed for analyzing the large volume of numerical data produced by Langmuir-probe surveys, allowing a
quantitative and meaningful correlation of thruster performance
with specific plasma processes characterizing the two thruster designs. Good correlation was obtained between thruster performance and the average Maxwellian-electron temperature of the discharge plasma. The average Maxwellian-electron
temperature in the ring-cusp thruster was found to be as much as
1 eV higher than it is in the J-series thruster. Significant advances were made in the materials-selection
criteria, hydroforming and stress-relieving tooling, and
fabrication procedures for ion-extraction assemblies. An ion- optics performance study was conducted to explore the influence
of screen aperture size on ion-optics performance and to verify the effectiveness of a beam-vectoring model for three-grid ion
optics. An assessment of the technology readiness of the J-series
thruster concluded that the major remaining technology issue is
baffle and pole piece erosion, with subsequent deposition of material onto the cathode keeper and its supporting structure. Cathode-heater reliability was judged tractable through adequate
quality-control procedures. We successfully demonstrated the use of a simplified power
processor to operate an 8-cm-diameter thruster that was functionally equivalent to the Ion Auxiliary Propulsion System
(IAPS) thruster.
II
1 1 1 I
a
I 1 1
I I I
xi i 1 I
SECTION 1
INTRODUCTION
The goal of the Mercury Ion Thruster Technology program was
to improve the understanding of mercury-ion-thruster systems,
with primary consideration toward improving the technology and
reliability of the state-of-the-art 30-cm-diameter J-series
thruster. The present program extends the work that was
performed under a previous investigation (NASA Contract NAS 3-21943), in which preliminary performance-characterization and
plasma-diagnostic measurements were conducted using a high-
performance thruster that utilizes a ring-cusp magnetic- confinement geometry. Because of its inherent simplicity and
demonstrated performance capability, the ring-cusp design is
perceived as a candidate for a new generation of ion thrusters that offers a significant performance advantage over the present J-series thruster.
The work performed under this program was conducted at Hughes Research Laboratories in Malibu, California. Appendix A describes the vacuum test facilities, instrumentation, and
thruster diagnostics used in the thruster performance evaluations. Performance testing and plasma-diagnostic
measurements were performed using a 30-cm-diameter laboratory-
model ring-cusp discharge chamber, in addition to a J-series thruster (S/N J2). Details of these thruster designs are presented in Section 2 of this report.
1.1 PROGRAM GOALS
Emphasis was placed on optimizing the performance and simplifying the design of the ring-cusp discharge chamber. To aid in this effort, we performed detailed documentation of the performance, discharge characteristics, and plasma properties in several ring-cusp chamber geometries. Similar measurements were performed in a J-series thruster for comparison with the ring-
cusp results. The objective was to understand the mechanisms
1
that prevail in the high-performance ring-cusp discharge chamber, with an eye toward incorporating those attributes of the ring- cusp design that result in its high performance into the more- mature J-series thruster. Other objectives were to improve ion- optics fabrication technology and to demonstrate the operation of a flight-type thruster using a simplified power processor. Both areas have direct impact on improving the reliability of the J- series thruster, as well as on future thruster designs.
1.2 PBOGBAbl ACCOMPLISHMENTS
The design of the ring-cusp discharge chamber was greatly simplified through the elimination of its cathode magnet and several of the original magnet rings.*" simplifications and reduction in mass, the performance of the discharge chamber was improved considerably. The baseline beam- ion-production cost of the optimized configuration was reduced to E ; 21 130 eV/ion. At a discharge-propellant-utilization efficiency of (q,d)unc = 95%, the beam-ion-production cost was reduced to about 155 eV/ion, representing a reduction of about 40 eV/ion over the corresponding value for the J-series thruster.
Along with the design
Comprehensive Langmuir-probe surveys were conducted for the first time in a J-series thruster. The plasma properties derived from these measurements, along with similar results obtained from the ring-cusp thruster, provided valuable insight into the dominant ion-production processes that prevail in their discharge chambers. Both plasmas were found to be characterized by a two- group distribution of electrons, and average values of the electron energies and densities were defined in such a manner as to make them useful in comparing the performance characteristics of the two thrusters.
The technology for fabricating ion-extraction electrodes was improved considerably. Materials specifications have been determined which should ensure successful and reproducible fabrication of electrodes. The hydroforming and stress-relieving fixtures that are used in fabricating electrodes for both two-
I 1 1 I 1 I I I I I 1 I I I I I 1 1 I
2
I I 1 I 8 I 1 I I I I 8 I I I 8 I I 8
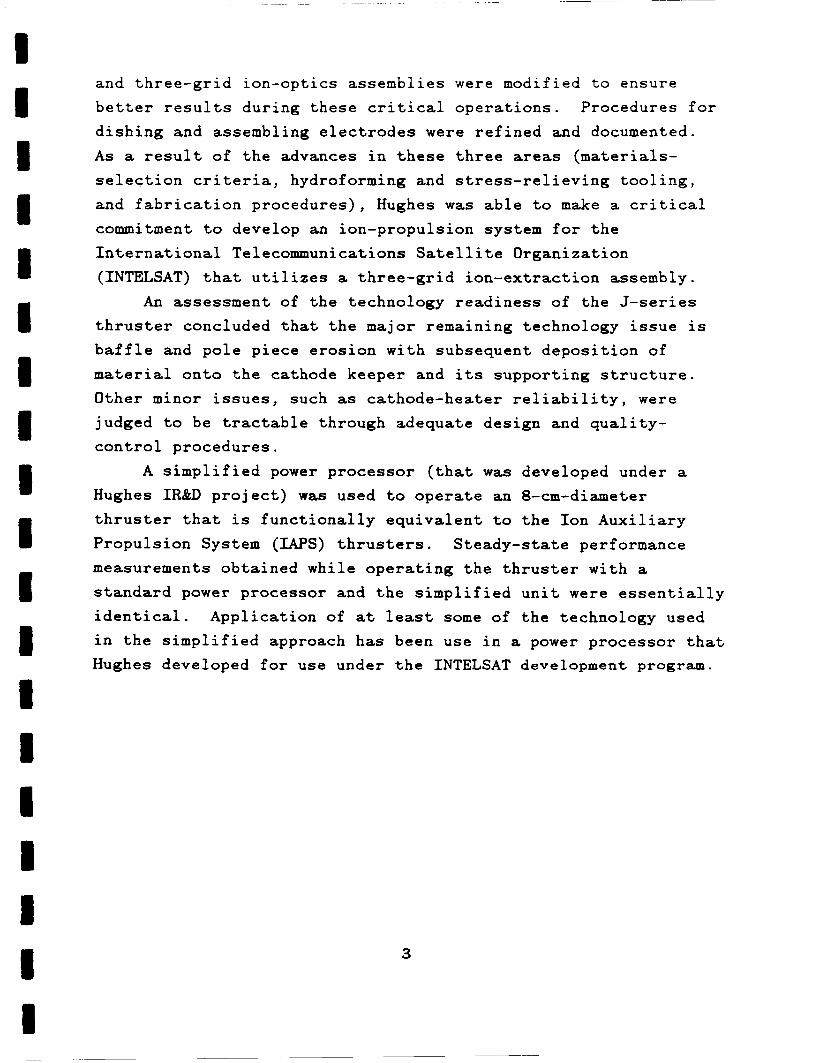
and three-grid ion-optics assemblies were modified to ensure
better results during these critical operations. Procedures for dishing and assembling electrodes were refined and documented. As a result of the advances in these three areas (materials- selection criteria, hydroforming and stress-relieving tooling,
and fabrication procedures), Hughes was able to make a critical
commitment to develop an ion-propulsion system for the International Telecommunications Satellite Organization
(INTELSAT) that utilizes a three-grid ion-extraction assembly. An assessment of the technology readiness of the J-series
thruster concluded that the major remaining technology issue is
baffle and pole piece erosion with subsequent deposition of material onto the cathode keeper and its supporting structure.
Other minor issues, such as cathode-heater reliability, were
judged to be tractable through adequate design and quality- control procedures.
A simplified power processor (that was developed under a Hughes IR&D project) was used to operate an 8-cm-diameter thruster that is functionally equivalent to the Ion Auxiliary Propulsion System (IAPS) thrusters. Steady-state performance measurements obtained while operating the thruster with a
standard power processor and the simplified unit were essentially identical. Application of at least some of the technology used in the simplified approach has been use in a power processor that Hughes developed for use under the INTELSAT development program.
3

SECTION 2
RING-CUSP DISCHARGE-CUMBER TECHNOLOGY
As a result of its high level of performance and inherent simplicity, the ring-cusp thruster is perceived as a potential replacement for other well-optimized designs such as the divergent-field J-series thruster. In the remainder of this section, we present the results of an in-depth investigation of the original ring-cusp configuration"' to optimize its
performance and better understand its operating characteristics.
2.1 DESIGN FEATURES
The ring-cusp and J-series thrusters differ primarily in the
design and performance of their discharge chambers. Major differences include the magnetic-field distribution used to
confine the discharge-chamber plasma, as well as the distribution of anode- and cathode-potential surfaces that define the discharge-chamber boundary. A detailed description of the evolution of the 30-cm-diameter ring-cusp thruster described
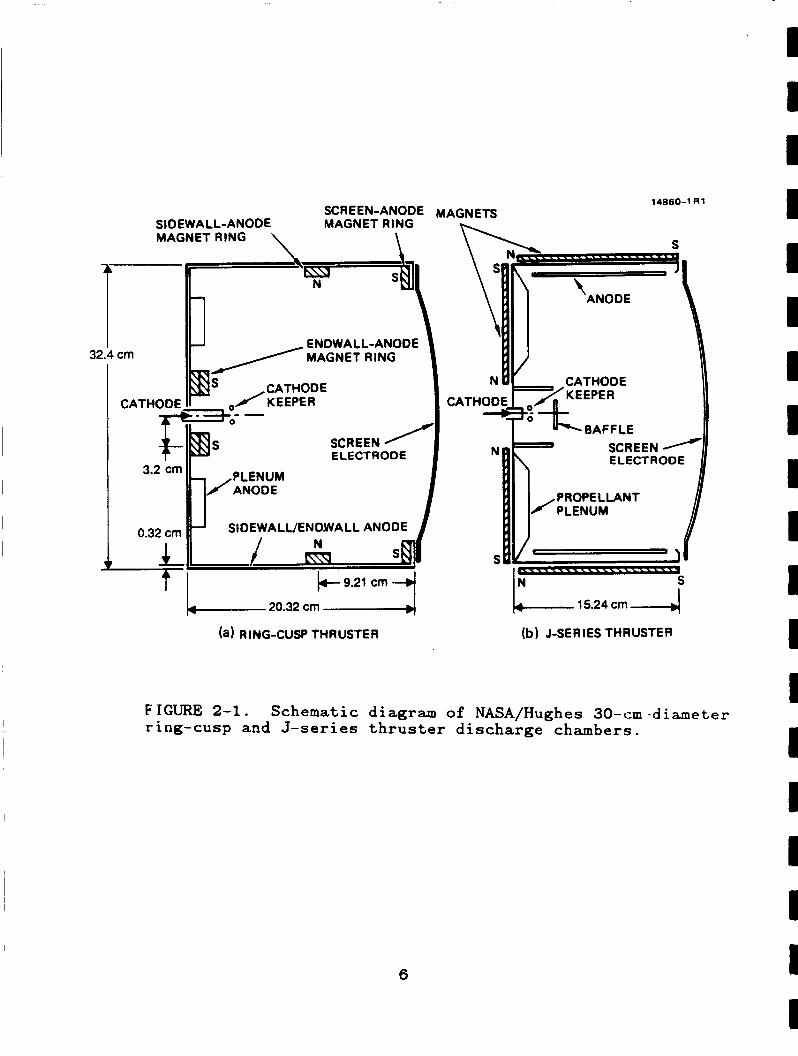
herein is presented in Appendix B. Figure 2-1 shows a schematic diagram of the laboratory-model thruster. For comparison, a schematic of the 30-cm-diameter J-series thruster2'2p 2 - 3 is also
presented. The ring-cusp discharge chamber is constructed of a
cylindrical sidewall and circular endwall, both of which are magnetic and maintained at anode potential. The cathode and
screen electrode are the only electrodes operated at cathode
potential. In addition, the cathode and cathode keeper are positioned in the discharge chamber with no protective structure surrounding them. The discharge chamber of the J-series thruster, by contrast, is comprised of two non-magnetic metal
parts; a circular endwall and a cylindrical outer shell which are operated at cathode potential, and an inner cylindrical liner
32.4 1 14860-1 R1
cm
CATHODE CATHODE S - I I /KEEPER
SCREEN / ELECTRODE
PLENUM ANODE
SIDEWALUENDNALL ANODE
9.21 cm 4 b- 20.32 cm --d
(a) RING-CUSP THRUSTER
ANODE
N
S U M - I - - - - -I 1"- 15.24 cm -J" (b) J-SER I ES THRUSTER
FTGURE 2-1. ring-cusp and J-series thruster discharge chambers.
Schematic diagram of NASA/Hughes 30-cm-diameter
6
1 1 I I I I 1 I I I I I I I I I I 1 I
1 I 1 B I I 1 1 I I I 8 M 1 II I I I I
which is operated at anode potential. The cathode is surrounded by a magnetic-baffle coil that can be energized to control the
current-flow impedance between the cathode and main-discharge
plasmas. The entire cathode assembly (consisting of the cathode and cathode keeper) is located within a baffle/pole-piece assembly which isolates the cathode and main-discharge plasmas.
The magnetic-field distribution within the ring-cusp discharge chamber is generated by three samarium-cobalt (SmCoS)
permanent-magnet rings; two rings on the cylindrical sidewall and a circular ring on the endwall. In the laboratory-model
thruster, the two sidewall magnet rings consist of a single layer
of magnets, while the endwall ring has a double layer to increase the magnetic field strength. The individual magnets are
rectangular in shape (1.9-cm-long by 1.27-cm-wide by 0.5-cm-high,
and magnetized along the short dimension) and are held in place only by the magnetic attraction to the soft-iron boundary of the
discharge chamber. The magnetic field at the surface of the magnets is about 2.5 kG, and their maximum operating temperature is about 3OOOC (above this operating temperature, irreversible loss of field strength occurs). The soft-iron chamber boundary
provides a low-reluctance path for closing the magnetic-flux lines.
The magnetic-field distribution within the J-series
discharge chamber is generated by axial and radial permanent magnets arranged along the outside of the chamber. The maximum operating temperature of the Alnico magnets used in the J-series thruster is much higher (Z750OC) than it is for the SmCoS magnets used in the ring-cusp thruster. However, the magnetic-field
strength near the Alnico magnet faces is significantly lower (2100 G). In addition, the discharge-chamber boundary of the J-series thruster serves as a structural member and is not a part of the magnetic circuit.
7
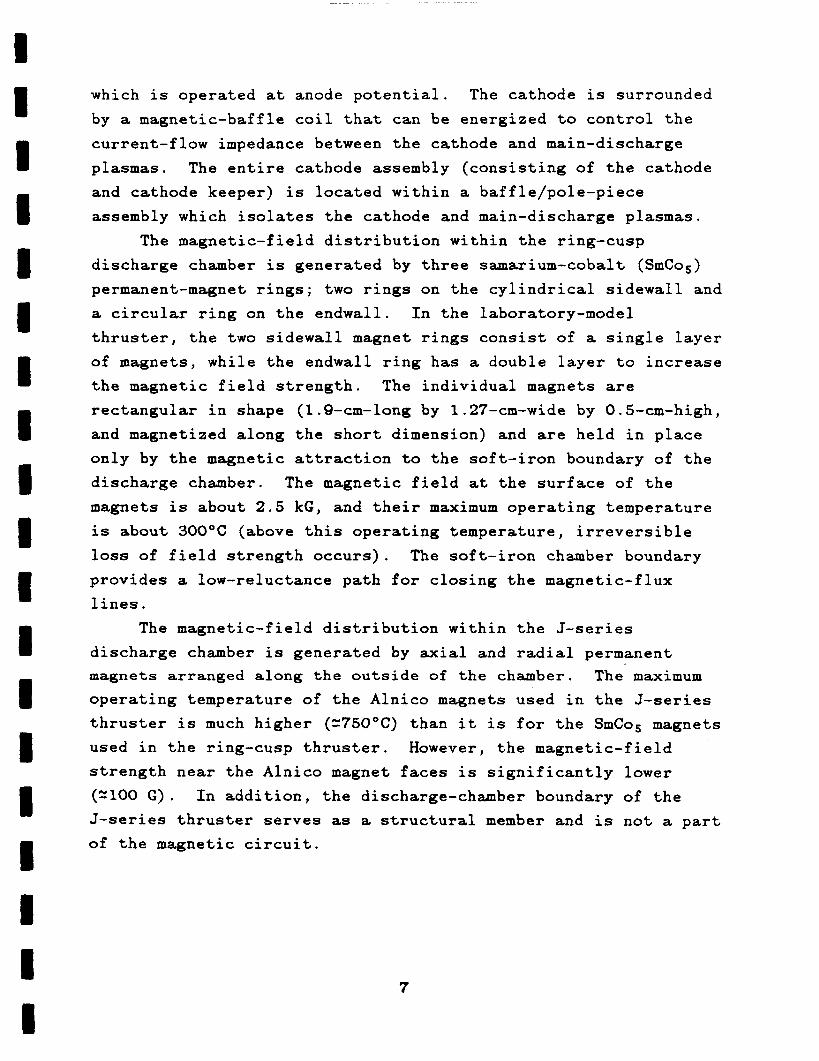
Documentation of the magnetic-field distribution within the ring-cusp discharge chamber included measurements of the vector components of the field, as well as the shape of the flux lines. The scalar field was obtained by measuring the axial and the
radial components (B, and B,) of the magnetic field in the centerline plane of the discharge chamber, and then computing the scalar magnitude as (BZ2 + B r 2 ) ' 1 2 for each measurement point. The vector nature of the magnetic field was documented by using powdered iron to trace out the lines-of-force in the field.
Figure 2-2 compares the scalar-magnetic-field distribution
for the ring-cusp and J-series thrusters. These results indicate
that the most significant feature of the ring-cusp design is the existence of strong magnetic fields along the boundaries of its discharge chamber. By contrast, the J-series thruster exhibits a
much weaker and nearly uniform scalar magnetic-field distribution.
I G 5
9 E w r! U.
c u z 4 2 a
5:
ION-EXTRACTION ELECTRODES
RADIAL MAGNET E .
/," ION-EXTRACTION ,,'# ELECTRODES
(a) RING-CUSP THRUSTER (b) J-SERIES THRUSTER
FIGURE 2-2. Scalar magnetic field distribution comparison.
8
I I I I I I I 1 I I 1 I I I I I I I I

9
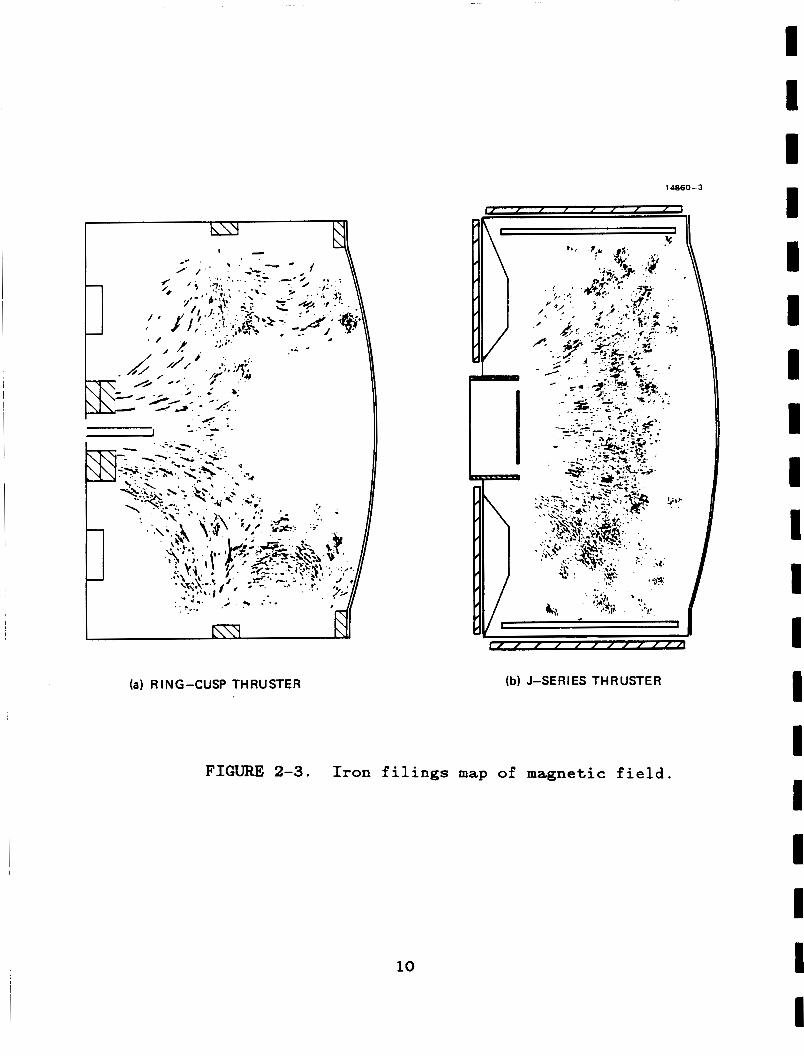
The vector-magnetic-field distributions indicated by iron filing patterns in Figure 2-3 demonstrate the cusp nature of the magnetic-field distribution within the ring-cusp thruster and the
divergent nature of the magnetic-field distribution within the J-series thruster. The cathode in the ring-cusp thruster is located in the endwall-cusp region, with a magnetic-field
strength at the cathode orifice on the order of 100 G. By comparison, in the J-series thruster the cathode is located in a nearly magnetic-field-free region. Discharge-chamber design
criteria determining the shape and magnitude of the magnetic field required for optimum performance of the ring-cusp thruster
were explored in detail and the results are reported under a separate research program. * - '
2.2 PERFORMANCE CHARACTERISTICS
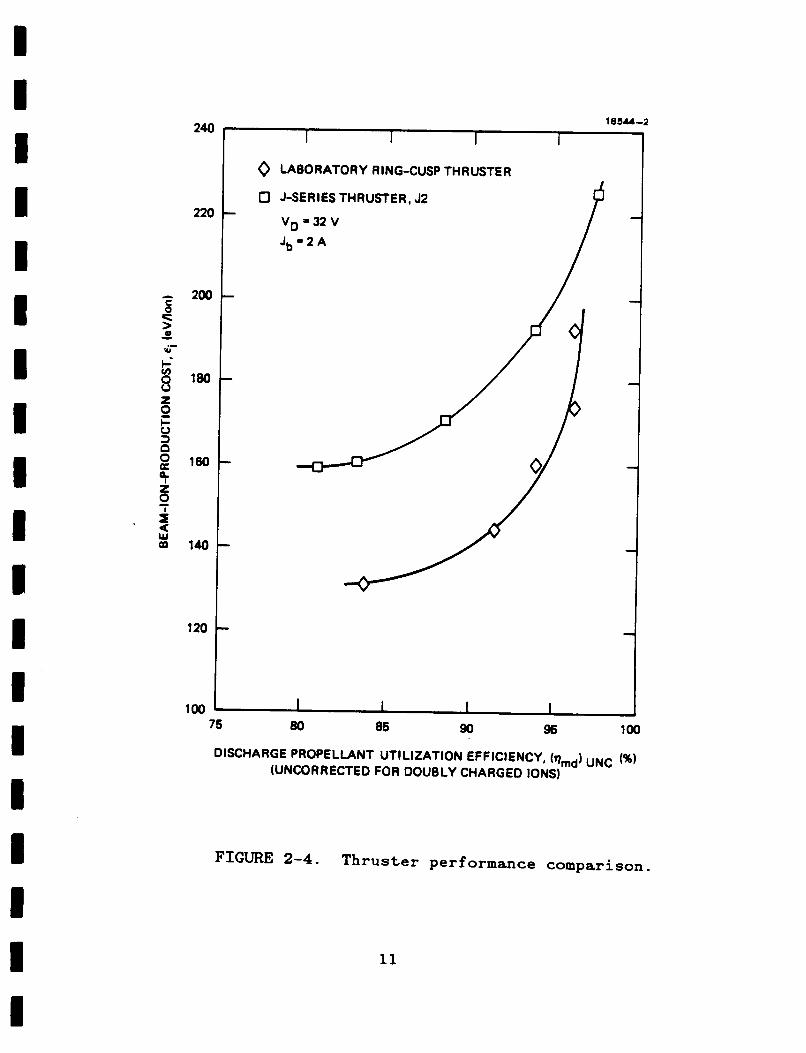
Figure 2-4 presents the performance of the 30-cm-diameter mercury ring-cusp thruster for a beam current of 2 A and a discharge voltage of 32 V (the standard operating conditions for the results presented in this report). The discharge-propellant-
utilization efficiency has not been corrected for doubly charged ions. For comparison, similar measurements obtained for a 30-cm- diameter J-series thruster (S/N J2) are also presented to show the significant performance improvement that has been achieved
with the optimized ring-cusp thruster. Figure 2-4 shows a performance improvement of about 40 eV/ion for the ring-cusp thruster operating at a propellant-utilization efficiency of 95%.
2.3 OPEBATING CHARACTERISTICS
The strong magnetic fields at the boundary of the ring-cusp discharge chamber (see Figure 2-2) inhibit energetic electrons from reaching the anode-potential surfaces anywhere
except in the cusp regions of the magnetic field defined by the three magnet rings. crossing the magnetic-flux lines that connect adjacent magnet
Energetic electrons are prevented from
1A860-3
(a) RING-CUSP THRUSTER (b) J-SERIES THRUSTER
I I I 1 I I 1 I I
FIGURE 2-3. Iron filings map of magnetic field.
I I
10
I I I I I I I I I I I I I I I I I I I
18544-2
0 LABORATORY RING-CUSP THRUSTER
0 J-SERIES THRUSTER, J2 P v D a 3 2 v
100 j 2 O 1 80 85 90 96 100 75
DISCHARGE PROPELLANT UTILIZATION EFFICIENCY, (vmd) UNC (%) (UNCORRECTED FOR DOUBLY CHARGED IONS)
FIGURE 2-4. Thruster performance comparison.
11
rings by the large values of JBdl (typically on the order of 1000 Gauss-cm) . - J -' J - ' Low-energy electrons cross the field lines more readily due to their much higher coulomb-collision cross section.
The electron current that sustains the discharge is influenced by the strong fields and small dimensions of the magnet cusps. It has been shown experimentally 2-8~2-Q~2-10that the effective area for electron collection at the cusps of the magnets is larger for low-energy electrons than it is for high- energy primaries. The ratio of these areas is found to agree with the ratio of the hybrid cyclotron radius, primary-electron cyclotron radius, rp. Therefore, the low-energy electrons tend to be preferentially "filtered out" in the magnetic cusps. The net result in the ring-cusp thruster is that plasma electrons bound to magnetic field lines that intersect the anode are reflected from the magnetic cusps due to mirror effects and limited conduction area. In this manner, the efficient confinement of ionizing plasma electrons is obtained.
(reri) ' I 2 , to the
Ions produced in the discharge chamber preferentially drift to the ion-extraction assembly at the ion-acoustic or Bohm velocity. '-11~'-12 The magnetically shielded anode-potential surfaces within the discharge chamber limit the amount of ion loss. Both analyti~al'"~ and e~perirnental'-'~~~-~' investigations have shown that the ion-arrival rate at these surfaces is consistent with the ions having a velocity close to that of the slow-moving neutrals. With nearly all the discharge- chamber volume bounded by magnetically shielded anode-potential surfaces, ion loss within the ring-cusp discharge chamber is relatively low.
By comparison, the plasma in the J-series thruster is confined by a divergent magnetic field. Electrons must diffuse across magnetic field lines before being collected by the anode. Furthermore, electrons bound to magnetic-field lines that intersect the anode will be lost at that surface.
I I I I I I I I I I 1 I 3 I I I I I I
12

The discharge-chamber configuration in the J-series thruster
is similar to conventional Penning discharge chambers, comprised of a combination of cathode-potential surfaces and magnetically
shielded anode-potential surfaces. The endwall surface is a magnetically shielded cathode-potential surface and represents a
substantial fraction of the total surface area of the discharge chamber. Magnetically shielded cathode-potential surfaces in
general represent a greater loss-mechanism for ions than do magnetically shielded anode-potential surfaces.*'13 account for higher ion-loss rates within the J-series discharge
chamber and an accompanying reduction in thruster performance.
This can
The description given above of ring-cusp thruster operation was verified by comprehensive measurements of the discharge-
chamber plasma properties and current-flow measurements to the
anode- and cathode-potential surfaces defining the discharge- chamber boundary. These results are presented in the material
that follows.
2.3.1 Plasma Properties
Under this program, we developed a technique for correlating the dominant plasma processes occurring within the discharge chamber with observed thruster performance. Average values of the Maxwellian-electron temperature and density, as well as the
primary-electron energy and density, were computed and correlated with thruster performance. A detailed description of this technique, including a comparison of the average plasma properties for the ring-cusp and J-series thrusters is presented in Reference 2-15.
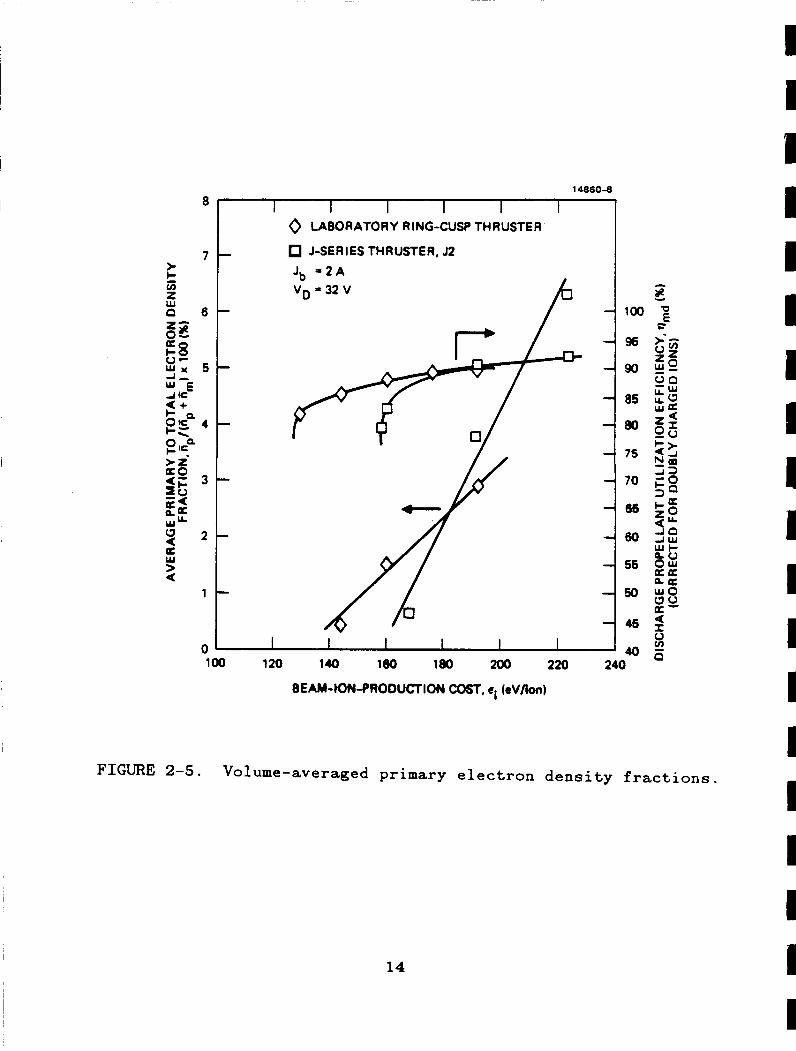
Figure 2-5 shows the variation of the average primary- electron fraction (ratio of primary-electron density to plasma density) with beam-ion-production cost for both the ring-cusp and J-series thrusters. For comparison, performance measurements f o r these thrusters are also shown. (The propellant-utilization data
of Figure 2-5 have been corrected for doubly charged ions, since the theory developed to compute the volume-averaged plasma
properties does not account for multiply ionized atoms.)
14860-8 8 I I I I I I
0 LABORATORY RING-CUSP THRUSTER
J-SERIES THRUSTER, J2
Jb = 2 A V g ~ 3 2 V
0 6 ' t > k v) z w
l t
P 1. 05
00
75
70
65
60
55
50
45 0 1 I I I I I I 100 120 140 le0 180 200 220 240
BEAM-tON-PRODUCTION COST, ei ( e V h )
0
c E
FIGURE 2-5. Volume-averaged primary electron density fractions.
14
I I 1 I I I 1 I I 1 I 1 I I I 1 I 1 I

The ring-cusp thruster maintains a higher primary-electron
fraction than the J-series thruster as the beam-ion-production
cost is lowered, demonstrating its superiority in confining
primary electrons. Although the density of primary electrons is low (varying from 1% to 3%), it can be shown that the primaries are responsible for about 15% of the total ion
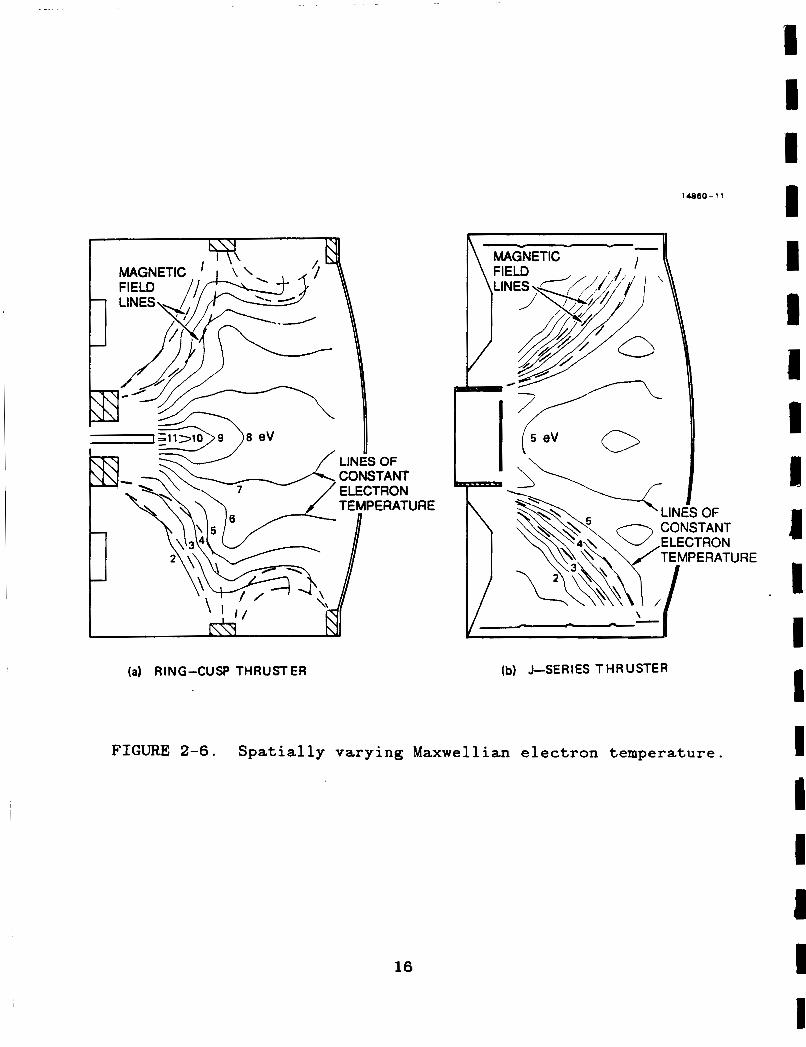
The Maxwellian electrons are responsible for the balance of the ion production. Figure 2-6 shows measurements of the spatially varying Maxwellian-electron temperature for the ring- cusp and J-series thrusters. The electron temperature is
constant along the magnetic-field line^^-'^^^-^' in both thrusters, and the isotherms have very nearly the same shape as
the magnetic-field lines. This suggests that there is good plasma confinement for both thrusters. However, the electron
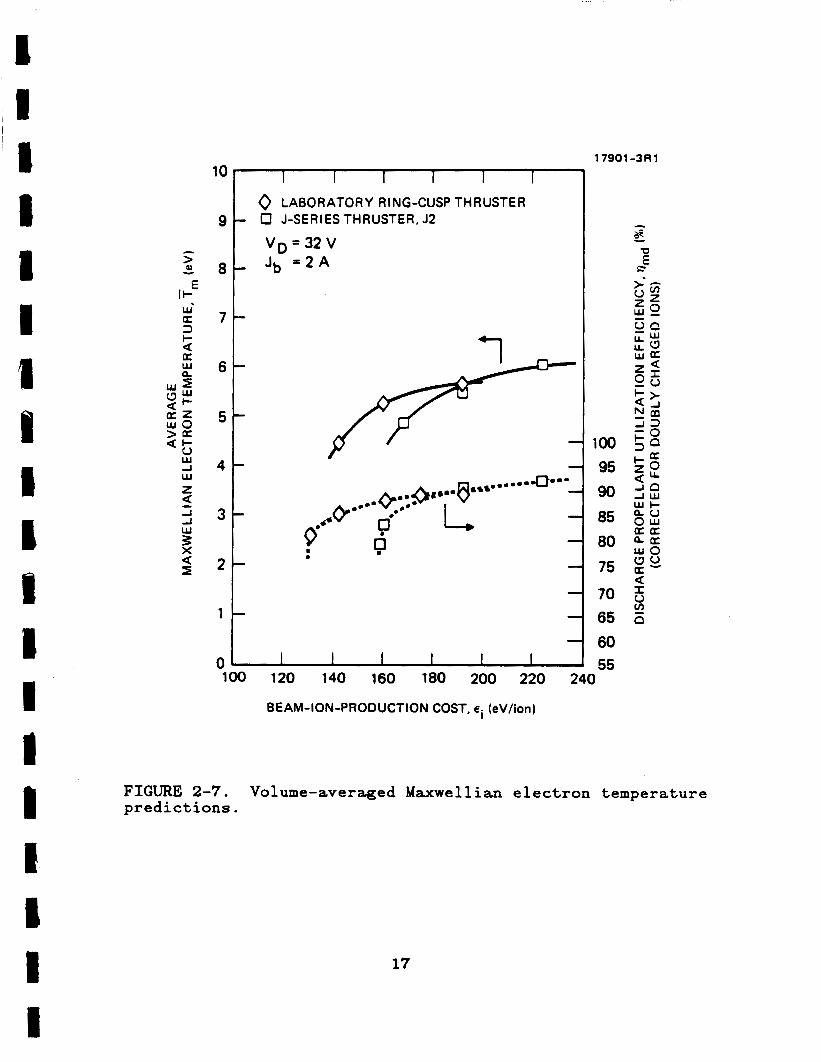
temperature in the ring-cusp thruster is significantly higher.
Figure 2-7 shows the variation of the average Maxwellian-electron temperature with beam-ion-production cost for both the ring-cusp
and J-series thrusters. These results indicate that as the beam-
ion-production cost is reduced, the ring-cusp thruster maintains
an average Maxwellian-electron temperature that is about 1 eV higher than it is in the J-series thruster. The 1-eV increase evident in Figure 2-7 is substantial, especially considering that it represents an increase over the total volume of the ion- production region. A higher Maxwellian-electron temperature indicates more-efficient confinement of this species.
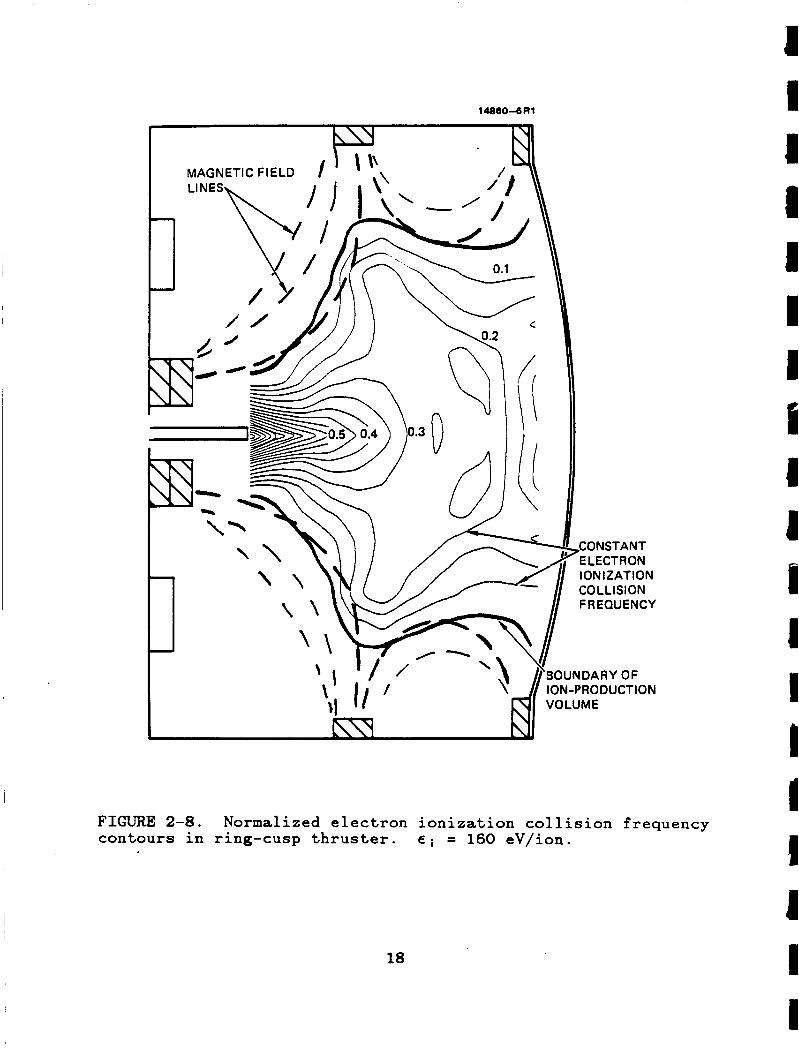
The results shown in Figures 2-6 and 2-7 indicate that the ring-cusp discharge chamber is more efficient in confining plasma, and this helps to explain the performance improvement over the J-series thruster. Calculations of the ion-production
rate (ionization collision frequency) within the discharge chamber further demonstrate the effectiveness of the ring-cusp design in confining the discharge plasma. Figure 2-8 shows contours of the ionization collision frequencies (accounting for
15
(a) RING-CUSP THRUSTER
14860-11
ELECTRON TEMPERATI
\
(b) J-SER I ES T H R U STER
OF rANT
FIGURE 2-6. Spatially varying Maxwellian electron temperature.
16
JRE
1 I I I I I 1 I I] 1 I I I I I I I I 1
10 - I I I I I I 0 LABORATORY RING-CUSP THRUSTER
9 - O J-SERIESTHRUSTER, J2
V g = 3 2 V Jb = 2 A 8 -
7t I
2 3l l t
0. 9*&
1
3 0 1 I 1 I I I I 1 55 1 0 0 120 140 160 180 200 220 240
BEAM-ION-PRODUCTION COST, ei (eV/ion)
FIGURE 2-7. predictions.
Volume-averaged Maxwellian electron temperature
17
14860-6 R1
FIGURE 2-8. contours in ring-cusp thruster. ~i = 160 eV/ion.
Normalized electron ionization collision frequency
18
1 I 1 I I I 1 S J I I 1 I I I 4 1 I I
both Maxwellian and primary electrons) calculated from plasma
properties measured in the ring-cusp discharge chamber. The
contour lines have been normalized with respect to the maximum
collision frequency. The solid line represents the boundary of the ion-production region, which is defined as the contour line that encloses 95% of the total ionization occurring within the discharge chamber.2"6 This boundary also has very nearly the same shape as the magnetic-field lines (shown by dotted lines)
used to confine the plasma.
The ion-production region is seen to be defined by the three magnet rings. The region of highest ion production extends from the axial location of the sidewall magnet ring to the axial location of the magnet ring nearest the ion-extraction assembly. Very little ion production occurs near the upstream location of the endwall magnet ring or near the magnetically shielded anode-
potential sidewall/endwall boundary surfaces.
Having established where ions are produced, the plasma-
potential distribution can be used to infer the direction of ion
flow within the discharge chamber. Because of their large cyclotron radii, ions are influenced more by electric fields than
they are by magnetic fields, with the electric fields produced by
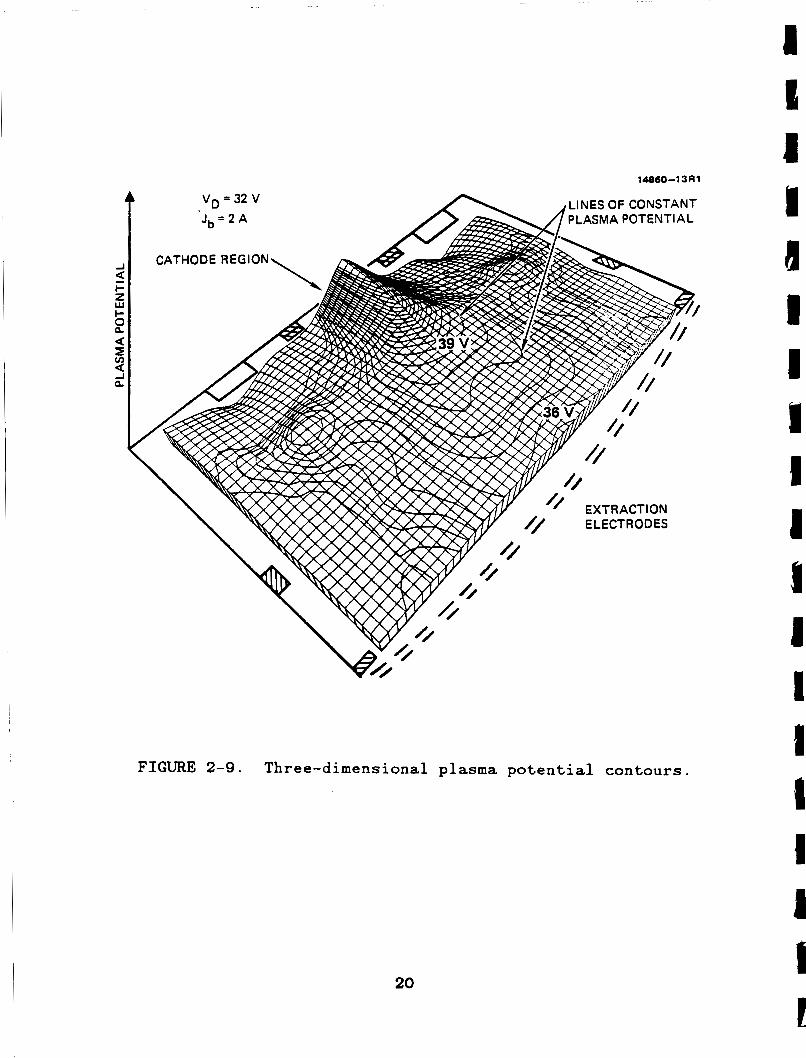
gradients in the plasma potential. Figure 2-9 shows contours of the plasma potential; there is about a 3 V drop in plasma potential between the region of highest ion production (cf. Figure 2-8) and the ion-extraction assembly. It is possible to infer from this gradient the presence of ion-accelerating potentials that result in directed ion transport away from regions of maximum ion production.
The concept of directed ion transport at the Bohm velocity has been studied and verified by several researchers. 2 - ' ' ' 2 - ' to the ion-extraction assembly by correlating the measured beam profile (as inferred by measurements obtained by sweeping a
Faraday probe through the ion beam) with the calculated ion flux to the screen electrode of the ion-extraction assembly. The ion
- '' We explored the concept of directed ion transport
19
14860-13A1
LINES OF CONSTANT PLASMA POTENTIAL
CATHODE REGION U
z w I-
U I
F
2
4 r n
Q
FIGURE 2-9. Three-dimensional plasma potential contours.
20
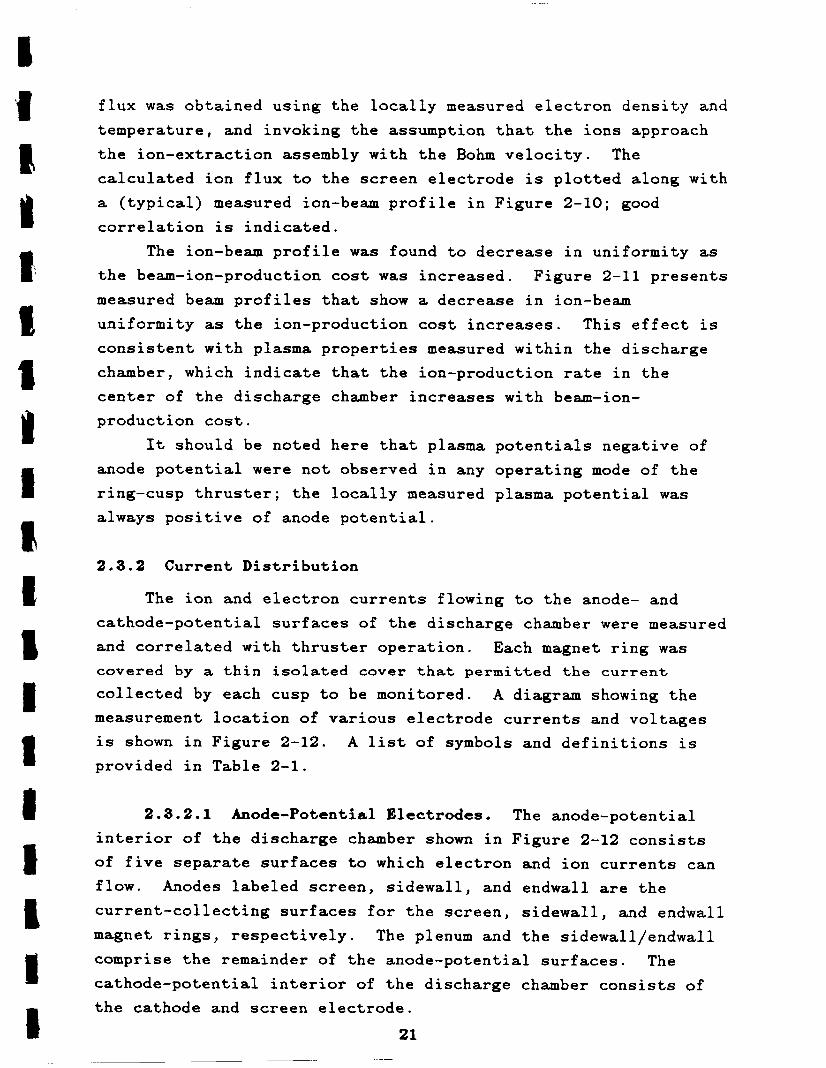
flux was obtained using the locally measured electron density and temperature, and invoking the assumption that the ions approach
the ion-extraction assembly with the Bohm velocity. The calculated ion flux to the screen electrode is plotted along with
a (typical) measured ion-beam profile in Figure 2-10; good correlation is indicated.
The ion-beam profile was found to decrease in uniformity as
the beam-ion-production cost was increased. Figure 2-11 presents
measured beam profiles that show a decrease in ion-beam uniformity as the ion-production cost increases. This effect is consistent with plasma properties measured within the discharge
chamber, which indicate that the ion-production rate in the
center of the discharge chamber increases with beam-ion- production cost.
It should be noted here that plasma potentials negative of
anode potential were not observed in any operating mode of the ring-cusp thruster; the locally measured plasma potential was
always positive of anode potential.
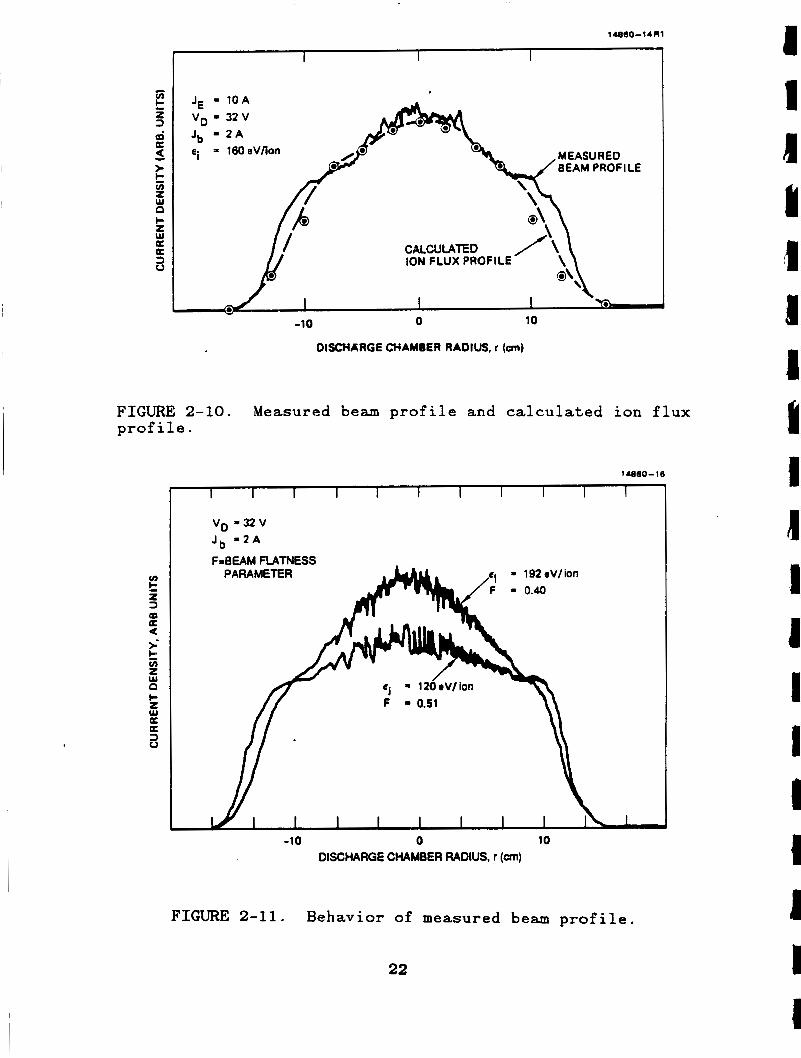
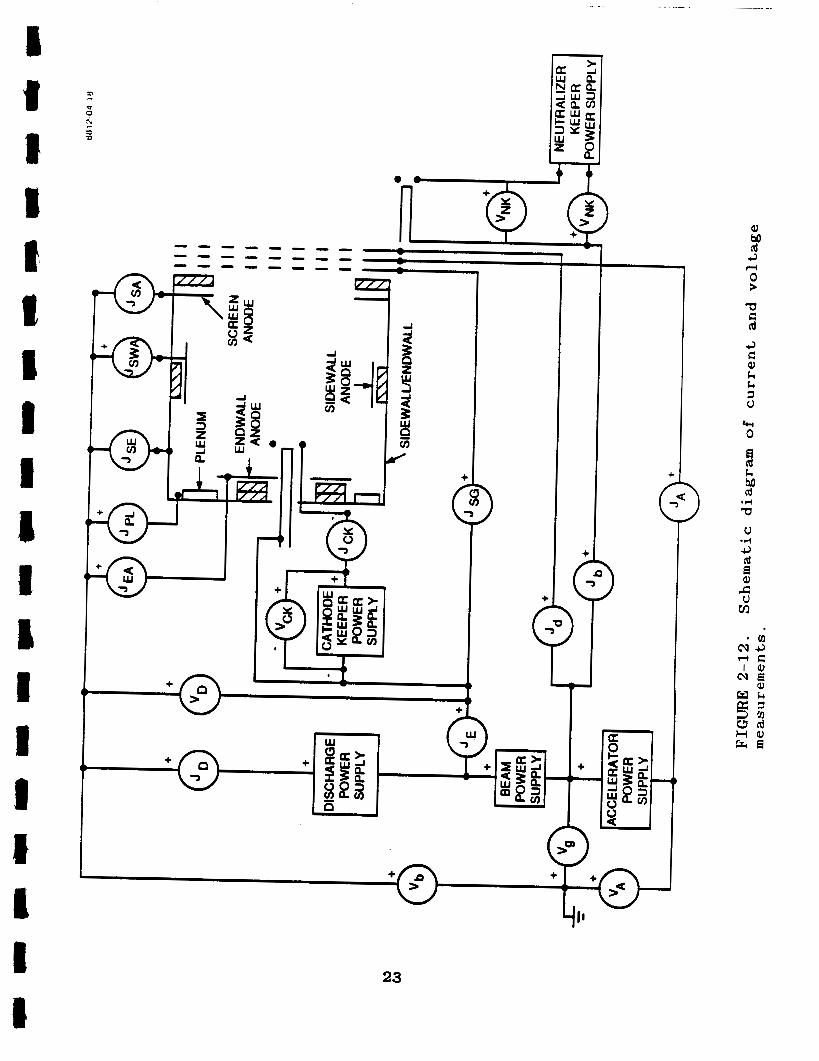
2.3.2 Current Distribution
The ion and electron currents flowing to the anode- and
cathode-potential surfaces of the discharge chamber were measured and correlated with thruster operation. covered by a thin isolated cover that permitted t h e current
collected by each cusp to be monitored. A diagram showing the measurement location of various electrode currents and voltages is shown in Figure 2-12. A list of symbols and definitions is provided in Table 2-1.
Each magnet ring was
2.3.2.1 Anode-Potential Electrodes. The anode-potential
interior of the discharge chamber shown in Figure 2-12 consists of five separate surfaces to which electron and ion currents can flow. Anodes labeled screen, sidewall, and endwall are the
current-collecting surfaces for the screen, sidewall, and endwall magnet rings, respectively. The plenum and the sidewall/endwall comprise the remainder of the anode-potential surfaces. The
cathode-potential interior of the discharge chamber consists of the cathode and screen electrode.
21
14860-1 4 R1
v) k z 3 m a U > c - B x
3
c 2 w a a
I I I
JE 10A VD = 32 W Jb - 2 A ci = 160eVfion
BEAM PROFILE
ION FLUX PROFILE
-10 0 10
DISCHARGE CHAMBER RADIUS, r (an)
FIGURE 2-10. Measured beam profile and calculated ion flux profile .
14a60-16
I I I I I I I I I I I
V g *32V J,, - 2 A
F=BEAM FIATNESS v) c z 3 Q a U G t v)
a I- z w
E
a a 3 0
-10 0 10 DISCHARGE CHAMBER RADIUS, r (an)
FIGURE 2-11. B e h a v i o r of measured beam profile.
22
1 1 d Y
d I Y 1 d I I I I I i 1 I I
1 I
a -
I f I +
+
23
v b
J b
VA
JA
Jd
JE
JP I
JS C
JS A
J S W A
JS E
JE A
VD
v, VN K
JN K
vC K
J C K
’Ind
( ‘ Indl u n c
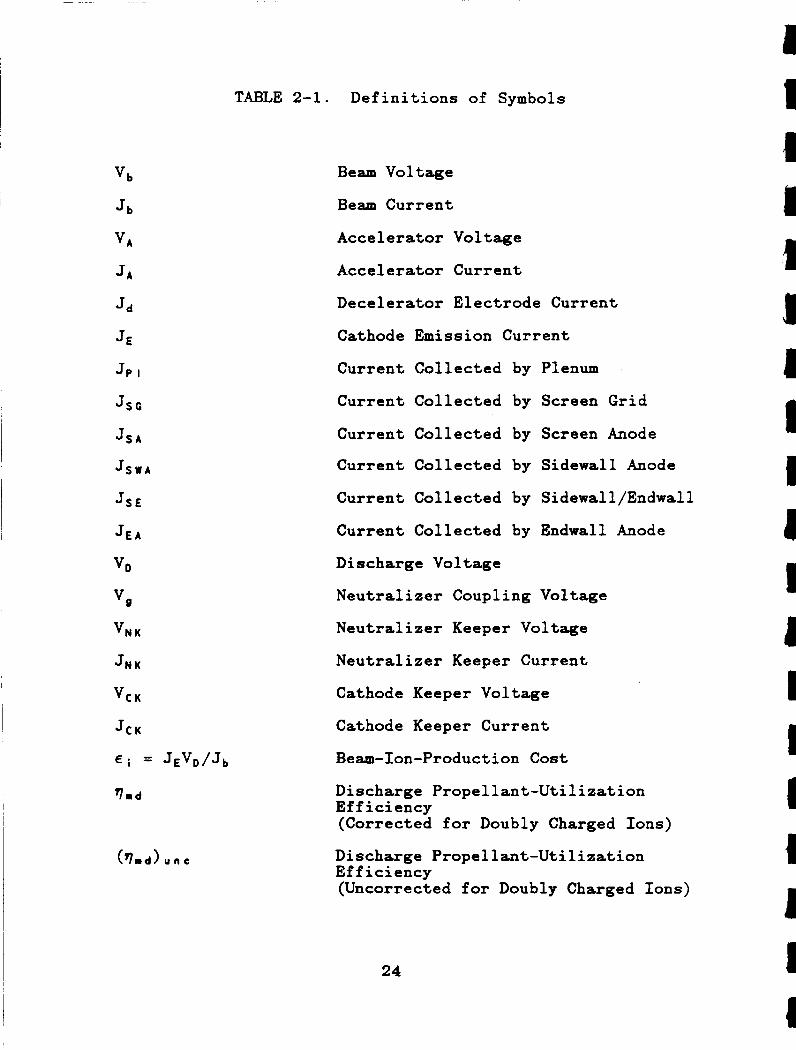
TABLE 2-1. Definitions of Symbols
Beam Voltage
Beam Current
Accelerator Voltage
Accelerator Current
Decelerator Electrode Current
Cathode Emission Current
Current Collected by Plenum
Current Collected by Screen Grid
Current Collected by Screen Anode
Current Collected by Sidewall Anode
Current Collected by Sidewall/Endwall
Current Collected by Endwall Anode
Discharge Voltage
Neutralizer Coupling Voltage
Neutralizer Keeper Voltage
Neutralizer Keeper Current
Cathode Keeper Voltage
Cathode Keeper Current
Beam-Ion-Production Cost
Discharge Propellant-Utilization Efficiency (Corrected for Doubly Charged Ions)
Discharge Propellant-Utilization Efficiency (Uncorrected for Doubly Charged Ions)
24
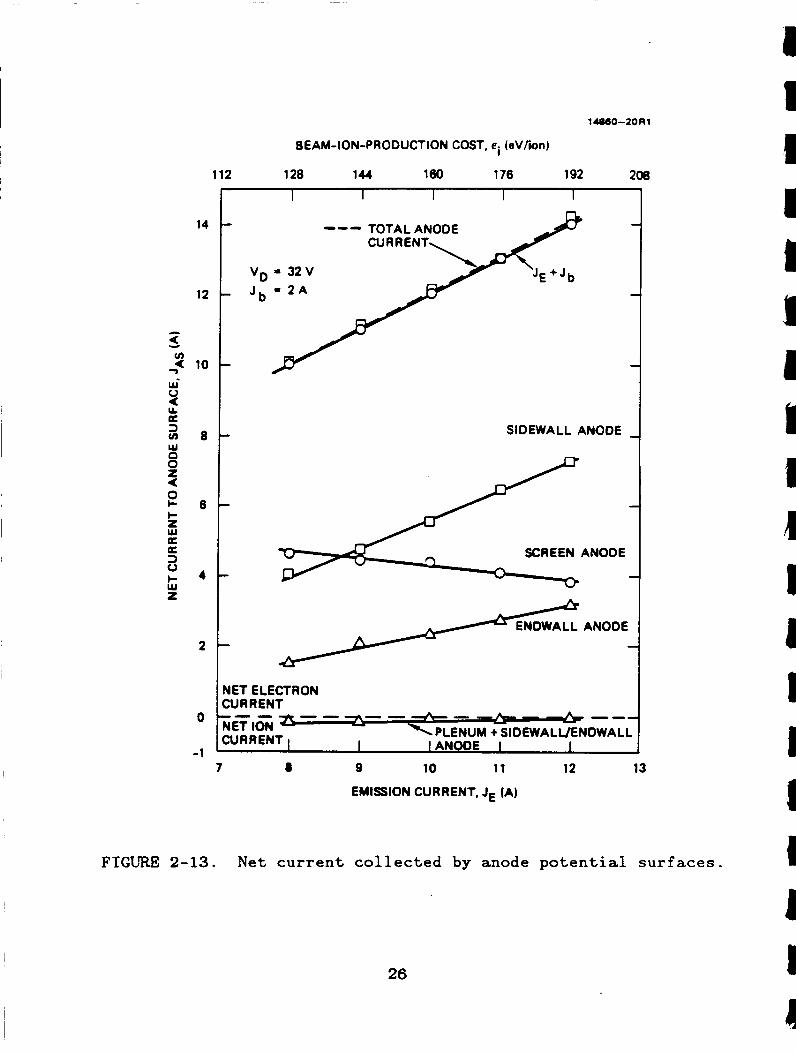
Figure 2-13 shows the variation of the net currents collected by the five anode-potential surfaces as a function of
cathode-emission current. The variation of total anode current (the sum of the individual anode currents) is also presented, showing good agreement with the variation of the sum of the beam
and cathode-emission currents; all net currents are
satisfactorily accounted for. The plenum and sidewall/endwall each collect a small ion
current, which is on the order of 10 mA for the plenum and 70 mA
for the sidewall/endwall. For clarity, the sum of these two currents is shown in Figure 2-13. By contrast, the screen,
sidewall, and endwall anodes collect net-electron current. These
results suggest excellent electron confinement to the three
magnet r.ings that define the cusp regions of the magnetic field. The screen and sidewall anodes collect the majority (280%) of the electron current, independent of the cathode-emission current. This is due to the location of these two electrodes within the ion-production region; the axial location of the sidewall anode coincides with the region of highest ion production (cf.
Figure 2-S), while the axial location of the screen anode coincides with the downstream end of the ion-production region near the ion-extraction assembly. For all but the screen anode, the net-electron current increases with cathode-emission current.
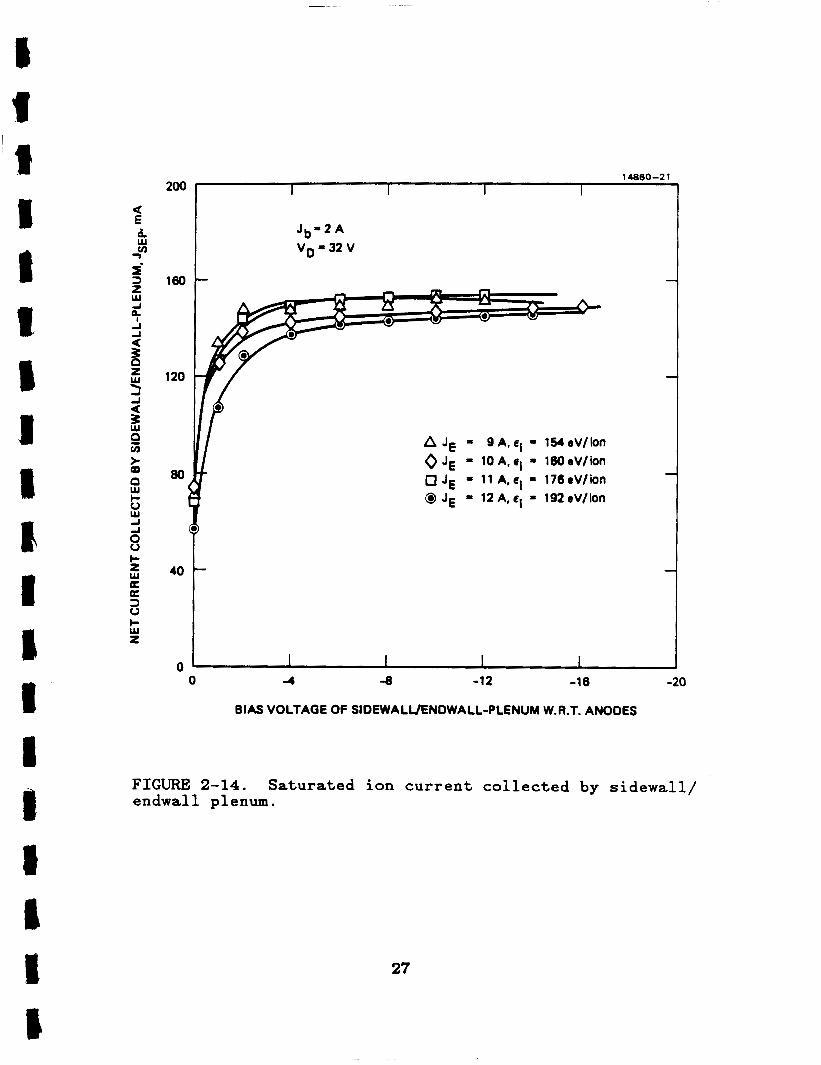
The net-ion current collected by the sidewall/endwall and plenum surfaces w a s determined by simultaneously biasing these
surfaces negative with respect to the remaining anode-potential surfaces. The results are shown in Figure 2-14, indicating that
the net-ion current flowing to the combined sidewall/endwall- plenum surface varies from about 140 d to 150 mA as the cathode- emission current decreases from 12 A to 9 A , while the net-
electron current varies from about 70 mA to 80 mA. The ion current saturates at a relatively low value of applied bias voltage (2 2 V), confirming that the electrons flowing to the
sidewall/endwall-plenum surface have low energy.
25
1 1
U - u) <
W' 0 U IL a 3 u) W 0 0 z 4
7
2 I- z W
3 0 I- w z
a a
14
12
10
8
6
4
2
0
-1
14860-20RI
BEAM-ION-PRODUCTION COST, ei ( e V h n )
112 128 144 le0 176 1 92 208
VD J b
TOTAL ANODE --- CURRENT.
\ Jc+Ji.
SIDEWALL ANODE
SCREEN ANODE c ENDWALL ANODE 3
JET ELECTRON :UR RENT
--I
NUM + SlOEWALL/ENDWALl I IANOOE I I
7 8 9 10 11 12 13
EMISSION CURRENT, JE (A)
FIGURE 2-13. Net current collected by anode potential surfaces.
26
1 I
200
le0
120
00
I (
40
0 i
I I 14860-2 1
I I I
F A JE = 9 A, ei = 154 eV/ion 0 JE = I O A , ~ ~ = lWeV/ ion 0 JE = l l A . e i = 176eV/ion 0 JE = 12A,ei = 192eV/ion
-
I I I I
-12 -16 -20 0 4 -8
BIAS VOLTAGE OF SIDEWALUENDWALL-PLENUM W.R.T. ANODES
FIGURE 2-14. endwall plenum.
Saturated ion current collected by sidewall/
27
The sidewall/endwall-plenum satisfies the definition of a
magnetically shielded anode-potential surface. The small current
of low-energy electrons collected by this surface affirms the confinement of high-energy electrons to the cusp regions of the magnetic field. The small ion current collected by this surface
is consistent with the concept of reduced ion transport to a magnetically shielded anode-potential surface.*’13
did not measure the ion loss to the three magnet-ring covers,
Kaufman’s model of reduced ion transport to magnetically shielded
anode-potential surfaces can still be used to infer a small ion
loss to the cusps as well.
Although we
2.3.2.2 Cathode-Potential Electrodes. The cathode and
screen electrode are the only cathode-potential surfaces within
the discharge chamber. The screen electrode is a loss surface for ions as well as energetic electrons capable of overcoming the potential difference between it and the plasma.
The ion current flowing to the screen electrode was determined by biasing it negative with respect to the cathode. The saturated ion current measured in this manner was 500 mA when
the beam current was 2 A, implying an ion transmission of 80% for the particular ion-extraction assembly used in the test (S/N 914). The beam and accel electrode voltages were +1200 V and -350 V, respectively.
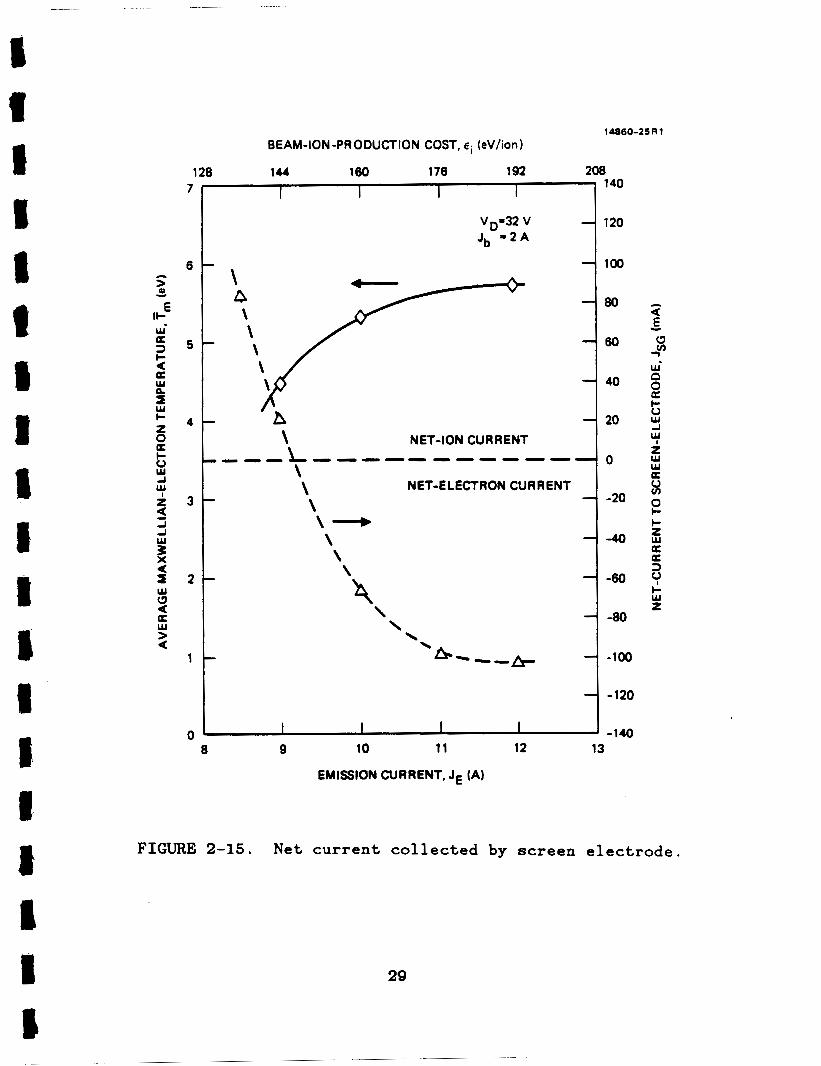
Measurements of the variation of net screen-electrode
current with cathode-emission current (beam-ion-production cost)
were obtained with the screen electrode connected to cathode
through an ammeter. Figure 2-15 shows that as the cathode- emission current is reduced, the current collected by the screen electrode undergoes a transition from net-electron current to
net-ion current. (For comparison, calculations of the volume-
averaged Maxwellian-electron temperature shown previously in Figure 2-7 are included also). This behavior can be understood
by considering the Maxwellian energy-distribution functions for
electron temperatures corresponding to thruster operation above
28
1. I I I
BEAM-ION -PRODUCTION COST, ei (eV/ion) 14860-25A1
128 144 160 176 192 208
I4O
1 l 2 O
Vox32 V Jb - 2 A
\ n \ \ \
100
80
60
40
20
0
-20
\ NET-ION CURRENT .--- L---- ------- \ \ NET-E LECTRON CURRENT
\ \ - \ \
-40
-60
-80
1 -120
I I 1 I -140 -
8 9 10 11 12 13 EMISSION CURRENT, JE (A)
FIGURE 2-15. Net current collected by screen electrode.
1 i
29
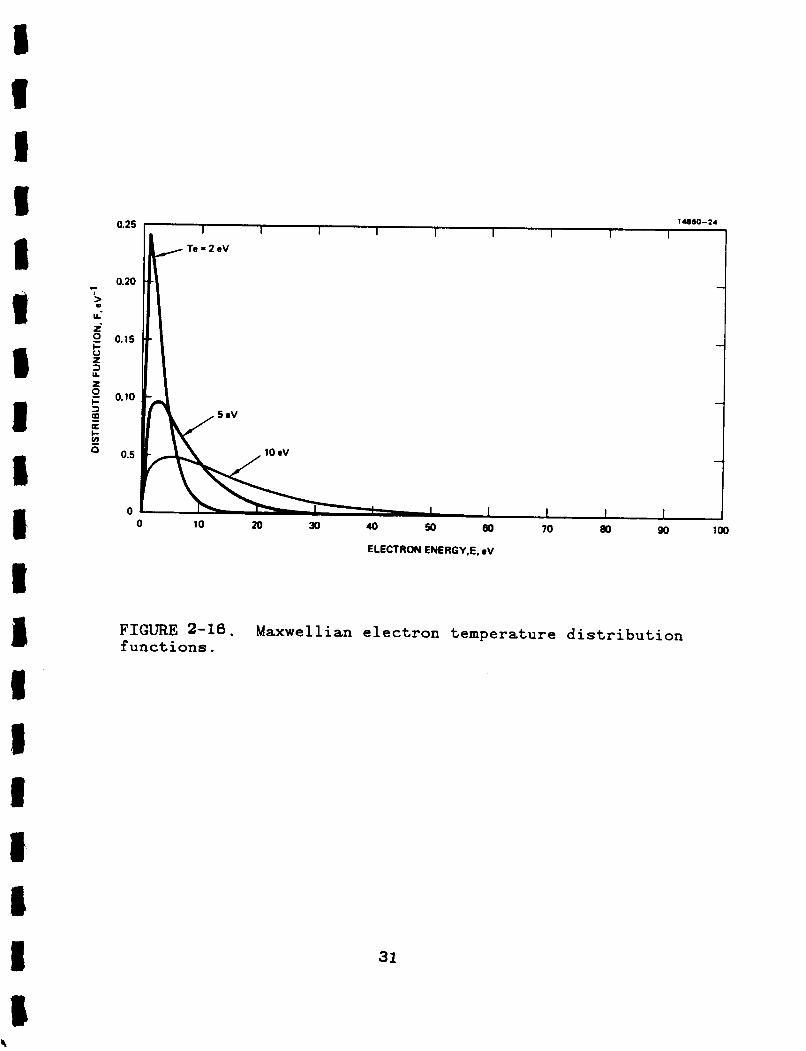
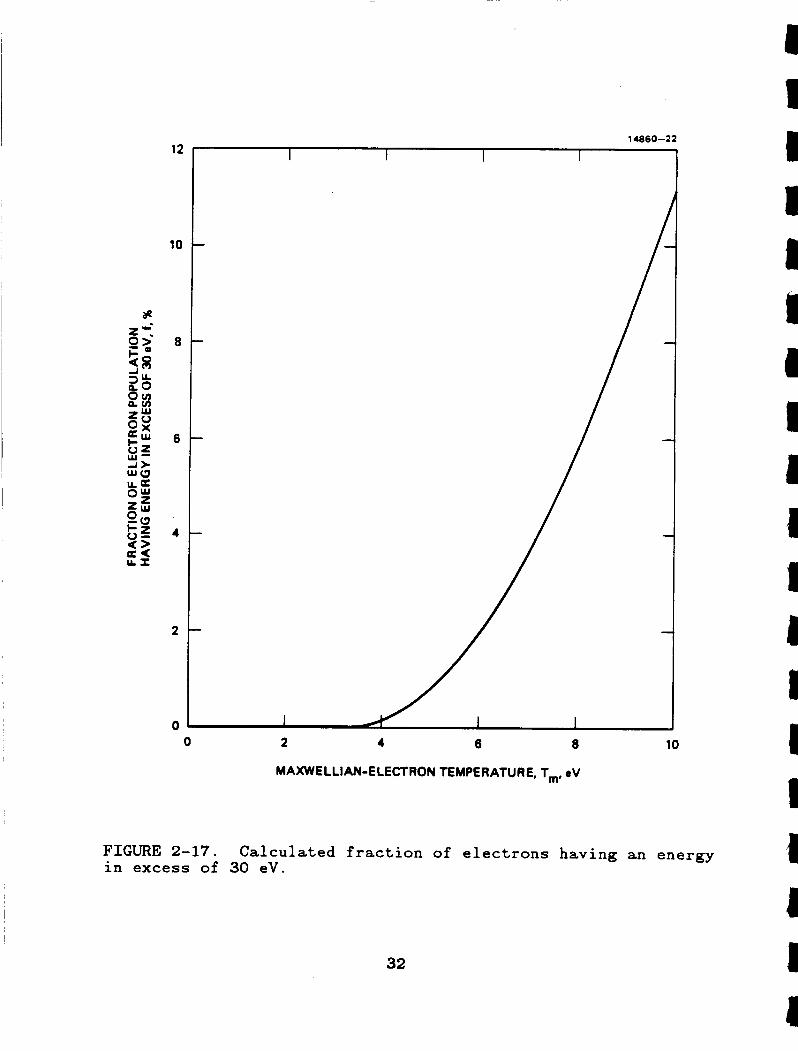
and below the current-collection transition point shown in Figure 2-15. The energy-distribution functions for various electron temperatures are shown in Figure 2-16; by integrating the distribution function over the appropriate limits, one can compute the fraction of electrons having energies in excess of a specified value. For our purposes, we specify this value as 30-eV; approximately the plasma potential within the discharge chamber. Figure 2-17 presents results of calculations to show (as a function of temperature) the fraction of electrons that have energies in excess of 30 eV; this fraction increases from less than 1% for a 5-eV temperature to about 4% for a 7-eV temperature. Therefore, the transition from net-ion to net- electron current collection by the cathade-potential screen electrode can be understood to occur when the cathode-emission current is increased to the point that the electron temperature near the screen electrode exceeds about 4 eV. The volume- averaged electron temperatures presented in Figure 2-15 support this argument.
Correlation of the net current collected by the screen electrode with the Maxwellian-electron temperature suggests that this measurement can be used as a simple and fast diagnostic to compare the Maxwellian-electron temperature for different operating conditions. We utilize this technique in the sections that follow.
2 . 4 ANODE EFFECTS
We extended our study of current collection to the anode- potential surfaces within the discharge chamber by exploring the effect each anode surface has on influencing thruster performance. This was accomplished by allowing each separate anode surface to electrically float by disconnecting it from the discharge power supply. In this manner, the electron current collection could be redistributed to the various anode surfaces, in an attempt to effect a redistribution of the ion-production volume.
30
c I
2 ri i P c 0 z 3 U 2
I- Q
a s 5 0
0.25
0.20
0.15
0.10
0.5
I, iweo-zi
I I I I I I 1 I I To=ZeV
I I I
60 10 m 90 loo
ELECTRON ENERGY,E, eV
FIGURE 2-16. functions.
Maxwellian electron temperature distribution
31
12
10
8
6
4
14860-22
I I
I I
0 2 4 6 8
MAXWELLIAN-ELECTRON TEMPERATURE, Tm, SV
10
FIGURE 2-17. in excess of 30 eV.
Calculated fraction of electrons having an energy
32
2.4.1 Endwall Anode and Plenum Floating
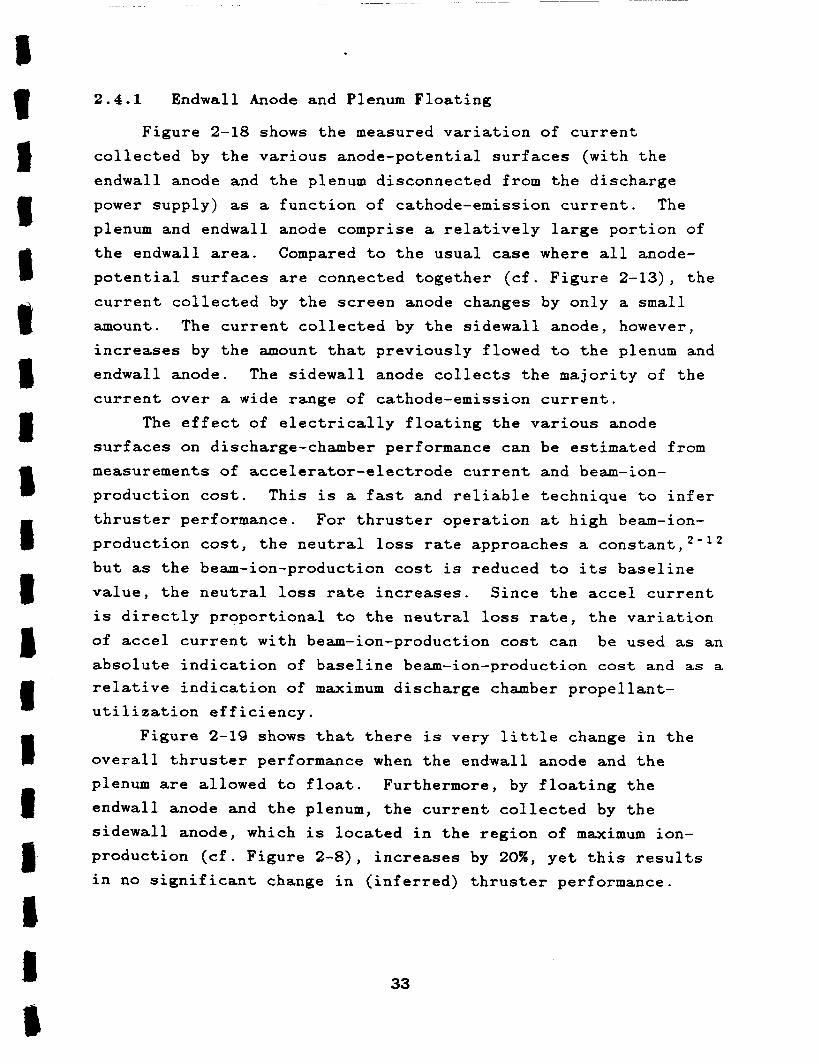
Figure 2-18 shows the measured variation of current collected by the various anode-potential surfaces (with the endwall anode and the plenum disconnected from the discharge power supply) as a function of cathode-emission current. The plenum and endwall anode comprise a relatively large portion of the endwall area. Compared to the usual case where all anode- potential surfaces are connected together (cf. Figure 2-13), the current collected by the screen anode changes by only a small amount. The current collected by the sidewall anode, however, increases by the amount that previously flowed to the plenum and endwall anode. The sidewall anode collects the majority of the current over a wide range of cathode-emission current.
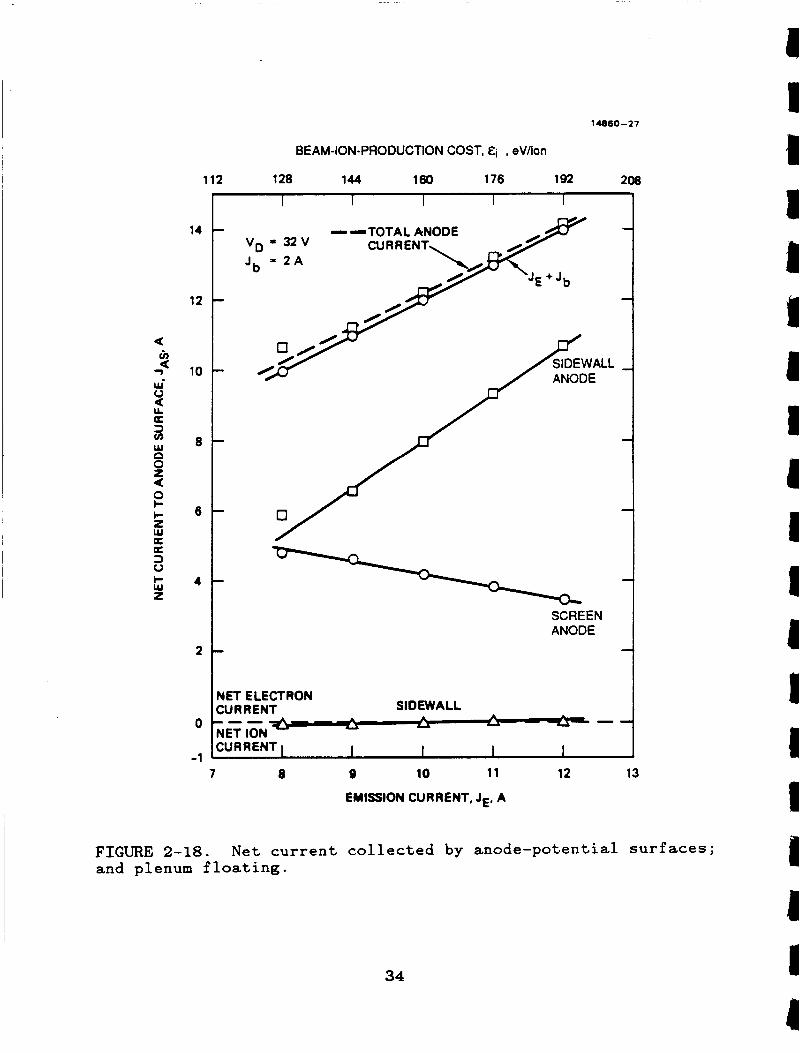
The effect of electrically floating the various anode surfaces on discharge-chamber performance can be estimated from measurements of accelerator-electrode current and beam-ion- production cost. This is a fast and reliable technique to infer thruster performance. For thruster operation at high beam-ion- production cost, the neutral loss rate approaches a but as the beam-ion-production cost is reduced to its baseline value, the neutral loss rate increases. Since the accel current is directly proportional to the neutral loss rate, the variation of accel current with beam-ion-production cost can be used as an absolute indication of baseline beam-ion-production cost and as a relative indication of maximum discharge chamber propellant- utilization efficiency.
Figure 2-19 shows that there is very little change in the overall thruster performance when the endwall anode and the plenum are allowed to float. Furthermore, by floating the endwall anode and the plenum, the current collected by the sidewall anode, which is located in the region of maximum ion- production (cf. Figure 2 - 8 ) , increases by 201, yet this results in no significant change in (inferred) thruster performance.
33
a Ch a
w‘ a a
7
u LL
3 u) w
z U 8
e I- z w
3 0 I- w z
a a
14
12
10
8
6
4
2
0
-1
11860-27
BEAM-ION-PRODUCTION COST, Ei , eV/ion
112 128 144 180 176 192 208
YET ELECTRON XJR RENT
SCREEN ANODE
S I 0 EWA LL - - . . . . -. . . --- YET IONN ZURRENT I I I 1 I
7 8 9 10 11 12 13
EMISSION CURRENT, JE, A
FIGURE 2-18. N e t c u r r e n t c o l l e c t e d by anode-potentia.1 s u r f a c e s ; and plenum f l o a t i n g .
34
14860-20
5 -
4 -
3 -
9 I I 1 I I I I I I
'4 \
0 ALL ANODES CONNECTED @ ENOWALL ANOOUPLENUM FLOATIh
32 V 2 A
P c
FIGURE 2-19. cost; endwall anode and plenum floating.
Variation of accel current with beam-ion-production
a E
I
110 120 130 140 150 le0 170 180 190 200 210
BEAM-ION-PROOUCTION COST, Ei , eVlion
35
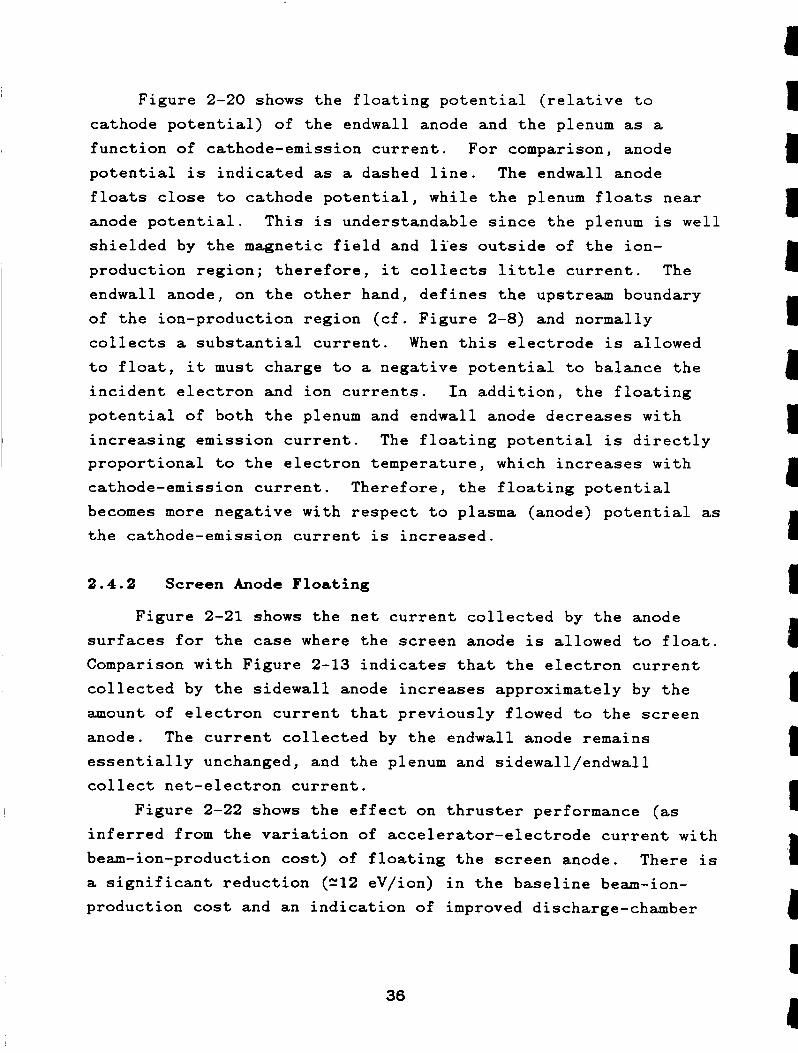
Figure 2-20 shows the floating potential (relative to
cathode potential) of the endwall anode and the plenum as a function of cathode-emission current. For comparison, anode
potential is indicated as a dashed line. The endwall anode
floats close to cathode potential, while the plenum floats near
anode potential. This is understandable since the plenum is well shielded by the magnetic field and li’es outside of the ion- production region; therefore, it collects little current. The
endwall anode, on the other hand, defines the upstream boundary
of the ion-production region (cf. Figure 2-8) and normally collects a substantial current. When this electrode is allowed to float, it must charge to a negative potential to balance the
incident electron and ion currents. In addition, the floating
potential of both the plenum and endwall anode decreases with increasing emission current. The floating potential is directly proportional to the electron temperature, which increases with
cathode-emission current. Therefore, the floating potential
becomes more negative with respect to plasma (anode) potential as the cathode-emission current is increased.
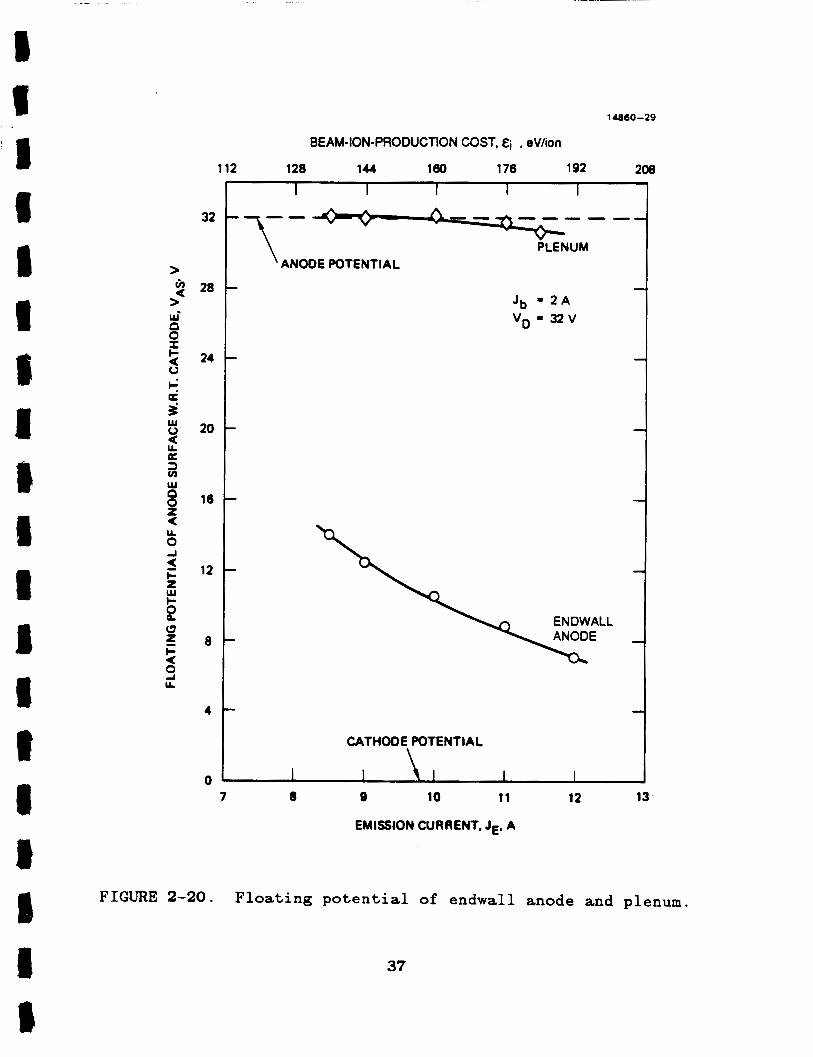
2.4.2 Screen Anode Floating
Figure 2-21 shows the net current collected by the anode surfaces for the case where the screen anode is allowed to float.
Comparison with Figure 2-13 indicates that the electron current collected by the sidewall anode increases approximately by the
amount of electron current that previously flowed to the screen
anode. The current collected by the endwall anode remains
essentially unchanged, and the plenum and sidewall/endwall
collect net-electron current.
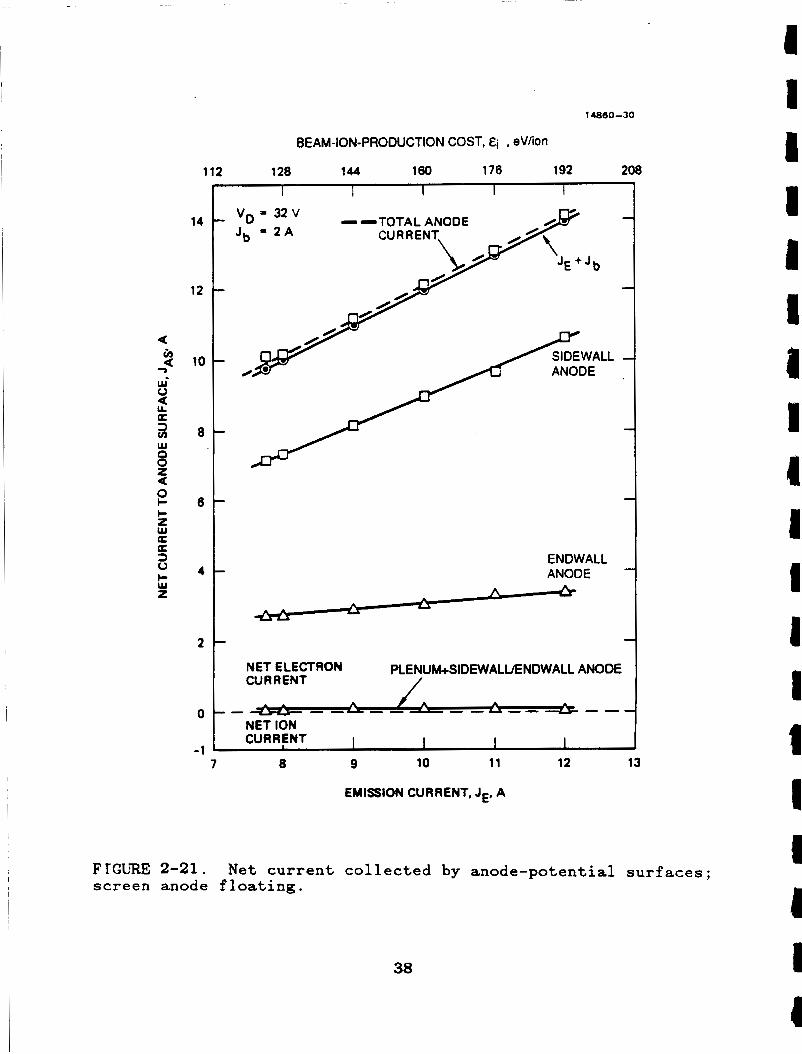
Figure 2-22 shows the effect on thruster performance (as inferred from the variation of accelerator-electrode current with beam-ion-production cost) of floating the screen anode. There is a significant reduction (“12 eV/ion) in the baseline beam-ion-
production cost and an indication of improved discharge-chamber
36
32
28
24
20
16
12
8
4
0
14860-29
BEAM-ION-PRODUCTION COST, &i , eV/ion
112 128 144 le0 176 192 208
'TO"" PLENUM ANODE POTENTIAL
, ~ H O D E ~ : E N T I A L , , 7 8 9 10 11 12 13
EMISSION CURRENT, JE, A
FIGURE 2-20. Floating potential of endwall anode and plenum.
37
74860-30
I
BEAM-ION-PRODUCTION COST, Ei , eV/ion
112 128 144 160 176 192 208 I 1
14
12
10
8
6
4
2
0
-1
V D = 3 2 V --TOTAL ANODE
ENDWALL ANODE
NET ELECTRON PLENUM+SIDEWALUENDWALL ANODE CUR RENT /
. - -- NET ION CURRENT I I I I
7 8 9 10 11 12 13
EMISSION CURRENT, JE, A
FTGURE 2-21. screen anode floating.
Net current collected by anode-potential surfaces;
38
14860-31
7 -
6 -
5 -
4 -
3 -
n I II
9 I I I I 1 I I I I + \ 4 \
\
0 ALL ANODES CONNECTED 0 SCREEN ANODE FLOATING
VD = 32 V b I \
\
I I I I I I I I I 110 120 130 140 150 160 170 180 190 200 210
BEAM-ION-PRODUCTION COST, Ei , eV/ion
FIGURE 2-22. cost; screen anode floating.
Variation of accel current with beam- ion-production
39
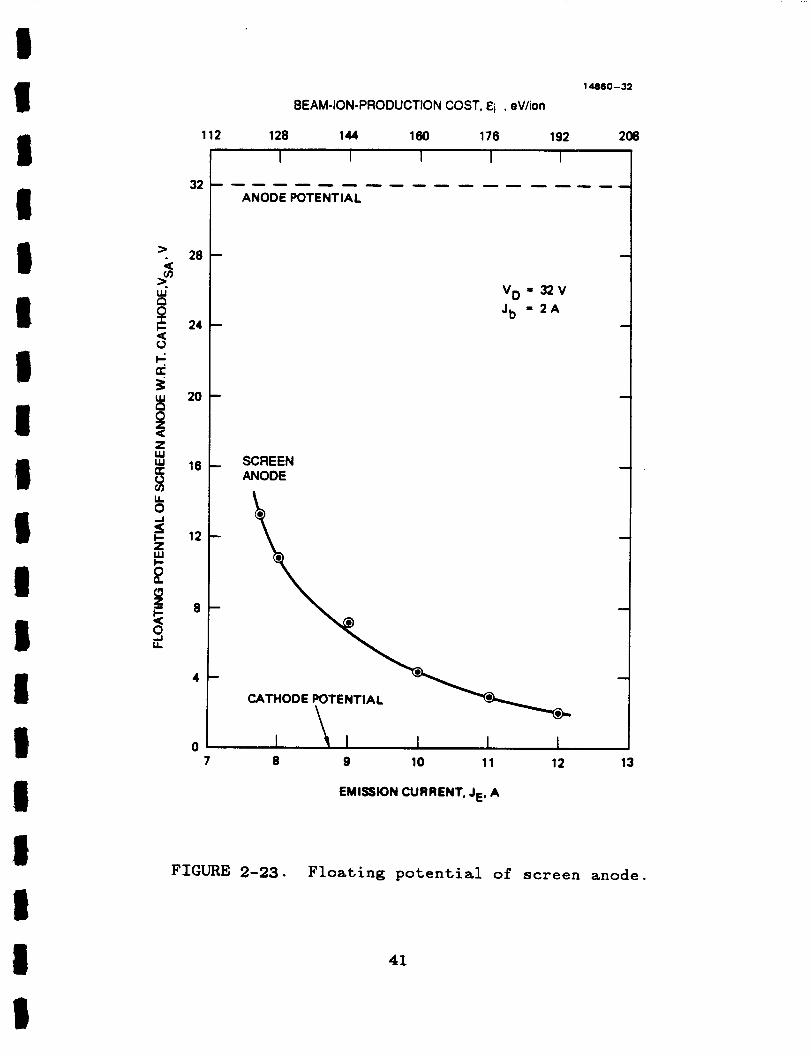
propellant-utilization efficiency. The net-electron current
collected by the plenum and sidewall/endwall could be due to a
reduction in ion loss to these surfaces or to an increase in
electron temperature. In the section below, we will show that the Maxwellian electron temperature increases significantly
throughout the discharge chamber plasma when the screen anode
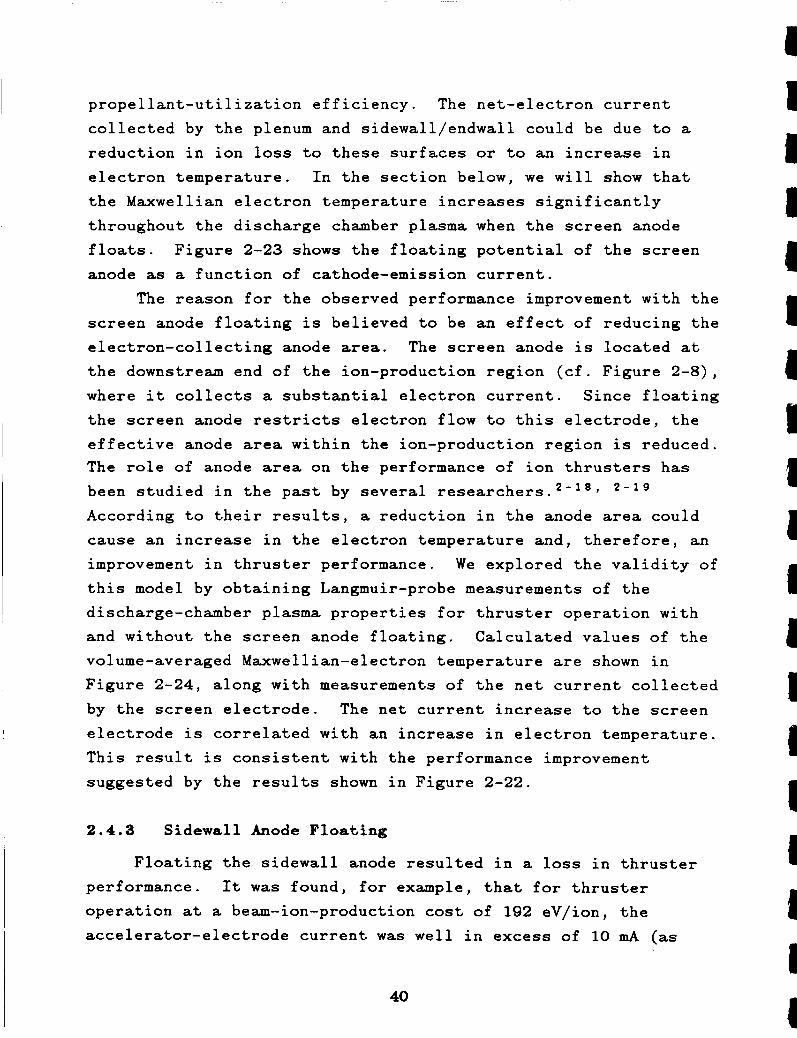
floats. Figure 2-23 shows the floating potential of the screen anode as a function of cathode-emission current.
The reason for the observed performance improvement with the
screen anode floating is believed to be an effect of reducing the
electron-collecting anode area. The screen anode is located at
the downstream end of the ion-production region (cf. Figure 2-8), where it collects a substantial electron current. Since floating
the screen anode restricts electron flow to this electrode, the effective anode area within the ion-production region is reduced. The role of anode area on the performance of ion thrusters has
been studied in the past by several
According to their results, a reduction in the anode area could
cause an increase in the electron temperature and, therefore, an
improvement in thruster performance. We explored the validity of this model by obtaining Langmuir-probe measurements of the discharge-chamber plasma properties for thruster operation with and without the screen anode floating. Calculated values of the volume-averaged Maxwellian-electron temperature are shown in Figure 2-24, along with measurements of the net current collected by the screen electrode. The net current increase to the screen electrode is correlated with an increase in electron temperature.
This result is consistent with the performance improvement
suggested by the results shown in Figure 2-22.
* - 1 9
2.4.3 Sidewall Anode Floating
Floating the sidewall anode resulted in a loss in thruster performance. It was found, for example, that for thruster
operation at a beam-ion-production cost of 192 eV/ion, the accelerator-electrode current was well in excess of 10 mA (as
40
14860-32
BEAM-ION-PRODUCTION COST, Ei , eV/ion
112 128 144 le0 176 192 208
32
28
24
20
16
12
8
4
0
I I I I I - - - - - - - - - - - - - - - - - -
ANODE POTENTIAL
SCREEN ANODE
7 8 9 10 11 12 13
EMISSION CURRENT, JE, A
FIGURE 2-23. Floating potential of screen anode.
41
f
3
8
E - 7
W- 0
I- o W A
z a
Y
8 e
W w
I- z W
3 o c W z
a a
120
80
40
0
-40
-80
-120
BEAM-ION-PRODUCTION COST, ei (eVAonJ
112 128 144 160 176 192 208
14860-33
I I I I I - A
\ \
- '9 4
V g t 3 2 V
J,, = 2 A
\
- \ \ \
IET :UR RENT ELECTRON\\ \ 0 ALL ANODES CONNECTED \, \ A SCREEN-ANODE
FLOATING
b \ \ -h
7.0
6.0
5.0
4.0
3.0
2.0
1 .o
0.0
- - 2 E
IC W' a 3 I- s r B
W 0 I
z I- o W A w z U - d W 3 X U z (3 U
> 4
w
a W
8 9 10 11 12 13 7
EMISSION CURRENT, JE (A)
FIGURE 2-24. screen current.
Correlation of electron temperature with collected
42
compared to the usual value of about 3.5 m A ) ; therefore, further
study of this case was ruled out. We interpret these results as
indicating that the sidewall anode is the most important
electrode affecting discharge-chamber processes. This finding is consistent with the results of Figure 2-13, which show that since the axial location of the sidewall anode coincides with the region of highest ion production, it collects most of the electron current.
2.4.4 Sidewall/Endwall Floating
Results presented in Figure 2-13 showed that net-ion current is collected by the plenum and sidewall/endwall. Furthermore, the results of Figure 2-14 indicated that the ion current collected by the sidewall/endwall-plenum surface is about twice
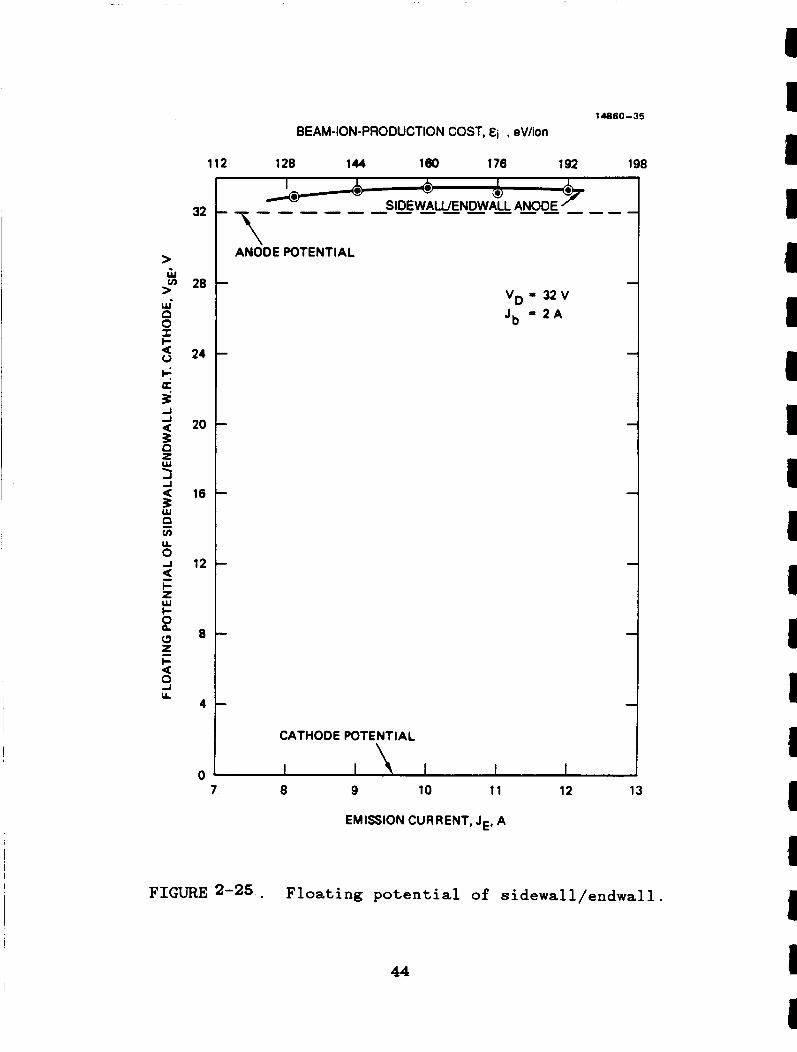
as large as the electron current that is collected. . Figure 2-25 shows the variation of the sidewall/endwall
floating potential with cathode-emission current. The floating
potential is positive with respect to the three anode-potential
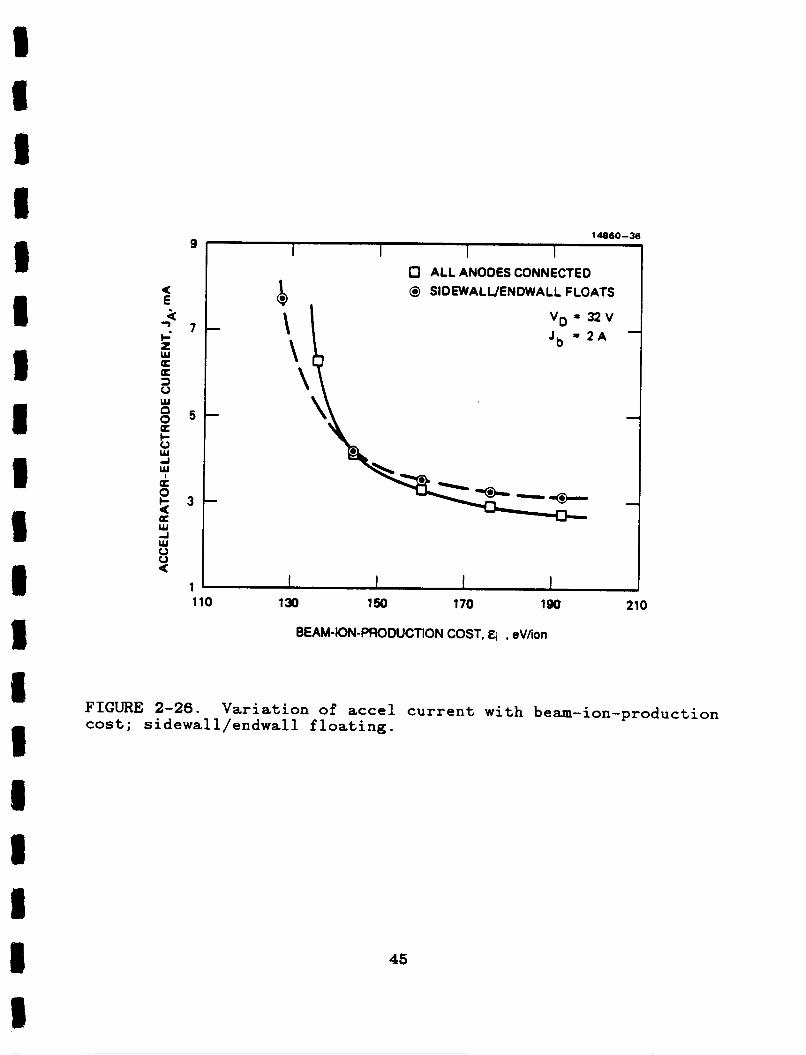
magnet-ring covers because net-ion current is collected by this surface during normal operation. The effect on thruster performance of electrically floating the sidewall/endwall is
presented in Figure 2-26, which shows about a 6-eV/ion reduction in the baseline beam-ion-production cost. We attribute the
increased performance to the fact that the sidewall/endwall floats at a positive potential with respect to the other anode surfaces and, therefore, has a tendency to impede ion loss to that surface.
2.4.5 Sidewall/Endwall-Plenum B i a s
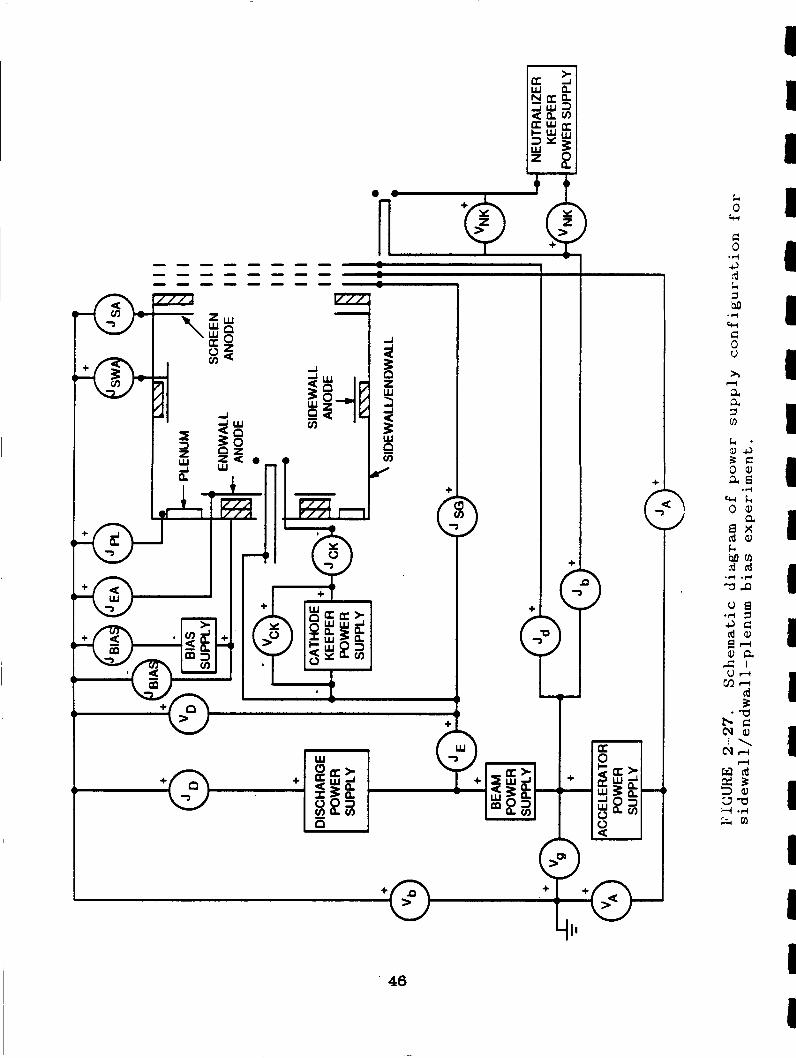
We explored the performance improvement associated with
floating the sidewall/endwall-plenum surface by biasing these
surfaces positive with respect to the screen, sidewall, and endwall anodes. The power-supply arrangement shown in Figure 2-27 was used in the bias experiments. Biasing the
43
32
28
24
20
16
12
8
4
0
14880-35
BEAM-ION-PRODUCTION COST, Ei , &//ion
112 128 144 l e 0 176 192 198
ANODE POTENTIAL
V D = 3 2 V Jb = 2 A
CATHOO E POTE NTI A L \
7 8 9 10 11 12 13
EMISSION CURRENT, JE, A
FIGURE 2-25,. Floating potential of sidewall/endwall.
44
14860-36
I I I I 1
b . '4 \
0 ALL ANODES CONNECTED @ SIDEWALUENDWALL FLOATS ,
110 130 150 170 190 210
BEAM-ION-PRODUCTION COST, Ei , eVlion
FIGURE 2-26. cost; sidewall/endwall floating.
Variation of accel current with beam-ion-production
45
+
> > +
+
1 I I
46
sidewall/endwall-plenum surfaces positive with respect to the
anode-potential magnet-ring covers is a technique known as
ttelectrostatic plugging" which has been used by several 2 - 2 1 to improve the performance of electron-
bombardment-type ion sources. With the currents measured as indicated in Figure 2-27, the
beam-ion-production cost was calculated using the expression
E ; = - T +
Jb J b
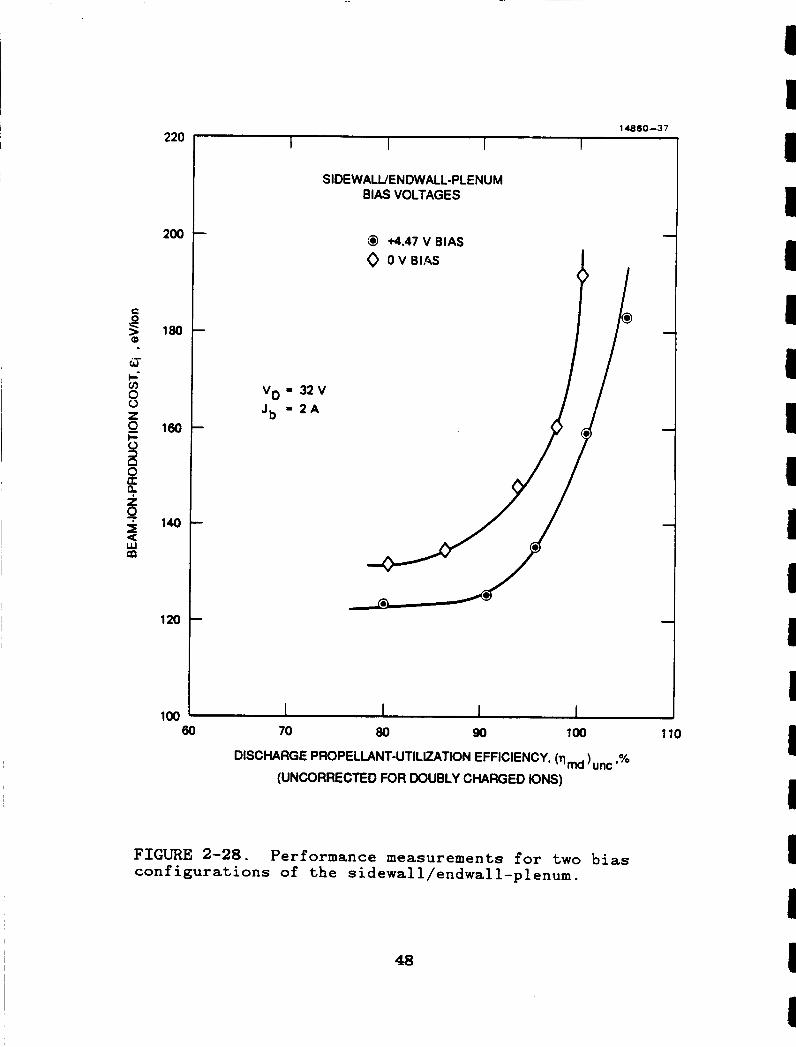
Thruster performance measurements (uncorrected for doubly- charged ions) were obtained for various bias voltages. Figure 2-28 shows the results for a bias voltage of VBIAs = 4.5 V. There is a reduction in the baseline beam-ion-
production cost of about 10 eV/ion and an increase in maximum discharge-propellant-utilization efficiency of about 5%, thus verifying the performance-enhancement technique. No additional performance gains were observed by increasing the bias voltage to values as high as VBIAS = 11 V.
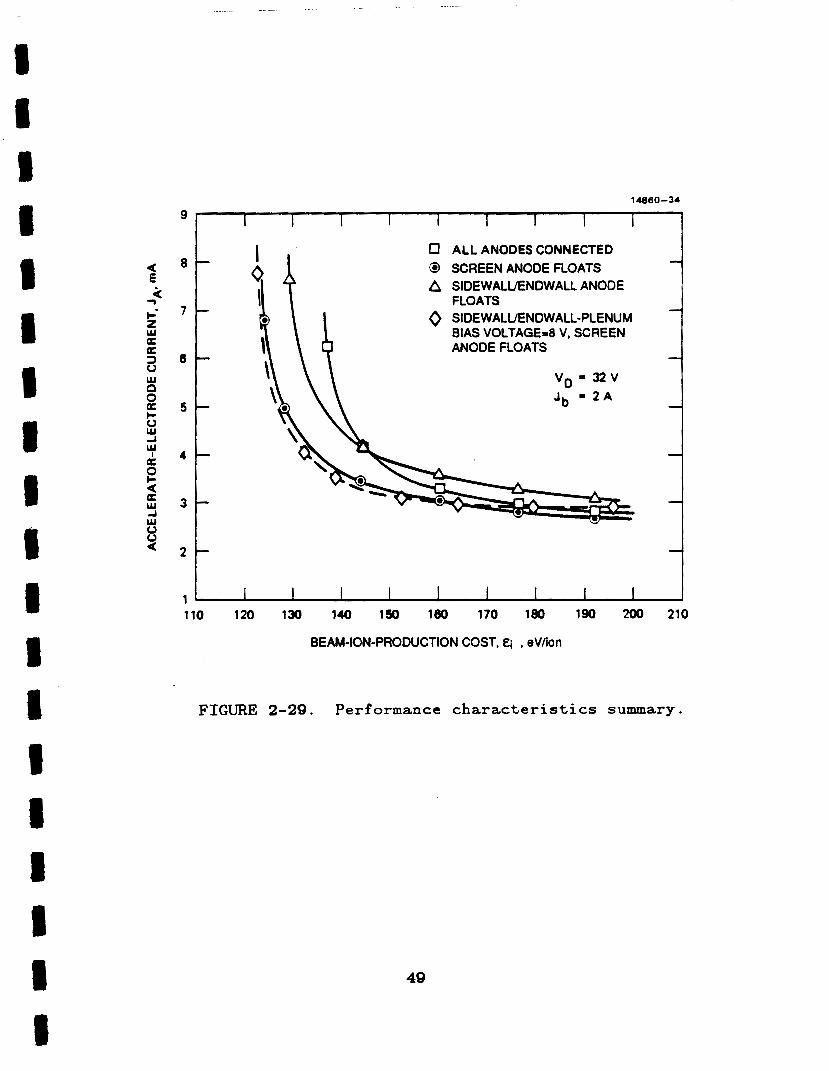
Measurements were performed to determine whether the separate effects of biasing the sidewall/endwall and additionally floating the screen anode, were additive (separately, each effect was shown to reduce the baseline beam-ion-production cost by about 10 eV/ion). Figure 2-29 shows the effect of biasing the sidewall/endwall surface 8 V positive with respect to the other anode surfaces, in addition to electrically floating the screen anode. The results indicate that the effects are not additive.
For comparison purposes, the separate cases when the screen anode floats, the sidewall/endwall floats, and the case when all the anodes are connected are also shown.
47
220
200
180
160
140
120
100
SIDEWALUENDWALL-PLENUM BIAS VOLTAGES
@ M.47 V 01AS
I
V g = 3 2 V Jb - 2 A
60 70 80 90 100 110
DISCHARGE PROPELLANT-UTILIZATION EFFICIENCY, (q md )uric ,%
(UNCORRECTED FOR DOUBLY CHARGED IONS)
FIGURE 2-28. configurations of the sidewall/endwall-plenum.
Performance measurements for two bias
48
I 4 1 I I 1 1 I I I I I I I
14860-34
9 I I I I I I I I I 1
E 8 t 0 ALL ANODES CONNECTED 0 SCREEN ANODE FLOATS A SIDEWALUENDWALL ANODE
FLOATS
BIAS VOLTAGE=B V, SCREEN ANODE FLOATS
0 SIDEWALUENDWALL-PLENUM
V D ' 3 2 V Jb = 2 A
I I I I I I I I I I 110 120 130 140 150 le0 170 le0 190 200 210
BEAM-ION-PRODUCTION COST, Ei , eV/ion
FIGURE 2-29. Performance characteristics summary.
49
2.5 OPERATION AT REDUCED DISCHARGE VOLTAGE
The primary wearout mechanism in ion-thruster discharge chambers is believed to be sputter erosion of the cathode-
potential surfaces. Therefore, thruster operation at reduced
discharge voltage could significantly alter this wearout
mechanism. Because the ring-cusp thruster exhibits such a high
level of performance, we explored operation at reduced discharge voltage as a means of minimizing internal sputtering and
extending lifetime.
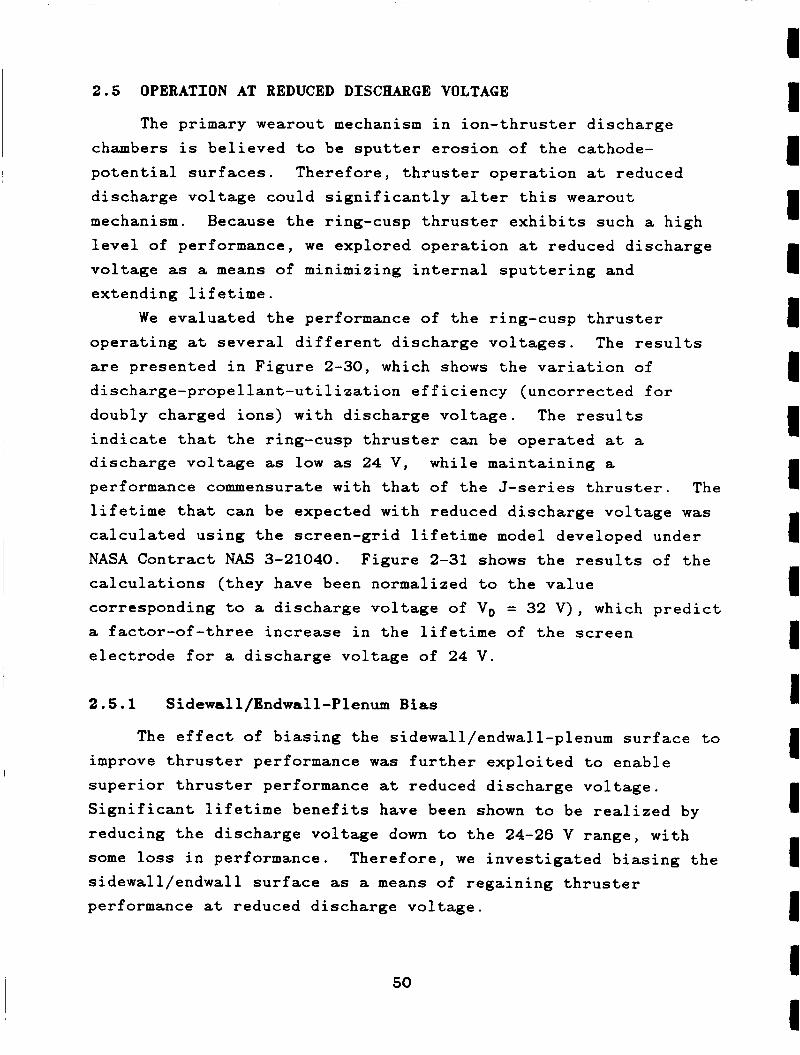
We evaluated the performance of the ring-cusp thruster operating at several different discharge voltages. The results
are presented in Figure 2-30, which shows the variation of discharge-propellant-utilization efficiency (uncorrected for
doubly charged ions) with discharge voltage. The results
indicate that the ring-cusp thruster can be operated at a discharge voltage as low as 24 V, while maintaining a performance commensurate with that of the J-series thruster. The
lifetime that can be expected with reduced discharge voltage was calculated using the screen-grid lifetime model developed under
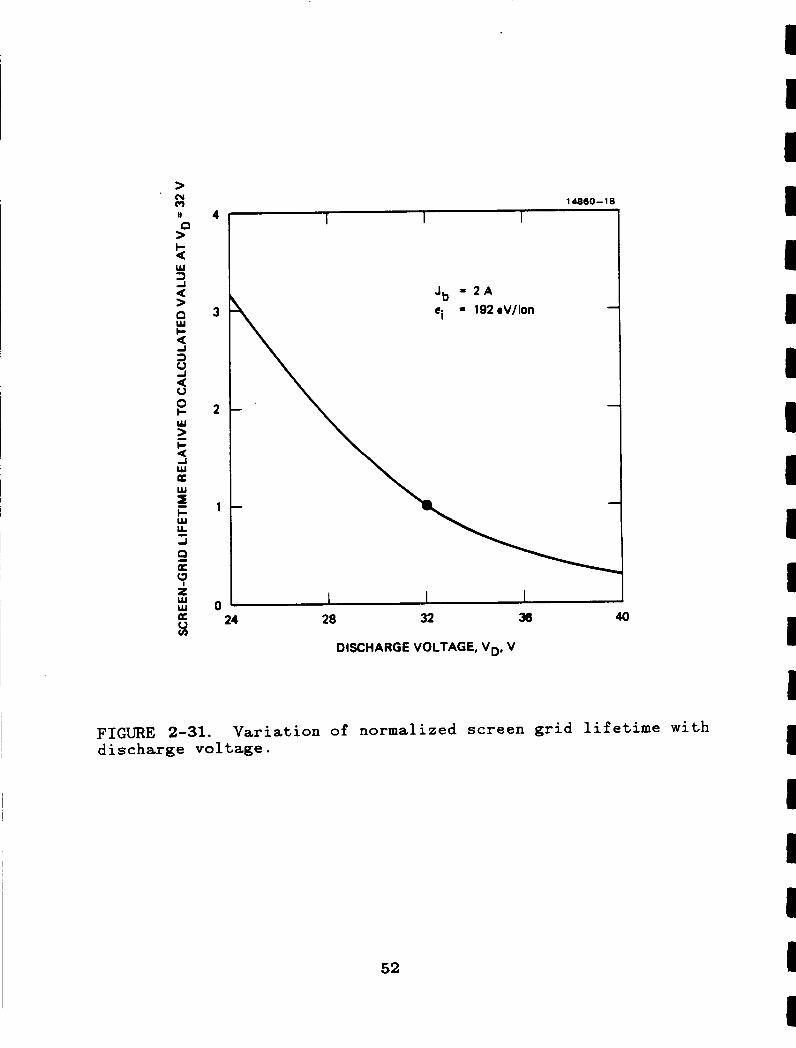
NASA Contract NAS 3-21040. Figure 2-31 shows the results of the
calculations (they have been normalized to the value corresponding to a discharge voltage of VD = 32 V), which predict
a factor-of-three increase in the lifetime of the screen
electrode for a discharge voltage of 24 V.
2.5.1 Sidewall/Endwall-Plenum Bias
The effect of biasing the sidewall/endwall-plenum surface to improve thruster performance was further exploited to enable
superior thruster performance at reduced discharge voltage.
Significant lifetime benefits have been shown to be realized by
reducing the discharge voltage down to the 24-26 V range, with some loss in performance. Therefore, we investigated biasing the sidewall/endwall surface as a means of regaining thruster performance at reduced discharge voltage.
I 1 I
I I I 1 I I I 1 I I I I I I I
a
50
ci = 192 eV/ion
24 25 26
DISCHARGE VOLTAGE, Vm V
FIGURE 2-30. Performance of ring cusp thruster at several different discharge voltages.
51
4
3
2
1
0 24
14660-18
Jb m 2 A ei = 192eV/ion
28 32 36 40
DISCHARGE VOLTAGE, VD, V
FIGURE 2-31. discharge voltage.
Variation of normalized screen grid lifetime with
52
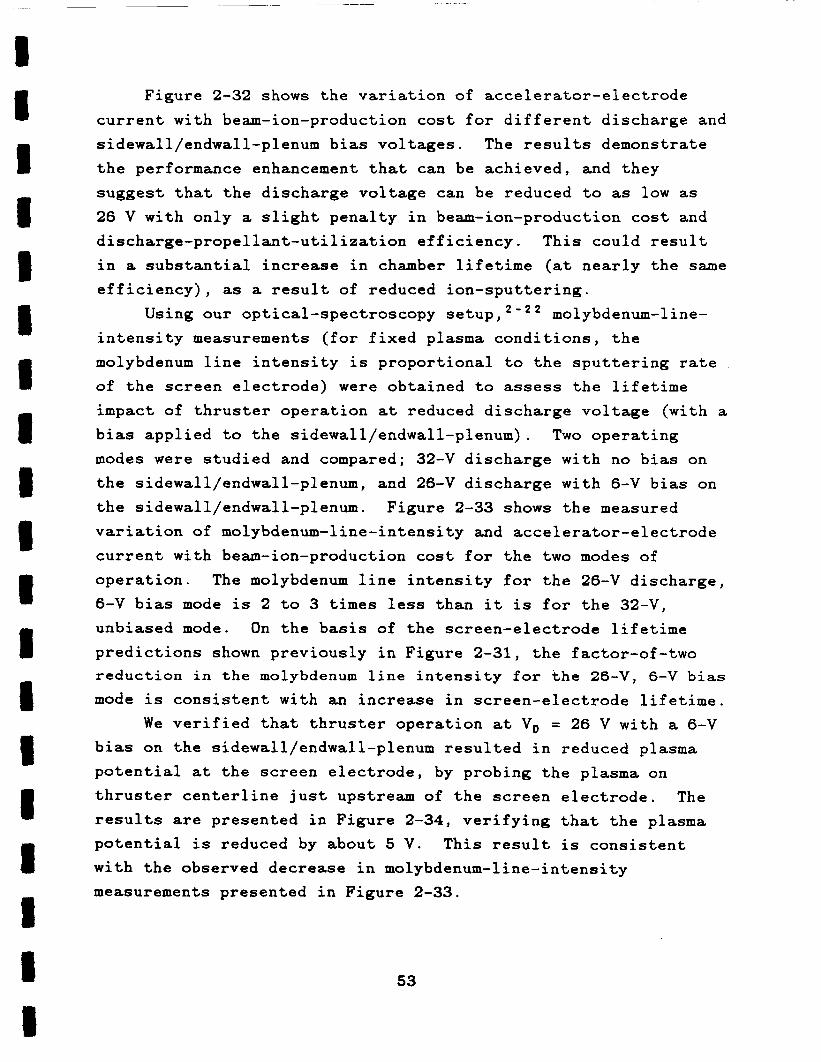
Figure 2-32 shows the variation of accelerator-electrode current with beam-ion-production cost for different discharge and sidewall/endwall-plenum bias voltages. The results demonstrate
the performance enhancement that can be achieved, and they
suggest that the discharge voltage can be reduced to as low as 26 V with only a slight penalty in beam-ion-production cost and
discharge-propellant-utilization efficiency. This could result in a substantial increase in chamber lifetime (at nearly the same
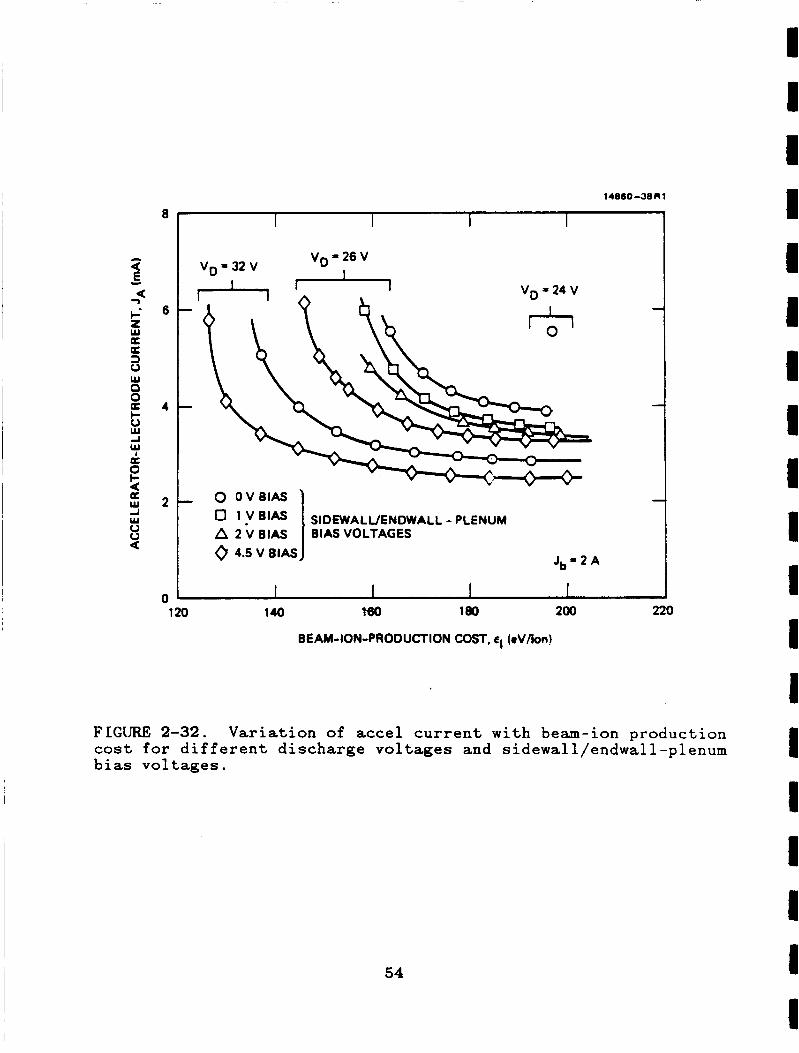
efficiency), as a result of reduced ion-sputtering. Using our optical-spectroscopy molybdenum-line-
intensity measurements (for fixed plasma conditions, the molybdenum line intensity is proportional to the sputtering rate
of the screen electrode) were obtained to assess the lifetime
impact of thruster operation at reduced discharge voltage (with a
bias applied to the sidewall/endwall-plenum). Two operating modes were studied and compared; 32-V discharge with no bias on the sidewall/endwall-plenum, and 26-V discharge with 6-V bias on the sidewall/endwall-plenum. Figure 2-33 shows the measured variation of molybdenum-line-intensity and accelerator-electrode
current with beam-ion-production cost for the two modes of
operation. The molybdenum line intensity for the 26-V discharge, 6-V bias mode is 2 to 3 times less than it is for the 32-V, unbiased mode. On the basis of the screen-electrode lifetime predictions shown previously in Figure 2-31, the factor-of-two reduction in the molybdenum line intensity for t h e 26-V, 6-V b i a s
mode is consistent with an increase in screen-electrode lifetime. We verified that thruster operation at V, = 26 V with a 6-V
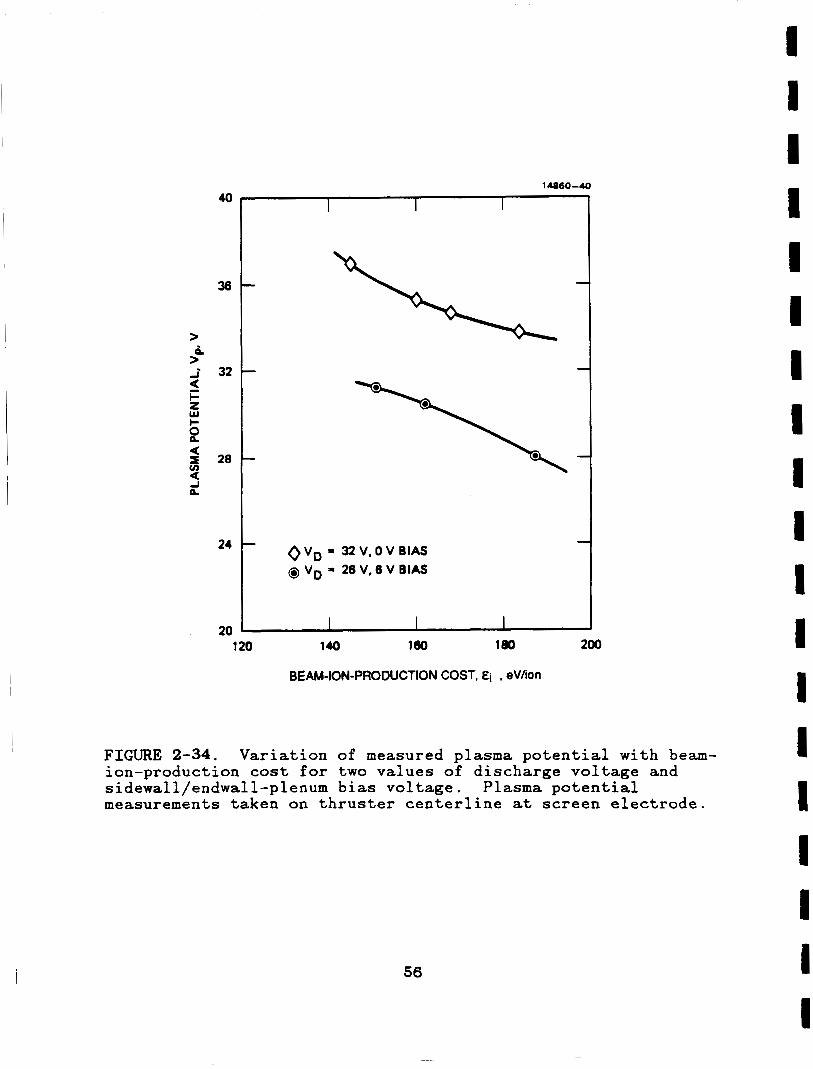
bias on the sidewall/endwall-plenum resulted in reduced plasma potential at the screen electrode, by probing the plasma on thruster centerline just upstream of the screen electrode. The
results are presented in Figure 2-34, verifying that the plasma potential is reduced by about 5 V. This result is consistent
with the observed decrease in molybdenum-line-intensity measurements presented in Figure 2-33.
53
a E -
I I I I I
B a
V g s 2 6 V I
4 1 V g ' 2 4 V
0 OVBIAS
A 2 b BIAS
2 ' SIDEWALUENDWALL - PLENUM BIAS VOLTAGES 1 0 4.5 V Bl A]
0 I I I I 1 120 140 100 180 200 220
BEAM-ION-PRODUCTION COST, ei (eVAon!
FIGIJRE 2-32. Variation of accel current with beam-ion production cost for different discharge voltages and sidewall/endwall-plenum bias voltages.
54
I I 1
1 I 1 1 1 I 1 I I I I I I I I
a
1 I 1 I 1 1 8 8 I 1 8 1 b 1 I I 1 I I
1460-39
I I I I I I I avo = ZV,OVBIAS
I O Vo 26 V, 6 V BIAS I I J b 3A I
4 \ 3
I .t
A- \ \ h \
11 I I I I I I I I 130 140 150 160 170 180 190 200 210 2:
~~EAM-ION-PROOUCTION COST, ei, eV/ion
FIGURE 2-33. Variation of accel current and molybdenum line intensity measurements with beam-ion-production cost for two values of discharge voltage and sidewall/endwall-plenum bias voltage .
55
14860-40
a I 28 u)
Q 4
24
20
IL >
1 c z w 8 c j 32t -
-
1 I
O V o t 3 2 V . O V B l A S a v o * 2 6 V . 6 V B l A S
120 140 l e0 180 200
BEAM-ION-PRODUCTION COST, Ei , eV/ion
FIGURE 2-34. ion-production cost for two values of discharge voltage and sidewall/endwall-plenum bias voltage. Plasma potential measurements taken on thruster centerline at screen electrode.
Variation of measured plasma potential with beam-
56
I 1 B 1 I I I 1 1 1 I I 1 I I I I 1 I
2.6 CATHODE EROSION
A life limitation of the J-series thruster is believed to be baffle/pole-piece erosion and subsequent deposition of material onto the cathode keeper and keeper support. The ring-cusp
thruster design eliminates the cathode baffle/pole-piece assembly
and positions the cathode directly in the discharge plasma. The cathode used in the ring-cusp and J-series thrusters has
a 0.76-mm-diameter orifice made of W-2%Th. Figure 2-35 shows a photograph of the cathode orifice plate after the 694 hours of ring-cusp thruster operation that were accumulated under this and
a companion study.'-' The photograph suggests that for ring-cusp thrusters operating with mercury propellant, an exposed cathode
with a 0.76-ram-diameter orifice experiences no significant erosion.
An attempt was made to incorporate the strong magnetic field near the cathode orifice of the ring-cusp thruster into a
J-series-type thruster. The intent was to explore ways of
improving the performance and lifetime of the J-series thruster with minimal modification of its discharge chamber. An
electrically equivalent J-series thruster (S/N 301-5) was modified to produce a "hybrid" ring-cusp configuration. The performance of this thruster was substandard, and, therefore, no
further measurements or modifications were performed. A summary of the results of this investigation is presented in Appendix C.
2.7 CATHODE LOCATION
The effect of the cathode location in the ring-cusp
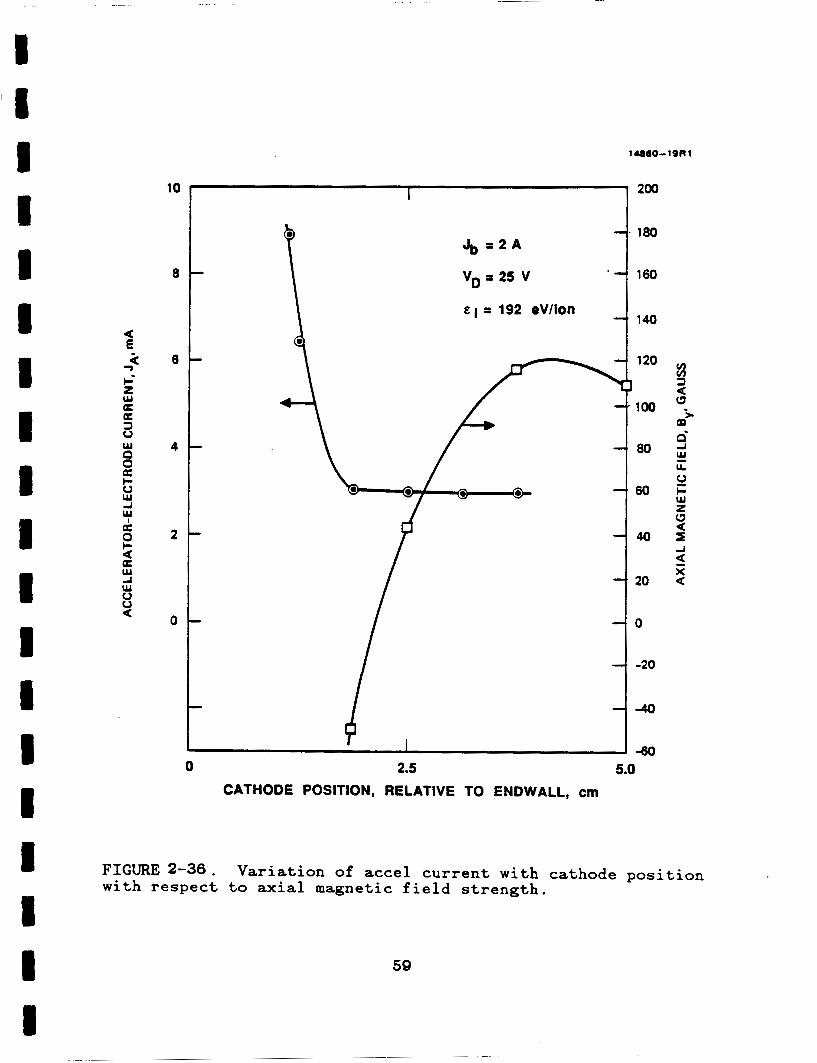
discharge chamber was explored by using the movable-cathode arrangement that was designed and fabricated under NASA Contract NAS 3-21943. Figure 2-36 shows the variation of accelerator- electrode current with cathode position. These results show there is little effect of cathode location, unless it is located near the endwall. Figure 2-36 also shows the variation of axial
57
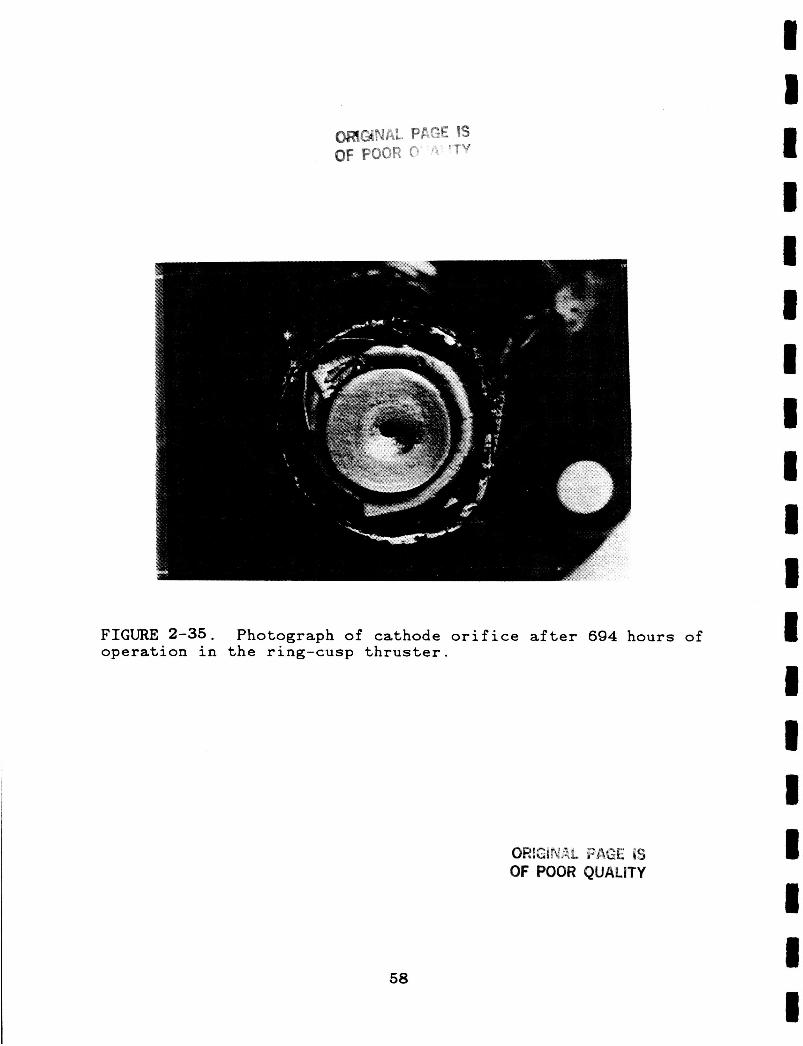
FIGURE 2-35. Photograph of cathode orifice after 694 hours of operation in the ring-cusp thruster.
OR!GiNAF FAGE is OF POOR QUALITY
58
10
8
6
4
2
0
lU)8O-lSRl
I 1200
Jb = 2 A ' 180
' 160
140
120
i VD P 25 V
92 eV/lon
I I
I:" -
-20
-40
FIGURE 2-36. with respect to axial magnetic field strength.
Variation of accel current with cathode position
59
magnetic field at the location of the cathode orifice. The t w o
curves suggest that the magnitude of the field at the cathode orifice has little effect on performance, as long as the cathode is located downstream of the field-reversal point. The flat
region of the accelerator-electrode-current variation suggests that no improvement in performance is to be expected as a result
of positioning the cathode further into the discharge chamber.
60
I 1 1 1 I I I 1 I I 1 I 1 I I I I 1 I
REFERENCES
2-1. Sovey, J.S, "Improved Ion-Containment Using a Ring-Cusp Ion Thruster," AIAA Paper No. 82-1928, New Orleans, Louisiana, November 1982.
2-2. Lovell, R.R. et al., "30-cm Ion Thruster Subsystem Design Manual," NASA Technical Memorandum 79191, National Aeronautics and Space Administration, Lewis Research Center, Cleveland, Ohio, June 1979.
2-3. Poeschel, R.L., "Retrofit and Acceptance Test of 30 cm Ion Thrusters," NASA CR-165259, Hughes Research Laboratories, Malibu, California, June 1981.
2-4. Beattie, J.R. and Matossian, J.N., "Inert Gas Thruster Technology," Final Report NAS 3-23860, Hughes Research Laboratories, Malibu, Calif.
2-5. Beattie, J.R. and Kami, S., "Advanced Technology 30-cm- Diameter Ion Thruster," AIAA Paper No. 82-1910, New Orleans, Louisiana, November 1982.
2-6. Beattie, J.R., "Extended Performance Technology Study; 30-cm Thruster," Final Report NAS 3-21943, Hughes Research Laboratories, June 1983.
2-7. Beattie, J.R. and Poeschel, R.L., "Ring-Cusp Ion Thrusters," AIAA Paper No. IEPC 84-71, Tokyo, 1984.
2-8. Leung, K.N., Hershkowitz, N., and Mackenzie, K.R., "Plasma Confinement by Localized Cusps," Physics of Fluids, V O ~ . 19, NO. 7, pp. 1045-1053, July 1976.
2-9. Knorr, G. and Merlino, R.L., "The Role of F a s t Electrons for the Confinement of Plasma by Magnetic Cusps," Plasma Phys. and Controlled Fusion, Vol. 26, No. 2, pp. 433-442, 1984.
2-10. Hershkowitz, N., Leung, K.N., and Romeser, T., "Plasma Leakage Through a Low-/3 Line Cusp," Phys. Rev. Letters, V O ~ . 35, pp. 277-280, August 1975.
2-11. Masek, T.D., "Plasma Properties and Performance of Mercury Ion Thrusters," A I M Paper No. 69-256, Williamsburg, Virginia, March 1969.
2-12. Kaufman, H.R., "Ion Thruster Propellant Utilization," Ph.D Thesis, Colorado State University, Fort Collins, Colorado, June 1971.
61

2-13. Kaufman, H.R., Robinson, R.S., ana Frisa, L.E., "Ion Flow Experiments in a Multipole Discharge Chamber," A M Journal, Vol. 22, No. 11, pp. 1544-1549, November 1984.
2-14. Brophy, J.R. and Wilbur, P.J., "The Flexible Magnetic Field Thruster," J. Spacecraft and Rockets, Vol. 22, No. 6, pp. 611-618, November-December 1983.
2-15. Matossian, J.N. and Beattie, J.R. "Properties of Plasmas in Electron Bombardment Ion Thrusters, It AIAA Paper No. 87-1076, Colorado Springs, Colorado, May 1987.
2-16. Beattie, J.R. and Wilbur, P.J., "Cusped Magnetic Field Mercury Ion Thruster," J. Spacecraft and Rockets", Vol. 14, No. 12, pp. 747-755, December 1977.
2-17. Longhurst, G., "Prediction of Plasma Properties in Mercury Ion Thrusters," NASA CR-159448, Colorado State University, Fort Collins, Colorado, December 1978.
2-18. Holmes, A.J.T., "Role of Anode Area in the Behaviour of Magnetic Multipole Discharges," Rev. Sci. Instruments, Vol:52 , No. 12, pp. 1814-1823, December 1981.
i 2-19. Goebel, D.M., "Ion Source Discharge Performance and Stability," Phys. Fluids, Vol. 25, No. 6, pp. 1093-1102,
~ June 1982.
2-20. Ehlers, K.W. and Leung, K.N., "Increasing the Efficiency of a Multicusp Ion-Source," Rev. Sci. Instruments, Vol. 53, No. 9, pp. 1429-1433, September 1982.
2-21. Hershkowito, N., Hendricks, K., and Carpenter, R.T., "Electrostatic Plugging of Leaks in a Multipole Device," J. Appl. Phys., Vol. 53, No. 6, pp. 4105-4112, June 1982.
2-22 Poeschel, R.L. and Beattie, J.R., "Primary Electric Propulsion Technology Study,lt NASA CR-159688, Hughes Research Laboratories, Malibu, California, November 1979.
,
62
I 1 I 1 I I I 1 I I 1 I 1 I I I I I I
SECTION 3
ION-OPTICS TECHNOLOGY
Earth-orbital applications of ion-propulsion technology may benefit from thruster operation at a lower specific impulse than
the nominal design point of the state-of-the-art J-series
thruster (Isp N 3000 sec). Applications such as North-South
stationkeeping of geosynchronous communications satellites may also require cyclic operation, where the typical thruster duty
cycle might be 1 hour per day. These operating requirements
translate into new design requirements for the ion-extraction assembly; namely, the use of a three-grid electrode design and a low-thermal-mass electrode-mounting arrangement. Substantial
progress in meeting these requirements was made under the present
program, along with improvements to the procedures that have been
used in the past for fabricating and assembling the J-series ion- extraction assemblies.
3.1 THEBMOMECBANICAL YODELLING
The ion-extraction assembly of the J-series thruster utilizes the relatively massive mounting-ring arrangement shown
in Figure 3-l(a) for supporting the electrodes. Excellent
steady-state performance characteristics have been demonstrated
with this design for operation to beam currents at least as high as Jb = 4 A. However, under cyclic operating conditions there is
some concern that the relatively poor thermal contact between the
edge of the electrodes and their stiffening rings could result in unacceptable transient temperature distributions. The consequent
aperture misalignment resulting from excessive nonuniformities in the temperature distributions could lead to undesirable beamlet vectoring, possibly causing direct impingement of ions onto the
accelerator electrode.
63
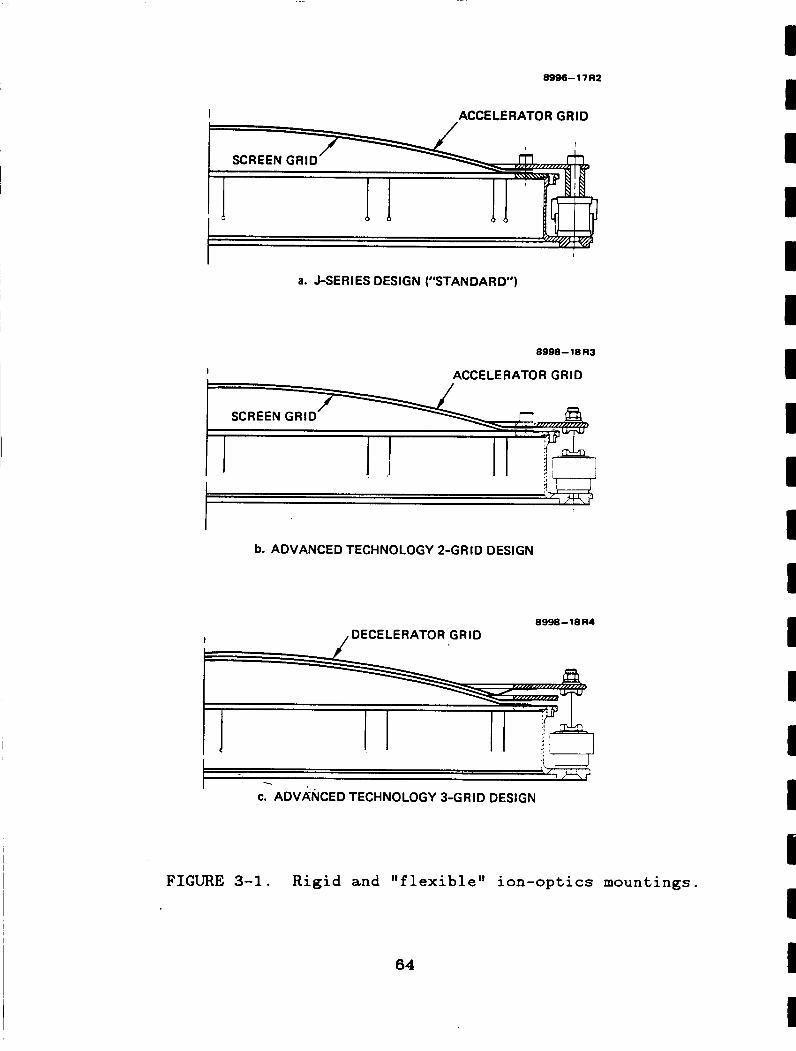
I
8996-17R2
ACCELERATOR GRID
I
a. J-SERIES DESIGN ("STANDARD")
8998-18 A 3
b. ADVANCED TECHNOLOGY 2-GRID DESIGN
8998-18R4 ,DECELERATOR GRID I
' - -"L . c. ADVkNCED TECHNOLOGY 3-GRID DESIGN
FIGURE 3-1. R i g i d and " f l e x i b l e t t i o n - o p t i c s mountings.
64
I 1 I 1 I I I 1 I I 1 I I I I I I I I
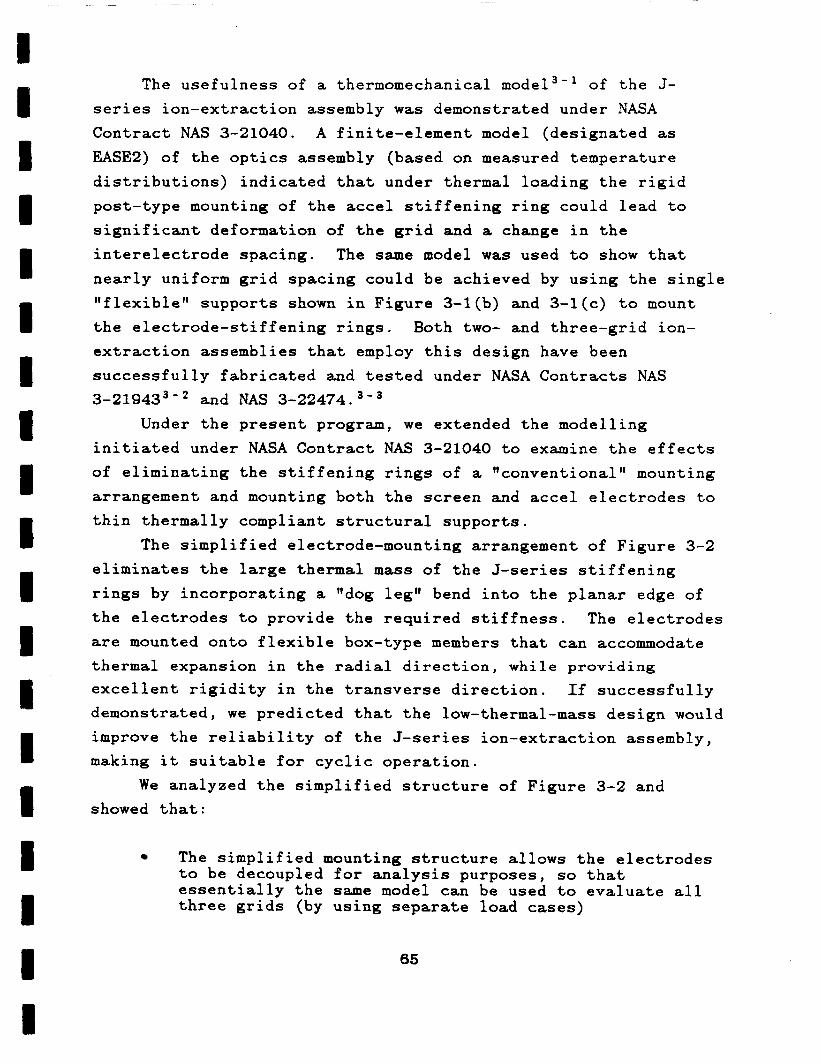
I I I I I I I 1 I I I I I
I I I I I
m
The usefulness of a thermomechanical model3-' of the J- series ion-extraction assembly was demonstrated under NASA Contract NAS 3-21040. A finite-element model (designated as EASEZ) of the optics assembly (based on measured temperature distributions) indicated that under thermal loading the rigid post-type mounting of the accel stiffening ring could lead to
significant deformation of the grid and a change in the interelectrode spacing. The same model was used to show that nearly uniform grid spacing could be achieved by using the single
"flexible" supports shown in Figure 3-l(b) and 3-l(c) to mount
the electrode-stiffening rings. Both two- and three-grid ion-
extraction assemblies that employ this design have been
successfully fabricated and tested under NASA Contracts NAS 3-219433 - * and NAS 3-22474. -
Under the present program, we extended the modelling
initiated under NASA Contract NAS 3-21040 to examine the effects of eliminating the stiffening rings of a "conventional" mounting arrangement and mounting both the screen and accel electrodes to
thin thermally compliant structural supports.
The simplified electrode-mounting arrangement of Figure 3-2 eliminates the large thermal mass of the J-series stiffening rings by incorporating a Itdog leg" bend into the planar edge of the electrodes to provide the required stiffness. The electrodes
are mounted onto flexible box-type members that can accommodate thermal expansion in the radial direction, while providing excellent rigidity in the transverse direction. If successfully demonstrated, we predicted that the low-thermal-mass design would improve the reliability of the J-series ion-extraction assembly, making it suitable for cyclic operation.
We analyzed the simplified structure of Figure 3-2 and showed that:
The simplified mounting structure allows the electrodes to be decoupled for analysis purposes, so that essentially the same model can be used to evaluate all three grids (by using separate load cases)
65
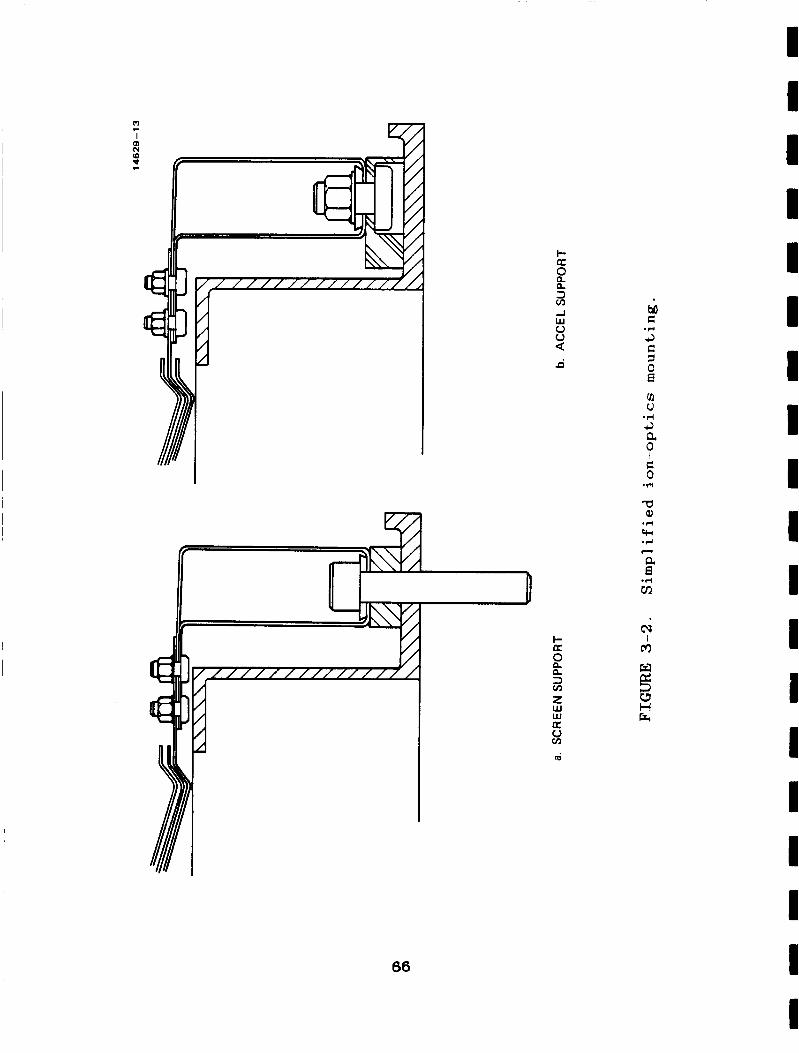
66
0
I 0)
c
N
M c 3 E
.r(
7 0 a
.I+
3 a 0 c 0
.r(
a al
.r(
rw -4 d a
rn a
.r(
I I I 1 I I 1 I I I 1 I 1 I I I I I I
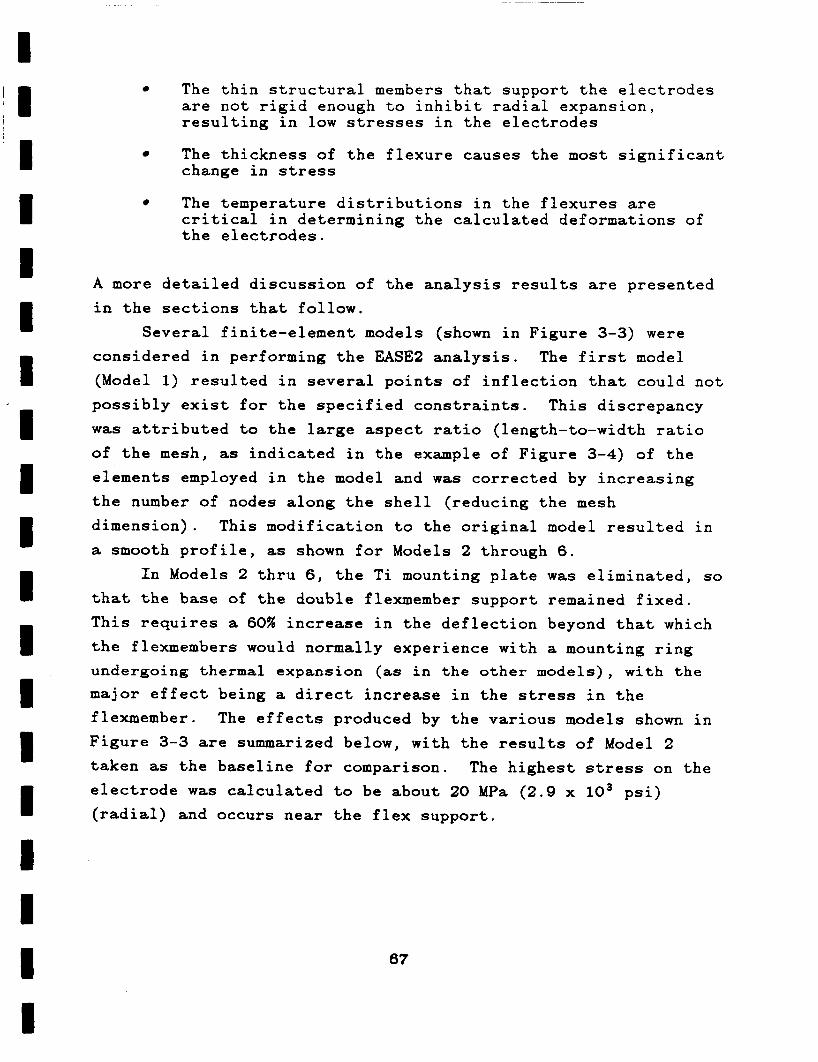
I ~I ‘ I I I I I I I I I I I I I I I I I
The thin structural members that support the electrodes are not rigid enough to inhibit radial expansion, resulting in low stresses in the electrodes
The thickness of the flexure causes the most significant change in stress
The temperature distributions in the flexures are critical in determining the calculated deformations of the electrodes.
A more detailed discussion of the analysis results are presented in the sections that follow.
Several finite-element models (shown in Figure 3-3) were considered in performing the EASE2 analysis. The first model (Model 1) resulted in several points of inflection that could not possibly exist for the specified constraints. This discrepancy was attributed to the large aspect ratio (length-to-width ratio
of the mesh, as indicated in the example of Figure 3-4) of the elements employed in the model and was corrected by increasing
the number of nodes along the shell (reducing the mesh dimension). This modification to the original model resulted in a smooth profile, as shown for Models 2 through 6.
In Models 2 thru 6, the Ti mounting plate was eliminated, so that the base of the double flexmember support remained fixed.
This requires a 60% increase in the deflection beyond that which the flexmembers would normally experience with a mounting ring undergoing thermal expansion (as in t h e o t h e r models), with the major effect being a direct increase in the stress in the flexmember. The effects produced by the various models shown in Figure 3-3 are summarized below, with the results of Model 2 taken as the baseline for comparison. electrode was calculated to be about 20 MPa (2.9 x lo3 psi) (radial) and occurs near the flex support.
The highest stress on the
67
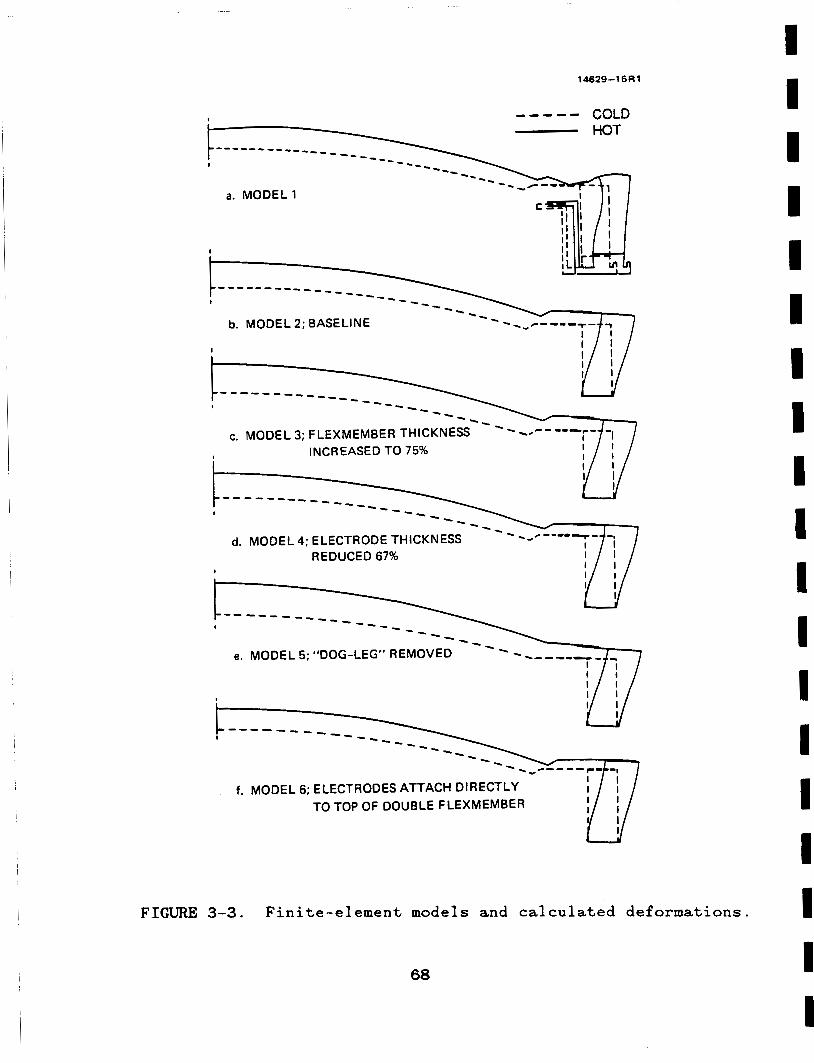
14629-16Rl
IT--: ------ ------ - I a. MODEL'
COLD HOT
-----
I --------------
b. MODEL 2; BASELINE
--------__
I I
INCREASED TO 75%
- - - - - ---- -- -- -- -: ---e
d. MODEL 4; ELECTRODE THICKNESS REDUCED 67%
I
--- -- - - __ I
- - e. MODEL 5; "DOG-LEG" REMOVED
I U I
f. MODEL 6; ELECTRODES ATTACH DIRECTLY TO TOP OF DOUBLE FLEXMEMBER
FIGURE 3-3. Finite-element models and calculated deformations.
68
I I I I I I I I I I I I I I I I I I I
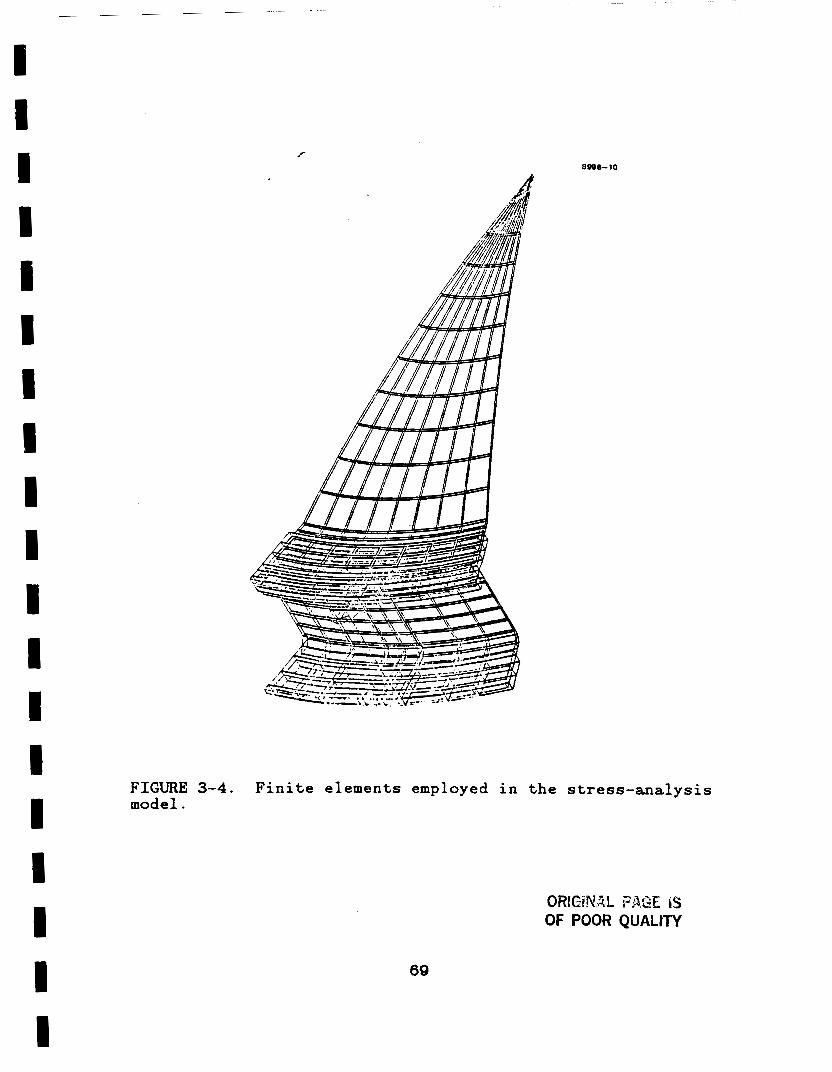
I I I I IC
I I I I I I 1 I I
r
9996-10
FIGURE 3-4. model.
Finite elements employed in the stress-analysis
ORfGiNAL PAGE is OF POOR QUALITY
69

3.1.1 Effect of the Flexmember Thickness
Model 3 employed a flexmember with a thickness of 0.76 mm, or 75% increase over that used for Model 2. There was no
significant change in the calculated radial displacements.
However, the stiffer arm extending from the double flexmember, combined with differential thermal expansion between the inner
and outer flexmembers, causes the arm to tilt upwards. This produces a 7.5% increase in the vertical displacement at the
center of the electrode.
3.1.2 Effect of Electrode Thickness
Model 4 employed a 67% reduction in the thickness of the electrode within the aperture boundary, and resulted in a point
of inflection on the shell curvature inboard of the location of the aperture boundary. Outboard of this point the slopes to and through the "dog leg" appear to be identical to those corresponding to the baseline configuration. The use of a thinner material as a means of simulating the perforated electrode geometry is probably more representative of the true
deflections than the smooth profile predicted by Model 2.
3.1.3 Effect of Removing the Dog Leg
Model 5 has flat flanges at the edges of the electrodes, with the "dog leg" removed. Differential thermal expansion
between the inside and outside flexmembers causes the extended
arm to tilt upward, and the compliance of the flat flange to the
upward tilt causes a 16% increase in vertical displacement at the
center of the electrode. The flexmembers of Model 5 are 0.43 mm thick and undergo a 16% increase in vertical displacement, compared to the 0.76-mm-thick flexmembers of Model 3, which have a calculated strain of only about 7%.
70
1 I 1 I 1 I I I I I I I I I I I I I 1

3.1.4 Effect of Electrode Diameter
The extended arm of the double flexmember support was removed in Model 6. This configuration was modelled by leaving
the flexmember at the same location as in the previous models and
enlarging the electrode flange to join the flexmember. This, in
effect, presented a more compliant member between the "dog leg"
and the flexmember supports (as in Model 5). In a practical design, the support would be located inboard, as close to the
"dog leg" as the thruster shell structure would allow. This
would result in deflections approaching, but (because of the elimination of the arm extension) not exceeding those of the baseline model. The net result predicted by Model 6 is a 19% decrease in the vertical displacement at the center of the
electrode.
Thermal expansion of the flex member support is included in all of the deflections indicated above. For Model 2, thermal expansion accounted for 38.5% of the vertical displacement at the screen center. Thermal expansion of the inboard flexmembers was
approximately 0.2 mm for Models 2-6. The simplified electrode mount shown in Figure 3-2 was
fabricated under the present program. Test results obtained with this promising new design will be obtained under NASA Contract NAS 3-23860.
3.2 ELECTRODE-FABRICATION TECHNOLOGY
Several improvements to grid-fabrication procedures were identified under NASA Contract NAS 3-23774. program, we continued the earlier work and reduced the improved
grid-fabrication techniques to practice. We also formulated a
set of detailed instructions to be followed during the fabrication of electrodes. Other work included an examination of the molybdenum materials properties that should give the best
results for hydroforming electrodes, particulary for the decel electrode of three-grid ion-extraction assemblies. This latter work is discussed in Section 5.
Under the present
71
3.2.1 Improvements to the Hydroforming Fixture
Previous ~ o r k ~ - ~ described the difficulty encountered in hydroforming the decel electrode of a three-grid ion-extraction assembly and concluded that flat spots or bumps appearing on the surface of the hydroformed electrodes could be eliminated by preventing air from being trapped between the grids during the dishing operation. To accomplish this, we modified the hydroforming fixture as shown in Figure 3-5. By eliminating the indicated air pocket, and by providing a vent for the release of any trapped air, electrode fabrication has been improved to the point that none of the 2130 grids that have been hydroformed since the tooling was modified have shown any signs of non-sphericity.
3.2.2 Improvements to the Stress-Annealing Fixture
Following the earlier work,3-3 we modified the stress- annealing fixture used for standard-dish-depth, three-grid optics assemblies. The problem that had been encountered in the past was thought to be the result of differential thermal expansion between the molybdenum electrodes and the carpenter-steel liner used in the annealing fixture. Under the present program, we replaced the steel liner with the graphite plug and liner shown in Figure 3-6. Stress-relieving operations performed since the fixture was modified have been highly successful. difficulty we have encountered has been an occasional cracking of the graphite ring. We believe the cracked rings have been caused by the rapid cooldown of the hot fixture, which is accomplished by blowing cold gas over the fixture. Closer control on vendor procedures is expected to eliminate this problem.
The only
3 .3 EXPERIMENTAL RESULTS
Table 3-1 lists the geometrical parameters of three ion- extraction assemblies that were fabricated and tested under this program to evaluate ion-optics performance effects related to aperture diameter and offset (to vector individual beamlets).
72
I I I I I I 1 I J 1 I I I 1 I 1 I I I
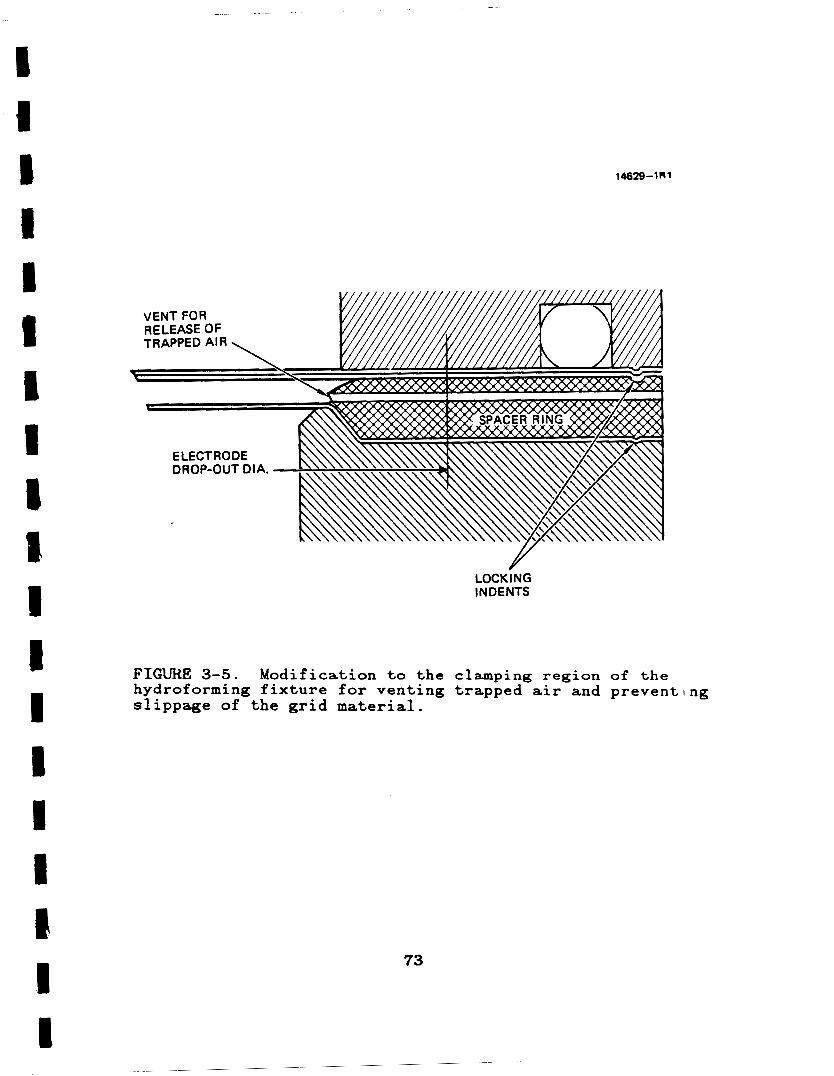
14629-1 R 1
VENT FOR RELEASE OF TRAPPED AIR
ELECTRODE DROP-OUT DIA.
LOCK~NG IN DENTS
FIGURE 3-5. hydroforming fixture for venting trapped air and preventlng slippage of the grid material.
Modification to the clamping region of the
73
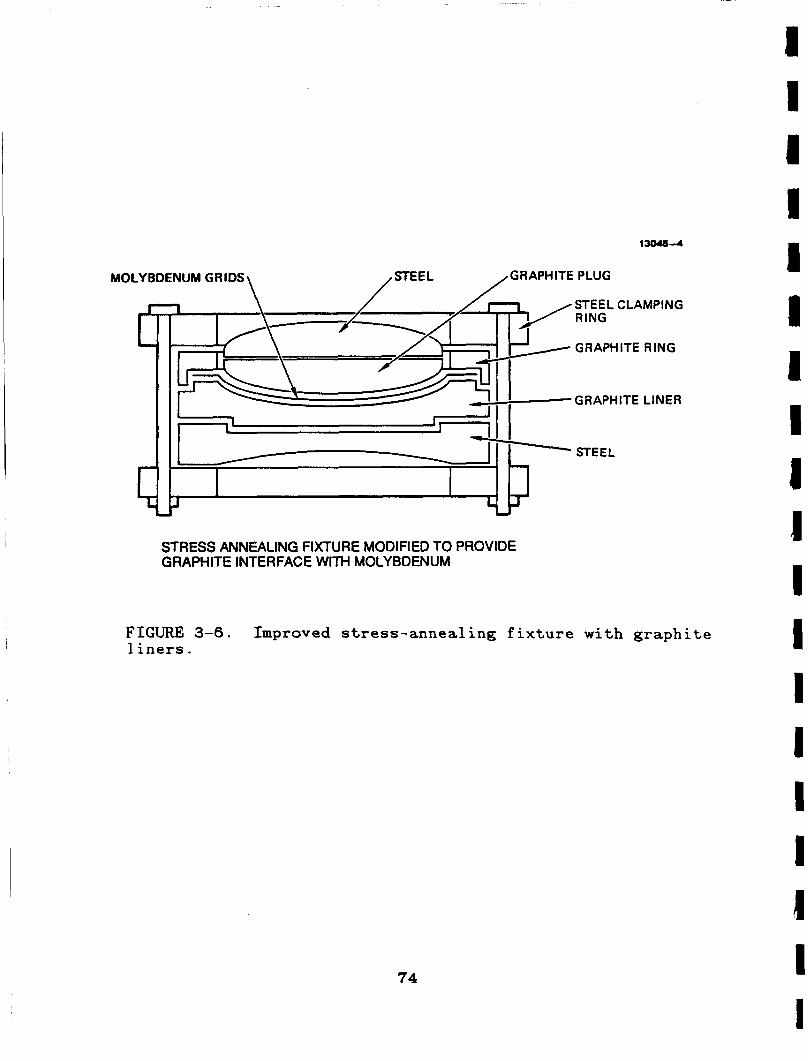
13045-4
MOLYBDENUM GRIDS GRAPHITE PLUG
A , GRAPHITE RING
GRAPHITE LINER
STEEL
J L LI - STRESS ANNEALING FIXTURE MODIFIED TO PROVIDE GRAPHITE INTERFACE WITH MOLYBDENUM
FIGURE 3-6. Improved stress-annealing fixture with graphite 1 iners.
74
1 I I I I 1 I I 1 I 1 I I I I 1 1 I
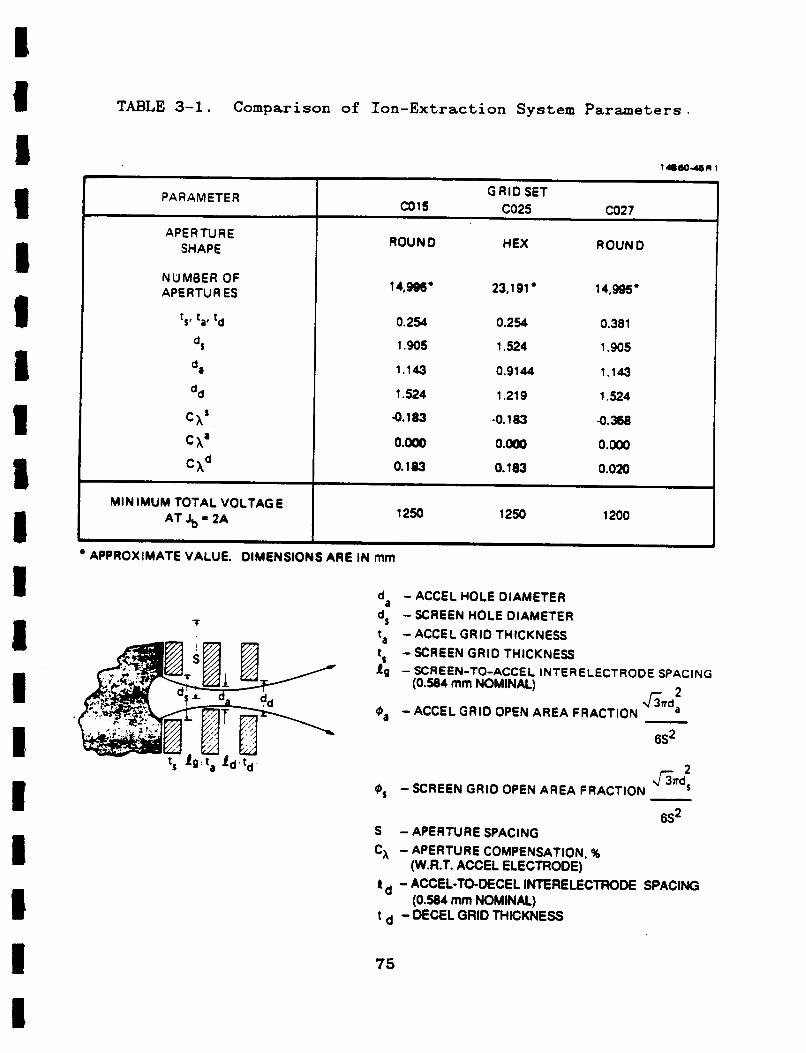
TABLE 3-1. Comparison of Ion-Extraction System Parameters
G RID SET co15 c025 C027
PA RAM ETE R
APE R TU R E SHAPE
NUMBER OF APERTU R ES
t ~ * ta, 'd
d,
dd
MIN IMUM TOTAL VOLTAGE AT Jb a 2A
ROUND HEX ROUND
14,906' 23,191 ' 14,995'
MIN IMUM TOTAL VOLTAGE AT Jb a 2A
0.254 0.254 0.381
1.905 1.524 1 .go5
1.143 0.9144 1.143
1.524 1.219 1.524
0.183 -0.183 -0.358
O.Oo0 O.Oo0 O.Oo0
0.183 0.183 0.020
1250 1250 1200 I
APPROXIMATE VALUE. DIMENSIONS ARE IN mm
T
da - ACCEL HOLE DIAMETER d, - SCREEN HOLE DIAMETER
- ACCEL GRID THICKNESS ta t, - SCREEN GRID THICKNESS 1 9 - SCREEN-TO-ACCEL INTERELECTRODE SPACING
(0.584 mm NOMINAL) &m( - - ACCEL GRID OPEN AREA FRACTION
6s'
- @s -SCREEN GRID OPEN AREA FRACTION
6S2 S -APERTURE SPACING Cx - APERTURE COMPENSATION, %
I d - ACCEL-TO-DECEL INTERELECTRODE SPACINO (W.R.T. ACCEL ELECTRODE)
(0.584 mm NOMINAL) t d - DECEL GRID THICKNESS
75
3.3.1 Aperture Diameter
Previous studies have shown that screen apertures smaller than about 2 mm in diameter result in a reduction in perveance per In spite of the reduction in perveance per aperture, we anticipated a net increase in beam-extraction
capacity to result from reducing the screen-aperture diameter to
less than 2 mm and increasing the number of apertures. Grid sets C015 and C025 were used to evaluate the effect of reducing the screen apertures from 1.91 mm to 1.52 mm, while increasing the number of apertures from about 15,000 to over 23,000. As the results of Table 3-1 indicate, there was essentially no increase in beam-extraction capacity; apparently the decrease in current per aperture was approximately equal to the increase in number of apertures (assuming the same gap and alignment). Recent
a n a l y ~ i s ~ - ~ and experimental result^^'^ indicate that aperture alignment becomes increasingly important as size is reduced.
We used optics set C015 to perform measurements of the perveance limit by spot welding a strip of 0.01-mm tantalum foil over a row of accel apertures on the downstream surface of the accel electrode (the decel electrode was removed) and then ion-
machining through the foil by operating the thruster for a few hours. Foil-aperture diameters measured for different total
accelerating voltages are shown in Figure 3-7. At a total
voltage of 1900 V (well in excess of that corresponding to the perveance limit of VT 1100 V), the machined apertures are
relatively uniform across the beam diameter and are about 60% of the accelerator-aperture diameter. At total voltages near the
perveance limit, the machined aperture diamet9rs are about 90% of the accelerator-aperture diameter. The results of Figure 3-9 suggest that the perveance limit occurs near the center of the ion optics for this (uncompensated) grid set.
The effect of smaller aperture diameter on electron backstreaming limit is shown in Figure 3-8. The increase in net-
to-total accelerating voltage ratio, R,,,, with smaller apertures
76
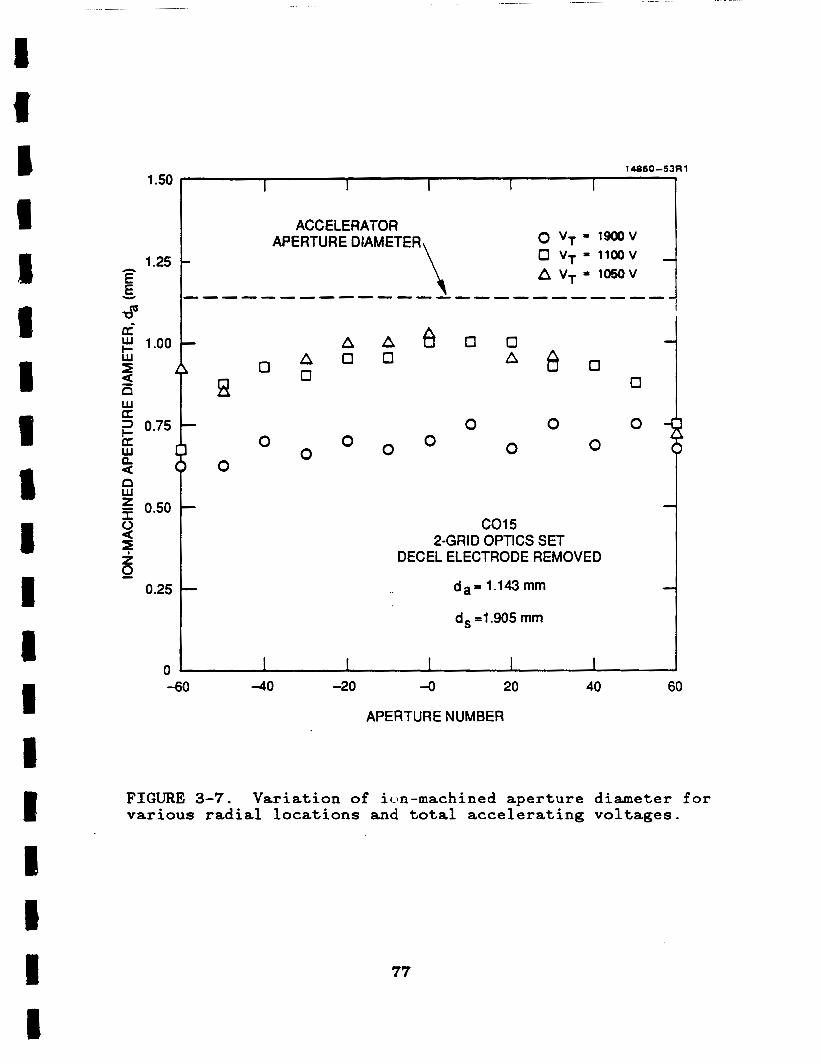
14860-53Rl 1.50 I I I I
0.25
a
I
Lu I- Lu
2 Lu
3 I-
w
a
a a a n Lu
$ 0
z a 7 0 -
1 .oo
0.50 Om7*
B
0
0
0
A 0
0
A a
0
A 0
0
9
0
a
0
0 A
0
0 a
0 0
C015
DECEL ELECTRODE REMOVED 2-GRID OPTICS SET
1 d a = 1.143rnm
d, ~1.905 mrn
FIGURE 3-7. various radial locations and total accelerating voltages.
Variation of ic>n-machined aperture diameter fo r
77
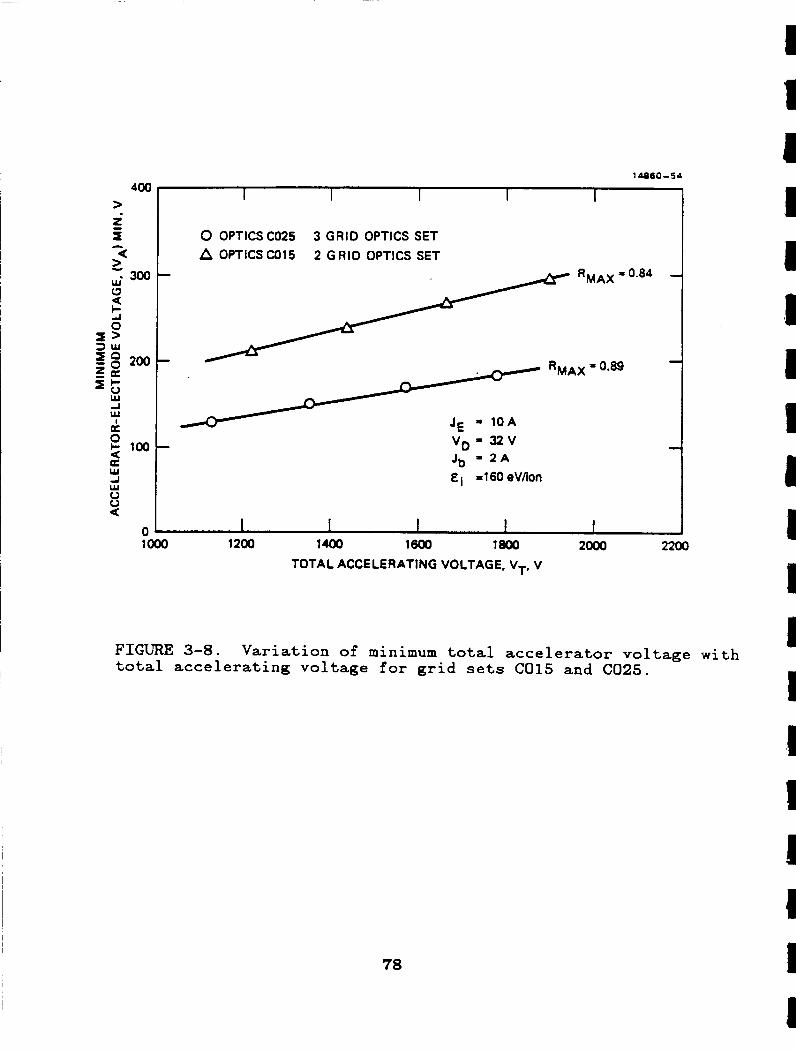
400 >
I
>
0 U
0
3 W
z U
-300 W-
3
r g 200
I >
$ E W
W I a
a 5 100
W A W 0 0 U
0
10860-54
~
I I I 1 I
0 OPTlCSC025 A OPTICS CO15
3 GRID OPTICS SET
2 GRID OPTICS SET 0.84
FIGURE 3-8. total accelerating voltage for grid sets C015 and C025.
Variation of minimum total accelerator voltage with
78
1 1 1 I 1 I 1 1 I 1 1 I I $1 I 1 il I 1
I II E 1 E E I 1 I I I 1 I 1 I I I i Y
is consistent with Kaufman’s analysis3” which relates R,,, to
the thickness-to-diameter ratio of the accelerator apertures,
t,/d,. could significantly reduce the amount of accelerator-electrode
sputtering due to a reduction in sputter yield that would
The ability to operate at such low accelerator voltages
accompany the reduced ion energies.
3.3.2 Besmlet Vectoring
The optics set C027 (Table 3-1) was designed fo r a net-to- total accelerating voltage ratio of R = 0.5, using a beamlet- vectoring model3’* to calculate the aperture compensation
required to vector beamlets parallel to the thruster axis. We verified the effectiveness of the aperture compensation in achieving beamlet vectoring by measuring the thrust-loss factor,
F,, as a function of the net-to-total accelerating voltage ratio, R. Figure 3-9 shows the variation of measured thrust-loss factor for optics sets C027 (compensated) and C015 (uncompensated). The
thrust-loss factor for optics set C027 varies with R and has a maximum near its design operating point of R = 0.5. By
comparison, the thrust-loss factor is essentially independent of R for the uncompensated optics set C015.
Further insight into the results presented in Figure 3-9 can be obtained from the angular dispersion profiles of the ion beamlets obtained from ExB probe measurements. Figure 3-10 shows the results for optics set C015, showing that the beamlet angle is independent of R. Furthermore, the profiles decrease in height and increase in angular width as the R value is reduced. This behavior is a consequence of beamlet spreading that accompanies the increase in ion deceleration at low values of R.
Angular dispersion profiles for optics set C027 are presented in Figure 3-11. These profiles also decrease in height and increase in angular width as the R value is reduced. However, the beamlet angle is strongly dependent on the R value for this compensated optics set. In addition, at an R value
79
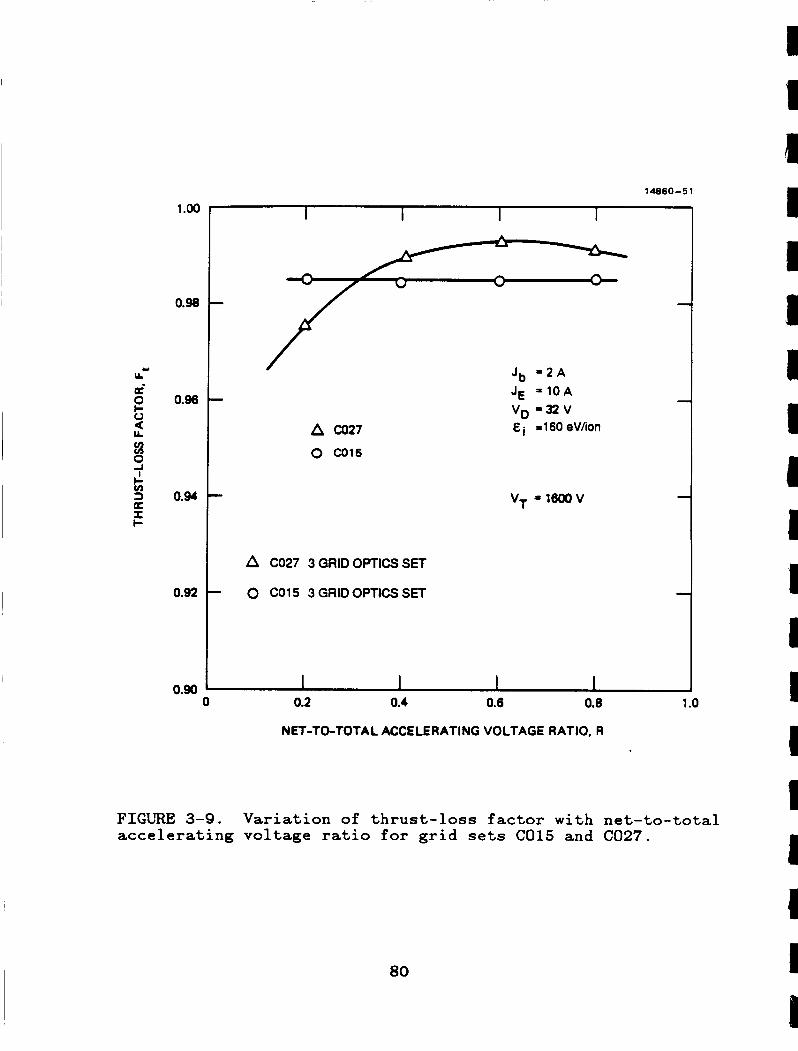
C u. a- 0
a 3 s a
u.
3 I I-
a
1 .oo
0.98
0.98
0.94
0.92
14860-51
P A CO27
0 W15
Jb * 2 A JE ~ 1 0 A VD - 3 2 v E -1 60 eViion
A C027 3 GRID OPTICS SET
0 CO15 3 GRID OPTICS SET
0.90 0 0.2 0.4 0.6 0.8 1 .o
NET-TO-TOTAL ACCELERATING VOLTAGE RATIO, R
FIGURE 3-9. Variation of thrust-loss factor with net-to-total accelerating voltage ratio for grid sets C015 and C027.
80
1 1 1 I 1 1 1 1 I I 1 I 1 1 1 I 1 1 1
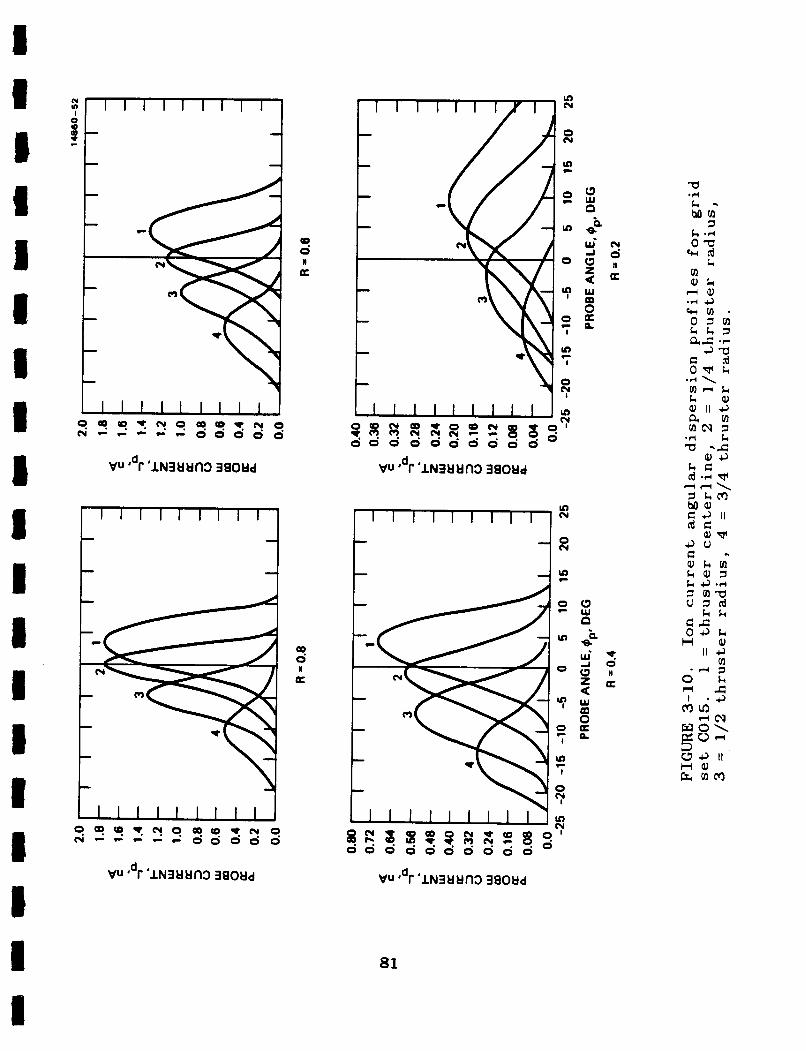
i c -I 0 hl
e 0 c;'
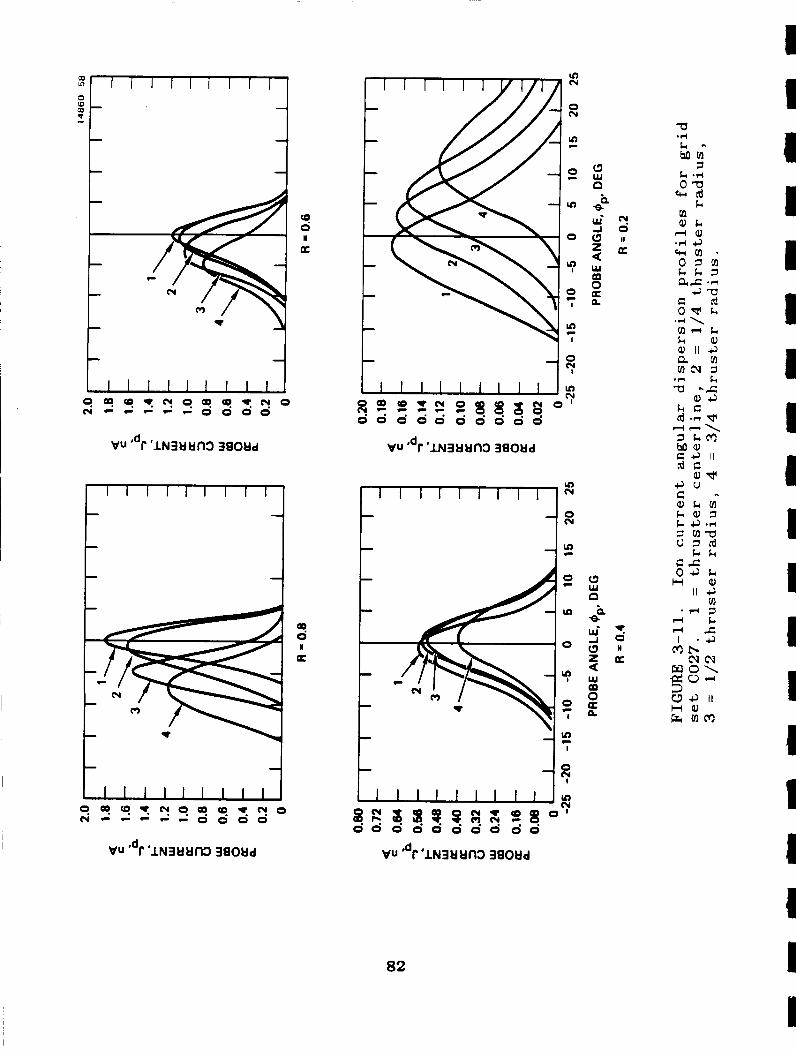
(9
a 0
W
-I
t
c
82
h 8
a m m c o 7
3 m a U 3 d
k k c c 0 3 k H a
II 4 m
between 0.4 and 0.6 there is nearly complete beamlet vectoring along the lines parallel to the beam axis for all radial locations (consistent with a large value of F, shown in Figure
3-9), while for other values of R there is off-axis beamlet vectoring (consistent with the lower values of F, shown in Figure
3-9). Figure 3-11 indicates the cross-over beamlet vectoring occurs at an R value of 0.2.
83
3-1.
3-2.
3-3.
I 3-4.
3-5.
3-6.
~ 3-7.
REFERENCES
Poeschel, R.L. and Beattie, J.R., "Primary Electric Propulsion Technology Study," NASA CR-159688, Hughes Research Laboratories, Malibu, California, November 1979.
Beattie, J.R., "Extended Performance Technology Study - 30-cm Thruster," NASA CR-168259, Hughes Research Laboratories, Malibu, California, June 1983.
Poeschel, R.L., "Development of Advanced Inert-Gas Ion Thrusters," NASA CR-168206, Hughes Research Laboratories, Malibu, California, July 1983.
Rawlin, V.K., "Studies of Dished Accelerator Grids for 30-cm Ion Thrusters", AIAA Paper No. 73-1086, 1973.
Kaufman, H . R . and Robinson, R.S., "Minimum Hole Size in Ion Optics", J. Spacecraft, Vol. 22, No. 3, pp. 381-382, May- June 1985,
Rovang, D., "Ion Extraction Capabilities of Two-Grid Accelerator Systems", NASA CR-174621, Colorado State University, Fort Collins, Colorado, February 1984.
Kaufman, H.R., "Technology of Electron-Bombardment Ion
84
1 1 1 I 1 1 I 1 I I I I I 1 1 I 1 1 I
SECTION 4 POWER-PROCESSOR SIMPLIFICATIONS
A dramatic simplification (factor-of-ten reduction in parts count) of the power processor required to operate an 8-cm-
diameter mercury ion thruster was demonstrated under a joint NASA/Hughes program aimed at reducing the complexity of ion- propulsion systems. '-' (SPPU) shown in the schematic of Figure 4-1 was built under the Hughes-funded program, and preliminary evaluation of the unit (using a laboratory-model 8-cm-diameter thruster) demonstrated the feasibility of the simplified approach. Under the present
program, we investigated the startup transients and steady-state operating characteristics of a laboratory-model 8-cm-diameter thruster when operated with the SPPU. We also demonstrated that
the SPPU could be used to successsfully operate an 8-cm-diameter thruster that was functionally equivalent to the Ion Auxiliary Propulsion System ( U P S ) flight thrusters and verified that steady-state performance was comparable to that obtained using a
conventional laboratory-model power processor and test console.
The Simplified Power Processor Unit
4.1 STEADY-STATE AND TRANSIENT OPERATION The initial operation"' of the SPPU used the output of
Resistance Temperature Devices (RTD's) to control the output of the discharge- and neutralizer-vaporizer-heater supplies (see Figure 4-1). Under t h e present program, w e improved the
performance characteristics of the SPPU by adding an external circuit that transforms thermocouple input into simulated-RTD
output. By replacing the RTD's on the laboratory-model 8-cm- diameter thruster with thermocouples, we could sense the
temperature at a location closer to the vaporizer and we eliminated a 2OoC to 5OoC overshoot in temperature that had been
85
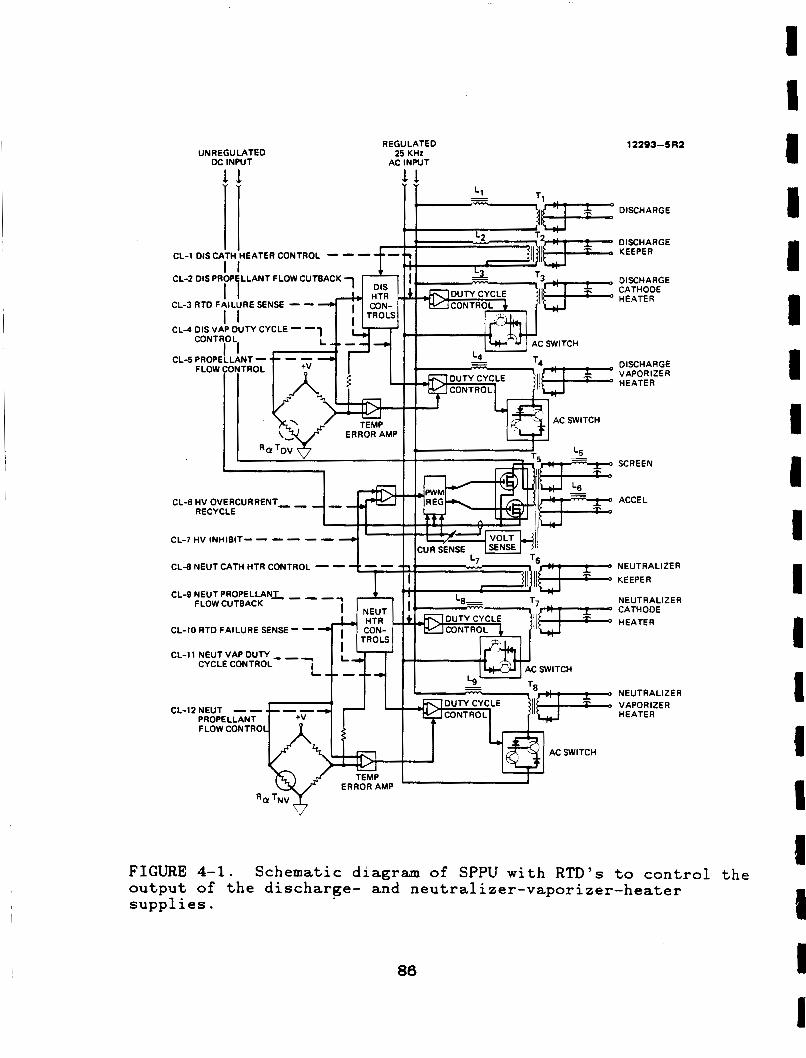
UNREGULATED DC INPUT
REGULATED
AC INPUT 25 KHz
12293-SR2
DISCHARGE
DISCHARGE KEEPER
DISCHARGE CATHODE HEATER
DISCHARGE VAPORIZER HEATER
SCREEN
CL-6 HV OVERCURRENT- - ACCEL RECYCLE
CL-7 HV INHIBIT- - - - NEUTRALIZER KEEPER
NEUTRALIZER CATHODE HEATER
CL-E NEUT CATH HTR CONTROL - - CL-9 NEUT PROPELLANT - - -
FLOW CUTBACK
CL-10 RTD FAILURE SENSE- -
NEUTRALIZER
CL-12NEUT -- VAPORIZER PROPELLANT HEATER FLOW CONTRO
FIGURE 4-1. output of the discharge- and neutralizer-vaporizer-heater supplies.
Schematic diagram of SPPU with RTD’s to control the
86
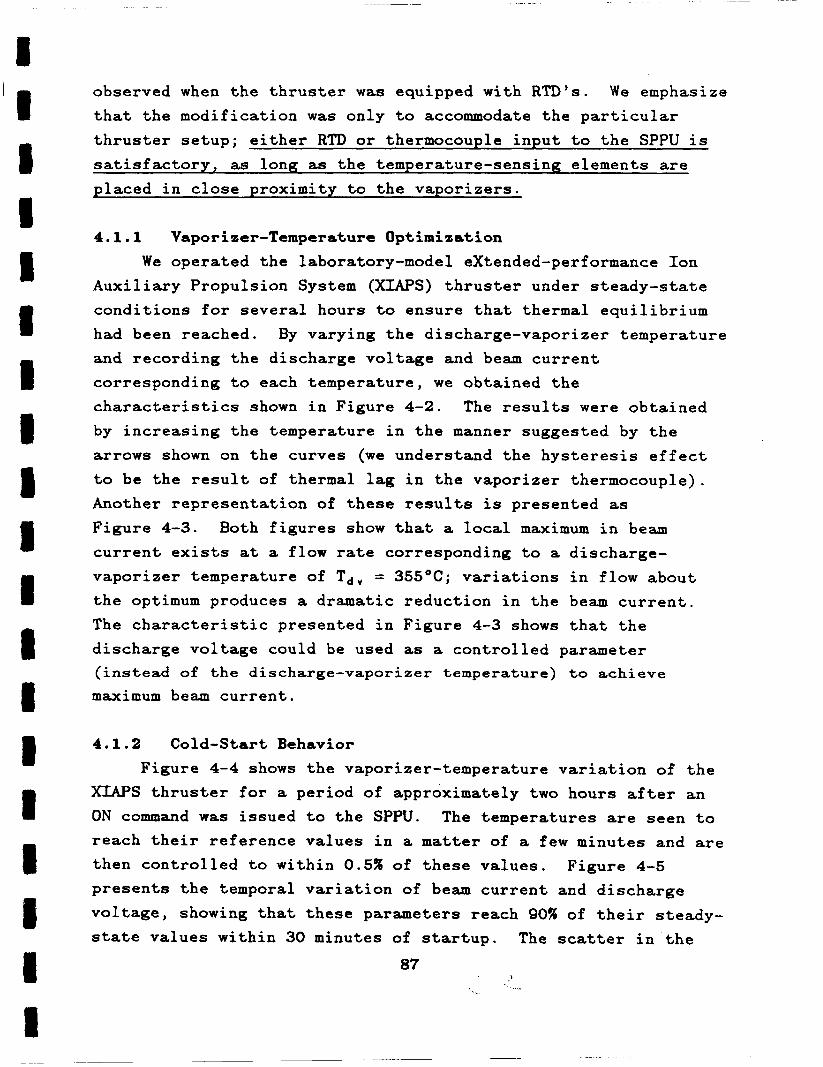
observed when the thruster was equipped with RTD's. We emphasize
that the modification was only to accommodate the particular thruster setup; either RTD or thermocouple input to the SPPU is satisfactory, as long as the temperature-sensing elements are placed in close proximity to the vaporizers.
4.1.1 Vaporizer-Temperature Optimization We operated the laboratory-model extended-performance Ion
Auxiliary Propulsion System (XIAPS) thruster under steady-state conditions for several hours to ensure that thermal equilibrium
had been reached. By varying the discharge-vaporizer temperature
and recording the discharge voltage and beam current corresponding to each temperature, we obtained the
characteristics shown in Figure 4-2. The results were obtained
by increasing the temperature in the manner suggested by the
arrows shown on the curves (we understand the hysteresis effect
to be the result of thermal lag in the vaporizer thermocouple). Another representation of these results is presented as Figure 4-3. Both figures show that a local maximum in beam current exists at a flow rate corresponding to a discharge- vaporizer temperature of Tdv = 355OC; variations in flow about the optimum produces a dramatic reduction in the beam current. The characteristic presented in Figure 4-3 shows that the discharge voltage could be used as a controlled parameter (instead of the discharge-vaporizer temperature) to achieve
maximum beam current.
4.1.2 Cold-Start Behavior Figure 4-4 shows the vaporizer-temperature variation of the
XIAPS thruster for a period of approximately two hours after an ON command was issued to the SPPU. The temperatures are seen to
reach their reference values in a matter of a few minutes and are then controlled to within 0.5% of these values. presents the temporal variation of beam current and discharge voltage, showing that these parameters reach 90% of their steady- state values within 30 minutes of startup. The scatter in the
Figure 4-5
87 > - -
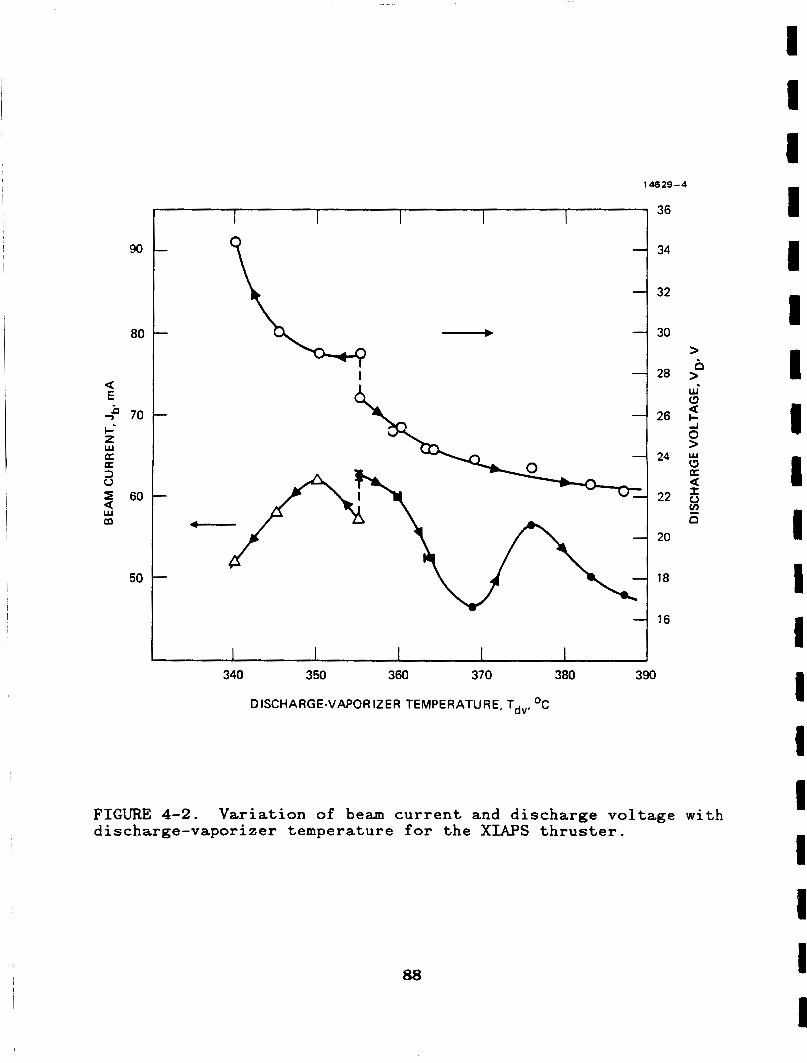
90
80
a E -ii 70 c- z a a 3 0 5 60
m
w
w
50
14629-4
36
i I 4
34
32
30
28
26
24
22
20
18
FIGURE 4-2. discharge-vaporizer temperature for the XIAPS thruster.
Variation of beam current and discharge voltage w i t h
88
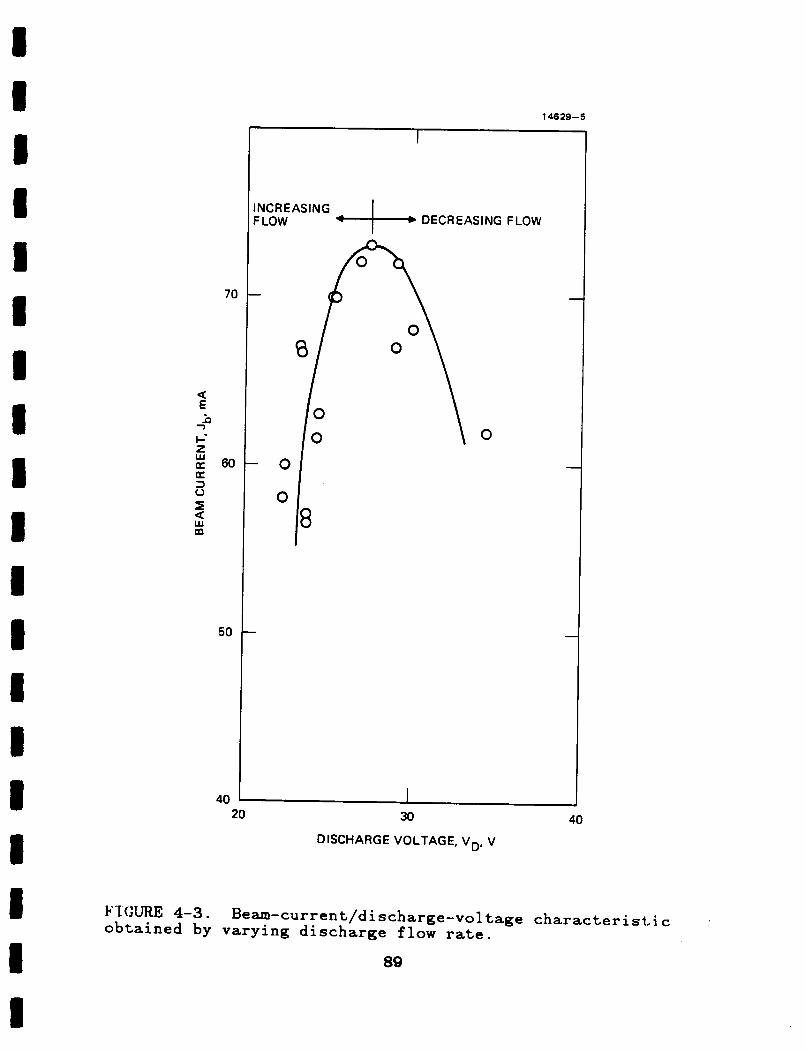
71
a E 5
I--
a 3 0 5 a m
7
z 6C
w
50
40
14629-5
*+b DECREASING FLOW
0
30 40 20
DISCHARGE VOLTAGE, VD, V
F I W R E 4-3. Beam-current/discharge-vol tage characteristi c I
obtained by varying discharge flow rate.
89
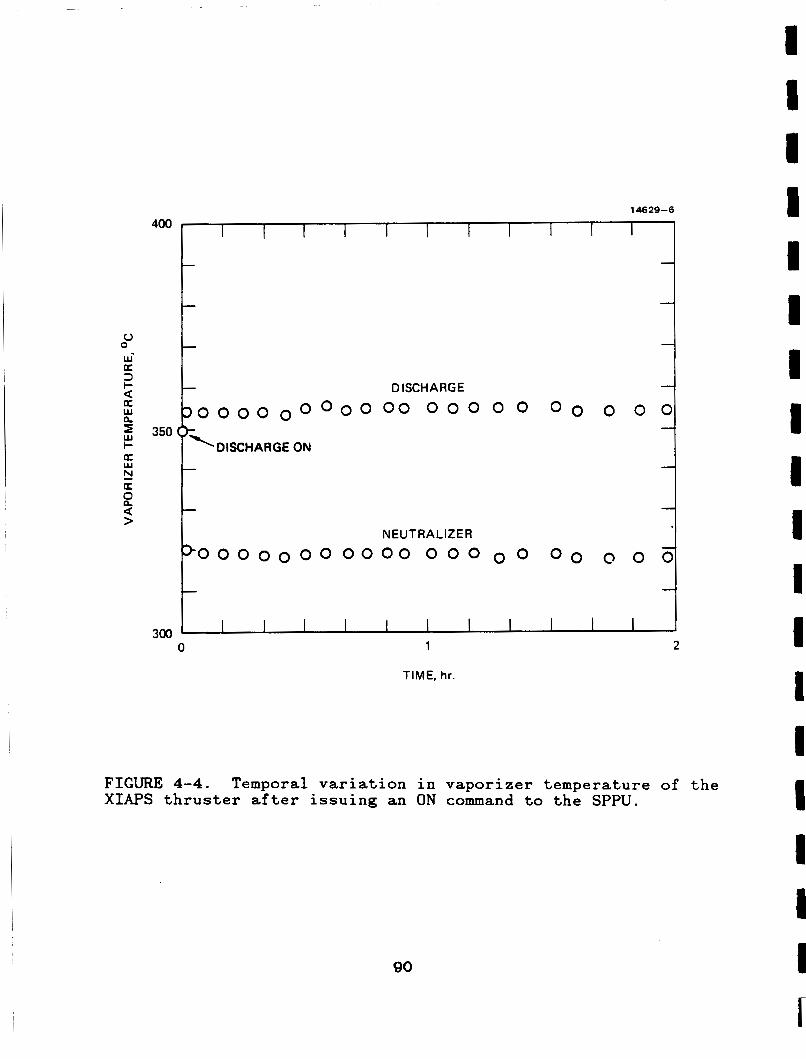
TIME, hr.
FIGURE 4-4. XIAPS thruster after issuing an ON command to the SPPU.
Temporal variation in vaporizer temperature of the
90
a I 1 I 1
I 1 I 1 1 1 1 I 1 I 1 I
a
r
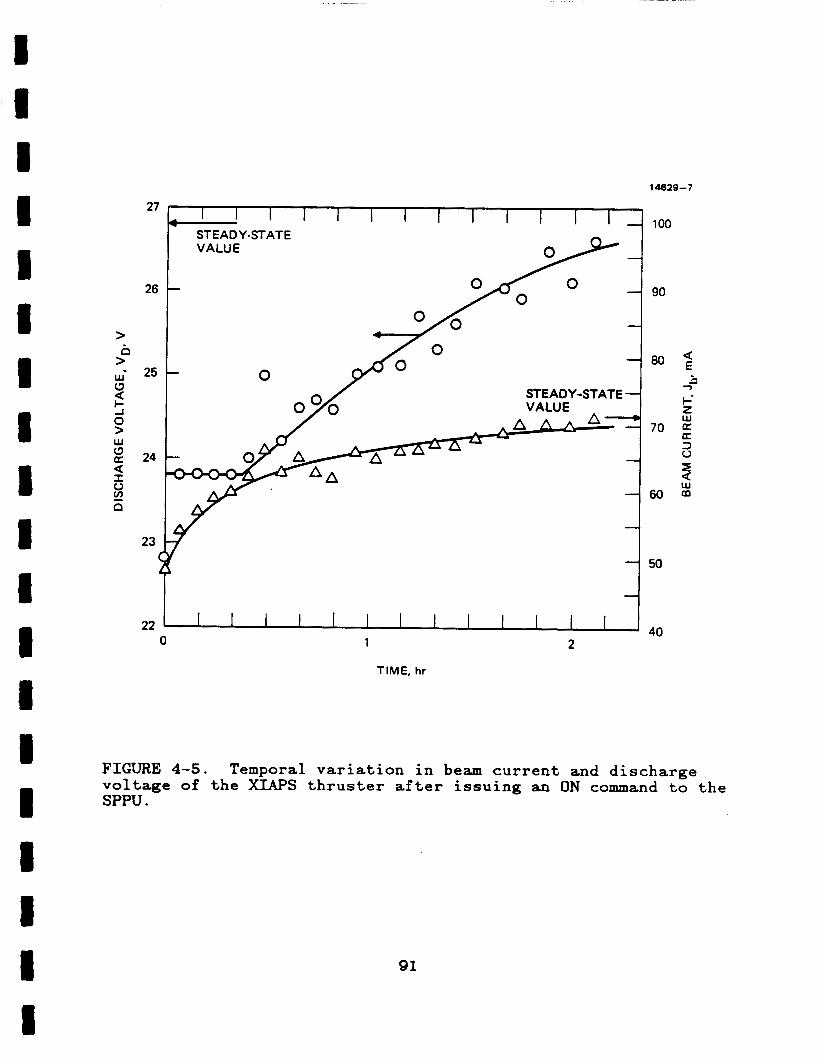
27
26
> > Q U c A 0 > Ly
a 25
24
I u z n
23 C L
22
14629-7
I I I I I I I I I I I 40
1 2 0
TIME, hr
FIGURE 4-5. voltage of the XIAPS thruster after issuing an ON command to the SPPU.
Temporal variation in beam current and discharge
91
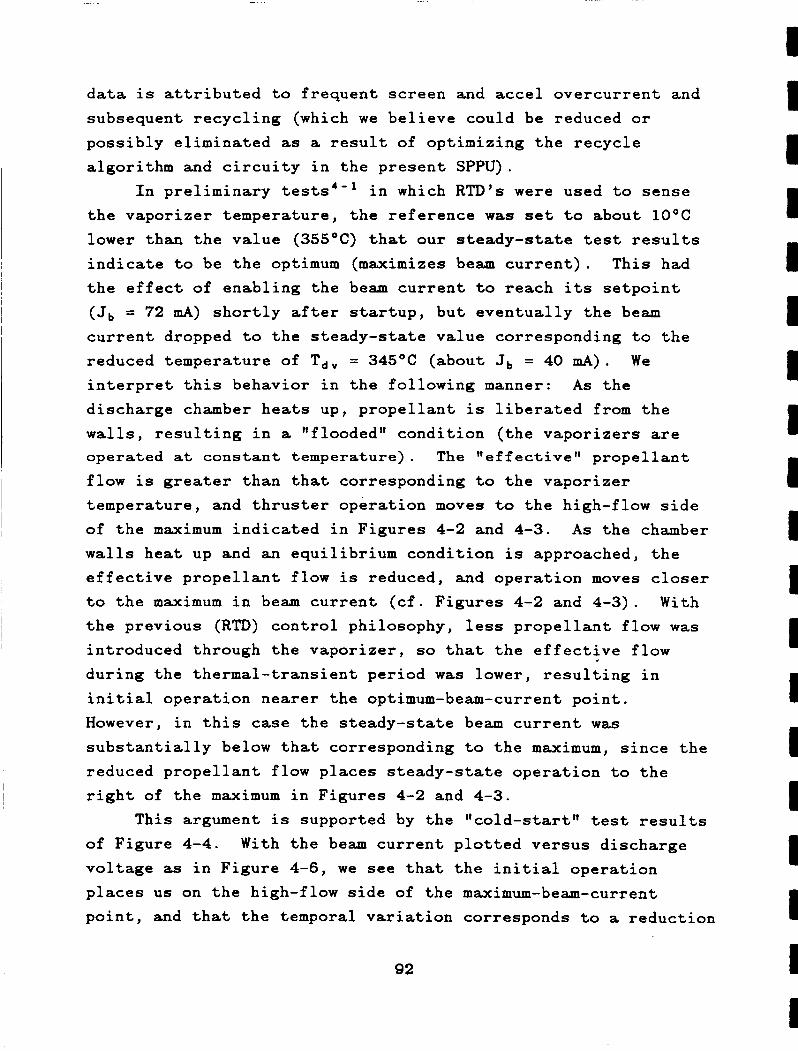
data is attributed to frequent screen and accel overcurrent and
subsequent recycling (which we believe could be reduced or possibly eliminated as a result of optimizing the recycle algorithm and circuity in the present SPPU).
In preliminary tests in which RTD's were used to sense the vaporizer temperature, the reference was set to about 1 0 ° C lower than the value (355OC) that our steady-state test results indicate to be the optimum (maximizes beam current). This had the effect of enabling the beam current to reach its setpoint (Jb = 72 mA) shortly after startup, but eventually the beam
current dropped to the steady-state value corresponding to the reduced temperature of T,, = 345OC (about J b = 40 mA) . We interpret this behavior in the following manner: As the discharge chamber heats up, propellant is liberated from the
walls, resulting in a "flooded" condition (the vaporizers are operated at constant temperature) . The "effective" propellant
flow is greater than that corresponding to the vaporizer temperature, and thruster operation moves to the high-flow side of the maximum indicated in Figures 4-2 and 4-3. As the chamber walls heat up and an equilibrium condition is approached, the effective propellant flow is reduced, and operation moves closer to the maximum in beam current (cf. Figures 4-2 and 4-3). With
the previous (RTD) control philosophy, less propellant flow was introduced through the vaporizer, so that the effective flow during the thermal-transient period was lower, resulting in
initial operation nearer the optimum-beam-current point. However, in this case the steady-state beam current was
substantially below that corresponding to the maximum, since the reduced propellant flow places steady-state operation to the right of the maximum in Figures 4-2 and 4-3.
This argument is supported by the "cold-start" test results of Figure 4-4. voltage as in Figure 4-6, we see that the initial operation places us on the high-flow side of the maximum-beam-current point, and that the temporal variation corresponds to a reduction
With the beam current plotted versus discharge
92
I I I I I I I 1 I I 1 1 1 I I I I 1 I
t
7
a E 22
c- z E 6t a 3 u 5
m
7
a w
50
40
^^ 14629-0
INCREASING*+* FLOW DECREASING FLOW
STEADY-STATE CHARACTE RlSTlC
F1 0- t = 10 MINUTES
I 3
2 0- t = 5 MINUTES
-
10- STARTING POINT, t = 0
COLD-START TEMPO R A L VARIATION
30 40 20
DISCHARGE VOLTAGE, VD, V
FIGURE 4-6. Comparison of "cold start'' temporal behavior of XIAPS thruster with steady-state performance characteristic.
93
in "effective" propellant flow with a resultant shift toward the optimum operating conditions. This transient-flow effect could
presumably be eliminated either by preheating the discharge
chamber, or by controlling the vaporizer flow in proportion to an operating parameter such as beam current or discharge voltage (instead of discharge-vaporizer temperature) .
Effects similar to the one described above have also been
observed in a 30-cm-diameter thruster, when it was brought to full beam current within a few minutes of discharge ignition. In
this case, the cathode flow was regulated to maintain constant discharge voltage, and we observed a reduction in vaporizer
temperature of about 100°C (from 32OOC to about 22OoC), followed by a corresponding increase in vaporizer temperature as the
thruster-body temperature increased.
4.2 IAPS-EQUIVALENT THRUSTER OPERATION The 8-cm-diameter thruster S/N 901 was modified to be
functionally equivalent to an IAPS flight thruster by incorporating the most-essential modifications that were employed under the IAPS flight program to upgrade the 900-series thrusters to flight specifications. The modifications included replacing
the discharge and neutralizer cathodes, the cathode pole piece
and baffle, and the ion-extraction assembly. We conducted a Performance Acceptance Test (PAT) of the
S/N 901 retrofit thruster, using the same laboratory-model power processor and test console that was used to test the IAPS flight thrusters. flight thrusters were followed for vaporizer calibration, cathode conditioning, and startup. We found that the retrofit thruster
performs much like the flight thrusters; a comparison of the operating parameters for the S/N 901 thruster with those representative of the Cyclic Life Test thruster S/N 903 and the flight thrusters S/N 908 and S/N 909 is presented in Table 4-1.
The same procedures used in acceptance testing the
94
1 1 I I I I 1 1 I I I I 1 I I 1 I 1 I
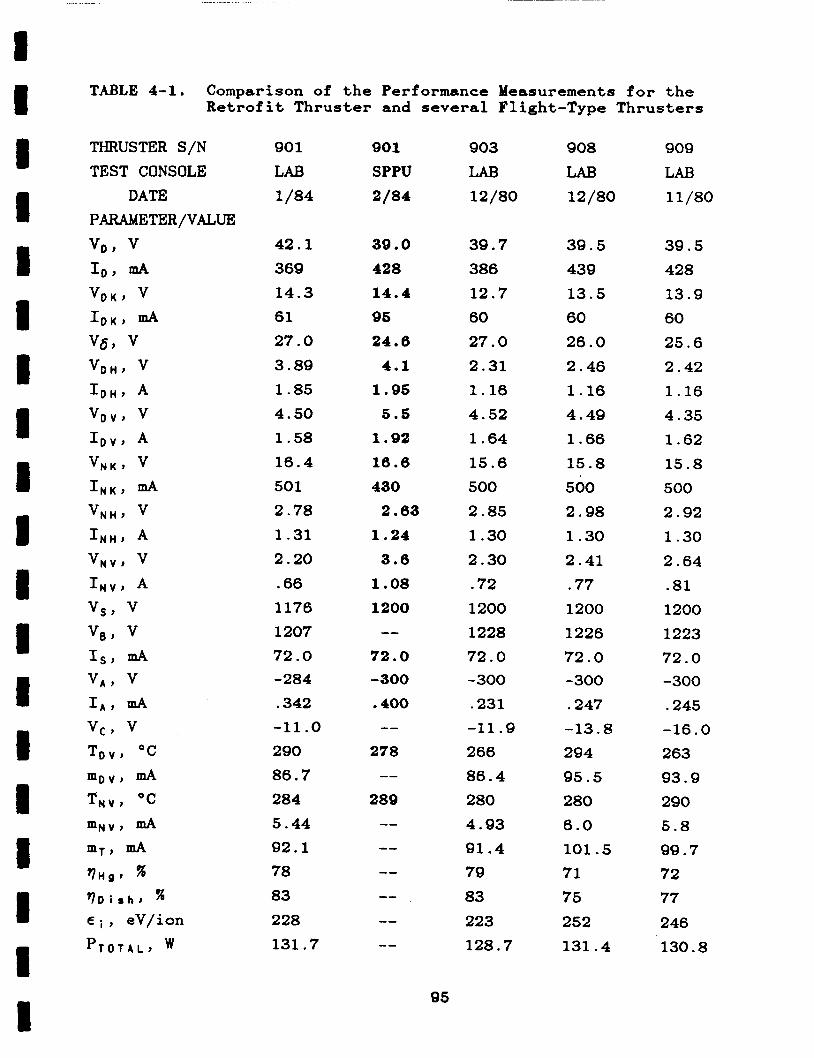
TABLE 4-1. Comparison of the Performance Retrofit Thruster and several
901 LAB 1 /84
42.1 369 14.3 61 27.0 3.89 1.85 4.50 1.58 16.4 501 2.78 1.31 2.20 .66 1176 1207 72.0 -284 .342 -11 .o 290 86.7 284 5.44 92.1 78 83 228 131.7
901
SPPU 2/84
39.0
428
14.4
96
24.6
4 .1
1.95
5 .5
1.92
16.6
430
2.63
1.24
3.6
1.08
1200 --
72.0 -300
.400 --
278 --
289 -- -- -- -- -- --
85
Measurements for the Flight-Type Thrusters
903 LAB 12/80
39.7 386 12.7 60 27.0 2.31 1.16 4.52 1.64 15.6 500 2.85 1.30 2.30 .72 1200 1228 72.0 -300 .231 -11.9 266 86.4 280 4.93 91.4 79 83 223 128.7
908 LAB 12/80
39.5 439 13.5 60 26.0 2.46 1.16 4.49 1.66 15.8 500 2.98 1.30 2.41 .77 1200 1226 72.0 -300 .247 -13.8 294 95.5 280 6.0 101.5 71 75 252 131.4
909 LAB 11/80
39.5 428 13.9 60 25.6 2.42 1.16 4.35 1.62 15.8 500 2.92 1.30 2.64 .81 1200 1223 72.0 -300 .245 -16.0 263 93.9 290 5.8 99.7 72 77 246 130.8
The only notable differences in these results are a higher cathode-heater power, (which was necessary in order to sustain the discharge), and for a nominal V b the discharge voltage and discharge-keeper voltage are a few volts higher than those typical of the flight thrusters. Performance-documentation results are presented in Figures 4-7 and 4-8, which show measured propellant-utilization efficiency and ion-production cost versus
V6. 26 V < Vg - < 28 V .
These results show that the optimum Vg lies in the range
- Having characterized the operation of the retrofit thruster
using a conventional power processor, we next operated it using the SPPU, which uses constant-vaporizer-temperature control loops for controlling the mercury flow through the discharge and neutralizer vaporizers. During the startup, predetermined maximum currents are applied to both the discharge and neutralizer cathode heaters and vaporizers. The keeper and
discharge voltages are also ON at this time. When the pre- selected vaporizer temperatures are reached, the vaporizer loops operate in proportional control to maintain these temperatures. The thruster remains in this condition until the keepers ignite.
After the neutralizer keeper ignites, the current to the neutralizer-cathode heater drops to a lower setpoint (there are only two setpoints on each cathode-heater supply) while the neutralizer-keeper current remains constant. In a similar manner, the ignition of the discharge keeper is followed by a lowering of the cathode-heater current to the predetermined value, while the discharge-keeper current remains constant. The main discharge can ignite any time after the discharge keeper. The screen and accel voltages are applied only after the
discharge and neutralizer keepers have ignited, the discharge has ignited, and the discharge voltage has dropped to less than VD = 50 V. There is a recycling feature of the SPPU that is triggered by sensing excessive screen or accel currents. 4 - 1
I 1 I I I 1 I I I I 1 I 1 I I I I I I
96
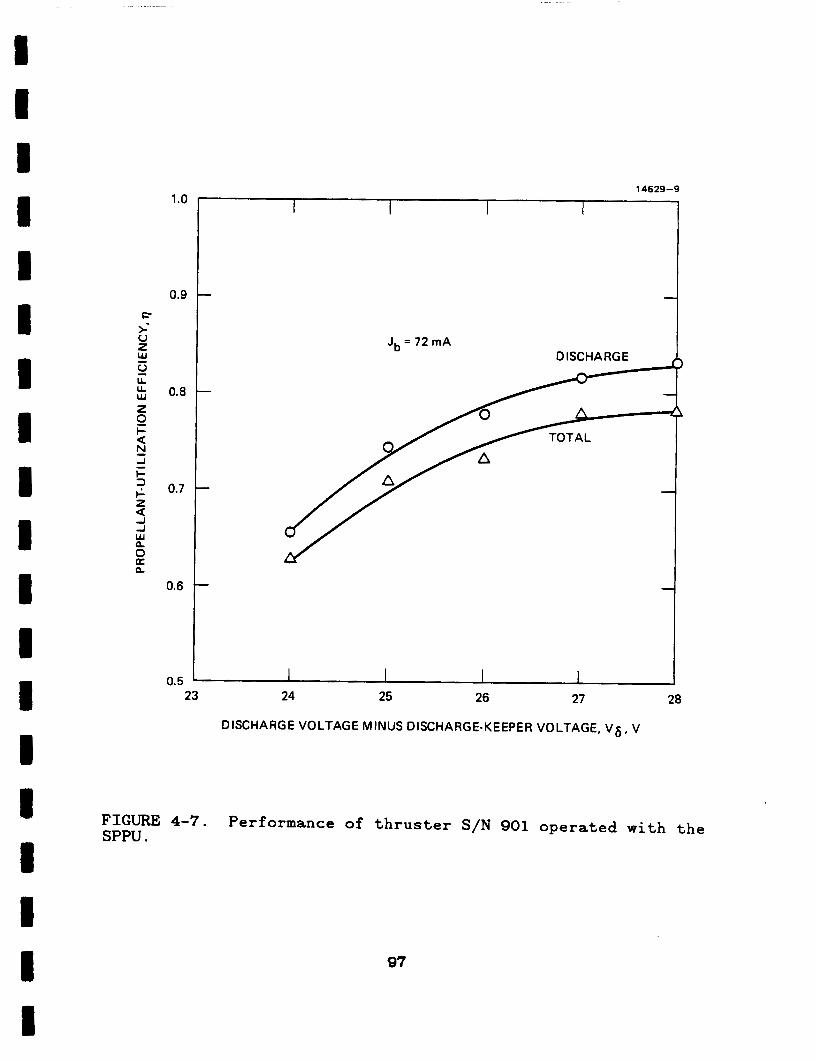
1 .c
0.9
0.8
0.7
0.6
0.5
Jb = 72 mA
TOTAL
I I 26 27 28
DISCHARGE VOLTAGE MINUS DISCHARGE-KEEPER VOLTAGE, V 6 , V
FIGURE 4-7. SPPU . Performance of t h r u s t e r S/N 901 operated w i t h t h e
97
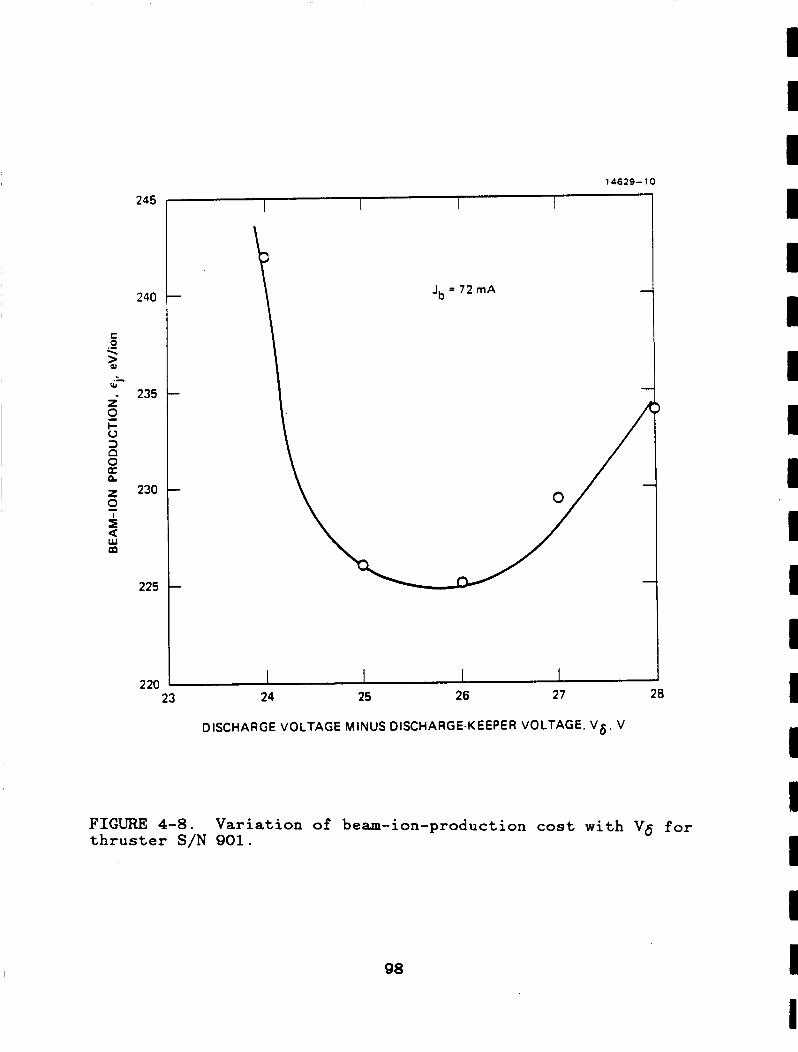
14629- 10
245
2 40
E 0 <
6- h
i 0
235
I- u 3 d 0 a Q
s 230
5
m d
225
2 20 23 24 25 26 27 28
DISCHARGE VOLTAGE MINUS DISCHARGE-KEEPER VOLTAGE, V 6 , V
FIGURE 4-8. thruster S/N 901.
Variation of beam-ion-production cost with Vg for
98
I 1 I I I I I I I I 1 I 1 1 I I I I I
Several demonstrations verified that a beam current of
J, = 72 mA could be obtained with the pre-selected values of discharge current and discharge-vaporizer temperature. Typical
electrical measurements are presented in Table 4-1 for comparison with the results obtained while operating the retrofit thruster
S/N 901 on a conventional power processor. Flow rates were not measured for the data corresponding to operation on the SPPU, but the vaporizer temperatures were about the same as those recorded for thruster S/N 901 when operated using the laboratory test console.
During the tests conducted with the S/N 901 retrofit thruster, we observed that the SPPU has a tendency to undergo excessive power-supply recycling during thruster startup from
ambient temperature or below. Similar results were observed in
earlier tests that were conducted using the XIAPS thruster. In these tests, we determined that cold startups are characterized
by excessive "effective" propellant flow (the sum of the discharge-vaporizer flow plus the propellant liberated from the walls), or "flooding" of the discharge chamber. In the more
recent tests, we could successfully prevent the recycling by
either preheating the thruster or by delaying the application of screen and accel voltages. The recycle feature in the SPPU appears to be more sensitive than that used in the IAPS power electronics, and it may have to be modified to enable rapid cold- starting without experiencing excessive high-voltage breakdowns
between the ion-extraction electrodes. With the exception noted above, the operation of an ttIAPS-
equivalent" thruster on the SPPU was quite satisfactory, and it appears that only minor modifications to the SPPU design are desirable. The only area of major concern is the constant- vaporizer-temperature control philosophy, which is based on the assumption that the calibration curves of the vaporizers remain constant throughout the lifetime of the thruster. This may or
99.
may not be true, and if it is not, a different control philosophy will have to be adopted. With only a slight increase in
complexity, the SPPU circuitry can be modified to permit active control of the vaporizer power to maintain the desired values of discharge voltage and neutralizer-keeper voltage. Application of the SPPU technology to inert-gas thrusters (in which the vaporizers are replaced by flow impedances) appears to be straightforward.
100
I 1 I I I I I I I I I I I

REFERENCES
4-1. Wessel, F.J. and Hancock, D.J., "Simplified Power Processing for Ion Thruster Subsystems," AIAA Paper No. 83-1394, Seattle, Washington, June 1983.
1
101
I I I I I I I I I I I I I I I I I I I
SECTION 5
TECHNOLOGY READINESS OF THE J-SERIES THRUSTER
Although several mercury-ion-thruster subsystems have been
brought to flight status (SERT I, SERT 11, IAPS, and RIT lo), there is a pervasive perception by mission designers that mercury-ion-propulsion technology does not have the demonstrated
maturity required for a primary system (i.e., mission fails unless system performs to specification). Some of the major system concerns that have been voiced are as follows:
0 Reliability documentation is inadequate
only limited data are available - test results are flawed - documentation of test results is insufficient - tests performed only on components
qualification requirements only vaguely specified
0 Interface specifications are not well defined
exhaust-plume definition and contamination - thrust-vector location - control requirements - high-voltage effects on spacecraft - system-integration procedures undefined or
undocumented
e Technology concepts under development are too complex and/or too expensive
too many parts - too many controls
e Required operating time is too long
- high reliability mandated - long operating or storage life mandated - qualification of representative flight system is
prohibitively expensive and time consuming
103
If the concerns of the system engineer that are listed above are to be alleviated by technology development, the following
tasks must be addressed:
0 A set of design specifications must be formulated for all thruster-subsystem components
- 1 if etime - performance - reliability - operating ranges (temperature, power, etc.) - interface requirements (structural, thermal, etc.) - integration (safety, environment, etc.)
0 A rationale must be devised for showing compliance with the design specifications
- qualification tests - demonstration tests and analytical projections
0 Thrust-subsystem components must be developed to meet the design specifications
A formal design specification comparable to the ones used for procuring chemical thrusters was not prepared as part of the development of the NASA/Hughes 30-cm-diameter, J-series mercury ion thruster. However, it has been developed to provide a nominal thrust of F = 130 mN at a nominal specific impulse of I,, = 3000 sec, and with a nominal power input of P i , = 2.7 kW.5-' The design lifetime for this thruster is L = 15,000 hours. In
most respects, the technology of the J-series thruster is very mature, and no fundamental problems remain to be solved if the thruster is used in the manner conceived during its development. There are some unresolved issues of lifetime and reliability that have been raised in endurance tests, and these must be resolved
before the technology can be considered fully mature.
Acceptability of the thruster technology would also be improved by reducing the complexity of the hardware and/or its operation, and by reducing fabrication costs. Specific tasks are identified
below to address these issues.
104
I I I I I I I I I I I I I I 1 I I I I

I
I I I I I I I I I I I I I I I I I
!I I 5.1 DISCHARGE-CHAMBER EROSION Erosion of critical thruster components by ion sputtering is
the major life-limiting process identified in the endurance tests performed on 900-seriess-* and J-series5-3 30-cm-diameter
thrusters. A secondary effect of this wearout mode is the deposition of the sputtered material. This deposition represents a reliability risk because spalling of the deposits produces metallic flakes that can result in pre-wearout failures (insulators can be short-circuited or ion beamlets can be deflected enough to damage the accelerator grids). Consequently, the major technology issue for the J-series
thruster is baffle and pole-piece erosion and subsequent deposition of material onto the cathode keeper and keeper
support. Life-test indicate that flakes can form from deposition in this region after relatively short operating times
which we estimate may precipitate failures after only 10,000 hours of operation. Potential solutions for this problem are:
0 Identify operating conditions that reduce sputtering in the cathode pole-piece/baffle region
0 Improve surface characteristics of deposition sites to inhibit spalling
0 Modify magnetic circuit to eliminate the pole piece/ baffle.
5.2 INSULATOR MATERIALS Another issue that is equally important is the specification
of materials and design of insulators for the thruster wiring and mounting. In the J-series design, several types of insulating materials are specified; ceramic or vespel stand-off-type insulators and teflon-coated kapton wiring insulation. thermal environment of the Mission Profile Life several insulation failures occurred. Although the failure mechanisms
In the
105
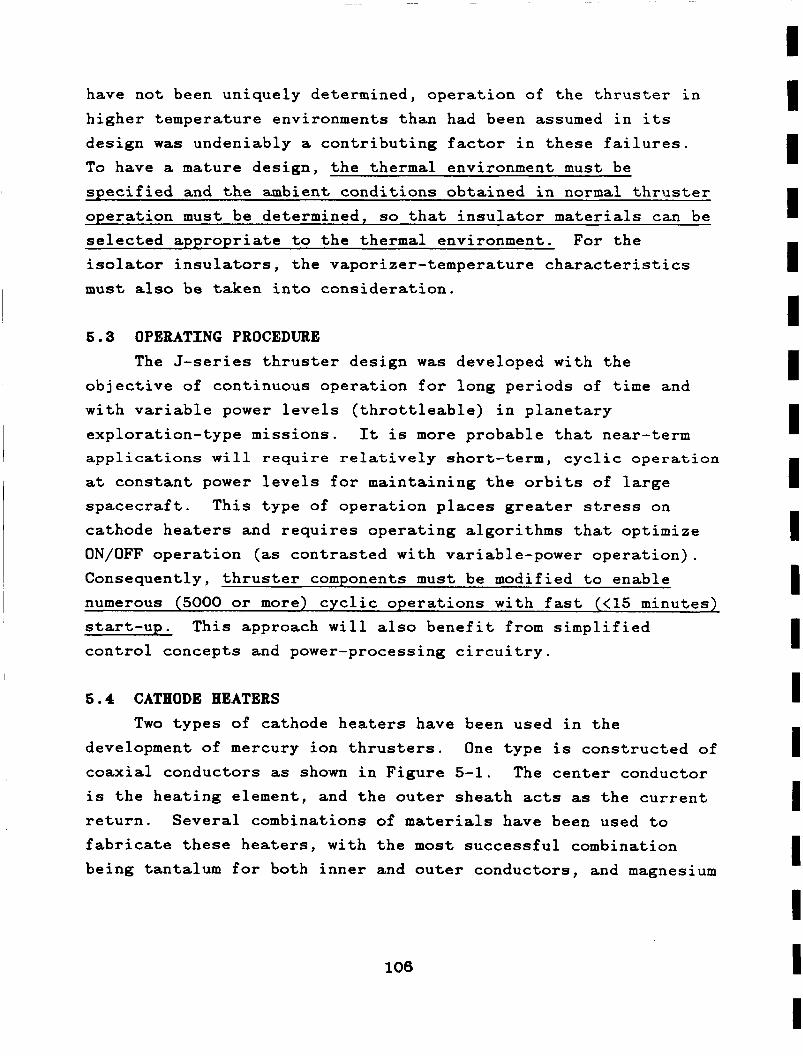
have not been uniquely determined, operation of the thruster in
higher temperature environments than had been assumed in its design was undeniably a contributing factor in these failures.
To have a mature design, the thermal environment must be specified and the ambient conditions obtained in normal thruster
operation must be determined, so that insulator materials can be
selected appropriate to the thermal environment. For the isolator insulators, the vaporizer-temperature characteristics
must also be taken into consideration.
5.3 OPERATING PROCEDURE The J-series thruster design was developed with the
objective of continuous operation for long periods of time and with variable power levels (throttleable) in planetary exploration-type missions. It is more probable that near-term applications will require relatively short-term, cyclic operation
at constant power levels for maintaining the orbits of large spacecraft. This type of operation places greater stress on
cathode heaters and requires operating algorithms that optimize ON/OFF operation (as contrasted with variable-power operation). Consequently, thruster components must be modified to enable numerous (5000 or more) cyclic operations with fast (<15 minutes) start-up. This approach will also benefit from simplified control concepts and power-processing circuitry.
6.4 CATHODE HEATERS Two types of cathode heaters have been used in the
development of mercury ion thrusters. One type is constructed of
coaxial conductors as shown in Figure 5-1. The center conductor
is the heating element, and the outer sheath acts as the current return. Several combinations of materials have been used to fabricate these heaters, with the most successful combination being tantalum for both inner and outer conductors, and magnesium
106
I I I I I I I I I I I 1 I 1 I I I I I
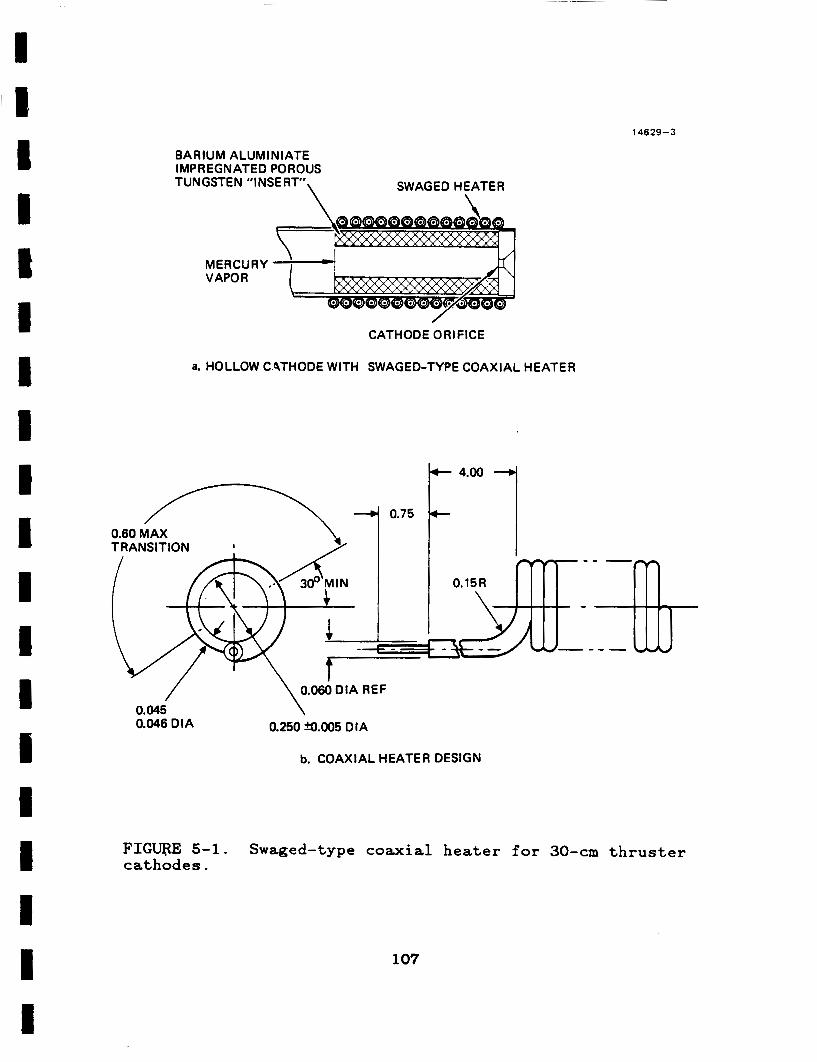
14629-3
BARIUM ALUMINIATE I MP R EG N ATE D PO ROUS
TUNGSTEN "INSERT", SWAGED HEATER
MERCURY += M VAPOR
CATHODE OR1 FICE
a. HOLLOW C9THODE WITH SWAGED-TYPE COAXIAL HEATER
TRANSITION
0.15R
- - - -
0.060 DIA REF
0.250 s.005 DIA 0.046 DIA
b. COAXIAL HEATER DESIGN
FIGWE 5-1. cathodes.
Swaged-type coaxial heater for 3 0 - c m thruster
107
oxide as the insulating material. The second type of heater is constructed by encapsulating the resistance-heating element in a
ceramic insulator as shown in Figure 5-2. For this type of
heater, the resistance-heating element has been fabricated using
tungsten or tungsten/rhenium alloy, and the heating element has
been encapsulated by flame spraying alumina.
For small-diameter cathodes (0.32 cm), the encapsulated heaters have proven to be tractable to fabrication. This type of
heater provides better heat transfer from the heating element to
the cathode tube, and, therefore, requires less power to achieve the required temperature. On the other hand, the coaxial heater
material cannot be wrapped around small-diameter cathodes without
excessive deformation that results in elongation and tearing of
the outer conductor. The impaired integrity of the coaxial
material caused by forming small-diameter coils has produced relatively short heater lifetimes.
Use of alumina-encapsulated heaters for larger diameter cathodes (0.64 cm or greater) is not tractable because the encapsulation tends to crack at normal dathode operating temperatures. Cracks in the encapsulation result in degraded
heat transfer from the heating element to the cathode tube,
requiring a higher operating temperature for the heating element and resulting in local "hot spots". These hot spots ultimately result in failure of the heater element.
Either of the cathode-heater designs decribed above can provide long operating life with high reliability if the heater- fabrication processes are carefully controlled. In both cases, the required controls have been documented. However, the
procedures used by the fabricator involve levels of skill and attention to detail that exceed those required for fabrication of
most comparable commercial products. Consequently, the successful procurement of high-reliability cathode heaters will require development of a vendor (or vendors) that can implement the quality procedures for fabricating reliable heaters.
I I I I II I I I 1 1 1 I I 1 1 1 1 I I
108
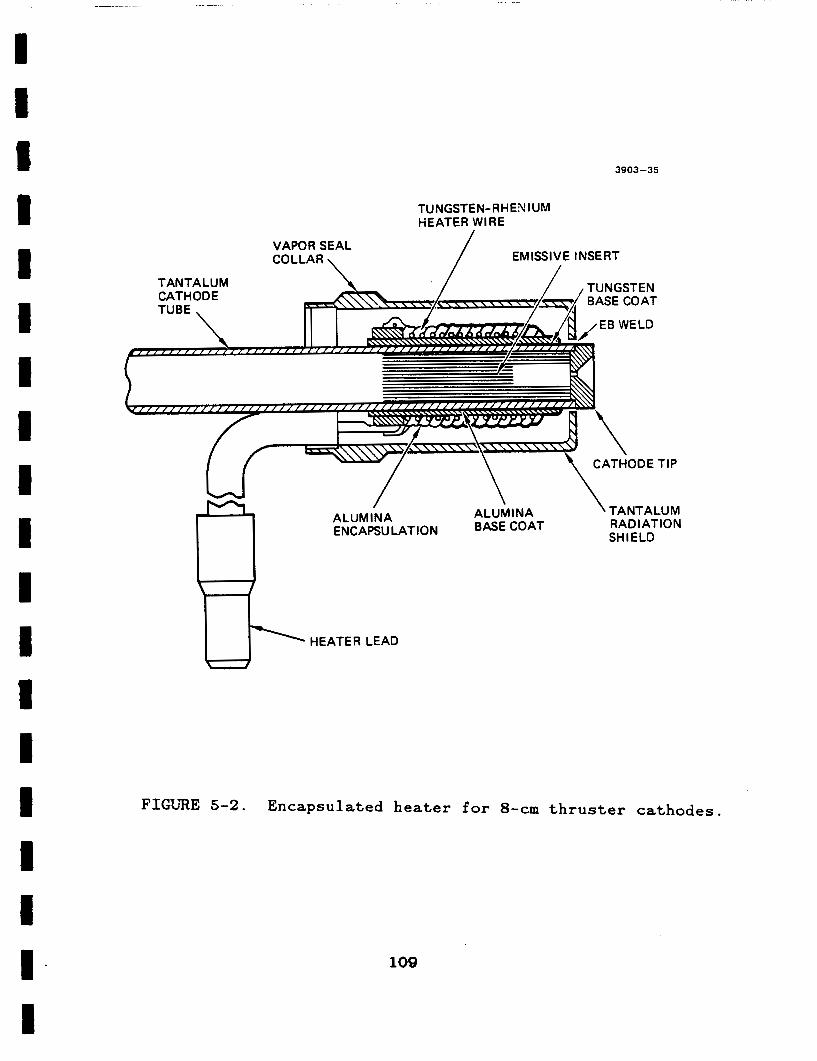
3903-35
TUNGSTEN- RHEN I UM HEATER WIRE
VAPOR SEAL EMISSIVE INSERT
TANTALUM CATHODE
ALUMINA ENCAPSULATION SHIELD
HEATER LEAD
FIGURE 5-2. Encapsulated heater for 8 - c m thruster cathodes.
109
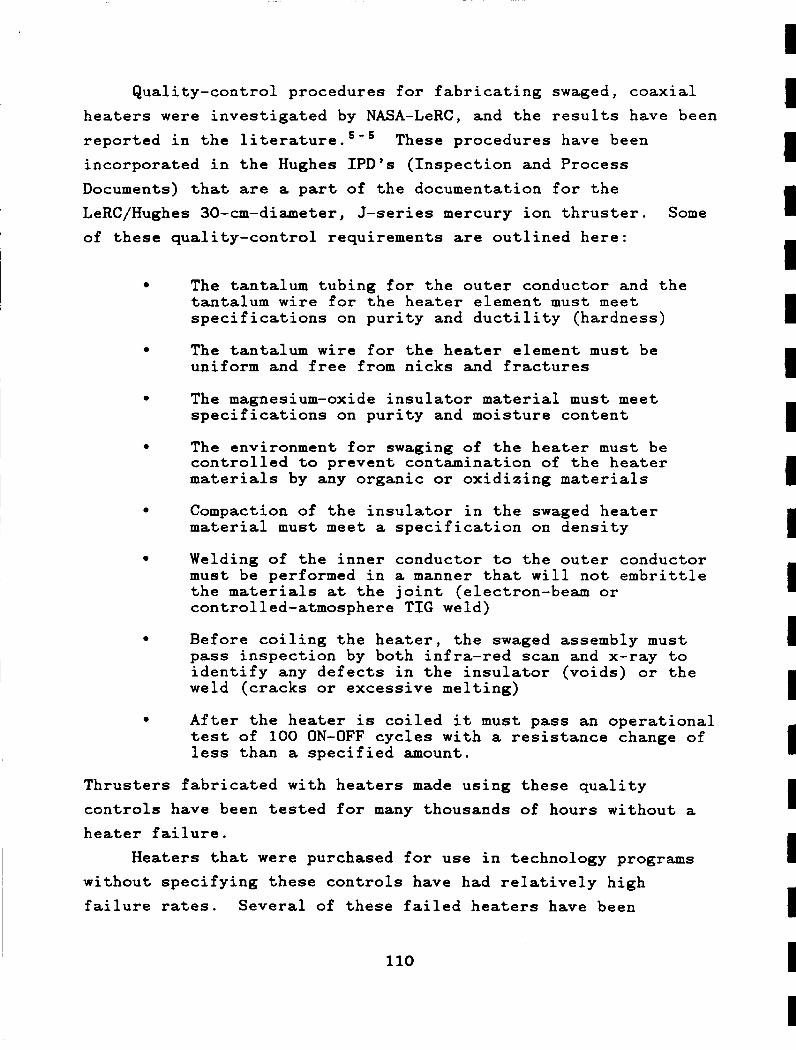
Quality-control procedures for fabricating swaged, coaxial
heaters were investigated by NASA-LeRC, and the results have been
reported in the literature. ’-’ incorporated in the Hughes IPD’s (Inspection and Process
Documents) that are a part of the documentation for the LeRC/Hughes 30-cm-diameter, J-series mercury ion thruster. Some
of these quality-control requirements are outlined here:
These procedures have been
0 The tantalum tubing for the outer conductor and the tantalum wire for the heater element must meet specifications on purity and ductility (hardness)
0 The tantalum wire for the heater element must be uniform and free from nicks and fractures
0 The magnesium-oxide insulator material must meet specifications on purity and moisture content
0 The environment for swaging of the heater must be controlled to prevent contamination of the heater materials by any organic or oxidizing materials
0 Compaction of the insulator in the swaged heater material must meet a specification on density
0 Welding of the inner conductor to the outer conductor must be performed in a manner that will not embrittle the materials at the joint (electron-beam or controlled-atmosphere TIG weld)
0 Before coiling the heater, the swaged assembly must pass inspection by both infra-red scan and x-ray to identify any defects in the insulator (voids) or the weld (cracks or excessive melting)
0 After the heater is coiled it must pass an operational test of 100 ON-OFF cycles with a resistance change of less than a specified amount.
Thrusters fabricated with heaters made using these quality
controls have been tested for many thousands of hours without a heater failure.
Heaters that were purchased for use in technology programs without specifying these controls have had relatively high failure rates. Several of these failed heaters have been
110
I I I 1 1 I I I 1 1 I I I 1 1 I 1 I I
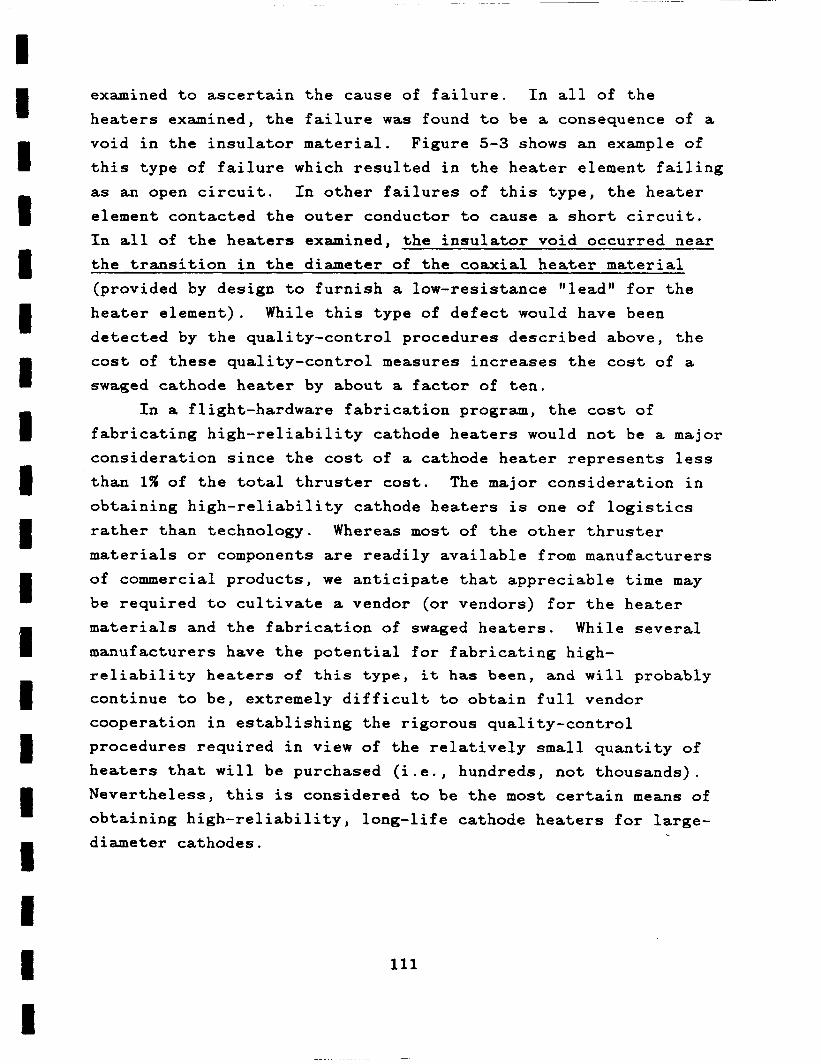
examined to ascertain the cause of failure. In all of the heaters examined, the failure was found to be a consequence of a void in the insulator material. Figure 5-3 shows an example of this type of failure which resulted in the heater element failing as an open circuit. In other failures of this type, the heater element contacted the outer conductor to cause a short circuit. In all of the heaters examined, the insulator void occurred near the transition in the diameter of the coaxial heater material (provided by design to furnish a low-resistance 'Ilead" for the
heater element). While this type of defect would have been detected by the quality-control procedures described above, the cost of these quality-control measures increases the cost of a
swaged cathode heater by about a factor of ten. In a flight-hardware fabrication program, the cost of
fabricating high-reliability cathode heaters would not be a major consideration since the cost of a cathode heater represents less than 1% of the total thruster cost. The major consideration in
obtaining high-reliability cathode heaters is one of logistics rather than technology. Whereas most of the other thruster materials or components are readily available from manufacturers
of commercial products, we anticipate that appreciable time may be required to cultivate a vendor (or vendors) for the heater materials and the fabrication of swaged heaters. While several
manufacturers have the potential for fabricating high- reliability heaters of this type, it has been, and will probably continue to be, extremely difficult to obtain full vendor cooperation in establishing the rigorous quality-control procedures required in view of the relatively small quantity of heaters that will be purchased (i.e., hundreds, not thousands). Nevertheless, this is considered to be the most certain means of obtaining high-reliability, long-life cathode heaters for large- diameter cathodes.
111
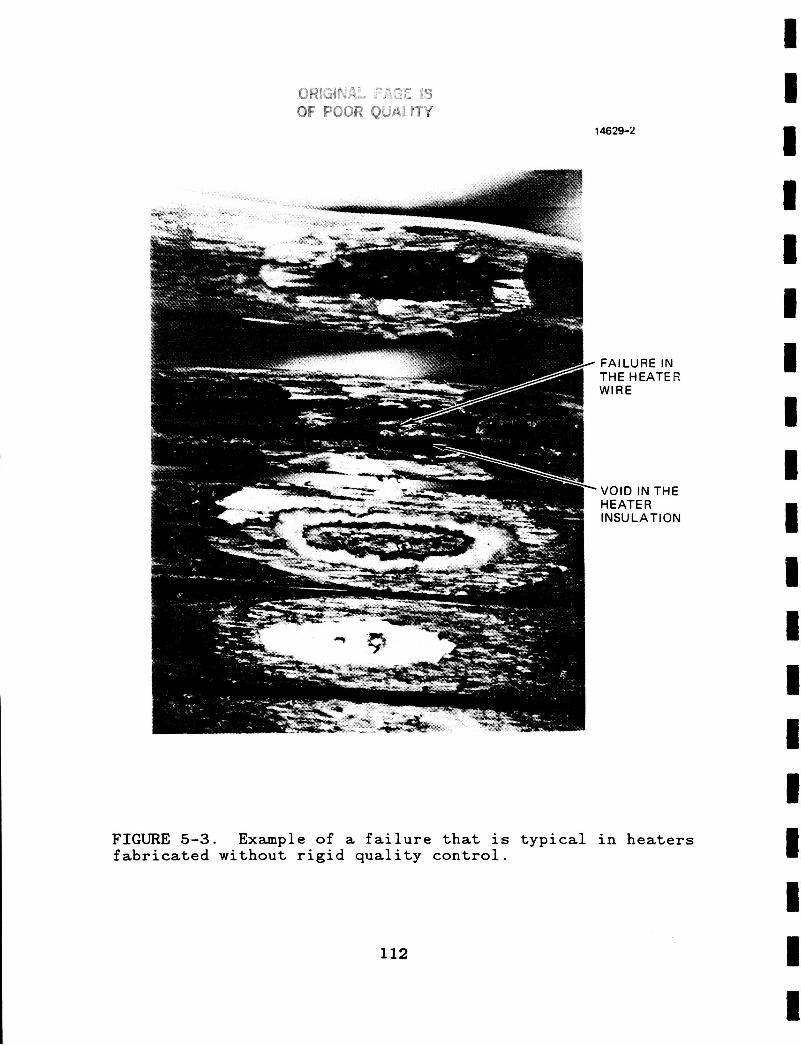
14629-2
FAILURE IN THE HEATER WIRE
VOID IN THE HEATER INSU LATl ON
FIGURE 5-3. Example of a failure that is typical in heaters fabricated without rigid quality control.
112

The encapsulated heaters used on the smaller diameter cathodes are fabricated using similar rigorous quality controls
to ensure long life and high reliability. Again, the purity of materials is an essential feature, but skill (craftsmanship) in application of the flame-sprayed alumina to the cathode tube, and then in covering the heater element, is the most critical operation in achieving successful fabrication of encapsulated heaters. The attachment of the heater wire to the cathode tube and to the center conductor of the coaxial lead-in by electron- beam welding is also a critical operation. However, this
operation is more readily documented and can become nearly an automatic one.
5 . 5 ION-OPTICS FABRICATION A final consideration relates to identifying and specifying
steps or procedures performed during the fabrication of ion- optics grids to ensure stable, reproducible operation for the ion-extraction assembly. Examination of grid sets fabricated f o r J-series thrusters S/N 5-2 thru J-10 revealed that the hole patterns of some grids are distorted sufficiently to influence the effective perveance. several hours of continuous operation are required to obtain thermal (and dimensional) equilibrium of the ion-extraction
assembly. This type of time constant could result in problems caused by aperture misalignment and out-of-tolerance
interelectrode spacing for short-term, cyclic operation.
Modifications in grid-fabrication procedures have been proposed to correct the problems described above; however, the effectiveness of these procedures has not been fully evaluated. Experiments to verify the relevance of improved grid-fabrication procedures to J-series mercury-ion-thruster designs must be performed.
Tests at NASA’s LeRC showed that
Although the J-series ion-extraction-assembly design has proven to be superior, by far, to prior designs, some advances in fabrication and assembly procedures need to be documented to
113

ensure that future use of this design will produce favorable results. In addition to the procedures already described in the
J-series, 30-cm mercury-ion-thruster documentation package, the
following list of notes and procedures must be included to obtain reproducible results.
5.5.1 Molybdenum Material Specifications In the documentation for fabrication of the J-series ion-
extraction grids, the material is specified as low-carbon, arc- cast molybdenum. Molybdenum sheet is available in several other forms that vary in purity and ductility, and for which both the
cost and delivery time is different. The material properties
considered to be necessary for achieving success in hydroforming the ion-extraction grids are low carbon content, and high
ductility (small grain size). Table 5-1 compares these properties in a qualitative manner for the available molybdenum
types. Each type can be formed without difficulty to the
curvature required for the J-series thruster two-grid ion-
extraction-assembly design. Extension of the technology to three grids, as required for operation at lower specific impulse (increased thrust-to-power ratio), requires a greater elongation
of the material in the decel grid and the properties of the material are more critical. The types of molybdenum listed as "arc-cast" and "standard pressed-and-sintered" in Table 5-1 are not sufficiently ductile to enable the grids to be formed in a manner that minimizes differential stretching between the grids
(the forming-fixture configuration is shown in Figure 5-4) without fracture of the decel grid at the point of sharpest
curvature.
5.5.2 Application of the Photoresist Pattern It has been found that the dimensions of the apertures and
the aperture patterns of the photoresist applied to the grids by
the vendor that performs the chemical milling service may vary
from the specifications on a given order, even though the
114
1 I I 1 1 1 1 1 I 1 I 1 1 I I I 1 1 I
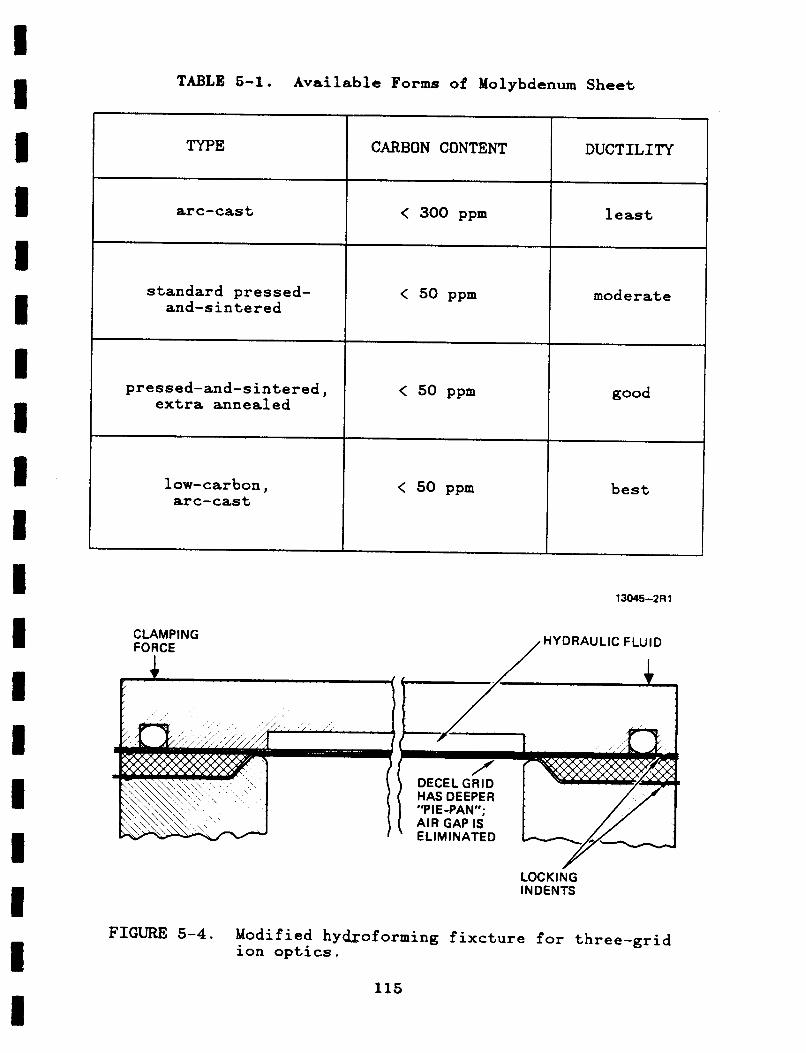
TABLE 5-1. Available Forms of Molybdenum Sheet
CARBON CONTENT
< 300 ppm
W E
arc-cast
standard pressed- and-sintered
pressed-and-sintered, extra annealed
low-carbon, arc-cas t
DUCTILITY
least
CLAMPING FORCE
< 50 ppm
< 50 ppm
moderate
good
< 50 ppm best
13045-2R 1
HYDRAULIC FLUID /
LOCKING INDENTS
FIGURE 5-4. Modified hydroforming fixcture for three-grid ion optics.
115
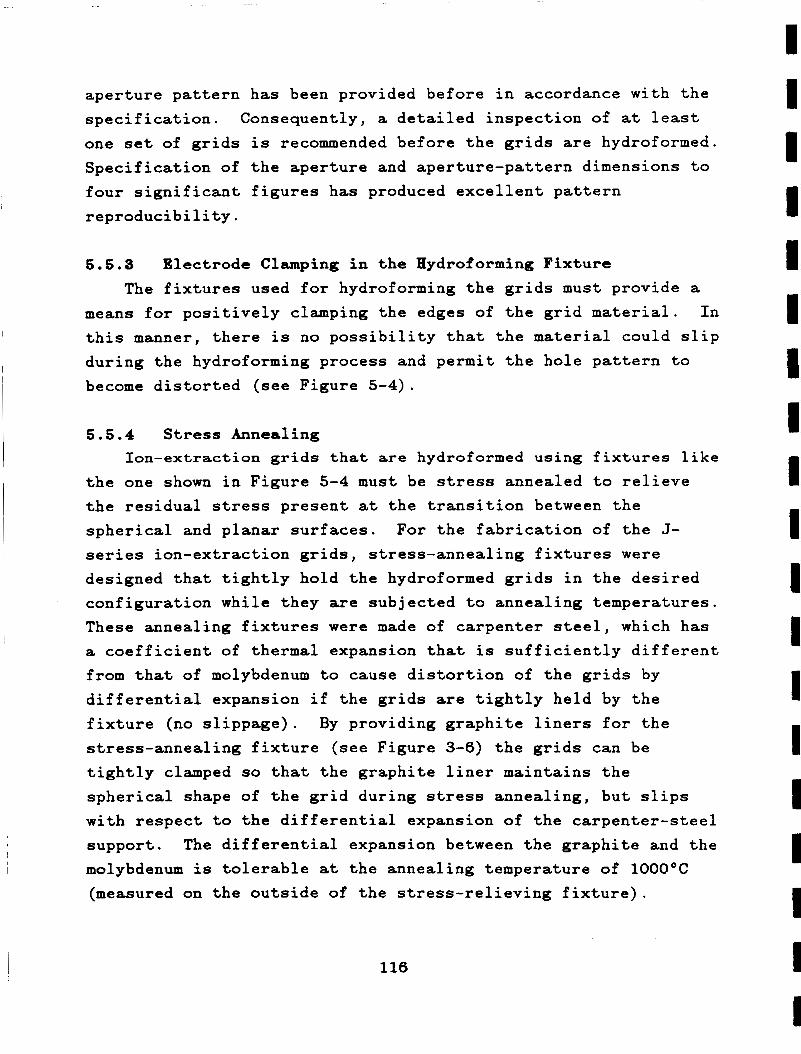
aperture pattern has been provided before in accordance with the
specification. Consequently, a detailed inspection of at least
one set of grids is recommended before the grids are hydroformed. Specification of the aperture and aperture-pattern dimensions to four significant figures has produced excellent pattern
reproducibility.
5.5 .3 Electrode Clamping in the Hydroforming Fixture The fixtures used for hydroforming the grids must provide a
means for positively clamping the edges of the grid material. In this manner, there is no possibility that the material could slip during the hydroforming process and permit the hole pattern to
become distorted (see Figure 5-4).
5.5.4 Stress Annealing Ion-extraction grids that are hydroformed using fixtures like
the one shown in Figure 5-4 must be stress annealed to relieve the residual stress present at the transition between the spherical and planar surfaces. For the fabrication of the J- series ion-extraction grids, stress-annealing fixtures were
designed that tightly hold the hydroformed grids in the desired configuration while they are subjected to annealing temperatures. These annealing fixtures were made of carpenter steel, which has
a coefficient of thermal expansion that is sufficiently different from that of molybdenum to cause distortion of the grids by differential expansion if the grids are tightly held by the fixture (no slippage). By providing graphite liners for the stress-annealing fixture (see Figure 3-6) the grids can be tightly clamped so that the graphite liner maintains the spherical shape of the grid during stress annealing, but slips
with respect to the differential expansion of the carpenter-steel support. The differential expansion between the graphite and the
molybdenum is tolerable at the annealing temperature of 1000°C (measured on the outside of the stress-relieving fixture).
116
1 1 I I 1 1 I I I I I 1 I I I I I I I
5-1.
5-2.
5-3.
5-4.
5-5.
REFERENCES
Lovell, R.R., et al, "30-Centimeter Ion Thrust Subsystem Design Manual," NASA TM-79191, NASA Lewis Research Center, Cleveland, Ohio, June 1975.
Collett, C.R. and Bechtel, R.T., "An Endurance Test of a 900 Series 30-cm Engineering Model Thruster," AIAA Paper No. 76-1020, Key Biscayne, Florida, November 1976.
Bechtel, R.T., Trump, G.E., and James, E.L., "Results of the Mission Profile Life Test," AIAA Paper No. 82-1905, New Orleans, Louisiana, November 1982.
Trump, G.E., et al, ,'An Electric Propulsion Long Term T e s t Facility," AIAA Paper No. 79-2080, Princeton, New Jersey, October 1979.
Mueller, L.A., "High Reliability Cathode Heaters for Ion Thrusters," AIAA Paper No. 76-1071, Key Biscayne, Florida, November 1976.
117
1
‘ I I I I I I 1 I U I 1 I I I I I
I I SECTION 6
ION-THRUSTER RELIABILITY
Marketing discussions with potential users of ion-propulsion technology invariably touch on the question of reliability; the designer wants to be assured that ion propulsion is at least as reliable as the chemical propulsion which it (typically)
replaces. The current practice within Hughes Space and
Communication Group is to require a qualification demonstration of at least 1.5 times the mission requirement. Consequently,
even with the low-duty-cycle requirement that North-South
stationkeeping of geosynchronous communications satellites imposes on a 30-cm-diameter mercury ion thruster, the
qualification time is on the order of 10,000 hours. Therefore, in any preliminary planning effort the potential customer needs
to be assured that lifetime is not an issue. We reviewed over sixty references dealing with ion-thruster
and component life tests and flight tests, with the objective of compiling data that could be used to demonstrate the reliability
of ion-propulsion technology to potential users. In performing
the literature survey, we evaluated three categories; thruster
endurance tests, component endurance tests, and thruster flight tests. The list of references that were used in the compilation are tabulated at the end of this section. The list is indexed according to test type, component, and related thruster size;
with the intent that new or additional test results could easily be added to the data base as they become available.
The compiled data include the accumulated number of operating hours and cycles, and the reasons for termination of testing. Table 6-1 summarizes the results, showing the number of life tests that have been conducted, the total number of
operating hours, and the total number of ON-OFF cycles for each of the three categories. The results show an impressive number
119
PRECEDING PAGE BLANK NOT FILMED
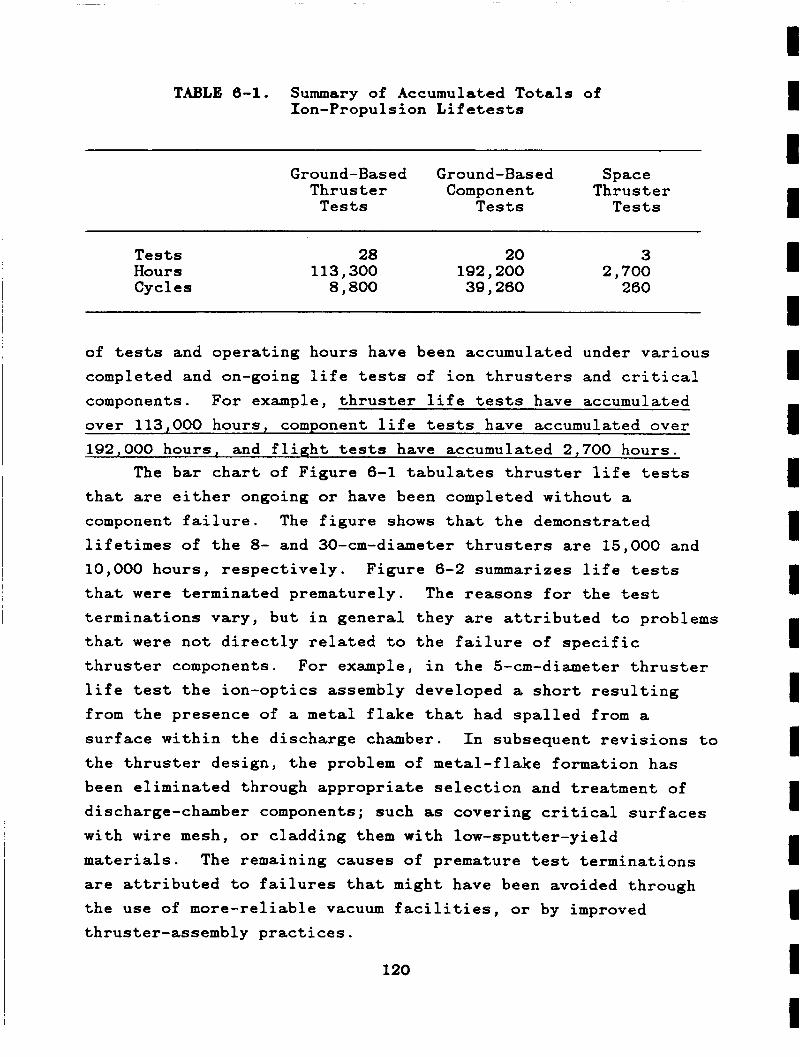
TABLE 6-1. Summary of Accumulated Totals of Ion-Propulsion Lifetests
Ground-Based Ground-Based Space Thruster Component Thruster Tests Tests Tests
Tests Hours Cycles
28 20 3 113,300 192,200 2,700 8,800 39,260 260
of tests and operating hours have been accumulated under various completed and on-going life tests of ion thrusters and critical components. For example, thruster life tests have accumulated over 113,000 hours, component life tests have accumulated over 192,000 hours, and flight tests have accumulated 2,700 hours.
The bar chart of Figure 6-1 tabulates thruster life tests that are either ongoing or have been completed without a component failure. The figure shows that the demonstrated
lifetimes of the 8- and 30-cm-diameter thrusters are 15,000 and 10,000 hours, respectively. Figure 6-2 summarizes life tests that were terminated prematurely. The reasons for the test terminations vary, but in general they are attributed to problems that were not directly related to the failure of specific thruster components. For example, in the 5-cm-diameter thruster
life test the ion-optics assembly developed a short resulting from the presence of a metal flake that had spalled from a surface within the discharge chamber. In subsequent revisions to
the thruster design, the problem of metal-flake formation has been eliminated through appropriate selection and treatment of discharge-chamber components; such as covering critical surfaces with wire mesh, or cladding them with low-sputter-yield materials. The remaining causes of premature test terminations are attributed to failures that might have been avoided through
the use of more-reliable vacuum facilities, or by improved thruster-assembly practices.
120
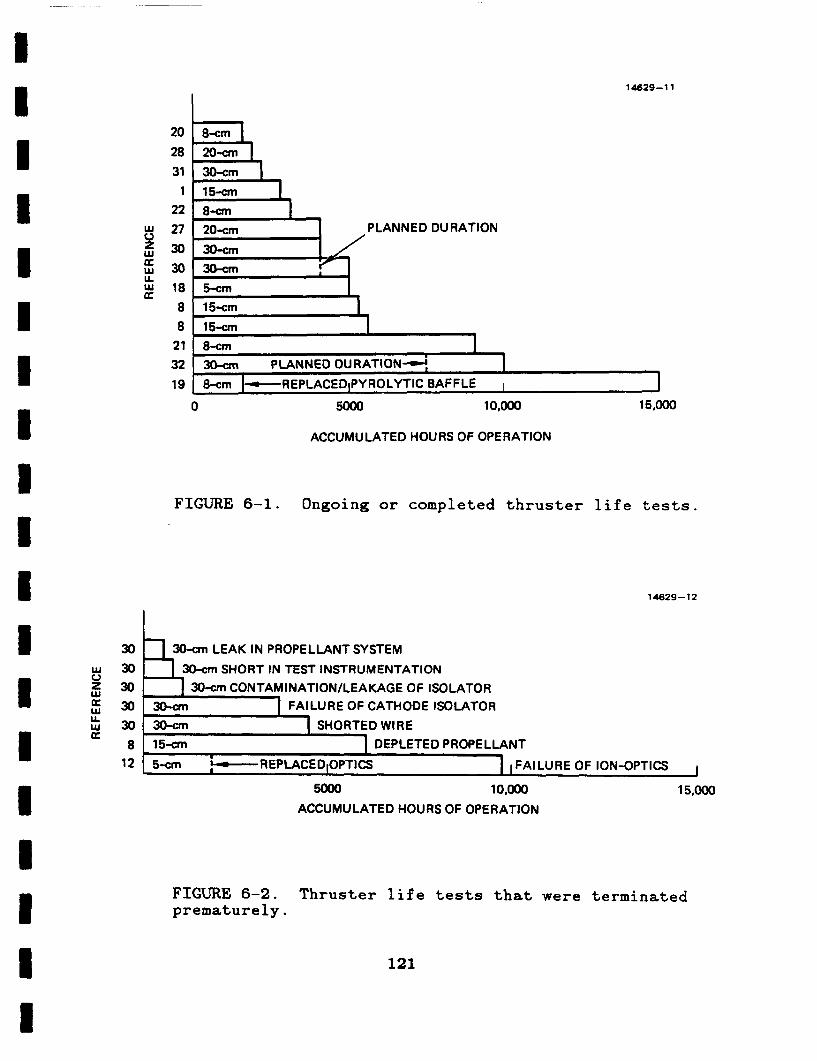
14629-1 1
w u z w W U w K
a
I 1 I
I I I
20
28 31
1 22 27
30 18 8 8
21 32 19
8-cm m-cm I 30-cm I 15-m 1 8 - m 20-cm PLANNED DURATION
30- 3o-m 5-cm 15-cm 1
4
15- I 8-cm 1 30- PUNNED DURATION&, 1 8-cm 1-REPLACED~PYROLYTIC BAFFLE I I
0 5ooo 10.oO0 15,000
ACCUMULATED HOURS OF OPERATION
FIGURE 6-1. Ongoing or completed thruster life tests.
14629- 12
30 h 30- LEAK IN PROPELLANT SYSTEM w 30 I ~3O-cmSHORTINTESTlNSTRUMENTATlON
OF ISOLATOR FAILURE OF CATHODE ISOLATOR
w 30 30- SHORTED WIRE U
K 8 15- 1 DEPLETED PROPELLANT
12 5-cm -REPLACED~OPTICS 1 I FAILURE OF ION-OPTICS 1 5ooo 1 0 , m 15,000
ACCUMULATED HOURS OF OPERATION
FIGURE 6-2. Thruster life tests that were terminated prematurely.
121
6.1 FLIGHT-TEST REFERENCES
1. Kerslake, W.R. and Ignaczak, L.R., "SERT I1 Extended Flight Thruster Experiments," AIAA 81-0665, April 1981.
2. Kerslake, W.R. and Ignaczak, L.R., "SERT I1 1979 Extended Flight Thruster System Performance," AIAA 79-2063, October 1979.
3. Kerslake, W.R. and Ignacaak, L.R., "Status of SERT I1 Spacecraft and Ion Thrusters," NASA TM X-78827 and AIAA 78-622, April 1978.
4. Kerslake, W.R., "Status of SERT I1 Thrusters and Spacecraft - 1976," NASA TM X-73501 and AIAA 76-1601, November 1976.
5. Kerslake, W.R. and Finke, R.C., "SERT I1 Thruster Space Restart - 1974," NASA TM X-71651 and AIAA 75-365, March 1975.
6. Cohen, H . A . and Mullen, E.G., "The Sounding Rocket Flight of a Satellite Positive Ion Beam System," AIAA 79-2068, October 1979.
7. Cohen, H.A., Huber, W.B., and Masek, T., "Preparation, Integration and Initial Operations of SPIBS on the P78-2 Satellite," AIAA 79-2069, October 1979.
8. Kerslake, W.R., Goldman, R.G., and Nieberding, W.C., "SERT 11: Mission Thruster Performance and In-Flight Thrust Measurements" J . Spacecraft and Rockets, Vol. 8, N o . 3, March 1971, pp. 213-224.
9. Ignaczak, L.R., Stevens, N . J . , and LeRoy, B.E., "Performance of the SERT I1 Spacecraft after 4 1/2 Years in Space," NASA TM X-71632, November 1974.
6.2 THRUSTER LIFE-TEST REFERENCES
6.2.1 5-cm-Diameter Thruster
10. Power, J.L., "Sputter Erosion and Deposition in the Discharge Chamber of a Small Mercury Ion Thruster," NASA TM X-71424 and AIAA 73-1109, October 1973.
11. Nakanishi, S. and Finke, R.C., "A 9700-Hour Durability Test of a Five-Centimeter Diameter Ion Thruster," NASA TM X-68284 and AIAA 73-1111, October 1973.
122
I 1 I I 1 I I 1 I 1 1 1 I I I I 1 I I
-
12.
13.
14.
15.
16.
17.
18.
6.2.2.
19.
20.
21.
22.
6.2.8
23.
Nakanishi, S. and Finke, R.C., "A 9700-Hour Durability Test of a Five-Centimeter Diameter Ion Thruster,I1 J. Spacecraft and Rockets, Vol. 11, No. 8, August 1974, pp.560-566.
Hyman, J., "Performance Optimized Small Structurally Integrated Ion Thruster System," NASA CR-121183, Hughes Research Laboratories, May 1973.
Lathem, W.C., "5000-Hour Test of a Grid-Translation Beam-Deflection System for a 5-cm Diameter Kaufman Thruster, NASA TM X-68185, January 1973.
Power, J.L., "Accelerated Life Test of Sputtering and Anode Deposit Spalling in a Small Mercury Ion Thruster," NASA TM X-3269, September 1975.
Nakanishi, S., "Durability Tests of a 5-cm-Diam Ion Thruster System," J. Spacecraft and Rockets, Vol. 11, No. 9, September 1974, pp. 669-671.
Nakanishi, S. "Durability Tests of a Five-Centimeter Diameter Ion Thruster System," NASA TM X-68132 and AIAA 72-1151, December 1972.
Nakanishi, S. and Finke, R . C . , l'A 2000-Hour Durability Test of a 5-cm Diameter Mercury Bombardment Ion Thruster," NASA TM X-68155, October 1972.
8-cm-Diameter Thruster
Nakanishi, S., "A 15,000-Hour Cyclic Endurance Test of an 8-Centimeter-Diameter Electron Bombardment Mercury Ion Thruster, l1 NASA TM X-73508 and A I M 76-1022, November 1976.
Mantenieks, M.A. and Wintucky, E.G., "5200 Cycle Test of an 8-cm Diameter Hg Ion Thruster," NASA TM X-78860 and AIAA 78-649, April 1978.
Dulgeroff, C.R., Beattie, J.R., Poeschel, R . L . , and Hyman, J., "IAPS (8-cm) Ion Thruster Cyclic Endurance Test," IEPC Paper No. 84-37, Tokyo, Japan, May 1984.
Rawlin, V.K., Private Communication, November, 1984.
15-cm-Diameter Thruster
Anon., "Development and Test of an Ion Engine System Employing Modular Power Conditioning," NASA CR-80515, Hughes Aircraft Company, August 1966.
123

24.
25.
26.
I
I 6.2.4
27.
28.
6.2.5
I 29.
30.
31.
32.
33.
34.
35.
Knauer, W . , Poeschel, R.L., King, H.J., and Ward, J.W., "Discharge Chamber Studies for Mercury Bombardment Thrusters," NASA CR-72440, Hughes Research Laboratories, September 1968.
Rulis, R.J., "SERT 11: Design Requirements for Integrating Electric Propulsion into Spacecraft," J. Spacecraft and Rockets, Vol. 8, No. 3, March 1971, pp. 209-213.
Rawlin, V.K. and Kerslake, W.R., "Durability of the SERT I1 Hollow Cathode and Future Applications of Hollow Cathodes, A I M 69-304, March 1969.
20-cm-Diameter Thruster
King, H.J., Eckhardt, W . O . , Ward, J.W., and Knecthli, R.C., "Electron Bombardment Thrusters Using Liquid Mercury Cathodes," J. Spacecraft and Rockets, Vol. 4, No. 5, May 1967, pp. 599-602.
Masek, T.D., "SEP Thrust Subsystem Development," JPL TR 32-1579, March 1973.
30-cm-Diameter Thruster
James, E.L. and Bechtel, R.T., "Results of the Mission Profile Life Test First Test Segment: Thruster J1,Il AIAA 81-0716, April 1981.
Bechtel, R.T., Trump, G.E., and James, E.L., "Results of the Mission Profile Life Test," A I M 82-1905, November 1982.
Mantenieks, M.A. and Rawlin, V.K., "Sputtering Phenomena of Discharge Chamber Components in a 30-cm Diameter Hg Ion Thruster," NASA TM X-73533 and A I M 76-988, November 1976.
Collett, C.R. and Poeschel, R.L., "A 10,000-Hour Endurance Test of a 700 Series 30-cm Engineering Model Thruster," A I M 76-1019, November 1976.
Collett, C.R. and Bechtel, R.T., l r A n Endurance Test of a 900 Series 30-cm Engineering Model Ion Thruster," AIAA 76-1020, November 1976.
Collett, C.R., "A 7700 Hour Endurance Test of a 30-cm Kaufman Thruster," A M 75-366, March 1975.
Mantenieks, M.A. and Rawlin, V.K., "Studies of Internal Sputtering in a 30-cm Ion Thruster," NASA TM X-71654 and A I M 75-400, March 1975.
I 1 1 I I I 1 1 I 1 1 I 1 I I I I I I
124
36.
37.
38.
39.
40.
6.3
6.3.1
41.
42.
43.
44.
45.
46.
47.
6.3.2
Collett, C.R., "Endurance Testing of a 30-cm Kaufman Thruster," AIAA 73-1085, October 1973.
Bechtel, R.T. and James, E.L., "Preliminary Results of the Mission Profile Life Test," AIAA 79-2078, October 1979.
King, H.J. and Poeschel, R.L., "A 30-cm Mercury Ion Thruster," J. Spacecraft and Rockets, Vol. 8, No. 4, April 1971, pp. 420-423.
King, H . J . and Poeschel, R.L., l r A n Ion Thruster Module for Primary Propulsion Systems," J. of British Interplanetary Society, Vol. 26, 1973, pp. 203-219.
Bechtel, R.T. and Dulgeroff, C.R., "J Series Thruster Thermal Test Results," AIAA 82-1906, November 1982.
COMPONENT LIFE-TEST REFERENCES
5-cm-Diameter Thruster
Wintucky, E.G., "A 20,000-Hour Endurance Test of a Structurally and Thermally Integrated 5-cm Diameter Ion Thruster Main Cathode," NASA TM X-71600 and AIAA 75-368, March 1975.
Lathem, W.C., "1000-Hour Test of a Dual Grid, Electrostatic Beam Deflection System on a 5-Centimeter- Diameter Kaufman Thruster, NASA TM X-67907, August 1971.
Lathem, W.C., "A Single-Axis Electrostatic Beam Deflection System for a 5-cm Diameter Ion Thruster,II NASA TM X-68133, September 1972.
Hudson, W.R. and Weigland, A.J., "Hollow Cathodes with BaO Impreganted, Porous Tungsten Inserts and Tips, l1 NASA TM X-71417 and AIAA 73-1142, October 1973.
Wintucky, E.G., "High Voltage Pulse Ignition of Mercury Discharge Hollow Cathodes," NASA TM X-71425 and AIAA 73-1140, October 1973.
Zuccaro, D., "Mercury Vapor Hollow Cathode Component Studies," AIAA 73-1141, October 1973.
Weigand, A.J., "5-cm Diameter Ion Thruster Development Program Summary," NASA TM X-68110, July 1972.
8-cm-Diameter Thruster
125

4 8 .
49.
50.
51.
6.3.3
52.
6.3 .4
53.
54.
55.
56.
57 .
58.
6.4
59.
Wintucky, E.G., "Cycle Life Testing of 8-cm Mercury Ion Thruster Cathodes," NASA TM X-73526 and AIAA 76-986, November 1976.
Williamson, W.S., Dulgeroff, C.R., and Williams, R.L., "8-cm Engineering Model Thruster Technology; A Review of Recent Developments," AIAA 79-2103, October 1979.
Williamson, W.S., Private Communication, April 1983.
Power, J . L . and Hiznay, D.J., "Solutions for Discharge Chamber Sputtering and Anode Deposit Spalling in Small Mercury Ion Thrusters," NASA TM X-71675 and AIAA 75-399, March 1975.
15-cm-Diameter Thruster
Rawlin, V.K., "A 13,000-Hour Test of a Mercury Hollow Cathode," NASA TM X-2785, June 1973.
30-cm-Diameter Thruster
Mirtich, M.J. and Kerslake, W.R., "Long Lifetime Hollow Cathodes for 30-cm Mercury Ion Thrusters,ll NASA TM X- 73523 and AIAA 76-985, November 1976.
Mueller, L.A., "High Reliability Cathode Heaters for Ion Thrusters," NASA TM X-73538 and AIAA 76-1071, Nov,ember 1976.
Mirtich, M.J. , "Investigation of Hollow Cathode Performance f o r 30-cm Thrusters," AIAA 73-1138, October 1973.
Mantenieks, M . A . , "Investigations of Mercury Isolators,11 AIAA 73-1088, October 1973.
Rawlin, V.K., "Studies of Dished Accelerator Grids for 30-cm Ion Thrusters," A I M 73-1085, October 1973.
Campbell, J.W., Bechtel, R.T., and Brophy, J . , IIJ Series Thruster Isolator Failure Analysis," AIAA 82-1907, November 1982.
LIFETEST BIBLIOGRAPHY
Krulle, G., Zeyfang, E., and Birner, W., "Recent Tests Performed for the Design Verification of RIT-10 Engineering Models,11 AIAA 79-2102, October 1979.
126
I 1 I I I 1 I I I I I I 1 I I I I I I
1 8 I
60. Pinks, W . and Krulle, G., "Performance Mapping and Lifetime Investigations of Thruster Components with Reference to the Development of a RIT-10 Flight- Prototype," AIAA 79-2115, October 1979.
61. Mantenieks, M.A., "Mercury Ion Thruster Component Testing," A I M 79-2116, October 1979.
62. Bassner, H.F. and Klein, W.U., "Orbit Control of the German TV-Satellite by the RITA-Subsystem, AIAA 81-0663, April 1981.
63. Hudson, W . and Vondra, R.J., "Electric Propulsion Research and Technology in the U.S.," AIAA 82-1867, November 1982.
64. Nakamura, Y., "Electric Propulsion Programs in Japan, ') AIAA 82-1868, November 1982.
I I I I 1 I I I
127
SECTION 7 CONCLUSIONS
Significant progress in advancing the understanding of mercury-ion-thruster systems and technology has been achieved
under this program. Major accomplishments include the following key results:
Major simplification and weight reduction of the ring- cusp discharge chamber.
Improved performance of the optimized ring-cusp configuration; the baseline beam-ion-production cost of the optimized configuration was reduced to E ; 130 eV/ion. At a discharge propellant-utilization efficiency of 95%, the beam-ion-production cost was reduced to about 155 eV/ion, representing a reduction of about 40 eV/ion over the corresponding value for the J- series thruster.
Comprehensive Langmuir-probe surveys were conducted in the J-series thruster for the first time.
Development of a volume-averaging scheme to analyze Langmuir probe data provided valuable insight into identifying the dominant plasma processes prevailing in the ring-cusp and J-series thrusters. Good correlation of the average Maxwellian-electron temperature with thruster performance was achieved. The outstanding performance characteristics of the ring-cusp thruster were correlated with a higher Maxwellian-electron temperature than that which exists in the J-series thruster.
The technology of fabricating ion-extraction electrodes was advanced by improving materials-selection criteria, hydroforming and stress-relieving tooling, and fabrication procedures.
An assessment of the technology readiness of the J- series thruster was completed; the major remaining technology issue is the baffle and pole-piece erosion with subsequent deposition of material onto the cathode keeper and its supporting structure.
A simplified power processor was used to successfully operate an 8-cm thruster that is functionally equivalent to the Ion Auxiliary Propulsion System (IAPS) thrusters.
129
PRECEDING PAGE BLANK NOT FILMED
APPENDIX A
VACUUM TEST FACILITY
Testing under this contract was performed in the 3-m-
diameter vacuum chamber illustrated in Figure A-1. This chamber is pumped by a combination of two liquid-helium cryopumps, an oil-diffusion pump, and a liquid-nitrogen-cooled cryoliner; its ultimate pressure is less than 5 ~ 1 0 ' ~ Pa (4~10'~ Torr). During
thruster testing with mercury propellant, only the diffusion
pump and the cryoliner are used. Testing with inert gases such
as xenon is accomplished using the cryopumps and the cryoliner, with the diffusion pump isolated from the vacuum chamber using a pneumatic gate valve. The facility pumping speed for xenon is about 50,000 l/s.
A graphite-covered disc located about 5 m from the thruster exit plane is used to collect the thrust beam. Water cooling of this collector allows absorption of over 10 kW of beam power, and the graphite coating minimizes backsputtering.
The vacuum chamber is equipped with a wide variety of diagnostic equipment. A quadrupole residual gas analyzer is used to monitor vacuum-chamber impurities, and an optical
monochromator is used to monitor line intensities of excited atoms produced in the discharge chamber. An ExB probe is used to measure the s i n g l y and doubly charged fraction of beam ions
and to measure off-axis thrust loss. includes near- and far-field Faraday probes for measuring the
current density profile in the ion beam and for measuring beam- divergence angles.
obtained using a computer-controlled Langmuir probe and data- acquisition system.
Other diagnostic equipment
Discharge-chamber plasma properties are
131
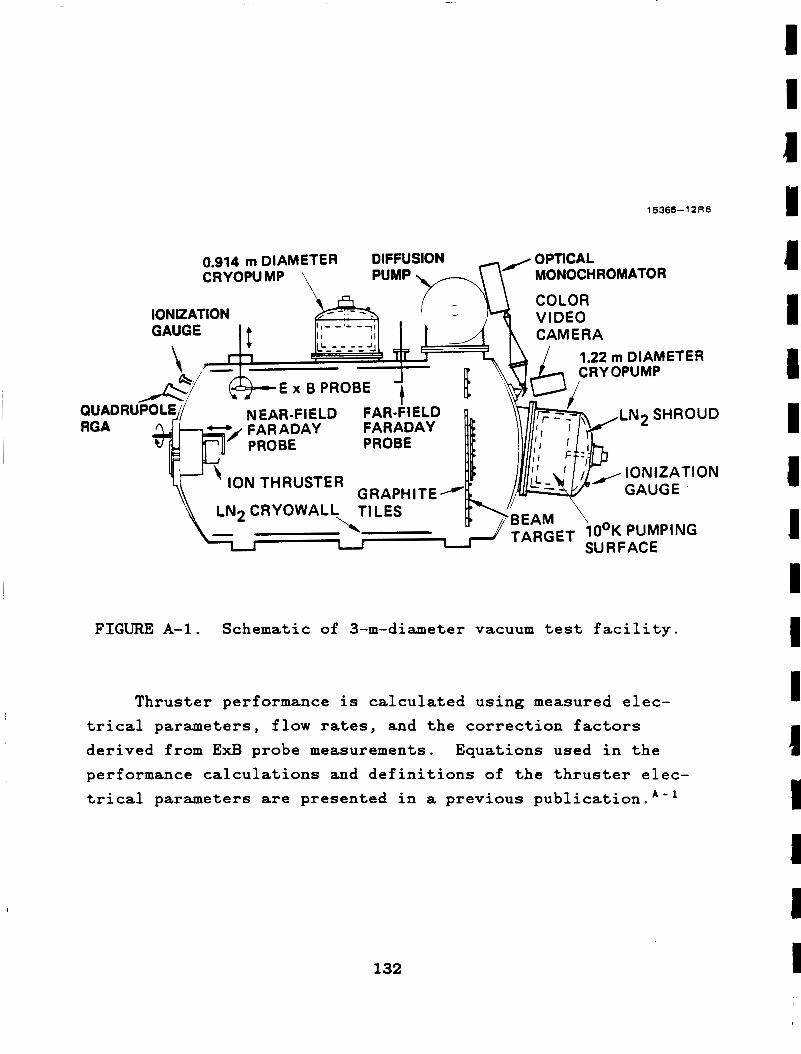
1 5365- 12R6
0.914 m DIAMETER DIFFUSION / OPTICAL CRYOPUMP \ PUMP -n MONOCHROMATOR
U W L U I I
VIDEO CAM ERA - 1 1 I , - - , & .
I I II LL-- ---- -JJ
IONIZATION GAUGE
- - 1 / 1.22mDlAMETER t
IY OPUMP 1 1 7
QUADRUPOLE / NEAR-FIELD FAR-FIELD RGA d-1 FARADAY FARADAY
ml' PROBE PROBE RR
GRAPHITE - GAUGE yp ION THRUSTER
IAHUET l O o K PUMPING SU R FACE
FIGURE A-1. Schematic of 3-m-diameter vacuum test facility.
Thruster performance is calculated using measured elec-
trical parameters, flow rates, and the correction factors derived from ExB probe measurements. Equations used in the performance calculations and definitions of the thruster elec- trical parameters are presented in a previous publication.A''
132
I 1 1 1 1 1 I I J I I I I 1 I I I I
REFERENCES
A-1 . Beattie, J.R., "Extended Performance Technology Study - R
1 1
3 0 - c m Thruster", NASA CR-168259, Hughes Research Laboratories, Malibu, California, June 1983. 1
133
APPENDIX B
RING-CUSP THRUSTER OPTIMIZATION
The final ring-cusp thruster configuration, whose
performance and operating characteristics were described in
Section 2, evolved as a result of a systematic investigation aimed at simplifying the original Sovey design, while at the same
time maintaining its high level of performance. Figure B-1 summarizes the different thruster configurations that were evaluated. A descriptive summary of each design modification is presented in the sections below. For clarity, Table B-1 lists the various thruster configurations and the baseline beam-ion-
production cost measured for each configuration.
B.l CONFIGURATION NO. 1 This configuration is similar to the original argon-thruster
design of Sovey, with the exception that the discharge chamber was scaled in length from 24 cm to 20 cm to compensate for the higher atomic mass (longer residence time) of mercury atoms.
8.2 CONFIGURATION NO. 2 This initial modification to the original ring-cusp thruster
(Configuration No. 1) involved the removal of the cathode pole piece and cathode magnet ring. A comparison of the magnetic field with and without the cathode-magnet assembly indicated its effectiveness in ttpushing'l the magnetic-field contour lines
downstream toward the ion-extraction assembly and producing a gradient in the magnetic field near the cathode orifice.
Thruster operation with the cathode-magnet assembly removed resulted in no observed damage to the "unprotectedt' cathode,
however the performance w a s poorer than that achieved with Configuration No. 1. The cause of the performance loss was
135
PRECEDING PAGE BLANK NOT FILMED
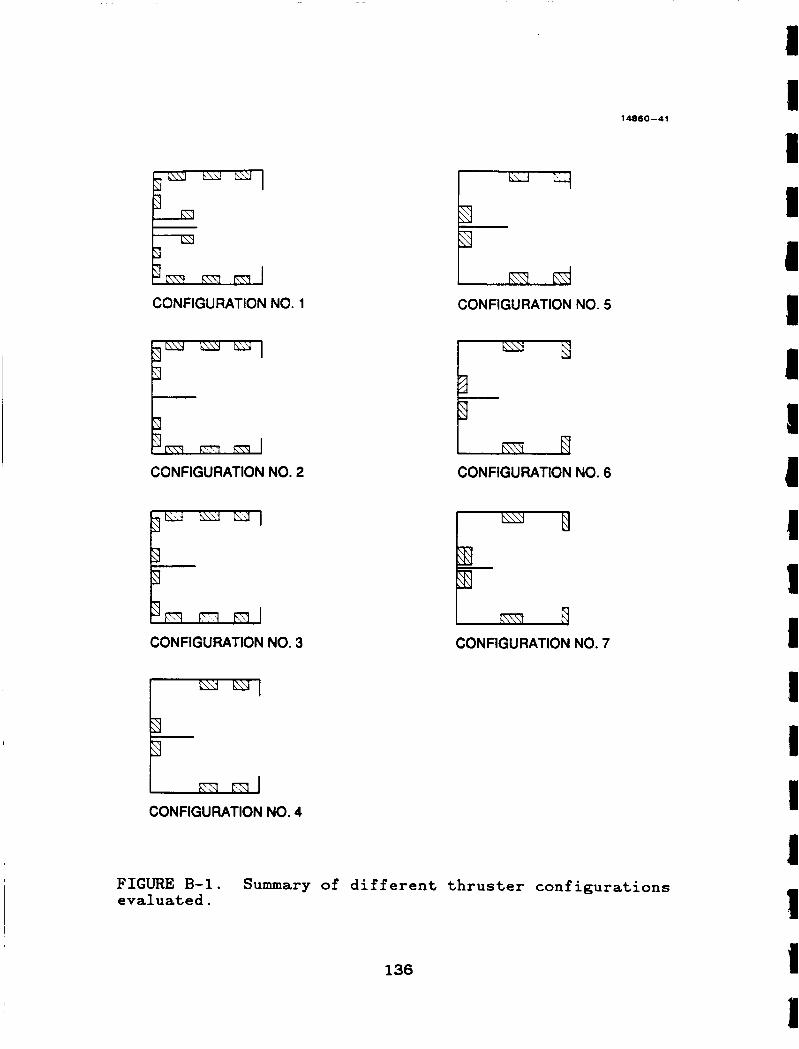
Fs I
CONFIGURATION NO. 1
L CONFIGURATION NO. 2
I- m m s¶]
CONFIGURATION NO. 3
P I CONFIGURATION NO. 4
1 CONFIGURATION NO. 5
CONFIGURATION NO. 6
u CONFIGURATION NO. 7
10860-41
FIGURE B-1. evaluated.
Summary of different thruster configurations
136
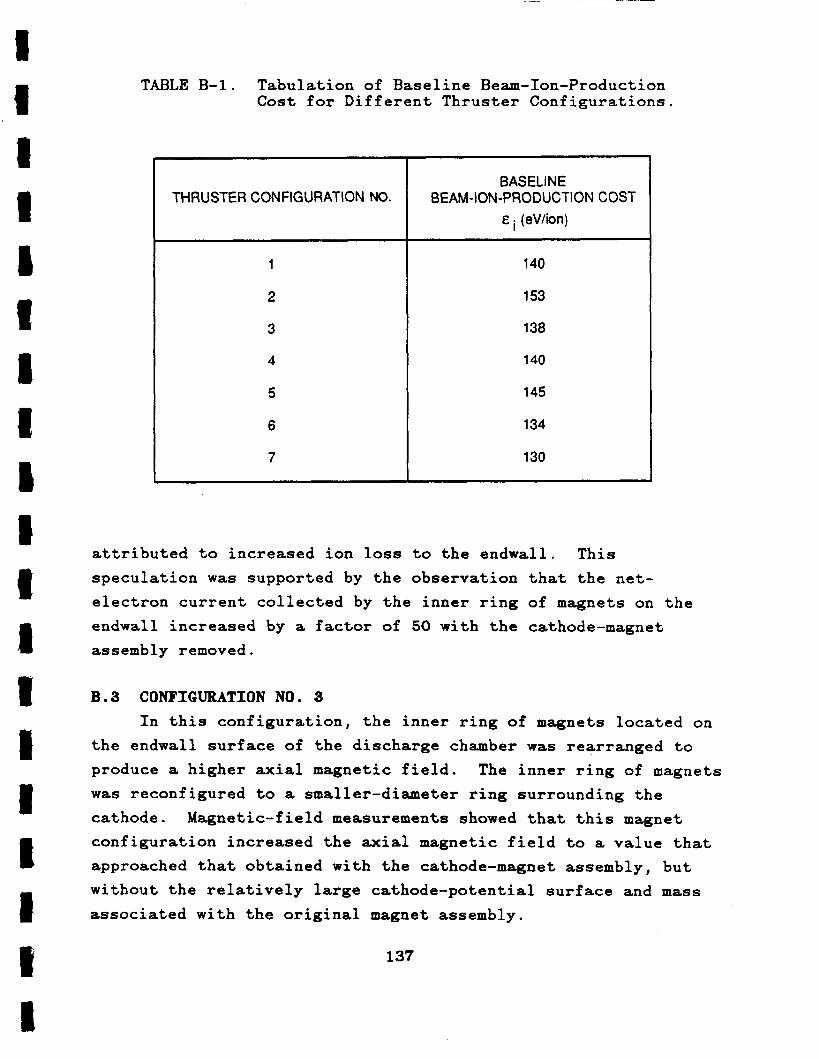
TABLE B-1. Tabulation of Baseline Beam-Ion-Production Cost for Different Thruster Configurations.
I BAS ELI NE
E (eV/ion) THRUSTER CONFIGURATION NO. BEAM-ION-PRODUCTION COST
1 140
2 153
3 138
4 140
5 145
6 134
7 130
attributed to increased ion loss to the endwall. This speculation was supported by the observation that the net- electron current collected by the inner ring of magnets on the endwall increased by a factor of 50 with the cathode-magnet assembly removed.
B.3 CONFIGURATION NO. 3 In this configuration, the inner ring of magnets located on
the endwall surface of the discharge chamber was rearranged to produce a higher axial magnetic field. was reconfigured to a smaller-diameter ring surrounding the
cathode. configuration increased the axial magnetic field to a value that approached that obtained with the cathode-magnet assembly, but without the relatively large cathode-potential surface and mass
associated with the original magnet assembly.
The inner ring of magnets
Magnetic-field measurements showed that this magnet
137
Thruster performance was improved relative to the previous
configuration, verifying that with the cathode-magnet assembly removed a performance gain could be achieved with a reduced-mass
configuration by simple rearrangemenet of the endwall magnets.
B . 4 CONFIGURATION NO. 4 The two corner-magnet rings were removed in this
configuration, giving rise to an additional simplification and mass savings. Previous thruster measurements indicated that the
location of the ion-production region was downstream of the cathode, toward the ion-extraction assembly. On the basis of
this result, the two corner-magnet rings were removed.
Thruster performance was essentially unchanged from the previous configuration, verifying that the two corner-magnet
rings were sufficiently far removed from the ion-production region to have an influence.
B . 5 CONFIGURATION NO. 5 In this configuration, the position of the downstream magnet
ring was changed so that it was located next to the anode pole piece. The intent was to confine the magnetic field closer to
the chamber boundary in the region near the ion-extraction assembly. chamber indicated a weaker field strength near the screen
electrode, and there was a significant degradation in thruster
performance compared to the previous configuration. Electrode- current measurements indicated that the performance degradation
was due to a net-ion loss to the sidewall/endwall (most likely
the pole piece) surface.
Magnetic-field measurements within the discharge
B . 6 CONFIGURATION NO. 6 The downstream magnet ring was rotated by 90'. In light of
the previous result of degraded thruster performance, it was
speculated that magnetically shielding the anode pole piece with
a l'rotatedtl magnet ring might reduce the net-ion loss to the
138
1 I I 1 I 1 1 1 I I 1 1 I I 1 1 1 P I
anode pole piece if this was the cause of the performance loss in the previous configuration. Magnetic-field measurements
indicated improved field confinement near the pole piece.
There was a significant improvement in both thruster performance and beam-profile uniformity. Electrode-current
measurements indicated a very small net-ion loss to the sidewall/endwall surface.
8.7 CONFIGURATION NO. 7
A second layer of magnets was added to the endwall-magnet ring. The intent was to "push" the ion-production region further
downstream toward the ion-extraction assembly, thereby improving
thruster performance. Measurements of the magnetic-field distribution indicated that the magnetic-field contour lines were
located further downstream. In addition, the contour lines were
better confined along the chamber boundary. and beam uniformity were improved.
The optimum position of the midstream magnet
Thruster performance
ring, and the minimum wall thickness required for optimum
thruster performance, were studied under a related programB' .
139

REFERENCES
B-1. Beattie, J.R., and Matossian, J.N., "Inert Gas Thruster Technology", Final Report NAS 3-23860, Hughes Research Laboratories, Malibu, California.
140
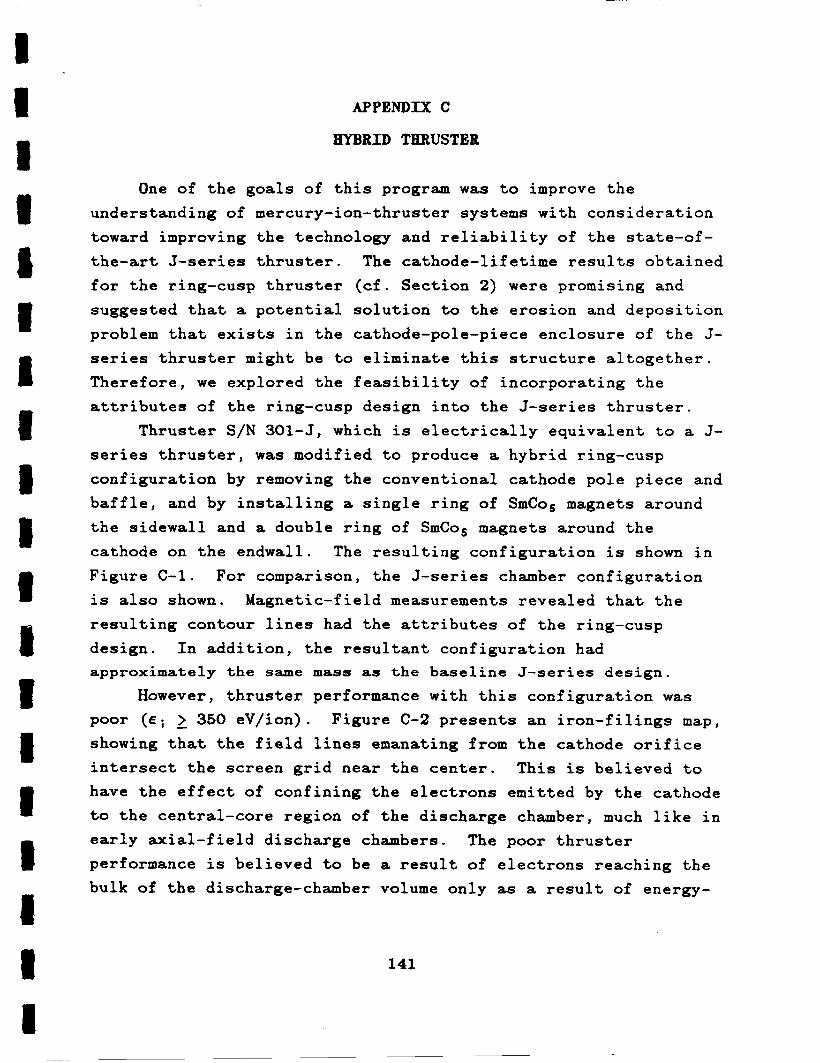
APPENDIX C
HYBRID THRUSTER
One of the goals of this program was to improve the
understanding of mercury-ion-thruster systems with consideration
toward improving the technology and reliability of the state-of- the-art J-series thruster. The cathode-lifetime results obtained for the ring-cusp thruster (cf. Section 2) were promising and suggested that a potential solution to the erosion and deposition
problem that exists in the cathode-pole-piece enclosure of the J- series thruster might be to eliminate this structure altogether.
Therefore, we explored the feasibility of incorporating the attributes of the ring-cusp design into the J-series thruster.
Thruster S / N 301-5, which is electrically equivalent to a J- series thruster, was modified to produce a hybrid ring-cusp
configuration by removing the conventional cathode pole piece and
baffle, and by installing a single ring of SmCoS magnets around the sidewall and a double ring of SmCos magnets around the cathode on the endwall. The resulting configuration is shown in
Figure C-1. For comparison, the J-series chamber configuration is also shown. Magnetic-field measurements revealed that the
resulting contour lines had the attributes of the ring-cusp design. In addition, the resultant configuration had approximately the same m a s s as the baseline J-series design.
However, thruster performance with this configuration was poor ( e i > 350 eV/ion). Figure C-2 presents an iron-filings map, showing that the field lines emanating from the cathode orifice intersect the screen grid near the center. This is believed to have the effect of confining the electrons emitted by the cathode to the central-core region of the discharge chamber, much like in early axial-field discharge chambers. The poor thruster
performance is believed to be a result of electrons reaching the bulk of the discharge-chamber volume only as a result of energy-
141
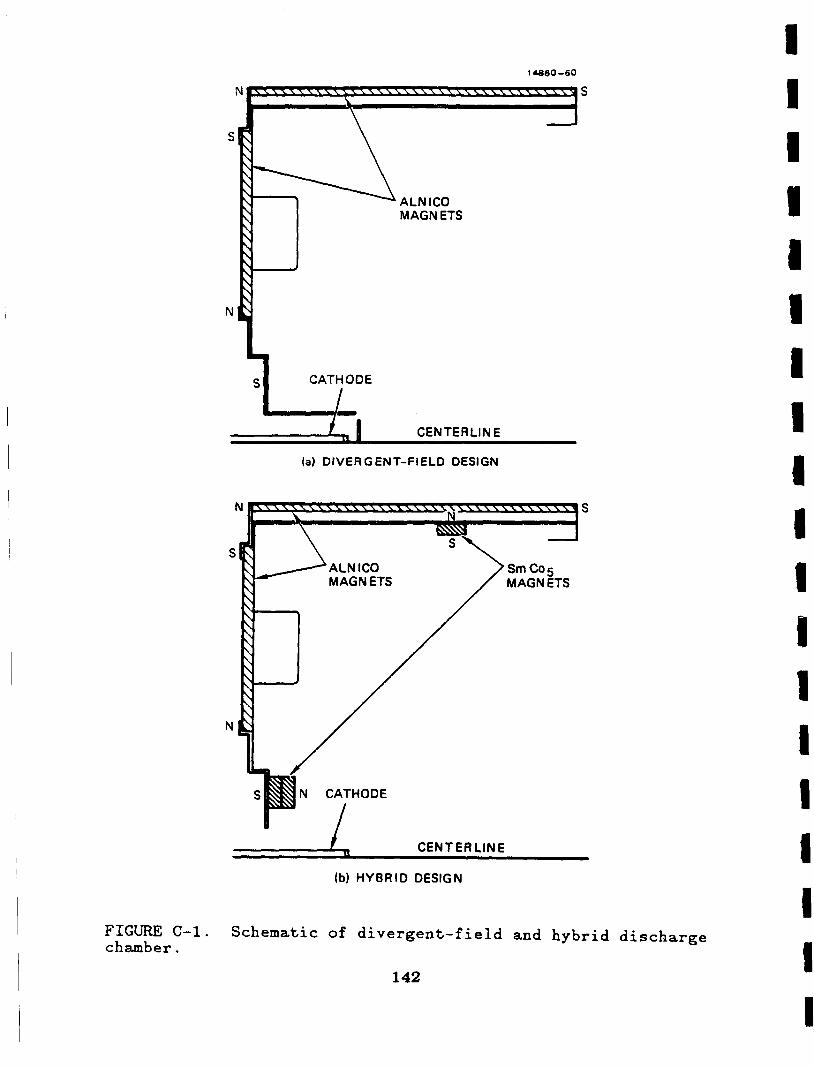
14880-60
S
S
N
CATHODE f! 2 1 CENTERLIN E
(a) DIVERGENT-FIELD DESIGN
S
CENTER LIN E
(b) HYBRID DESIGN
FIGURE C-1. chamber.
Schematic of divergent-field and hybrid discharge
142
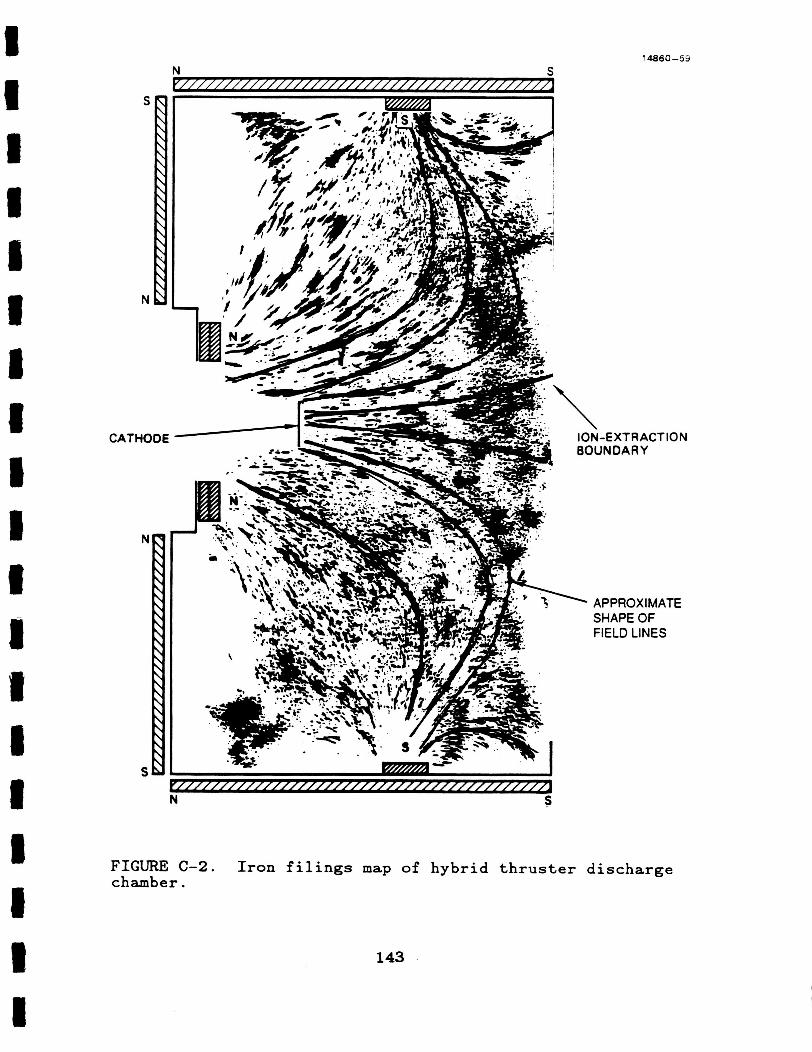
S 4 4 \
4 4 \ 4 4 4 4 \ \ \ \ \ \ \ \ \ \
N 2
CATHODE
FIGURE C-2. chamber.
Iron filings map of hybrid thruster discharge
143
14860-53
\ ION-EXTRACTION BOUNDARY
APPROXIMATE SHAPE OF FIELD LINES
depleting collisions. This argument is supported by the observation (that was made after the test) that the upstream side
of the screen grid had a bright-appearing region that extended over the center part of the grid (a diameter of about 7 to 10 cm), suggesting the existence of an intense plasma in this region.
A Langmuir-probe survey revealed that the plasma in the hybrid thruster was characterized by low electron temperature and plasma potential. The results also indicated that the plasma was confined to the region near the chamber axis, confirming our speculation based on the iron-filings map and the appearance of the screen grid.
144
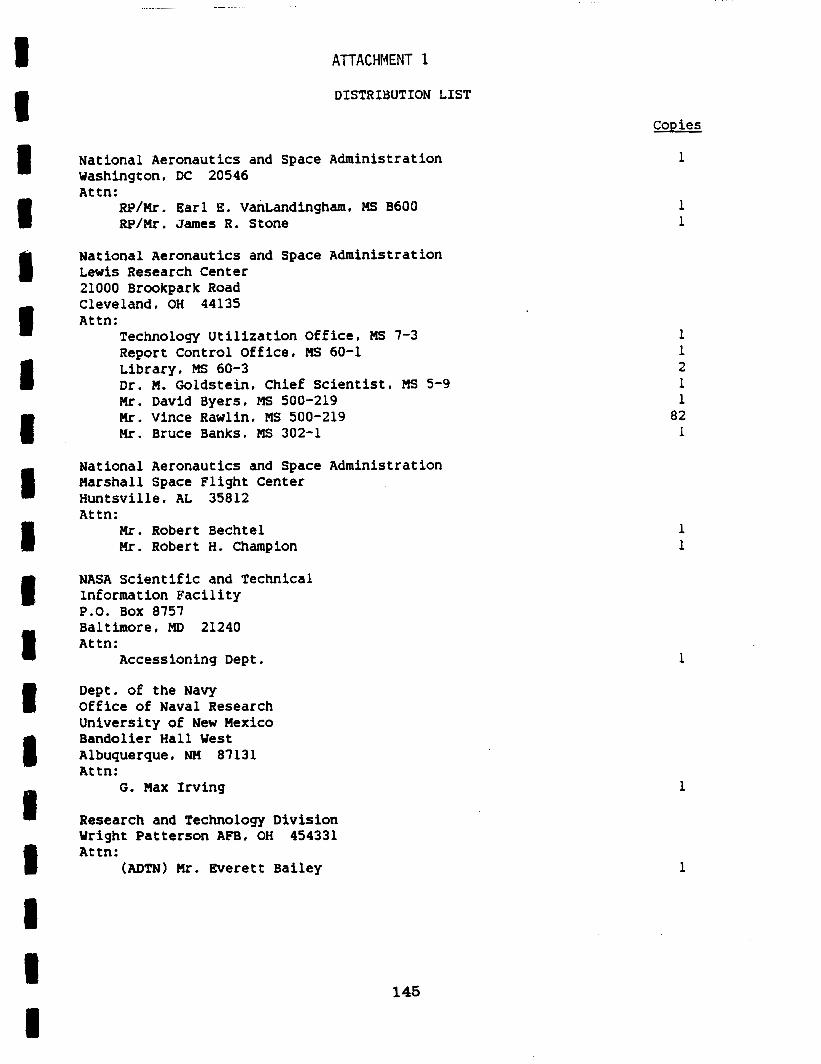
8 m 8 1 I
I I I I 1 I I I I 1 I R I
n
ATTACHMENT 1
DISTRIBUTION LIST
Nationa Aeronautics and Space Administration Washington, DC 20546 Attn:
RP/Mr. Earl E. VanLandingham, MS B600 RP/Mr. James R. Stone
National Aeronautics and Space Administration Lewis Research Center 21000 Brookpark Road Cleveland, OH 44135 Attn:
Technology Utilization Office, MS 7-3 Report Control Office, MS 60-1 Library, MS 60-3 Dr. M . Goldstein, Chief Scientist, MS 5-59 Mr. David Byers, MS 500-219 Mr. Vince Rawlin, MS 500-219 Mr. Bruce Banks, MS 302-1
National Aeronautics and Space Administration Marshall Space Flight Center Huntsville. AL 35812 Attn:
Mr. Robert Bechtel Mr. Robert H. Champion
NASA Scientific and Technical lnformation Facility P . O . Box 8757 Baltimore, MD 21240 Attn:
Accessioning Dept.
Dept. of the Navy Office of Naval Research University of New Mexico Bandolier Hall West Albuquerque, NM 87131 At tn:
G. Max Irving
Research and Technology Division Wright Patterson Am, OH 454331 Attn:
(ADTN) Mr. Everett Bailey
145
Copies
1
1 1
1 1 2 1 1 82 1
1 1
1
1
1
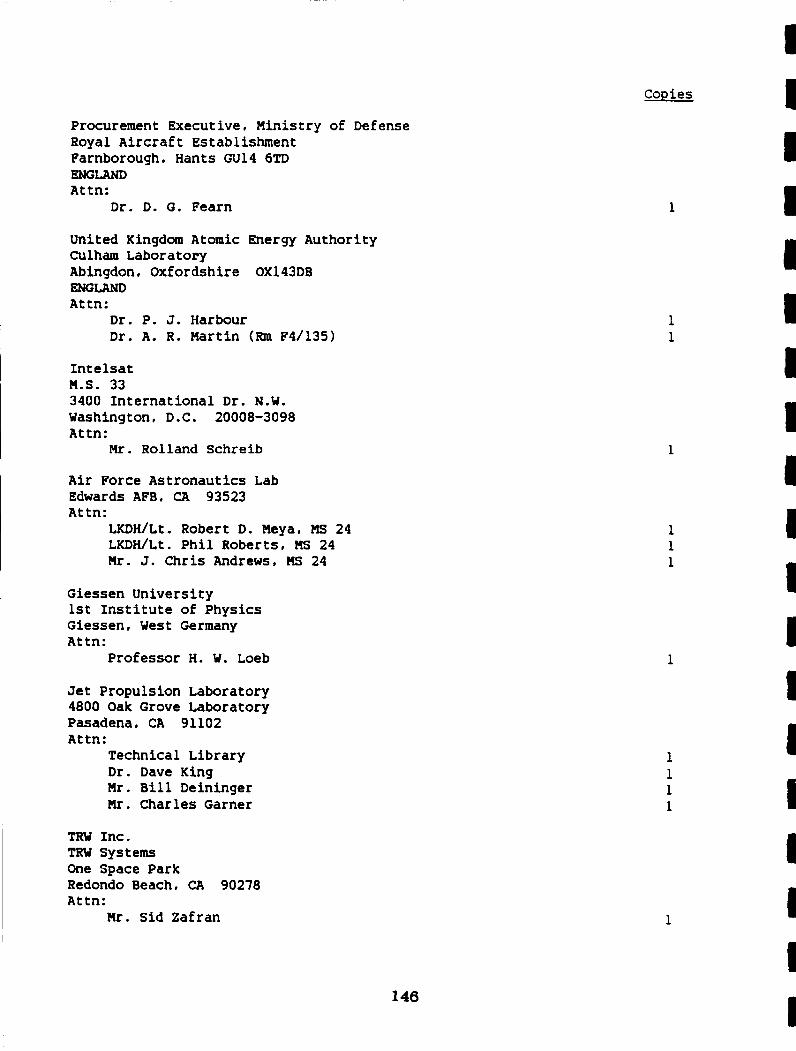
Procurement Executive, Ministry of Defense Royal Aircraft Establishment Farnborough, Hants GU14 6 T D ENGLAND Attn:
D r . D . G . Fearn
United Kingdom Atomic Energy Authority Culham Laboratory Abingdon, Oxfordshire OX143DB ENGLAND At tn:
D r . P. J. Harbour Dr. A. R. Martin (Ezm F4/135)
Intelsat H.S. 33 3400 International Dr. N.W. Washington, D . C . 20008-3098 Attn:
Mr. Rolland Schreib
Air Force Astronautics Lab Edwards AFB, CA 93523 At tn:
LKDH/Lt. Robert D . Meya, MS 24 LKDH/Lt. Phil Roberts, MS 24 Hr. J. Chris Andrews, HS 24
Giessen University 1st Institute of Physics Giessen, West Germany Attn:
Professor H. W. Loeb
Jet Propulsion Laboratory 4800 Oak Grove Laboratory Pasadena, CA 91102
I At tn: I Technical Library
D r . Dave King Hr. Bill Deininger Hr. Charles Garner
TRU Inc. TRU Systems One Space Park Redondo Beach, CA 90278 Attn:
Mr. Sid Zafran
146
Copies
1
1 1
1
1
1
Scionics, Inc. 18801 Muncaster Rd. Derwood. MD 20855 At tn:
Dr. Bernard Free
COMSAT Laboratories P. 0. Box 115 Clarksburg, MD 20734 At tn:
Technical Library
Electro-Optical Systems, Inc. 300 North Halstead Pasadena, CA 91107 Attn:
Mr. E. James Hr. W. Ramsey
National Aeronautics and Space Administration Goddard Space Flight Center Greenbelt, MD 20771 Attn:
Dr. David H. Suddreth
National Aeronautics and Space Administration Ames Research Center Moffett Field. CA 94035 At tn:
Technical Library
National Aeronautics and Space Administration Langley Research Center Langley Field Station
At tn: Hampton. VA 23365
Technical Library
Hughes Research Laboratories 3011 Halibu Canyon Road Malibu, CA 90265 Attn:
Dr. Jay Hyman, HS RL 57 Dr. J. R. Beattie, MS RL 57 Dr. J. N. Hatossian, WS RL 57 Dr. W. S. Williamson HS RL 57
147
Copies
1
1
1 1
1
1
1
Princeton University Princeton, NJ 08540 Attn:
Dean R. G. Jahn Dr. Arnold Kelly
Boeing Aerospace Co. P. 0. Box 3999 Seattle, WA 98124 At tn:
Mr. Donald Grim, MS 8K31
Lockheed Missiles and Space Co. Sunnyvale, CA 94088 Attn:
Dr. William L. Owens Dept. 57-24
Rocket Research Co. P. 0. Box 97009 Redmand. WA 98073-9709 At tn:
Mr. William W. Smith Mr. Paul Lichon
Rocket Research Co. York Center Redmond, WA 98052 Attn:
Mr. R. J. Cassidy
Sandia Laboratories P. 0. Box 5800 Albuquerque, NM 87185 Attn:
Mr. Ralph R. Peters, Mail Code 4537 Mr. Dean Rovang, Mail Code 1251
Ion Tech Inc. 2330 E. Prospect Road Fort Collins, CO 80525 At tn:
Dr. Dan Siegfried
Tuskegee Institute School of Engineering Tuskegee Institute, AL 36088 Attn:
Dr. Pradosh Ray
148
Copies
1 1
1
1
1 1
1
1 1
1
1
I 1 8 I 8 I I I I I I I 8 I I 1 I I 8
Mr. Lee Parker 252 Lexington Road Concord, HA 01741
Colorado State University Fort Collins, CO 80523 At tn:
Dr. R. S. Robinson Dr. P. J. Wilbur
OSD/SDIO/IST Pentagon 1E118 Washington, DC 20301-7100 At tn:
Dr. Leonard H. Caveny
Sverdrup Technology 16530 Commerce Ct. Middleburg Heights, OH 44130 Attn:
Mr. James Gilland
Michigan State University East Lansing, MI 48824 Attn:
Dr. J. Asmussen Dr. M. C. Hawley
The Aerospace Corporation Space Sciences Laboratory
Los Angeles, CA 90009 Attn:
Technical Library
P. 0. Box 92957
Mr. Jay P e M
Dr. Kevin Rudolph M.S. S-8071 Martin Marietta Aerospace P. 0. Box 179 Denver, CO 80201
Dr. Finkelstein Physics Department Georgia Institute of Technology Atlanta. GA 30332
Dr. Rod Burton G-T Devices, Inc. 5705 A General Washington Dr. Alexandria, VA 22312
149
Copies
1
1 1
1
1
1 1
1 1
I Mr. Curtis Haynes Teletronix Inc. HS 50-431
Beaverton, OR 97077 I P. 0. Box 500
Y. J. Schaefer Assoc. Inc. 1901 North Fort Meyer Dr., Suite No. 800 Arlington, VA 22209 At tn:
Dr. Herbert Cohen Dr. Robert Vondra
Electric Propulsion Laboratory, Inc. St. Rt. 2, Box 3406A Tehachapi, CA 93561 A t tn:
Dr. Graeme Aston Dr. John R. Brophy
Uestinghouse RLD Center 1310 Beulah Rd. Pittsburgh, PA 15235 Attn:
J. F. Perkins
150
Copies
1
1 1
1 1
1
1 1 I I I I I I I I I 1 I 1 I I I 1 1