mercosur report n° 13 · (grupo ad hoc sobre biocombustibles) gahip ad hoc production integration...
TRANSCRIPT

RepoRt
Inter-American Development BankMERCOSUR Report Nº 13, May 2009
Integration and Trade SectorInstitute for the Integration of Latin America and the Caribbean - IDB-INTAL
2007 (Second SemeSteR) - 2008 (FiRSt SemeSteR)

2007 (Second SemeSter) - 2008 (FirSt SemeSter)
report
MERCOSUR ReportN° 13

Editing Coordination: Susana FilippaEditing: Julieta S. Tarquini
Inter-American Development BankIntegration and Trade Sector
Institute for the Integration of Latin America and the Caribbean - IDB-INTALEsmeralda 130, 11th and 16th Floors C1035ABD Buenos Aires, ArgentinaPh. (54 11) 4323-2350 fax (54 11) 4323-2365 E-mail: [email protected] http://www.iadb.org/intal
The authors are responsible for ideas and opinions hereby expressed which may not necessarily reflect policies and/or positions from IDB or INTAL.
Published in Argentina
Institute for the Integration of Latin America and the Caribbean - IDB-INTALMERCOSUR Report Nº 131a ed. - Buenos Aires: IDB-INTAL. May, 2009.184 p.; 28 x 21 cm.
ISBN: 978-950-738-282-6
1. Desarrollo EconómicoCDD 338.9

PRESENTATIoN
The achievements and challenges in this ambitious initiative by the Southern Common
Market (MERCOSUR), constituted by the Treaty of Asunción in 1991, have been evaluated in annual
reports. The report presented here is part of a wider framework of activities that IDB/INTAL, as a unit of the
Vice-Presidency of Countries and coordinating its actions with the Integration and Trade Sector of IDB’s
Vice-Presidency for Sectors and Knowledge (VPS), has been carrying out in connection with the integration
processes of Latin America and the Caribbean.
Through this annual report, IDB/INTAL aims to facilitate access to information for a
readership potentially interested in MERCOSUR, spanning the public, private, and academic sectors, and
the subregional community as a whole. Also, to extend the interest aroused by MERCOSUR in the local
to the international community we publish the Report in English, as well as the bloc’s official languages of
Spanish and Portuguese.
Report 13 covers the second half of 2007 and the first half of 2008. The initial draft of
the document was prepared by a team of economists, headed by Ricardo Markwald with the collaboration of
Lucía Maduro, Fernando Ribeiro, and Sandra Ríos. The macroeconomic chapter was prepared in INTAL with
the collaboration of Rosario Campos, Romina Gayá, and Alejandro Ramos. The Integration and Trade Sector,
managed by Antoni Estevadeordal, also collaborated in the design and content of the report. The final draft was
coordinated and edited by Ricardo Carciofi and Uziel Nogueira, Director and Senior Integration Economist of
INTAL respectively, with the assistance of Rosario Campos, Romina Gayá and Alejandro Ramos.
Ever mindful of living up to the expectations prompted by previous reports, we invite readers
to send their comments and/or suggestions on how we can improve the scope and focus of future publications.


GLoSSARy of AbbREvIATIoNS ANd AcRoNymS
ABDI Brazilian Agency for Industrial Development (Agência Brasileira de Desenvolvimento Industrial)ABICALÇADOS Brazilian Footwear Industries Association (Associação Brasileira da Indústria de Calçados)ABIMAQ Brazilian Machinery Builders' Association (Associação Brasileira da Indústria de Máquinas e Equipamentos)ABIT Brazilian Textile and Apparel Industry Association (Associação Brasileira da Indústria Têxtil e de Confecção)ADB Asian Development BankADEFA Association of Automobile Manufacturers of Argentina (Asociación de Fábricas de Automóviles de la Argentina)ADIMRA Association of Metallurgical Industrialists of the Argentine Republic (Asociación de Industriales Metalúrgicos de la República Argentina)AFJP Retirement and Pension Fund Administrator (Administradora de Fondos de Jubilaciones y Pensiones) AM Agricultural ManufacturingAMPIP MERCOSUR Agency for the Promotion of Production Integration (Agencia MERCOSUR para la Promoción de la Integración Productiva)ANCAP National Administration of Fuels, Alcohol, and Portland (Administración Nacional de Combustibles, Alcohol y Portland)ANFAVEA National Association of Automotive Vehicle Manufacturers (Associação Nacional dos Fabricantes de Veículos Automotores)APEX Brazilian Trade and Investment Promotion Agency (Agência Brasileira de Promoção de Exportações)BADLAR Buenos Aires Deposits of Large Amount Rate BCB Central Bank of Brazil (Banco Central do Brasil)BCP Central Bank of Paraguay (Banco Central de Paraguay)BCRA Central Bank of the Argentine Republic (Banco Central de la República Argentina)BCU Central Bank of Uruguay (Banco Central de Uruguay)BCV Central Bank of Venezuela (Banco Central de Venezuela)

BEA Bureau of Economic Analysis b.p. Basic pointsBRAECLPA Brazilian Pulp and Paper Association (Associação Brasileira de Celulose e Papel)BsF Strong Bolivarsc.a. Cumulative annualCADIVI Commission of Foreign Exchange Administration (Comisión de Administración de Divisas)CAF Andean Development Corporation (Corporación Andina de Fomento)CAIRAA Argentina Chamber of Refrigeration and Air Conditioning Industries (Cámara Argentina de Industrias de Refrigeración y Aire Acondicionado)CAM MERCOSUR Customs Code (Código Aduanero del MERCOSUR)CAMEX Chamber of Foreign Trade (Câmara de Comércio Exterior)CAN Andean Community of Nations (Comunidad Andina de Naciones)CCM MERCOSUR Trade Commission (Comisión de Comercio del MERCOSUR)CCPAC Certificate of Common Tariff Policy Compliance (Certificado de Cumplimiento de la Política Arancelaria Común)CCROM Certificate of MERCOSUR Origin Regime Compliance (Certificado de Cumplimiento del Régimen de Origen MERCOSUR)CEB Buenos Aires Studies Center (Centro de Estudios Bonaerenses)CEB Brazilian Business Coalition (Coalizão Empresarial Brasileira)CEP Center for Production Studies (Centro de Estudios para la Producción)CET Common External TariffCG Capital GoodsCIC Chamber of the Footwear Industry (Cámara de la Industria del Calzado)CINDES Center for Integration and Development Studies (Centro de Estudos de Integração e Desenvolvimento)CMC Common Market Council (Consejo del Mercado Común)CNCE National Foreign Trade Commission (Comisión Nacional de Comercio Exterior)

CNI Brazilian National Confederation of Industry (Confederação Nacional da Indústria)COF MERCOSUR Structural Convergence Fund Agreement (Convenio del Fondo para la Convergencia Estructural del MERCOSUR)CPC Joint Parliamentary Commission (Comisión Parlamentaria Conjunta)CPI Consumer Price IndexCPI-GBA Consumer Price Index for the Autonomous City of Buenos Aires and Greater Buenos Aires (Índice de Precios al Consumidor de la Ciudad Autónoma de Buenos Aires y el Gran Buenos Aires)CRB Commodity Research Bureau CRPM Commission of Permanent Representatives of MERCOSUR (Comisión de Representantes Permanentes del MERCOSUR)DDC Developed CountriesDec. Decision DGC Developing CountriesDGEEC General Directorate of Statistics, Surveys, and Censuses (Dirección General de Estadísticas, Encuestas y Censos)DINAPYME National Office for Crafts and Small and Medium Enterprises (Dirección Nacional de Artesanías, Pequeñas y Medianas Empresas)DNCN National Office of National Accounts (Dirección Nacional de Cuentas Nacionales)DNI National Directorate of Industries (Dirección Nacional de Industrias)€ Euro ECA Economic Complementation Agreement ECLAC Economic Commission for Latin America and the CaribbeanELETROS National Association of Electric and Electronic Products Manufacturers (Associação Nacional de Produtos Eletroeletrônicos)EPCI Extended Consumer Price IndexESRI Economic and Social Research Institute EU European UnionEUROSTAT Statistical Office of the European Communities EVE Economic Variables ExpectationsExt. ExtraordinaryFAO Food and Agriculture Organization FCES Economic and Social Consultative Forum (Foro Consultivo Económico-Social)FDI Foreign Direct Investment

FED The Federal Reserve System FFR Federal Funds Rate FLIR Short-Term Liquidity Facility with Monetary Regulation Instruments Reporting (Facilidad de Liquidez de Corto Plazo con Reporto de Instrumentos de Regulación Monetaria)FOCEM MERCOSUR Structural Convergence Fund (Fondo para la Convergencia Estructural del MERCOSUR)FOGADE Deposits Guarantee and Bank Protection Fund (Fondo de Garantía de Depósitos y Protección Bancaria)FONDEN National Development Fund (Fondo de Desarrollo Nacional)FONPLATA Financial Fund for the Development of the River Plate Basin (Fondo Financiero para el Desarrollo de la Cuenca del Plata)FTAA Free Trade Area of the AmericasFTS Free Trade SpaceFTT Financial Transaction TaxFUNCEX Foreign Trade Study Center Foundation (Fundação Centro de Estudos do Comércio Exterior)GAHB Ad Hoc Biofuels Group (Grupo Ad Hoc sobre Biocombustibles)GAHIP Ad Hoc Production Integration Group (Grupo Ad Hoc de Integración Productiva)GANAEC High Level Group to Examine the Consistency and Dispersion of the Current Structure of the Common External Tariff (Grupo de Alto Nivel para Examinar la Consistencia y Dispersión del Arancel Externo Común)GANASIM High Level Group for the Elaboration of the Strategic Plan to Overcome Asymmetries in MERCOSUR (Grupo de Alto Nivel para la Superación de las Asimetrías)GANRI High Level Ad Hoc Group for Institutional Reform of MERCOSUR (Grupo Ad Hoc de Alto Nivel para la Reforma Institucional del MERCOSUR)GCC Gulf Cooperation CouncilGDP Gross Domestic ProductGEIPA Executive Group for Automotive Chain Production Integration (Grupo Ejecutivo para Integración Productiva de la Cadena Automotriz)GIP Production Integration Group (Grupo de Integración Productiva)GMC Common Market Group (Grupo del Mercado Común)HICP Harmonized Index of Consumer Prices

HS Harmonized SystemIBGE Brazilian Institute of Geography and Statistics (Instituto Brasileiro de Geografia e Estatística)ICOME Foreign Currency Purchase Tax (Impuesto a la Compra de Moneda Extranjera)ICONE Institute for Studies of International Trade Negotiations (Instituto de Estudos do Comércio e Negociações Internacionais)ID Internal documentIDB Inter-American Development BankIDB-INTAL Institute for the Integration of Latin America and the CaribbeanIIRSA Initiative for the Integration of Regional Infrastructure in South AmericaIM Industrial ManufacturingIMF International Monetary FundINAN National Food and Nutrition Institute (Instituto Nacional de Alimentación y Nutrición)INDEC National Institute of Statistics and Censuses (Instituto Nacional de Estadísticas y Censos)INDIRA Customs Register Information Exchange (Intercambio de Información de los Registros Aduaneros)INE National Statistics Institute (Instituto Nacional de Estadística)INPC National Consumer Price Index (Índice Nacional de Precios al Consumidor)INTN National Institute for Technology, Standardization, and Metrology (Instituto Nacional de Tecnología, Normalización y Metrología)IPEA Institute of Applied Economic Research (Instituto de Pesquisa Econômica Aplicada)IT Import taxesITTG Information Technology and Telecommunications GoodsIVSS Venezuelan Institute of Social Security (Instituto Venezolano de los Seguros Sociales)LAIA Latin American Integration AssociationLD Legislative DecreeLEBAC Central Bank Accounts (Letras del Banco Central)LPG Liquefied petroleum gasMAC Competitive Adaptation Mechanism (Mecanismo de Adaptación Competitiva)

MDIC Ministry of Development, Industry, and Foreign Trade (Ministério de Desenvolvimento, Indústria e Comércio Exterior)MECON Ministry of Economy and Production (Ministerio de Economía y Producción)MEyP Ministry of Economy and Production (Ministerio de Economía y Producción)MERCOSUR Southern Common Market (Mercado Común del Sur)n.a. Not availableNAFTA North US Free Trade AgreementNAMA Non-Agricultural Market Access Negotiations NBS National Bureau of Statistics of the People’s Republic of China NOBAC Central Bank Notes (Notas del Banco Central)OECD Organisation for Economic Cooperation and DevelopmentONCyT National Science and Technology Bodies (Organismos Nacionales de Ciencia y Tecnología)ONIP National Organization of the Petroleum Industry (Organização Nacional da Indústria do Petróleo)ORPIP Permanent Regional Observatory on Production Integration in MERCOSUR (Observatorio Regional Permanente sobre Integración Productiva en el MERCOSUR)OTDS Overall Trade-Distorting Support PAC Common Automotive Policy (Política Automotriz Común)PAC Common Tariff Policy (Política Arancelaria Común)PCPM Constitutive Protocol of the MERCOSUR Parliament (Protocolo Constitutivo del Parlamento del MERCOSUR)PCRPM Presidency of the Commission of Permanent Representatives of MERCOSUR (Presidencia de la Comisión de Representantes Permanentes del MERCOSUR)PDVSA Venezuela Petroleums Inc. (Petróleos de Venezuela Sociedad Anónima)PICE Argentina-Brazil Integration and Economics Cooperation Program (Programa de Integración y Cooperación Económica Argentina-Brasil)PIPM MERCOSUR Production Integration Program (Programa de Integración Productiva del MERCOSUR)p.p. Percentage point

PPT Pro Tempore PresidencyPROMINP Mobilization Program for the National Petroleum and Natural Gas Industry (Programa de Mobilização da Indústria de Petróleo e Gás)PSND Public Sector Net DebtRAM Recently-Acceded MemberREACH Registration, Evaluation, Authorisation and Restriction of Chemical Substances RECyT Specialized Science and Technology Meeting (Reunión Especializada de Ciencia y Tecnología)Res. Resolution S&P Standard & Poor’s SACU South African Customs Union SAGPyA Secretariat of Agriculture, Livestock, Fishing, and Food (Secretaría de Agricultura, Ganadería, Pesca y Alimentos de la República Argentina)SEBRAE Brazilian Service of Support for Micro and Small Enterprises (Serviço Brasileiro de Apoio às Micro e Pequenas Empresas)SECEX Secretariat of Foreign Trade (Secretaria de Comércio Exterior)SELIC Special System for Settlement and Custody (Sistema Especial de Liquidación y Custodia)SENACSA National Service of Quality and Animal Health (Servicio Nacional de Calidad y Salud Animal)SENAI National Service of Industrial Learning (Serviço Nacional de Aprendizagem Industrial)SENAVE National Plant and Seed Quality and Health Service (Servicio Nacional de Calidad y Sanidad Vegetal y de Semillas) SEPYME Undersecretariat for Small and Medium Enterprise and Regional Development (Subsecretaría de la Pequeña y Mediana Empresa y Desarrollo Regional de la República Argentina)SICA Central American Integration System (Sistema de Integración Centroamericana)SM MERCOSUR Secretariat (Secretaría del MERCOSUR)SMEs Small and Medium EnterprisesSML Local Currency Payment System (Sistema de Pagos en Moneda Local)SSG Special Agricultural SafeguardTRP Permanent Review Tribunal (Tribunal Permanente de Revisión)TU Technical Unit

UN United NationsUNASUR Union of South American NationsUNCTAD United Nations Conference on Trade and DevelopmentUSA United States of AmericaVAT Value Added TaxWESP World Economic Situation and Prospects WG Working GroupWP Working PaperWS Working SubgroupWTA World Trade Atlas WTO World Trade OrganizationYOY year-on-year

COMMON MARKET COUNCIL (CMC)
MINISTERIAL MEETINGS
• Agriculture(RMA)
• Culture(RMC)
• EconomiesandCentralBankPresidents(RMEPBC)
• Education(RME)
• Industry(RMIND)
• Interior(RMI)
• Justice(RMJ)
• Environment(RMMA)
• MinesandEnergy(RMME)
• MERCOSURMinistersandHighAuthoritiesinScience,TechnologyandInnovation(RMACTIM)
• MinistersandAuthoritiesinchargeofSocialDevelopment(RMADS)
• Health(RMS)
• Labor(RMT)
• Tourism(RMTUR)
GROUpS
• HighLevelGroupforMERCOSUREmploymentGrowthStrategy(GANEMPLE)
• HighLevelGrouptoExaminetheConsistencyandDispersionoftheCurrentStructureoftheCET(GANAEC)
• Ad HocHighLevelGroupforInstitutionalReform(GANRI)
• HighLevelGroupfortheElaborationoftheStrategicPlantoOvercomeAsymmetriesinMERCOSUR(GANASIM)
• HighLevelGroupfortheElaborationofaSouth-SouthCooperationProgram(GANASUR)
• WorkingGroupfortheNegotiationoftheMembershipProcessoftheBolivarianRepublicofVenezuela(GTVENE)
• Ad HocWorkingGroupfortheIncorporationoftheRepublicofBoliviaasaMERCOSURStateParty(GTBO)
PolicyConsultationandConsensus-BuildingForum
(FCCP)
CommissionofPermanentRepresentativesofMERCOSUR
(CRPM)
MeetingofHighAuthoritiesintheAreaofHumanRights(RADDHH)
mERcoSuR INSTITuTIoNAL fRAmEwoRk
COMMON MARKET GROUp (GMC)
WORKING SUBGROUp
• Communications(SGTN°1)
• InstitutionalAspects(SGTN°2)
• TechnicalRegulationsandConformityEvaluation(SGTN°3)
• FinancialMatters(SGTN°4)
• Transport(SGTN°5)
• Environment(SGTN°6)
• Industry(SGTN°7)
• Agriculture(SGTN°8)
• Energy(SGTN°9)
• LaborMatters,Employment,andSocialSecurity(SGTN°10)
• Health(SGTN°11)
• Investments(SGTN°12)
• TradeElectronic(SGTN°13)
• Mining(SGTN°15)
SpECIAL MEETINGS
• FamilyAgricultureinMERCOSUR(REAF)
• MERCOSURFilmandAudiovisualAuthorities(RECAM)
• ApplicationAuthoritiesinDrugs,PreventionofDrugsAbuse,andDrugRehabilitation(RED)
• ScienceandTechnology(RECyT)
• SocialCommunication(RECS)
• MERCOSURCooperatives(REC)
• OfficialMERCOSUROmbudsmen(REDPO)
• IntegrationInfrastructure(REII)
• Youth(REJ)
• Women(REM)
• MERCOSURPublicMinistries(REMPM)
• InternallyControlledGovernmentOrganizations(REOGCI)
• MERCOSURJointTradePromotion(REPCCM)
• Tourism(RET)
• GovernmentEntitiesforNationalsResidentOverseas(REEG)
TechnicalMeetingfortheIncorporationoftheMERCOSURRegulatoryFramework(RTIN)
MERCOSURPublicContractingGroup(GCPM)
MERCOSURSocialLaborCommission(CSLM)
SAMBudgetaryMattersGroup(GAP)
MERCOSURTechnicalCooperativeCommittee(CCT)
ConsultativeForumofMERCOSURMunicipalities,FederatedStates,
Provinces,andDepartments(FCCR)
AutomotiveCommittee(CA)
ServiceGroup(GS)
Ad hoc GROUpS• "MERCOSURStructural
ConvergenceFundExperts(GAHE-FOCEM)
• MERCOSURCustomsCode(GAHCAM)
• Concessions(GAHCON)
• ConsultationandCoordinationforWTOandSGPCNegotiations(GAHOMC-SGPC)
• ExternalNetworking(GAHRE)
• SanitaryandPhytosanitary(GAHSF)
• SugarSector(GAHAZ)
• AgriculturalBiotechnology(GAHBA)
• CigaretteTradeinMERCOSUR(GAHCC)
• BorderIntegration(GAHIF)
• TowardaRegionalPolicyonTires,includingRetreadedandUsed(GAHN)
• Biofuels(GAHB)
• MERCOSURDomain(GAHDM)
• MERCOSURSupportFundforSmallandMediumEnterprises(GAHFME)
MERCOSURTrainingInstitute(IMEF)
MERCOSURProductionIntegrationGroup(GIP)

MERCOSUR ADMINISTRATIVE AND LABOR TRIBUNAL (TAL)
MERCOSUR pERMANENT REVIEW TRIBUNAL (TpR)
SOCIAL AND ECONOMIC CONSULTATIVE FORUM (FCES)
MERCOSUR pARLIAMENT (pM)
MERCOSUR SECRETARIAT (SM)
MERCOSUR TRADE COMMISSION (CCM) TECHNICAL COMMITTEES
• Tariff,Nomenclature,andGoodsClassification(CTN°1)
• CustomsMatters(CTN°2)
• TradeRulesandDisciplines(CTN°3)
• Competitiveness-DistortiongPublicPolicies(CTN°4)
• DefenseofCompetition(CTN°5)
• MERCOSURForeignTradeStatistics(CTN°6)
• ConsumerDefense(CTN°7)
• TradeDefenseandSafeguardsCommittee(CDCS)
MERCOSUR CENTER FOR THE pROMOTION OF DEMOCRACY (CMpED)
MERCOSURObservatoryforDemocracy(ODM)
Source:MERCOSUROfficialwebsitehttp://www.mercosur.int(owntranslation).

coNTENTS
EXECUTIVE SUMMARY i
CHAPTER 1. MACROECONOMIC OVERVIEW 1
A. The international scenario 1
B. The evolution of the balances of payment 7
C. The macroeconomic evolution of MERCOSUR 10
D. Economic policy: instruments and results 13
E. Incomes and employment 22
F. Conclusions 24
ANNEX I i
CHAPTER 2. THE EVOLUTION OF TRADE AND FOREIGN DIRECT INVESTMENT 25
A. Total MERCOSUR trade 25
B. MERCOSUR trade by country 35
C. MERCOSUR-Venezuela trade 56
D. Foreign direct investment in MERCOSUR 59
CHAPTER 3. THE INTERNAL AGENDA 65
A. The treatment of asymmetries 65
B. The MERCOSUR Structural Convergence Fund (FOCEM) 69
C. The Common External Tariff 75
D. Initiatives in strengthening regional production integration 82
E. Local Currency Payment System (SML) 90
F. The MERCOSUR Parliament 94
G. Other issues on the internal agenda 97

CHAPTER 4. SECTORAL CONFLICTS AND TRADE DISPUTE NEGOTIATION 103
A. General outline 103
B. The evolution of the Brazil-Argentina Common Automotive Policy: latest agreements 104
C. Trade in products subject to the previous licensing system and voluntary restriction agreements: footwear, white goods, and paper 110
D. Trade in products subject to antidumping and safeguard measures in Argentina 111
E. The textile sector 114
F. The used or retreaded tire dispute 116
G. Repercussions of the pulp mill dispute 117
H. Final remarks 117
CHAPTER 5. THE EXTERNAL AGENDA 119
A. The international climate and the strategies of MERCOSUR member countries 119
B. The Doha Round: recent movements and impacts for MERCOSUR 122
C. Latin America integration 130
D. The extraregional negotiations agenda 139
E. Prospects for the MERCOSUR external agenda 144
BIBLIOGRAPHY

i
ExEcuTIvE SummARy
In spite of the international context affected by the financial and credit crisis triggered in the US mortgage market, integration of the Southern Common Market (MERCOSUR) has continued to move forward, mainly in the internal agenda, where member countries reached certain agreements. In the period covered in this report (June 2007 to June 2008), trade volumes grew in an expanding context for the bloc’s economies. On the external front, the negotiating dynamic has seen less tangible results. The worsening of the international financial crisis in the last quarter of 2008 creates an adverse context for the bloc’s economies in the coming year. This scenario contemplates a downturn in world growth and a contraction of the main consumer markets, such as the United States, the European Union, and Japan. Below are the main conclusions of this 2007-2008 MERCOSUR Report.
Macroeconomic outlook: The gross domestic product of the bloc’s five member countries grew on average 7.3% in 2007 and may reach 6.9% in 2008, according to the latest forecasts available. Although imports were highly dynamic, the growth of the five economies (Argentina, Brazil, Uruguay, Paraguay, and Venezuela) was supported by a great expansion of exports, helped along by the strong demand and high price of commodities. GDP growth was based on rising investment in production sectors and robust private consumption as a result of rising incomes and the availability of credit, mainly in Brazil. The dynamism of the economies was an aspect of a macroeconomic situation characterized by positive fiscal balances (except Venezuela) and surpluses in the Brazilian, Argentine, and Venezuelan trade balances.
The unemployment rate fell across all five countries, reaching an average rate of 8.1% of the economically active population. Again, on the social level, there was progress in terms of lower poverty levels. The rate of inflation was the main challenge for the monetary authorities, due to the sharp increase in food and energy prices. Average inflation of the five countries was thus 10% in 2007* and was expected to rise above this level by late 2008.
For 2009, the outlook for growth is subject to great uncertainty. In fact, the depth and extent of the slowdown of the global economy will be the main variable to determine MERCOSUR’s potential for growth. The bloc’s economies will be negatively affected through trade and access to international credit, phenomenon that has already began to stand in the way of trade financing. In terms of exports, a dual impact will be felt, occasioned by the fall in demand and leading commodity prices (agricultural produce, minerals, and oil).
It remains to be seen whether the slowdown in global growth can be offset through anticyclical monetary and fiscal policies across the five countries of the bloc. Governments will attempt to maintain employment levels, incomes, consumption, and investment. The lesser role of inflationary pressure that characterized late 2007 and early 2008 will be an important factor in achieving this purpose. The forecasts for the bloc’s growth rates of 4% p.a. in 2009 are consistent with the above premises.**
* Simpleaveragefortheyear-on-yearvariationofconsumerpriceindexesinDecember2007.
** TheprojectionisasimpleaverageofthemedianofMarketExpectationsinArgentina,Brazil,Paraguay,andUruguay.InthecaseofVenezuela,itcorrespondstoECLACforecasts.ThemostrecentIMFforecasts(11/06/08)indicategrowthbelow4%forthesimpleaverageofthefiveeconomies.

ii
Trade and foreign direct investment: In 2007-2008, the trade balance continued to be a dynamic factor in the bloc: global exports reached US$129.1 billion in the first half of 2008, 27.5% up on the first half of 2007. Imports reached US$115.8 billion, a 50.7% increase. Intrazone trade also saw robust growth, with imports of US$19.8 billion in the first half of 2008. The pace of commerce was accompanied by foreign direct investment in the bloc of US$41.5 billion in 2007. Investment reached US$19.3 billion in the first half of 2008, 13.2% down on the same period in 2007. This drop reflects the negative impact of the financial crisis. For an estimated value of US$7.1 billion in 2007, Brazilian companies carried on investing in the bloc’s economies, mainly Argentina.
Internal agenda: The bloc’s Pro Tempore Presidency was held by Uruguay in the second half of 2007 and Argentina in first half of 2008. Reflecting the these countries’ priorities, the emphasis in the case of Uruguay was placed on the second stage implementation of CMC Resolution 54/04, whose main objectives are to establish a MERCOSUR Customs Code and define a mechanism for the distribution of customs revenue. In spite of the Uruguayan authorities’ diplomatic efforts, it proved impossible to achieve the desired objective. In the case of Argentina, the proposed objective of defining a Production Integration Program was accomplished, an issue of especial importance in strengthening regional production chains and one that aims to overcome the asymmetries existing within the bloc. For 2009, the internal agenda will have to pursue the efforts in the two areas mentioned, and in the activation of several consultation mechanisms to avoid trade intrabloc conflicts.
Sectoral and trade disputes: Where sectoral conflicts and trade dispute negotiations are concerned, in spite of the rise in Brazil’s trade surplus with other partners in the bloc, the period was relatively quiet. This can be explained by the growth of the five economies, the appreciation of the Brazilian real in relation to the other partners’ currencies (mainly the Argentine peso), rising Brazilian investments in the region, and the efficiency of the Bilateral Trade Monitoring Commissions. In terms of the Common Automotive Policy, setting a timeframe for free trade between Brazil and Argentina was the main achievement of the bloc’s industrial integration agenda. The satisfactory settlement of the dispute caused by the installation of a cellulose plant in Fray Bentos, Uruguay, remains a major challenge for Uruguayan and Argentine diplomacy in 2009.
External agenda: MERCOSUR’s external agenda saw scant progress during the period analyzed, despite the various negotiation fronts opened by the bloc in recent years. Notwithstanding the less favorable international climate for trade liberalization movements, the bloc is encountering difficulties over the convergence of interests between its partners in relation to the projects of international insertion. On the one hand, Uruguay is seeking authorization to move ahead in bilateral talks, independent of MERCOSUR. Argentina, on the other hand, has little incentive to commit itself in new trade liberalization movements, as this would mainly affect its manufacturing sector. Brazil, for its part, concentrated its efforts on the multilateral negotiation of the Doha Round, which is still at a standstill. In 2009, the external agenda will be even more defensive in light of the adverse international scenario. Much of the external effort will be concentrated on the WTO, trying to maintain access to global markets.

1
cHAPTER 1. mAcRoEcoNomIc ovERvIEw
A. The international scenario
The new world economic context1
The outbreak of a major financial crisis with epicenters in the developed countries (DDCs) during the northern summer of 20072 increased uncertainty over the strength and permanency of the factors that had been stimulating growth and world trade since 2003. The disruption initially only affected certain segments of the US mortgage market, once the real estate bubble burst at the start of 2007. However, the crisis spread until it became a systemic threat, blocking key credit markets, increasing stock market and foreign exchange volatility, and creating both inflationary and contractive trends (Box A). A recent scenario forecasts that world GDP and trade in 2008 will expand by 2.7% and 4.9% respectively, as against 3.7% and 7.2% in 2007. There would be a substantial slowdown in 2009, as trading would rise by just 4.1% and activity by 1.9%. The USA and the Euro Zone would grow by a mere 0.1% and 0.2%, while China would see its rate of expansion fall to a lesser degree, from 9.7% in 2008 to 9.3% in 2009. These forecasts are, nevertheless, marked by a high degree of uncertainty.3 It is worth noting that, although the depth of the crisis beginning in mid-2007 is unheard-of in recent times, its initial impact on world growth was weak. This is explained by two main factors. On the one hand, until mid-2008, the emerging economies (those of MERCOSUR among them) maintained steep rates of expansion, while the brunt of the slowdown was borne by the developed economies (Graph 1). On the other hand, the DDCs’ authorities implemented a set of measures to curb contractive and deflationary trends, such as massive injections of liquidity, interest rate cuts and tax incentives. In the USA, GDP growth in 2007 was 2% (2.8% in 2006) and 2.3% in the first half of 2008. It should be noted, however, that these increases combine a marked drop in the aggregate of durable consumption and residential investment (6.1% in the first half of 2008) with strong growth in exports of goods and services (10.5% in the same period), stimulated by the real depreciation of the dollar seen until mid-2008.4 On the other hand, imports of US goods and services tailed off during 2007, contracting by 1.4% in the first half of 2008. Although this situation helps correct one of the imbalances that beleaguer the world economy, it also brings about a reduction in one of its sources of dynamism. The US economy’s troubles are more pronounced in terms of labor demand: while on average during 2006-2007, 133,000 jobs were created per month, between January and September 2008, 85,000 jobs were lost per month.
1 TextconcludedOctober20.2008.2 SeeMERCOSUR Report 12[2007],p.3.3 Worldgrowthratecorrespondstoanaggregationthroughmarketexchangerates.IMF[2008c],p.2.SeealsotheUnitedNations(UN)forecastsinUN[2008],whichincludesarangeofscenarios,andthoseofUNCTAD[2008],p.2.4 BetweenJanuary2007andJune2008,thedollardepreciated9.0%inrealeffectiveterms.ThetrendwasreversedbetweenJuneandSeptember,withanappreciationof4.0%.However,inthemedium-termoutlook,itisvaluenotingthat,betweenJanuary2002andSeptember2008,thedepreciationrecordedwas19.9%.

2
Box AKEY EVENTS IN THE FINANCIAL CRISIS 2007-2008
Date Event
2007
17-07 BearStearnssubprimemortgagehedgefundcrashmakesheadlinenews.
19-07 TheDowJonesreachesarecordhighof14,164pointsbeforestartingadownwardspiral.
03-08 BearStearnsdescribesthestateofthemarketastheworstin22years.
09-08 BNP Paribas announces the freezing of "dynamic funds" exposed to subprimemortgages. The EuropeanCentralBank,theFederalReserveandothermonetaryauthoritiessetintrainemergencyoperationstoinjectliquidityintothefinancialmarket.
16-08 TheDowJonesreachesarelativelowof12,846pointsasaresultofthepanictriggeredbythesubprimecrisis;CountrywideFinancial,amajorUSmortgageoperatorrequiresliquidityloans.
17-08 Inanemergencystatement,theFederalReserveextendsliquidityfacilitiesforentitiesintrouble,reducesoneofitsdiscountratesby50basicpoints(b.p.),butkeepsthefederalfundsrate(FFR)at5.25%.
18-09 TheFederalReservecutstheFFR50b.p.to4.75%.
09-10 Drivenupbyslackmonetarypolicy,theDowJonesreachesarecord14,165-pointhighandthenbeginstofallintailoffwithlowsinJanuary,March,andOctober2008.
31-10 25b.p.cutintheFFRto4.5%.
01-11 CitigroupannouncesithastoraiseUS$30billionextracapital;itssharepricecollapses.
27-11 AbuDhabi’ssovereignfundannouncesinvestmentsinCitibank.
11-12 TheFederalReserveannouncesacutofjust25b.p.intheFFRto4.25%.
12-12 TheFederalReserve announces the implementation of theTermAuction Facility, intended to alleviate theliquidityproblemsofdepositorybanks;theauctionsgetstartedonDecember17.
2008
17-01 IssuesofrecessionintheUSAincreasewhenadishearteningreportfromtheFederalReservecomestolight.
22-01 Arelative11,971-pointlowfortheDowJones.Emergency75b.p.cutintheFFRto3.5%.SociétéGénéraleannouncesheavylosses,attributedtoanoperator.
30-01 Further50b.p.cutintheFFRto3%thatbooststhestockmarket.
27-02 TheDowJonesreachesarelativehighof12,694points,beforebeginningabruptlytodeteriorateagain.
10-03 TheDowJonesreachesarelativelowof11,740.
11-03 TheFederalReserveannounces the implementationof theTermSecuritiesLendingFacility,whichenablesinvestment banks and other "primary dealers" to exchange asset-backed papers relating to themortgagemarketforTreasurynotes;theauctionsgetstartedonMarch27.
14a17-03 TheFederalReserveannouncesabailoutforBearStearns,whichincludescreditfacilitiesforabuyoutbyUSinvestmentbank,J.P.MorganChase,andcutsoneofitsdiscountratesby25b.p.
18-03 75b.p.cutintheFFRto2.25%.Thestockmarketreactsfavorably.
30-04 25b.p.cutintheFFRto2%.Accordingtoprovisionaldata,USGDPsawmoderategrowthinthefirstquarter.

3
Box A (Continued)
In the other developed economies, the new climate imposed by the financial crisis resulted in a more marked slowdown than in the USA. Japan and the Euro Zone’s GDP growth reached just 1% and 1.7% respectively in the first half of 2008, as against 2% and 2.6% in 2007. The cooling of these economies is linked first to a deterioration in export performance (related as it is to the aforementioned real depreciation of the dollar) and second, to a weakening of capital formation. In some countries, like Japan and Germany, the export expansion seen from 2003 had led to an explosion of investment in machinery and equipment. This lost momentum in the new climate. In other countries, like Spain and Ireland, dynamic investment in construction was linked to an inflation of real estate assets, a situation that was reversed when the credit market hardened. On the other hand, in the context of China’s steady accumulation of capital over the first nine months of 2008, GDP growth dropped to 9.9%, as against 11.8% in 2007. More conspicuous was the downturn in the markets of destination of China’s exports, as reflected in the fall in its 30% expansion rate in the first half of 2007 to 21% in the same period of 2008. In contrast, in the same periods, imports increased 18.2% and 30.9% respectively, mainly reflecting the significant price rises in raw materials.
Date Event
07 OverJulythepricesofvariouscommoditiespeak,thenbegintotailoff.Thismarksthecloseofthe"inflationaryphase"ofthecrisis.
07-09 The US government takes control of mortgage giants, Freddie Mac and Fannie Mae, whose debt is ofsystemicimportance.
15-09 LehmanBrothersdeclaresbankruptcy.
17-09 Bailoutoftheinsurancegiant,AmericanInternationalGroup,Inc(AIG).
21-09 GoldmanSachsandMorganStanleyconverttobankholdingcompanies.
28-09 NationalizationoftheDutch/Belgianfinancialgroup,Fortis,andtheBritishmortgagebank,Bradford&Bingley.
29-09 USCongressthrowsoutamammothbailoutplanforthefinancialsystem.TheDowJonesseesa4.8%dropof777points.
03-10 TheUSCongressapprovesaUS$700billionfinancialbailout,butthestockmarketscontinuetofall.
06-10 TheDowJonescloses9,000pointsdown.
08-10 50b.p.cutintheFFRto1.50%.
10-10 TheDow Jones closes at 8,451 points after eight consecutive falls inwhich it loses a total of 2,399 units(22.1%).Itisacrashofhistoricproportions.
14-10 Afterameetingof theG7, it isannouncedthat, torecapitalizeawiderangeoffinancial institutions, theUSTreasurywillmake "voluntarypurchases"ofpreferredshares.Depositprotection isextendedandaplan isoutlinedtoassistwithliquidityinexchangeforasset-backedpaperswithathree-monthmaturity.

4
GrAph 1GROWTH OF MAIN ECONOMIES 2000-2008
(%variationinrealGDPagainstthesamequarterthepreviousyear)a/
00.5
11.5
22.5
33.5
44.5
1 2 3 4 1 2 3 4 1 2 3 4 1 2 3 4 1 2 3 4 1 2 3 4
2003 2004 2005 2006 2007 2008
0
2
4
6
8
10
12
14
USA Japan Euro Zone China (right axis)
Note: a/ 2008: Preliminary figures.TheEuro Zone figures correspond to an aggregation in dollarswithpurchasingpowerparities.
Source:Authors’ownelaborationbasedonBEA(USA),OECD,EUROSTAT,ESRI(Japan),ADB,andNBS(China)data.
The development of the international financial crisis
The prime destabilizing factor of the financial crisis has been the devaluation of US real estate assets. Prices began to slow in 2006, when monetary policy became tougher, and then to fall early in 2007. In July 2008, the house price index was 17.5% below the same month in 2007.5 This deflationary process put heavy pressure on the balances of mortgage holders and several financial entities. Both agents suddenly faced spiraling arrears and a devaluation of support assets, with a subsequent sharp rise in the relative burden of liabilities. By mid-2007, the decapitalization seen in various investment vehicles belonging to major international financial institutions closed the door on borrowing in short-term and interbank markets, which fell into crisis. Since then, there have been three episodes of stock-market panic6 (in August 2007 and in March and September/October 2008) triggered by the apparent weakness or insolvency of key financial entities. The depreciation of stock-market assets that began to accompany the devaluation of real estate assets added a second deflationary factor to the crisis: in the first half of October 2008, the Dow 30 was 30.5% down on July 2007. Furthermore, while remaining positive, private funding flows of the US current account deficit fell noticeably. Whereas, between 2003 and the third quarter of 2007,
5 S&F/Case-ShillerIndex(20metropolitanareas)forresidentialpropertyprices;itismobileaveragesquarterly.6 Inastateofpanic,muchofthemarketnotonlytakesabearishsellingstance("futurepriceswillbelowerthanpresentones"),butbelievestherewillbeageneralizedcessationofpayments.Thisleadstoamasssaleofassetsandcreditrestriction,thepurposeofwhichistoraiseindividualliquidity.Historically,therehavebeenmanyoccasionswhenthepanicspreadtothebankingsystem,causingrunsondepositsandwidespreadbankruptcyamongfinancialinstitutions,aphenomenonthatwascontainedafter1929indevelopedcountries.OtherclassictextsonthesephenomenaincludeBagehot[1968],Pigou[1927],andKindleberger[2000].

5
they represented on average 2.6% of GDP, between the fourth quarter of 2007 and the second quarter of 2008 they stood at just 0.6%. This incipient sign of distrust toward US assets had a correlate in the greater willingness to place capital in other markets, including emerging markets, in spite of the general increase in uncertainty. This factor has been extremely relevant in the evolution of several MERCOSUR countries’ balance of payments.
The response of the world’s monetary authorities has had three stages. The first panic in August 2007 set in train heavy injections of liquidity in several DDCs, the cut in the Federal Reserve interest rate, and the implementation of a fiscal stimulus package in the USA, equivalent to approximately 1.1% of GDP. The second panic, in March 2008, was contained by means of a specific bailout operation, namely, the sale of Bear Stearns organized by the Federal Reserve. The third episode, involving government control of crucial entities in the mortgage market and the elimination or reorganization of the main investment banks in the USA, required legislative approval for a systemic bailout plan of depreciated mortgage assets by exchanging them for quality government instruments for around 5% of US GDP. The inadequacy of this approach, as manifested in the stock-market crash of October7 and the weakness of the credit market, led to the US government tabling the possibility of buying shares from financial entities. The UK had already implemented this form of recapitalization, extended to other European countries.
The transmission channels of the crisis to MERCOSUR
From the point of view of the evolution of raw materials prices, key for MERCOSUR countries, the crisis has developed in two differentiated phases. Between August 2007 and June 2008, the prices of several of these products -in particular petroleum, certain cereals, and oleaginous seeds- rose significantly. This first phase of the crisis, in which inflationary features prevailed, had direct consequences for the variables of the MERCOSUR countries’ balances of payments, and indirect ones for their internal price indicators, as also occurred in the developed economies (Graph 2 and Box B). Between July 2007 and 2008, the prices of goods exported by Latin America and the Caribbean8 rose 40.3%, excluding petroleum. The petroleum price grew 86.3%. The prices of soya and corn went up by 80.2% and 81.2% respectively during the period. The market panic of August 2007 and the measures intended to ease monetary conditions stimulated the reallocation of portfolios to more secure assets (such as US Treasury notes),9 but also to emerging countries’ assets and, notably, commodities. The depreciation of the dollar,10 the currency in which these goods are quoted, contributed to rising prices, as did the fact that the world economy continued in positive growth.
7 BetweenOctober1and10,2008,theDowJonesfell22%.8 IndexestimatedbyECLACwitharepresentativebasketofproductsexportedbytheregion.9 The10-yearyieldofthebillwentfrom5.10%inJune2007to3.51%inMarch2008.10 SeeNote4.

6
GrAph 2MONTHLY DYNAMICS OF SELECTED pRICE INDICATORS 2006-2008
(%andlevelvariationagainstthesamemonththepreviousyear)
USAa/ Euro Zoneb/ Commodities exportedc/ (right axis)
6
5
4
3
2
1
0
Jan-
06
Mar
-06
May
-06
Jul-0
6
Sep
-06
Nov
-06
Jan-
07
Mar
-07
May
-07
Jul-0
7
Sep
-07
Nov
-07
Jan-
08
Mar
-08
May
-08
Jul-0
8
Sep
-08
290
270
250
230
210
190
170
150
Notes: a/ IPC; b/ IAPC; c/ Exported Commodities Index for LatinAmerica and the Caribbean, excludingpetroleumandderivatives;Average2000=100.
Source:Authors’ownelaborationbasedonBEA,EUROSTAT,andECLACdata.
In July 2008, however, the trend in several of these factors shifted and the commodities markets began to weaken as a result. On the one hand, the cooling of activity in the Euro Zone and Japan was reflected in a dollar rise that had begun after the "trust effect" brought about by the bailout of Bear Stearns.11 Although the implementation of tax assistance in the USA kept up activity levels, inflationary pressures began to reduce demand, as in other DDCs. Significantly, in July there was a weakening of demand for petroleum in OECD countries that impacted on their price. In September, the price of commodities exported by the region (excluding petroleum) was 8.9% down on June.12 The evidence of a further decline in activity indicators and the persistent devaluation of real estate assets led to the market panic of September and October, in which capital flow no longer went toward commodities, but was concentrated in US Treasury notes and other more liquid assets, with immediate repercussions for the region’s foreign exchange markets.13 The development of the phase beginning in July ended up dovetailing with the third episode of the financial crisis mentioned above, which led to an abrupt outflow of capital that affected the economies of MERCOSUR and particularly Brazil. The domestic credit circuit thus bore the brunt and added a negative factor to the decline in export prices. These parameters will no doubt condition economic activity in what remains of 2008 and 2009.
11 Aneffectalsoreflectedinthemarketindicators(theDowJonesrose6%betweentheendofMarchandmid-May)andinthe10-yearyieldofTreasurynotes(goingfrom3.51%inMarchto4.10%inJune).12 InternationalEnergyAgency[2008],p.4.13 OnOctober8,theBrazilianrealwasquotedat2.39perdollar,53.5%upontheAugust1exchangerate.

7
b. Evolution of the balances of payments
The international financial crisis impacted on MERCOSUR countries’ balances of payments in a variety of ways. The evolution of export and import prices, and the availability of financial capital shaped the dominant trends in these countries’ international transactions unevenly. In 2007, the credit balance of the bloc’s balance of payments current account (excluding Venezuela) was down 1.6% on the previous year to 0.6% of GDP, a result similar to Latin America and the Caribbean as a whole (Graph 3). In Argentina, Brazil, Paraguay, and Venezuela the surplus fell, whereas Uruguay recorded a lower deficit that year. In the first half of 2008, the trends of 2007 continued in Argentina and Brazil, bringing about a current account deficit in the latter, while the debit balance expanded in Uruguay and the surplus grew in Venezuela. No recent information is available for Paraguay.
GrAph 3MERCOSUR: EVOLUTION OF THE CURRENT ACCOUNT BALANCE
(In%ofGDP,atcurrentprices)
Argentina Brazil
1995
1999
1998
1997
1996
2001
2000
2003
2004
2002
2005
2007
2006
2008
a/
10
8
6
4
2
0
-2
-4
-6
1995
1999
1998
1997
1996
2001
2000
2003
2004
2002
2005
2007
2006
2
1
0
-1
-2
-3
-4
-5
43210
-1-2-3-4-5-6-7-8
1995
1996
1997
1998
1999
2000
2001
2002
2003
2004
2005
2006
2007
2008
a/
1995
1999
1998
1997
1996
2001
2000
2003
2004
2002
2005
2007
2006
2008
a/
20181614121086420
-2-4-6
Venezuela
Latin America and the Caribbean MERCOSUR
Paraguay Uruguay
Note:a/EstimateforthefirsthalfofthecurrentaccountbalanceandnominalGDP.
Source:Authors’ownelaborationbasedonECLACdataandofficialsources.
- Argentina -
In Argentina, the deterioration in the current account balance from 3.7% to 2.7% of GDP between 2006 and 2007 has different causes during the period: the turning point was mid-2007. Until then, goods imports

8
grew more than exports, translating into the steady erosion of this balance.14 From that time on, there was a relative acceleration of exports, explained by growth in commodity prices during the inflationary phase of the international crisis. These trends extended throughout the first half of 2008, when Argentina enjoyed improved terms of trade of 14.4%. Whereas the 12-month moving average for growth of external sales of goods was 14.7% in June 2007, a year later it reached 31.6%. International "food inflation" benefitted Argentina’s external accounts. Although imports also experienced a sharp acceleration, the net result of these movements was a rising surplus in the goods balance, which helped shore up the current account surplus. The decline in the first half of 2008 originated first in the steep growth of net income payments and, second, in a rise in the services deficit. During the first half of 2008, Argentina saw an outflow of financial capital15 equivalent to 2.9% of GDP in a scenario of greater uncertainty caused by a taxation dispute between the government and the agricultural sector in a context of the rising international prices of certain raw materials.16
- Brazil -
Brazil saw a persistent acceleration of imports from mid-2007 due to a rise in its activity levels and the appreciation of its currency. In June that year, the 12-month moving average for the growth rate of external purchasing was already a robust 26.5%, and reached 44% a year later. As exports did not experience a similar dynamic, in spite of rates of about 19% during the period, the balance surplus in goods fell significantly. This decline in trade in goods, added to a sharp rise in income payments, led to the country beginning to see a current account deficit from the fourth quarter of 2007. For the year as a whole, the surplus was 0.1% of GDP (1.3% in 2006). The debit balance expanded in the first half of 2008, representing 2% of GDP. The change was very swift. Apart from the aforesaid internal causes, this result had to do with the international financial crisis, which translated into a strong inflow of capital into Brazil. In 2007, the net income from financial capital and net foreign direct investment was equal to 6.8% of GDP: the first heading accounted for 4.6% of GDP.17 In the first half of 2008, these figures were 4.3% and 3.3% respectively. The impact of the international financial instability was initially favorable then for Brazil in this period. Despite the episodes of panic involving specific outflows of capital, the country remained a destination for financial investments due to the wide differential in interest rates and the still predominant trend of appreciation of the real in a context of the weakening availability of private capital to finance the US deficit.18 However, during the panic of September and October 2008, this situation underwent a sudden reversal, triggering capital outflows and
14 FormoredetailabouttradeinMERCOSURcountries,seeChapter2.15 Theconceptofcapitalforallcountriesincludesthenetcapitalbalance,thefinancialbalance(excludingforeigndirectinvestment),andanyerrorsandomissions.16 Triggeredas theywereby theapplicationofexport taxesbasedon the internationalprices ("mobilewithholdings")ofcertainagriculturalproducts.TheresolutionwasrejectedbytheSenateinJuly.17 Theconceptofforeigndirectinvestment(FDI)usedinthisReportcorrespondstothefamiliardefinitionofthebalanceofpayments(IMF[1993]):itconsistsofinvestmentsbyanentityresidentinaneconomy("directinvestor")toobtainlastinginterestinabusinessresidentinanothereconomy.Lastinginterestimpliestheexistenceofalong-termrelationshipandasignificantdegreeofinfluencebythe"directinvestor"overtherunningofthebusiness(10%ormoreoftheordinarysharesorofthedevotedpower).ForfurtherdetailonFDIflowsinMERCOSURseeChapter2.18 Inrecentyears,Brazilhasactedasadestinationfor"carrytrade",financialarbitrationtransactionsfromcountrieswithlowinterestratesand"weak"currencieslikeJapan.

9
a rapid depreciation of the real. But, while it held up, the strong influx of capital into Brazil brought about a relative depreciation of imports and weakened its credit balance in goods.
- Paraguay -
Like Argentina, Paraguayan export prices in 2007 rose with "food inflation," although the country also experienced the negative effects of the rising petroleum price. It thus saw only a slight improvement in its goods balance. This improvement was, however, counteracted by the worsening of incomes, transfers, and services balances, especially in transport. In 2007, Paraguay had a surplus in its current account equivalent to 1.1% of GDP, quite a way below the 2.4% of 2006. As with Brazil, the combination of financial and foreign direct investment was extremely important in 2007, representing 5% of GDP, with 3.5 p.p. corresponded to the second heading.
- Uruguay -
In Uruguay, the current account deficit fell from 1.9% of GDP in 2006 to 1% in 2007. Although the country benefitted from low petroleum prices in the first half and an acceleration in exports toward the end of the year, the annual result was a slight increase in the deficit of the goods balance, more than offset by higher income in the services and incomes balance. In the first half of 2008, the rising petroleum price hit the goods balance very hard: imports were up 82.5% on the same period the previous year and the current account deficit was estimated at 4% of GDP. This balance was covered by abundant inflows of direct investment and financial capital, equivalent to 5.8% and 9.6% of the product respectively.
- Venezuela -
The current account balance of Venezuela’s balance of payments was determined by the significant fluctuations in the petroleum price. In 2007, the surplus of this account stood at 8.8% of GDP, well below the 14.7% reached in 2006. The decline was due to the contraction of the petroleum price during the first half of 2007 (the world average for crude was down 1.3% on the same period the previous year), while imports grew steadily all year, around 41% annually. However, one of the consequences of the crisis erupting in mid-2007 was the extraordinary rise in the petroleum price: 76.6% up in the first half of 2008 on the same period in 2007. The current account surplus reached 17.2% of GDP in the first half of 2008, which is explained by the rising petroleum price and a slowdown of imports, which grew 12.7%.
In all these countries, levels of international reserves remained high and relatively stable between the second half of 2007 and the first half of 2008. Measured in months of imports, the reserves in that period were equal to 11.1, 15.1, 4.5, 7.5, and 8.2 for Argentina, Brazil, Paraguay, Uruguay, and Venezuela respectively. These figures represent slight reductions in Argentina and Uruguay against the level of the indicator in the preceding year, and a more significant fall in the case of Venezuela. The indicator rose in Brazil and Paraguay, however.
10
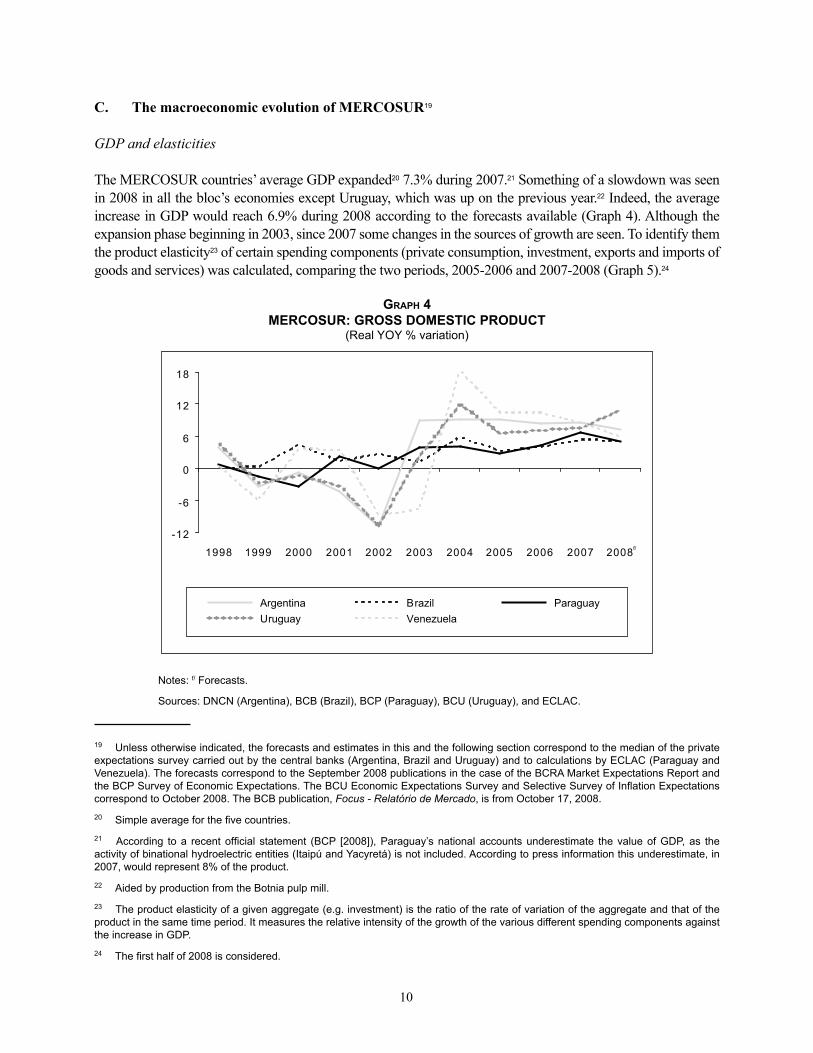
c. The macroeconomic evolution of mERcoSuR19
GDP and elasticities
The MERCOSUR countries’ average GDP expanded20 7.3% during 2007.21 Something of a slowdown was seen in 2008 in all the bloc’s economies except Uruguay, which was up on the previous year.22 Indeed, the average increase in GDP would reach 6.9% during 2008 according to the forecasts available (Graph 4). Although the expansion phase beginning in 2003, since 2007 some changes in the sources of growth are seen. To identify them the product elasticity23 of certain spending components (private consumption, investment, exports and imports of goods and services) was calculated, comparing the two periods, 2005-2006 and 2007-2008 (Graph 5).24
GrAph 4MERCOSUR: GROSS DOMESTIC pRODUCT
(RealYOY%variation)
-12
-6
0
6
12
18
1998 1999 2000 2001 2002 2003 2004 2005 2006 2007 2008f/
Argentina Brazil ParaguayUruguay Venezuela
Notes:f/Forecasts.
Sources:DNCN(Argentina),BCB(Brazil),BCP(Paraguay),BCU(Uruguay),andECLAC.
19 Unlessotherwiseindicated,theforecastsandestimatesinthisandthefollowingsectioncorrespondtothemedianoftheprivateexpectationssurveycarriedoutbythecentralbanks(Argentina,BrazilandUruguay)andtocalculationsbyECLAC(ParaguayandVenezuela).TheforecastscorrespondtotheSeptember2008publicationsinthecaseoftheBCRAMarketExpectationsReportandtheBCPSurveyofEconomicExpectations.TheBCUEconomicExpectationsSurveyandSelectiveSurveyofInflationExpectationscorrespondtoOctober2008.TheBCBpublication,Focus - Relatório de Mercado,isfromOctober17,2008.20 Simpleaverageforthefivecountries.21 According toa recentofficial statement (BCP [2008]),Paraguay’snationalaccountsunderestimate thevalueofGDP,as theactivityofbinationalhydroelectricentities(ItaipúandYacyretá)isnotincluded.Accordingtopressinformationthisunderestimate,in2007,wouldrepresent8%oftheproduct.22 AidedbyproductionfromtheBotniapulpmill.23 Theproductelasticityofagivenaggregate(e.g.investment)istheratiooftherateofvariationoftheaggregateandthatoftheproductinthesametimeperiod.ItmeasurestherelativeintensityofthegrowthofthevariousdifferentspendingcomponentsagainsttheincreaseinGDP.24 Thefirsthalfof2008isconsidered.

11
GrAph 5MERCOSUR: pRODUCT ELASTICITY OF THE MAIN SpENDING COMpONENTSa/
(2005-2006and2007-2008)b/
VENEZUELA
ARGENTINA BRAZIL
PARAGUAY URUGUAY
0
2
4Private consumption
Investment
Exports
Imports 0
2
4
6Private consumption
Investment
Exports
Imports
0
2
4Private consumption
Investmentc/
Exports
Imports 0
2
4
6Private consumption
Investment
Exports
Imports
0246
Private consumption
Investment
Exportsc/
Imports
2005-2006 2007-2008
Notes:a/ProductelasticityistheratiobetweentheaveragerateofvariationoftheaggregateandGDPinthesameperiod.ItmeasurestherelativeintensityofgrowthforthedifferentspendingcomponentsintermsoftheincreaseinGDP. Investment:Grossfixedcapitalformation+Stockvariation. Exportsandimports:includesgoodsandservices. b/Thedatafor2008arefromthefirsthalf. c/Thisgraphshowsproductelasticityinabsolutevalues.N.B.TheproductelasticitiesforinvestmentinParaguayin2005-2006andforVenezuelanexportsarenegativeinbothperiods.SeeTableAI.3inAnnexI.
Source:Authors’ownelaborationelaborationbasedondatafromDNCN(Argentina),IBGE(Brazil),BCU(Uruguay),BCP(Paraguay),BCV(Venezuela),andECLAC.

12
With the exception of Argentina and Venezuela, the GDP of the MERCOSUR economies grew more in the second than in the first of the periods in question. In terms of the sources of growth, two trends in 2007-2008 should be highlighted: on the one hand, the increase of product elasticity of investment in all countries except Venezuela and, on the other, the decrease of export elasticity in the five economies. This means that there was an increase in the importance of gross capital formation as an engine of growth, while the negative contribution of net exports was higher in the second stage.25 Import elasticity increased in Argentina, whereas in the other countries it fell. It has to be remembered that, in Brazil, the sensitivity of imports to variation in GDP remained high, at around 3.8.
In Argentina, GDP grew 8.7% in 2007 and a 7.2% rise is foreseen in 2008. The elasticity of private consumption rose slightly during 2007-2008, but remained close to the unit. In 2007, this was driven by rising real wages, employment, and credit, but slowed during the first half of 2008. On the one hand, this evolution is explained by a decline in consumer confidence related to inflation levels and the fallout of the dispute between the government and the agricultural sector. On the other hand, the lower growth of total wages owing to lower levels of job creation also impacted on the dynamism of family spending in the first half of 2008. The above increase in investment product elasticity was in response to the growth of durable production equipment (mainly imported), partially offset by a certain downturn in construction.
In brazil, GDP accelerated in 2007 (5.4% YOY) and is forecast to reach 5.2% during 2008. In 2007, the Brazilian economy underwent marked reheating, while the reduction of the pace of expansion foreseen for this year originates in the external sector, while internal demand holds steady. The elasticity of private consumption fell slightly over the periods analyzed, holding slightly above the unit, after the leap seen during the second quarter of 2006. Private consumption grew faster in 2007-2008 due to the increase in employment, real wages, and readier access to credit. The nominal appreciation of the real until July 2008 invigorated private consumption and also contributed to the significant rise in investment through the importation of capital goods. Construction also expanded, fuelled by greater access to mortgage loans. Investment elasticity thus rose from 1.3 in 2005-2006 to 2.9 in 2007-2008.
In Paraguay, GDP growth accelerated in 2007 (6.8% YOY) and a 5.1% increase in 2008 is foreseen. The main momentum came from the agricultural sector, which expanded 24.1% in 2007 and 11.3% YOY during the first half of 2008. While the elasticities of private consumption, exports, and imports were down over the periods analyzed, investment elasticity reached 2.4 in 2007-2008.
In uruguay, GDP grew 7.4% in 2007 and a rise of 10.8% is foreseen for 2008. With the exception of investment, all the spending components analyzed showed a downturn in product elasticity during the second period. On the supply side, the expansion of activity was headed by services (transport, storage, and communications; trade, restaurants, and hotels) and manufacturing due to the entry into operation of the Botnia pulp mill, the activity of the National Administration of Fuels, Alcohol, and Portland (ANCAP), and the growth of the refrigeration industry.
The GDP of venezuela slowed to 8.4% in 2007 and a 6% rise is expected in 2008. It is worth remembering that a sharp tailoff in the pace of growth was seen in the first three months of 2008, partially offset during the following quarter. Investment and import elasticities fell, while export elasticity, which is negative, rose in absolute terms. Furthermore, the elasticity of private consumption stood at 2 in 2007-
25 Thenegativecontributiontogrowthoftheexternalsectorimpliesthatimportsaregrowingmorethanexports.

13
2008, the maximum level within the bloc. The improvement in its terms of trade allowed Venezuela to raise consumption and investment far above GDP. This had its correlate in the high negative contribution of its net exports. Last, differentiated behavior is seen between petroleum and non-petroleum activity: whereas the former shrank 4.2% in 2007 and rose 3.2% in the first half of 2008, the latter grew 9.5% and 6.5% respectively.
d. Economic policy: instruments and results
Inflation
Between the second half of 2007 and the first half of 2008, the main macroeconomic problem of the members of MERCOSUR was inflation. This phenomenon is similar to that in many other countries and is associated with certain characteristics of the international financial scenario explained above. During 2007, the increase in retail prices averaged 10%26 and a larger rise is foreseen for 2008 (Graph 6).27 In all cases, inflation originated both in internal and external factors. Within the last group, the international rise in the price of food (Box B) and fuels was particularly remarkable. In any event, it is worth pointing out that the fall in commodity prices from July 2008, fuelled as it was by investors unwinding positions in real assets, the deepening financial crisis, and the prospects of world economic slowdown, has begun to mitigate inflationary pressures.
According to official figures, the variation in the consumer price index (IPC-GBA)28 in Argentina was 8.5% during 2007 and would stand at around 9.1% in 2008. Other official indicators,29 however, suggest larger increases. Among the main internal factors fuelling inflation are, on the one hand, the pressure of demand stimulated by income policy, and the acceleration of public spending, and on the other, the adjustments of certain regulated prices (transport, certain public services). In the context of heavy external inflationary pressures, Argentina has applied a variety of sectoral measures, particularly in energy and food, in an attempt to separate the behavior of internal from external prices.
In brazil, retail inflation, as measured by the IPCA, stood at 4.5% during 2007 (3.1% in 2006) and would rise to 6.2% this year, while still staying within the target (4.5% with a margin of ±2 p.p.). This acceleration stemmed largely from the reactivation of internal demand, encouraged by the depreciation of credit and the influx of external capital prevailing until September. On the other hand, although the appreciation of the real helped to mitigate inflation by anchoring inflationary expectations and containing the price of the imported goods, it also fuelled the rise in internal demand precisely via imports and the price of tradables actually continued to accelerate.30 Other factors also fuelling inflation were the expansion of total wages, the international rise of raw materials prices, and the adjustments of certain regulated prices (public transport, education).
26 Simpleaverageforthefivecountries.27 Argentina,ParaguayandVenezuelaimplementedvariousdifferentchangesinthemethodologyforcalculatingtheCPIin2008.Thisiswhyrecentinflationratesmaynotbestrictlycomparablewithpreviousones.28 ConsumerPriceIndexfortheAutonomousCityofBuenosAiresandGreaterBuenosAires.29 ThenationalCPI,wholesaleprices,GDPimplicitprices.30 ThepriceoftradablegoodsincreasedatgrowingYOYratesbetweenAprilandSeptember2007,andDecember2007andJune2008.

14
Box BSTRUCTURAL AND SITUATIONAL CAUSES OF FOOD INFLATION
Overthelasthalfadecadethepricesofrawmaterialsrosesignificantlyasaresultoftheexpansionofworlddemand.Food,whichhadlaggedquiteawaybehindfuelsandmetals,rosesubstantiallyinpricethroughout2007andthefirsttwomonthsof2008.LastJune,theywere67%abovetheaveragelevelfor2006.InthecontextoftheinternationalfinancialcrisisbeginninginAugust2007,inflationbecameaseriousglobalmacroeconomicproblemuntilatleastJuly2008,whencommoditypricesbegantofall.Inthecaseoffood,pricesfell14%betweenJuneandSeptember.
FOOD pRICE INDExa/
(Average1998-2000=100)
80
100
120
140
160
180
200
220
2000
2001
2002
2003
2004
2005
2006
2007
Jun-
07Ju
l-07
Aug
-07
Sep
-07
Oct
-07
Nov
-07
Dec
-07
Jan-
08F
eb-0
8M
ar-0
8A
pr-0
8M
ay-0
8Ju
n-08
Jul-0
8A
ug-0
8S
ep-0
8
Start of stronggrowth phase of world economy
Start of internationalfinancial crisis
Notes:a/Includes55rawfoodmaterials.
Source:FAO.
Variousfactorshavecontributedtorisingfoodpriceinrecentyears.Onthedemandside,themainmomentumhascomefromtherapidgrowthofdevelopingcountries(DGCs),particularlyChinaandIndia.Thisnotonlydirectlydroveupthetotalamountoffoodconsumed,buttheimprovementinthequalityoflifeintheseeconomiesthroughtheincorporationofhigherproportionsofproteinsinthediet(foundinmeatanddairyproducts)hasindirectlyincreaseddemandforcertaingrainsforlivestockfodder.
Anotherrelevantfactoristheuseofcertaincropsinbiofuelproduction,encouragedbythesubsidiesgrantedforthispurposeintheDDCsinthefaceofhighenergyprices,whichreducesthesupplyavailableforfood,aswellasthatofothercropscompetingforland.Morerecently,animportantfactorinexplainingthepriceriseisthespeculativedemandforagriculturalcommodities,oneoftheexpressionsoftheinternationalfinancialcrisisduringthesecondhalfof2007andthefirsthalfof2008.
Ontheotherhand,certainstructuralquestionshavelimitedtheincreaseinfoodsupply.Theseincludeclimatechange,urbandevelopmentrestrictinglandandwateruse,andtheimpactoftherisingpetroleumpriceonthepriceoffertilizers,energy,andtransportcosts.DDCs’protectionistpolicies isalsoacontributingfactor in thissense,astheyreplacethetraditional formsofaid,whichstimulatedincreasedproductionthroughsubsidiesthatbearnorelationtotheamountproduced.Intheshortterm,thesupplyhasalsobeenaffectedbyclimaticconditionsandepidemics,aswellasrestrictionsonexportsinsomebigproducercountries.Inshort,theincreaseinfoodpricesisexplainedbyasteadyincreaseindemandthatexceedsthecapacitytomeetsupply,givingrisetoareductionofworldstocksandgeneratingabullishtrendaggravatedbyfinancialandsituationalfactors.
"Foodinflation"hasbeenaconcernforeconomicpolicytheworldover,particularlyinDGCs,whereahigherproportionofincomeisspentonfood. Indeed,whereasfoodanddrink inDDCsimpact inflationby lessthan15%, in theMERCOSUReconomiesthefigureisabout30%(exceptforBrazil,wheretheweightingisashighas22.1%).Although,fromJuly2008,aconsiderablereductionwasseeninrawmaterialsprices,decompressinginflationarypressure,theseremainatrecordhighs.

15
Box B (Continued)
In Paraguay, retail inflation stood at 6% during 2007, within the 5% target range (with a margin of ±2.5 p.p.). The largest increases were seen during the first half, as a result of price rises in fruit and vegetables due to certain import restrictions. After a slowdown in the second half of 2007, inflation rose again in 2008, fuelled by other foods. This factor, like higher energy prices, would push inflation up to around 9.7% by the end of the year, above the 4.5% target with a ±2 p.p. margin of tolerance.
The consumer price index (IPC) in uruguay was up 8.5% in 2007, 2 p.p. above the ceiling of the target range (4.5-6.5%). The main inflationary factors came from tradables, especially fuel and food. In the
During2007andthefirsthalfof2008,retailinflationunderthefoodanddrinkheadingexceededtheriseinthegenerallevelofpricesinallMERCOSURcountrieswiththeexceptionofArgentina,wherethevariationwaspracticallyidentical.Thus,whileinthetwolargesteconomiesthisheadingaccountedforalmostathirdoftotalinflation,inParaguayandUruguayitcontributedoverhalfoftheincrease,andinVenezuela44.2%.
Intheframeworkofanti-inflationarypolicy,MERCOSURgovernmentsadoptedavarietyofdifferentmeasuresgearedspecificallytocontainingfoodprices.Theseincludetheliberalizationand/orsimplificationofimportsofcertainkeyproducts(Brazil,Paraguayand Uruguay), the reduction or suspension of value added tax (VAT) or other taxes on certain foods (Brazil, Uruguay andVenezuela),agreementsandotherpricecontrols(Argentina,Paraguay,andUruguay),quantitativeprohibitionandrestrictionscertainexports(Argentina),increaseddutiesonagriculturalexports(Argentina),andcompensationforproducers(Argentina).Tocurbrisingpriceswithoutreducingexternalsales,Brazillaunchedaprogramtostimulatetheproductionofsensitivefoodsthroughsoftloans,guaranteeingthepaymentofminimumprices.
RETAIL INFLATION(2007andfirsthalfof2008a/)
0
2
4
6
8
10
12
14
16
18
20
2007 2007 2007 2007 20070
5
10
15
20
25
30
35
Argentina(left axis)
Brazil(left axis)
Paraguay(left axis)
Uruguay(left axis)
Venezuela(left axis)
20081st H
20081st H
20081st H
20081st H
20081st H
General level Food and drink
Note:a/CumulativetoJune.
Sources:INDEC(Argentina),IBGE(Brazil),BCP(Paraguay),INE(Uruguay),andINE(Venezuela).

16
latter case, aside from the international rise, prices were driven up by poor climatic conditions affecting the production of meat, fruit, and vegetables. In 2008, retail inflation would remain at the same level as the previous year, again above the target maximum. Certain fiscal measures were implemented to ease inflationary tension: a fund was set up to subsidize the price of collective urban transport and a cut stipulated in tariffs on fuel, telephony, and electricity, and the health quota, the elimination of the foreign currency purchase tax (ICOME) paid by public sector companies and the exemption from value added tax (VAT) for poultry.
Retail inflation in venezuela, as measured by the National Consumer Price Index (INPC), accelerated in 2007 (22.5%) and the first half of 2008 (15.1% cumulative between January and June). The monetary authorities’ forecast for 2008 was revised to 19% from an initially expected 11%, although it may be higher, as YOY variations of over 30% were seen between June and September 2008. Among the main explanatory factors were rising food prices, the shortage of certain essential products and the rise of the unofficial exchange rate in the second half of 2007 in a context of some policy uncertainty.
Monetary policy and exchange
As mentioned above, the inflationary acceleration seen during 2007 and the first half of 2008 was the main challenge facing monetary policy in MERCOSUR countries. This responded in various ways, hardening conditions in the monetary markets. In certain cases, the Central Bank also had to contend with the pressure of appreciating currencies (Graph 7).
GrAph 6MERCOSUR: CONSUMER pRICE INDEx
(%YOYvariationinDecembereachyear)
-2
4
10
16
22
28
34
40
1998
1999
2000
2001
2002
2003
2004
2005
2006
2007
2008
f/
Argentina BrazilParaguay
UruguayVenezuela/a
Notes:f/Forecasts. a/Thedatafor2008correspondstotheYOYvariationinSeptember.
Sources:INDEC,IBGE,BCP,BCU,INE,andECLAC.
GrAph 7MERCOSUR: REAL EFFECTIVE ExCHANGE RATE
(2000=100Index-Endofperiod)
60
90
120
150
180
210
240
1998
1999
2000
2001
2002
2003
2004
2005
2006
2007
2008
a/
Argentina BrazilParaguay
UruguayVenezuela
Note:a/June.
Source:ECLAC.

17
- Argentina -
Between 2007 and 2008, policy centered on maintaining exchange competitiveness and the preventive accumulation of international reserves began to be eroded by inflationary pressures. In particular, during the second quarter of 2008, the above agricultural dispute brought about a deterioration in expectations, which translated into a fall in the price of government securities, deposit levels, and liquidity in the banks. In order to contain the loss of trust reflected in the foreign exchange market, the BCRA sold foreign currencies and boosted the nominal appreciation of the peso, while interest rates increased. In June 2008, these reached the maximum for the last five years, although they remain at moderate levels and are, in some cases, negative in real terms.31 The BCRA subsequently provided the banks with liquidity through various monetary instruments. The exchange intervention in the period of instability translated into a fall in international reserves from US$50.5 billion in March 2008 to US$47.5 billion by the end of June. Even so, they were 10.1% higher than a year ago. In September 2008, the government announced the use of US$6.7 billion of international reserves to pay off the debt with the Paris Club, though, in the context of the international financial crisis, it was stated by mid-October that payment would be made in as yet undefined stages.
During 2007 and the first half of 2008, the means of payment (M2)32 rose by 17.9% and 16% YOY respectively, fuelled by loans to the private sector. On the supply side, the purchase of foreign currencies was one of the most important sources of money creation until the first quarter of 2008, whereas the public sector, fixed-term deposits, and Repos were the main contractive factors. As in previous years, the BCRA partially sterilized monetization from the external private sector via LEBAC and NOBAC placement. However, as mentioned earlier, from the second quarter of 2008, Central Bank securities contributed to increasing the money supply. Deposits continued to increase (16.2% YOY in June 2008), fuelled by non-index-linked current account fixed-term investments.
The nominal dollar exchange rate, on the other hand, depreciated 2.6% in 2007. Although inflation was higher than that of the main trade partners, the nominal appreciation of the Brazilian real up to the October crisis helped to raise the real effective exchange rate 8.2% in 2007 and 1.1% during the first half of 2008.
- Brazil -
To contain inflation the Central Bank of Brazil (BCB) gradually raised the Special System for Settlement and Custody benchmark interest rate (SELIC) from 11.25% in March 2008 to 13.75% in September, allowing the nominal appreciation of the real (16.9% in 2007 and 9.4% up to June 2008), although it bought foreign currencies in any event. Reserves were up 110% during 2007 and by mid-2008 stood at 36.5% above the level of June 2007.
During the first half of 2008, M233 was up 27.6% YOY. The intervention of the BCB in the foreign exchange market was the main source of money creation. The operations with federal government securities and the expansion of deposits contributed along the same lines, while the National Treasury was a contractive factor.
31 InJune2008,themaininterestratesstoodat9%(CentralBank´s7-dayReporate),13%(30-44-dayfixed-termpesodeposits),17.5%(BuenosAiresDepositLargeAmountRate,orBADLAR,forprivatebanks,for30-35-dayoperationsoverAR$1million),and11.8%(12-monthCentralBankBills,orLEBAC).32 Billsandcoins+pesocurrentaccountdeposits+pesodepositsinsavingsaccounts.33 Billsandcoins+currentaccountdeposits+depositsforinvestment+savingsaccountdeposits+privatesecurities(fixed-termdeposits,billsofexchange,mortgagepaymentsandrealestatepayments).

18
The demand for money, on the other hand, was fuelled by the dynamism of credit, explained by the interest rates cuts between late 2005 and early 2008. Thus, in mid-2008 loans represented 36.6% of GDP, the highest level in over thirteen years.
The Brazilian real appreciated 13.5% in real terms during 2007 and 6.6% in the first half of 2008 in relation to its main trade partners. In 2008, to alleviate the negative effects on activity, the Government suspended the levying of the Financial Operations Tax (IOF) on exports, eliminated the obligatory repatriation of export-derived foreign currencies, and created an IOF for certain applications of foreign investors in order to discourage the influx of speculative capital.
- Paraguay -
The Central Bank of Paraguay (BCP) continued to be geared to mitigating the pressure on price levels via the inflation targets system and to containing the appreciation of the guaraní.
The inflows of foreign currencies from Binational Entities (Yacyretá and Itaipú) and from the increase of public and private deposits in the financial system fuelled the nominal appreciation of the guaraní against the dollar (11% during 2007 and 15.7% in the first half of 2008), in spite of the BCP’s significant intervention in the foreign exchange market.
The purchase of foreign currencies by the monetary authority constituted the main source of money creation and, in June 2008, reserves were 48.5% up on a year ago. In order to sterilize monetization and contain its inflationary effect, the BCP increased the placement of securities and raised interest rates. A new instrument, the Short-Term Liquidity Facility with Monetary Regulation Instruments Distribution (FLIR), was also approved.
In real terms, the guaraní appreciated 5.8% during 2007 and 12.4% in the first half of 2008. Although Paraguay’s rate of inflation is higher than those of several of its trade partners, the fall in the real effective exchange rate was not serious due to the revaluation of the real.
The rise in interest rates was transferred to the rest of the financial system at the start of 2008, stimulating the growth of deposits (29% YOY in June 2008), particularly in local currency. Foreign currency placements continued to rise in spite of the appreciation of the guaraní.
- Uruguay-
The Central Bank of Uruguay (BCU) decided to shift the focus of monetary policy away from pursuing M1 to setting the interbank interest rate (call), which went from 5% in September 2007 to 7.75% in October 2008. Faced with inflationary pressure and given that the margin for increasing rates is narrow, the BCU increased reserves for short-term deposits and raised the inflation tolerance range from 4-6% to 3-7% in 2008. In spite of this, as previously mentioned, this year CPI variation would be over the target.
The BCU’s intervention in the foreign exchange market was more limited than in other countries in the bloc. The capital inflow stemming from rising interest rates and the higher inflows of foreign currency due to exports translated into a nominal appreciation of the peso of 11.3% in 2007 and 10.1% until June 2008. The real effective exchange rate was down 3.3% during 2007 and 7% in the first six months of 2008.

19
The M1 monetary aggregate expanded 32% in 2007 and 28% YOY in June 2008, fuelled by the dynamism of demand deposits. In a context of foreign exchange appreciation, peso placements expanded steadily, while foreign currency deposits fell, although they still represent 78% of the total.
- Venezuela -
As of February 2007, Venezuela began to implement an anti-inflationary program that includes price controls, a slowdown in public spending, and a contractive monetary policy, via the sale of structured notes (packages of assets in dollars acquirable in local currency), the increased supply of foreign currencies by the Commission of Foreign Exchange Administration (CADIVI), the transfer of US$1.5 billion from the reserves to the National Development Fund (FONDEN), increased reserves, higher interest rates, dollars payments of liabilities by the Government, and the increase of the minimum limits of active rates. Whereas in the first half of 2007, the bills and coins in circulation grew at an average effective rate of 22.1%, they did so at 9.3% in the same period of 2008. Between May and June an average real contraction of 2.8% was seen in this aggregate. In mid-2008, the reserves of the Central Bank came to US$33.56 billion (10.1 months of imports).
In January 2008, a monetary reconversion was implemented, by means of which three zeros were docked from the bolívar, which was replaced by the strong bolívar (BsF). The official exchange rate remains fixed at 2.15 BsF per dollar, and the regime of foreign currency management and the restrictions on the outflow of capital remain in place.
Fiscal policy
During 2007 and the first half of 2008, MERCOSUR countries, with the exception of Venezuela, continued to see primary surpluses. In the first half of 2008, Argentina and Paraguay obtained financial surpluses, while this result in Brazil and Uruguay was slightly negative. In all MERCOSUR countries, the share of the public debt in GDP continues to fall as a result of GDP growth (Table 1).
- Argentina -
Argentina’s primary surplus reached 3.2% of GDP over 2007. Primary spending in the public sector grew faster than revenues (37.1% and 32.3% YOY respectively). If one excludes the transfer of stock accumulated in individual capitalization accounts as a result of the 2007 social security reform, the primary result for 2007 would be 2.2% of the product. During the first half of 2008, the primary surplus represented 4.1% of GDP, 3.8% up on the same period the previous year. The rise is explained by the Central Bank’s advance on profits during May and June 2008. A surplus of 3.5% of the product by 2008 is forecast.34
During the first half of 2008, revenue rose 38.3% and primary spending 37.4% YOY. Collection increased in all tax categories, notably VAT, income tax (both linked to levels of activity and inflation), and export duty (fuelled by the increase in aliquots and commodities prices). Last, the higher revenues due to social security are explained by rising numbers of contributors, a result of the social security reform, and to rising nominal
34 Ifthestockoftheabovecapitalizationaccountsisexcluded,theprimaryresultwouldbe3.9%duringthefirsthalfof2008(3.0%duringthesameperiodin2007).

20
wages. The increase in spending during the first half of 2008 stems mainly from subsidies to the private sector (energy, transport), which were up 64.9% YOY, at around 1% of GDP.
tABle 1MERCOSUR: MAIN FISCAL INDICATORS
(%ofGDP)
Country period primary Resulta/ Interesta/ Financial Resulta/ public Debtb/
Argentina 2007 3.2 2.0 1.1 56.1
20071stH 3.8 1.7 2.1 59.3
20081stH 4.1 1.4 2.7 48.8
Brazil 2007 4.0 6.2 -2.3 42.7
20071stH 5.8 6.4 -0.6 44.1
20081stH 6.2 6.4 -0.1 40.4
Paraguay 2007 1.8 0.8 1.0 23.2
20071stH 4.2 0.8 3.4 n.a.
20081stH 4.4 0.7 3.7 20.6
Uruguay 2007 3.6 3.6 0.0 70.7
20071stH 3.2 4.4 -1.1 66.7
20081stH 1.3 1.4 -0.1 61.5
Venezuela 2007 -1.0 1.6 -2.6 23.2
20071stH n.a. n.a. n.a. 17.8
20081stH n.a. n.a. n.a. 18.0
Notes:n.a.:notavailable. a/Argentina:CentralGovernment.Asof2007,duetoachangeofmethodology,coparticipableresourcesandderivedspendingareexcluded.BrazilandUruguay:ConsolidatedPublicsector.Paraguay:Centralgovernment.Venezuela:RestrictedPublicsector. b/Argentina:TotalGrossNationalPublicSectorDebt.NotincludingUS$30.612billioncorrespondingtodebtwithcreditorswhodidnotaccepttheexchange(holdouts)equivalentto10%ofGDPinthefirsthalfof2008.TocalculateGDPtheaverageofthelastfourquarterswastaken.Brazil:PublicSectorNetDebt(PSND).Itdiffersfromthepreviousreportowingtochangesintheoriginalsource.Paraguay:Non-FinancialPublicSectorDebt.Thedatafrom2008isanannualforecastbytheIMFbasedonofficialdataandstaffestimates.Uruguay:GrossGlobalPublicSectorDebt,includingBCUdebt.Venezuela:Grosspublicdebt.
Sources:Authors’ownelaborationwithdatafromTreasuryandFinanceSecretariats(Argentina),TreasuryMinistry,IPEA(Brazil),BCP,TreasuryMinistry,andIMF(Paraguay),EconomyandFinanceMinistry(Uruguay),andtheMinistryofthePopularPowerforEconomyandFinance(Venezuela).
The public debt as a proportion of GDP continued to fall during 2007 and the first half of 2008, reaching 48.8%. This decrease is due to GDP growing at levels higher than the debt, the latter rising in absolute terms: in June 2008 it came to US$150 billion, 5 billion more than December the previous year. As already mentioned, in September 2008, it was announced, on the one hand, that the Paris Club debt (approximately US$6.7 billion) would be paid making use of Central Bank reserves and, on the other, that the restructuring of government bonds

21
(amounting to US$30.6 billion) for creditors who did not join the exchange of the debt in 2005 ("holdouts") would be reopened. However, the deadlines for the two operations have not yet been defined.35
- Brazil -
In Brazil, the primary surplus of the consolidated public sector represented 4% of GDP and the financial deficit 2.3% of the product during 2007. There was a notable increase in the primary surplus during the first half of 2008, which stood at around 6.2% of GDP (5.8% in the same period the previous year). This surplus covered almost all interest, resulting in a nominal deficit of just 0.1% of the product. The central government’s higher surplus, partially offset by the reduction of the surplus of regional governments and state companies, contributed to the increase.
The central government’s total income grew 16.7%, while primary spending rose by just 9.8%. Tax collection expanded in all categories, fuelled by the dynamism of economic activity. On the one hand, the collection of income tax rose due to higher company profits and the increase in total wages, as did tax on industrialized products due to higher manufacturing production (especially, the automotive industry) and import tariffs due to higher levels of external purchasing. On the other hand, revenues rose due to contributions to social security funding, the social contribution on net earnings (whose aliquot was increased), and the social integration program. It should be stressed that the tax on financial operations offset any collection losses from the elimination of the provisional contribution on financial movements ("check tax") in December 2007. The slowdown of primary spending, on the other hand, is due to the delay in the approval of the budget in March 2008. Capital spending rose faster than total expenditure in the framework of the Growth Acceleration Program.
In June 2008, the net public sector debt represented 40.4% of GDP, as against 42.7% in December the previous year.
- Paraguay -
In 2007, fiscal income grew more than spending (13.1% and 10% YOY respectively) and the global result represented 1% of GDP, continuing the surplus trend since the signing of the IMF agreement in 2003. In this framework, fiscal policy in Paraguay retains the main features of previous years: low tax pressure, offset partly by revenue from the Itaipú and Yacyretá hydroelectric power stations (3.3% of GDP in 2007), and public spending, where current expenditure predominates (three quarters of total disbursements in 2007).
During the first half of 2008, public revenues grew 16.6%, fuelled by VAT collection and income tax from the strong performance of activity levels. Revenue from import duties fell due to the appreciation of the guaraní. Total spending grew 13.6% during the first half of 2008 due to the increase of expenditure under personnel.
35 Inmid-October,thegovernmentannouncedanewreformofthesocialsecurityregime,consistingofthenationalizationoftheprivatesystem(AFJP).Intheeventofreceivinglegislativeapproval,thiswillhaveapositiveshort-termimpactongovernmentfinance,asboththestocksaccumulatedintheindividualcapitalizationaccountsandfuturecontributionswillcomeunderstatecontrol.

22
The public debt represented 23.2% of GDP in 2007 and could reach 20.6% of GDP by the end of 2008. Between December 2007 and June 2008, it fell slightly in absolute terms.
- Uruguay -
The primary result in 2007 represented 3.6% of GDP in Uruguay. This figure was equivalent to interest on the debt, as a result of which the global result balanced. During the first half of 2008, there was a significant fall in the primary surplus, equivalent to 1.3% of GDP. This lower surplus is explained by the expansion of spending, due mainly to transfers to the private sector, and by the expansion of the public sector deficit. On the other hand, interest dropped to 1.4% of GDP, giving rise to a global deficit of 0.1% of the product.
The public debt represented 70.7% of the product in December 2007 and fell to 61.5% in the first half of 2008 due to the rise in GDP, while the debt grew in nominal terms.
- Venezuela -
In Venezuela, the sign of the primary restricted public sector result36 was reversed, with a deficit of 1% of GDP (0.6% surplus in 2006). In terms of interest on the debt, the global deficit represented 2.6% of the product. It should be stressed that the slowdown of both total revenue and spending during 2007 contributed to their reduction as a percentage of GDP. The slowdown in revenue is explained by weaker flows due to utilities, dividends, and commissions, associated with the lower petroleum price up to August 2007. The lowest growth in spending comes from falling purchases of goods and services and from more moderate transfers to public organizations.
The public debt represented 23.2% of the product during 2007 and 18% during the first half of 2008 respectively. The falling ratio is due to rising GDP, as the debt also grew in absolute terms.
E. Incomes and employment
MERCOSUR countries’ per capita GDP rose 6.1% on average in 2007 and a variation of 5.6% in real terms is expected in 2008.37 Uruguay should have the best performance in 2008, with a rise of 10.7% of the product per inhabitant, followed by Argentina (6.2%) and Venezuela (4.2%). In Brazil (3.8%) and Paraguay (3.1%), per capita GDP should once again rise less than in the other partners, as in recent years (see Tables AI.8 in Annex I). These two countries’ GDP per inhabitant should remain below the MERCOSUR average.
Economic growth continued to fuel the rise in total wages in MERCOSUR countries during 2007 and the first half of 2008, both via new job creation, with the notable performance of formal employment, and improved pay. Unemployment rates fell in all countries in the bloc and currently stand at minimum levels
36 TherestrictedpublicsectorismadeupoftheBudgetaryCentralGovernment,VenezuelaPetroleumsInc.(PDVSA),theSampleofNon-FinancialPublicCompanies,theVenezuelanInstituteofSocialSecurity(IVSS),andtheDepositsGuaranteeandBankProtectionFund(FOGADE).Itdoesnotincludethesocialactionprogramsor"missions."37 Simpleaverageforthefivecountries.Thefiguresto2007correspondtoconstantpricemeasurementfor2000.Source:ECLAC.TheforecastsaretheAuthors’ownelaboration.

23
of recent years (Graph 8). Unemployment in MERCOSUR on average38 affected 8.1% of the economically active population (EAP) in 2007.
GrAph 8MERCOSUR: RATE OF UNEMpLOYMENT
(As%ofEAP)
46
81012
1416
1820
2003 2004 2005 2006 2007 2008a/
Argentinab/ Brazilc/ Paraguayd/
Uruguaye/ Venezuelaf/
Notes:a/Datacorrespondingtothefirsthalf.ThedataforParaguayisnotavailable. b/ Urban areas. The beneficiaries of social plans performing related labor considerations areconsideredemployed. c/Sixmetropolitanareas. d/Totalpopulation(urbanandrural).Thefiguresdonotcoincidewiththepreviousreport,asruralareaswerenotincludedbefore2006. e/In2006,theNationalSurveyofHouseholdswasexpandedtoalsoincluderuralareas.Thefiguresfromthisyeararethereforenotcomparablewithpreviousyears(urbantotal). e/Nationaltotal.
Sources:INDEC,IBGE,INE,DGEEC,ECLAC.
In Brazil, Uruguay, and Venezuela, the dynamism of activity levels meant greater job creation. Employment product elasticity39 stood at 0.6 in Brazil and Venezuela during the first half of 2008, slightly lower than in Uruguay during 2007. In Paraguay, elasticity reached a level close to the unit in 2007. In Argentina, however, expansion created fewer jobs than in previous years. Employment-product elasticity fell at 0.2 during the first half of 2008 (see Table A.I.9 in Annex I).
Real wages continued their upward trend in all countries in the bloc with the exception of Venezuela, where they fell 2% YOY during the first half of 2008 due to the rising rate of inflation. In Brazil, Paraguay, and Uruguay, the pace of growth of real remunerations slowed. Argentina, on the other hand, saw a higher increase in real wages over previous years if the IPC-GBA is used as a deflator. Nevertheless, the adjustment based on other official indexes (like the National CPI or GDP implicit prices) and on private estimates suggests a slowdown (see Table A.I.10 in Annex I).
38 Simpleaverageforthefivecountries.39 VariationinthenumberofemployedinrelationtovariationinGDP.

24
f. conclusions
The MERCOSUR economies have kept up high growth rates and continued to show falling unemployment indexes. Between 2007 and 2008, there was a deepening of the shift in growth factors from net exports, which prevailed in the initial stages of recovery after the crisis, toward internal demand and, in particular, investment. With the appearance of the first financial tremors in the second half of 2007, external inflationary pressures joined the scenario of internal dynamism. The increase in international food and energy prices affected all countries in the bloc and largely determined economic policy actions.
Halfway through 2008, however, the impact of the international crisis, now in full swing, is changing the focus of the macroeconomic situation. First, as external inflationary factors have been tailing off due to the change in the prices of raw materials, the main macroeconomic problems have come to be related to the variables of the balance of payments and the pace of activity. In the new context, external demand is weakening due both to prices and quantities, while competition from third markets is on the increase. The new scenario could also have negative consequences in several MERCOSUR countries in terms of fiscal collection in the medium term.
Second, the flow of external funding both private and public, which did not in general undergo net contractions due to the international crisis up to July 2008, will probably show greater volatility. The monetary and fiscal tools must aim simultaneously to preserve the sustainability of the external and fiscal balances. On a favorable note, and despite still warranting the attention of the bloc’s economic authorities, it is worth noting that the respective financial institutions’ capital position has been less exposed to the toxic assets that have affected global finances.
Last, the impact of a common external shock presents a favorable occasion for the macroeconomic coordination of MERCOSUR countries. The significant depreciation of the Brazilian real in September-October 2008 in a context of the country’s trade surplus with the rest of its partners will probably, among other issues, become a reason for dialogue among the authorities.

i
ANNEx I
tABle Ai.1MERCOSUR: GROSS DOMESTIC pRODUCT
(RealYOY%variation)
Year Argentina Brazil paraguay Uruguay Venezuelaa/ MERCOSURb/
1998 3.9 0.0 0.6 4.5 0.3 1.9
1999 -3.4 0.3 -1.5 -2.8 -6 -2.7
2000 -0.8 4.3 -3.3 -1.4 3.7 0.5
2001 -4.4 1.3 2.1 -3.4 3.4 -0.2
2002 -10.9 2.7 0.0 -11.0 -8.9 -5.6
2003 8.8 1.1 3.8 2.2 -7.8 1.6
2004 9.0 5.7 4.1 11.8 18.3 9.8
2005 9.2 3.2 2.9 6.6 10.3 6.4
2006 8.5 3.8 4.3 7.0 10.3 6.8
2007 8.7 5.4 6.8 7.4 8.4 7.3
2008f/ 7.2 5.2 5.1 10.8 6.0 6.9
Notes: a/Thefiguresfor2003-2006differfromtheprevious,astherewasachangeinthedatafromECLAC,whichtakesofficialdatafromVenezuela. b/Simpleaverageforthefivecountries. f/Forecasts.ForArgentina,Brazil,Paraguay,andUruguay,forecastscorrespondtothemarketexpectationssurveycarriedoutbytheCentralBanks,whileinVenezuela’scasethiswasproducedbyECLAC.
Sources:DNCN(Argentina),BCRA(Argentina),IBGE(Brazil),BCB(Brazil),BCP(Paraguay),BCU(Uruguay)yECLAC.
tABle Ai.2MERCOSUR: TERMS OF TRADE
(Indexes1998=100)
Year Argentina Brazil paraguay Uruguay Venezuela MERCOSURa/
1998 100.0 100.0 100.0 100.0 100.0 100.0
1999 94.0 86.8 94.1 91.9 129.1 99.2
2000 103.5 89.4 92.6 95.8 195.2 115.3
2001 102.7 89.2 92.8 99.6 160.5 109.0
2002 102.4 87.9 89.5 98.2 171.0 109.8
2003 111.8 86.7 93.9 99.1 192.7 116.8
2004 113.5 87.1 96.6 95.7 230.5 124.7
2005 111.3 87.9 90.2 86.9 301.4 135.5
2006 118.0 92.5 88.5 85.0 359.9 148.8
2007 122.3 94.5 92.7 86.6 394.6 158.1
Notes:a/Simpleaverageforthefivecountries. n.a.:notavailable.
Source:ECLAC.

iiii
tABle Ai.3MERCOSUR: pRODUCT ELASTICITYa/ OF DIFFERENT
AGGREGATE DEMAND COMpONENTS(Averagefortheperiod)
Country / Bloc and aggregate demand component
YOY variation product elasticity
2005-2006 2007-2008 2005-2006 2007-2008
MERCOSURb/
GDP 6.6 7.8
Privateconsumption 8.4 9.5 1.3 1.2
Investmentc/ 12.5 21.6 1.5 2.7
Exportsd/ 8.6 6.0 1.8 0.7
Importse/ 18.3 19.6 3.0 2.6
Netexportsf/ -1.2 -1.9
Argentina
GDP 8.8 8.3
Privateconsumption 8.3 8.4 0.9 1.0
Investmentc/ 16.5 18.0 1.9 2.2
Exportsd/ 10.4 5.5 1.2 0.7
Importse/ 17.8 21.6 2.0 2.6
Netexportsf/ -0.8 -1.9
Brazil
GDP 3.3 5.7
Privateconsumption 4.5 6.6 1.4 1.2
Investmentc/ 4.4 16.3 1.3 2.9
Exportsd/ 7.4 4.1 2.2 0.7
Importse/ 13.7 21.6 4.2 3.8
Netexportsf/ -1.9 -3.1
Paraguay
GDP 3.6 7.5
Privateconsumption 4.5 6.9 1.3 0.9
Investmentc/ -3.4 18.0 -0.9 2.4
Exportsd/ 13.3 12.1 3.7 1.6
Importse/ 12.8 14.7 3.5 2.0
Netexportsf/ 0.2 -0.4
Uruguay
GDP 6.8 10.3
Privateconsumption 7.7 11.2 1.1 1.1
Investmentc/ 14.1 38.9 2.1 3.8
Exportsd/ 12.2 13.0 1.8 1.3
Importse/ 14.2 19.3 2.1 1.9
Netexportsf/ -0.3 -0.6

iii
tABle Ai.3 (Continued)
Notes: a/ProductelasticityistheratiobetweentheaveragerateofvariationoftheaggregateandGDPin2005-2006and2007-2008.Variablesmeasuredatconstantpricesfor2000.Thedatafor2008correspondtothefirsthalf,withtheexceptionofParaguay,wheretheycorrespondtothefirstquarter. b/Simpleaverageforthefivecountries. c/Investment:grossdomesticcapitalformation=grossdomesticfixedcapitalformation+variationinstocks. d/Exports:includesgoodsandservices. e/Imports:includesgoodsandservices. f/Netexportelasticitycalculatedasthedifferencebetweenexportandimportelasticities.
Source:Authors’ownelaborationwithDNCN(Argentina),IBGE(Brazil),BCU(Uruguay),BCV(Venezuela)andECLACdata.
tABle Ai.4MERCOSUR: CONSUMER pRICE INDEx
(YOY%variation)
Year Argentina Brazil paraguay Uruguay Venezuela MERCOSURa/
1998 0.7 1.7 14.6 8.6 29.9 11.1
1999 -1.8 8.9 5.4 4.2 20.0 7.3
2000 -0.7 6.0 8.6 5.1 13.4 6.5
2001 -1.5 7.7 8.4 3.6 12.3 6.1
2002 41.0 12.5 14.6 25.9 31.2 25.1
2003 3.7 9.3 9.3 10.2 27.1 11.9
2004 6.1 7.6 2.8 7.6 19.2 8.7
2005 12.3 5.7 9.9 4.9 14.4 9.4
2006 9.8 3.1 12.5 6.4 17.0 9.8
2007 8.5 4.5 6.0 8.5 22.5 10.0
2008p/ 9.1 6.2 9.7 8.5 34.5 13.3
Notes: a/Simpleaverageforthefivecountries. b/ForecastsforArgentina,Brazil,Paraguay,andUruguaycorrespondtothemarketsurveycarriedoutbytheCentralBanks;whileforVenezuelaitistheYOYvariationtoSeptember2008.
Sources:INDEC(Argentina),BCRA(Argentina),IBGE(Brazil),BCB(Brazil),BCP(Paraguay),BCU(Uruguay),andINE(Venezuela).
Country / Bloc and aggregate demand component
YOY variation product elasticity
2005-2006 2007-2008 2005-2006 2007-2008
Venezuela
GDP 10.3 7.2
Privateconsumption 16.8 14.4 1.6 2.0
Investmentc/ 31.0 16.6 3.0 2.3
Exportsd/ -0.4 -4.6 -0.0 -0.6
Importse/ 33.1 21.0 3.2 2.9
Netexportsf/ -3.2 -3.6

iviv
tABle Ai.5MERCOSUR: REAL EFFECTIVE ExCHANGE RATE
(2000Indexes=100-endofperiod)
Year Argentina Brazil paraguay Uruguay Venezuela MERCOSURa/
1998 110.2 76.9 101.5 107.0 109.0 100.9
1999 100.4 105.4 101.0 98.7 100.9 101.3
2000 99.2 103.8 97.2 99.8 97.5 99.5
2001 97.2 116.1 113.2 106.0 94.0 105.3
2002 227.9 156.8 114.9 134.9 127.4 152.4
2003 216.1 126.3 107.2 158.0 130.6 147.6
2004 221.4 115.5 115.2 145.8 135.9 146.8
2005 214.9 91.9 115.7 128.8 137.9 137.8
2006 214.0 89.0 96.2 132.1 123.2 130.9
2007 230.8 77.0 90.6 121.8 108.0 125.7
2008b/ 233.4 71.9 79.4 113.3 98.6 119.4
Notes: a/Simpleaverageforthefivecountries. b/Firsthalf.
Sources:ECLAC.
tABle Ai.6MERCOSUR: NET INTERNATIONAL RESERVES
(US$Millions.Decemberaverages)
Year Argentina Brazil paraguay Uruguay Venezuela
2005 28.077 53.799 1.297 3.078 29.636
2006 32.037 85.839 1.658 3.091 36.672
2007 46.176 180.334 2.462 4.121 33.477
2008a/ 47.709 200.827 3.196 6.101 31.625
Note:a/Juneaverage.
Sources:BCRA(Argentina),BCB(Brazil),BCP(Paraguay),BCU(Uruguay)andBCV(Venezuela).
tABle Ai.7MERCOSUR: PER CAPitA GDp
(RealYOYvariation,atconstant2000prices)
Year Argentina Brazil paraguay Uruguay Venezuela MERCOSURa/
1999 -4.4 -1.2 -3.6 -3.4 -7.7 -4.1
2000 -1.8 2.8 -5.3 -1.8 1.8 -0.9
2001 -5.4 -0.2 0.0 -3.6 1.5 -1.5
2002 -11.7 1.2 -2.0 -11.0 -10.5 -6.8
2003 7.8 -0.3 1.8 2.2 -9.4 0.4
2004 8.0 4.2 2.1 11.9 16.2 8.5
2005 8.1 1.5 0.9 6.6 8.4 5.1
2006 7.4 2.3 2.4 6.8 8.5 5.5
2007 7.6 4.0 4.9 7.2 6.6 6.1
2008f/ 6.2 3.8 3.1 10.7 4.2 5.6
Notes: a/Simpleaverageannualvariation. f/Forecasts.
Sources:ECLACandAuthors’ownelaborationforecasts.

v
tABle Ai.8MERCOSUR: UNEMpLOYMENT INDEx
(As%EAP,annualaverage)
YearArgentina
Brazilb/ paraguayc/ Uruguayd/ Venezuelae/ MERCOSURf/
a1/ a2/
2003 17.3 22.7 12.3 8.1 16.9 18.0 14.5
2004 13.6 18.1 11.5 7.3 13.1 15.3 12.2
2005 11.6 14.8 9.8 5.8 12.2 12.4 10.4
2006 10.2 12.3 10.0 6.7 10.9 10.0 9.6
2007 8.5 9.4 9.3 5.6 9.2 8.5 8.2
2008g/ 8.2 8.6 8.3 n.a. 8.0 8.0 8.1
Notes:n.a.:notavailable. a1/Urbanareas.Beneficiariesofsocialplansperformingrelatedlaborconsiderationsareconsideredemployed. a2/Urbanareas.Peoplewhosemainoccupationcomesfromasocialplanareconsideredunemployed. b/Sixmetropolitanareas. c/Totalpopulation(urbanandrural).Thefiguresdonotcoincidewiththepreviousreport,asruralareaswerenot includedbefore2006. d/In2006,theNationalSurveyofHouseholdswasexpandedtoalsoincluderuralareas.Thefiguresfromthisyeararethereforenotcomparablewithpreviousyears(urbantotal). e/Nationaltotal. f/Simpleaverageforthefivecountries.ForArgentina,theratecorrespondingtonotea1/istaken. g/Firsthalf.
Sources:INDEC(Argentina),IBGE(Brazil),INE(Uruguay),INE(Venezuela)andDGEEC(Paraguay).
tABle Ai.9MERCOSUR: EMpLOYMENT-pRODUCT ELASTICITY
(RatioofYOYvariationinemployedpopulationandtherealYOYvariationinGDP)
period / Country Argentina Brazil paraguay Uruguay Venezuela
2006 0.5 0.6 -0.6 n.a. 0.4
2007 0.3 0.6 0.9 0.7 0.4
2008a/ 0.2 0.6 n.a. n.a. 0.6
Note:a/Firsthalf.
Sources:MinistryofEconomy(Argentina),IBGE(Brazil),INE(Uruguay)andINE(Venezuela).
tABle Ai.10MERCOSUR: REAL REMUNERATIONS
(YOYvariation.Nominalwageindex,adjustedforconsumerpriceindexes)
period / Country Argentina Brazil paraguay Uruguay Venezuela
2006 6.3 4.0 1.3 4.4 5.1
2007 10.8 3.2 0.7 4.8 1.5
2008a/ 14.3 2.3 n.a. 4.1 -2.0
Note:a/Firsthalf.
Sources:INDEC(Argentina),IBGE(Brazil),BCU(Uruguay),INE(Uruguay)andBCV(Venezuela).

vivi

25
cHAPTER 2. THE EvoLuTIoN of TRAdE ANd foREIGN dIREcT INvESTmENT
During 2007 and the first half of 2008, the foreign trade flows of MERCOSUR countries continued to perform exceptionally well. Since 2003, exports and imports of the members of the bloc have in fact been growing at fairly high rates, and this period has been the region’s most prosperous, at least since the bloc was created in 1991. Argentina, Brazil, Paraguay, and Uruguay have enjoyed a favorable international climate, both in terms of an increase in the volume of world trade or of the increase in the prices of the goods exported by the countries, especially agricultural and mineral commodities. Instead of keeping pace with world trade, these countries’ exports have outstripped it, which has enabled a continuous increase in their market share of world imports. The context has also been quite favorable in terms of FDI flows.
A. Total mERcoSuR trade40
The MERCOSUR exports countries41 totaled US$224.2 billion in 2007, which meant growth of 17.8% in relation to the previous year. The fifth consecutive year of growth in the bloc’s external sales, a period in which the value exported increased 2.5 fold, equivalent to an average annual growth rate of 20.3%. As underlined later on, it is a good idea to observe the evolution of MERCOSUR trade while paying attention to the events of the last decade. Graph 9 clearly shows the contrast between recent performance and the situation in 1998-2002, when the bloc’s exports grew just 1.4% c.a.
Imports have been showing greater dynamism, with higher rates than exports. In 2007, they reached US$176.6 billion, 31% up on the previous year, and in the last five years their growth was 24.2% c.a., tripling their value. This performance also contrasts sharply with the 9.3% c.a. fall seen in the previous five-year period. The bloc’s trade flow thus reached a total of US$400 billion in 2007, with 23.3% growth that year and 21.9% c.a. in the last five years.
Much faster import growth in 2007 in comparison with exports meant that the trade balance for the year was 14.2% down on 2006, a fall of US$7.9 billion in absolute terms. Even so, the bloc recorded a US$47.6 billion surplus. Graph 9 shows that the bloc’s trade balance fell for the first time since 1998.
During the last ten years, MERCOSUR’s trade balance has been through three separate phases. The first, from 1998 to 2002, was characterized by serious macroeconomic instability in all countries in the bloc, added to a highly convulse international atmosphere. Indeed, between 1998 and 2002, the economies of MERCOSUR went through a period of deep crisis that led to a stagnation or fall in activity levels, foreign exchange depreciations, and, in certain cases, to serious social crises. The world economy also underwent a fairly unstable period, with the Asian crisis and the recession of the US economy in 2001, as well as the negative impact of the terrorist attacks of September 11. MERCOSUR thus saw virtual stagnation of exports and shrinkage of imports, which meant the trade balance went from a deficit of around US$14 billion in 1998 to a surplus of US$29.2 billion in 2002.
40 Methodologicalclarification:asVenezuelaMERCOSURmembershipprocessisstillunderway,anyreferencesmadeinthistexttothebloc’stradeflowscoveronlythefouroriginalpartners.Specificobservationsare,however,madeaboutVenezuela.41 Includesintrabloctrade.

26
GrAph 9TOTAL MERCOSUR FOREIGN TRADEa/
(1990-2007-US$Billions)
4203903603303002702402101801501209060300
-30
1990
1991
1992
1993
1994
1995
1996
1997
1998
1999
2000
2001
2002
2003
2004
2004
2006
2007
Balance Export Import Trade Flow
Note:a/Includesintrabloctrade.
Sources:INDEC(Argentina),SECEX-MDIC(Brazil),BCP(Paraguay),andBCU(Uruguay).
The second phase, from 2003 to 2006, was characterized by extremely positive scenarios, both in the international market and on the internal front, and, once again, MERCOSUR countries showed sustained growth. Exports increased sufficiently fast to deal with the expansion of imports. This in turn enabled the bloc’s trade surplus continued to rise until it reached a record US$55.5 billion in 2006.
The most recent phase, taking in 2007 and the first half of 2008, was characterized by the sustained high pace of growth in internal demand in the bloc and by a still favorable international scenario, especially where the increases in international commodity prices was concerned, which far exceeded their historical average. However, the trade surplus still fell in 2007 and again in the first half of 2008, 45.4% down on the same period for 2007, a reduction of US$11.1 billion. Apparently, this trend will continue for the rest of the year.
The deterioration in MERCOSUR countries’ trade balances over the first half of 2008 cannot be explained by the weak performance of exports, which, at US$129.1 billion, were 27.5% up on the same period the previous year. The cause of this, however, was the exceptional growth in imports during that half, a staggering 50.7% up on the same period for 2007. Exports reached US$115.8 billion, more than what the bloc imported in the whole of 2005. Analysis of the data for each country, presented in detail in the following section, shows that much of that growth was due to the rise in the import prices of products with a significant bearing on MERCOSUR countries’ pattern of trade, products such as petroleum, fertilizers, and mineral inputs. A similar phenomenon occurred in exports, considering that the growth in external sales was mostly based on the rising prices of agricultural products, which make up a significant part of MERCOSUR’s export basket.

27
Trade flows by country
Brazil was responsible for slightly over 70% of total MERCOSUR exports in 2007, with US$160.6 billion. Argentina had a 25% share (US$56.2 billion), and Paraguay and Uruguay together exported US$7.3 billion, slightly over 3% of the total. Table 2 shows that, compared to 2006, Paraguay performed best with a 46.1% increase, while Uruguayan exports grew just 12.9%. Argentina expanded its exports by 20.8% and Brazil grew 16.6%, slightly lower than the rise in the bloc’s total external sales.
The situation was similar in the first half of 2008, Brazilian exports performed worst in the bloc, up 23.8% on the first half of 2007, which meant a 2.1 p.p. drop in Brazil’s share in the bloc’s total sales. Growth was more significant in the case of Paraguayan and Uruguayan sales (85.7% and 43.6% respectively), while Argentina’s performance (34.3%) also exceeded the increase in the bloc’s total exports.
This recent evolution contrasts with 2003-2007, when Brazil raised its share in the bloc’s external sales by 3.7 p.p. This increase at the expense of Argentina’s share, which fell by 3.8 p.p. The annual average growth of Argentine exports in the last five years was the lowest in MERCOSUR at 17%. In this period, Paraguay’s share increased slightly (+0.2 p.p.) and Uruguay’s fell 0.1 p.p.
It is worth remembering, however, that 80% of the MERCOSUR population lives in Brazil and that it produces almost 70% of the bloc’s GDP (excluding Venezuela). To offset the difference of scale between the countries, it is important to analyze the evolution of exports per inhabitant. Two main facts stand out. First, Argentina and Uruguay had the highest coefficients of exports per inhabitant in 1998-2007. Second, although Brazil’s exports per inhabitant were the most dynamic, this indicator also shows more rapid acceleration in the other partners. Between 1998 and 2007, it was up 2.8-fold in Brazil, 2.3 in Paraguay, 2 in Argentina, and 1.6 in Uruguay.
Regarding imports, Table 2 shows that Brazil was responsible for 68.3% of the bloc’s total external purchasing in 2007, with US$120.6 billion. Argentina’s share was similar to that for exports (25.4%) and the greatest difference emerged in the shares of Paraguay and Uruguay, both with 3.2%. The growth rate between 2006 and 2007 was higher in Brazil (32.1%) and Argentina (31.1%), and below average in Paraguay (24.2%) and Uruguay (17%). In the first half of 2008, imports accelerated substantially in all countries in the bloc, especially Uruguay, where they increased a staggering 92.6%. Paraguay recorded growth of 54.9%, Brazil 50.7%, and Argentina 45.3%.
Between 2002 and 2007, Brazil’s share in total MERCOSUR imports fell by 10.8 p.p., while Argentina’s grew by 10.3 p.p. The increase reflected annual average growth of 37.9% in this country’s external purchasing, but it is worth remembering that the basis for comparison is for 2002, a year when its imports suffered a deep contraction due to the grave economic crisis following the end of the foreign exchange convertibility regime. In fact, Argentina’s current share in MERCOSUR imports is still well below that seen in 1998, which was 32.9%.
The trade surplus recorded by MERCOSUR in 2007 reached US$47.6 billion, US$40 billion of which correspond to Brazil, i.e. over 80% of the total. Argentina’s share was US$11.5 billion, while Paraguay and Uruguay had deficits of US$2.8 billion and US$1.1 billion respectively. The balance evolved unfavorably in all countries in comparison with the previous year, especially in Brazil, whose surplus fell by 13.9%

28
(US$6.4 billion), and Uruguay, whose deficit grew 38%. The trend continued during the first half of 2008, when the trade balance of all countries deteriorated in comparison with the same period the previous year. In this sense, Brazil once again stands out for having suffered a 44.9% reduction in its surplus, as does Uruguay, whose deficit rose 438%.
tABle 2TOTAL MERCOSUR TRADE FLOWS AT SELECTED TIMES
(US$Millions)
1998 2002 2006 2007 % Var. 2007/2006 2007a/ 2008a/ % Var.
Exports 81,336 88,901 190,268 224,178 17.8 101,251 129,119 27.5
Argentina 26,434 25,651 46,569 56,246 20.8 24,751 33,237 34.3
Brazil 51,120 60,439 137,808 160,649 16.6 73,214 90,645 23.8
Paraguay 1,014 951 1,906 2,785 46.1 1,227 2,278 85.7
Uruguay 2,769 1,861 3,985 4,498 12.9 2,060 2,959 43.6
imports 95,375 59,705 134,757 176,567 31.0 76,789 115,755 50.7
Argentina 31,379 8,988 34,150 44,781 31.1 19,346 28,113 45.3
Brazil 57,714 47,243 91,343 120,621 32.1 52,637 79,310 50.7
Paraguay 2,471 1,510 4,489 5,577 24.2 2,454 3,802 54.9
Uruguay 3,811 1,964 4,775 5,588 17.0 2,352 4,530 92.6
trade Balance (14,039) 29,195 55,511 47,611 (14.2) 24,462 13,364 (45.4)
Argentina (4,946) 16,662 12,419 11,465 (7.7) 5,405 5,124 (5.2)
Brazil (6,595) 13,196 46,465 40,028 (13.9) 20,577 11,335 (44.9)
Paraguay (1,457) (560) (2,583) (2,792) 8.1 (1,228) (1,524) 24.1
Uruguay (1,042) (103) (790) (1,090) 38.0 (292) (1,571) 438.0
Note:a/FirstHalf.
Sources:INDEC(Argentina),SECEX-MDIC(Brazil),BCP(Paraguay),andBCU(Uruguay).
In short, recent evolution shows a reversion in terms of 2002-2006, when there was an improvement in the bloc’s trade balance that certainly included the above Argentine anomaly, the 2002 crisis being accompanied by an extremely sharp contraction of imports, resulting in an abnormally high surplus that year.
Recent evolution of intrazone trade
Intrazone exports, equivalent, by definition, to intrazone imports, grew by a significant 25.7% in 2007 to reach US$32.4 billion (Table 3). In fact, intrazone exports have been seeing a more favorable evolution than extrazone exports in recent years. Between 2002 and 2007, intrazone exports saw annual average growth of

29
26%, a higher rate than that seen in exports to the rest of the world (19.5%). This trend continued during the first half of 2008, when intrazone exports were up 39% on the same period in 2007.
tABle 3MERCOSUR INTRAZONE AND ExTRAZONE TRADE FLOWS AT SELECTED TIMES
(US$Billions)
1998 2002 2006 2007 % Var. 2007/2006 2007a/ 2008a/ % Var.
intrazone
Exportsb/ 20.4 10.2 25.8 32.4 25.7 14.3 19.8 39.0
Extrazone
Exports 61.0 78.7 164.5 191.8 16.6 87.0 109.3 25.6
Imports 75.0 49.4 109.4 144.0 31.6 62.4 95.6 53.2
total
Exports 81.3 88.9 190.3 224.2 17.8 101.3 129.1 27.5
Imports 95.4 59.7 134.8 176.6 31.0 76.8 115.8 50.7
Balance (14.0) 29.2 55.5 47.6 (14.2) 24.5 13.4 (45.4)
Notes: a/Firsthalf. b/Bydefinition,equaltoIntrazoneimports.
Sources:INDEC(Argentina),SECEX-MDIC(Brazil),BCP(Paraguay),andBCU(Uruguay).
Consequently, intrazone exports show an increase in their share in the bloc’s total sales from 11.5% in 2002 to 15.3% in the first half of 2008. However, Graph 10 shows that this share is still well below the 25% high of 1998. It can safely be said that, although an effective rise in trade integration is seen among MERCOSUR countries, in relative terms this only represents the recovery of the space lost between 1998 and 2002. At any rate, it is worth remembering that, in extrazone exports, commodities have a greater bearing in comparison with intrazone sales. In this context, whereas the prices of raw materials in 2008 were high, in 1998, they recorded a historic low. The share of intrazone trade in the total is therefore underrepresented, in spite of its recent and significant expansion.42 Recent evolution has been different for imports. Purchases from countries outside MERCOSUR rose 31.6% in 2007, a rate higher than the one seen for intrazone imports. Graph 10 shows that the share of intrazone imports over the bloc’s total imports has been gradually falling since 2003, reaching 17.4% in the first half of 2008.
Table 4 shows the composition of intrazone trade flows, discriminated by country. In 2007, Brazil exported US$17.3 billion to its neighbors and its share was 53.6% of total intrazone exports. Argentina exported US$12.4 billion (38.4% of the total); Paraguay, US$1.4 billion (4.2% of the total), and Uruguay, US$1.2 billion (3.8% of the total). In relation to 2006, Paraguay’s intrazone sales are notable, with an increase of
42 ForanestimateoftheevolutionoftradeinSouthAmericaatconstantprices,seeCarciofiandGayá[2007],especiallySectionB.

30
49.9%, a rate well above the one recorded by the intrazone exports of Uruguay (32.4%), Argentina (25%), and Brazil (24.1%).
The situation in terms of imports is quite different. Argentina was the country that imported most in comparison with its MERCOSUR partners (US$16 billion, or 49.2% of the total), while the shares of Paraguay (7.5%) and Uruguay (7.6%) were much higher than those of exports. Brazil, on the other hand, was responsible for just 35.7% of intrazone imports. In terms of the evolution of imports, Paraguay was once again prominent, 45.7% up on 2006, growth well above that recorded for the intrazone imports of Brazil (29.7%), Argentina (27.7%), and, especially, Uruguay, (13.4%).
GrAph 10RATIO OF INTRAZONE TRADE FLOWS AND
TOTAL TRADE FLOWS IN MERCOSUR1990-FIRST HALF 2008
(%ofnominalfigures)
1990
1991
1992
1993
1994
1995
1996
1997
1998
1999
2000
2001
2002
2003
2004
2004
2006
2007
2008
a/
2625242322212019181716151413121110
98
Export Import
Note:a/Firsthalf.
Sources:INDEC(Argentina),SECEX-MDIC(Brazil),BCP(Paraguay),andBCU(Uruguay).
Brazil’s high share in intrazone exports and its rather lower share in imports naturally implies high trade balances in its favor. In fact, Brazil continues to be the only country in the bloc to record intrazone trade surpluses. In 2007, the balance reached US$5.7 billion, approximately US$700 millions up on 2006. Argentina had a deficit of US$3.6 billion, up US$1 billion in relation on the previous year. Paraguay had a deficit of US$1.1 billion, and Uruguay US$1.2 billion.
The situation changed considerably in comparison to a few years ago, when Argentina was the only country with an intrazone trade surplus. The change reflected the fact that Brazil’s intrabloc exports grew almost

31
40% c.a. between 2002 and 2007, compared to Argentina, Paraguay, and Uruguay’s rises of between 15% c.a. and 20% c.a. of exports. In the same period, Brazil’s intrazone imports grew 15.7% a year, while in the other countries this growth fluctuated between 21.3% (Uruguay) and 40.8% c.a. (Argentina).
The recent trend deepened in the first half of 2008, as Brazil’s surplus with its partners increased by 43%, whereas the other countries increased their deficits, especially Argentina, whose imbalance was up 63.5% by approximately US$1 billion. Argentina’s intrazone deficit in six months of 2008 was already higher than that for the whole of 2006. Uruguay also experienced a severe worsening of its intrazone deficit, which rose 43.2%, whereas Paraguay’s loss balance remained relatively stable.
tABle 4INTRAZONE TRADE FLOWS IN MERCOSUR BY COUNTRY AT SELECTED TIMES
(US$Millions)
1998 2002 2006 2007 % Var. 2007/2006 2007a/ 2008a/ % Var.
Exportsb/ 20,355 10,189 25,785 32,401 25.7 14,259 19,814 39.0
Argentina 9,415 5,718 9,940 12,426 25.0 5,527 7,421 34.3
Brazil 8,877 3,311 13,986 17,354 24.1 7,596 10,459 37.7
Paraguay 531 553 917 1,374 49.9 608 1,164 91.4
Uruguay 1,532 607 942 1,247 32.4 528 770 45.8
importsb/ 20,393 10,300 25,394 32,602 28.4 14,348 20,125 40.3
Argentina 7,930 2,895 12,555 16,037 27.7 7,167 10,103 41.0
Brazil 9,428 5,615 8,968 11,630 29.7 5,204 7,037 35.2
Paraguay 1,383 845 1,689 2,461 45.7 995 1,566 57.4
Uruguay 1,652 944 2,182 2,474 13.4 981 1,419 44.6
trade balance
Argentina 1,485 2,823 (2,615) (3,611) 38.1 (1,640) (2,682) 63.5
Brazil (551) (2,304) 5,018 5,723 14.1 2,392 3,422 43.0
Paraguay (853) (293) (772) (1,087) 40.8 (387) (402) 4.0
Uruguay (119) (337) (1,240) (1,227) (1.1) (453) (649) 43.2
Notes: a/Firsthalf. b/Intrablocexportsandimportsdonottallyowingtodifferencesineachcountry’srecords.
Sources:INDEC(Argentina),SECEX-MDIC(Brazil),BCP(Paraguay),andBCU(Uruguay).
Extrazone trade
The 27 countries of the European Union (EU) were the main destination of MERCOSUR exports in 2007, with US$51.4 billion, or 26.8% of the total. Next, with shares of around 20% of the total, come the NAFTA and Asian countries, while the other LAIA countries accounted for 12.2% of the total. The highest growth

32
in relation to 2006 was in fact seen in sales to the EU (29%) and the Asian market (25%). The variation in sales to NAFTA was a mere 0.9% (Table 5).
In terms of MERCOSUR imports, almost 30% (US$42.8 billion) came from the Asian countries in 2007, 35% up on the previous year. In recent years, Asia came to occupy the place of the EU whose share in the bloc’s imports fell from over 30% at the start of the decade to 24.2%. The Other Countries also had a significant share in 2007 (21.5%), at 18%, higher than the NAFTA countries. LAIA countries had a limited share of just 6.4%.
tABle 5MERCOSUR ExTRAZONE TRADE FLOWS BY ECONOMIC BLOC AT SELECTED TIMES
(US$Billions)
1998 2002 2006 2007 % Var. 2007/2006 2007a/ 2008a/ % Var.
Exports 60.982 78.712 164.483 191.777 16.6 86.992 109.305 25.6
NAFTA 14.383 22.713 38.233 38.593 0.9 18.239 19.294 5.8
EU 20.627 21.251 39.829 51.388 29.0 23.016 29.535 28.3
LAIAb/ 7.195 8.727 20.789 23.303 12.1 10.677 12.612 18.1
Asia 9.933 13.598 30.014 37.509 25.0 16.821 23.249 38.2
OtherCountries 8.844 12.423 35.618 40.984 15.1 18.240 24.615 35.0
imports 74.982 49.406 109.362 143.964 31.6 62.442 95.630 53.2
NAFTA 17.883 12.482 19.808 25.918 30.8 13.711 18.970 38.4
EU 27.140 16.017 26.734 35.080 31.2 15.568 21.670 39.2
LAIAb/ 3.297 2.424 8.087 9.224 14.1 4.248 5.925 39.5
Asia 13.576 9.565 31.736 42.842 35.0 18.154 29.176 60.7
OtherCountries 13.087 8.918 22.997 30.900 34.4 10.762 19.888 84.8
trade Balance (14.001) 29.306 55.120 47.813 (13.3) 24.550 13.675 (44.3)
NAFTA (3.499) 10.231 18.425 12.675 (31.2) 4.528 324 (92.9)
EU (6.513) 5.234 13.095 16.308 24.5 7.448 7.865 5.6
LAIAb/ 3.898 6.304 12.701 14.079 10.8 6.429 6.688 4.0
Asia (3.643) 4.033 (1.722) (5.333) 209.7 (1.333) (5.928) 344.7
OtherCountries (4.243) 3.505 12.620 10.084 (20.1) 7.477 4.727 (36.8)
Notes: a/Firsthalf. b/WiththeexceptionofMERCOSURandMexico.MexicoisincludedinNAFTA.
Sources: INDEC(Argentina),SECEX-MDIC(Brazil),BCP(Paraguay),andBCU(Uruguay).
It comes as no surprise then that MERCOSUR recorded a high trade deficit with Asian countries, which reached US$5.3 billion in 2007. On the contrary, the balance with the other blocs recorded a fairly high surplus, especially with the EU (US$16.3 billion) and with LAIA (US$14.1 billion). The balance with these two blocs was up on 2006, while the surplus with NAFTA and the Other Countries fell and the deficit with Asia rose considerably.

33
The movements seen in 2007 deepened in the first half of 2008, with more pronounced growth in exports to the EU (28.3%) and Asia (38.2%), and with a more moderate increase to LAIA (18.1%) and NAFTA (5.8%). Imports from all blocs grew rapidly, but the rate was much higher in purchases from Asia (60.7%) and Other Countries (84.8%), reflecting, in the latter case, the sharp rise in petroleum prices. MERCOSUR’s trade surplus with the EU and LAIA saw a slight increase, and fell with NAFTA and the Other Countries, whereas the deficit with Asia tripled, reaching a total of US$5.9 billion, an amount higher than the deficit recorded in the whole of 2007.
Exports, world trade, and market share
MERCOSUR exports have clearly been fuelled by the strong pace of growth experienced by world trade from 2003. This variable rose 16.4% c.a. in 2003-2007 and 19.9% in the first half of 2008. However, the countries in the bloc were able to expand their exports more rapidly, obtaining continuous increases in their market share, as shown in Graph 11. Indeed, between 2003 and 2007, MERCOSUR exports grew at an annual average rate of 20.3%, i.e. 3.9 p.p. above world imports, and in the first half of 2008 they grew 27.5%, i.e. 7.7 p.p. above world growth. Although there was a significant increase in the quantities exported by MERCOSUR in this period, much of this growth differential is due to the sharp increase in international commodity prices, the main component of MERCOSUR exports.
GrAph 11MERCOSUR ExpORT AND WORLD IMpORT GROWTH, AND EVOLUTION OF MERCOSUR’S MARKET SHARE
1998-FIRST HALF OF 2008(%)
30
25
20
15
10
5
0
-5
-101998 1999 2000 2001 2002 2003 2004 2005 2006 2007 2008a/
1.65
1.60
1.55
1.50
1.45
1.40
1.35
1.30
1.25
World Imports MERCOSUR Exports
MERCOSUR Market Share(right axis)
Note:a/Firsthalf.
Source:IMF,INDEC(Argentina),SECEX-MDIC(Brazil),BCP(Paraguay),andBCU(Uruguay).

34
MERCOSUR’s market share was 1.64% in the first half of 2008, three tenths of a p.p. up on 2002. Though not highly significant in relative terms, this increase is important when measured in absolute values. At 2007 levels, a 0.3% share in world imports represents approximately US$42 billion.
Box CINTERNATIONAL CRISIS, COMMODITY pRICES, AND pROSpECTS FOR MERCOSUR ExpORTSThefinancialcrisisbeginningintheUSAinmid-2007causednosignificantdamagetoexportsfromMERCOSURcountriesuntilthefirsthalfof2008,withtheexceptionoftheslowdowninsalestoNAFTAcountries,whichgrewjust0.9%in2007and5.8%inthefirsthalfof2008.AsstatedinChapter1,thefirstphaseofthecrisisbroughtbenefitstotheMERCOSURcountriesduetoinflatedcommodityprices.TheGraph below shows that themain international commodities prices, asmeasured on the index of Reuters’ CommodityResearchBureau(CRB),grewsignificantlyinrecentyears,withtheexceptionofthesecondhalfof2006asaresultofa15%dropinpetroleumprices.However,growthwasespeciallysignificantfrom2007,withanaccumulatedincreaseof34.9%betweenthesecondquarterofthatyearandthesameperiodof2008.ThismovementwascloselyshadowedbyArgentineexportprices,whichgrew32.1%inthesameperiod,followedbyBrazilianexportprices,whichsawariseof28.9%.
Nevertheless, the deepening of the crisis from September 2008 considerably increased instability compared to the exportperformanceofMERCOSURcountries.TheproblemsextendedtothefinancialsystemsofJapanandEurope,andarecessiveprocesswasunleashedacrossthedevelopedworldwithareversalofcommodityprices.Asafirstreflectionofthismovement,theCRBindexrecordeda2.7%fallinthethirdquarterof2008inrelationtothepreviousquarter.
QUARTERLY EVOLUTION OF MAIN COMMODITY pRICES (CRB INDEx), ARGENTINE AND BRAZILIAN ExpORT pRICES
(2003.IV=100)
200190180170160150140130120110100
90
2003
.IV
2004
.I
2004
.II
2004
.III
2004
.IV
2005
.I
2005
.II
2003
.III
2005
.IV
2006
.I
2006
.II
2006
.III
2006
.IV
2007
.I
2007
.II
2007
.III
2007
.IV
2008
.I
2008
.II
2008
.II
Argentina Brazil CRB
Sources:INDEC(Argentina),FUNCEX(Brazil)andReuters(CRB).
ForeseeingwhatmayhappentoMERCOSURexportsfromnowonisahighlycomplextask.Thefiguresfor2008willstillshowconsiderablegrowth,not justbecauseperformancewasextremelyfavorableinthefirsthalfoftheyear,butalsobecausethenegativeeffectsoftheinternationalcrisistendtohaveadelayedimpactonexports.Butperformancein2009willcertainlybehitandwillbeconditionedbythreemainaspects:(i)thedepthoftherecessionintheDDCs;(ii)thedegreeofresistanceoftheDGCs,i.e.towhatextenttheirgrowthwillbeaffectedbythecrisis,especiallyinthecaseofAsiancountries;and(iii)thescopeofthedropincommodityprices.Thepointistoascertaintheintensityoftheslowdowninexports.Inthissense,itispossibletoimaginethreescenarios.

35
Box C (Continued)Inabenignscenario, the recession inDDCswouldbe lightand thefinancial crisiswouldnotspread toDGCs,whichwouldexperienceaneconomicslowdowndespitecontinuingtogrowatreasonableratessupportedbytheirinternaldemand.Commoditypriceswouldseefurtherfallsuntilearly2009,butwouldriseagainovertheyearduetothestillvigorousdemandintheDGCsandtoshort-termrestrictionsinordertoincreasesupply.Inthisscenario,MERCOSURexportswouldseesignificantgrowthin2009(albeitbelowtheaveragefor2003-2008)ofapproximately20%c.a.(stilllargelysustainedbytherisingprices).
Inapessimisticscenario,therecessioninDDCswouldbedeeperthanexpectedandwouldspreadtotheDGCs,whowouldnotbeabletosustaintheirgrowthmerelythroughtheirinternaldemand.Thiswouldalsoshrinkduetoamorecautiousattitudefromconsumersandcompanies.Asaresult,commoditypriceswouldcontinuetofallandcouldreverttolevelsclosetothoseseenin2007,orevenlower.Thiswouldrepresentafallofbetween20%and25%ofexportpricesagainstthelevelsreachedinthesecondhalfof2008.Inthisscenario,MERCOSURexportswouldundergoasignificantdropin2009.
AnintermediatescenariowouldbecharacterizedbyarelativelylightrecessioninDDCsandamoreintenseslowdowninDGCs,althoughsucharecessionwouldnot intheendbewidespread.Commoditypriceswouldundergonoadditional falls in2009,althoughitwouldimplyaslightreductioninaveragepricesappliedduringthatyearinrelationtotheaveragefor2008.Inthiscontext,MERCOSURexportswouldsufferamoredecisiveslowdownandalowlevelofgrowth,albeitnotnegative,backedupbyanincreaseinthevolumeexported.
Inanyofthesescenarios,however,twoaspectsseemcertain.First,theeconomiesofArgentinaandBrazilareunlikelytosuffersuchnegativeeffectsas thoseseen in theyears following theAsiancrisis,as thestateof theirexternalaccounts is farmorecomfortabletodaythanitwasthen,dueeithertothereducedneedforexternalfundingortotheexistenceofafirmcushionofinternational reserves,worthUS$47.5billion inArgentinaandoverUS$200billion inBrazilat theendofJune.Second, thesecountrieswillinevitablyexperienceareductioninthepaceoftheireconomicgrowth,duebothtothelowermomentumofexportsoninternalproductionandtotheneedtoslowdownimportgrowthinordertoavoidarapidspeedydeteriorationofthetradebalance.
b. mERcoSuR trade by country
Argentina
Argentina’s foreign trade flows in 2007 continued the extremely positive dynamics seen since 2003, with a marked expansion of exports and imports, and therefore of trade flows, and reasonable stability of the trade balance.
Exports from Argentina reached US$56.2 billion in 2007, 20.8% up on the previous year. Graph 12 shows that this was the fifth consecutive annual increase in Argentina’s external sales, a period in which the annual average rate was 17%. Imports grew even more rapidly in 2007 at a rate of 31.1% and maintained their trend of rapid expansion in the last five years, a period in which annual average growth was 37.9%. The trade balance was US$11.5 billion in 2007, 7.7% down on the previous year. From 2004, Argentina’s balance has fluctuated between US$11 billion and US$12 billion, after peaking at US$16.7 billion in 2002. In 2007, the total trade flow reached the US$100 billion mark for the first time, with 25.2% growth in relation to 2006 and 23.9% c.a. since 2002.
The pace accelerated in the first half of 2008, when exports saw a 34.2% rise in relation to the same period for 2007, reaching the figure of US$33.2 billion, and imports increased 45.3%, with a total of US$28.1 billion. The result was a slight 5.2% drop in the trade balance, equivalent to US$5.1 billion.
That is not a recent trend. Every year since 2003 (with the exception of 2005), the price rise exceeded the growth of the quantum. In 2003-2007, prices were responsible for half of the increase in the country’s exports, a trend that deepened in the first half of 2008, when prices experienced an unprecedented rise of 31.6% in relation to the first half of 2007, shortly after the boom in international prices of agricultural products. In the same half, the quantum saw a rise of just 1.9%. This means that prices were responsible for

36
93% of the growth of Argentine exports in the period. This poor performance may be to do with the dispute between the government and the agricultural sector over the duties on export-related earnings, which, for several weeks, caused the external sales of these products to shrink.
GrAph 12ARGENTINA: TRADE FLOWS IN 1990-2007
(US$Billions)
Balance Export Import Trade Flow
1990
1991
1992
1993
1994
1995
1996
1997
1998
1999
2000
2001
2002
2003
2004
2004
2006
2007
1101009080706050403020100
-10
Source:INDEC.
On the contrary, where imports are concerned, most of the growth seen in recent years is associated with the increase in the quantities imported, whereas prices accounted for only slightly over 10% of growth in the value imported. In 2007, the rise of the import quantum was 21.6%, whereas prices grew 7.3%, equal to a rise of just 26% of the value imported. In the first half of 2008, the quantum accelerated, recording a rise of 26.3%, but prices also increased more significantly (14.9%) by 37% of the growth in imports.
The faster growth of the prices of exported products as against the prices of imported products meant that Argentina has seen significant gains in its terms of trade in recent years. In 2007, the rise was 3.7%, reaching 14.4% in just the first half of 2008. Between 2003 and the first half of 2008, the terms of trade accumulated growth of 34.9%.
MERCOSUR partners were the destination of 22.1% of Argentine exports in 2007, equivalent to US$12.4 billion, representing growth of 25% in relation to 2006. This rate was higher than the one recorded in the country’s total sales and contributed to that the partners’ share increasing eight tenths of a p.p. in the period. Table 6 shows that, in 2007, Brazil was the destination for 84.4% of Argentina’s exports to MERCOSUR countries, a rise of 28.6%, and that it continues to be the main recipient of the country’s total external sales, with an 18.6% share. In the first half of 2008, sales to MERCOSUR grew 34.3%, slightly above the general average, bringing about a further 22.3% rise in the bloc’s share. This percentage is exactly the same as that recorded in 2002.

37
Argentine imports from its MERCOSUR partners reached US$16 billion in 2007, representing 35.8% of the country’s total imports. Brazil had a 90.6% share in Argentina’s intrazone imports (US$14.5 billion), 23.6% up on 2006. This means that it keeps its place as the main country of origin for Argentine imports in global terms, with 32.4% of the total. During the first half of 2008, the MERCOSUR partners were responsible for 35.9% of Argentina’s imports, down on the 37% seen in the same period of 2007. The main increase in the period was due to purchases from Paraguay (80.7%), while those from Brazil grew by 37.8%.
GrAph 13ARGENTINA: INCREASE IN pRICES AND IN THE ExpORT QUAntUM
1998-FIRST HALF OF 2008(%)
Price Quantum
322824201612840
-4-8
-121998 1999 2000 2001 2002 2003 2004 2005 2006 2007 2008 a/
Note:a/Firsthalf.
Source:INDEC.
Argentina’s trade balance with its MERCOSUR partners produced a negative result of US$3.6 billion in 2007, owing basically to the imbalance in its trade with Brazil, with a US$4 billion deficit. It should be stressed, however, that, for the first time in many years, there was also a slight deficit with Paraguay. Argentina’s balance with Uruguay remains positive, despite falling in 2007. During the first half of 2008, the debit balance with its partners rose considerably to US$2.7 billion. Deficits with Brazil (47.8%) and Paraguay (171.9%) rose considerably, but the surplus with Uruguay grew 33.2%.
In spite of exports to its MERCOSUR partners performing well, Argentina continues to lose market share in its partners’ imports. In the case of Brazil, the percentage in 2007 was just 8.6%, well below that seen at the end of the 1990s, when it topped 13%. During the first half of 2008, it fell again to 7.9%. In Paraguay, the loss of market share has been even more rapid, from 14.3% in 2007 to 12.3% in the first half of 2008, after reaching figures of over 25% in 1998-2000. Uruguay, where Argentina’s share in imports is the highest of the MERCOSUR partners, the market share reached 22.1% in 2007 and rose to 26.7% in the first half of 2008.

38
Argentine exports to extrazone markets reached US$43.8 billion in 2007, 19.6% up on the previous year. Asia consolidated its place as the main destination for Argentine exports, with a percentage of 20.8% of the total in 2007, as against 17.6% for the EU, 13.8% for LAIA, and 10.3% for NAFTA. It is important to underline the significance of the Chilean market for Argentina, as sales to that country totaled US$4.2 billion in 2007, higher than sales to the USA (Table 7).
Extrazone imports reached US$28.7 billion in 2007, an increase of 33.1%. A predominant share was also seen for Asian countries, representing 20.4% of the country’s total imports in that year, significantly up on the previous year (+43.2%). In recent years, Asian countries have become Argentina’s prime extrazone suppliers (a place occupied by the EU in the past) with annual average growth of 53.4% in 2003-2007.
tABle 6ARGENTINA: TRADE FLOWS WITH MERCOSUR COUNTRIES AT SELECTED TIMES
(US$Millions)
1998 2002 2006 2007 % Var. 2007/2006 2007a/ 2008a/ % Var.
Exports
MERCOSUR/total (%) 35.6 22.3 21.3 22.1 22.3 22.3
MERCOSUR 9,415 5,718 9,940 12,426 25.0 5,527 7,421 34.3
Brazil 7,949 4,846 8,152 10,485 28.6 4,627 6,195 33.9
Paraguay 622 343 616 776 26.1 356 492 38.2
Uruguay 843 529 1,172 1,165 (0.6) 544 734 35.0
imports
MERCOSUR/total (%) 25.3 32.2 36.8 35.8 37.0 35.9
MERCOSUR 7,930 2,895 12,555 16,037 27.7 7,167 10,103 41.0
Brazil 7,055 2,517 11,750 14,523 23.6 6,458 8,901 37.8
Paraguay 348 255 504 1,056 109.5 522 943 80.7
Uruguay 528 122 301 458 52.2 187 259 38.3
trade Balance
MERCOSUR 1,485 2,823 (2,615) (3,611) 38.1 (1,640) (2,682) 63.5
Brazil 895 2,329 (3,598) (4,038) 12.2 (1,831) (2,706) 47.8
Paraguay 274 87 112 (280) (351.0) (166) (451) 171.9
Uruguay 316 407 871 707 (18.8) 357 475 33.2
Source:INDEC.
Argentina’s trade surplus with the countries outside MERCOSUR reached US$15 billion in 2007, almost the same amount as seen in 2006. There is a significant surplus balance with all blocs, except NAFTA, where there is a US$1.1 billion deficit. The best result obtained was with the LAIA countries (US$6.5 billion), which, to a large extent, is a reflection of good trade performance with Chile, although the surplus of over US$1 billion in trade with Venezuela must also be underlined. Next are the balances with the Asian countries (US$2.6 billion) and the EU (US$2.4 billion).

39
During the first half of 2008, exports to all groups of countries outside MERCOSUR grew markedly, especially to the EU (54.8%) and Other Countries (45.3%). However, imports rose even more rapidly, especially from Other Countries (111.8%) and Asia (47.6%). Even so, the extrazone trade balance grew 10.8%, up US$7.8 billion, with more significant surpluses in the cases of the LAIA and the EU, a lower balance with Asia, and a growing deficit with NAFTA.
tABle 7ARGENTINA: ExTRAZONE TRADE FLOWS BY COUNTRY
AND ECONOMIC BLOCS AT SELECTED TIMES(US$Millions)
1998 2002 2006 2007 Var. % 2007/2006 2007a/ 2008a/ Var. %
Exports
Extrazone/total (%) 64.4 77.7 78.7 77.9 77.7 77.7
Extrazone 17,019 19,932 36,629 43,820 19.6 19,224 25,816 34.3
NAFTA 2,679 3,744 5,932 5,804 (2.2) 2,733 3,232 18.3
EU 4,633 5,114 8,002 9,895 23.7 4,286 6,636 54.8
LAIAb/ 3,373 4,247 7,234 7,765 7.3 3,648 4,477 22.7
Asia 4,007 4,435 8,568 11,713 36.7 5,034 6,353 26.2
OtherCountries 2,328 2,393 6,893 8,643 25.4 3,523 5,118 45.3
imports
Extrazone/total (%) 74.7 67.8 63.2 64.2 63.0 64.1
Extrazone 23,449 6,093 21,595 28,744 33.1 12,179 18,010 47.9
NAFTA 7,163 2,012 5,550 6,893 24.2 3,108 4,297 38.3
EU 8,871 2,028 5,813 7,452 28.2 3,313 4,491 35.6
LAIAb/ 1,138 255 1,129 1,273 12.8 574 705 22.8
Asia 4,792 1,072 6,365 9,115 43.2 3,835 5,660 47.6
OtherCountries 1,485 727 2,738 4,011 46.5 1,349 2,857 111.8
trade Balance
Extrazone (6,430) 13,839 15,034 15,076 0.3 7,045 7,806 10.8
NAFTA (4,484) 1,733 382 (1,089) (385.3) (375) (1,065) 184.0
EU (4,238) 3,086 2,189 2,443 11.6 973 2,145 120.5
LAIAb/ 2,234 3,992 6,105 6,492 6.3 3,074 3,772 22.7
Asia (785) 3,363 2,203 2,598 17.9 1,199 693 (42.2)
OtherCountries 842 1,666 4,155 4,632 11.5 2,174 2,261 4.0
Notes: a/Firsthalf. b/WiththeexceptionofMERCOSURandMexico.MexicoisincludedinNAFTA.
Source:INDEC.
An analysis of the composition of Argentina’s exports according to product-type shows that agricultural manufacturing (AM) forms the most important group, representing approximately a third of the basket in recent

40
years, including 2007 and the first half of 2008. The second group corresponds to the industrial manufacturing (IM), whose share in 2007 was 31%, slightly down on the first half of 2008. Since 2003, however, the share of these products has increased about five p.p. Commodities represented 22% of exports in 2007 and 25% in 2008, which reversed the process of gradual loss of share seen up to 2006. However, fuels and energy, which usually represented 18% of exports, fell to 11.5% in 2007 and 10.8% in the first half of 2008.
In terms of the composition of imports, capital goods were the main heading, slightly above 40% of the total from 2004 to the first half of 2008. Raw materials and intermediate goods are also extremely important, at around 35%. Consumer goods increased gradually their share to 17.5% of the total in 2007 and the first half of 2008. Fuels, however, fairly insignificant share, albeit a growing one in recent years, reaching 7.5% of the total in the first half of 2008.
Brazil
Brazil’s foreign trade flows remained highly dynamic in 2007, the fifth consecutive year of growth at relatively high rates. Exports reached US$160.6 billion, up 16.6% on the previous year. Although this represented a slowdown in terms of previous years, performance was still quite favorable when compared to the 1990s or the first years of the current decade, as can be see in Graph 14. Imports, in turn, reached US$120.6 billion in 2007, up 32.1% on the previous year. This was the highest annual rate seen by Brazil since 1995 and was well above the annual average of 20.6% for 2003-2007. The fact that imports have grown almost twice as fast as exports meant that the trade balance fell for the first time in ten years, although the surplus remained a steady US$40 billion. In turn, the total flow of trade reached a record US$281.3 billion, an annual increase of 22.7% and an average growth of 21.2% throughout 2003-2007.
GrAph 14BRAZIL: TRADE FLOWS IN 1990-2007
(US$Billions)
Balance Export Import Trade Flow
300280260240220200180160140100806040200
-20
1990
1991
1992
1993
1994
1995
1996
1997
1998
1999
2000
2001
2002
2003
2004
2004
2006
2007
Source:SECEX-MDIC.

41
The downward trend of Brazil’s trade balance deepened in the first half of 2008, not due to the poor performance of exports, which were up 23.8% on the same period the previous year, but to the acceleration of imports, which were up 50.7% in the period, a reflection of steeper growth in internal demand. The trade balance thus stood at US$11.3 billion, 44.9% down on the first half of 2007. Preliminary data for July and August show a steep reduction in this balance, but a reduction is expected of at least a third in relation to 2007 is expected by the end of the year.
The growth of Brazilian exports in 2007 was clearly fuelled by price rises, up 10.5% on the previous year, while the export quantum rose just 5.5% (Graph 15). This means that prices accounted for 65% of the rise in values exported in the year. Similarly, this was repeated in 2005 and 2006, when prices respectively represented 56% and 78% of the rise in exports. Throughout 2003-2007, prices rises were responsible for half of the growth in the values exported by Brazil, up 10.1% c.a. These figures contrast with the ones for 1998-2002, when prices contributed negatively to variation in exports.
GrAph 15BRAZIL: GROWTH OF pRICES AND OF THE ExpORT QUAntUM
1998-FIRST HALF OF 2008(%)
Prices Quantum
1998 1999 2000 2001 2002 2003 2004 2005 2006 2007 2008a/
2824201612
840
-4-8
-12-16
Note:a/Firsthalf.
Source:FUNCEX,basedonSECEX-MDICdata.
The reverse was true of imports, whose growth in 2007 was due to a 22% rise in quantities imports, although prices made a significant contribution with a rise of 8.2%. From 2003 to 2007, the import quantum rose 11.2% c.a. and prices were up 8.5% c.a. Prices played an even more important part in the first half of 2008. In fact, all growth in the values exported in the period was due to a 25.2% rise in prices, with the quantum falling 1.5%. In terms of imports, price rises in the period were also quite marked (22.3%), accompanied by similar growth of the quantum (22.9%).

42
Brazilian exports to MERCOSUR partners were far more dynamic than those to the rest of the world. Table 8 shows that exports in 2007 reached US$17.4 billion, 24.1% up on the previous year, a rate well above the 16.6% of the country’s total exports. In 2003-2007, sales to its trade partners rose 39.3% c.a., also well up on the total average (21.6%), which allowed the share of Argentina, Paraguay, and Uruguay to rise to 10.8% of the total in 2007. Nevertheless, its share continues to be well below the 17.4% of 1998, despite the price of commodities hitting a historic low that year, as mentioned above.
tABle 8BRAZIL: TRADE FLOWS WITH MERCOSUR COUNTRIES AT SELECTED TIMES
(US$Millions)
1998 2002 2006 2007 % Var. 2007/2006 2007a/ 2008a/ % Var.
Exports
MERCOSUR/total (%) 17.4 5.5 10.1 10.8 10.4 11.5
MERCOSUR 8,877 3,311 13,986 17,354 24.1 7,596 10,459 37.7
Argentina 6,747 2,347 11,740 14,417 22.8 6,311 8,589 36.1
Paraguay 1,249 560 1,234 1,648 33.6 699 1,112 59.2
Uruguay 881 413 1,013 1,288 27.2 587 758 29.1
imports
MERCOSUR/total (%) 16.3 11.9 9.8 9.6 9.9 8.9
MERCOSUR 9,428 5,615 8,968 11,630 29.7 5,204 7,037 35.2
Argentina 8,034 4,744 8,054 10,410 29.3 4,694 6,238 32.9
Paraguay 351 383 296 434 46.7 162 320 97.0
Uruguay 1,042 485 618 786 27.2 347 478 37.6
trade Balance
MERCOSUR (551) (2,304) 5,018 5,723 14.1 2,392 3,422 43.0
Argentina (1,287) (2,397) 3,686 4,007 8.7 1,617 2,351 45.4
Paraguay 898 177 938 1,214 29.5 536 793 47.7
Uruguay (162) (72) 394 502 27.4 239 279 16.7
Note:a/Firsthalf.
Source:SECEX-MDIC.
Argentina was the destination for 83.1% of Brazilian exports to MERCOSUR, a share that has been growing over the years, whereas Paraguay received 9.5% and Uruguay, 7.4%.
Brazilian imports from MERCOSUR partners totaled US$11.6 billion in 2007, a rise of 29.7% that compares unfavorably with the 32.1% rate of total Brazilian imports. Throughout 2003-2007, MERCOSUR purchases grew at a rate of 15.7% c.a., also below the average rate of total imports (20.6%). As a result, the partners’ share in the Brazilian import basket has been steadily falling in recent years (in 2007, it stood at 9.6%,

43
after reaching 16.3% in 1998). Almost 90% of all Brazil’s imports from MERCOSUR in 2007 came from Argentina, while Uruguay had a 6.8% share and Paraguay just 3.7%.
The Brazilian balance trade with all MERCOSUR partners continued to be extremely positive, reaching the record level of US$5.7 billion in 2007. In comparison with the previous year, Brazil’s surplus was up, against both Argentina (8.7%), and Paraguay and Uruguay (29.5% and 27.4% respectively).
The general picture for intrazone trade showed no major changes in the first half of 2008. Brazilian exports to MERCOSUR grew 37.7% (above the general average) and imports rose 35.2% (below the general average). This caused the trade balance to grow 43% in relation to the same period for 2007. The most remarkable thing was that MERCOSUR was the only economic bloc with which Brazil managed to improve its trade balance in the period.
In spite of strong performance in exports to Argentina, the Brazilian market share in imports from its neighbor fell after peaking at 35.5% in 2005. Its share was 32.4% in 2007 and contracted even further over the first half of 2008 to 31.7%, the lowest level in six years. In the case of Paraguay, the Brazilian market share had, for several years, already been seeing a downward trend, but grew slightly in 2007 to 28.5% and remained at 28% in the first half of 2008. In Uruguay, the Brazilian share has gradually increased, reaching 23.5% in 2007, but falling to 18% in the first half of 2008.
Table 9 sets out the distribution of Brazil’s trade flows according to the main economic blocs outside MERCOSUR. In 2007, exports reached US$143.3 billion, 89.2% of the country’s total sales, 15.7% up on the previous year. The EU is the main destination of Brazilian sales, with a share of 25.2% of the total, followed by NAFTA with 19.9% of the total, Asia with 15.6%, and LAIA with 9.2%. Other Countries’ share was 19.3%. In fact, Brazilian exports have been fairly well-distributed across the world for some years now: almost 25% go to the EU, 20% to NAFTA, 20% to Latin America (including MERCOSUR), 15% to Asia, and another 20% to the rest of the world.
In spite of this reasonably stable distribution of extrazone flows, great variability was seen in 2007 in the growth of sales to the various blocs, with steep growth in those to the EU (30.2%) and Asia (20.5%), low growth in sales to NAFTA (just 1.3%), and a moderate performance in sales to LAIA and Other Countries. The best result in trade with Europe and Asia are due to the composition of exports to those regions that are concentrated in commodities, whose prices rose significantly in 2007.
In terms of imports, the distribution by economic bloc of origin is also quite highly diversified. In 2007, the country’s main suppliers were the Asian countries, with 25.5% of total Brazilian imports, followed by the EU with 22.2%, NAFTA with 18.7%, and LAIA with 5.8%. 18.2% corresponded to Other Countries.
The composition of Brazil’s trade balance showed significant changes in 2007 in comparison with the previous year. The surplus with NAFTA dropped 33.9% (US$4.8 billion) and, as a result, NAFTA ceased to be the destination with which Brazil has its largest trade balance. That place has been taken by the EU, which, in 2007, recorded a deficit US$13.7 billion (+US$2.8 billion) with Brazil. There was also an increase, favorable to Brazil, in the balance in trade with the LAIA countries (+US$809 million). Offsetting this, the deficit with Asian countries more than doubled, to US$5.7 billion.
In the first half of 2008, Brazilian exports to destinations outside MERCOSUR accelerated, 22.2% up on the same period for 2007, due mainly to the improved performance of sales to Asia and Other Countries. Offsetting this, extrazone imports grew no less than 52.4%, and Asian countries were once again prominent,

44
their sales to Brazil growing by 64.7%. The result was a fall of over US$10 billion in the extrazone trade balance, with a worsening of the result with all blocs, including LAIA and the EU. The surplus with NAFTA fell US$3 billion, whereas with Asian countries it was up US$3.6 billion.
tABle 9BRAZIL: ExTRAZONE TRADE FLOWS BY ECONOMIC BLOC AT SELECTED TIMES
(US$Millions)
1998 2002 2006 2007 % Var. 2007/2006 2007a/ 2008a/ % Var
Exports
Extrazone/total (%) 82.6 94.5 89.9 89.2 89.6 88.5
Extrazone 42,243 57,128 123,822 143,296 15.7 65,617 80,186 22.2
NAFTA 11,411 18,687 31,512 31,936 1.3 15,074 15,852 5.2
EU 15,250 15,609 31,045 40,428 30.2 18,178 22,146 21.8
LAIAb/ 3,506 4,226 13,051 14,812 13.5 6,734 7,590 12.7
Asia 5,613 8,798 20,816 25,086 20.5 11,460 16,306 42.3
OtherCountries 6,464 9,807 27,397 31,033 13.3 14,172 18,293 29.1
imports
Extrazone/total (%) 83.7 88.1 90.2 90.4 90.1 91.1
Extrazone 48,287 41,628 82,375 108,991 32.3 47,433 72,273 52.4
NAFTA 16,008 11,760 17,355 22,575 30.1 10,250 14,035 36.9
EU 17,184 13,495 20,201 26,736 32.3 11,885 16,632 39.9
LAIAb/ 1,959 2,033 6,020 6,972 15.8 3,195 4,566 42.9
Asia 7,881 7,996 22,887 30,715 34.2 13,041 21,481 64.7
OtherCountries 5,254 6,344 15,912 21,993 38.2 9,063 15,560 71.7
trade Balance
Extrazone (6,044) 15,500 41,447 34,305 (17.2) 18,184 7,912 (56.5)
NAFTA (4,597) 6,927 14,157 9,361 (33.9) 4,823 1,817 (62.3)
EU (1,934) 2,114 10,844 13,692 26.3 6,293 5,513 (12.4)
LAIAb/ 1,547 2,194 7,031 7,840 11.5 3,540 3,024 (14.6)
Asia (2,269) 802 (2,071) (5,629) 171.9 (1,581) (5,175) 227.4
OtherCountries 1,209 3,463 11,485 9,040 (21.3) 5,109 2,733 (46.5)
Notes: a/Firsthalf. b/WiththeexceptionofMERCOSURandMexico.
Source:SECEX-MDIC.
Analysis of the composition of Brazilian exports by type of goods shows that commodities have performed far more favorably against manufactured or semi-manufactured goods recently, so that their share has gone from 29.2% in 2006 to 35.3% in the first half of 2008. This increase is equivalent to the loss recorded in manufactured products, whose share fell from 54.4% to 48.4% in the same period, whereas the share of semi-manufactured goods remains reasonably stable. That rapid change in the composition of Brazilian

45
exports is due largely to the sharp increase in international commodity prices. In fact, between the first half of 2006 and the first half of 2008, the export prices of commodities grew 52.6%, i.e. double the price rise of manufactured products.
Furthermore, many experts have pointed out that the combination of foreign exchange appreciation and rising levels of use of the installed capacity in industry could be affecting the dynamism of manufactured product exports. In terms of imports according to categories of the economic use of goods, the composition has not seen very significant changes in recent years, although one cannot but point out the drop in the share of raw materials and intermediate goods, and the gradual increase in consumer and capital goods. Indeed, the last two categories saw the highest rates of growth in 2007 (38.1% and 35.9% respectively) and have performed best in terms of quantities imported, a reflection of the rapid growth of investments and of the internal demand for durable goods, mainly automobiles and electrical and electronic goods, at far higher rates than GDP growth.
Paraguay
Paraguay’s flow of foreign trade performed exceptionally well in 2007, especially exports, which saw the highest growth rate in two decades (46.1%), reaching a record level of US$2.8 billion. Graph 16 shows that this was the fifth consecutive year of export expansion, a dramatic contrast with the virtual stagnation of Paraguay’s external sales between 1990 and 2002. The strong performance of exports, however, has not been enough to improve Paraguay’s trade balance, which in 2007 reached a record deficit of US$2.8 billion. This is due to the fact that in the last five years there has also been rapid growth in imports, which reached US$5.6 billion in 2007, 24.2% up on 2006.
GrAph 16pARAGUAY: TRADE FLOWS IN 1990-2007
(US$Billions)
Balance Export Import Trade Flow
1990
1991
1992
1993
1994
1995
1996
1997
1998
1999
2000
2001
2002
2003
2004
2004
2006
2007
9876543210
-1-2-3
Source:BCP.
46
The evolution of trade was even more favorable in the first half of 2008. Exports totaled US$2.3 billion, 85.7% up on the first half of 2007, and imports reached US$3.8 billion, a rise of 54.9%. The trade deficit stood at US$1.5 billion, with 24.1% growth.
Unlike Argentina and Brazil, the recent strong performance of Paraguayan exports cannot be explained primarily by price rises. In 2003-2007, the growth of the quantum was 17.9% c.a., while prices grew at just 5.1% c.a. In 2007, the quantum rose 36.6%, as against an increase of just 7% in prices. Imports behaved in a similar fashion: indeed, the quantum rose 20.6% that year, against a price rise of just 3%. Between 2003 and 2007, the import quantum grew 24.2% c.a., while prices increased by 4.6% c.a.43
In fact, the evolution of the unit prices of Paraguay’s exports and imports shows the country has made no significant earnings in the terms of trade in recent years. Although they rose 3.9% in 2007, throughout 2003-2007, the cumulative gain was just 2.6%. Although 2007 has seen a large rise in soya and corn prices, the increase in the petroleum price affected Paraguay’s improved terms of trade.
In contrast, the steep price rises in agricultural products, roughly from the end of 2007, allows ones to infer that much of the growth of Paraguayan exports in the first half of 2008 was due to price rises. However, given the intensity of the growth of values, it is quite probable that the export quantum has also grown steeply.
MERCOSUR countries were the destination for almost half of Paraguay’s exports in 2007, a total of US$1.370 million. Approximately 40% went to Argentina, a further 40% to Brazil, and the remaining 20% to Uruguay. Brazil and Argentina thus continue to be the main markets for Paraguayan products, together representing 40% of the country’s total sales (Table 10).
In the last five years, MERCOSUR’s share in Paraguayan exports has fallen 9 p.p., due basically to the low growth of sales to Brazil (9.6% c.a.) and Uruguay (9.9% c.a.). It is for this reason that Paraguay’s market share in Uruguayan imports has fallen steadily in recent years, reaching just 0.5% in 2007. In Brazil, the share of Paraguayan exports has remained stable at extremely low levels (approximately 0.4%). Exports to Argentina, however, grew by 73.9% c.a. in the last five years, after falling to minimal levels in 2002. Because of this, Paraguay has gained in market share in Argentine imports, reaching the figure 2.4% in 2007 after being just 1.1% in 1998.
The YOY growth of Paraguayan imports in 2007 was substantial in purchases from MERCOSUR, with a 45.7% variation, while the total grew by 24.2%. The bloc’s share in Paraguay’s total imports thus reached 44.1% in 2007, still below the figure of around 56% seen in 1998 and 2002. Almost two thirds of the US$2.5 billion in imported products from MERCOSUR originated in Brazil. Argentina contributed 32.5% and Uruguay had a share of just 3%. Brazil continued to be Paraguay’s largest supplier, with 28.5% of the total, but China has been growing apace and exported similar amounts to Paraguay in 2007 as Brazil. Argentina is Paraguay’s third largest supplier.
Paraguay’s trade deficit with its MERCOSUR partners rose again in 2007 to US$1.1 billion, an increase of 40.8%. This value represents almost 40% of Paraguay’s total deficit and has been growing steadily since 2002. It is almost totally related to trade with Brazil (a debit balance of US$1 billion), but there was also a significant deficit with Argentina (US$248 million). Only with Uruguay did Paraguay obtain a surplus in 2007 (US$191 million), and even so this was almost 50% down on the previous year.
43 TheexportpriceindexiscalculatedbyECLAC.Thequantumwasobtainedbydeflatingthevaluesexportedwiththispriceindex.

47
tABle 10pARAGUAY: TRADE FLOWS WITH MERCOSUR COUNTRIES AT SELECTED TIMES
(US$Millions)
1998 2002 2006 2007 % Var. 2007/2006 2007a/ 2008a/ % Var.
Exports
MERCOSUR/total (%) 52.3 58.1 48.1 49.3 49.6 51.1
MERCOSUR 531 553 917 1,374 49.9 608 1,164 91.4
Argentina 153 35 168 552 227.5 188 305 62.6
Brazil 349 353 328 558 70.1 325 495 52.4
Uruguay 29 165 420 264 (37.1) 95 364 281.0
imports
MERCOSUR/total (%) 56.0 56.0 37.6 44.1 40.5 41.2
MERCOSUR 1,383 845 1,689 2,461 45.7 995 1,566 57.4
Argentina 481 309 677 800 18.1 356 467 31.2
Brazil 822 478 960 1,588 65.4 610 1,064 74.5
Uruguay 80 58 52 74 42.3 29 34 19.4
trade Balance
MERCOSUR (853) (293) (772) (1,087) 40.8 (387) (402) 4.0
Argentina (328) (275) (509) (248) (51.3) (169) (162) (3.7)
Brazil (473) (125) (632) (1,030) 63.0 (285) (569) 99.6
Uruguay (51) 107 368 191 (48.3) 67 329 394.0
Note:a/Firsthalf.
Source:BCP.
There was marked growth in Paraguayan exports to MERCOSUR partners during the first half of 2008 (91.4%). Especially worthy of note was the 281% expansion of sales to Uruguay. Imports from MERCOSUR also grew considerably in this period at a rate of 57.4%. These figures meant that Paraguay’s deficit with MERCOSUR remained almost stable at approximately US$400 million as against the same period for 2007. Its composition, however, was different: although the deficit with Argentina (US$162 million) has remained relatively stable in comparison with the same period in 2007, the deficit with Brazil doubled (US$569 million). In contrast, the surplus with Uruguay rose significantly (US$329 million).
Table 11 shows the distribution of Paraguay’s trade flow according to the main economic blocs outside MERCOSUR. In terms of exports, the main destinations in 2007 were Other Countries (17.6% of Paraguay’s total sales). The LAIA countries share was also outstanding, at 15.8% of the total, and sales to Chile, Peru, and Venezuela were especially worthy of note.
Most of the goods purchased by Paraguay outside MERCOSUR come from Asian countries, whose share in Paraguay’s total imports in 2007 was 38.6%. China alone exported a value of US$1.6 billion to Paraguay. The other extrazone imports are divided among NAFTA (6.2% of the total), the EU (5.6%), LAIA (4.4%), and Other Countries (1.1%). Asia also accounts for almost the whole of Paraguay’s trade deficit in extrazone

48
trade, with a debit balance of US$2 billion in 2007 (71.1% of the country’s total deficit). There were slight deficits with NAFTA and the EU, and surpluses with LAIA and Other Countries.
tABle 11pARAGUAY: ExTRAZONE TRADE FLOWS BY ECONOMIC BLOC AT SELECTED TIMES
(US$Millions)
1998 2002 2006 2007 % Var. 2007/2006 2007a/ 2008a/ % Var.
Exports
Extrazone/total (%) 47.7 41.9 51.9 50.7 50.4 48.9
Extrazone 483 398 990 1,411 42.6 619 1,114 80.1
NAFTA 83 42 74 80 8.3 32 29 (10.8)
EU 285 83 114 233 103.9 147 162 10.2
LAIAb/ 66 99 153 441 189.0 167 331 98.7
Asia 18 48 101 166 65.0 50 227 349.3
OtherCountries 31 126 548 491 (10.4) 222 366 64.6
imports
Extrazone/total (%) 44.0 44.0 62.4 55.9 59.5 58.8
Extrazone 1,087 665 2,800 3,116 11.3 1,459 2,236 53.2
NAFTA 282 92 375 343 (8.5) 163 210 28.6
EU 284 142 243 313 29.0 139 202 44.8
LAIAb/ 30 29 227 246 8.4 172 288 67.0
Asia 449 305 1,739 2,152 23.7 952 1,444 51.7
OtherCountries 42 95 216 61 (71.6) 33 92 181.8
trade Balance
Extrazone (604) (267) (1,811) (1,705) (5.8) (841) (1,121) 33.4
NAFTA (199) (50) (301) (263) (12.6) (131) (181) 38.3
EU 1 (59) (129) (81) (37.4) 7 (40) (654.9)
LAIAb/ 35 69 (75) 195 (361.1) (6) 44 (887.4)
Asia (430) (257) (1,638) (1,986) 21.2 (901) (1,217) 35.1
OtherCountries (11) 30 332 430 29.4 189 273 44.3
Notes: a/Firsthalf. b/WiththeexceptionofMERCOSURandMexico.
Source:BCP.

49
During the first half of 2008, the shape of Paraguay’s extrazone trade presented no major alterations in relation to the pattern of previous years. The main export market continued to be Other Countries, followed by LAIA and the Asian countries, where Paraguayan sales were up no less than 349.3% on same period for 2007. The highest import growth was seen in imports from Other Countries, but Asia continued to have a share of almost 40% in Paraguay’s total purchases. The trade balance with Asia highly negative, responsible for almost 80% of Paraguay’s total deficit in the period.
Analysis of the composition of Paraguay’s export basket by product shows that it continues to be extremely concentrated in agricultural or agroindustrial products. Just seven products accounted for 80% of the country’s external sales in 2007: soya and derivatives (45%), meat (12.9%), corn (10.2%), wood (4.2%), hides (3%), wheat (2.5%), and cotton (2.2%). These products’ share has remained fairly stable over the last fifteen years.
In terms of the composition of imports, the most remarkable thing is that, in recent years, capital goods have become the main heading, concentrating 45% of the total in 2007, and in the first half of 2008 too. Until a few years ago, this position was occupied by consumer goods, which in 2007 accounted for 25% of imports. These figures reflect the fact that Paraguay has been undergoing a more intense capital formation process, which is likely to have beneficial effects on its future economic growth. Raw materials, intermediate goods, and fuels have also gradually lost share in imports in recent years, and together represent 28% of the total.
Uruguay
In 2007, Uruguay’s flows of foreign trade saw a period of marked growth, albeit at a more modest ace the other MERCOSUR countries. Exports reached US$4.5 billion, 12.9% up on 2006, but signifying a slowdown compared to previous years. In 2003-2007, annual average growth was 19.3%. Graph 17 shows that 2007 was the fifth consecutive year of export expansion, after the downturn of 1999-2002.
However, such strong exporter performance was not enough to improve Uruguay’s trade balance, which in 2007 reached a US$1.1 billion deficit, the worst result since 2000. This is due to the fact that imports grew at a systematically higher pace than exports. In 2007, they reached US$5.6 billion, 17% up on 2006. Between 2003 and 2007, growth was 23.3% c.a. In 2007, Uruguay’s trade flow exceeded US$10 billion for the first time.
The evolution of trade flows during the first half of 2008 showed dramatic acceleration. Exports totaled US$3 billion, up 43.6% on the same period for 2007, while imports reached US$4.5 billion, an increase of no less than 92.6%. The trade balance thus suffered further decline, recording a deficit of US$1.6 billion, the worst result in the historical series.
Export prices contributed very significantly to the growth of the value exported by Uruguay in 2007, with a 6% increase, similar to the 6.5% rise in the quantum. However, in 2003-2007, the growth of the quantum headed the rise in exports, given that its annual average growth was 12.8%, as against a 5.8% c.a. rise in prices. The same happened with imports: in 2007, the quantum rose 10.5% over the previous year, exceeding the 6% increase in prices. In 2003-2007, the quantum grew at a rate of 13.2% c.a., as against an 8.9% c.a. evolution in prices.44
44 SeeNote43.

50
GrAph 17URUGUAY: TRADE FLOWS IN 1990-2007
(US$Billions)
11109876543210
-1-2
1990
1991
1992
1993
1994
1995
1996
1997
1998
1999
2000
2001
2002
2003
2004
2004
2006
2007
Balance Export Import Trade Flow
Source:BCU.
The evolution of export and import unit prices shows that Uruguay enjoyed no gains in the terms of trade in recent years. In fact, the terms of trade show a downward trend in recent years, after peaking in 2003. Since then, the cumulative loss in terms of trade is 14.2%. As with Paraguay, this is probably the result of the Uruguayan export basket being excessively concentrated in a few agricultural products, the prices of which did not evolve particularly favorably up to 2007.
MERCOSUR countries were the destination for slightly over a quarter of Uruguayan exports in 2007. Rather more than half of the US$1.250 million went to Brazil, 16.2% of Uruguay’s total exports. Argentina was the destination for slightly over a third of MERCOSUR exports and for 9.8% of total exports, while Paraguay received less than 2% of Uruguay’s total exports (see Table 12). Despite this strong performance, MERCOSUR’s share in Uruguay’s total exports is still less than in 2002 (32.6%) and is far lower than 1998 (55.3%).
Uruguay has for some years had a relatively stable market share in its neighbors’ imports, approximately 1% in Argentina and 0.7% in Brazil, while in Paraguay its share was down considerably on the start of the decade, from approximately 3.2% to just 1.3% in 2007.
In its pattern of imports, Uruguay’s MERCOSUR partners continue to be the main suppliers, with 46.2% of the total imported by the country in 2007. The US$2.6 billion was 18.2% up on the previous year, with growth in purchases from Brazil (21.9%) especially prominent. Brazil was Uruguay’s main supplier in 2007, with a share of 23.5%, besting Argentina’s 22.1%. Purchases by Paraguay represented just 0.5% of the total.

51
Uruguay’s trade deficit with its MERCOSUR partners rose again in 2007, to US$1.3 billion, an increase of 7.5%. Most of this is linked with trade with Argentina, whose US$794 million balance was negative, but the result with Brazil was also on the negative side (US$586 million). With Paraguay, the US$46 million balance was slightly positive. In fact, Uruguay’s trade deficit has been concentrated in MERCOSUR for several years now, as the extrazone balance has been positive, reaching US$243 million in 2007.
In the first half of 2008, Uruguayan exports to MERCOSUR accelerated, up 45.8%, with an especially significant variation in sales to Brazil (51.8%). However, imports from its neighbors grew even more rapidly (74.4%): purchases in Argentina saw an increase of 118%, again making it Uruguay’s number one supplier. The deficit with MEROSUR was almost double what it was in the same period for 2008, reaching US$1.3 billion, a value close to the one recorded for the whole of 2007.
tABle 12URUGUAY: TRADE FLOWS WITH MERCOSUR COUNTRIES AT SELECTED TIMES
(US$Millions)
1998 2002 2006 2007 % Var. 2007/2006 2007a/ 2008a/ % Var.
Exports
MERCOSUR/total (%) 55.3 32.6 23.6 27.7 25.6 26.0
MERCOSUR 1,532 607 942 1,247 32.4 528 770 45.8
Argentina 513 113 301 441 46.3 188 254 35.1
Brazil 935 432 583 728 25.0 307 466 51.8
Paraguay 84 62 58 77 32.4 33 49 48.5
imports
MERCOSUR/total (%) 43.3 48.1 45.7 46.2 49.9 45.2
MERCOSUR 1,652 944 2,182 2,580 18.2 1,174 2,047 74.4
Argentina 842 541 1,079 1,235 14.5 555 1,209 118.0
Brazil 793 390 1,078 1,314 21.9 604 817 35.3
Paraguay 16 14 26 31 18.4 15 21 40.0
trade Balance
MERCOSUR (119) (337) (1,240) (1,333) 7.5 (646) (1,277) 97.8
Argentina (328) (427) (777) (794) 2.2 (367) (955) 160.5
Brazil 142 42 (495) (586) 18.3 (297) (351) 18.2
Paraguay 67 48 32 46 43.6 18 28 55.6
Note:a/Firsthalf.
Source:BCU.

52
In 2007, Uruguay’s extrazone trade grew at a less intense pace than intrabloc trade. Exports rose just 6.9%, with an especially poor performance in sales to LAIA (18.7% down) and Asia (just 2.7% up). However, the growth in sales to the EU was quite marked (24.6%), making this bloc the main destination for Uruguayan exports after MERCOSUR, with a share of 18.5% of the total and displacing the NAFTA countries, with 17.2% (Table 13). Other Countries also had a significant share (18.2%), mainly the Middle East and Africa.
The pattern of imports is distributed slightly differently. The main suppliers outside MERCOSUR are the Asian countries, with 15.4% of Uruguay’s total purchases, followed by the LAIA countries, with 13.1%, in which Venezuela is prominent: with 87% of the bloc’s sales, it is Uruguay’s third largest. The EU represented 10.4% of Uruguayan imports, and NAFTA just 9.2%.
Uruguay’s extrazone trade surplus reached US$243 million in 2007, 46% down on the previous year. This worsening was due mainly to the increase in deficits with the LAIA countries (US$449 million) and Asian countries ($316 million). Uruguay has a surplus with Other Countries (US$497 million), and with the EU (US$254 million) and NAFTA (US$256 million).
Uruguay’s extrazone trade also grew rapidly during the first half of 2008, especially imports, which grew 110.7%, driven mainly by purchases from NAFTA and Other Countries. Exports grew 42.9%, with a steep rise in sales to the EU, LAIA countries, and Other Countries, and a drop in exports to NAFTA. The trade balance was in deficit to the tune of US$294 million, US$650 million down on the positive balance in the first half of 2007, due mainly to the investment of the balance with NAFTA and the increase in the deficit with Asia.
Analysis of the composition of Uruguay’s exports by product shows that they continue to be quite heavily concentrated in agricultural or agroindustrial products, representing approximately 60% of the total in 2007. Among them, commodities (meat, fish, cereals, and other agricultural products) represented almost 40% and industrial products of agricultural origin (mainly food and drink, hides and skins, and wooden products) constituted almost 20%. Among the other industrialized products are textiles (6.8%), plastics and rubber (5.5%), chemicals (5.3%), and transport material (2.7%).
In terms of the composition of imports, almost 45% of the total in 2007 was raw materials and intermediate goods, which traditionally represent half of the total. Consumer goods, and fuels and lubricants each represented almost 20% of the total, with relatively stable percentages over the last five years. Capital goods represented just 13% of the total in 2007, slightly up on the average for previous years. It should be remembered that the share of capital goods in Uruguayan imports is well below Argentina and Paraguay’s, and is only comparable to Brazil’s. It should be pointed out, however, that Brazil has significant internal production of these goods, which is not the case with Uruguay. This reflects the fact that investment levels in Uruguay remain relatively low, in contrast with the favorable evolution of this variable seen in the other MERCOSUR countries.

53
tABle 13URUGUAY: ExTRAZONE TRADE FLOWS BY ECONOMIC BLOC AT SELECTED TIMES
(US$Millions)
1998 2002 2006 2007 % Var. 2007/2006 2007a/ 2008a/ % Var.
Exports
Extrazone/total (%) 44.7 67.4 76.4 72.3 74.4 74.0
Extrazone 1,236 1,254 3,043 3,251 6.9 1,532 2,189 42.9
NAFTA 210 239 715 773 8.1 400 181 (54.7)
EU 459 445 668 832 24.6 405 592 46.1
LAIAb/ 251 156 351 286 (18.7) 128 214 67.2
Asia 295 317 530 544 2.7 276 363 31.4
OtherCountries 21 98 779 817 4.8 323 839 160.0
imports
Extrazone/total (%) 56.7 51.9 54.3 53.8 50.1 54.8
Extrazone 2,159 1,020 2,593 3,008 16.0 1,178 2,483 110.7
NAFTA 526 200 407 516 26.9 189 428 126.3
EU 802 352 477 578 21.4 230 345 49.9
LAIAb/ 170 106 712 734 3.1 307 366 19.3
Asia 454 191 745 860 15.4 326 592 81.4
OtherCountries 208 171 252 319 26.7 126 751 498.3
trade Balance
Extrazone (923) 234 450 243 (46.0) 354 (294) (183.0)
NAFTA (316) 39 308 256 (16.8) 211 (248) (217.3)
EU (343) 93 191 254 32.7 175 246 41.0
LAIAb/ 81 49 (360) (449) 24.5 (179) (152) (15.0)
Asia (159) 125 (216) (316) 46.4 (50) (229) 358.3
OtherCountries (186) (73) 527 497 (5.6) 197 88 (55.5)
Notes: a/Firsthalf. b/WiththeexceptionofMERCOSURandMexico.
Source:BCU.

54
Box dTHE MAJOR TRADE BALANCES IN FAVOR OF BRAZIL AND THE QUESTION OF ECONOMIC ASYMMETRIES
ThemarkedaccelerationoftotalBrazilianimportsduring2007andinthefirsthalfof2008broughtaboutapronouncedreductionof the country’s trade surplus, except with MERCOSUR partners. In fact, from 2003, Brazilian exports to their neighboringMERCOSURcountrieshavegrownfasterthatimportsfromthesamecountries.ThesubsequentgrowthofBrazil’stradesurpluseswitheachofitsMERCOSURpartnersisconsideredasyntheticindicatorofexistingeconomicasymmetrieswithintheambitofthebloc.InArgentina,theconcernistodowiththepotentialriskthegrowingpenetrationofBrazilianindustrialproductsinitsmarketrepresentstoitsindustrialstrengtheningstrategy.InthecasesofParaguayandUruguay,thedeficitswithBrazilwouldthusbeproofthatMERCOSURisprovidinglittleornoeconomicbenefittothesecountries.Brazilwouldthusbethemajorbeneficiaryofintegrationinthebloc.
However,thebenefitsoftradeintegrationarenotonlymeasuredbytheexpansionofsalestopartners,butalsobythepossibilityofimportinggoodsfromthosecountriesatlowercosts,notonlybenefittingthecountry’sconsumers,butalsothecompaniesthatneedinputsandcapitalgoodsthatareoftennotproducedinternallyorareproducedatveryhighcosts.Furthermore,atradesurplusmayonlyreflectlowergrowthofinternaldemandforthecountryasagainsttheoneseeninOtherCountries.
Acomplementarywayofevaluatingtheeffectivegainsofaprocessofeconomicintegrationinvolvesanalyzingtheevolutionofacountry’sshareofsalesinitspartners’totalimports,i.e.itsmarketshare.Theoretically,itwouldbenaturalforaprocessoftradeintegrationtogenerateanincreaseinintrabloctradeflowhigherthanthatofextrabloctrade,preciselybecauseeachcountryhasprivilegedaccesstoitspartners’marketsunderthetariffpreferencesystem.Inthisperspective,thedataindicatethatthereare,infact,asymmetricbenefitsinMERCOSUR.
The following Graph shows that Brazil’s market share in the joint imports ofArgentina, Paraguay, and Uruguay has risenconsiderablyinthelasteightyears,reachingpercentagesofover30%between2003and2007,almostsixp.p.uponthesecondhalfofthe1990s.Ontheotherhand,thesecountries’marketshareinBrazilianimportsexperiencedasignificantdropinthesameperiod,ofapproximately6p.p.usingthesamecomparison.Thisputsitinthe9%to10%rangebetween2004and2007.Thegoodnewsisthatthemarketshareseemstohavebeenstabilizedatthatlevel.Thebadnewsisthattherearenosignsthatitwillreturntothelevelsofthe1990s.
BRAZIL’S SHARE IN OTHER MERCOSUR COUNTRIES’ IMpORTS VERSUS THEIR SHARE IN BRAZILIAN IMpORTS(%)
17
16
15
14
13
12
11
10
9
MERCOSURin Brazilian imports(left axis)
Brazil in MERCOSURImports (right axis)
1995
1996
1997
1998
1999
2000
2001
2002
2003
2004
2004
2006
2007
34
32
30
28
26
24
22
20
18
Sources:ABECEB(Argentina),INDEC(Argentina),SECEX(Brazil),BCP(Paraguay),andBCU(Uruguay).

55
Box d (Continued)
Itisasimportanttoidentifytheproblemasitistoanalyzethefactorscausingit.Inthiscase,thelossofmarketshareinBrazilianimportsmaybeduetotwofactors.a/ThefirstistodowithpotentialcompetitivenessproblemsoftheproductsexportedtoBrazilbythepartnercountriesagainstproductsprovidedbythirdsuppliersfromBrazil,eitherbecausecompetitorsareabletoapplylowerpricesorbecauseMERCOSURpartnersarelimitedintermsofthevolumeofexportablesupply.Asaresult,thesecountrieswouldundergoadropintheirmarketshareinBrazilianimportsoftheproductsinquestion.
ThesecondfactoristodowithapossibleimbalancebetweenthestructureofArgentina,Paraguay,andUruguay’sexportsupplyandthestructureofBrazil’simportdemand,sothatcountries’exportswouldbeconcentratedinproductsthatareinsignificantin theBrazilian importscheme, inotherwords,productswhosegrowth inBrazilian importswasbelowthatobservedinthecountry’stotalimports.
ComparativeanalysisofthecompositionofBrazilianimportsfromMERCOSURcountriesintermsofitstotalimportsbetween2002and2007makesitclearthatthelossofmarketsharewasduetoacombinationofthesetwofactors,albeitwithdifferingdegreesofrelevanceineachcountry.ThemostemphaticcaseisthatofParaguay,wherebothfactorswereofsupremeimportance.Infact,96%ofParaguayanexportstoBrazilin2002weremadeupofproductswhoseBrazilianimportsgrewmoreslowlythantotalimportsbetweenthatyearand2007,andParaguaywasnotabletoalterthecompositionofitssalestoBrazil,astheseproductscoveredquiteahighpercentagein2007(83%).Inaddition,almostalltheproductswithasignificantshareinthestructureofParaguayanexportstoBrazilin2002underwentlossesofmarketshareinBrazilianimportsoverthefollowingyears,especiallyvegetableoils,cotton,andmeat.
ThecaseofUruguaydisplayssimilarcharacteristics,asalmost70%ofexportstoBrazilin2002weremadeupofproductswhoseBrazilianimportsgrewmoreslowlythantotalimportsinthefollowingyears.Theseproductsrepresentedalmost70%ofsalestoBrazilin2007,whichmeansthatUruguaycouldnotredirectitssalestowardproductswithgreaterdynamisminBrazilianimports.Furthermore,nolessthan82%ofexportsin2002consistedofproductsthatlostmarketshareinBrazilianimportsbetween2002and2007.
These two factorswere also significant in the case ofArgentina, albeit to a lesser extent, as amirror image of the greaterdiversificationofitssalestoBrazil.OnlyhalfofexportstoBrazilin2002weremadeupofproductswhoseBrazilianimportsgrewmoreslowlythantotalimports,andthelossesofmarketshareincludedproductsthatrepresented55%ofsalestoBrazilin2002.
Infact,themainexplanationforArgentina’stotallossofmarketshareinBrazilianimportsliesintheperformanceofthesalesof just twoproducts:petroleum,whosesales toBrazil fell 90%between2002and2007,whereasBrazilian importsweregrowingrapidlywiththesubstantialdecreaseintheArgentinemarketshare;andwheat,aheadingthatlostshareinthetotalstructureofBrazilianimportsinthatperiod.IftheArgentinemarketshareinpetroleumhadheldupandtheshareofwheatintheBrazilianimportbaskethadnotaltered,Argentina’smarkettotalshareinimportswouldhaveremainedatapproximately10%in2007,asimilarfigureto2002.
In short, the performance of Argentine, Paraguayan, and Uruguayan exports to Brazil have been damaged largely byproblemsrelatedtothesecountries’exportsupply.Ontheonehand,theyhavehadserioustroublediversifyingtheirsalestowardmoredynamicgoodsinBrazilianimports;ontheother,theyarebeingdisplacedbycompetitionfromthirdcountries,eveninproductsinwhichtheypossesscomparativeadvantages.ThisisessentiallytheproblemofeconomicasymmetriesinMERCOSUR,aquestionthathasbeenonthebloc’sagendasinceitscreation,butwhich,upuntilnow,hasbeendealtwithtimidly.Chapter3goesintomoredepthaboutthecurrentstateofthediscussionsandinitiativesintheambitofMERCOSURtotacklethisproblem.
--------------------a/SeeMERCOSUR Report 11[2006],Chapter2.

56
c. mERcoSuR-venezuela trade
The trade flow between MERCOSUR countries and Venezuela has grown rapidly in recent years, and reaching the record figure of US$7.2 billion in 2007, 24.6% up on the previous year and 34.2% c.a. up on 2003. Graph 18 shows that most of this increase is due to the expansion of MERCOSUR exports, which reached US$6.1 billion in 2007, 36.7% up on 2006 and 44.4% c.a. up on 2003-2007. Venezuela’s exports to the Southern Cone bloc in turn experienced only moderate growth between 2003 and 2007 (10.8% c.a.) and shrank in 2007 by 15.3% to US$1.1 billion. As a result, the trade balance in favor of MERCOSUR grew substantially, to US$4.9 billion in 2007. It is important to point out that the trade flows between MERCOSUR and Venezuela were much more balanced until the beginning of the current decade and, in some cases, showed slight surpluses in favor of Venezuela, as in 2000, when Venezuelan sales to the bloc reached a record level of US$1.5 billion.
GrAph 18MERCOSUR: TRADE FLOWS WITH VENEZUELA IN 1998-2007
(US$Billions)
Balance Export Import Trade Flow
8
7
6
5
4
3
2
1
0
-1
1998
1999
2000
2001
2002
2003
2004
2004
2006
2007
Sources:INDEC(Argentina),SECEX-MDIC(Brazil),BCP(Paraguay),andBCU(Uruguay).
Brazil was responsible for 77.7% of MERCOSUR exports to Venezuela in 2007, followed by Argentina with 19.2% (Table 14). MERCOSUR has continually raised its share in imports from Venezuela since 2000, with 12.6% of the total in 2007. That year, the Brazilian market share in Venezuelan imports was 9.5%, more than double the figure at the end of the 1990s, as shown in Graph 19. Argentina’s market share, on the other hand, has remained between 2% and 3% in recent years, slightly up on the end of the 1990s.
Conversely, MERCOSUR has become less and less important as a destination for Venezuelan exports, reaching just 1.7% of the total in 2007, in contrast with the higher levels of previous years, for example,

57
1998, when it topped 4.8%. This is largely to do with the increase in petroleum prices that impacted on the value of the country’s total exports, but did not have the same effect on sales to MERCOSUR, where petroleum is of little relevance. The main destination of Venezuelan sales to MERCOSUR was Uruguay, which in 2007 accounted for 55.5% of everything the country sold to the bloc. Up to 2005, Brazil was the main destination, accumulating up to 90% of the total to this destination annually. However, its recent performance has been negative: between 2003 and 2007, Brazilian imports from Venezuela underwent a cumulative fall of 45.4%.
tABle 14VENEZUELA: TRADE FLOWS WITH MERCOSUR COUNTRIES AT SELECTED TIMES
(US$Millions)
1998 2002 2006 2007 % Var. 2007/2006
% Var. c.a. 2007/2002
Exports to Venezuela
MERCOSUR 1,106 969 4,446 6,079 36.7 44.4
Argentina 364 149 793 1,169 47.4 51.0
Brazil 706 799 3,565 4,724 32.5 42.7
Paraguay 8 10 10 87 803.0 55.0
Uruguay 28 11 78 99 26.2 54.6
imports from Venezuela
MERCOSUR 855 689 1,356 1,149 (15.3) 10.8
Argentina 58 7 25 24 (4.9) 26.4
Brazil 756 633 592 346 (41.5) (11.4)
Paraguay 3 5 140 142 1.3 97.2
Uruguay 38 44 599 638 6.4 70.5
trade Balance
MERCOSUR 251 280 3,091 4,930 59.5 77.5
Argentina 305 142 768 1,146 49.1 51.9
Brazil (49) 166 2,974 4,378 47.2 92.4
Paraguay 5 5 (130) (55) (57.7) (262.0)
Uruguay (10) (33) (521) (539) 3.4 74.8
Sources:INDEC(Argentina),SECEX-MDIC(Brazil),BCP(Paraguay),andBCU(Uruguay).
It is no coincidence that Venezuela has an extremely limited market share in imports form the MERCOSUR countries. In 2007, this was 0.7%, down on the 1% of 2006. Over the last 10 years, the highest market share (1.4%) was seen in 2000. Among MERCOSUR countries, Venezuela has a very low market share in Brazil and Argentina (less than 0.3%) and a much higher one in Uruguay (11.4% in 2007). In the Paraguayan imports, Venezuela’s market share was 2.5% in 2007.

58
In terms of MERCOSUR’s trade balance with Venezuela, most of the surplus recorded in recent years was obtained by Brazil, the balance of which was US$4.4 billion in 2007, a value that contrasts with the figures recorded just five years earlier, which showed a surplus of just US$166 million. Argentina’s surplus also grew substantially in recent years, from US$142 million in 2002 to US$1.1 billion in 2007. Paraguay and Uruguay, however, have had debit balances with Venezuela in recent years, and Uruguay’s US$539 million deficit in 2007 is especially worthy of note.
GrAph 19MERCOSUR’S MARKET SHARE IN VENEZUELAN IMpORTS IN 1998-2007
(%)
14131211109876543210
1998 1999 2000 2001 2002 2003 2004 2005 2006 2007
Argentina Brazil MERCOSUR
Source:LAIA.
The composition of MERCOSUR exports to Venezuela is reasonably diversified, but it is possible to identify a certain concentration in four types of products: agricultural, food, machinery and equipment, and automobiles and autoparts. In the case of Argentina, the last group had a share of almost 20% of exports to Venezuela in 2007, but there was also a significant share in food products (basically soya petroleum, meat, dairy products, cereals and malt), iron and steel products, tractors, machinery, and pharmaceutical products.
In Brazilian exports, the products of the automotive sector (not only automobiles and autoparts, but also trucks and buses) are the most important, contributing 27% of the total of sales from the country to Venezuela in 2007. But food products also had significant share (basically beef and poultry, sugar and milk), electronic products (mainly cellular telephones), machinery and equipment (especially construction and agricultural machinery), chemical products and basic metallurgy (aluminum and sheet steel). Together, these five groups accounted for almost 50% of exports. Soya petroleum represented almost 90% of Paraguay’s exports, while purchases from Uruguay were mainly pharmaceutical products (40% of the total), dairy products (11.5%), plastic products, bulldozers, and various animal products, especially meat.

59
Like its total exports, the composition of Venezuela’s exports to MERCOSUR is fairly heavily concentrated in just a few products. However, while these are basically petroleum-related (almost 90% of the total in 2007), sales to MERCOSUR include significant numbers of other products. Only in the case of Uruguay does petroleum dominate, with 98% of total sales in 2007. In Argentina, the petroleum coke and petroleum-derived chemical products had a share in exports of just 30%, while other products, like diamond drills, electric razors, aluminum disks, radiators, pigments, and chromium-based preparations, iron tubing, steel, and tires performed outstandingly, altogether making up almost 40% of exports in 2007.
In terms of sales to Brazil in 2007, directly petroleum-derived products had a share of just 27%, with other products of greater importance, such as mineral coal (15%), aluminum and aluminum alloys (12%), inorganic chemical products (10%), and urea (8%). Exports to Paraguay, for their part, were concentrated in tires (two thirds of the total in 2007) and plastic products (11%).
d. foreign direct investment in mERcoSuR45
2007 was a very favorable year for MERCOSUR countries in terms of foreign direct investment. The US$41.5 billion coming in that year was 62.7% up on 2006 and, for the first time in many years, came close to the investments received at the end of the 1990s of over US$50 billion (Graph 20). In that period, however, investments were stimulated by privatizations of public sector companies, especially in Brazil and Argentina. In recent years, however, investments were in response to the improved prospects of countries’ growth.
GrAph 20FOREIGN DIRECT INVESTMENT IN MERCOSUR
1994-FIRST HALF OF 2008(US$Billions)
6055504540353025201510
50
1994
1995
1996
1997
1998
1999
2000
2001
2002
2003
2004
2005
2006
2007
2007
a/
2008
a/
Note:a/Firsthalf.Thedatafromthe1sthalfof2007and2008donotincludeParaguay.
Sources:INDEC(Argentina),BCB(Brazil),BCP(Paraguay),andBCU(Uruguay).
45 ForadefinitionofFDI,seeNote17,Chapter1.WhereasChapter1considersnetFDIflows,thissectionlimitsitselftoadiscussionofFDIinflowsintoeachcountry’seconomy.

60
In terms of world FDI flows, MERCOSUR’s share increased to 2.1% in 2007, two tenths of a p.p. up on the previous year, but remained below the share of around 2.7% recorded between 2001 and 2005, and is still well below the second half of the 1990s (approximately 4.5%). The same is true of MERCOSUR’s share in the total FDI received by DGCs. This was 8.3% in 2007, below the average for 2001-2005 (9.4%) and well below the 17.7% average for the second half of the 1990s.
The momentum of investments cooled a little in the first half of 2008,46 when was 13.2% down on the same period for 2007. This was already a clear knock-on effect of the financial crisis in the USA, which began in the middle of the previous year, but worsened throughout 2008. Even so, the US$19.3 billion were quite important and point to still quite a solid result for the 2008 total.
It is worth remembering that Brazil’s larger size, besides generating large trade flows, makes it the top recipient of foreign investment in MERCOSUR. In 2007, for example, it received US$34.6 billion, a share of 83.2% of MERCOSUR’s total recorded income.
This amount broke the previous record of US$32.8 billion in 2000 (Graph 21). In fact, virtually the whole increase of the investments in MERCOSUR between 2006 and 2007 must be attributed to Brazil, as the flows to Argentina showed modest growth (just 13.4%) and grew 7.4% to Paraguay, whereas Uruguay recorded a drop of 29.6%. Since 2000, Brazil has been the recipient of at least 75% of investment in the bloc.
GrAph 21FOREIGN INVESTMENT IN BRAZIL AND ARGENTINA
1994-FIRST HALF OF 2008(US$Billions)
1994
1995
1996
1997
1998
1999
2000
2001
2002
2003
2004
2005
2006
2007
2007
a/
2008
a/
363330272421181512
9630
Brazil Argentina
Note:a/Firsthalf.
Sources:INDEC(Argentina)andBCB(Brazil).
46 DataonlyreferringtoArgentina,Brazil,andUruguay.

61
Despite showing lower amounts, the investments received by Argentina also evolved favorably in the recent period, in excess of US$5 billion per year between 2005 and 2007. This represents a remarkable recovery given the rather low levels seen between 2001 and 2003. Nevertheless, Argentina is still a long way from recovering the volume of investments received in the second half of the 1990s (which averaged US$10.5 billion) due to privatizations of public sector companies: these were a record US$24 billion in 1999 after the sale of YPF to Repsol.
A similar situation applies in Paraguay (Graph 22), which received investments of almost US$200 million per year in 2006 and 2007, well up on the practically insignificant levels of 2002-2005, but still well below the record US$342 million that came in in 1998. Uruguay, on the other hand, received unprecedented volumes of investments (around US$1 billion, almost 6.5% of GDP) in the three years 2005-2007, in sharp contrast to the average of just US$226 million in 1994-2004.
GrAph 22FOREIGN INVESTMENT IN pARAGUAY AND URUGUAY
1994-FIRST HALF OF 2008(US$Billions)
Paraguay Uruguay
1994
1995
1996
1997
1998
1999
2000
2001
2002
2003
2004
2005
2006
2007
2007
a/
2008
a/
1.61.51.41.31.21.11.00.90.80.70.60.50.40.30.20.10.0
Note:a/Firsthalf.
Sources:BCP(Paraguay),andBCU(Uruguay).
Brazilian investments in MERCOSUR
One of the characteristics of the evolution of Brazilian external accounts in recent years, especially since 2004, is the sharp growth in foreign direct investment beyond its borders. In 2007, Brazil invested a total of US$7.1 billion in other countries, a figure that, while below that of 2006 (US$28.2 billion, inflated by a single operation, namely, the purchase of the Canadian company, INCO, by VALE) is well above the annual average for investments between 1998 and 2003 of just US$1.2 billion.
62
It is common knowledge that much of this investment targeted South American countries, but the statistical data gathered by the Central Bank of Brazil do not enable an adequate calculation, as much Brazilian investment passes first through countries that offer fiscal advantages, or tax havens, and only then reaches its true destination. Indeed, in 2006, this type of countries accounted for almost two thirds of the total stock of FDI by Brazilian companies. In contrast, Argentina, Paraguay, and Uruguay together represented just 4% of the total.
However, reality shows that there is a high number of Brazilian companies making investments in MERCOSUR, especially Argentina, among which are large companies like Petrobras (petroleum and energy), Camargo Correa (mining and construction), Ambev (beverages), Gerdau (iron and steel), Coteminas (textiles), the meat processing plants JBS-Friboi and Marfrig, as well as a significant number of medium companies. In fact, Brazilian companies’ share in the Argentine economy is not a recent phenomenon. A study performed by the Buenos Aires Studies Center (CEB) in 200547 shows that there were 53 Brazilian companies operating in Argentina at the time, and more than half had started operations in the country in the 1980s and 1990s. However, in terms of the investment volumes, over half came from companies entering the country between 2002 and 2005.
The creation of MERCOSUR in 1991 fuelled Brazilian investments in Argentina, which grew significantly between 1994 and 1997, accompanying the rapid expansion of the Argentine economy and the growth of bilateral trade. During the most critical years of the convertibility regime in Argentina (1998-2000), there were net outflows of Brazilian capital. But in 2002, when the country was submerged in a deep recession, Brazilian investment made a spectacular leap as a result of acquisitions by Petrobras (the largest Brazilian investment made in Argentina to date) and by other companies taking advantage of the fall in prices of Argentine assets.
Graph 23 shows that, in 2002, Brazil was responsible for almost half of all foreign investment received by Argentina, with flows of approximately US$1 billion. This performance, however, became even more favorable from 2005. Although this is not official data but information based on investments announced by the companies,48 Brazilian investments in Argentina grew to levels close to US$2 billion p.a., somewhere between 30% and 40% of all foreign investment received by the country.
In Paraguay, Brazil has traditionally played an important role as an investor. Of the total stock of investments received by Paraguay up to 2007 (US$1.8 billion), Brazil is responsible for 11.8%, just behind the USA. Brazilian investments grew still further in recent years: in 2005-2007, the country was responsible for 22.4% of all foreign investments received by Paraguay (US$67 million).
In Uruguay, unlike the other MERCOSUR partners, Brazilian investments have not been very significant. In 2004-2006, Brazil’s share in total investments received by Uruguay was only 3.3% (US$88.6 million). However, the figures for 2007 should be much more favorable, bearing in mind the three major operations announced over the year: the acquisition of Saman by Camil Alimentos, with an estimated investment of US$160 million, and the purchase of two Uruguayan meat processing plants by Marfrig, which is committing resources of around US$120 million.
47 CitedinIglesias,R.[2007].48 SystematicallyobtainedbytheCenterforProductionStudies(CEP)ofArgentina’sEconomyMinistry.

63
GrAph 23TOTAL FOREIGN INVESTMENT IN ARGENTINA BY ORIGIN
(US$Billions)
Total Origin Brazil
6
5
4
3
2
1
0
2 0 0 1 2 0 0 2 2 0 0 3 2 0 0 4 2 0 0 5 a / 2 0 0 6 a / 2 0 0 7 a /
Note:a/Datarelativetoinvestmentsannouncedbybusinesses.
Source:MinistryofEconomyofArgentina.


65
cHAPTER 3. THE INTERNAL AGENdA
This chapter is a record of the evolution of the main issues on MERCOSUR’s internal agenda between July 2007 and July 2008. In this period, the Pro Tempore Presidency (PPT) was first held by Uruguay (second half of 2007), then Argentina (first half of 2008). This is relevant because, as holders of the PPT, countries reveal their preferences in defining priority matters and issues, despite having to uphold any decisions jointly adopted in the ambit of the CMC, as well as keeping in mind the deadlines set to enact previous decisions issuing from the supreme body of MERCOSUR.
During Uruguay’s PPT, emphasis was placed on the implementation of the second stage of CMC Dec. 54/04, whose main objectives were to draw up the MERCOSUR Customs Code and define the customs revenue distribution mechanism. In spite of Uruguay’s efforts, neither of these objectives were achieved, a frustration repeated during Argentina’s PPT. The present expectation is that Brazil, the country currently holding the MERCOSUR PPT, should succeed in overcoming the obstacles still blocking the final draft of the Customs Code and the definition of a consensus-based formula for distributing customs revenue. Progress on the CET and the Customs Code is described in Section C.
However, Argentina’s PPT did successfully define a Production Integration Program, an issue of particular interest to this country, since the strengthening of regional production chains has always been considered by Argentina as a crucial instrument in overcoming asymmetries in MERCOSUR. These questions are developed in Section D of this chapter.
Alongside these matters, the chapter describes various other issues that have shown some evolution over the period considered, e.g. the treatment of asymmetries (Section A), the implementation of projects with FOCEM resources (Section B), the installation of a mechanism to pay for trade transactions in local currency (Section E), and the evolution of the discussion about the criterion of civic representation in the MERCOSUR Parliament (Section F). Finally, Section G deals with Venezuela’s membership of MERCOSUR, the evolution of the institutional reform issue, and the approval of a biofuels plan.
A. The treatment of asymmetries
Background
The treatment of asymmetries was the subject of intense debate during Brazil’s PPT, in the second half of 2006, and during Paraguay’s in the first half of 2007. The documents describing the different approaches defended by the States Parties (SPs) were discussed in detail in MERCOSUR Report 12 and clearly illustrate each country’s different reading of the issue in light of their specific interests.
Paraguay is certainly the most active participant in the discussion of asymmetries. In this sense, it is necessary to remember that, based on a group of proposals submitted by the country in 2003 while it held the PPT, the issue was "installed" on the MERCOSUR agenda once and for all. On that occasion, Paraguay defended the principle of special and differential treatment for the smaller economies, invoking above all its condition as a land-locked country. As a result, Paraguay was granted differential treatment in negotiations with third countries (CMC Dec. 28/03), differential regional content in MERCOSUR’s origin regime, and, jointly with Uruguay, additional CET exception lists, as well as reduced aliquots for extrazone imports of capital goods, information technology and telecommunications goods, and various raw materials and

66
agricultural inputs. The most significant result in Paraguayan demand was, however, the formation at the end of 2006 of the MERCOSUR Structural Convergence Fund (FOCEM), to which the country contributes 1% of resources, but receives 48% of disbursements in exchange.
In September 2006, Paraguay submitted a document attached to the Minutes of the 65th GMC Meeting, through which it called for aggressive community policies to overcome asymmetries, based on four "pillars" or lines of action: (i) community policies to foster development; (ii) competitiveness support programs; (iii) access to regional and other world markets; and (iv) institutional design. This document, registered as "preliminary", is fairly generic in character.
Next, in May 2007, on the occasion of the 5th CMC Special Meeting in Asunción, Paraguay, it submitted a new, rather more detailed document to its partners, in which it explicitly states its approach in terms of the treatment of asymmetries.49
In this document, Paraguay defended transfer mechanisms as instruments that "must, par excellence, characterize the deep integration projects like MERCOSUR, in the ambit of which objectives and commitments are contemplated superior to any other kind of integration and where the countries decided to give up their national policies in favor of the community project". As a result, to overcome asymmetries, Paraguay suggests prioritizing two instruments in the short and medium term: the amplification and capitalization of the FOCEM, and the implementation of cooperation programs. In the long term, once these asymmetries have been eased or reduced, MERCOSUR should design strategic actions steered by supranational institutions.
It must be remembered that, with undeniable optimism, the first phase to reduce asymmetries is defined as a ten-year period (2008-2017) during which Paraguay should grow quickly, for which US$2.3 billion p.a. in additional investments must be made available. The second phase would extend from 2018 to 2025. Based on this approach, the Paraguayan document of May 2007 presents a wide group of actions falling within the framework of the four "pillars" previously defined in the document of September 2006.
In short, where asymmetries are concerned, Paraguay cites its condition as a land-locked country with lower per capita income in the members of MERCOSUR to call for special and differential treatment, flexibilities, and exceptions, as well as technical support and, mainly, a very significant extension of the transfer mechanism.
uruguay’s position is quite different. The country has a small economy, but with relatively high per capita income in comparison with the other partners. As a result, its criticisms of MERCOSUR center much less on the treatment of structural asymmetries and more on the bloc’s inability to move toward the formation of a genuine Customs Union and on the length of time it is taking to eliminate asymmetries arising from national policies that distort competition or limit access to intrazone markets. The currency of policy-derived asymmetries would be particularly harmful to Uruguay, whose main structural asymmetry lies in the limited size of its domestic market. Uruguay is, therefore, also calling for flexibility, but bases its argument on the failure of MERCOSUR to account for its own agenda, which produces an unbalanced distribution of the costs and benefits of regional integration, as well as damage for the smaller economies. The flexibilities called for to the benefit of the smaller economies are, therefore, considered fair and necessary compensation for the costs they incur by virtue of unresolved policy asymmetries.
49 MERCOSUR/VCMCExt./ID02/07."GuidelinestoovercomeasymmetriesinMERCOSUR",includedasAnnexIIIintheMinutes.

67
The Uruguayan stance was clearly expounded in the letter sent by President Tabaré Vázquez to President Lula da Silva in September 2006, and in two later documents distributed in October 2006 and May 2007.
In fact, the proposals included in President Vázquez’s letter leave no doubts about the Uruguayan demand, which calls for the effective compliance with objectives envisaged on the internal agenda. The proposals include: (a) moving forward in the objective of the free circulation of goods and in the establishment of a Customs Union as determined in CMC Dec. 54/04; (b) centering the objectives of the Customs Union on the elimination of technical and bureaucratic barriers to trade and on the adoption of mechanisms for greater macroeconomic coordination; and (c) acknowledging that the levels of the CET are inadequate and should be revised. Moreover, the concession of flexibilities on the external agenda, mainly "via the incorporation of bilateralities, be it in the framework of joint negotiations or allowing individual negotiations", would constitute countervailing demands.
In the document of October 2006, Uruguay reiterates its "highly critical" focus on the integration process by virtue of the failure to comply with key aspects of the internal agenda and insists on calling for flexibility in the negotiations with third countries in order to "allow the smaller partners to reduce the costs of the stagnation resulting from the failure to comply with other commitments".50
The document of May 2007 is also rather incisive and highlights the need to concentrate efforts "on the elimination of incentive policies that distort the conditions of competition, and [on] the harmonization of indirect taxes, a requirement for the effective free circulation of goods and services within the bloc".51
The document is particularly critical of proposals submitted by Argentina and Brazil at the MERCOSUR Trade Commission regarding "Disciplines for the application of intrazone incentives". It considers that the Argentine proposal is inadequate to solve the underlying problem caused by the impact of the concession of incentives on the steering of investment flows to the benefit of the larger economies. The Brazilian proposal, on the other hand, is criticized for proposing "no significant alteration to the prevailing situation". As a result, Uruguay is calling for countries to adopt a frank and realistic stance, and to explicitly state their restrictions in order to push forward in this matter.
Elsewhere the document states that "the provisional measures regarding exceptions to the CET and special import regimes have enabled Uruguay to reduce the costs associated with the full implementation of a CET that does not reflect the reality of domestic production structure". Nevertheless, the document stresses that special and differential treatment measures, and unilateral measures do not guarantee sustained growth, although they may contribute to solving specific relevant problems. In short, it can be said that Uruguay is defending the stance of effective compliance with the commitments adopted by MERCOSUR countries, rather than the granting of flexibilities or exceptions.
Argentina, as stressed in the previous Report, remained fairly inactive in the debate and only came out in favor in a document circulated in June 2007.52 This document criticizes the scant progress in regional policy coordination and states that the integration process concentrated almost exclusively on dismantling tariff barriers and establishing a common external tariff, placing less emphasis on production aspects. It
50 Minutesofthe65thGMCRegularMeeting(AnnexIV).51 MERCOSUR/VCMCExt./ID03/07."MeasurestoovercomeasymmetriesinMERCOSUR",includedasAnnexIVintheMinutes.52 MERCOSUR/LXVIIIGMC/WPNo.11/07."ProductionintegrationasanecessarytooltoovercomeasymmetriesinMERCOSUR",includedasAnnexXXIintheMinutes.

68
therefore insists on any future measures being geared toward providing incentives for MERCOSUR’s global production, increasing regional added value, and stimulating the steering of new investments toward the smaller economies.
The Argentine document quite emphatically states that the proposals that "induce higher levels of extrazone imports do not meet the above objective". It therefore recommends the adoption of policies based on "a greater degree of liaison between the countries’ production sectors, the balance of investment flows, the promotion and development of regional suppliers, and the deepening of integration of companies and sectors".
In short, the Argentine document emphasizes "production integration" based on the development of value chains. It is a document aimed at Brazil, the MERCOSUR country with most leadership capacity to structure regional production chains and the only member that has a large number of big companies already established in partners’ territory and potentially interested in developing regional suppliers.
In the issue of asymmetries, while Paraguay, Uruguay, and Argentina act as petitioners, Brazil is capable of selecting, filtering, and driving the initiatives it considers most realistic or least expensive in light of its own interests. In this sense, its leadership is purely reactive.
In December 2006, Brazil tabled two initiatives intended to ease asymmetries: the granting to Paraguay and Uruguay of more flexible treatment over origin, and anticipation of the elimination of double levying of the CET in those countries’ favor. Only the first of these proposals was endorsed in 2007, with the adoption of a de minimis approach of 10% in the bloc’s Origin Regime (CMC Dec. 16/07).
Evolution
The intense debate over the question of asymmetries seen between mid-2006 and mid-2007 during Brazil and Paraguay’s PPTs was not echoed to any significant extent during Uruguay’s PPT in the second half of 2007 or Argentina’s in the first half of 2008. Strictly speaking, during the exercise of their respective PPTs, both Uruguay and Argentina opted to give priority to their own particular approaches to the issue. Uruguay thus concentrated its efforts on attempting to meet the objectives laid down in CMC Dec. 54/04, aimed at providing incentives for the elimination of double levying of the CET and the adoption of a mechanism to distribute customs revenue, while Argentina opted to give real direction to its proposal to move forward in regional production integration.53
During Uruguay’s PPT, the initiatives regarding the "overcoming of asymmetries" were limited to the adoption of a CMC decision to set in train a proposal by the Paraguayan delegation to the GMC and the submission of an Economic and Social Consultative Forum (FCES) Recommendation to the 32nd Special GMC Meeting, held in Montevideo at the end of 2007.
CMC Dec. 57/07 simply extended the mandate granted to the High Level Group for the Elaboration of the Strategic Plan to Overcome Asymmetries in MERCOSUR (GANASIM) for it to carry out its work and set a deadline of late 2008 for the submission of a Strategic Plan. However, on Paraguay’s initiative, an express recommendation was made to the GANASIM toward "giving priority to the use of the FOCEM as community instrument for the funding of the identified projects".
53 TheseissuesaretackledelsewhereinthisReport.

69
In its turn, the Paraguayan proposal, which was not taken up, defended the creation of a new Program in the ambit of the FOCEM ("Program for the Development and Integration of Economies with no Maritime Coastline") and increased contributions to the FOCEM from the States Parties up to the equivalent of 0.05% of MERCOSUR GDP in 2006. In concrete terms, the Paraguayan proposal contemplated a timeline for rising contributions to the FOCEM, starting with a sum of US$76 million in 2009 and reaching US$607 million in 2016. Those resources would be exclusively destined for the new Program and distributed as follows: 70% for projects submitted by Paraguay and 10% for projects submitted by each of the remaining three MERCOSUR members.54
The main concern of the FCES Recommendation was to guarantee some participation and/or coordination with other MERCOSUR organizations, like the Consultative Forum of State and Provincial Governors and Mayors and the High Level Employment Group. In the first half of 2008, during Argentina’s PPT, the only reference to the issue is in the Minutes of the 71st GMC Regular Meeting, which record the results of the GANASIM meeting in April 2008. According to the Minutes, the States Parties’ delegations claimed to be in agreement that "the Strategic Plan shall focus first on specific actions with a direct effect on asymmetries, mainly through any cooperation mechanisms or funding identified" - precisely Paraguay’s demand, as explicitly stated in the May 2007 document.
b. The mERcoSuR Structural convergence fund (focEm)
Background
MERCOSUR Report 12 highlighted the efforts made in 2006 and the first half of 2007 both by the FOCEM’s Ad Hoc Group of Experts (GAHE-FOCEM) and the Presidency of the Commission of Permanent Representatives of MERCOSUR (PCRPM) and the MERCOSUR Secretariat (SM) to speed up the full operation of the FOCEM.
First, through the CRPM, negotiations were held for the speedy incorporation in the States Parties’ legal systems of the CMC decisions providing for the creation of the FOCEM (CMC Dec. 18/05) and instituting its Regulations (CMC Dec. 25/05). Both decisions came into force in December 2006 and in August 2007, respectively.
Second, in late 2006, at the 31st CMC Meeting in Brasilia, the FOCEM’s first budget was approved, consisting of the total endowments foreseen for 2006 (US$50 million) and 2007 (US$75 million).
Third, immediately after the FOCEM’s Regulations were approved, the selection began of technicians to form its Technical Unit in the ambit of the MERCOSUR Secretariat. TU-FOCEM effectively began to operate in September 2007, initially with four senior technicians, one from each State Party. Later on a further four assistant technicians were taken on.
In September 2007, after the TU had just begun to operate, the CMC had already approved 15 projects, which illustrates the high priority MERCOSUR members gave the FOCEM.
54 MERCOSUR/LXXGMC/WP15/07.

70
Evolution
During Uruguay’s PPT, there was intense activity in the TU/MS, mainly in organizational and functional matters. The main initiatives were:
a) The distribution of tasks among the team members;
b) The organization of bank accounts with the resources contributed by member countries; and
c) The documentary, legislative, and regulatory analysis of the FOCEM.
In addition, the methodological bases for project evaluation were designed, a task in which the TU had the support of the FOCEM Ad Hoc Group of Experts. The procedures were also adopted for disbursements to begin in projects already approved, and last, the TU began to play an active party in the technical and financial evaluation of new project proposals.
In their turn, the MERCOSUR Secretariat and the CRPM worked on drawing up and signing the MERCOSUR Structural Convergence Fund Agreements (COF), legal instruments whose purpose it is to regulate compliance with approved projects. By the end of 2007, 13 agreements had been signed.
The CPRM also drew up a draft decision to be submitted to the CMC at the end of 2007, authorizing the SM Director to hold the FOCEM’s resources in accounts that could give interest, with liquidity guarantees and deposit security. It was established that interest accrued in one year would be added to the FOCEM’s budget the following year.
In the meeting in Montevideo in December 2007, the Presidents’ Communiqué stated that, to date, 18 projects had been approved. The total number of projects was US$145.3 million, with FOCEM contributions of US$111.6 million.
In the following half, during Argentina’s PPT, the TU/MS drew up a FOCEM Visibility Application Guide, with the intention of guaranteeing an optimum project communication and visibility strategy. The introduction to the Guide highlights the importance of strengthening MERCOSUR’s identity and of disseminating the existence of the FOCEM, raising awareness and sensitizing the population in terms of the projects and their benefits, and guaranteeing transparency by informing people about the origin of the resources financing these projects. The Guide was approved at the 35th CMC Meeting in San Miguel de Tucumán (CMC Dec. 04/08).
The same Meeting approved the procedures to be adopted by the States Parties when publishing international tenders (CMC Dec. 05/08). The main objectives of the measure are to establish "mechanisms to guarantee the transparency and advertisement of the recruiting processes carried out in the framework of the projects approved for funding with FOCEM resources". Furthermore, the procedures approved ensure that States Parties "have access to the necessary information for those interested to be able to participate in the bidding process on an equal footing".
At the end of Argentina’s PPT, a further five projects were approved, bringing the total of projects approved by the CMC by the end of June 2008 to 23. The projects totaled US$169.3 million, US$130 million of which was contributed by the FOCEM and the remaining US$39.3 by national counterparts. It is necessary to notice that the counterparts make up over 23%, in excess of the minimum 15% demanded.

71
Up to now, the main recipient of FOCEM resources has been Paraguay, which benefitted from 13 projects totaling US$134 million, or almost 80% of the resources approved.
Uruguay is second, with 6 projects totaling US$18.7 million, slightly over 11% of the total approved. Next comes a regional project to support the eradication of foot-and-mouth disease in the ambit of MERCOSUR, the MERCOSUR Foot-and-Mouth-Free Action Program (PAMA), which is slightly under 10% of the resources granted by the FOCEM. Last, the MERCOSUR Secretariat is handling the development of three projects totaling just US$170,000.
tABle 15SUMMARY OF FOCEM pROJECTS BY TARGET AND pROGRAM
(US$Millions)
Targetprogram I program II program II program IV Total
N° Value N° Value N° Value N° Value N° Value %
Paraguay 7 92.7 3 11.1 3 30.2 - - 13 134.0 79.2
Uruguay 2 12.3 1 1.5 3 4.9 - - 6 18.7 11.1
Regional - - 1 16.3 - - 1 16.3 9.6
SM - - - - - - 3 0.2 3 0.2 0.1
total 9 105.5 5 28.9 6 35.2 3 0.2 23 169.3 100.0
% 62.0 17.1 20.8 0.1 100.0
Source:TU/SM.
In terms of the distribution per program, Program I (Structural Convergence) absorbed over 60% of resources and respected the priority that, during the first four years, the FOCEM’s operation should be granted to projects designed to develop the smaller economies and less favored regions, the main reason for the Fund’s creation (see Articles 12 and 13 of CMC Dec. 18/05).
On the other hand, Program II (Competitiveness Development) and Program III (Social Cohesion) enjoyed 17.1% and 20.8% of approved resources respectively. Last, Program IV (Strengthening of the Institutional Framework and the Integration Process), the execution of which is the job of the MERCOSUR Secretariat, was granted just 0.1% of resources, below the maximum set for this Program (0.5%) in the FOCEM’s first four years.
Some brief remarks on the three projects of Program IV are relevant. First is the notable project "Identification of Structural Convergence Needs in MERCOSUR", which aims to make a report of the basic needs in the States Parties in the areas of highway infrastructure, construction, modal and multimodal transport road modernization and recovery, which promote physical integration among the members of MERCOSUR. Ideally, the project, approved on the initiative of the Argentine representation, will serve as a basis for each State Party (SP) to identify priority projects to be financed by the FOCEM in the future.
The second project, the "MERCOSUR Jurisprudence Database", aims to computerize, systematize, and enable free access to the MERCOSUR Secretariat database, which contains the jurisprudence of the States Parties’ national courts relating to MERCOSUR law. Last, the third project, the "Common External Tariff

72
Information System", similar in format to the previous project, is intended to systematize all the information relating to the CET and the Common Tariff Policy, and to enable free access to this information in the future via the Secretariat’s web page.
An examination of the disbursements made to date (see Table 16) is less auspicious: resources for 11 projects were partial or totally disbursed, but the total amount available corresponds to just 4.8% of the total value of the projects approved.
A preliminary balance of the FOCEM should highlight the following:
• The instrument is a reality and constitutes a benchmark for various MERCOSUR initiatives, so much so that there are numerous suggestions for expanding its resources or creating new subprograms in order to fund a wide variety of proposals.
• In the last year, there was a clear effort to speed up the institutionalization of the instrument by completing the Regulations and drawing up guidelines and operational manuals.
• The deadlines for project evaluation and approval seem satisfactory, and the administrative costs are low.
• There is a concern about transparency and about avoiding the "natural" propensity to the clientelistic use of resources.
• However, most projects are small in scale, which may lessen the instrument’s effectiveness and impact. One exception is the "Uruguay-Brazil 500MW Electrical Interconnection Project", with a value of approximately US$93 million, submitted by Uruguay and already receiving a favorable report from the CRPM. The project is currently undergoing technical analysis in the TU/MS.
• The pace of disbursements is slow, but the process of institutional construction needed for the effective operation of the projects in less developed countries is likely to be one of the causes behind sluggishness.
• Last, the amount of FOCEM’s resources seems small when compared to similar instruments. It is worth remembering, however, that the resources are not irrelevant in the case of Paraguay. Furthermore, apparently, it is not resources that are currently in short supply, but projects.

73
tAB
le 1
6SU
MM
ARY
OF
pRO
JEC
TS A
ppR
OVE
D T
O 0
6-30
-200
8
Nº
Cou
ntry
Des
crip
tion
prog
ram
Tota
l pro
ject
Va
lue
(US$
M
illio
ns)
Tota
l FO
CEM
In
vest
men
t (U
S$
Mill
ions
)
CM
C A
ppro
val
Dis
burs
emen
ts
to 0
7-31
-08
(U
S$ M
illio
ns)
Dec
. Nº
Dat
e
1Paraguay
ME
RC
OS
UR
- H
abita
t.SocialPromotionandstrengtheningof
humancapitalinpoorfamilysettlements
III12.915
7.500
8/07
01-18-07
3.505
2Paraguay
ME
RC
OS
UR
- R
oga.Housingandinfrastructureconstruction
inareasofextremepoverty
III9.706
7.500
8/07
01-18-07
0
3Paraguay
GreatAsunción:Sliproadsandringroad
I14.860
12.631
8/07
01-18-07
0
4Paraguay
Integralsupportform
icroenterprises
II5.000
4.250
8/07
01-18-07
0.425
5Paraguay
Installationofbiosecuritylaboratoryandinfrastructureforfood
checklaboratory
II4.800
4.080
8/07
01-18-07
0.047
6Paraguay
Renovationofroadways
I16.990
14.442
11/07
05-22-07
0
7Regional
ActionProgram
Afoot-and-mouth-freeMERCOSUR(P
AMA)
II16.340
13.889
8/07
01-18-07
2.395
8Uruguay
Route26MeloStretch.SarandídeBarcelóRiver
I7.929
5.310
8/07
01-18-07
0.508
9Uruguay
Technologicaldevelopmentandtraininginthesoftw
are,
biotechnology,andelectronicssectors
II1.500
1.275
8/07
01-18-07
0.701
10Uruguay
Strengtheningoflocalcom
munitiesinborderregions
III1.647
1.400
8/07
01-18-07
0.140
11Uruguay
Trainingofinformalmanpowerforurbanwasteclassification
III1.882
1.600
11/07
05-22-07
0.220
12Uruguay
Interventionsinborderregionsettlem
ents
III1.412
1.200
11/07
05-22-07
0.035
13Uruguay
Route12-R
oute54-Route55Connection
I4.371
2.928
23/07
06-28-07
0
14SM
CETinformationsystem
IV0.050
0.050
8/07
01-18-07
0.050
15SM
Jurisprudencedatabase
IV0.050
0.050
8/07
01-18-07
0.050
16SM
IdentificationofbasiclacksandneedsinSPstosteerstructural
convergenceactions
IV0.071
0.071
39/07
10-25-07
0
17Paraguay
Drinkingwaterandbasicsanitationsystem
inruraland
indigenouscom
munities
I39.471
28.516
47/07
12-17-07
0

74
tAB
le 1
6 (C
on
tin
ued
)
Nº
Cou
ntry
Des
crip
tion
prog
ram
Tota
l pro
ject
Va
lue
(US$
M
illio
ns)
Tota
l FO
CEM
In
vest
men
t (U
S$
Mill
ions
)
CM
C A
ppro
val
Dis
burs
emen
ts
to 0
7-31
-08
(U
S$ M
illio
ns)
Dec
. Nº
Dat
e
18Paraguay
SurfacingRoute8,S
anSalvador-RojasPotreroBranchRoad
I6.345
4.903
48/07
12-17-07
0
19Paraguay
DevelopmentoftouristproductsintheIguazú-Misiones
integratedcircuit
II1.303
0.992
7/08
06-30-08
0
20Paraguay
SurfacingRoutes6and7,PresidenteFranco-Cedrales
RegionalIntegrationCorridor
I5.847
4.517
8/08
06-30-08
0
21Paraguay
SurfacingRoute2feedersections(Itacurubi-Valenzuela-
Caballero)
I5.187
4.008
9/08
06-30-08
0
22Paraguay
ResurfacingRoutes1andGranerosdelSur
I4.004
3.093
10/08
06-30-08
0
23Paraguay
ME
RC
OS
UR
Ypo
rã.A
ccesstodrinkingwaterandbasic
sanitationinregionsofpovertyandextremepoverty
III7.589
5.835
11/08
06-30-08
0
tota
l16
9.26
613
0.04
08.
076
Source:TU-FOCEM/SM.

75
c. The common External Tariff
This section sets out various issues to do with the Common External Tariff (CET): the problems to do with double levying of the tariff, special import regimes, exception lists, non-objections in footwear introduced to the CET, textiles and fashions, and the rules in force in capital goods and information technology and telecommunications equipment.
Elimination of double levying of the CET and distribution of customs revenue
- Background -
Since the establishment of the Common External Tariff in 1994, the question of the modification of rules for the circulation of goods has become a permanent fixture in MERCOSUR, in order eliminate the "problem of double levying of the CET" within the territory of the Customs Union.55 The treatment of the issue only began to make progress as of 2000, when the CMC allocated analysis of it to the CCM, as well as the related problem of defining a mechanism for the distribution of any customs revenue affected by modifications to the circulation rules.
The first substantive advance came in 2004 with the approval of CMC Dec. 54/04, which set the guidelines for the transition to full operation of the Customs Union. This decision established the principle that imported extrazone goods complying with the Common Tariff Policy (PAC) would receive treatment as original MERCOSUR goods, both in terms of their circulation in the States Parties’ territories and their incorporation in production processes. Furthermore, Article 2 of CMC Dec. 54/04 ruled that the goods for which the CET set a 0% aliquot, as well as extrazone goods with a 100% common preference, would receive treatment as original MERCOSUR goods as of January 1, 2006, it falling to the CCM to define a positive list before that date that included goods that met these criteria. It should be noted that, in both cases, the impact on the distribution of customs revenue is nil, considering that the measure affects imported extrazone goods that generate no revenue through import tax. However, the measure had strategic and policy importance, as it was in response to a demand by the EU and marked the start of the transition to full operation of the Customs Union.
Last, CMC Dec. 54/04 established the requirements to extend the free circulation rule to the other goods, aside from those contemplated in Article 2. Indeed, by virtue of Article 4, a deadline was set (2008) to execute the following requirements: (i) approval of the MERCOSUR Customs Code (CAM); (ii) online interconnection of the customs administration computer systems; and (iii) the definition of a mechanism for the distribution of customs revenue.
In December 2005, CMC Dec. 37/05 regulated CMC Dec. 54/04 and included three annexes: (i) Annex I listing the goods whose CET was 0% in all States Parties; (ii) Annex II listing the goods the four countries granted a simultaneous 100% tariff preference and governed by the same origin requirement (therefore excluding those governed by temporary quotas or origin requirements); (iii) Annex III listing the goods from Annexes I and II that were subject to some trade defense measure (antidumping right, countervailing duty, or safeguard measures) in one or other of the States Parties.
55 Importedextrazoneproductsshouldbeable tocirculate freely inMERCOSUR,oncepaymentof theCEThasbeenmadeattheentrypointtotheCustomsUnion.Butthisdoesnotoccur,asmanyextrazoneproductsaresubjecttodoubleCETlevyingwhenexportedfromoneMERCOSURcountrytoanother.

76
Under CMC Dec. 37/05, goods included in Annex I and II would receive treatment as original MERCOSUR goods, excluding those in Annex III. This, in short, was how the "scope" of CMC Dec. 54/04 was defined.
Other chapters of CMC Dec. 35/05 defined: (i) customs procedures, mainly the characteristics and rules for the issuing of the Certificate of Common Tariff Policy Compliance (CCPAC) and the Certificate of MERCOSUR Origin Regime Compliance (CCROM); (ii) the establishment of complementary rules relating to the origin regime; (iii) information exchange between customs houses; and (iv) general provisions determining, among other things, the follow-up on the impact of regulations on trade flows, a responsibility attributed to the CCM.
CMC Dec. 37/05 initiates the "second compliance stage of CMC Dec. 54/04", regarding compliance with the three requirements above. Where the drafting of the Customs Code is concerned, an Ad Hoc Group was set up in 2006 to submit a consensus-based text to the GMC as early as the first half of 2006. This deadline was later extended until the first GMC Meeting in the second half of 2007 (CMC Dec. 15/07). In terms of the definition of mechanism for customs revenue distribution, a special group was set up in the ambit of the CCM.
- Evolution -
Of the three requirements laid down by CMC Dec. 54/04, the one that made most rapid progress during Uruguay and Argentina’s PPTs, i.e. between mid-2007 and mid-2008, was that related to the online interconnection of the States Parties customs houses. Indeed, in 2008, CMC Dec. 01/08, intended to detail the technical specifications of the computer infrastructure for the Customs Register Information Exchange (INDIRA) System, stated that the System "is under way and available in all four States Parties". Also, CMC Dec. 02/08 was approved in Tucumán, laying out the procedures to resolve technical differences in customs valuation in MERCOSUR.
In terms of the Customs Code and the definition of the mechanisms of customs revenue distribution, progress was not very satisfactory. In fact, where the CAM is concerned, the report of Uruguay’s PPT in late 2007 bears witness to six meetings of the Ad Hoc Group and a further two meetings of the Acting National Coordinators, without completing the final draft of the Code within the specified deadline. As a result, CMC Dec. 55/07 again extended the deadline and ruled that the CAM should be concluded in May 2008 for approval at the first CMC Regular Meeting the same year.
In Tucumán, however, the report of Argentina’s PPT admitted that the four meetings of the Ad Hoc Group went not enough to reach a final draft of the Code. However, it concluded on an optimistic note, estimating that the progress achieved enabled a "glimpse of the completion of the work by late 2008".
In terms of the customs revenue distribution mechanism, Argentina’s PPT stated that the formula to be adopted should reflect intrazone circulation, and implicitly enshrine the principle of fiscal neutrality. In accordance with Argentina’s PPT, there was also consensus over two issues to be dealt with by the rules defining the mechanism. These issues are: (i) the scope; (ii) the amount to be distributed; (iii) the distribution formula; (iv) the creation of a clearance fund to account for the modifications in the circulation of goods; (v) the definition of an organization for administration and control, and (vi) the definition of customs and origin procedures.
The confidential nature of most of the documents related to the drafting of the CAM prevents inferences being drawn about the effective progress made since mid-2006, when the GMC approved Res. 40/06.

77
It is worth remembering that, on that occasion, significant guidelines were defined to be followed in drafting CAM. These included:
• Taxable event:56 Imports or exports for consumption will be the taxable event. This is the effective definition in Argentina’s customs code, but not in Brazil’s, for which the taxable event is the movement of merchandise across the border.
• The scope of the Customs Code: The CAM will be a "framework" code, i.e. the code will leave some matters pending definition. These will be tackled in the future, when a definitive code customs is established, an aspect that has earned criticism from the private sector.
• The spatial ambit of application of the CAM: Customs legislation will be applied throughout the territory of the States Parties and in any enclaves granted to them. The concept of "enclave" was defined as "that part of the customs territory of a State that is not a member of MERCOSUR, where the application of MERCOSUR customs legislation is permitted".
• Customs territory: This was defined as that part of the spatial ambit in which a single tariff regime and economic restrictions on imports and exports of this regime will be applied. Excluded from the customs territory were free zones and "exclaves", i.e. that part of the States Parties’ territory where the application of a third state’s customs legislation is permitted by virtue of some international agreement.
• Customs infractions, financial sanctions, prescription of actions to call for payment of tax credits: By virtue of the asymmetries existing in national legislations, these aspects will not be regulated by the CAM, not at this first stage, at least. It must be stressed, however, that even in the EU some of these aspects have remained under the umbrella of national legislations.
• Territorial waters: It was agreed that the CAM will provide for a special customs regime for the treatment of the entry, storage, and exit of goods in territorial waters "keeping in mind each State Party’s effective legislation".
• Customs deposits: It was agreed that the different modalities in force regarding Customs Deposits will "take into particular account the characteristics of port, airport, and/or land legislations in each of the States Parties".
After the approval of Res. 40/06, national negotiators stated, with a degree of optimism that over 80% of the CAM had already been agreed. Two years later, however, in Tucumán, negotiators declared that there were still obstacles to be overcome in at least three areas: (i) the precise delimitation of the MERCOSUR customs territory; (ii) the definition of the special customs areas (including the territorial waters); and (iii) the issue of export duties.
The confidential character of the documents related to the CAM prevents a more precise evaluation of the obstacles in the way of the final draft of the rule. Nevertheless, in terms of export duties, national negotiators
56 The"taxableevent"isthesituationthat,bylaw,justifiesthelevyingoftax.

78
made explicit the points of divergence in Tucumán. Indeed, according to the declaration of the Argentine representative reported in the press, the draft of the CAM provided for three alternatives: (a) not including export duties in the code; (b) determining that such duties be defined at community level; or (c) permitting each country to establish its export duties. The Argentine representative declared that his country was in favor of the latter alternative. Uruguay, on the other hand, stated its preference for export duties to be subject to CMC approval. Hence the deadlock.
It was also revealed in Tucumán that there was consensus for the creation of an "Authorized Economic Operator" (AEO), which would have a preferential channel for border traffic in goods.
Where the customs revenue distribution mechanism is concerned, all that is known is that rehearsals were performed based on alternative formulas and that Paraguay opposes the main resistances.
Special Import regimes
- Background -
In December 2000, the States Parties undertook to totally eliminate any unilaterally adopted special import regimes "that imply the total or partial suspension of customs duties that tax the temporary or definitive importation of merchandise and that does not aim at the improvement and subsequent reexportation of the resulting merchandise to third countries" (Article 1 of CMC Dec. 69/00) as of January 1, 2006. Special Customs Areas (free zones), which are governed by other provisions, were excepted from this regulatory framework.
CMC Dec. 33/05 extended the deadline to January 1, 2008, and CMC Dec. 14/07 extended it to December 31, the same year. Worthy of note is the fact that CMC Dec. 02/06 had already previously defined the sectors of interest for which the CCM had to negotiate the relevant common regimes. These sectors were: (i) goods making up investment projects; (ii) goods for scientific and technological research; (iii) goods for the naval industry; (iv) goods for the aeronautical industry; (v) goods for education; (vi) goods for health; and (vii) goods subject to transborder land trade.
- Evolution -
During Uruguay and Argentina’s PPT, the CCM held ten meetings. The minutes of this entity periodically report on the progress in the negotiation of common import regimes, including the following circulating proposals:
• Brazil submitted a proposal for a common regime of goods for scientific and technological research, which already received observations and comments from the other countries’ representatives.
• Argentina submitted an initial proposal for a common import regime of goods making up investment projects and already drew up a revised draft that takes into account partners’ various observations.
• The import regime of goods for the naval industry merited proposals from almost all the countries. There were at least two meetings in which the private sectors of the member countries took part and progress was promising.

79
• Brazil distributed a proposal for a common regime of goods for the aeronautical industry, which was received with interest by the other countries. Brazil is promoting a meeting with the participation of EMBRAER.
• The CCM minutes do not mention proposals for the areas of health and education, but Brazil already communicated that it will shortly submit proposals for both sectors.
• There are no proposals tabled for goods subject to transborder land trade. As a result, the countries decided to take the works of the Ad Hoc Transborder Integration Group as a precedent.
In short, except in the case of the common regime of goods for the naval industry, it is possible to infer that the negotiation of special import regimes will demand yet another extension of the deadline.
Exception lists for the Common External Tariff
The exception lists for the CET continue to be postponed. In late 2007, the CMC established new deadlines and limits for lists whose timelines were effective until the end of 2008 (CMC Dec. 38/05). Indeed, CMC Dec. 59/07 set new deadlines, stipulating that the lists of Argentina and Brazil may contain at most:
* 100 items from the MERCOSUR Common Nomenclature (NCM) up to 01.31.2009;
* 93 items from the NCM between 02.01.2009 and 01.31.2010;
* 80 items from the NCM between 02.01.2010 and the 07.31.2010;
* 50 items from the NCM between 08.01.2010 and the 12.31.2010;
On the other hand, in line with the provisions of the same decision, Uruguay and Paraguay may keep 100 headings form the NCM up to December 31, 2015. It must also be stressed that the States Parties are authorized to alter up to 20% of the NCM positions included in the lists every six months.
It has to be remembered that Articles 2 and 3 of CMC Dec. 31/03 are still in force. The first of these authorizes Paraguay to include up to 150 additional items on its exception list, while Uruguay is authorized to include 125 additional items. In both cases, the deadlines for these additional exceptions extend to 2010. Article 3, in turn, keeps Paraguay’s 399 exceptions to the CET foreseen in Article 4 of CMC Dec. 07/94 until 2010.
Modification to the CET for footwear, textiles, and fashions
MERCOSUR Report 12 recounted Brazil’s negotiations with its partners to analyze the possibility of promoting an increase in the CET for a relatively high number of products included in the textiles, fashions, and footwear sectors, in order to contain the advance of imports of these goods.
The partners accepted the Brazilian initiative and, as a result, the CMC set new levels for the CET in various products from those sectors (CMC Dec. 37/07) as of November 30, 2007. The new levels were set at 26%

80
for the textiles sector and at 35% for fashions and footwear, and will remain in force until the last CMC Regular Meeting in 2010, when the situation will be reevaluated depending on the evolution of trade flows.
In this period, under the provisions of the same CMC decision, "Paraguay and Uruguay will be able to maintain the levels of the national tariffs previously in force for products from the textiles and fashions sectors". Subsequently, CMC Dec. 27/08 extended the same treatment in favor of both countries to the footwear sector, although limited to just eight of the 29 tariff positions whose import aliquot had been previously increased.
Capital goods
- Background -
The rule in force for capital goods is CMC Dec. 34/03, agreed in December 2003. The rule stipulates the following:
• A Common Regime of Non-Produced Capital Goods providing for a wide list of such goods was established with an import aliquot fixed at 0% and coming into force as of January 1, 2006.
• It authorized the States Parties to uphold their capital goods import regimes up to the 12.31.2005 and included unilateral measures previously authorized by CMC Dec. 02/03, essentially a waiver authorizing the application of aliquots below the CET for the import of extrazone capital goods to Argentina, Paraguay, and Uruguay.
• It authorized Uruguay and Paraguay to apply a 2% aliquot for extrazone imports of capital goods up to 12.31.2010, excepting those included in the above list of the common regime, whose aliquot had been fixed at 0%.
However, at the end of 2005, CMC Dec. 40/05 delayed the entry into force of the common regime until 01.01.2009 and, as a result, authorized the States Parties to maintain their import regimes for capital goods (as well as the waiver) until December 31, 2008.57 This decision also ruled that as of January 1, 2011, the only imports that would enjoy the common regime would be new capital goods and their parts appearing on the Common List and having the code "BK" in the NCM. Last, the High Level Group to Examine the Consistency and Dispersion of the Current Structure of the Common External Tariff (GANAEC) was entrusted with drafting a proposal to revise the CET for Capital Goods that would be ready by December 31, 2006. The deadline granted to the GANAEC was extended to the end of 2006 and subsequently to December 2007 (CMC Dec. 34/06).
- Evolution -
Strictly speaking, the only substantive evolution in this area was, once again, the extension of the deadline granted to the GANAEC, "until the last GMC Meeting of the second half of 2008" (Article 1 of CMC Dec. 507/8).58
57 Non-applicationoftheCETforcapitalgoodsenablesArgentina,Paraguay,andUruguaytoapplylowerimporttariffsthanBrazil,theonlycountrythathastrulysignificantdomesticproductionincapitalgoods.58 ThesubmissionofaBrazilianproposaltitled"OperatingProceduresfortheCommonRegimefortheImportationofNon-ProducedCapitalGoodsinMERCOSUR"(XCIXCCM/WP04/08)atthe99thCCMMeetingshouldalsobementioned.

81
In May 2008, Argentina requested a further extension of the deadline to maintain its incentives for two more years and its application should meet with no opposition from the other governments. In that same month, however, the Brazilian and Argentine representatives of the capital goods sectors (ABIMAQ and ADIMRA) signed an engagement contract in order to outline a common incentive regime. The two countries’ representatives agreed over the advisability of developing a single entity to represent the MERCOSUR capital goods sector. To this end, representatives from the Paraguayan and Uruguayan capital goods sectors would also be invited. The following step would be the redesign of a common capital goods regime similar to the automotive regime, which would not only cover tariffs, but also the taxation system and credit incentives.
Nevertheless, the statements by the spokespeople of the sectoral entities are not totally consistent. The Argentine representative insisted on the importance of "there being no difference between opening a factory in Brazil or in Argentina", but questioned the harmonization of the incentives in the two countries, which, in Brazil’s case, includes the concession of incentives for the state governments. On the other hand, the spokesperson of the Brazilian entity highlighted the importance of technological innovation and suggested the need to promote exchange for the breakthroughs made in each country, as well as bringing new technologies from third countries that can be incorporated into local production to give greater competitiveness to the machinery and equipment manufactured in the region.59
Information technology and telecommunications goods
- Background -
The situation regarding information technology and telecommunications goods (ITTG) is quite similar to the one prevailing in capital goods.
At the end of 2003, CMC Dec. 33/03 stipulated the following:
• Instruct the CCM to negotiate a Common Information Technology and Telecommunications Goods Regime to be approved by the GMC by December 31, 2005.
• Before March 31, 2004, the States Parties should submit an ITTG list to the CCM, subject to quadripartite consultations, for which an aliquot of 0% could be applied up to December 31, 2005.
• Authorize Paraguay and Uruguay to apply an aliquot of 2% for extrazone ITTG imports up to December 31, 2010, with the exception of the tariff headings included in the previous list, whose aliquot, until the end of 2005, would be 0%.
At the end of 2005, the deadline for the CCM to negotiate a common regime was extended to December 31, 2006, and Paraguay and Uruguay’s authorizations to import ITTG with an aliquot of 2% were extended up to December 31, 2011. On the other hand, the GANAEC is responsible for drafting a proposal to revise the CET for ITTG before June 30, 2006. This is to come into force as of January 1, 2006, but that it would have a convergence timeline that should be implemented as July 1, 2007.
59 JornalValorEconômico[2008].

82
At the end of 2006, the GANAEC’s deadline was extended to December 2007. As a result, the deadline to initiate the convergence timeline (January 1, 2008) and the deadline for the full validity of the new CET for ITTG (January 1, 2010) were also extended. Until the convergence program starts up, the States Parties will be able to apply the 0% aliquot, subject to quadripartite consultations. Finally, Paraguay and Uruguay’s authorization (2% aliquot) was extended to December 31, 2012, (CMC Dec. 27/06).
- Evolution -
At the end of 2007, CMC Dec. 61/07 established a further extension of GANAEC’s deadline and introduced certain modifications with regard to the previous extension:
• GANAEC’s proposal regarding the revision of the CET will come into force for Argentina and Brazil as of January 1, 2011, and for Uruguay and Paraguay as of January 1, 2016.
• GANAEC’s proposal shall include a convergence timeline that will be applied for Argentina and Brazil as of January 1, 2009.
• The CCM has a deadline of September 30, 2008, to negotiate a Common ITTG Regime, to be approved by the GMC by December 31, 2008.
• The States Parties will therefore be able to apply an aliquot of 0% to ITTG up to December 31, 2008, while respecting the procedure for quadripartite consultations. The deadline for Uruguay and Paraguay, however, to apply the 0% aliquot is extended to December 31, 2015.
• Also, Paraguay and Uruguay will be able to apply a 2% aliquot to extrazone ITTG imports up to December 31, 2015, excepting those goods whose tariffs are 0% by virtue of the previous provision.
d. Initiatives in strengthening regional production integration
Background
After weathering the severe regional economic and financial crisis of 1999-2002, two diagnoses begin to prevail in MERCOSUR: first, the recognition of serious and deeply-rooted asymmetries between the partners, whose treatment could not forgo the adoption of policies and instruments similar in essence (albeit not in scale) to those adopted in other integration processes, mainly the European experience; second, the verification that more than a decade after the constitution of the bloc, the coordination of production among the partners’ economies was still fairly limited, which therefore required the adoption of public initiatives to strengthen regional production integration.
As described in the previous section, the issue of asymmetries was eventually formally incorporated in the bloc’s internal agenda in 2003 after the intensification of the statements by the smaller partners. But in

83
production integration, there was no truly significant evolution.60 The issue was cited recurrently, every time an increase in sectoral disputes between the two main MERCOSUR partners occurred. This was when the need to promote the formation of regional "value chains" became a commonplace.
The need to strengthen regional production integration is doggedly defended by Argentina. Even the mention of the production complementation agreements of the 1980s, central as they were to the Argentina-Brazil Integration and Economics Cooperation Program (PICE), is always present in local analyses that argue in favor of recovering that "foundational approach" and call for the issue to be reinstated on the bloc’s internal agenda. In any case, as mentioned earlier, progress in this matter has been extremely timid, partly due to the wide variety of initiatives proposed and to the diversity of official applications or forums where this question is raised. These two factors demonstrate the intrinsic difficulty of designing and executing public regional policies in this area.
In fact, in line with the content of the previous Report, the debate surrounding the strengthening of production integration has embraced questions as wide and complex as the stimulus to form regional production chains, the coordination of scientific and technological policies, the drawing-up of instruments to promote joint ventures among small and medium enterprises (SMEs), the promotion of cooperatives, the creation of regional funds to finance the production sector, and many others.
The same Report mentioned the following initiatives adopted between mid-2006 and mid-2007, during the PPT of Brazil and Paraguay:
* At the 30th CMC Meeting in July 2006, the MERCOSUR Secretariat received the request to design specific actions to coordinate production with the States Parties’ public and private sectors, including a development program for regional suppliers’ of Petrobras, a program to strengthen the automotive chain, and a program to create a business space to discuss the problem of production integration.
* At the end of 2006, in the framework of SGT 7 (Industry), Brazil submitted an Agenda Proposal for the MERCOSUR Development and Production Integration Plan comprising six lines of action: (i) a regional human resources training program; (ii) national and regional financial support for production integration; (iii) the coordination of trade facilitation measures; (iv) the coordination of various WGs and committees; (v) the coordination of national SME development policy, and (vi) the follow-up on the production process, including integration the homogenization of statistics and the development of indicators.
* In the first half of 2007, the MERCOSUR Film and Audiovisual Sector Competitiveness Forum (GMC Res. 24/07) was set up, which a similar initiative already in force in the timber and furniture sectors.
* By mid-2007, when the 32nd CMC Meeting was held in Asunción, the GMC was requested to draw up proposals to form a MERCOSUR Support Fund for SMEs committed to production integration initiatives.
60 AlthoughtheissueofproductionintegrationhasevolvedlittleontheMERCOSURagenda,theimportanceofcertainprocessesinduced by the constitution of the extended market is undeniable, among them being intrafirm trade (mainly between regionalsubsidiariesofmultinationals)andtheincreaseinintrazoneinvestmentflows.TherecentwaveofBrazilianinvestmentsintheregionisofparticularimportance.Bothcases,however,havetodowithbigcompanies.

84
This basically constitutes the limited progress in the issue of "production integration" up to July 2007, when Uruguay’s PPT began.
- Evolution -
Uruguay’s PPT, during the second half of 2007, gave little priority to the issue of production integration, to such an extent that the Presidency Report made barely any mention of the issue.
Nonetheless, the 34th CMC Meeting (December 2007) approved CMC Dec. 52/07 which set up the Ad Hoc Production Integration Group (GAHIP) on the basis of the proposal submitted by Argentina at the GMC. The GAHIP was given the job of drawing up a Production Integration Program that takes into account (a) the Guidelines for Production Integration submitted by Brazil in SGT 7 (Industry); (b) the Pilot Production Integration Projects identified in the studies directed by the MERCOSUR Secretariat; and (c) the works developed in the framework of the Timber and Furniture Competitiveness Forum, as well as potential initiatives submitted in the recently created MERCOSUR Film and Audiovisual Sector Competitiveness Forum.
Strictly speaking, throughout the second half of 2007, the main focus of activity regarding the issue of production integration centered on the CRPM, which organized a seminar and a cycle of workshops to deal with the issue. The reports of existing projects were discussed at these events, various financial entities were invited (CAF, FONPLATA, IDB, etc.) to relate their experiences in SME support, and a document was drawn up on the issue ("Contributions of the CPRM Presidency regarding the alternatives for the constitution of an SME Fund"). The report of the CRPM Presidency, submitted at the end of 2007, also mentions a project to set up a Permanent Observatory for Production Integration in MERCOSUR to identify opportunities for SMEs and collaborate in the design of policies public to promote and strengthen production integration.
In the first half of 2008, Argentina’s PPT chose production integration as the most important issue of its administration, an aspect underlined in the Presidency Report submitted at the 35th CMC Meeting, in June 2008 in San Miguel de Tucumán, Argentina.
Two decisions related to the issue of production integration were approved at that meeting:61
a) CMC Dec. 12/08 approving the MERCOSUR Production Integration Program and creating the Production Integration Group (GIP), and
b) CMC Dec. 13/08 setting up the MERCOSUR Support Fund for SMEs, whose first stage will implement a Guarantees System and set up an Ad Hoc Group to draw up a regulatory framework for this mechanism.
In addition, the Annexes of the Minutes to the 35th CMC Meeting record two preliminary proposals by Brazil for projects to be submitted to the FOCEM: the Program for Automotive Intensification and
61 ThereportbyArgentina’sPPT includedCMCDec.03/08 in the issueofproductive integration,whichapprovesaFrameworkProgramofScience,Technology,andProductionInnovation,discussedinanothersectionofthischapter.

85
Complementation in MERCOSUR and the MERCOSUR Program for Supplier Development for the Petroleum and Gas Sectors.62
Last, the CRPM Presidency Report also submitted in Tucumán carries out a further institutional proposal consisting of the creation of a "MERCOSUR Agency for the Promotion of Production Integration" (AMPIP) to promote policies and actions that encourage production complementation.
a) MERCOSUR Production Integration Program (PIPM) (CMC Dec. 12/08)
The MERCOSUR Production Integration Program seeks to embrace a wide and varied group of preexisting initiatives under one umbrella program.
The Program’s justification mentions that production integration in MERCOSUR currently encounters obstacles arising from differences of scale, asymmetries in technological development, as yet unharmonized national schemes, market failures, inadequacies in companies to tackle associative schemes, difficulties in access to funding, non-tariff border barriers, and so on. Consequently, it proposes sectoral intraindustrial cooperation as a key element in overcoming these obstacles.
The general Program’s objective, which makes room for no less than 17 specific objectives, is to "contribute to strengthening the production complementarity of MERCOSUR companies and, especially integration in the production chains of SMEs and companies from economically smaller countries in order to deepen the bloc’s integration process" (p. 2 of the PIPM).
Notable among the actions contemplated by the Program are seven lines of action at the horizontal level and two types of sectoral initiative. The lines of action at the horizontal level are clearly based on six actions described in the document duly submitted by Brazil in SGT 7 (Industry), plus institutional suggestions submitted by the CRPM Presidency along the following lines:
1. Cooperation between the national organizations/entities coordinating the instruments linked to the development of companies, in particular micro and SMEs to support the production integration process;
2. Complementation of instruments and national entities linked to research and development and technology transfer;
3. Regional Human Resources Production Integration Training Program;
4. Coordination with other instances of MERCOSUR, such as the FCES, the CRPM, the MERCOSUR Parliament, and the Consultative Forum of MERCOSUR Municipalities, Federated States, Provinces, and Departments (FCCR);
5. The creation of a Permanent Regional Observatory on Production Integration in MERCOSUR (ORPIP) whose structure and operating model will be defined by the GIP and approved by the
62 AnnexesXandXVoftheMinutes.

86
GMC. However, some of its functions are stated in advance: (a) setting up and maintaining a Geographical System of MERCOSUR Production Information; (b) designing and maintaining panels with production integration indicators and measurements; and (c) drawing up periodic reports on production integration;
6. Trade facilitation measures to eliminate obstacles (logistical flaws, border obstacles, the absence of technical standardization, etc.) that hold back the integration of production chains; and
7. Funding and cooperation (funding lines for intraregional investment in support of joint ventures, the installation of plants, or the expansion of investments already made).
In terms of actions at the sectoral level, the Program incorporates two initiatives already under way:
1. The MERCOSUR Production Chains Competitiveness Forums, including the already ongoing Timber and Furniture Competitiveness Forum, as well as the possibility of the GIP proposing the creation of further forums; and
2. The sectoral production integration initiatives, for which a methodology is defined that makes explicit the forms of representation and coordination for government representatives and production sectors involved in such initiatives. The initiatives under way are explicitly mentioned, that is: the Development Program for Suppliers of the Petroleum and Gas Sectors, the Executive Group for Automotive Chain Production Integration (GEIPA), the Tourist Routes Program, and the MERCOSUR Program for Business Coordination for Production Integration.
The Program concludes with the definition of the GIP’s tasks: coordinating, proposing new lines of action, drawing up reports, and even the analysis of the CRPM Presidency’s proposal on the possibility of creating a "MERCOSUR Production Integration Promotion Agency".
The main merit of the Program is to have gathered a high number of initiatives under the supervision of a single group, the GIP. It is worth point out, however, that the tasks allocated to the group are highly coordination-intensive. By way of example, there is the suggestion, included in the Program, to set up a regional network that links entities providing support for companies, mainly small and medium operating in Argentina (SIC, SAGYPA, SEPYME, and Pro-Argentina), Brazil (SEBRAE, ABDI, and SENAI), Paraguay (ONA, INTN, INAN, SENAVE, and SENACSA) and Uruguay (DNI and DINAPYME).
In terms of production integration initiatives, those centering on the automotive chain and the petroleum and gas sectors are certainly the most important (see Boxes E and F). In this sense, three aspects are worth highlighting: (a) the initiatives show a clear willingness on Brazil’s part to meet the demands of the other

87
members of the bloc; (b) the initiatives recognize that the participation of the private sector is absolutely indispensable and rate it as the main actor in the production integration process, and (c) the initiatives show a clear concern not to marginalize the smaller economies.
Box epROGRAM FOR AUTOMOTIVE INTENSIFICATION AND COMpLEMENTATION IN MERCOSUR
ThetentativeproposalfortheProgram for Automotive Intensification and Complementation in the Ambit of MERCOSURsubmitted to the FOCEM by Brazil in June 2008 during the 35th CMCSession in Tucumán,Argentina, with the backingof theBrazilianMinistryofDevelopment, Industry,andForeignTrade (MDIC), indicates theBrazilianAgency for IndustrialDevelopment(ABDI)astheexecutingorganizationandproposestheagency’spresident,Dr.ReginaldoArcuri,asresponsiblefor its implementation. To formalize it in the framework of the FOCEM the project is linked to Program II (Program ofCompetitivenessDevelopment)and,morespecifically,with thecomponent "Promotionofproductionchaindevelopment indynamicanddifferentiatedeconomicsectors".
TheproposedProgramwillberegionalinscope,viewingthefourMERCOSURmembercountriesasbeneficiaries.Nevertheless,theProgramdoesforeseethe"laterandprogressiveinsertionofVenezuela".TheProgram’scostsarecalculatedinprincipleatUS$3.5millionfortheactivitiestobedevelopedbetweenthesecondhalfof2008andtheendof2010.TheFOCEM’scontributionisestimatedatbetweenUS$1.6millionandUS$2million,i.e.46%and57%oftheproject’stotalcost.
TheProgramisgroundedintheimportanceoftheautomotivesectoranditsproductionchainintheindustryofMERCOSUR,thesizeoftheregionalmarket,andthecapacityoftheproductionsystemtobroadenitsconditionsofcompetitivenessagainstotherregionalblocs(EU,NAFTA,andAsia).TheBraziliangovernmentismentionedspecificallyastheauthoroftheinitiativeandtheindispensableparticipationoftheprivatesector isstressed(businessassociations,unionrepresentations,andcivilsocietyorganizations).
Theproject’s technical descriptionenvisages four themesor components: (i) institutional strengthening, (ii) thepromotionofcompetitiveness,(iii)informationsystemsfortradeintegration,and(iv)supportforinnovationandtechnologicaldevelopment.
In institutional development,theProgramproposesasthemainobjectivesconsolidationoftheExecutiveGroupforAutomotiveChainProductionIntegrationinMERCOSUR(GEIPA),thecomparativestudyofnationalindustrialpolicies,andtheholdingofaSeminar onMERCOSURAutomotivePolicies.TheGEIPA, "as its fundamental characteristics, will have consensus in the definitionof thecommonobjective, thepresenceofsignificant institutionsand leaderships in thenucleusofcoordination, thedefinitionofconcretetargets,thebuildingoftrustasabasisforgrowingcooperation,systematicprogressiononthebasisofanegotiatedagenda,andflexibilityintheformationofthematicsubgroups".
The development of local suppliers of the automotive chain will be the focus of the competitiveness component.Amongtheobjectives listedare the formationof technical teams formanufacturing, small-scalesupplier trainingviamanagerialandtechnologicaltraining,and,asamoregeneralobjective,thestrengtheningofsubregionalproductionagreements.
In relation to the development of information systems for trade integration, the objective is to give greater visibility tobusiness opportunities and provide local supplierswithmore possibilities to participate in regional purchasing of autopartsandsubsystems.Intheinstrumentalaspect,theimplementationhasbeenmentionedofatemporaryshowroomforautopartsmakers,theholdingofbusinesswheelsandtrademissions,andtheassemblyofaninformationsystemontradesupplyanddemand,technology,andinnovationintheambitofMERCOPARTS.IncreasingUruguayandParaguay’sshareintheautomotivechainismentionedasaspecificobjective.
Last,inthesupport for innovation and technological developmentcomponent,theobjectivesincludetheholdingoftrainingprogramsininnovationmanagement,thecoachingandtrainingoftechnicalteams,andtheintegrationofresearch,development,andengineeringactivitiesinvolvingassemblers,systemssuppliers,andautopartsmakers.

88
Box FMERCOSUR pROGRAM FOR SUppLIERS DEVELOpMENT
FOR THE pETROLEUM AND GAS SECTORS
As in thepreviouscase, the tentativeproposalof theMERCOSUR Program for Supplier Development for the Petroleum and Gas SectorswassubmittedbyBrazilinJune2008duringthe35thCMCMeetinginTucumán,Argentina.TheproposalwassentbytheBrazilianAgencyforIndustrialDevelopment(ABDI)andislinkedtovariouscomponentsintheFOCEM’sProgramII(ProgramofCompetitivenessDevelopment).
TheproposedProgramwillberegional inscopeandwillhavethefourMERCOSURmembercountriesasbeneficiaries.Theproposal states that Argentina, Paraguay, and Uruguay "will benefit from the four components of the project (competitiveintelligence; innovation and technology; information coordination and dissemination; management and competitiveness), while Brazilwill only benefit from the competitivenessmanagement component through the creation of a network of cooperation,learning, and compatibilization and harmonization of technical standards".
TheproposalsubmittedinTucumándoesnotdefinetheProgram’scosts.ItscentralactorisPetrobras,consideredthelargestanchorcompanyinMERCOSUR’spetroleumandgassectors,althoughitdoesnotexcludeparticipationbyotherlargecompaniesoperatinginthesector,suchasRepsol-YPF.Thedocumentdefinestheanchorcompanyas"a large company that utilizes a vast number of suppliers of goods and services with which it establishes a formal contractual relationship, but which also involves a process of exchange and learning that occurs in accordance with the positioning of the company and of a business attitude dedicatedtoimprovingtheeconomic,social,andenvironmentalscenarioinwhichitfindsitself".InthecaseofPetrobras,thecompanycurrentlyacquiresmostofitsinputsfromcompaniesestablishedinBrazil.Eveninthe18countriesinwhichitoperates,withthesoleexceptionoftheUSA,Petrobras"hastoimportthevastmajorityofthegoodsitutilizesortoacquirethemfromforeignsuppliersestablishedinitsplaceofoperation,duetothedifficultyoffindinglocalsuppliersthatmeettherequirementsdemanded by the sector".AsPetrobrasoperatesbothinArgentina,andinUruguayandParaguay,theobjectiveoftheProgramwouldbetoprivilegelocalsupplierswhowillneverthelesshavetomeettheinternationalrequirementsandstandards.
Theproposaldescribes thetypeofoperationofPetrobras ineachof theMERCOSURmembercountries.ThecompanyhasbeenoperatinginArgentinasince1993anditscurrentactivitiesspantheexploitationandproductionofpetroleumandnaturalgas,refiningandprosecution,thedistributionofderivatives,administrationofthepipelinenetwork,andpetrochemicalactivities.The company has a network of approximately 720 service stations and operates in all ofArgentina’s active petroleum andgasfields,aswellashavingexploratoryrightsin21blocsand25petroleumfields.PetrobrashasbeenoperatinginParaguaysince2006,whenitacquiredShell’sbusinessrelatedtofueloperations(retailandcommercialmarket).Theacquisitionincludedservicestations, thecommercializationofLPG,andofaviationproductsat theAsunciónandCiudaddelEsteairports.Last,PetrobrashasbeenoperatinginUruguaysincelate2004,distributingnaturalgaswithinthecountry.ThedistributorcontrolledbyPetrobras(DistribuidoraUruguayaConecta)hasexclusiverightsinthedistributionofnaturalgasbygaspipeline,LPG,andgasmanufacturedoutsidethecapital,Montevideo.
As already mentioned, the project’s technical description highlights four components. The first component, competitiveintelligence,aimstosurveycompaniesmakinguptheregionalpetroleumandgasproductionchainwithaviewto identifyingpotentialities,weaknesses,andbusinessopportunities.Indeed,thissurveillancewoulddetectcompaniesinterestedinbecomingsuppliersofthechain,identifyrealopportunities,verifythelevelofemployeetrainingandthemanagementaspectsofapplicantcompanies,aswellaslearningthemaindifficultiesfacedbytheanchorcompanies(PetrobrasandRepsol-YPFfromArgentina)intheacquisitionofgoodsandservices.Thesecondcomponent, innovation and technology,centersonthetrainingofsuppliers(permanentandstand-bystaff)intheareasofadministration,foreigntrade,anddevelopmentandinnovationsupport.Thethirdcomponent,coordination and dissemination of information,comprisesthemobilizationoftheanchorcompaniesintermsofgivingpreferenceandstimulatingtheacquisitionofgoodsandservicesfromnationalratherthanforeigncompanies.ThefourthandlastcomponentoftheProgram,competitiveness management,aimstostimulatesupplierorganizationstocreateformalchannelsofliaisonanddefinecriteriafortheinternationalcodificationoftechnicalstandards.
TheProgramstressesthatBrazilalreadyhashighly-developedknow-howintheimplementationofthesecomponents.Therefore,theproposalsuggestsreplicatingthemethodologyappliedinthiscountryintheprojectof"InternationalizationoftheProductionChainofPetroleum,Gas,andEnergy",asaresultofanagreementbetweenPetrobrasandtheBrazilianServiceofSupportforMicroandSmallEnterprises(SEBRAE).TwootherBrazilianprojectsarealsomentioned,whichmayservetoorientatetheProgram:(i)the"TradePromotionProgramforExportsinthePetroleumandGasSegment",jointlydevelopedbytheBrazilianTradeandInvestmentPromotionAgency(APEX)andtheNationalOrganizationofthePetroleumIndustry(ONIP),whichaimstoincreasetheexportcapacityofcompaniesinthesector;and(ii)the"MobilizationProgramfortheNationalPetroleumandNaturalGasIndustry"(PROMINP)whoseobjectiveisto increasetheparticipationofBrazilianindustry,onacompetitivebasis, intheimplementationofpetroleumandgasprojectsbothinBrazilandabroad.
89
b) Support Fund for Small and Medium Enterprises (SMEs) (CMC Dec. 13/08)
At the 33rd CMC Regular Meeting in Asunción at the end of the first half of 2007, the CMC decided to commission a proposal from the GMC with alternatives for the constitution of a MERCOSUR SME Support Fund (CMC Dec. 22/07).
In September 2007, the CRPM Presidency submitted a report at the GMC Meeting entitled "CRPM Presidency Contributions regarding the alternatives for the constitution of the SME Fund".
In this report, the CPRM related that it organized a workshop, which met on three occasions with the participation of members of the SGT 7 (Industry), representatives of the States Parties linked to organizations responsible for implementing public policies geared to SMEs and officials from various different national and regional financial institutions. The report set out the Fund’s objectives, instruments, and sources of finance. In terms of objectives, it stated that the central one must be the improvement of SMEs’ access conditions to regional and international markets, the promotion of investments to increase their competitiveness and enable the diversification of products and processes, and the development of innovations through associative strategies between companies.
In terms of funding, the report listed funding lines for projects with various different characteristics: support for the generation of regional value chains, insertion in third markets, joint purchasing of capital goods, quality certification, supplier development, etc.
In terms of the possible, but not exclusive, sources of financing, the report offered three options: (i) the States Parties’ budgetary resources, in order to set up a fund similar to the FOCEM, or of creating a subprogram within the FOCEM itself; (ii) the use of resources available in regional credit organizations, such as IDB, CAF, and FONPLATA; and (iii) the extension of credit lines by local public banks.
Finally, the CRPM President’s report recommended that the Fund begin to operate by implementing pilot projects.
In January 2008, the Brazilian government submitted its ideas and suggestions to the GMC "which may undergo modification as the debate on the issue deepens".63
If it is compared to the suggestions previously submitted by the PCRPM, the Brazilian proposal must be considered clearly "minimalist", as it only suggests setting up a Fund that will give guarantees to support accredited banks granting loans to Small and Medium Enterprises. The proposal leaves the credit analysis of beneficiaries up to the banks, as well as the decision on the use of the Fund. What is more, the guarantee will not be complete, but may represent a significant part of the funding. The proposed model suggests establishing a Management Council made up of representatives from the States Parties, preferably linked to public financial institutions or supportive of industry, as well as creating an administrative organization.
In Tucumán, CMC Dec. 13/08 supported the Brazilian proposal by opting for the creation of a Fund "that will implement a System of Guarantees in its first stage". Through this decision, an Ad Hoc Group is also created, which is to submit a draft Statute for the System of Guarantees before the CMC at its last regular meeting of 2008. Even so, the possibility of opting for other modes of funding for SMEs involved in production integration processes is not being discarded. Indeed, it will be the Ad Hoc Group’s job to go into the issue
63 LXXIGMC/ID02/08."PossibleideasforanoperatingmodeloftheMERCOSURFundforSmallandMediumEnterprises".

90
more deeply and submit a preliminary report to the GMC in the second half of 2008 in order to explore additional alternatives.
E. Local currency Payment System (SmL)
Background
The discussion about the use of local currencies in transactions between Argentina and Brazil began in 2005, after verification of the importance of bilateral international trade and empirical corroboration of the existence of transaction costs associated with operations that were effectively limiting small companies’ access to bilateral trade.
Indeed, commercial trading between the two main MERCOSUR partners represents on average 80% of intrazone trade, reaching US$24.8 billion in 2007. On the other hand, the surveys carried out in a joint document elaborated by the central banks of Argentina and Brazil showed that, in 2006, over 5,000 Brazilian companies imported products from Argentina across approximately 3,000 tariff lines. In terms of exports, the figures were even higher: in the same year, approximately 5,800 companies exported products to the Argentine market across 4,600 tariff lines. The aforementioned document highlighted the lack of low-cost financial instruments for peso-real transactions, while pointing out that the transaction costs were obstacles that restricted and discouraged SME access to bilateral trade (Borba & D’Orio [2007]).
The work by the two countries’ central banks to develop a mechanism allowing foreign trade operations in local currencies, thus meeting the objectives to simplify and debureaucratize bilateral exchange, underwent various stages.
In 2005, the international experience was evaluated (USA, Europe, Mexico, Canada, and others) in order to understand the workings of the mechanisms already under way with a view to identifying a model better adjusted to the objectives and conditions prevailing in both countries. The characteristics, workings, and instruments available in the two countries’ markets were also researched in order to verify the existence of similar mechanisms. In that case, these did not need to be developed, but merely finetuned.
It was stipulated that the establishment of a local currency clearinghouse for Brazil and Argentina aimed to: (i) facilitate financial settlements in local currencies between the two countries; (ii) increase liquidity and efficiency and, consequently, deepen the real-peso foreign exchange market; (iii) reduce the costs of transactions and thus increase the level of access to trade for the small and medium agents; and (iv) move forward in the regional integration process by familiarizing agents with local currencies.
The deepening of the discussions helped define the desirable characteristics for a local currency clearinghouse and certain premises were established as a result:
• Voluntary participation by agents.
• Absence of credit risk.
• Absence of risk of exposure to local currencies.

91
• Absence of subsidies for participants.
• Absence of arbitration between currencies within the clearance system.
In short, it was agreed to develop a clearance and securities transfer system that would incorporate no risk or financial coverage mechanism between the participants.
In this clearance system, unlike the foreign exchange market, the agent of international trade would transfer/receive currency local to/from the intervening financial institution. In turn, the financial institution would transfer/receive local currency to/from the central bank and the clearance between reals and pesos would take place on a daily basis in the ambit of the central banks.
The following outline illustrates the clearance system agreed:
BCB/BCRA MODEL
ArgentinaExporter
Argentine Trade Bank
Argentina Importer
BrazilImporter
Brazilian Trade Bank
Brazil Exporter
BCRA BCB
US$ COMPENSATION
Argentinepesos
Reals
Reals
Reals
Argentinepesos
Argentinepesos
Argentinepesos
Reals
Product
Product
SML exchange rate(Real/Peso)
Source:BCBandBCRA.
Once the characteristics of the system to be set up were defined, the central banks, in August 2006, defined the stages needed to carry out their operation. The work plan envisaged: (a) meetings with exporters and importers from both countries; (b) meetings with both countries’ private banks; (c) a survey of the changes needed in the two countries’ foreign exchange legislation; (d) foreign exchange rates model tests; (e) development of the technological infrastructure needed for the clearinghouse to operate, and (f) the precise definition of the terms of the agreement to create the clearinghouse, including rules, restrictions, operating modes, etc.

92
One aspect that demanded attention from the formulators of the Local Currency Payment System (SML) was the need to preserve the absence of risk for central banks as a basic principle of the system. In this sense, when the contingency procedures was analyzed in more depth, questions arose about the system’s operative continuity in the face of foreseeable eventualities, such as human or operational errors, technological flaws, situations where payments for smaller amounts were attested, or even the absence of payment of the results of the daily clearing.
In the case some of these eventualities, the only solution that would produce no risk for the central banks would be settlement of the operations recorded in the SML, which, however, would compromise the system’s credibility. It was therefore concluded that it was necessary to establish a "contingency margin" among the central banks. It was agreed that there would be interest on this margin’s value, calculated at LIBOR + 1%, a level established to discourage the use of said mechanism. It was also ruled that the contingency margin would initially be established on an estimated basis, according to which approximately 15% of the volume of Brazilian-Argentine trade would migrate to the new mechanism, a percentage applied to the weekly average of the balances between the payments and charges arising from the commercial transactions between the two countries.
Last, it was agreed that the daily SML rate would be calculated on the basis of real-dollar rates (PTAX Interbank Rate released daily by the Central Bank of Brazil) and peso-dollar rates (Benchmark Rate released by the Central Bank of Argentina) and that the financial settlement would be performed within three working days (D+2).
The formalization of these agreements in the ambit of MERCOSUR followed the sequence described in the previous Report and summarized below:
• In July 2006, on the occasion of the Presidents Summit in Córdoba City, Argentina, a Letter of Intent was signed, defining the lines of a pilot project for a mechanism to allow foreign trade transactions to be carried out in local currency.
• Subsequently, at the 31st CMC Meeting CMC Dec. 38/06 was approved, which stipulated carrying out studies to develop a mechanism with these characteristics to be initially implemented at bilateral level in Brazil-Argentina trade. If the new system works satisfactorily, it could be extended to any other MERCOSUR countries that so desired.
• The next step was in the framework of the Asunción Summit, when CMC Dec. 25/07 was approved, which created the SML for trade between MERCOSUR States Parties. It also was stipulated that this system’s transaction conditions would be optional and would be defined via voluntary bilateral agreements between the respective countries Central Banks.
• This Decision was established by the 59th Additional Protocol to ECA 18 in the ambit of LAIA, the adoption of the procedures needed to incorporate it in their respective legal systems being left to the two countries.
Evolution
In 2008, it was announced that, after a trial period, the SML would come into operation during the second half of that year. In Brazil, more than ten banks were to participate in the tests.

93
On June 26, 2008, the Provisional Measure 435 was enacted, authorizing the Central Bank of Brazil "to provide credit to the Central Bank of the Argentine Republic up to a limit of US$120 million in the form of a reciprocal contingency margin in the ambit of the Local Currency Payment System (SML)".
Finally, on September 8, 2008, on the occasion of President Cristina Kirchner’s visit to Brazil, the two countries’ central banks announced the signing of the "Local Currency Payment Convention between the Argentine Republic and the Federative Republic of Brazil".
The Convention sanctioned the previous commitments between the central banks, highlighted the voluntary nature of the mechanism, and made explicit the central banks’ desire not to take on risks:
• "The disputes between importers and exporters, between exporters and the relevant Authorized Entities, or among Authorized Entities regarding the registration or execution of payments made via the SML will be directly resolved among them, the Central Banks taking no responsibility for the differences or damages such disputes may cause" (Clause Ten).
• "The SML is not a foreign exchange risk coverage mechanism. The Central Banks take on no reciprocal credit risk, with the exception of the provisions in Clause Thirteen, nor credit risk of its country’s Authorized Entities" (Clause Fourteen).
The above exception is in fact related to the contingency margin:
• "The Central Banks shall, by common agreement, establish a reciprocal potential margin to be used in accordance with the Operative Regulations" (Clause Thirteen).
On September 2008, 11 the Central Bank of Brazil circulated Res. 3,608, which included some provisions clearly geared to facilitating bilateral transactions to the benefit of private individuals and/or small companies. It is worth highlighting at this point the exemption from presenting commercial transaction documentation in transactions whose value in reals should not exceed US$3,000, as well as the possibility of collecting cash values not above R$10,000.
The Resolution will come into force on October 3, the date announced for the start of the operation of the new system.
Finally, when the new system was announced, the authorities of the Central Bank of Brazil released the following information:
* The expectation of a reduction in the transaction costs under the operation of the SML was estimated at approximately 4%.
* Adherence to the new system was estimated at between 10% and 20% of the daily movement of bilateral trade, currently in the order of US$120 million.
* The initial value of the credit line (contingency margin) in favor of the Central Bank of the Argentine Republic would be set at US$10 million.

94
On September 26, 2008, Argentina, for its part, released Communiqué 4,847 through the BCRA on the same issue.
The creation of the mechanism was welcomed in both countries. In Brazil, it was highlighted that SMEs would benefit from the reduction in costs, even thought this advantage was slight due to the absence of a genuine real-peso parity and the requirement of the dollar for triangulation. The optimists pointed out that the new system of payments also had a symbolic value, representing as it did the first step toward the establishment of a single currency in MERCOSUR.
f. The mERcoSuR Parliament
Background
The constitution of a MERCOSUR Parliament was the subject of discussion among the members of the old Joint Parliamentary Commission (CPC) for almost three years.
In 2003-2004, the CMC took two important decisions: first, CMC Dec. 26/03, which included in the "2004-2006 MERCOSUR Work Program" the objective to constitute a Parliament in the ambit of MERCOSUR; second, CMC Dec. 49/04, in which it was formally decided to go ahead with the creation of the MERCOSUR Parliament as the representative organ of the peoples of the States Parties. On that occasion, it was decided that the Parliament would be governed by the provisions of its Constitutive Protocol and would form part of MERCOSUR’S institutional framework. CMC Dec. 49/04 vested the Joint Parliamentary Commission with the responsibility of drawing up the Draft Protocol and December 31, 2006, was established as the date of its effective establishment and the winding-up of the CPC.
The CPC drew up the Constitutive Protocol of the MERCOSUR Parliament (PCPM) and submitted it to the CMC at the end of 2005, whereupon it was approved (CMC Dec. 23/05). The last step included in CMC Dec. 49/04 was taken at the end of December 2006 with the effective establishment of the MERCOSUR Parliament.
The Protocol enshrined the principle of "civic representation" (Art. 5), a criterion that still lacked a more precise definition, as it would have to be drawn up by the Parliament itself, but which was different from States Parties’ principle of equal representation, the kind of representation that had prevailed in the CPC and would prevail in the Parliament until the implementation of the new criterion. In short, civic representation would turn the Parliament into something different than the other organs of MERCOSUR, where representation was always governmental.
The election mechanism for MERCOSUR parliamentarians through universal, direct, and secret ballot, adopted by the Protocol (Art. 6), enshrined the principle of democratic legitimacy. The expectation is that this mechanism will contribute to building a regional identity. The constitution of the Parliament is also expected to lend greater legitimacy to the community rules. Many of these rules can currently only be incorporated through approval by the respective legislative bodies, but their legitimacy is nevertheless widely questioned on the basis of the inadequacy of the debate preceding their approval. It is worth pointing out, in this respect, that one of the Parliament’s main powers is to do with its advisory capacity (Art. 4, Section 12). Through this power, the Parliament is entitled to draw up reports on all draft rules under negotiation. In exercising this capacity, the

95
Parliament can organize public hearings to debate any rules being processed with civil society. The Parliament’s performance can therefore strengthen the legitimacy and transparency of the integration process.64
Under Article 1 of the Protocol, the Parliament will be constituted out in stages, defined explicitly in the Temporary Provisions. The period from December 31, 2006, the date of the Parliament’s establishment, and December 31, 2010, forms the "first transition stage". At this stage, the Parliament is made up of 18 parliamentarians per State Party. The national legislative bodies choose these parliamentarians and each Parliament defines the modalities and criteria for the choice. Its mandate lasts four years.
Before the end of the first transition stage, the criterion of "civic representation" will be defined and approved so that the States Parties can set about electing the national parliamentarians of the following legislature through the election mechanism of universal, direct, and secret ballot. The election of parliamentarians in the States Parties must be completed by the end of December 2010, so they can take up their functions at the start of 2011, but the precise date of this election is depends on each State Party’s electoral calendar.
The second transition stage will last four years, from January 1, 2011, to December 31, 2014. It is worth pointing out that, by this stage, the Parliament will already be made up of legislators elected by universal, direct ballot. Before the end of 2012, it will be the Parliament’s job to propose a date to the CMC for holding simultaneous elections in the States Parties to elect the parliamentarians in 2014 for the next legislature (2015-2018). "Civic MERCOSUR Day" will thus be established, and the first simultaneous elections will take place before December 31, 2014, when the second transition stage draws to a close.
Evolution
In August 2007, the Parliament approved its Internal Regulations, establishing the organization of ten permanent thematic commissions and including ways of participating in organized society. To this end, the Regulations contemplate the holding of public hearings and seminars with the participation of civil society. More precisely, Article 83 of the Regulations states that any Commission "may hold public meetings with civil society organizations, production sectors, NGOs, and social movements in order to deal with matters concerning its area of performance, via a proposal by any member or at the request of an entity or interested sector".
On the other hand, the Regulations (Art. 33 and subsequent) determine the rules for the formation of "policy groups". The expectation is that the formation of these groups, based on political and ideological affinities between members of the various different national representations, should encourage a community vision that goes beyond the limits of a merely national approach. It is hoped, therefore that the Parliament will be a counterweight to intergovernmental approach adopted by the other MERCOSUR organs.
In line with the Regulations, for a political group to be formed it must contain at least (a) 10% of the Parliament’s members if they are representatives of a single State Party, or (b) 5 parliamentarians if they are representatives of more than one State Party.65
64 Itshouldbepointedout,however,thatthesanctionofMERCOSURrulesisrestrictedtotheambitoftheCMC,astheMERCOSURParliamenthasnolegislativepowersintheambitofthecommunity.65 Forthetimebeing,justonepoliticalgrouphasbeenformed,theNationalParty,madeupexclusivelyofeightUruguayanparliamentarians.

96
The Regulations also stipulate that no parliamentarian may belong to more than one political group at a time.
But the MERCOSUR Parliament’s main task in this first transition stage is to precisely define the criterion of civic representation. In effect, in line with the Protocol, the criterion of proportionality "will be established by Decision of the Common Market Council after proposal by the Parliament adopted by qualified majority. This Decision will be approved by December 31, 2007, at the latest" (Article 2 of the Temporary Provisions). Qualified majority was defined as the affirmative vote of the absolute majority of members of the parliamentary representation of every State Party.
The deadline set by the Protocol was not met and, by decision of the Parliament and the CMC, it was extended to December 31, 2008. The lateness in defining the criterion of proportionality demonstrates the difficulty faced by the States Parties to agree a different form of representation to equal representation for the first time.
The delay has already given rise to an unprecedented situation, as Paraguay held elections in April 2008 and, anticipating the definition of the criterion of proportionality, opted unilaterally to elect 18 parliamentarians. This floor is viewed as high, even in the almost inevitable eventuality that the form of representation chosen will be proportional representation (RP), similar to that in the European Parliament.
It is a matter of urgency to define the criterion of proportionality before the end of 2008, for, once this has been agreed, each State Party will define its internal proportionality and the electoral law that will regulate the election. These definitions must, in turn, respect the States Parties’ electoral schedules. Uruguay and Argentina will be having elections in 2009. Brazil, for its part, will define internal proportionality by law in 2009 so that the election of its representatives can be held in 2010.
It should be noted in this sense that the Brazilian Constitution does not provide for elections to institutions or entities outside its borders. Consequently, the definition of the number of parliamentarians in the Brazilian representation requires the drafting of a law, which will also stipulate whether the electoral district will be state, regional, or national.
The difficulty in defining the criterion of proportionality lies in the reluctance of the smaller countries to establish a direct link between the size of each country’s population (which varies from 3 million in Uruguay’s case to 180 million in Brazil’s) and the number of its seats. If this were to happen, the largest partners would have a far greater number of seats than the other countries. The concern, therefore, is that the smaller countries will be politically "swallowed up" by the larger countries, mainly by Brazil. This difficulty even raises the suspicion that the Parliament may modify the temporary provision that determines the deadlines for its ultimate constitution, which would make explicit "the incapacity or lack of will of the States to strike up substantial political agreements" (Casal [2008]).
Currently, a Draft Rule is being put through the Parliament, whose secretary is its current President, Dr. Rosinha, a member of the Brazilian representation. The draft adopts "the criterion of attenuated representation, which starts from a floor and adds seats for each population group above the floor at increasingly wider intervals in order to favor the desired attenuation in proportionality", in accordance with the justification of the draft.

97
tABle 17DISTRIBUTION OF SEATS IN THE MERCOSUR pARLIAMENT
(BasedonthecriteriaoftheDraftRule)
Countries Inhabitants SeatsInhabitants per
MERCOSUR parliamentariana/
Brazil 183,987,291 75 2,529,930
Argentina 39,531,000 33 1,197,909
Paraguay 6,127,000 18 340,388
Uruguay 3,340,000 18 185,555
Venezuela 27,657,000 27 1,024,333
total 260,642,291 171 1,557,893
Note:a/InthecaseofBrazil,thereisaninconsistencyinthesourcebetweenthetotalandthecoefficientofrepresentation.
Source:Dr.Rosinha[2008].
The Draft Rule also provides that the entry of any new State Party in MERCOSUR will involve revision by the CMC and at the suggestion of the Parliament of the number of seats corresponding to the representation of each member country, which will come into effect in subsequent elections.
At present, discussion of the Draft Rule is the MERCOSUR Parliament’s main task.
G. other issues on the internal agenda
Venezuela’s membership of MERCOSUR
Venezuela’s membership of MERCOSUR is still pending approval by the Paraguayan and Brazilian congresses. The President of Venezuela requested approval of the Adherence Protocol immediately after the Paraguayan President took office. In spite of the interest in this approval shown by the Brazilian and Paraguayan governments in their respective congresses, no serious progress has yet been over issue in the two countries’ legislative bodies.
Recently, Brazil’s Minister of Foreign Relations declared that he would strive to have the Protocol of Adhesion approved by the Brazilian Congress in 2008. After being approved by certain commissions, the Protocol will be voted on in a plenary session of the Chamber of Deputies, after which it will be sent to the Federal Senate. The period of municipal elections in Brazil, which lasts until mid-November, added to the backlog of projects being processed in the Brazilian Parliament furnishes little hope that this objective will be achieved.

98
Institutional reforms
In December 2005, the CMC created a High Level Ad Hoc Group for Institutional Reform of MERCOSUR (GANRI) within the space of a year (CMC Dec. 21/05). The deadline was excessively short and its scope too broad.
By mid-2006, the CMC issued another decision that was wide and vague in its scope, this time instructing the GMC to "identify the level of evolution of the institutions and principles of MERCOSUR in light of the objectives of the Treaty of Asunción, and the evolution of their derived rules" (CMC Dec. 22/06). In the same rule, the CMC states that the institutions and principles to be evaluated are: free circulation, the common trade policy, macroeconomic, sectoral and investment policy coordination, the application of regulations, and social matters.
At the end of 2006, once the GANRI’s initial deadline was up, the CMC recognized that "owing to the complexity and breadth of the issues considered" the deadline needed to be extended (CMC Dec. 29/06). This time, however, the CMC defined a set of priority issues, implicitly abandoning the demand for an integral proposal by admitting the possibility of the GANRI sending proposals (in the plural) to the CMC. The guidelines for institutional reform defined by the CMC were now:
• To restructure MERCOSUR’s decision-making organs and subordinate forums, including their jurisdiction.
• To finetune the system of incorporation, effectiveness, and application of the MERCOSUR regulations.
• To analyze the creation of potential organs in the ambit of MERCOSUR in order to negotiate common policies.
• To optimize the functions and jurisdiction of the MERCOSUR Secretariat in line with the process’s needs.
• To finetune the MERCOSUR dispute settlement system and strengthen its institutional organs.
• To adopt a budget that will integrally finance MERCOSUR’s institutional framework.
The deadline set for the GANRI was again one year, until the end of 2007.
In January 2007, the CMC commissioned the GANRI to send a proposal for adjustments to the Protocol of Olivos before the end of 2007. However, five months later, it opted to extend this deadline to June 2008.
At the end of 2007, the CMC granted the GANRI a fresh extension, deferring the deadline to June 2009, but called on the Group to submit proposals before June 2008 on four issues detailing and restricting the scope defined at the end of 2006 (CMC Dec. 56/07):
• The restructuring of MERCOSUR’s decision-making organs and their subordinate forums, including their jurisdiction, which, among other things, contemplates the functions of support for MERCOSUR States Parties’ Permanent Representations and adjustments to the CMC Regulations.

99
• The finetuning of MERCOSUR’s dispute settlement system and the strengthening of its institutional organs, including the works in the framework of CMC Dec. 17/07 relating to a proposal for adjustments to the Protocol of Olivos.
• The finetuning of the system of incorporation, effectiveness, and application of the MERCOSUR regulations.
• A MERCOSUR budget that, at this stage, must provide for the budgetary requirements of the MERCOSUR Secretariat and the Permanent Review Tribunal Secretariat.
Until June 2008, the results obtained by the Institutional Reform were restricted to two CMC Decisions (CMC Decs. 54/07 and 14/08) and to administrative measures of a budgetary nature mentioned in the report submitted by Argentina’s PPT in San Miguel de Tucumán.
CMC Dec. 54/07 extended the functions of the Permanent Representatives accredited by the States Parties in Montevideo, allowing them to attend the GMC when requested. To this effect, they will be able to meet in the headquarters of the MERCOSUR Secretariat under the coordination of the State holding the PPT.
CMC Dec. 14/08, on the other hand, modifies the CMC’s Internal Regulations in order to institutionalize the participation of Ministers attending MERCOSUR Ministerial Meetings in the bloc’s supreme organ to deal with the matters in their respective jurisdictions. To this effect, the regular meetings of the CMC will be held in three sessions.
The first session will be held with the Ministers of Foreign Relations and the Economy or their counterparts in the States Parties. In view of the issues on the agenda, a second session will be held, in which, alongside the Ministers of Foreign Relations and the Economy or their counterparts, the similar-ranking Ministers or authorities appointed by each State Party. The last session of the CMC will be held with the Ministers of Foreign Relations and the Economy, or their counterparts, and the Presidents of the States Parties.
The decision also stipulates that "consensuses reached at the Ministerial Meetings will be termed Proposals and will be submitted to the Common Market Council for consideration. These proposals may consist of international draft agreements, Decisions, Recommendations, or other instruments".
Last, the modification to the CMC’s Internal Regulations stipulates a process of notice for extraordinary CMC meetings.
Argentina’s PPT also reported that the GANRI debated various draft amendments to the Protocol of Olivos, mainly to do with the composition and operation of MERCOSUR Tribunals and the establishment of disciplines regarding compliance with rulings and countervailing measures, without reaching any consensus between countries.
A proposal by Argentina was also debated. This admitted the possibility of directly applying the rules not requiring legislative approval in the States Parties’ legal systems. However, there was no consensus over this matter either.

100
Last, the budgets of the Permanent Review Tribunal Secretariat and the MERCOSUR Secretariat were agreed, and it was decided that, as from 2009, the Commission of Permanent Representatives will receive funding.
Biofuels
As described in MERCOSUR Report 12, the issue of biofuels was included on the bloc’s internal agenda through the Brazilian government initiative submitted at the 65th GMC Regular Meeting in November 2006. The following month, the States Parties of MERCOSUR and Venezuela signed a "Memorandum of Understanding to establish a Special Biofuels Working Group", responsible for drawing up a cooperation program in the area of biofuels that would consider the strategic importance of energy cooperation among MERCOSUR members.
At the 34th CMC Meeting in Montevideo in December 2007, the Special Working Group submitted a MERCOSUR Action Plan for Cooperation in Biofuels, which was approved (CMC Dec. 49/07). The CMC also opted to create an Ad Hoc Biofuels Group (GAHB) to define the criteria and instruments to facilitate countries’ cooperation in this area.
The approved Action Plan envisages nine activities, each of which breaks down into specific objectives. At the first meeting of the GAHB in March 2008, the participating delegations (including Venezuela) decided to give priority to drawing up a work plan based around three activities:
• Evaluation of the technical specifications for biofuels: The main objective of this activity is to draw up a document on the compatibilities and differences of technical specifications for biofuels in the ambit of MERCOSUR.
• Identification of entities and companies with competition in technological research and development in biofuels production chains: The objective of this activity is to identify ongoing lines of research and the entities or companies able to commit to the Action Plan.
• Aspects linked to sustainable biofuel production: The objective foreseen for the second half of 2008 is to identify key elements to define the sustainable production and use of biofuels in the ambit of MERCOSUR.
The Science, Technology, and Innovation Framework Program
In 2006, the Specialized Science and Technology Meeting (RECyT) was commissioned to draw up a science and technology program for MERCOSUR. In Tucumán, at the end of June 2008, the CMC approved the MERCOSUR Science, Technology, and Innovation Framework Program for 2008-2012 (CMC Dec. 03/08).
101
Box GSCIENCE, TECHNOLOGY, AND INNOVATION FRAMEWORK pROGRAM
Fundamentals
TheFrameworkProgram (PM) is topromote integration,givevisibility to strategic regional transformationprojects,andestablishaharmonizedjointposition.ItsactionsmustbetotallyconsistentandcoherentwiththemajorintegrationprojectsintheambitofMERCOSUR.
Sustainable,highimpactprojectsareneededtogiveprioritytoscience-,technology,andinnovation-basedsocialandproductiondevelopmentlikesustainabledevelopmentguarantees.
ThePMisamultiannualpublicprogram.ItistohavepermanentresourcestofacilitatetheexecutionofprojectsandactivitiescommontotheStatesPartieswithoutthelimitationsimposedbynationalbudgets.
pM Actors
PMactorsineachStatePartyinclude:
• Nationalscienceandtechnologyoffices.
• Highereducationinstitutionsandoftechnicaltraining,nationalacademies,vocationalcolleges,scientificsocieties,laboratories,andresearchanddevelopmentcenters,bothpublicandprivate.
• Privatesectororganizations,companies,technologicalserviceproviders,andinformationandassistancenetworks.
• Publicorprivatecorporatebodiesthatundertakingactivitiesofscience,technology,andinnovation,andtheirapplications.
• Organizedcommunitiesthatraiseproblemscapableofbeingdealtwithbyscience,technology,andinnovation.
Funding
ThePMneedstohaveapermanentfundingmechanismthatcanensuretheallocationofresources,withstable,continuousfoundations,justasthestructuralinitiativesthatnormallygovernmultiannualactionsrequire.TheStatesPartieswillundertakeeffortstoidentifyavarietyofpromotionsources,andwillalsoevaluatetheuseoftheMERCOSURStructuralConvergenceFund(FOCEM).Untilapermanentfundisavailable,eachcountry’spermanententitieswillundertakeeffortstowardmakingviablespecificcontributionstofundtheProgram’sinitiatives,suchasresourcesfromintra-andextraregionalcooperationprojects.
Programmatic themes
Fourprogrammaticthemesaredefined,alongwiththeirmainquestionsorissues.
theme i - Strategic dimension
Issue:Advanced,alternativeenergies,hydrocarbons,hydraulics,nuclearandbiomass;sustainabledevelopment(naturalnon-renewable resources, urban development, sewerage, and other); information and communication technologies;biotechnology;nanotechnologyandnewmaterials;healthandmedicines;space;biodiversity;water.
theme ii - industrial and agricultural dimension
Issue:Agroindustry;localproductionagreements;technologicalextension;poles,parks,andincubators;university-business(U-B)cooperativeprojects.
theme iii - Social dimension
Issue:Diffusionofappropriatetechnologies;foodsecurity;digitalinclusion;habitationandsewerageresearch.
theme iV - national systems of science, technology and innovation (Sti) dimension
Issue:Scienceinfrastructure,technologyandinnovation;humanresourcestraining;funding;legalframework;internationalcooperation;informationinscience,technology,andinnovation;scienceindicators,technologyandinnovation.
Complementary considerations
• TheactionscontemplatedinthePMwillinvolvegroupsofatleastthreecountries,oneofwhichistheleastdeveloped.
• RECyTwillworkasanauthorityresponsibleforsettingpriorities,support,andevaluationofthePM.
• The selection of projectswill be based on three alternatives: a)Definition of the project or program through theselectionofactors,withaleadingrolebeingplayedbytheRECyT’sownauthorities;b)DefinitionoftheR+Dproblemorissuethatisthetargetoftheaction,andaninvitationtoactorspreviouslyidentifiedandlisted;andc)DefinitionoftheR+Dproblemorissuethatisthetargetoftheactionandanopenpublicannouncementforselection.
• Therewillbeasystemofprojectevaluationandfollow-up.TheevaluationprocesswillbecoordinatedbyRECyTandwillbeperformedbypeerevaluationasrecognizedbytheNationalScienceandTechnologyBodies(ONCyT)fromeachStateParty,foraspectsrelatedtotheintrinsicqualityoftheactionstobeevaluated,andbyexpertsorotherrelevantactorsforthoseaspectsrelatedtosocialimportanceandrelevancetotheintegrationprocess.

102
The Framework Program defined the following seven issues or priority questions for 2008 -2012:
• Biotechnology
• Energy
• Nanotechnology
• Water resources
• The information society
• The popularization of science and technology
• Technological development and innovation

103
cHAPTER 4. SEcToRAL coNfLIcTS ANd TRAdE dISPuTE NEGoTIATIoNS
A. General outline
Compared to previous years, there was less evidence of trade disputes within MERCOSUR both in terms of political repercussions and impact on the internal negotiating agenda. The partners’ significant rates of economic growth, the expansion of Brazilian investment in the region, and an appreciation of the real against the dollar with repercussions for Argentine real/peso parity combined to foster growth in regional trade as a whole and Brazilian imports from the other MERCOSUR countries. Thus, until July 2008, the bloc saw significant growth in economic and trade terms without any major disputes, in spite of structural asymmetry thanks to which the largest partner has a robust trade surplus over the other three member countries.
In the first half of 2008, Brazilian foreign trade was characterized by a marked growth in imports (50.6%) against the same period for 2007, whereas exports showed lower expansion (27.5%). As a result, there was a slowdown in the growth of the global trade surplus.
However, in terms of Brazil’s trade with MERCOSUR countries in 2008, its exports to the bloc grew more than imports (37.7% and 35.2% respectively). This performance was responsible for a more favorable trade balance for Brazil in exchange with Argentina66 and with its other two MERCOSUR partners. The general picture in the bloc is then one of higher levels of trade and balances ever more favorable to Brazil (see Chapter 2).
Some factors helped create a less tense, less pressurized atmosphere in terms of trade disputes. These include the partners’ economic growth, the increase in Brazilian investments in the region, and follow-up on the Bilateral Monitoring Commissions.
Recent data67 show that Argentina’s loss balances in trade with Brazil are concentrated increasingly in products with higher added value. This is indicative of Argentine industry’s difficulties in recovering a share in the two countries’ markets, in spite of the investments in machinery and equipment after the macroeconomic crisis of 2002. In this sense, there is a feeling that Argentina has been losing ground in Brazilian industrial manufacturing purchases, whereas Brazil expanded its share in the structure of Argentine imports in this segment.
On the other hand, there is a slowdown in Argentine imports from Brazil in the sectors subject to the current trade monitoring systems, with a slight downward trend in Brazilian market share. Even so, the scheme of the old Trade Monitoring Commission (now called the Brazil-Argentina Bilateral Meeting) shows that, in fact, trade disputes decreased. Many voluntary export restriction agreements were not renewed (the agreement in the paper and pulp sector still stands) and the agenda increasingly includes issues of interest common regarding third countries. This is true of trade with China, which is a cause for concern in both countries.
The textile sector, which had been the butt of serious trade discrepancies, became a space for cooperation on the basis of Brazilian investments in Argentina. The perceived "China effect" on the sector has facilitated the development of coordinated action between the two countries’ private sectors, notwithstanding the bilateral overview for samples of import deviation and losses of Brazilian market share in the Argentine market.
66 Brazil’stradebalancewithArgentinareachedUS$2.3billioninthefirsthalfof2008,asagainstUS$1.6billioninthesameperiodof2007.67 ABECEB[2008].

104
Perhaps the Common Automotive Policy agreement, with its setting of a time limit on free trade, was the issue that left the greatest mark on relations between MERCOSUR’s two senior partners in terms of trade disputes between July 2007 and June 2008. This sector, responsible for a significant portion of bilateral trade and characterized by administrated trade that had difficulty adapting to free trade, had been postponing negotiations for the lifting of intra-MERCOSUR restrictions.
Setting a date for free trade proved difficult for Argentina, which was concerned to maintain and grow foreign direct investment in the sector. The terms of the conclusion of this negotiation were not considered exactly desirable by representatives of the industry in Brazil, whereas in Argentina they were seen as a possible limit. It was felt that, for the sake of calm in the market and the maintenance of investments, it was better to have an agreement aimed at free trade in the future, but which created a predictable horizon for trade rules, rather than maintaining the earlier situation with temporary agreements subject to constant extensions. It now remains to monitor the implementation of the agreement and create the conditions for the commitments to be met.
This chapter describes in detail the evolution of the Brazil-Argentina Common Automotive Policy, weighs up the trade disputes in the industry indicating the progress of negotiations in the textile sector, and looks at two other issues selected for their repercussions on negotiations between the governments during the GMC meetings (the pulp mill dispute between Argentina and Uruguay, and the issue of used or retreaded tires, since, in the framework of the WTO, Brazil is required to eliminate special MERCOSUR import conditions. The report is not exhaustive, but, as mentioned, the trade climate among the partners has been milder than in previous years.
b. The evolution of the brazil-Argentina common Automotive Policy: latest agreements
The Common Automotive Policy between Brazil and Argentina was established in 2001 with the signing of the 30th Additional Protocol to ECA 14. Bilateral automotive trade has been administrated throughout the construction process in the free trade area and the MERCOSUR Customs Union, including trade quotas up to the level of vehicle brands.
As of the 30th Protocol, an organized structure for the Common Automotive Policy was created, the levels of the Common External Tariff (CET) for extrabloc imports, the methodology of national tariff adjustment to these levels, and the mechanisms to set intrabloc preferential trade quotas for 2001-2005 all having been defined. There was no commitment over the date of establishment of the free trade area.
The issue was finally included in the 31st Protocol of November 2002. Article 13 says that "as of January 1, 2006, trade in automotive products between the Parties will no longer be subject to tariffs or to quantitative limitations" (see Box H, describing the Brazil-Argentina Common Automotive Policy’s evolution in detail).
The period 2002 to June 2006 was characterized by intense negotiations between governments and representative entities from the two countries’ private sectors. Negotiations on the free trade issue have traditionally been difficult. These difficulties are explained by a significant flow of investment attraction in the automotive sector based on maintaining high levels of protection in relation to abroad, and barriers and quotas in trade with Brazil.

105
Bo
x h
EVO
LUTI
ON
OF
THE
BR
AZI
L-A
RG
ENTI
NA
CO
MM
ON
AU
TOM
OTI
VE p
OLI
CY
Issu
e
31st
pro
toco
l of N
ovem
ber 1
1, 2
002
35th
Pro
toco
l of J
une
28, 2
006
38th
Pro
toco
l of J
une
23, 2
008
Effe
ctiv
e fr
om A
ugus
t 1, 2
000
to D
ecem
ber 3
1, 2
005
(art
icle
s 12
at 2
3 st
artin
g Ja
nuar
y 20
01)
Effe
ctiv
e fr
om J
uly
1, 2
006
to J
une
30, 2
008
Effe
ctiv
e fr
om J
uly
1, 2
008
to J
une
30, 2
014
Extr
azon
e tr
ade
in v
ehic
les
and
auto
part
s
The ProtocolincorporatedtheAgreementontheCom
mon
Autom
otivePolicybetweenArgentinaandBrazil.
TheCETwassetat3
5%fo
rautomobiles,buses,trucks,
chassis,trailersa
ndsem
i-trailers,and
bodyworkand
cabs,andat14%
fortractors,harvesters,agriculturaland
self-propelledmachinery,onatotalof81tariffitems.
Differentiated
treatmentisadmittedinthe
caseof
provisionalpreferences,temporaryexem
ptionsand
tariffreductionsforgoodsnotproducedinM
ERCOSUR
(formerBraziliantariffs).Aperiodicrevisiondirectedbythe
Autom
otiveCom
mitteeisforeseen(A
rt.3).
Anascendingconvergencetim
elinewasalsodefinedfo
rArgentinatoadopttheselevelsfrom
2000to2006(Art.9).
Forautoparts,theoriginalvariedlevelsoftheCETwere
maintained(Art.3)foratotalo
f514tariffitems(varied
CETlevels).
CET
levelsremained
the
same
and
were
adoptedbybothcountrieswiththefinalizationof
Argentina’sconvergencetim
eline(Art.3).
Thesamereferencetoprovisionalpreferences
wasmaintained
for
temporaryexem
ptions
andtariffreductionsforgoodsnotproducedin
MERCOSUR(exBraziliantariffs)(Art.3).
Thesampleoftheagreem
ent(automobiles,etc.
andautoparts)w
asnotmodified.
TheCETlevels(35%and14%
)werenotm
odified.
AutopartsremainattheoriginalCETlevels.
Thesamereferencetopreferences,exem
ptions,
andreductionsismaintained.
Withslightadjustments,thesam
pleofautom
obiles,
buses,trucks,chassis,tractors,trailers,chassis,
and
self-propelled
machinerywasmaintained,
covering79tariffitems.
The
composition
ofthe
autopartssample
was
modifiedtoincorporate534tariffitems.
Impo
rts
of a
utop
arts
fo
r pro
duct
ion
Ascendingtim
elinesofImport
Tax
(IT)forimported
autopartsfrom
thirdcountriesanddestinedforautom
otive
productioninArgentinaandBrazil.InArgentina’simports,
authorizationwasgiventoadd0.5p.p.totheIT(Art.5
and6).
Protocols3
1and
35foreseethe2
%IT
for
autopartsnon-producedinM
ERCOSURtobe
appliedinproducts,alistofw
hichwillbedefined
bym
eansofproposalsfromthetwocountries’
privatesectors(Art.6ofthisProtocol,andArt.8
ofthe31stProtocol).
Importsofnon-originalM
ERCOSURautoparts
fortheproductionoftractors,harvesters,and
agriculturalandself-propelledmachinerym
ay
enjoythe
8%a
liquotoftheIT.T
hisbenefit
requiresproducerstoregisterwitheachparty’s
Protocolapplicationauthorities(A
rt.8).
Before
Decem
ber
31,
2006,
countrieswill
make
effortstoreach
consensus,working
jointlywithprivatesectors,onthedefinitionofa
commonautopartspoliciestoelim
inateexisting
asym
metries(Art.7).
Thespecialtreatmentof2%ITonautopartsnot
producedinMERCOSURismaintained(Art.6).
ThelistofgoodsnotproducedinMERCOSURwas
notyetdefined.
Thesamebenefitontheimportationofnon-original
MERCOSURautopartswasmaintained,withan8%
aliquotfortheproductionoftractors,harvesters,
agriculturalandself-propelledmachinery(A
rt.7).

106
Bo
x h
(Co
nti
nu
ed)
Issu
e
31st
pro
toco
l of N
ovem
ber 1
1, 2
002
35th
Pro
toco
l of J
une
28, 2
006
38th
Pro
toco
l of J
une
23, 2
008
Effe
ctiv
e fr
om A
ugus
t 1, 2
000
to D
ecem
ber 3
1, 2
005
(art
icle
s 12
at 2
3 st
artin
g Ja
nuar
y 20
01)
Effe
ctiv
e fr
om J
uly
1, 2
006
to J
une
30, 2
008
Effe
ctiv
e fr
om J
uly
1, 2
008
to J
une
30, 2
014
Intr
azon
e tr
ade
adm
inis
trat
ion
(sco
pe
of a
pplic
atio
n)
Productssubjectto
monitoring
fromJanuary2
001
to
Decem
ber2005:automobilesandlightutilityvehicles,
buses,trucks,sem
i-trucks,chassis,andautoparts(A
rt.12).
Productssubjecttotradem
onitoringuntilJanuary2002:
trailersandsem
i-trailers,chassis,agriculturaltractors,
harvesters,andself-propelledagriculturalm
achinery,and
self-propelledmachinery(A
rt.12).
Products
subjecttomonitoring:automobiles
andlightutilityvehicles,buses,trucks,tractors,
chassiswithengines,andautoparts.T
heperiod
definedforthiscontrolw
asfrom
July1,2006,to
June30,2008(Art.11).
Thesampletobemonitoredwasnotm
odified.T
he
productssubjecttoglobalm
onitoringfromJuly1,
2008,toJune30,2013,are:a
utom
obilesandlight
utilityvehicles,buses,trucks,sem
i-trucks,chassis,
andautoparts(A
rt.10).
Coe
ffici
ent
of e
xpor
t de
viat
ion
(Fle
x)
US$1ofimports=US$2.6ofexports,in2005(coefficient
grow
ingbetween2001and2005)(A
rt.13).
Thereisnototallimitforpreferentialexports,providedthe
FlexdefinedintheProtocol(Art.13)ismet.
US$1ofimports=US$1.95ofexportsfrom
July
1,2006,toJune30,2008(Art.12a).
Providedthecoefficientofexportdeviationduring
thefirsttw
elvemonthsdoesnotexceed2.1,the
coefficientofdeviationwillm
aybecalculated
basedonthebiannualperiodbetweenJuly2006
andJune2008(Art.12b).
Thesamereferenceontheabsenceofatotal
limitforpreferentialexportsw
asm
aintained,
providedtheFlexismet.
Up toJune30,2013,thecoefficientofdeviationwill
beasfollows,dependingonthetraderesult:
BilateraltradedeficitforArgentina:Flexnotabove
US$1.95.
Bilateraltraded
eficitforBrazil:Flexn
ota
bove
US$2.50.
Thesamereferenceonth
eabsenceofato
tallimit
forpreferentialexportsw
asm
aintained,provided
theFlexismet.
T rad
e pe
riod
to
calc
ulat
e th
e de
viat
ion
of e
xpor
ts
Annualperiodsfrom
Januaryto
Decem
ber2001to
2005
(Art.13a).
Twotwelve-monthperiodsfrom
July1,2006,to
June30,2007,andfromJuly1,2007,toJune
30,2008.
Fivetw
elve-monthperiodsfrom
July1,2008(Art.11).
Free
Tra
de
FreetradeforecastinJanuary2006(Art.13a).
100%
preferencefortradeinMERCOSURunderthe
rulesoftheagreem
ent,withinthequantitativelim
itsandin
compliancewiththerulesoforigin(A
rt.11).
Nodateforeseen.Thesoleindicationisthat,
beforeJune30,2008,thecountrieswillcarryout
afullevaluationoftheevolutionofthein
dustry
andcommercialtrading,includingtradewiththe
restoftheworld,inordertomakeadjustmentsto
theAutom
otivePoliciesdefinedin
theProtocol
(Art.28).Thesam
e100%
preferencefortradeis
maintainedwithintherules(Art.10).
Up
toJune
30,2008,the
100%
preference
marginispreservedintrabloc(A
rt.10)withinthe
monitoringsystem
andinaccordancew
iththe
rulesoforigin.
From
July1,2013,theautomotivetradewillhaveno
quantitativelim
its(A
rt.11c).
The
100%
preferencemargin
waspreserved
intrablocbyArticle9.

107
Bo
x h
(Co
nti
nu
ed)
Issu
e
31st
pro
toco
l of N
ovem
ber 1
1, 2
002
35th
Pro
toco
l of J
une
28, 2
006
38th
Pro
toco
l of J
une
23, 2
008
Effe
ctiv
e fr
om A
ugus
t 1, 2
000
to D
ecem
ber 3
1, 2
005
(art
icle
s 12
at 2
3 st
artin
g Ja
nuar
y 20
01)
Effe
ctiv
e fr
om J
uly
1, 2
006
to J
une
30, 2
008
Effe
ctiv
e fr
om J
uly
1, 2
008
to J
une
30, 2
014
Inde
x of
reg
iona
l an
d A
rgen
tine
cont
ent
60%regionalcontentfo
rallproducts.Forautoparts,w
ith
theexceptionofgroupsandsubsetswhichm
ustalso
meetthe60%
,thesam
eMERCOSURgeneralrulewillbe
appliedforthoseproducts.
5%m
inimum
contentofArgentineautopartsand65%
maximum
content
ofimported
autoparts,
including
MERCOSURpartners(in2005)(A
rt.23).
The35thProtocolm
aintainedthesameorientation
towardregionalcontentasthepreviousProtocol.
Thedemandforminimum
Argentinecontentfor
autopartswasnotrenewed.
The38thProtocolm
aintainedthesameorientation
towardregionalcontentasthepreviousProtocol.
T em
pora
ry a
dmis
sion
an
d dr
awba
ck
Elim
inationoftheseoperationsin
vehicleandautoparts
exportsforM
ERCOSURcountries(Art.24).
Autom
otiveexportstoaMERCOSURpartnerwill
besubjectto
theMERCOSURgeneralrulesfo
rsuchoperations(A
rt.22).
Similarly,
the
38thProtocol
refersdraw
back
operationstoMERCOSURrules(Art.22).
Tech
nica
l reg
ulat
ions
Dem
and
forcompliance
withMERCOSURTechnical
Regulationsrelatedtotheenvironm
ent,andactiveand
passivesecurity,regardlessoftheoriginoftheproduct
(Art.31).
BeforeDecem
ber31,2006,thecountriesm
ust
agree
the
provisionslinked
tothe
Technical
RegulationstobeincorporatedintheAgreement
(Art.29).
The
countriesu
ndertaketo
resume
the
workof
harmonizationfortheTechnicalRegulationslinkedto
theenvironm
entandtheactiveandpassivesecurity
(Art.27).

108
The idea of maintaining limits on free trade (100% preference) through the Flex regime while it was not possible to obtain more balanced levels in bilateral exchange lies at the root of Argentina’s policies for the sector.68 This justifies the terms of the 35th Protocol of June 2006, according to which the free trade commitment was eliminated by a specific date and a more severe trade deviation than the previous one adopted, i.e. US$1 of imports = US$1.95 of exports between July 1, 2006, and June 30, 2008.
The Brazilian capacity to attract investments and the size of its market were considered threats to the recovery of the sector in Argentina. Nonetheless, the announcements of investments for the development of new models fuelled by the country’s economic recovery in 2006 and by the growth of Brazilian internal demand in the sector in 2007 brought about a more favorable climate for the negotiation of the Common Automotive Policy in the second half of the last year and the first half of 2008. This climate also benefitted from the exchange parity between currencies, which was more favorable to Argentina.
Indeed, this period was crucial for negotiations between Brazil and Argentina in the automotive area. The Brazilian automotive industry was applying pressure to set a scope on free trade, arguing that to maintain a scenario of instability regarding "the rules of the game" would be more negative than competition with Brazil. In the Brazilian view, the capacity to attract investment and maintain a favorable climate for the operation of multinational plants was linked to the macroeconomic environment and regulatory predictability.
Before June 30, 2008, countries had to make a complete evaluation of the evolution of the industry and trading, including trade with the rest of the world, in order to make adjustments in the Automotive Policies. That was the mandate that served as a basis for the great efforts by negotiators. In spite of the Brazilian pressure to guarantee a shorter deadline, the negotiations fixed free trade in July 2013, seven and a half years after what had been agreed in 2002.
With the active participation of the two entities from the private sector, the National Association of Automotive Vehicle Manufacturers (ANFAVEA) of Brazil and the Association of Automobile Manufacturers of Argentina (ADEFA) of Argentina, the agreement was considered positive compared with other available alternatives. Not to have an agreement or simply to set new extensions that reflected provisional agreements without the slightest reference to the objective of freeing up bilateral trade did not seem acceptable alternatives to the Brazilian party. The moment of reheating of internal demand for automobiles and the major appreciation of the real against the Argentine peso encouraged importation by the neighboring country and facilitated the conclusion of the negotiations.
An unusual rule included in the 38th Protocol of June 2008 was the setting of an asymmetric Flex. 1.95 is the limit for Argentina’s trade deficit in the sector. This means that, for Brazil, the proportion is US$1 of imports for US$1.95 of exports. The level of 2.5 corresponds to the limit of the Brazilian trade deficit, which means that, for Argentina, US$1 of imports should correspond to US$2.50 of that country’s exports.
Even in light of the recovery of investment in Argentina, the production asymmetry between the two countries continued to be significant. The possibility to enjoying a higher level than the Flex in exports should encourage greater trade balance and complementarity in the sector.
68 The"regimeofFlex"consistsofacoefficientofexportdeviation,viawhichalimitonexportsfromeachofthecountriesisdefinedperUS$1ofimports.

109
Table 18 shows the loss of market share in trade in vehicles, both by Brazil in the Argentine market and by Argentina in the Brazilian market, in the period of ECA 35’s application (July 2006 to June 2008). Even so, the higher level of the Brazilian market share (approximately 75%) against the Argentine market share (approximately 55%) is notable, considering that the two countries’ levels of imports from the rest of the world are very similar. On the other hand, the growth of Brazilian imports from the rest of the world was more marked than that of Argentine imports from the rest of the world, indicating a greater trade deviation than Brazil in relation to its partner.
In trade in autoparts, the differences in market share are wider (36% and 8%). The very much higher level of Brazilian imports from the rest of the world, which include autoparts not manufactured in either of the two countries, is remarkable. One of the pending tasks of the Common Automotive Policy’s 38th Protocol is in fact to define the list of products not manufactured within MERCOSUR, whose import tax will fall to 2%. The imports of autoparts not produced in the bloc for the production of tractors, harvesters, and agricultural machinery already enjoy the benefit of lower tax of 8%.
tABle 18IMpORTS OF pRODUCTS INCLUDED IN THE COMMON AUTOMOTIVE pOLICY
VEHICLES(US$Billions)
CutsArgentina Brazil
Jul. 2006 to Jun. 2007
Jul. 2007 to Jun. 2008 % Var. Jul. 2006 to
Jun. 2007Jul. 2007 to Jun. 2008 % Var.
World 3.815 5.495 44.1 3.180 5.616 76.6
Partner 2.914 4.074 39.8 1.820 3.022 66.0
MarketShare
BrazilinArgentina 76% 74%
ArgentinainBrazil 57% 54%
AUTOpARTS(US$Billons)
CutsArgentina Brazil
Jul. 2006 to Jun. 2007
Jul. 2007 to Jun. 2008 % Var. Jul. 2006 to
Jun. 2007Jul. 2007 to Jun. 2008 % Var.
World 6.558 8.466 29.1 13.987 19.052 36.2
Partner 2.330 3.017 29.5 1.073 1.350 25.9
MarketShare
BrazilinArgentina 36% 36%
ArgentinainBrazil 8% 7%
Note:Theproductscontainedinthe35thAdditionalProtocoltoECA14areincluded.
Source:PreparedusingWTA,MDIC,andLAIAdata.

110
c. Trade in products subject to the previous licensing system and voluntary restriction agreements: footwear, white goods, and paper
Trade in footwear between Brazil and Argentina has been traditionally marked by quantitative limits on Brazilian exports in the form of voluntary restriction agreements and non-automatic import licensing.
The first instrument is characterized by an effort to control trade by the entities representing the private sector. The Brazilian Footwear Industries Association (ABICALÇADOS) and the Argentine Chamber of the Footwear Industry (CIC) (this last by common agreement with its government) for years defined the annual quotas of sales from Brazil to Argentina in thousands of pairs of shoes.
In 2004 and 2005, Brazil was responsible for close to 80% and 70% of Argentine shoes imports respectively.69During that time, anything from voluntary restriction agreements to non-automatic licensing was in force. The main objective of the performance of the business entities was to maintain trade within the agreed limits, avoiding the activation of the Argentine government’s licensing instruments, which in turn acted as "incentives" for negotiations and trade monitoring.
Argentina’s footwear industry advocated the need to contain imports at a level of 14.5 million pairs (Brazil was seeking a quota of 16 million pairs) and the issue was debated between the two countries’ Ministers of State on various occasions.
Table 19 shows that Brazil’s market share in the Argentine market in 2006 and 2007 was adjusted, at between 60% and 65%. It is worth mentioning that, in the first half of 2008, compared to the same period in the previous year, the growth of Argentine imports from the rest of the world was a good deal higher than the growth of purchasing from Brazil. This determined a more modest level of the Brazilian market share.
This sector is still on the agenda of the Brazil-Argentina Bilateral Meeting, which identifies a significant expansion of Brazilian investment in Argentina. The two countries are in the process of evaluating imports from China in 2006, 2007, and 2008, on an annual and six-monthly basis.
In the area of white goods (stoves, refrigerators, and washing machines), the trade dispute began with the Argentine Economy and Production Ministry’s Res. 444 of July 5, 2004, which ruled that imports of stoves (NCM 7321.11.00), refrigerators (NCM 8418.10.00 and NCM 8418.21.00) and washing machines (NCM 8450.11.00) would be subject to non-automatic licensing.
In 2005 and 2006, ELETROS, the Brazilian private sector entity, and the Argentina Chamber of Refrigeration and Air Conditioning Industries (CAIRAA) agreed a balanced share in the Argentine market for local production and for Brazilian production, also devoting a small market reserve to other suppliers. Considering the possibility of import restrictions through the regime of non-automatic licensing, the Brazilian private sector chose to accept the voluntary restriction agreements that would preserve the market and would facilitate the modernization effort of the Argentine park.
In September 2006, all those agreements expired and ELETROS was unwilling to renew them. Even so, imports form Argentina in 2006 and 2007 expanded a good deal. Imports from the rest of the world grew
69 SeeMERCOSUR Report 12[2007].

111
32% from one year to the next in ´comparison with 21% of imports from Brazil. The shrinking of this segment in the Argentine market caused falls in purchases in 2008, both from the rest of the world and from Brazil. The Brazilian market share in white goods remained high in general, although it fell in the washing machine heading due to a rise in imports from Chile. Argentina and Chile maintain a significant trade flow in that product. Unlike trade with Brazil, in which Brazil does not import white goods from Argentina, trade in washing machines between Argentina and Chile is two-way.
tABle 19pRODUCTS SUBJECT TO THE NON-AUTOMATIC LICENSING REGIME
AND VOLUNTARY RESTRICTION AGREEMENTS(Argentineimports)
products
2006 2007 % Variation
US$ Millions US$ Millions 2007/2006
World Brazil MarketShare World Brazil Market
Share World Brazil
Footwear 228.7 138.6 60.6% 280.7 183.9 65.5% 22.8% 32.7%
Whitegoods 174.4 139.3 79.8% 231.7 168.2 72.6% 32.8% 20.8%
Paper 32.4 30.3 93.6% 40.6 39.2 96.6% 25.3% 29.3%
products
January-June 2007 January-June 2008 % Variation
US$ Millions US$ Millions 2008/2007
World Brazil MarketShare World Brazil Market
Share World Brazil
Footwear 113.0 72.4 64.1% 153.9 84.5 54.9% 36.2% 16.7%
Whitegoods 99.3 71.6 72.1% 93.4 63.6 68.0% -5.9% -11.2%
Paper 17.3 16.8 97.6% 21.3 19.8 92.8% 23.5% 17.4%
Source:ArgentinaMinistryofEconomyandProduction(MeyP).PreparedusingWTAandMDICdata.
The paper sector is one of the few to keep its voluntary restriction agreement in exports. The Brazilian private sector, as represented by Brazilian Pulp and Paper Association (BRAECLPA), feels the agreement is positive. Table 19 shows why: Brazil is practically the sole supplier of Argentina.
d. Trade in products subject to antidumping and safeguard measures in Argentina
The spectrum of products subject to antidumping duties, countervailing duties, and safeguard measures in Argentina and affecting Brazilian exports has changed little since 2006. The Competitive Adaptation Mechanism (MAC), approved to enable the adoption of certain restrictions on trade between Brazil and

112
Argentina through negotiations and under certain circumstances, was not implemented by the countries.70The regular survey by the National Foreign Trade Commission (CNCE) shows that, in 2006, there were 40 tariff items subject to the application of these measures, as against 36 in 2008.
For the vast majority of products, the imposition of restrictive measures began in 2005, with a deadline of 3 to 5 years. Antidumping duties were imposed on three products in 2007 and 2008: transformers (MEyP Res. 02/07 of July 23, 2007), manual saw blades (MEyP Res. 61/08 of February 14, 2008) and glasses and glass pitchers (MEyP Res. 121/08 of March 13, 2008). In 2007, the Brazilian market share of those products was 18%, 16%, and 49% respectively. In the case of transformers, the measures had an effect after the drop in Brazilian imports that same year. In the first half of 2008, this trend was reversed and Brazil practically supplied the Argentine market.
From the second half of 2007, the most conflictive issue in this area, the final decision for which is due in August 2008, is to do with color TV sets. Manufactured in the Manaus Free Trade Zone, this product was the object of research to establish safeguard measures the result of which was the establishment of an export quota for Brazil for a 3-year period (MEyP Res. 43/05 of February 9, 2005). Quotas of 100,000 units in 2005, 169,000 in 2006, and 235,000 in 2007 were established for Brazilian exports.
Exports exceeding this quota are subject to 21.5% import duty. Plasma and LCD TV sets were excluded from the restriction. With the start of production of these TV sets in Argentina, the two countries’ private sectors signed a voluntary restriction agreement. The previous tariff position (NCM 8528.12.90), covering all color products, was divided into the following positions in 2007: NCM 8528.71.90 (CRT) and NCM 8528.72.00 (LCD/Plasma).
The safeguard expired at the start of this year, but the Argentine government set a new quota of 175,000 units up to September, while it evaluates the national industry request. The revision of the safeguard, suggesting the possibility of automatically extending it to LCD/ Plasma TV sets (NCM 8528.72.00) was opened up by Res. 25/07 of December 21, 2007.
Table 20 presents the aggregate data for this type of TV set, but it can be seen that, in 2007, it saw a drop in Argentine imports, no doubt deriving from the start of local production of LCD and plasma sets. In 2008, imports were up on the first half of 2007 and, according to statements from the Brazilian private sector, other suppliers, like China and Mexico, contributed to this result.
70 TheMACbetweenBrazilandArgentinawasthesolutionhituponbythetwolargestpartnersintheblocktoattendtoArgentina’sdemand to "institutionalize"an intra-MERCOSURsafeguard.Decision28/00of June2000haddefined theneed todiscipline theapplicationofantidumpingandcountervailingmeasuresand todefineasystem for theirgradualelimination from intrazone tradebeforetheendof2001.Subsequentdecisionsextendedthisdeadline.TheMACwasapprovedonFebruary1,2006.Thismechanismincludesthefollowingrules:consultationbetweenprivatesectors,opening-upofresearch,damageordamageriskchecks,organofappeal,etc.TheMACwasprotocolizedinLAIAandbecamethe34thAdditionalProtocoltoEconomicComplementationAgreement14(ECA14),signedonApril11,2006.ItsentryintoforcemustbesimultaneousinallcountriesandwillcomeaboutwhenthecountriesinformLAIAoftheProtocol’sincorporationintheirrespectiveinternallegislations.Asthisdemandhasnotbeenmet,theMAChasnotyetcomeintoforce.IntheambitofMERCOSUR,the43rdAdditionalProtocoltoEconomicComplementationAgreement18(ECA18)ofJune25,2003,haddefinedasystemtodisciplinethesemeasuresinthesphereofintrabloctrade,butthishasnotbeenincorporatedintothepartners’legalsystems.

113
tABle 20pRODUCTS SUBJECT TO ANTIDUMpING AND COUNTERVAILING RIGHTS,
AND DEFINITIVE SAFEGUARD MEASURES(Argentineimports)
Source:ArgentineNationalForeignTradeCommission(CNCE).PreparedusingWTAandMDICdata.
products
2006 2007 % VariationUS$ Millions US$ Millions 2007/2006
World Brazil MarketShare World Brazil Market
Share World Brazil
Ceramicsanitaryarticles 1.6 1.2 74.0% 2.4 1.6 66.5% 43.9% 29.3%
Manualsawblades 2.0 0.3 13.9% 2.3 0.4 16.1% 13.3% 31.2%
Polyethyleneterephthalate-PET
114.7 16.3 14.2% 158.1 18.7 11.8% 37.8% 14.6%
Newbicycletires 111.2 20.7 18.6% 127.2 18.9 14.9% 14.4% -8.7%
Laminatedironandsteelproducts 80.7 72.5 89.9% 183.9 120.9 65.7% 128.0% 66.7%
Transformers 10.0 7.4 74.7% 13.2 2.4 18.4% 32.7% -67.3%
Seam-weldedstainlesssteeltubing
15.4 4.5 29.0% 22.8 6.3 27.6% 48.5% 41.6%
ColorTV 168.8 59.4 35.2% 72.0 19.7 27.4% -57.3% -66.8%
Glassesandglasspitchers 12.7 6.5 51.3% 16.7 8.2 49.1% 32.2% 26.5%
products
January-June 2007 January-June 2008 % VariationUS$ Millions US$ Millions 2008/2007
World Brazil MarketShare World Brazil Market
Share World Brazil
Ceramicsanitaryarticles 1.0 0.8 80.1% 1.6 0.9 56.8% 58.9% 12.6%
Manualsawblades 1.1 0.2 21.9% 1.7 0.2 13.4% 49.5% -9.0%
Polyethyleneterephthalate-PET
56.0 5.5 9.8% 67.9 2.5 3.7% 21.3% -54.4%
Newbicycletires 30.3 6.2 20.5% 46.1 7.5 16.3% 52.0% 21.3%
Laminatedironandsteelproducts 78.7 58.7 74.6% 118.4 85.4 72.1% 50.5% 45.4%
Transformers 10.8 0.0 0.0% 21.1 18.6 87.9% 95.8% n.d.
Seam-weldedstainlesssteeltubing
12.0 3.0 25.2% 13.2 3.4 25.9% 9.9% 12.7%
ColorTV 10.9 5.2 48.0% 70.2 15.3 21.7% 547.0% 193.1%
Glassesandglasspitchers 5.8 2.7 45.4% 9.0 4.6 51.6% 53.5% 74.4%

114
E. The textile sector
Brazilian-Argentine relations in the textile sector have, for many years, been characterized by a prolonged trade dispute. The first stage was marked by the inclusion of certain products from the textile sector in the two countries’ Adjustment Regimes. Between 1995 and 1999, Argentina protected the clothing sector in the ambit of intra-MERCOSUR trade, whereas Brazil protected the woolen fabrics sector.
After the end of the Adjustment Regime, a second stage of the dispute started in 2000. The sector became the target for an array of measures adopted by Argentina to contain Brazilian imports. These included antidumping measures, especially on denim and cotton fabrics, which were gradually replaced by trade monitoring agreements, non-automatic import licensing, quotas, price agreements, and so on.
This change in trade control instruments was encouraged by the role of the Brazil-Argentina Trade Monitoring Commission. The idea behind this new dialogue mechanism was to make the technical treatment of questions relating to the two countries’ private sectors viable so as to avoid the adoption of unilateral measures that had so far been raised at the political level.
The conflict began to be closely followed by the entities representing the private sector in each country, namely, ABIT in Brazil and FIT in Argentina. These, together with their governments, negotiated the bilateral trade conditions for the following product categories:
• Denim: category subject to annual quotas;
• Acrylic yarns: group of products subject to price agreements;
• Corduroy: price control and non-automatic licensing;
• Cotton fabrics: quotas and trade control;
• Towel: control based on prices and quotas;
• Rugs and carpets: price agreements.
This exercise in bilateral understandings intensified between 2004 and 2006. There are currently no more quantitative restrictions agreements; the last (on denim) was suspended in January 2008.
Nor are there any more bilateral commitments over prices. The "price criterion" system adopted by Argentine customs is applied to any import, including those from MERCOSUR. This system sets a benchmark price for each product (usually above the market price) and requires that imports below this be taxed at double the rate of VAT and advance income tax. Brazil also applies a compulsory "floor price" system, under which importing below this limit is not authorized. This, however, is aimed essentially at imports from Asia and is not applied to purchases from other origins.
A decided improvement in bilateral relations can be seen in the sector from around 2007. Two reasons seem to have favored this change: (i) the expansion of Brazilian investment in the Argentine textile industry; and (ii) the greater awareness that the major problem for the Brazilian and Argentine sectors alike lies in the economic impact caused by rising Chinese imports.
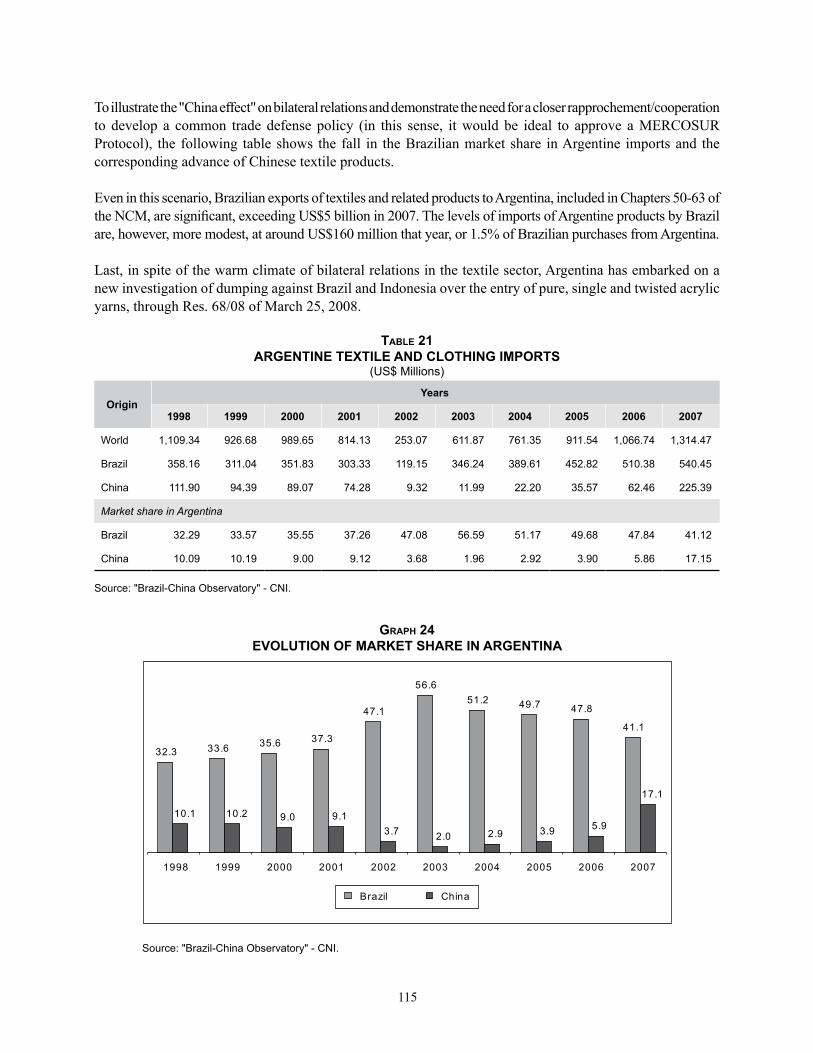
115
To illustrate the "China effect" on bilateral relations and demonstrate the need for a closer rapprochement/cooperation to develop a common trade defense policy (in this sense, it would be ideal to approve a MERCOSUR Protocol), the following table shows the fall in the Brazilian market share in Argentine imports and the corresponding advance of Chinese textile products.
Even in this scenario, Brazilian exports of textiles and related products to Argentina, included in Chapters 50-63 of the NCM, are significant, exceeding US$5 billion in 2007. The levels of imports of Argentine products by Brazil are, however, more modest, at around US$160 million that year, or 1.5% of Brazilian purchases from Argentina.
Last, in spite of the warm climate of bilateral relations in the textile sector, Argentina has embarked on a new investigation of dumping against Brazil and Indonesia over the entry of pure, single and twisted acrylic yarns, through Res. 68/08 of March 25, 2008.
tABle 21ARGENTINE TExTILE AND CLOTHING IMpORTS
(US$Millions)
OriginYears
1998 1999 2000 2001 2002 2003 2004 2005 2006 2007
World 1,109.34 926.68 989.65 814.13 253.07 611.87 761.35 911.54 1,066.74 1,314.47
Brazil 358.16 311.04 351.83 303.33 119.15 346.24 389.61 452.82 510.38 540.45
China 111.90 94.39 89.07 74.28 9.32 11.99 22.20 35.57 62.46 225.39
MarketshareinArgentina
Brazil 32.29 33.57 35.55 37.26 47.08 56.59 51.17 49.68 47.84 41.12
China 10.09 10.19 9.00 9.12 3.68 1.96 2.92 3.90 5.86 17.15
Source:"Brazil-ChinaObservatory"-CNI.
GrAph 24EVOLUTION OF MARKET SHARE IN ARGENTINA
32.3 33.6 35.6 37.3
47.1
56.651.2 49.7 47.8
41.1
10.1 10.2 9.0 9.13.7 2.0 2.9 3.9 5.9
17.1
1998 1999 2000 2001 2002 2003 2004 2005 2006 2007
Brazil China
Source:"Brazil-ChinaObservatory"-CNI.

116
f. The used or retreaded tire dispute
A variety of Brazilian resolutions and rules have banned the importing of used or retreaded tires in Brazil since 1991, a regulatory framework that has not, however, been applied to MERCOSUR. In January 2006, a panel was established in the WTO at the EU’s request, which questioned Brazil’s ban on importing used tires from Europe, while it does allow imports from MERCOSUR. The Brazilian argument, based on an environmental concern (retreaded or used tires have a less useful lifespan and become difficult-to-use waste) was accepted by the WTO, but was called on to adjust the Brazilian measure to the non-discrimination rule between countries.
On January 15, 2008, Brazil declared it would accept the WTO decision, but that it needed a deadline to do so, especially to debate gradual treatment in MERCOSUR. The aim was to define a common policy for the sector, as to extend this ban to the bloc would be incompatible with statements made by the MERCOSUR Permanent Review Tribunal. A new regime for used tires had to be created, one that should be approved by the GMC, MERCOSUR’s executive organ.
This issue came to form part of the GMC table and became controversial on the eve of the presidential elections in Paraguay. Paraguayan sales to Brazil are deemed extremely important in terms of foreign currencies and jobs, and the possibility of Brazil adopting restrictions carried great political resonance in Paraguay, only comparable to the recent discussions over Paraguayan demands to revise the Itaipú tariffs and the sale of surplus electric power quotas from that country to any destination.
Since the GMC Meeting in April 2008, Brazilian representatives have been proposing the creation of a Working Group to study a common policy on trade in used and reformed or recast goods. Brazil will accept the WTO’s decision, but alternatively proposes that a community policy be studied to be submitted to the multilateral organization in the shortest possible time.
There are no guarantees that a proposal of this nature will be accepted in the WTO. As stated in the GMC Minutes, the bloc has not yet found a way of dealing with the issue. Paraguay remains adamant about not modifying the current trade conditions.
Brazil has a deadline of December 17 to enforce the WTO ruling and the Brazilian government has been alerting its partners that, in the event of an intra-MERCOSUR understanding not being reached, the country will comply with the international demands.
It is important to remember that Uruguay and Argentina too have been in conflict since 2004 over Argentina’s ban on importing retreaded tires, with ramifications in the sphere of the Protocol of Olivos and the MERCOSUR Permanent Review Tribunal. Argentina is maintaining restrictions on used tires and its extension to retreaded tires has been the object of a complaint by Uruguay. Uruguay won the case, in line with the TRP ruling issued in April 2008.
Last, in the retreaded tires issue, Brazil approved a resolution in the Chamber of Foreign Trade (CAMEX) that will discipline its imports. In the text published in the Official Journal on September 18, 2008, Brazilian imports of retreaded tires for automobiles are limited to 250,000 units p.a., of which Uruguay will be able to export 130,000 units and Paraguay 120,000. These quotas were defined on the basis of average imported values over the last three years. As there is not record of imports from Argentina, it was unnecessary to set a limit for this country. When adopting this measure, the CAMEX took the following into account:

117
a) The negative impact on the environment and public health related to the import of reformed or retreaded tires;
b) Ruling by the MERCOSUR Ad Hoc Arbitration Tribunal of January 9, 2002, on the Brazilian import ban on retreaded tires;
c) WTO report issued on June 12, 2007, recognizing the justification for the exceptional authorization granted to Brazil to import retreaded tires from MERCOSUR in 2004; and
d) Negotiations under way in MERCOSUR to adopt an environmental management policy for special waste and a common policy on trade in tires and their waste.
G. Repercussions of the pulp mill dispute
By way of protest against the installation of two paper factories on the banks of the River Uruguay, Argentine environmentalist groups organized a roadblock for vehicular traffic on the bridges across the river during the first half of 2006.
Uruguay submitted this dispute over the "omission of the Argentine State to take appropriate measures to prevent and/or halt the obstacles to free circulation arising from the blocking of access roads in Argentine territory to the international bridges of General San Martin and General Artigas, joining the Argentine Republic and the Oriental Republic of Uruguay" to MERCOSUR’s Ad Hoc Tribunal.
The Ad Hoc Tribunal accepted the Uruguayan arguments and recognized that the roadblocks and the Argentine omission were incompatible with the commitments undertaken by the countries to guarantee the free circulation of goods and services in their respective territories. However, it imposed no sanctions or corrective measures. Argentina nevertheless submitted an appeal to the Permanent Review Tribunal, whose ruling of July 2006 expressly stated its non-acceptance.71
Although the investments in Uruguay have been made, this question became one of the greatest sources of intra-MERCOSUR conflict of recent years and gave rise to complaints about the lack of Brazil’s role in the case and to constant debates in the GMC about the barriers to the free circulation of goods and the flimsiness of the dispute settlement instruments in MERCOSUR.
Perhaps the economic impact of this conflict has not been thoroughly evaluated, but its political repercussions were significant in the subsequent discussions on asymmetries and the Uruguayan demands for more compensation for the "losses" deriving from the integration process.
H. final remarks
The Common Automotive Policy between Brazil and Argentina was, without a doubt, the great sectoral issue of the period. The economic importance of intraindustrial relations and Argentina’s concern to maintain and
71 TheconflictisalsobeingresolvedintheInternationalCourtofTheHague.

118
expand investments are aspects that explain the priority of the negotiations, the negotiators’ effort, and the commitment of both countries’ private sectors. It is understandable that this negotiation will influence the bilateral agenda and in that of MERCOSUR itself.
As mentioned at the start of this chapter, the context of greater growth and greater trade flows reduced the traditional picture of conflicts, in spite of the growth of the Brazilian trade surplus with the other partners, mainly Argentina. The increase of the surplus accumulated by Brazil can be explained by greater Brazilian competitiveness in industrial products, Argentina difficulty in maintaining a diversified export structure, and the reduced share of products subject to trade restriction measures (with the exception of the automotive sector) in trade as a whole.
Conflict levels were lowered by the effects of the trade monitoring and administration mechanisms, the strong performance of activity levels in the two countries, and the growth of Brazilian direct investment in various economic sectors in Argentina.
The bilateral trade data show, however, that the products monitored by the Brazil-Argentina Bilateral Meeting are those that display a loss of Brazilian market share and import deviations to the benefit of other suppliers. It is worth remembering that, from now on, this mechanism will diversify its agenda, with the treatment of common issues relating to the world market, e.g. trade with China, in order to continue to play an important role in the bilateral sphere.
Last, the depreciation of the real against the dollar deriving from the world financial crisis of September-October 2008 and its effects on parity between currencies may impact on the trade climate within MERCOSUR. The prospect of greater expansion of the Brazilian trade surplus may stimulate the escalation of sectoral disputes between the partners.

119
cHAPTER 5. THE ExTERNAL AGENdA
There has been little progress in MERCOSUR’s external agenda, despite the various negotiating fronts opened up by the bloc in recent years. Apart from the increasingly unfavorable international climate for trade liberalization movements, the bloc is facing growing difficulties in achieving the convergence of interests among its partners in terms of international integration projects.
On the one hand, Uruguay continues to seek authorization to move forward in bilateral negotiations, independently of MERCOSUR. On the other, Argentina has fewer incentives to commit itself to new trade liberalization movements. And Brazil has been concentrating its efforts on obtaining results at the Doha Round, amid criticism from certain business segments calling for results in the country’s external agenda.
In spite of the variety of initiatives under way, the only progress seen was the signing of the free trade agreement (FTA) with Israel toward the end of 2007. The negotiations with a view to a fixed preference agreement between MERCOSUR and the Southern African Customs Union (SACU) reached an end, but the agreement remained unsigned. The future of the WTO’s Doha Round, the top priority of the bloc’s trade agenda in recent years, is still uncertain.
The other regional or bilateral negotiating fronts with the EU, the Gulf Cooperation Council, India, Morocco, Egypt, Pakistan, or Mexico, made no progress. Besides these, two new negotiating fronts were opened as a result of the last MERCOSUR Summit: the FTA negotiations with Jordan and Turkey.
In the South American region, the constitution of the Union of South American Nations (UNASUR) on May 23, 2008, was announced by governments as an important step in the regional integration project. The Constitutive Treaty of UNASUR72 is quite ambitious in terms of its thematic agenda, but is vague on the subject of its members trade and economic integration. In the ambit of LAIA, the debates toward creating a Free Trade Space (FTS) is facing assorted resistance from most of its members.
A. The international climate and the strategies of mERcoSuR member countries
The significant growth of the economy and trade that dominated the international scenario from 2003 should have facilitated new trade liberalization movements. However, in spite of the proliferation of bilateral trade agreements, there was a deepening of protectionist stances and the predominance of the respective internal agendas in the formulation of the main actors’ strategies in international negotiating forums. The emergence of the new Asians economic powers contributed, on one hand, to growth in international trade, but on another, fuelled protectionism in most countries.
In the last year, the international financial crisis and the uncertainty about the extent of its effects on the world economy altered the mood of optimism and stimulated anti-globalization views.
72 TheConstitutiveTreatymustbeapprovedbytheCongresses.

120
In the USA, opinions about the need to revise US trade policy strategies are gaining ground.73 US presidential candidates are defending a review of NAFTA. The approval of trade agreements already negotiated with South Korea, Panama, and Colombia is in trouble in the US Congress. The new climate also consists of statements opposed to foreign direct investment in sectors considered strategic in the USA.
In Europe, trade policy turned to non-traditional protection instruments: technical rules such as Registration, Evaluation and Authorization of Chemicals (REACH), sanitary and phytosanitary measures such as those affecting Brazil’s meat exports, and environmental rules (for ethanol imports) are increasingly rigorous. These restrictions have getting in the way of the export of MERCOSUR products to Europe and are fuelling debate on new issues that should be part of the negotiating agendas between the two blocs, when talks are resumed.
The rise of international commodity prices has brought to the fore the issue of food security in food-importing countries and ignited the debate on the self-sufficiency in the production of agricultural products. The reduction of food import barriers would be the desired reaction, but it was not what was seen. Wariness of dependence on food imports in a context of excess demand reinforced internal production protection policies in several importer countries.
The concern about internal supply also manifested itself in food-exporting countries. Quantitative restrictions and export taxes (also known as "withholdings") were formulas used by some countries to fight the inflationary and distributive impact of rising international prices. This was the case with Argentina (see Chapter 1, Box B).
Divergent strategies
Faced with the international context and the evolution of their internal macroeconomic climate, MERCOSUR countries have been adopting divergent trade policy strategies. Such differences, which had already become apparent in Uruguay’s repeated requests to negotiate separate bilateral trade agreements with countries outside the bloc, were also became clear at the WTO mini-ministerial meeting in Geneva in July 2008, when Brazil and Argentina took opposite stances.
In the case of Argentina, rising agricultural prices brought an additional difficulty for its anti-inflationary policies. The increase in export taxes (subsequently rejected by the Congress) generated a degree of concern among the other MERCOSUR partners. In this context, the trade negotiations aiming to obtain better access conditions (the reduction of import tariffs and/or extension of quotas) and reduce subsidies in international agricultural markets are becoming less relevant. Likewise, the Argentine government was less willing to make concessions in trade liberalization of industrial goods.
The Brazilian government, for its part, is seeking a bigger role in trade negotiations in response to the demand for results in trade policies from diverse economic sectors. The negotiations for the WTO’s Doha Round became central to Brazil’s trade policy agenda and the government mobilized much of its negotiating capacity to act in the multilateral forum. At the same time, the Brazilian authorities tried to highlight Brazil’s desire to move forward with the trade negotiations on a variety of fronts, from the EU to the Middle East, India, and South Africa.
73 ThearticlesbyLawrenceSummers[2008a]and[2008b]showthatthisdebateisgaininggroundandinvolvesolddefendersofthebroadtradeliberalization.

121
After failure to obtain an agreement on trade liberalization modalities at the WTO’s mini-ministerial meeting in July 2008, many analysts and representatives of the business world74 argued that Brazil made the mistake of centering its efforts in multilateral negotiations. In line with this evaluation, the Brazilian government relegated the negotiation of regional or bilateral trade agreements with important markets that could guarantee better access conditions for Brazilian products. It is true that the Doha Round was at the top of Brazil’s trade policy priorities, but that did not mean losing the desire to move forward in regional or bilateral trade negotiations.
The differences between the Brazilian and Argentine stances, which had already manifested in the negotiations between MERCOSUR and the EU, were again in evidence in the reaction of the two countries to the document submitted by WTO General Director, Pascal Lamy, at the mini-ministerial meeting of July. While Brazil expressed its support for the document, the Argentine authorities submitted objections.75These differences reignited the debate about the viability of maintaining the bloc’s common trade policy or the advisability of introducing flexibilities to allow member countries to accommodate their different interests.
The Uruguayan President, Tabaré Vázquez, called, in September 2006, for flexibility in the external negotiations via the incorporation of bilaterality, either in the framework of the joint negotiations or by allowing individual negotiations.76From then on, the issue has been back on MERCOSUR’s agenda at the insistence of Uruguay.
The Uruguayan request, which has the support of Paraguay, has not been welcomed by the governments of Argentina and Brazil. To compensate for this, the Brazilian government has gone to some lengths to design a Strategic Plan to Overcome Asymmetries in MERCOSUR. The Plan includes: (1) actions for the integration of the economies of countries with no maritime coastline; (2) actions for the development of infrastructure; (3) actions for the support of competitiveness; (4) market access; (5) actions in the institutional framework, and (6) the definition of community instruments.
The Plan was discussed again at the GMC Meeting of June 2008, but was not approved.77The Uruguayan claim appears in the market access chapter: the possibility to starting trade negotiations separately and bilaterally. This claim was responsible for lack of approval for the Plan so far. At the GMC Meeting, the countries undertook to pursue work on this issue in the second half of 2008.
The debate about flexibility in MERCOSUR’s common trade policy will continue in the foreseeable future. According to Peña [2008], two types of flexibilities could be considered: (i) authorization for each partner to negotiate with other countries or blocs bilaterally, which meets the Uruguayan demand, or (ii) the possibility that, in MERCOSUR’s joint negotiations with other countries or blocs, each partner will adopt differentiated commitments. The latter option ha already been put into practice in some of the bloc’s negotiations, e.g. the agreement between MERCOSUR and the Andean Community of Nations (CAN).
74 SeeJornal Valor Econômico[4-08-08],p.2.75 In a declaration of July 30, at theWTOTrade Negotiations Committee in Geneva, ForeignMinister, Jorge Enrique Taiana,expressedArgentina’sobjectionstothe"LamyPackage".AccordingtoTaiana,itis"itisclearlynecessarytointroducemodificationstothetextstoapprovemodalities.Inparticular,thetextonnon-agriculturalmarketsaccess(NAMA)requiresstructuralchangessothatitcan serve as a basis for negotiation".Seethedeclarationsathttp://www.mrecic.gov.ar.76 Foradetaileddescription,seeMERCOSUR Report 11[2006],pp.86-88.77 MERCOSUR/GMC/MINUTES02/08ofthe72ndGMCRegularMeeting,June19and20,2008.

122
b. The doha Round: recent movements and impacts for mERcoSuR
In the first half of 2008, there was intense activity among trade negotiators at WTO headquarters in Geneva to reach an agreement on methods and modalities for the trade liberalization of agricultural and industrial products before the vacation period in the northern hemisphere. These efforts were based on the objective of reaching a solid agreement in the issues deemed crucial to the Round before the presidential elections in the USA.
An agreement on the methods and modalities for the liberalization of trade in goods that year would pave the way for the conclusion of the Doha Round in 2009, when it would be under a new administration in the USA. This is due to the fact that the crucial issues, which are the focus of the main negotiations between the member countries, would be already defined. In view of the fact that this agreement was not reached, the beginning of a new US government, the elections in India, and the changes of leadership in the European community in 2009, will all combine to make the general climate rather unconducive to the Round’s conclusion next year.
Many analysts felt that the significant increase in the international prices of agricultural products over the last year and the debate on food security could facilitate a trade liberalization agreement. In this context, food-importing countries might be more willing to reduce their tariffs in order to cut costs and, in the countries that subsidize agricultural production, there would be less demand for government assistance. The concern to protect internal production prevailed, however.
Assembled in Geneva from July 21 through 29 last, the trade ministers of more than 30 member countries of the WTO were close to achieving consensus on a package of trade liberalization commitments submitted by WTO Director General, Pascal Lamy. The differences between the USA and India in terms of a special safeguard mechanism for the import of agricultural products in DGCs led to the breakdown of the initiative, according to the announcement of July 29 (WTO [2008]).
Differences blocking the agreement
Although the Doha Round’s agenda is more comprehensive, throughout 2008, the negotiations in Geneva focused on defining liberalization modalities for agricultural and industrial products. The balance of trade liberalization efforts that countries’ should carry out in these two areas is key to the conclusion of the Round.
The balance is not only necessary between the two negotiation areas, but also within each of them. For example, the USA has a pro-liberalization stance regarding the reduction of import tariffs for agricultural products, but seeks to commit itself with the lowest possible level of subsidy reduction for its internal production. India, on the other hand, is interested in the reduction of US subsidies to local producers, but refuses to accept significant tariff reduction commitments for agricultural products, using the argument that it needs to protect local family agriculture.
The differences between the USA and India over the special safeguard mechanism for agricultural products were responsible for the suspension of the ministerial meeting in Geneva in late July. In 2004, the member countries agreed to incorporate on the negotiating agenda the implementation of a safeguard mechanism to protect the farmers of poor countries from a substantial increase of imports.
This mechanism foresees the automatic raising of tariffs, above the level consolidated in the Uruguay Round in the event of a steep rise in imports. The differences centered on how to define the growth rate of

123
imports, on the basis of which the application of the mechanism would be "triggered", and the percentage rise in import tariffs.
The proposal that was being discussed when the talks were suspended, the "Lamy Package", envisaged that DGCs could only raise their tariffs above the consolidated level when imports grew 40% or more above imports in the last three years. This growth would act as the trigger that would allow consolidated tariffs to be raised by as much as 15% above the consolidated tariff, or 15 p.p., whichever is higher.
The US representatives claimed that a 40% increase in imports was the lowest rate they could accept (as their initial position was 60%). In turn, on behalf of the G-33 (Group of DGCs importing agricultural product), the delegates from India insisted on the percentage being 10% and on the limit for the tariff increase being 30% above the consolidated tariff.
After some efforts at negotiation, India agreed to the trigger being increased to 15%, but the negotiations went no further. As the positions were still far-removed from each other, the WTO’s Director General, whose objective it was to preserve the consensus obtained in other issues on the agenda, decided to suspend the negotiations.
This was an important issue for MERCOSUR countries, which joined forces to prevent the G-20 adopting a safeguards proposal that would damage the bloc’s exporter sectors. MERCOSUR exports to DGCs have growing considerably in recent years and now represent over 50% of total agricultural exports. The adoption of a safeguard mechanism allowing the increase of tariffs to levels higher than those consolidated in the Uruguay Round would have been a decision radically against MERCOSUR’S interests.
The "Lamy Package"
The presidents of the Agriculture and NAMA Negotiating Groups, on July 10, revealed a final draft of the texts that were to serve as the basis for the work of the high level representatives and ministers at the meetings, which would be held in Geneva before the end of the month. These documents incorporated significant breakthroughs in several issues, but still left open serious questions to be defined by ministers.
A few days into the ministerial meeting, pessimism dominated the negotiating climate in Geneva and there was no progress in the talks. With the intention of contributing to the convergence of positions, the WTO’s Director General presented a package of commitments to a small group of ministers comprising the G-7. The package contained some of the main points for which it was necessary to reach a definition in the texts on agricultural and non-agricultural (NAMA) products. The G-7 was made up of delegates from Australia, Brazil, China, the USA, India, Japan, and the EU.
Although the seven countries’ representatives were dissatisfied with certain specific aspects of the package, only India, among all the G-7 members, immediately raised strong objections to Pascal Lamy’s proposal. However, the country did not refuse to go on discussing the proposal. Brazil was the first country to announce its backing of the document. Argentina was not part of the G-7, but Foreign Minister Jorge Taiana said his government would reject the "Lamy Package".
The document presented by Lamy tried to strike a balance between the offensive and defensive interests of the various actors and to adjust the various different sensitivities. The special agricultural safeguard

124
mechanism was the issue that sparked the disagreement that led to the talks being suspended. But there were also difficulties in connection with other issues. These included the value of distorting agricultural subsidies allowed the USA, the anti-concentration clause for sensitive products in industrial goods, and the requirement to participate in sectoral agreements.
Box iMAIN pOINTS OF THE "LAMY pACKAGE"
1. Agricultural goods
• Overall trade-distorting support (OtDS)
i.USA:US$14.4billion(80%cutonwhatwasconsolidatedintheUruguayRound).
ii.EU:€22billion(70%cut).
• Marketaccess
i.70%reductionforthehighesttariffs(above75%)chargedbytheDDCs.
ii.Fornon-sensitiveproducts,DDCswillhave toconsolidateamaximum tariffof100%andmayexercise thisceilingfor1%oftarifflinestooffsetincreasesgreaterthanexpectedintariffquotasforsensitiveproducts.
iii.Sensitiveproducts
1.DDCswillbeentitledtodesignateupto4%oftarifflinesassensitiveproductsandanadditional2%ascompensationforsubsequentliberalization.
2.BroadeningoftariffquotasforsensitiveproductsfromDDCsequivalentto4%ofdomesticconsumption.
iv.Specialproducts:
*DGCsmaynominateupto12%oftarifflinesas"productsspecial".Inthisgroupofproducts,5%oftarifflinescouldbeexemptedfromtariffreduction.
*Thegroupofspecialproductswillexperienceanaveragetariffcutof11%.
*Forrecentlyaccededmembers(RAM)oftheWTO,thenumberofspecialproductswouldbe13%,withanaveragecutof10%.
• Special safeguards for DGCs
i.Triggerforautomaticapplicationofsafeguards:40%increaseofimportsonthevalueofthelastthreeyears.
ii.15%or15p.p.increaseonthecurrentconsolidatedtariff,whicheverishigher.
iii.2.5%limitontarifflinesthatmightexceedcurrentlyconsolidatedlevelsinagivenyear.
• Safeguards for DDCs
i.Eliminationofspecialagriculturalsafeguard(SSG)fromamaximumof1%oftarifflinesuntiltheirtotaleliminationin7years.
ii.Itwouldnotbepermittedtoexceedthisconsolidatedtariffduringtheperiod.
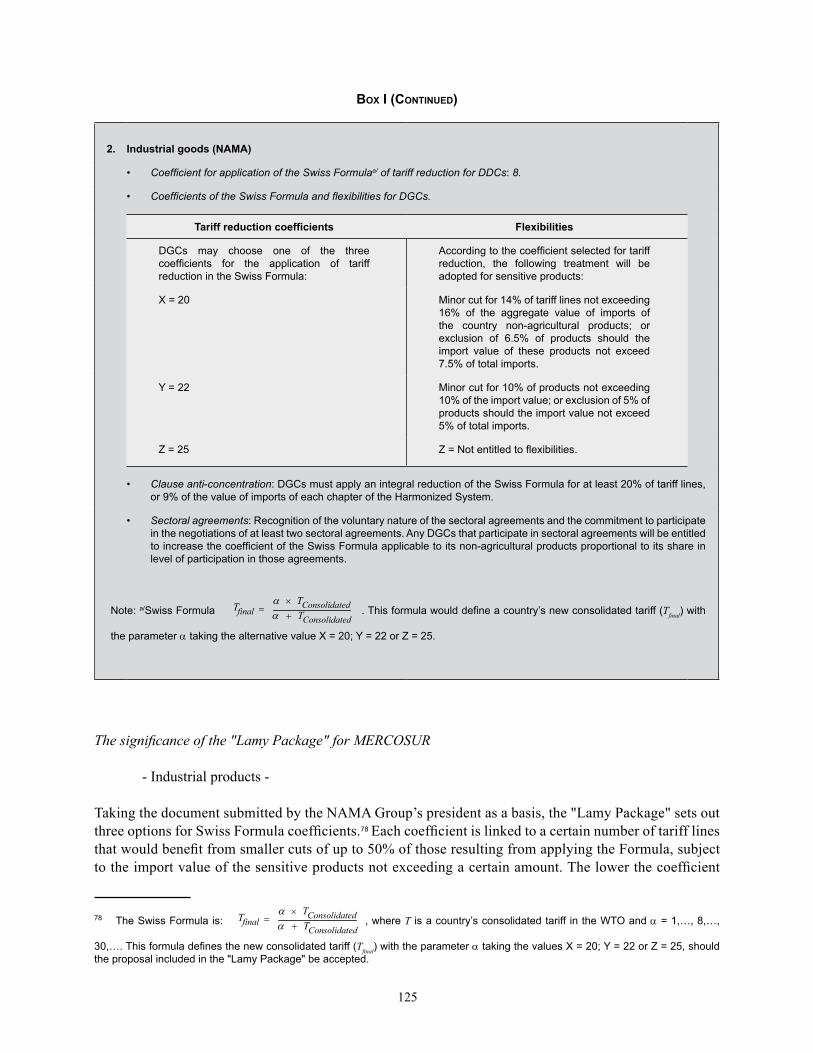
125
Box i (Continued)
2. Industrial goods (NAMA)
• CoefficientforapplicationoftheSwissFormulaa/ of tariff reduction for DDCs:8.
• CoefficientsoftheSwissFormulaandflexibilitiesforDGCs.
Tariff reduction coefficients Flexibilities
DGCs may choose one of the threecoefficients for the application of tariffreductionintheSwissFormula:
Accordingtothecoefficientselectedfortariffreduction, the following treatment will beadoptedforsensitiveproducts:
X=20 Minorcutfor14%oftarifflinesnotexceeding16% of the aggregate value of imports ofthe country non-agricultural products; orexclusion of 6.5% of products should theimport value of these products not exceed7.5%oftotalimports.
Y=22 Minorcutfor10%ofproductsnotexceeding10%oftheimportvalue;orexclusionof5%ofproductsshouldtheimportvaluenotexceed5%oftotalimports.
Z=25 Z=Notentitledtoflexibilities.
• Clause anti-concentration: DGCsmustapplyanintegralreductionoftheSwissFormulaforatleast20%oftarifflines,or9%ofthevalueofimportsofeachchapteroftheHarmonizedSystem.
• Sectoral agreements: Recognitionofthevoluntarynatureofthesectoralagreementsandthecommitmenttoparticipateinthenegotiationsofatleasttwosectoralagreements.AnyDGCsthatparticipateinsectoralagreementswillbeentitledtoincreasethecoefficientoftheSwissFormulaapplicabletoitsnon-agriculturalproductsproportionaltoitsshareinlevelofparticipationinthoseagreements.
Note:a/SwissFormula
ConsolidatedConsolidated
final TTT
×
.Thisformulawoulddefineacountry’snewconsolidatedtariff(Tfinal)withtheparameterαtakingthealternativevalueX=20;Y=22orZ=25.
The significance of the "Lamy Package" for MERCOSUR
- Industrial products -
Taking the document submitted by the NAMA Group’s president as a basis, the "Lamy Package" sets out three options for Swiss Formula coefficients.78Each coefficient is linked to a certain number of tariff lines that would benefit from smaller cuts of up to 50% of those resulting from applying the Formula, subject to the import value of the sensitive products not exceeding a certain amount. The lower the coefficient
78 TheSwissFormulais:
ConsolidatedConsolidated
final TTT
×
,whereT isacountry’sconsolidatedtariff intheWTOandα=1,…,8,…,30,….Thisformuladefinesthenewconsolidatedtariff(Tfinal)withtheparameterαtakingthevaluesX=20;Y=22orZ=25,shouldtheproposalincludedinthe"LamyPackage"beaccepted.

126
selected, the higher the reduction in tariffs and also the number of products that the countries could classify as sensitive.79
Table 22 shows the impact on the CET of MERCOSUR80 of the three options submitted by Lamy as the coefficients for the Swiss Formula. For the CET, the application of the three coefficients clearly produces very similar results in terms of tariff reduction.
tABle 22SIMULATION ExERCISE:
EFFECT OF AppLICATION OF THE "LAMY pACKAGE" ON MERCOSUR(Tariffreductioninnon-agriculturalgoodsexcludingsensitiveproducts)
Statistics CETSwiss Formula Coefficient
x = 20 Y = 22 Z = 25
Average 10.77 11.74 12.41 13.34
Maximum 35.00 12.73 13.51 14.58
Averagetariffreduction(%) 59.09 56.81 53.71
Tarifflinesaffectedbythereduction 4,953 4,953 3,441
Note:Totalitems:8,849.(HS2002.December2006).
Source:PreparedbyNegint/CNIbasedonMDICdata.
Without considering sensitive products, which will see half of the tariff cut determined by applying the Swiss Formula, the maximum consolidated tariff81 would become 12.73% for coefficient 20 and 14.58% for coefficient 25. The maximum tariff consolidated by the members of MERCOSUR in industrial goods is currently 35%. The average consolidated tariff would become 11.74% in the first case and 13.34% in the second.
This means that, in either option, the average tariff consolidated in the WTO would be even higher than the average CET of 10.77%. But there are various products that would see a significant tariff reduction, as the maximum ceiling would be cut by over 20 p.p. The deadline for implementation of the tariff reduction by DGCs would be 10 years from the conclusion of the Round.
For various products, the new consolidated tariff would continue to be higher than the CET, but for 4,953 products, or 56% of total tariff lines, there would be a reduction in the applied tariff. Interestingly, the number of products subject to tariff cuts is the same for coefficients 20 or 22.
79 ForadetaileddescriptionoftheelementsoftheNAMAnegotiationandthecharacteristicsoftheSwissFormula,seeMERCOSUR Report 11[2006],pp.103-105.80 ThetariffconsideredinthisexerciseisMERCOSUR’snominalCET,excludingexceptions.81 TheMERCOSURpartnersconsolidatedtheirowntariffstructuresintheWTO.ThetariffconsolidatedbyBrazilwastakenforthepurposesofthisexercise,whichinanycaseisfairlysimilartothatoftheothercountriesintheblock.

127
Graph 25 shows the average tariffs by chapter of the Harmonized System and consolidated by Brazil in the Uruguay Round (dark gray line), the CET (light gray line), and the new tariff consolidated in the WTO that would result from applying the Formula with coefficient 20 (black line). This might possibly be the coefficient chosen for MERCOSUR countries, as the difference in the impact on tariff levels in relation to coefficient 25 is small and the coefficient 20 option means that 14% of total tariff lines can be designated as sensitive products.
GrAph 25BRAZILIAN TARIFFS COMpARED CONSIDERING THE AppLICATION OF THE SWISS FORMULA,
x = 20, ExCLUDING SENSITIVE pRODUCTS
0
5
10
15
20
25
30
35
40
03 15 23 26 28 30 32 34 36 38 40 42 44 46 48 50 52 54 56 58 60 62 64 66 68 70 72 74 76 79 81 83 85 87 89 91 93 95 97
Chapters of Harmonized System
Average tariff consolidated at the Uruguay RoundAverage CETa/ Average resulting tariff of X = 20
Note:a/CET,position:December2006(INC2002).
Source:MinistryofDevelopment,IndustryandForeignTrade(MDIC).
If the MERCOSUR countries were to opt for coefficient 20, they would be entitled to include 1,238 items on the list of sensitive products, which would see a cut equal to half that set by application of the Formula. The value of imported products included on this list may not exceed 16% of each country’s total imports. This means that, when considering sensitive products, the maximum CET for industrial products would fall from the current 35% to 23.86%, rather than 12.73% resulting from the full and comprehensive application of the Formula’s cut.
Throughout 2008, MERCOSUR negotiators sought to increase the number of products that might make up the sensitive list and requested special treatment for the bloc as a Customs Union. The proposal, which came to be incorporated in one of the preliminary documents of the NAMA Group’s President, consisted of

128
submitting a single list of sensitive products for MERCOSUR, as intrabloc trade would be excluded from the calculation of the aggregate value of the bloc’s imports.
The objective was partly to place a larger number of articles on the list of sensitive products. If the concentration of Argentine imports in certain products that might make up the sensitive list is taken into account, the percentages of the maximum import value up for discussion represented too low a ceiling to include the country’s sensitive products.
In response to the difficulties of obtaining consensus over the proposal, negotiators began to work toward enabling the four MERCOSUR countries to submit a common list and use the Brazil’s volume of imports as a benchmark to calculate the limit of sensitive products. The objective was to include a larger number of products on the sensitive lists of Argentina, Paraguay, and Uruguay, as Brazil’s volume of imports is very much higher than the bloc’s other partners. The proposal was welcomed by the NAMA Group’s President in the document released on July 10, which was the last draft published before the mini-ministerial meeting in Geneva.
To prevent DGCs including all products in any given sector on the list of sensitive products, European negotiators insisted on an anti-concentration clause. This clause would define a ceiling for products that could be considered sensitive in the same chapter of the HS.
The "Lamy Package" proposes that at least 20% of tariff lines or 9% of import value in any given chapter be subject to the full cut set by the application of the Swiss Formula. The European negotiators demanded significantly higher percentages than had been incorporated in the document. This was one of the points that focused the negotiators’ attention in the last months.
Another highly sensitive issue for MERCOSUR is sectoral agreements to reduce and/or eliminate tariffs on industrial products.82 As from 2003, US negotiators have insisted on including sectoral agreements as a central modality to reduce tariffs on industrial goods. But faced with resistance from various DGCs, it was agreed to make adherence to these agreements voluntary.
The Lamy document recognizes the voluntary nature of participation in the agreements, but includes an obligation to participate in negotiating at least two sectoral agreements. In other words, under the proposal, a country could participate in the negotiation without committing to signing the agreement. This alternative may constitute a risk, as a country relevant to trade in a given sector could be pressed to sign the sectoral agreement at the end of the negotiations in which it was participating.
These two issues (the anti-concentration mechanism and sectoral agreements) were promoted at the negotiations by pressure first from the European and second the US business sectors. For the Europeans, the main question is to prevent some more export-oriented sectors being integrally incorporated on the sensitive products lists of DGCs with a significant domestic market. MERCOSUR is concerned to maintain the highest possible degree of freedom in the composition of its sensitive products lists.
The US business sector, for its part, sees in sectoral agreements the opportunity to obtain effective access to DGCs’ markets, with the total elimination or a considerable reduction of import tariffs in export-oriented sectors. Most DGCs have no interest in sectoral agreements for industrial products. Brazil might be interested in an agreement for, say, the ethanol sector. But ethanol is considered agricultural in the WTO
82 Althoughvoluntaryinnature,suchagreementsaimedtoeliminateorreducetariffsincertainsectorsinadditiontothecutsestablishedbyapplyingtheSwissFormula.AmongthesectorsofinteresttotheUSAarechemicals,forestryproducts,andelectronicproducts.

129
negotiations and does not belong to the products negotiated in the framework of NAMA, where sectoral agreements are discussed.
- Agricultural products -
In the area of agriculture, the "Lamy Package" submitted proposals for the main issues on the agenda: the reduction of internal support measures, export subsidies, access to DDCs and DGCs’ markets, including special products. There was also progress on other issues, like trade liberalization for tropical products, bananas, and the treatment of preference erosion. The main issues pending resolution were to do with setting the intraquota tariff and tariff capping, as well as the reduction of subsidies, specifically for cotton, the creation of tariff quotas for certain products (including ethanol), and geographical indications.
As well as the special safeguard mechanism described earlier, the definition of the cutting of subsidies for production in the USA was among the main controversies of the "Lamy Package". The Lamy document incorporates a ceiling of US$14.5 billion for total internal aid, whereas the last US proposal was US$15 billion and the G-20 insisted it being US$13 billion.
In 2007, the value of subsidies for internal production in the USA was just US$8 billion, given the high level of international agricultural commodity prices. By 1999, however, this amount had reached US$24.2 billion. For the representatives of the Brazilian agricultural sector, defining caps by product was more important defining the total value of subsidies.
According to estimates by the Institute for Studies of International Trade Negotiations (ICONE),83 looking at just three products (ethanol, beef, and poultry), earnings for Brazilian agriculture could reach US$4.9 billion. These earnings, catered for by the parameters of the "Lamy Package", would be concentrated in US and European markets, because, according to ICONE’s evaluation, the increased access to DGCs’ markets would be not very significant. Although the Brazilian sector agricultural felt that this was a modest result, it supported the government’s decision to accept the "Lamy Package".
Brazil raised the question of ethanol as being fundamental in reaching an agreement in the Doha Round. The USA showed no willingness to negotiate the rate of US$0.54 per gallon of the product imported, and argued that this value is not defined with an import tariff, but would constitute a levy to be included in "other rates", and there would therefore be no reason to negotiate it in the WTO. For Brazil, however, the Round’s exclusion of ethanol is unacceptable. The EU, for its part, would be willing to create a tariff quota for ethanol.
The assessment of the "Lamy Package" as expressing a reasonable balance of concessions and the idea that it was important to make the most of this window of opportunity to save the Doha Round led to the Brazilian government lending its support to the document.84
The Argentine government’s assessment was different. For the Argentine negotiators, the earnings from the cuts in subsidies and agricultural market access would be insignificant and would demand an effort of trade liberalization in industrial products, which the country is not willing to implement.
83 SeeICONE: http://www.iconebrasil.org.br.84 The"LamyPackage"presentednocommitmentsforspecificproductsanditsapprovalwouldnotthereforesolvethequestionof ethanol. However, information circulating in the press indicates that this issue had been the subject of negotiations betweenrepresentativesfromBrazilandothercountriesforsometime.

130
Apart from trade liberalization for agricultural and industrial products, the Doha Round’s agenda includes other issues such as rules (antidumping measures, countervailing duties, and subsidies) and trade and services facilitation. Significant progress in the Round is not expected in these areas, with the exception of services, where countries should raise consolidation levels in their sectoral commitments. The predominant expectation is that, once the main questions in the areas of agriculture and industrial goods have been resolved, the issues pending in other areas would be quickly solved.
The Doha Round’s prospects
Immediately after the announcement of the collapse of the mini-ministerial meeting and the traditional exchange of allegations that characterizes such failures, several of the main actors hastened to express their interest in preserving the progress made at the time in Geneva. To do this it would be necessary to resume the talks as quickly as possible.
In the following weeks, intense activity was seen from the WTO’s Director General and certain leaders, including negotiators from the USA, Brazil, and Australia. It is hoped that the high officials will meet again in Geneva after mid-September and that the most important progress will be seen three or four weeks after that.
The haste to resume the negotiations is based on the observation that it is vital now to move forward toward an agreement on modalities that will be a good basis for concluding the final agreement at the start of next year. Otherwise, it will be necessary to wait another two or three years before it is possible to resume the talks.
The elections in the USA this year, in India next, and the change of leadership in the European Commission in 2009 will stand in the way of any significant progress over next two years. They are key actors in the talks and will probably not be in a position to or will not be interested in returning to the negotiating table until 2010.
More recently, the intensity and ramifications of the US financial crisis, which are beginning to affect the real economy not just of DDCs, but also of DGCs, have added new elements of uncertainty to the international panorama and blurred predictions about the fate of the Doha Round.
In this period, it will be difficult to keep the Doha Round’s agenda, which in many people’s minds is already obsolete, intact. The negotiating mandate defined in 2001 reflected an international trade reality very different from the one that will predominate at the start of next decade. The possible inclusion of other issues in the agenda will tend to increase the complexity of the negotiations even further.
c. Latin American integration
In the 1990s, the efforts of South American integration centered almost exclusively on trade. The main initiatives were MERCOSUR and the negotiation of bilateral agreements between MERCOSUR members, and Bolivia, Chile, and, more recently, the CAN.
The difficulties of moving forward in the process of subregional integration and intraregional trade liberalization have risen in recent years. The agenda of the MERCOSUR Customs Union encounters recurrent difficulties in moving forward and the prolonged negotiations between MERCOSUR countries and

131
the CAN were signs of growing internal resistance to move beyond certain limited agreements previously signed in the ambit of LAIA.
In recent years, the priority assigned during the ten years from 1990 to the trade agenda in intraregional relations was eventually criticized by various social actors and the governments of various different countries in the region. At the same time, other South American countries deepened their option for integration with the international economy, and sought partnerships through fixed trade agreements with countries outside the region. The growing differences in trade policies and national investment regimes have led to a virtual paralysis of integration and trade liberalization initiatives in the region in recent years.
More recently, signs of macroeconomic instability are resurfacing in a few countries, a trend that contrasts with the favorable picture seen across South American countries up to 2006. In a general way, although the region’s economies are continuing to grow at significant rates, inflationary pressures in certain countries are disrupting the prospects of macroeconomic evolution, which had been favorable until then. These pressures add a new factor of uncertainty to concerns about the impact of the financial crisis and rising commodity prices on the maintenance of the region’s economic growth (see Chapter 1).
In contrast with the unfavorable climate for trade liberalization initiatives in the region, the flows of trade and intraregional investments have been taking on ever greater importance. Economic relations are expanding beyond traditional trade and incorporating trade in services and direct investments, fuelled by Brazilian companies’ recent trend toward internationalization.85
These investments are geared toward a growing number of countries and translate an interesting diversification in terms of the sectors and companies involved.
A deterioration in the macroeconomic climate in the region through inflationary pressures and the worsening of the international financial crisis may not only affect trade flows, but also the recent flows of direct investment by Brazilian companies in neighboring countries. This would be particularly true should this decline be accompanied by increased uncertainty for foreign investors in terms of regulations, as has been occurring in certain countries in the region.
Under these conditions, it has been difficult for more ambitious economic integration projects to do well. After a long period of negotiations, UNASUR had difficulty in May 2008 incorporating ambitious economic integration objectives. The project added a significant number of issues and watered down economic integration objectives. In the sphere of LAIA, the debates surrounding the creation of an FTS are showing no progress and reflect divergent views about the model of regional integration desired by the various member countries.86
85 AFUNCEXstudybyRobertoIglesiasattherequestofBrazil’sNationalConfederationofIndustrypresentsdetailedinformationabouttherecentflowofBrazilianinvestmentsinSouthAmericaandincludesrecommendationstostimulateit.86 TheCenterforIntegrationandDevelopmentStudiesorganizedajointtaskforcefor25membersfromvariousdifferentsegmentstodrawupproposalsforregionalintegrationintradeandinvestment,infrastructureandtransportservices,energyandclimatechange.Thedocumentfromthisinitiativecanbeaccessedat:http://www.cindesbrasil.org.

132
UNASUR incorporates comprehensive objectives
After more than three years of negotiations, the Constitutive Treaty of the Union of South American Nations was signed on May 23, 2008, incorporating broad and ambitious objectives. The extent of its agenda reveals the difficulties the project faced in covering the array of requirements of the various participants. Throughout these years, there was a trend to incorporate a variety of social, policies, and cultural issues, and to water down trade-related questions.
The Treaty establishes as a general UNASUR objective the building of "a space of cultural, social, economic, and political integration and union among its peoples, giving priority to political dialogue, social policies, education, energy, infrastructure, funding, and the environment, among other things, with a view to eliminating socioeconomic inequality, achieving social inclusion, and civic participation, strengthening democracy, and reducing asymmetries in the framework of strengthening the States’ sovereignty and independence".
In addition to the general objective, the Treaty includes 21 specific objectives, the first of which is "the strengthening of political dialogue between the Member States to ensure a space for coordination to reinforce South American integration and the participation of UNASUR in the international scenario".
Questions relating to economic and trade integration appear in the twelfth specific objective: "Economic and trade cooperation to achieve the progress and consolidation of an innovative, dynamic, transparent, equal, and balanced process that contemplates effective access, and promotes growth and economic development to overcome asymmetries through complementation of the South American economies, as well as the promotion of the wellbeing of all sectors of the population and the reduction of poverty".
Although the mission "to compatibilize and coordinate the initiatives of UNASUR with other effective regional and subregional integration processes in order to promote the complementarity of efforts" has been assigned to the Council of Delegates, the role of UNASUR in terms of trade issues and the convergence of subregional integration schemes is not clear.
One of the most important issues for South American economic and trade integration is the development of physical connection infrastructure. UNASUR’s fifth specific objective is to do with the "development of an infrastructure for the interconnection of the region and among our peoples based on sustainable social and economic development criteria". In this area, it will be important for UNASUR to coordinate its actions with the Initiative for the Integration of Regional Infrastructure in South America (IIRSA), which already selected 31 priority projects comprising the "Consensus-Based Implementation Agenda", several of which are under way.87
The recent political crisis in Bolivia may be the first test of UNASUR’s policy coordination capacity. Chile assumed the UNASUR PPT during the second half of 2008. Although a Presidents’ Summit was agreed for October, President Michelle Bachelet of Chile called a special meeting for September 15 to analyze the crisis in Bolivia and seek measures to help normalize the situation. In the words of the Chilean President,
87 IIRSAbegan itsworkafter theSummitofSouthAmericanPresidents in2000. In this framework,andwith thesupportof thefinancialinstitutionsthatmakeuptheTechnicalCoordinationCommitteeofIDB,CAF,andFONPLATA,IIRSAhasgivenimpetustoprojectsandsectoralprocessesgearedtothephysicalintegrationofSouthAmerica.FordetailedinformationonIIRSA,seehttp://www.iirsa.org andIDB/INTAL[2008].

133
"the central concern for all the region’s heads of State is that we want a Bolivia at peace and that it is a task for UNASUR".88
At the next regular meeting in October, the UNASUR Summit will have to address itself to approving the Action Plan, whose priority issues are energy, education, social policies, infrastructure, and funding.
Box JMAIN CHARACTERISTICS OF UNASUR
Objective • UNASUR’sobjectiveistobuildaspaceforintegrationandunioninthecultural,social,economic,and
politicalspheresamongitspeoples,givingprioritytosuchareasaspoliciesdialogue,socialpolicies,education,energy,infrastructure,funding,andtheenvironment.TheTreatylists21specificobjectives.
Decisions • TheUNASURdecision-makingsystemmustbeconsensus-based.Decisionsmaybeadoptedwiththe presence of¾ of the countries (9 countries).Any absentee countriesmust be consulted andtheiranswersbesentinthe30followingdays.Anycountrymayexemptitselffromtotallyorpartiallyapplyinganapprovedpolicyforadefiniteorindefiniteperiodwithoutthisaffectingitssubsequenttotalorpartialincorporationinthepolicies.
presidency and countries involved
• ThePPTwillbeheldsuccessivelybyeachoftheMemberStatesinalphabeticalorderfortheperiodofayear.ThepresidencypriortothesigningoftheTreatywasheldbyBoliviaandthenextcountrywouldbeColombia;however,themandatepassedtoChile.
• Argentina,Bolivia,Brazil,Colombia,Chile,Ecuador,Guyana,Paraguay,Peru,Suriname,Uruguay,andVenezuela.
Structure and powers
Council of Heads of State and Government (annual ordinary and extraordinary meetings)
• Establishing the policies guidelines, action plans, programs, and projects of the process of SouthAmericanintegrationanddecidingtheprioritiesfortheirimplementation.
• CallingSectoralMinisterialMeetings and setting upMinisterial-levelCouncils;ConvocarReunionesMinisterialesSectorialesycrearConsejosdenivelMinisterial.
• DecidingontheproposalssubmittedbytheCouncilofMinistersofForeignRelationsandadoptingpolicieslimitsforrelationswiththirdcountries.
Council of Ministers of Foreign Relations (six-monthly ordinary and extraordinary meetings)
• ProposingdraftDecisionsandpreparingthemeetingsoftheCouncilofHeadsofStateandGovernment.
• AdoptingResolutionstoimplementtheDecisionsoftheCouncilofHeadsofStateandGovernment.
• CoordinatingpositionsinissuescentraltoSouthAmericanintegration.
• Developingandpromotingpoliticaldialogueandagreementonissuesofregionalandinternationalinterest.
• Carryingout the follow-upandevaluationof the integrationprocessasawholeandapproving theannualactivityprogramandthebudget.
Council of Delegates (executive organ formed by 12 delegates, one representative from each country, with preferably two-monthly meetings in PPt territory or another location agreed upon
• ImplementingtheDecisionsoftheCouncilofHeadsofStateandGovernment,andtheResolutionsoftheCouncilofMinistersofForeignRelationsthroughtheadoptionoftherelevantProvisions.
• Preparing themeetingsof theCouncilofMinistersanddrawingupdraftDecisions,Resolutions,andRegulations.
• Compatibilizing and coordinating UNASUR initiatives with other regional and subregionalintegrationprocesses.
• Forming,coordinating,andfollowingupontheWorkingGroups,promotingcivilianparticipation,andproposingthebudgetoftheGeneralSecretariatwithdifferentiatedquotasofthecountriesaccordingtotheireconomiccapacities.
88 SeetheOGloboPortal:http://www.g1.globo.com

134
Box J (Continued)
Structure and powers
General Secretariat, based in Quito, Ecuador, secretary appointed by the Council of Heads of State and Government at the suggestion of the Council of Ministers of Foreign Relations, with a 2-year renewable mandate
• SupportingtheCouncilandthePPT,participatingwiththerighttointervene,andactingassecretaryatthemeetingsoftheorgansofUNASUR,submittingtheAnnualReport,actingasrecipientoftheAgreementsandpreparingtheirpublication,preparingthebudgetproposalandadoptinganymeasuresnecessaryfortheirproperadministrationandexecution,etc.
Note:TheSouthAmericanEnergyCouncil,createdintheMargaritaDeclaration(04.14.2007)ispartofUNASUR.
Diferences • System of direct negotiation. In the event of not finding a solution, the Council of Delegates willformulatea recommendationwithin60daysof its receipt andmaybring thedifferencebefore theCouncilofMinisters.
Effectiveness • TheTreatywillcomeintoforce30daysafterreceiptoftheninthratificationinstrument.
A Free Trade Space in LAIA: far from consensus
The objective of creating a Free Trade Space (FTS) in the ambit of LAIA89 was approved at the 13th Meeting of LAIA’s Council of Ministers of Foreign Relations in October 2004. On that occasion, it was foreseen to move forward in trade liberalization, through the transformation of fixed preference agreements existing at the time in fixed trade agreements and adopt convergence programs, as well as common rules regarding origin regime, safeguards, and dispute settlement.
At the Council’s 14th Meeting on March 11, 2008, seven draft resolutions were debated in order to move forward in building the FTS:
• Access to goods markets ("Directives for the Evaluation and Convergence Conference");
• Trade in services;
• Origin regime;
• Safeguards Regime;
• Dispute settlement mechanism;
• Action plan in favor of the less economically developed countries; and
• Guidelines for the strengthening of regional production integration, trade promotion, and a greater participation of civil society.
In spite of having detailed proposals to move ahead with the constitution of the FTS, the LAIA faced difficulties coordinating minimum consensus among its members and moving forward in that direction.
89 TheinformationontheFTSintheambitofLAIAwastakenfromtheCarta de MontevidéuNos.3and5,MERCOSURandLAIA:NewsoftheBrazilianDelegationinMontevideo,December2007andMay2008.

135
There are at least three different outlooks among member countries: (i) those that already have fixed trade agreements with the USA and advocate the FTS adopting the NAFTA model; (ii) those that advocate more modest liberalization models, including MERCOSUR, and (iii) those that have no interest in making progress in trade liberalization and advocate an alternative agenda for regional integration.
According to the information published in Carta de Montevidéu 5, the Meeting of the Council of Ministers was unable to approve the projects because Bolivia, Ecuador, and Venezuela objected to the text on market access. They argued the need to incorporate the social question in the economic-trade agenda under way in LAIA to "promote a more balanced integration process".
Faced with the differences, Ministers limited themselves to requesting that the Committee of Representatives continue working toward the formation of the Free Trade Space (FTS) and that it call a meeting of Vice ministers and a special meeting of the Council itself for the second half of 2008, occasions on which the seven draft resolutions, supplemented by a social agenda, will once again be the subject of debate.
The evolution of the debates on the FTS in LAIA faces a process similar to that seen in the draft constitution of UNASUR: faced with the difficulty of achieving a convergence of positions in economic and trade issues, it is sought to incorporate other issues in the agenda.
Other subregional negotiations
- Brazil-Mexico -
The interest in negotiating the deepening of ECA 53 (a fixed preference agreement currently governing Brazil-Mexico trade) expressed by the Brazilian business sector is one of the main novelties in trade policy-making in Brazil.90
The recent initiative of rapprochement of the Brazilian private sector is geared toward a bilateral FTA in a period of no more than ten years and represents an important change of tack in the Brazilian business position in comparison with the positions prevalent in the period leading up to the signing of ECA 53 in 2002.
At the start of the decade, when the current agreement was under negotiation, there was concern in the Brazilian private sector about the imbalance in competitiveness with Mexican producers in terms of both Mexico’s participation in NAFTA and the benefits that the foreign trade policies in force in that country gave to local producers. The perception of the Brazilian business sector has altered in the last four years and the view is currently prevalent that there are many business opportunities between the two countries and that Brazilian producers are in a position to take advantage of them.
After their entry to NAFTA, Mexico adopted an aggressive trade negotiating policy, signing fixed trade agreements with most of the DDCs and with many emerging economies. As a result, Brazilian producers
90 Forallthatitisabilateralagreement,ECA53doesnotcompromisetheobjectiveofconvergenceforanagreementinthe4+1formatbetweenMERCOSURandMexico.Asiscommonknowledge,theMERCOSURpartnersalsohavebilateralagreementswiththatcountry.Furthermore,ECA54,signedinJuly2002byMERCOSURandMexico,providestheinstitutionalframeworktomovetowardFTAs,butsofarprogressinnegotiationsonthistypeofagreementinthe4+1formathasnotbeenpossible.
136
face less favorable access conditions to the Mexican market than their main competitors, which reinforces the interest in negotiating an agreement that evens up the conditions of competition.
In November 2007, the Brazilian Business Coalition (CEB) submitted a proposal to the Brazilian government for the negotiation of an FTA with Mexico, based on expanding and deepening ECA 53, which contains the following:
* Complete tariff elimination in a ten-year maximum deadline;
* Respect for the levels of preferences already negotiated between the countries with a 30% minimum preference during the first year of the agreement;
* Automatic application of the tariff elimination timelines to all products;
* Admission of a list of sensitive products with a ten-year deadline and two year’s grace for tariff elimination. This list will respect the 5% limit of tariff items and trade value;
* Inclusion of chapters on the liberalization of trade in services and protection of investments.
In November 2007, the Minister, Celso Amorim, was in Mexico, a visit that gave rise to the following commitments agenda for 2008:
* Program of meetings of the ECA 53 Administrating Commission in the first half of 2008. The Commission’s 5th Meeting will be held in the first few months of next year;
* Meetings of the Bilateral Trade Monitoring Commission in parallel with the meetings of the ECA 53 Administrating Commission;
* 1st Meeting of the Energy Working Group in the first quarter of 2008 to deal with cooperation in biofuels;
* Visit by Mexican president, Felipe Calderón, to Brazil in the second half of 2008.
In May 2008, "the CEB proposal for a Second Generation Agreement" was sent to the Mexican private sector, starting to a process of consultations between the two countries’ private sectors. Though certain sectors of Mexican production have an interest in deepening the preferences negotiated under ECA 53, the leading business organizations and Mexican government representatives have shown little in the way of enthusiasm in negotiating a broader agreement.
While understandings for a broader agreement are not doing well, the two countries’ governments have been working on broadening the lists of products with tariff preferences under ECA 53. To do this, they have provided incentives for representatives from the two countries’ industrial sectors to already seek out sectoral agreements that can be incorporated in the existing agreement. The two governments have exchanged lists of requests and offers, based on consultations with each country’s private sector.
In the automotive sector, ECA 55’s Administrating Commission will define preferential treatment for buses and trucks under the 1st Additional Protocol to the agreement. Moreover, the preferential treatment for an

137
autoparts list already agreed between the two countries’ private sectors is under negotiation. Mexico has an interest in the accumulation of origin for automotive products.
The Mexican President, Felipe Calderón, has scheduled a visit to Brazil for November 2008, when an extension of ECA 53 is expected to be announced.
- MERCOSUR-Chile services liberalization agreement -
After over two years of negotiation, the MERCOSUR countries and Chile concluded the ECA 35 Protocol on Trade in Services in July 2008, which before that only covered trade in goods. The Protocol includes commitments on market access and national treatment in important sectors, such as professional services, services rendered to companies, engineering, distribution, transport, and tourism. This is the MERCOSUR’s first services agreement with another country.
- United States-Peru agreement: impact for the interests of MERCOSUR countries -
Given the difficulties faced by the project of regional trade integration in South America, some countries in the region are seeking to implement their international economic integration strategies by negotiating fixed trade agreements with countries outside the area, with its consequent negative effects for the trade interests of MERCOSUR partners.
In the latter months of 2007, the US House of Representatives ratified the bilateral FTA with Peru. As MERCOSUR had signed a trade liberalization agreement with Peru (ECA 58) in August 2003, the main effect of the USA-Peru agreement on the interests of MERCOSUR countries will be the erosion of the tariff preferences granted by Peru to members of the bloc. Furthermore, the bilateral FTA may affect the competitive position of service providers and investors, including those from MERCOSUR countries.
The USA-Peru agreement reproduces the FTA model adopted in recent years by the USA, with some adaptations in labor and environmental issues, the clauses of which are more demanding than they were in the previous agreements signed by that country. The agreement includes a wide variety of trade and not directly trade-related issues and adopts WTO-plus disciplines in several areas, such as services, investments, intellectual property, and competition policy.
This is an important difference with ECA 58, which is limited to the area of goods. It is difficult to claim that that difference will disadvantage MERCOSUR companies in their business with Peru but, in any event, US service providers and investors will have access guarantees and protection levels for their interests in Peru that others from the business world do not, including those from MERCOSUR.
In the area goods markets access, the main effect for MERCOSUR of the USA-Peru bilateral agreement is the erosion of preferences over time. An exercise by the National Confederation of Industry91 for Brazil92 shows that
91 Detailedinformationisavailableinthepublication,Comércio Exterior em Perspectiva.NationalConfederationofIndustry,Year17,Nos.06and07,March/April2008.92 BrazilandArgentinareceivedmoreunfavorabletreatmentintheagreementwithPeruthanParaguayandUruguay.Therefore,thecaseofBrazilillustratestheworstsituationamongMERCOSURpartnersintermsofdiscriminatorytreatmentinrelationtotheUSA.

138
much of the erosion of Brazilian preferences in the Peruvian market will take place immediately: for 78% of tariff items, the USA will receive immediate elimination, a benefit only granted to Brazil for 11% of tariff items.
tABle 23USA-pERU AGREEMENT
SUMMARY OF AGREEMENT BY ELIMINATION TIMELINE
Deadlinesproducts Total imports from peru - 2007
Items % Share US$ Millions % Share
Immediate 5,415 78 9,984 49
2years 3 0 0 0
3years 14 0 30 0
5years 830 12 991 5
7years 44 1 331 2
8years 11 0 0 0
9years 1 0 0 0
10years 596 9 4,611 23
12years 3 0 0 0
15years 6 0 1 0
Longerdeadlines 47 1 770 4
Non-locateda/ - - 3,748 18
total 6,970 100 20,464 100
Note:a/Productsnotlocatedinthetranslator.
Source:Textoftheagreement,WTA.
The products to be immediately eliminated for US exports represent practically half of Peru’s total imports, whereas the products for immediate elimination included in ECA 58 for Brazil represent just 7% of that country’s total imports. In any event, as MERCOSUR’s agreement with Peru has been effective since 2006, the MERCOSUR countries already have a degree of tariff preference in the Peruvian market.
The asymmetric treatment by Peru of MERCOSUR and US products will decrease over time. In 2014, the 74% tariffs of the tariff items will be reduced to zero for Brazil in ECA 58, whereas this will be 90% for the USA Almost 4,000 tariff items to be eliminated immediately for the USA will only be fully deregulated for Brazil in 2014, the year of much of the liberalization granted to Brazil by Peru.
The USA-Peru agreement therefore not only erodes the preferences that MERCOSUR partners enjoyed in the Peruvian market by virtue of ECA 58, but will grant privileged treatment to US products over the next few years. The same will happen to Colombia in the event of the agreement signed by that country with the USA being approved by the US Congress.
In the case of Chile, which has been adopting an aggressive of fixed trade agreement negotiating strategy with its main trade partners, the problems for the MERCOSUR countries center on the erosion of preferences because approximately 97% of products have, since 2006, already had their trade totally liberalized.

139
tABle 24ELIMINATION TIMELINES OF pERU-USA AND pERU-BRAZIL AGREEMENTS COMpARED
(Numberoftariffitemsp.a.forfullelimination)
Elimination year peru-USAperu-Brazil
2008 2010 2014 2019 Non-locateda/ total
2008 5,415 761 57 3,984 591 22 5,415
2010 3 - - - 3 - 3
2014 844 21 7 687 120 9 844
2019 652 5 492 150 5 652
Longerdeadlines 56 - - 1 51 4 56
total 6,970 787 64 5,164 915 40 6,970
Note:a/Productsnotlocatedinthetranslator.
Source:Textoftheagreement,WTA.
d. The extraregional negotiations agenda
Since the mid-1990s, MERCOSUR has been committed to various trade agreement negotiating initiatives with an extremely varied set of extraregional partners: the FTAA, the EU, India, the Southern African Customs Union (SACU), Canada, Egypt, Morocco, Israel, and countries in the Gulf Cooperation Council.
Of all these initiatives, the only FTA concluded outside South America was with Israel, at the end of 2007. A fixed preference agreement with India was also signed and more recently the finalization of the negotiations with SACU was announced. But these two agreements are very limited in scope and neither has yet come into force.
MERCOSUR-Israel: first extraregional FTA
The FTA between MERCOSUR and Israel was signed on December 18, 2007, during the MERCOSUR Summit in Montevideo. This result has great significance, as it is the first FTA outside South America in which MERCOSUR has participated. Israel, on the other hand, has already implemented various such fixed trade agreements, e.g. with the USA, the EU, Canada, and Mexico.
The strategy adopted by MERCOSUR was to negotiate and sign fixed trade agreements with the Gulf Cooperation Council (GCC) and Israel simultaneously in order to avoid susceptibilities in the area of foreign policy. However, the two initiatives displayed different dynamics and, once the differences with Israel were overcome in a scenario where the outlook with the GCC is uncertain, the agreement with Israel was signed.
It is an agreement on access to the goods market and foresees the possibility of incorporating services and investments in the future. The trade rules foreseen are: a trade liberalization program applied to goods, rules of origin, safeguards, cooperation over technical rules and sanitary and phytosanitary rules, technical and technological cooperation, and customs cooperation. The agreement foresees tariff elimination baskets in the following categories: A (immediate); B (4 years); C (8 years); D (10 years) and E (special fixed preference quota regimes).

140
Israel had difficulty liberalizing agricultural products, arguing that its internal legislation limits the concessions in the meat and dairy sectors, whose production is for the domestic market. As a result, Israel excluded 866 codes from the tariff elimination program, whereas MERCOSUR excluded 326 items. Table 25 below shows the coverage of the respective offers in terms of tariff lines. The products excluded by Israel from full liberalization are concentrated in the agroindustrial sector.
tABle 25MERCOSUR-ISRAEL NEGOTIATION
SUMMARY OF OFFERS IN THE GOODS SECTOR(December2007)
Line
OffersMERCOSUR Israel
Items1/ % Share Items2/ % Share
ImmediateElimination 2,395a/ 24.6 6,674 75.7
Eliminationin4years 927b/ 9.5 1,061 12.0
Eliminationin8years 3,447c/ 35.3 136 1.5
Eliminationin10years 2,606d/ 26.7 -
DifferenciatedRegimes 375 3.8 995 10.8
Excluded 326e/ 3.3 866e 9.8
total 9,750 100.0 8,866 100.0
Notes:1/NCMNomenclature;2/IsraelNomenclature. a/1(one)productexcludedbyBrazil;b/35;c/52;d/7-Productswithdifferentbasketsthanthebloc’soffer;e/Theseproductsdonotformpartoftheoffers.
Tables 26 and 27 below show that Israel was not a major destination for MERCOSUR partners’ exports: on average over the last two years, the country was a destination for 0.27% of the bloc’s total sales. Israel’s share in Uruguayan exports is higher than in the other MERCOSUR countries, but even so only reached 1.42% in 2006 and fell to 1% in 2007. Nor is Israel a significant supplier of products for MERCOSUR, with just 0.48% of the bloc’s total imports.
tABle 26MERCOSUR ExpORTS TO ISRAEL
(US$MillionsFOB)
CountriesIsrael World Share
2005 2006 2007 2006 2007 2006 2007
Argentina 208.409 134.854 212.511 45,756.509 54,851.046 0.29% 0.39%
Brazil 260.842 271.623 354.166 134,853.690 157,265.358 0.20% 0.23%
Paraguaya/ 13.475 16.221 8.900 1,903.530 2,122.658 0.85% 0.42%
Uruguay 25.892 56.574 44.914 3,974.683 4,494.430 1.42% 1.00%
total 508.618 479.272 620.491 186,488.412 218,733.492 0.26% 0.28%
Note:a/DatatoAugust2007.
Source:LAIA.

141
tABle 27MERCOSUR IMpORTS FROM ISRAEL
(US$MillionsCIF)
CountriesIsrael World Share
2005 2006 2007 2006 2007 2006 2007
Argentina 79.938 94.880 125.338 33,885.735 44,439.628 0.28% 0.28%
Brazil 508.102 511.499 737.270 95,822.566 126,652.030 0.53% 0.58%
Paraguaya/ 4.532 21.701 6.642 5,756.903 4,636.536 0.38% 0.14%
Uruguay 8.158 7.909 8.130 4,774.535 5,620.286 0.17% 0.14%
total 600.730 635.989 877.430 140,239.739 181,348.480 0.45% 0.48%
Note:a/DatatoAugust2007.
Source:LAIA.
MERCOSUR-EU: links with the Doha Round
The negotiations aiming at a Biregional Partnership Agreement between the EU and MERCOSUR have been at a standstill for three years. The deadlock they have reached reflects the strength of the two sides’ defensive interests, but also the perception that the conclusion of the biregional negotiations would depend on a clearer definition about what will happen in the multilateral sphere in the ambit of the Doha Round.
The main area that links the two negotiating fronts is the liberalization of agriculture. European negotiators introduced the concept of an EU "single pocket" in biregional agreements, from which come all agricultural offers for the multilateral and the biregional negotiating fronts. Therefore, the higher the offer they make in the multilateral sphere, the lower the capacity to offer concessions in the biregional sphere.
As the agricultural question is extremely important in the biregional negotiations, the "Doha variable" is a supremely influential factor in the outlook for the negotiations. Despite being a crucial element, the loss of European interest in the negotiating process with MERCOSUR is apparent. The trade policy agenda circulated by the European Commission in October 2006 includes MERCOSUR among the priorities for the negotiation of fixed trade agreements, but clearly states that the new European strategy is geared to the major emerging Asian economies.
On MERCOSUR’s side, however, the interest in these negotiations is not uniform either. The Brazilian and Uruguayan authorities made repeated statements in favor of resuming the talks. Argentina maintained more reticent stances. However, in the Joint Declaration emerging from the President Cristina Kirchner’s visit to Brazil on September 8, 2008, a paragraph was inserted that explicitly mentioned the willingness of both countries to resume negotiations with the European bloc.
In any event, the future agreement between MERCOSUR and the EU seems to be exactly linked to what can happen in the multilateral Round. As long as the outcome of the Doha talks remains undefined (either its conclusion or suspension) biregional understandings will remain on hold. After the failure of the WTO’s mini-ministerial meeting in Geneva in July 2008, there were various speculations about the possibility of restarting the talks between the two blocs immediately. But there have been no concrete initiatives in this direction as yet.

142
MERCOSUR-Gulf Cooperation Council (GCC): frustrated expectations
2007 began with the firm expectation that the FTA between MERCOSUR and the GCC would be signed at the MERCOSUR Summit to be held in January. The expectation was unfulfilled. Instead of the agreement a joint declaration was circulated stating that the regulatory part was finished, and included a chapter on trade in goods, with parameters for tariff liberalization in 8 years, as well as chapters on services and investments.
The declaration also pointed out that this group of instruments would be supplemented with annexes on dispute settlement and safeguards, and with specific commitments on services and investments. The annexes relating to the timelines for tariff elimination and rules of origin had seen significant progress and were close to being concluded. The declaration closed by stating that the agreement, with all its texts and commitments, would be concluded before June 2007.
Since then there has been no progress between in the understandings pending between the two blocs. The difficulties in the negotiations arose out of the exclusion by MERCOSUR of its product offer in the petrochemical complex. The GCC, in contrast, excluded from its offer important products for Brazilian exports to the region, such as chickens, sugar, ceramics, and iron and steel products. In a second stage, the two blocs’ exception lists were shortened. The MERCOSUR list, which was 1,600 products, was cut back to just 534 articles, 195 of which are from the petrochemical sector, which is the GCC countries’ main focus of interest. The GCC, on the other hand, excluded 222 items from its offer, including meat, fish, dairy products, tobacco, ceramics for coverings, refrigerators, and iron and steel products.
Another sensitive issue in the understandings with the GCC has to do with rules of origin. The proposal to adopt a more flexible origin regime than MERCOSUR’s, based on rules of 35% regional content (added value), brought strong reactions in the Brazilian private sector, which views the adoption of rules for tariff classification and specific rules as fundamental. Furthermore, the adoption of more flexible rules of origin for extrabloc trade than those applying in intrabloc trade makes no sense.
The dynamism of the Middle Eastern economies and the opportunities for exports of goods and services are arousing the interest of various production sectors in MERCOSUR in this agreement. However, expectations that the agreement would be concluded by 2007 were reversed in view of communication problems between the two blocs since the start of the year. As with the EU, the mood of the GCC negotiators seems to have cooled.
India and the Southern African Customs Union (SACU): modest agreements still not in force
The MERCOSUR-India Agreement defined three levels of preferences: 10%, 20%, and 100%. MERCOSUR’s list of concessions consists of 452 tariff items.93The thirteen items granted by MERCOSUR with a 100% preference margin have an applied tariff of 0% in the bloc. The other concessions were also made in products with an average MERCOSUR external tariff of between 5% and 7.5%. In India’s offer, concessions were made on 450 tariff items. The lowest preferences (10% and 20%) were applied on products with higher tariffs, while the 100% preference was granted for products with a 3.1% tariff average.
93 TheMERCOSUR concessions cover half of Brazil’s imports to India. The Brazilian Congress ratified the Preferential TradeAgreementbetweenMERCOSURandtheRepublicofIndia,signedin2004,throughtheLegislativeDecree(LD)221ofSeptember3,2008,publishedintheOfficialJournalofSeptember4,2008.AccordingtoArticle30oftheAgreement,thiswillcomeintoforcethirtydaysafterthecountriesgiveformalnoticeofthefinalizationoftheinternalratificationprocedures.

143
At an intra-MERCOSUR meeting held at the end of June 2006, a modality proposal to broaden and deepen the agreement was agreed. It includes the following: (1) the 10% and 30% preferences already existing in the Agreement would be enlarged to 30% and 50% respectively; and (2) the minimum 20% preference margin would be granted to 50% of the tariff sample by exchanging request lists. After defining the offer lists, each party’s priority products would be indicated in order to deepen the preference margins reciprocally.
In the last two years, India has steered the negotiations to broaden and deepen preferences to the entry into force of the agreement already negotiated. With the approval of the Agreement by the Brazilian Congress in September 2008, it will be possible to resume these negotiations.
The negotiations between MERCOSUR and SACU began on the basis of the understandings achieved by the Negotiating Commission of the MERCOSUR-South Africa Framework Agreement, signed on December 15, 2000, to set up a free trade area. In October 2003, the talks incorporated all SACU members (South Africa, Namibia, Botswana, Lesotho, and Swaziland).
The negotiations defined preferences for trade on 1,900 articles, 958 of which were granted by MERCOSUR under the NCM and 951 for SACU in its nomenclature. The preference margins are 10%, 25%, 50%, and 100%. In the MERCOSUR offer, a 100% preference margin was granted on almost the entire value of trade, although the CET average for these products (1.7%) is low. Something similar in the SACU offer. A significant volume of the offer was given a 100% preference margin, but it has low ad valorem tariffs or specific tariffs.
After twelve rounds of talks, the two blocs’ governments signed a Joint Communiqué in June 2008 in Tucumán, Argentina, confirming the end of the negotiations of a Tariff Preference Agreement. The governments must expedite internal procedures for its signature, which is to become effective before the end of the Brazilian presidency in MERCOSUR in December 2008. The Agreement is also to be sent to the Congresses of the countries of both blocs for approval.
The first meeting between officials of MERCOSUR, SACU, and India took place in August 2005 to study the possibility of signing a trilateral agreement on the initiative of MERCOSUR (Brazil) that would include market access to goods and services, and investments. The agreement, based on the principle of free trade, will cover 80% of trade and the next stages of studies in each country are to identify sectors and products that can make up the offers of market access.
The difficulties of moving forward in deepening MERCOSUR’s agreements with India and Southern Africa create highly optimistic expectations for this project to constitute an trilateral free trade area, a project that has been encouraged by the dialogue in the ambit of the IBSA (India, Brazil, and South Africa) initiative.
Other ongoing negotiating initiatives
The mERcoSuR-Egypt framework Agreement was signed in 2004, negotiation of which was defined in two stages: the signing of a fixed preference agreement and the subsequent free trade negotiation. There was no progress in the talks until August 2008, when, during a visit to Argentina and Brazil by the Egyptian Trade Minister, Brazilian negotiators mentioned their willingness to resume the negotiations that might lead directly to the creation of a free trade area.
The mERcoSuR-morocco framework Agreement was also signed in 2004, during King Mohammed VI’s visit to Brazil, which also included the negotiation of a fixed preference agreement, as a first step

144
toward free trade. April 2008 saw the first contact between the parties in order to move forward in the negotiations, an occasion on which the MERCOSUR representatives also expressed the desire to go straight to the constitution of a free trade area. The Moroccan authorities rejected the proposal, arguing the need to comply with the provisions of the Framework Agreement.
The mERcoSuR-Pakistan framework Trade Agreement was signed in July 2006 at the MERCOSUR Summit in Córdoba, Argentina. The Agreement set out the groundwork for preferential agreement negotiations that will progressively lead to an FTA. The agreement establishes the creation of a Negotiating Committee to exchange information on tariffs and market access conditions, criteria for the negotiation of a Free Trade Area.
The intra-MERCOSUR meeting was held in September 2006 to study a negotiating methodology similar to the one the bloc is proposing to India. Pakistan, for its part, has already sent the list of products of export interest (1,024) to improve MERCOSUR market access conditions, and has indicated that it can offer reciprocity of treatment.
At the last MERCOSUR Summit, two Framework Agreements between MERCOSUR and Jordan (CMC Decision 28/08) and MERCOSUR and Turkey (CMC Decision 29/08) were signed. The two decisions are similar: they aim to strengthen bilateral relations by promoting trade and establishing conditions for the negotiation of a free trade area. These two negotiating fronts will represent important challenges for certain MERCOSUR industrial sectors, as the two countries are highly competitive in some areas where MERCOSUR countries are sensitive, e.g. the textile sector.
Rapprochement initiatives with no negotiating mandate
On the initiative of South korea, a MERCOSUR-South Korea Feasibility Study carried out and completed in October 2007. Since then, the countries have been holding consultations with their respective private sectors to identify their interests in negotiating a trade agreement. The MERCOSUR countries have shown an interest in the openness of South Korea’s agricultural products market, a sector highly protected by tariff and non-tariff barriers. Furthermore, Korean industrial products are highly competitive and spark resistance from MERCOSUR’s industrial sectors over the negotiation of a broader agreement with that country.
MERCOSUR is showing interest in starting negotiations toward an agreement with the central American Integration System (SICA). A meeting to be held in September 2008 will analyze the instruments that might lead to an agreement between the two blocs. Furthermore, MERCOSUR is signing a Cooperation Agreement with the Russian Federation.
E. Prospects for the mERcoSuR external agenda
MERCOSUR’s external agenda has made little progress. The deepening of integration in South America is facing difficulties due to ever more divergent trends in the region’s economic models and its international economic integration strategies. The failure of the Doha talks, a central issue on the bloc’s external agenda, multiplies the positions that favor the need to advance in regional and/or bilateral agreements. But MERCOSUR is having difficulties negotiating the world of bilateral agreements.

145
Protectionist pressure in world trade tends to deepen with the failure of understandings in the WTO. The slowdown of the world economy and the concern over food security raised by rising international food prices may hatch protectionist initiatives in the climate of a weakening WTO.
One of the protectionist trends already manifesting itself in international trade is the introduction of technical and sanitary rules and regulations for products and production processes. These trends are linked to trade in agricultural and agroindustrial products, but also to trade in industrial products, particularly in the field of the environment.94Such measures have a significant bearing on MERCOSUR’s trade interests, strongly centered on natural resource-intensive products.
To move ahead in trade negotiations with countries with large markets, MERCOSUR members must be willing to make concessions in areas attractive to their potential partners. To do this it will be necessary to adjust their stances on several issues on the negotiating agenda. The bloc has avoided making commitments in areas not strictly trade-related in order to preserve policies space, i.e. the capacity to implement autonomous internal policies.
The priorities of MERCOSUR’S external agenda will also have to be evaluated. As we have seen, the priority for multilateral negotiations did not paralyze the bloc’s external negotiation agenda. Various initiatives are under way, but their relevance varies greatly. Targeting certain more economically significant initiatives and revising the bloc’s positions on certain issues on the thematic agenda may be the path to efficiency in the external agenda.
Last, the question of flexibility over a common trade policy will have to be tackled in order to move forward in the external agenda. Indeed, a certain degree of flexibility has been introduced in the agreements the bloc has signed in the last five years. But this strategy is only valid in those initiatives where there is consensus between all the partners.
94 Theregulationsandrulesoncertainsectors’productionprocesses,aswiththeREACHintheEU,arebeginningtoaffectchemicalexports to theEuropeanbloc.MERCOSUR recently releasedadocument settingout the rulesonproductionandacceptanceofbiofuelsintheEuropeanmarketplace.

bIbLIoGRAPHy
BiBliographical SourceS
ABECEB. Presentation at the seminar "A economia argentina e as perspectivas das relações com Brasil e MERCOSUL." Rio de Janerio. August 22, 2008.
Bagehot, W. Lombard Street. El mercado monetario de Londres. México: FCE. 1968.
Banco central do Brasil (Bacen). "Nota sobre o sistema de pagamento em moeda local". Brasilia. 2007.
__________. Relatório de inflação. Various issues. Brasilia: BACEN. 2008.
Banco central de Paraguay (BcP). Informe económico. Various issues. Asunción: BCP. 2008a.
__________. Informe de inflación. Various issues. Asunción: BCP. 2008b.
__________. "Avanza el sinceramiento de números del PIB". Press release, September 30, 2008. Asunción: BCP. 2008c.
__________. Cuentas Nacionales Trimestrales. Primer y segundo trimestre de 2008. Reports. Asunción: BCP. 2008d.
Banco central de la rePúBlica argentina (Bcra). Informe de inflación. Various issues. Buenos Aires: BCRA. 2008.
Banco central de uruguay (Bcu). Informe de política monetaria. Tercer y cuarto trimestre de 2007. Montevideo: BCU. 2007.
__________. Comité de coordinación macroeconómica. Various issues. Montevideo: BCU. 2008.
BorBa, l. and l. a. d´orio. A new payment system´s facility to improve Brazil - Argentina Trade. Costa de Sauípe. 2007.
Bouzas, r. "¿Es posible sobrevivir a las buenas noticias?" Todavía Nº 19. August 2008.
caPehart, t. y J. richardson. Food Price Inflation: Causes and Impacts. Presentation of the CRS to the US Congress. Washington: Congressional Research Service - The Library of Congress. April 10, 2008.
carciofi, r. and r. gayá. Notes on trade expansion and South American infrastructure need. INTAL Monthly Newsletter N° 135. Buenos Aires: BID-INTAL. October 2007.
casal, o. "Parlamento MERCOSUL: desafios para sua consolidação". Pontes, Vol. 4 N° 3. Geneva: International Centre for Trade and Sustainable Development (ICTSD). August 2008.
centro de estudos de integração e desenvolvimento (CINDES). O Brasil na América do Sul: promovendo a integração e a cooperação regionais. Short Series, Nº 7. Rio de Janeiro. 2008.

confederação nacional da indústria (CNI). Comércio Exterior em Perspectiva. Various issues. Brasilia: CNI. 2007 & 2008.
__________. Interesses Empresariais Brasileiros na América do Sul. Brasilia: CNI. 2007.
__________. Informe MERCOSUL. Various issues. Brasilia: CNI. 2007 y 2008.
delegação do Brasil em montevidéu. Carta de Montevidéu. Various issues. 2008.
dr. rosinha (florisvaldo fier). Parlamento do MERCOSUL: Identidade Comum e Cidadania. Mimeo. 2008.
economic commission for latin america and the cariBBean (eclac). Balance preliminar de las economías de América Latina y el Caribe 2007. Santiago de Chile: ECLAC. 2007.
__________. Estudio económico de América Latina y el Caribe 2007-2008. Santiago de Chile: ECLAC. 2008.
gloBal trade information services, inc. (gti). World Trade Atlas. Database prepared by GTI.
iglesias, r. Os interesses empresariais brasileiros na América do Sul: investimentos diretos no exterior. Work prepared for FUNCEX. Brasilia: CNI. 2007.
insertion in international trade Programme (ici). Los precios de los alimentos. Situación y perspectiva mundial. La incidencia en Uruguay. ICI Presentation. Montevideo: IDB/FOMIN. June 2008.
instituto de estudos do comércio e negociações comerciais (ICONE). "Ícone na prensa". Various articles. São Paulo.
institute for the integration of latin america and the cariBBean (IDB-INTAL). MERCOSUR Report. Subregional Integration Reports Series (Various issues). Buenos Aires: IDB-INTAL.
__________. MERCOSUR Report N° 11. Subregional Integration Reports Series. Buenos Aires: IDB-INTAL. 2006.
__________. MERCOSUL Report N° 12. Subregional Integration Reports Series. Buenos Aires: IDB-INTAL. 2007.
__________. Integration & Trade N° 28. Buenos Aires: IDB-INTAL. 2008.
instituto de Pesquisa econômica aPlicada (iPea). Carta de conjuntura. Various issues. Brasilia - Rio de Janerio: IPEA. 2008.
international monetary fund (imf). Balance of Payments Manual. Washington D.C.: IMF. 1993.
__________. Uruguay: Article IV Consultation - Staff Report; Staff Statement; Public Information Notice on the Executive Board Discussion, and Statement by the Executive Director for Uruguay. Washington D.C.: IMF. February 2008a.
__________. Paraguay: Fifth Review Under the Stand-By Arrangement - Staff Report; Press Release on the Executive Board Discussion, and Statement by the Executive Director for Paraguay. Washington D.C.: IMF. June 2008b.

__________. World Economic Outlook (WEO). Financial Stress, Downturns, and Recoveries. Washington D.C.: IMF. October 2008c.
Johnson, K. Food Price Inflation. Explanation and Policy Implications. Maurice R. Greenberg Center for Geoeconomic Studies - Working Paper Nº 3. New York: Council on Foreign Relations. July 2008.
Jornal valor econômico. "Bens de capital pedem regime comum". July 15, 2008.
__________. Ed. August 4, 2008.
KindleBerger, c.P. Manias, Panics, and Crashes. New York: John Wiley. 2000.
Peña, f. La flexibilidad en las negociaciones Comerciales. Mimeo. August 2008.
Pigou, a. C. Industrial Fluctuations. London: MacMillan. 1927.
Porta, f. Integración Productiva en el MERCOSUR. Condiciones, Problemas y Perspectivas. Mimeo. August 2007.
summers, l. "America Needs to Make a New Case for Trade". Financial Times. April 27, 2008a.
__________. "A Strategy to Promote Healthy Globalization". Financial Times. May 4, 2008b.
unión industrial argentina (uia). Una aproximación pragmática al concepto de integración productiva. Mimeo. Undated.
united nations. World Economic Situation and Prospects (WESP) - 2008, Update as of mid-2008. New York: UN. May 15, 2008.
united nations conference on trade and develoPment (unctad). Trade and Development Report 2008. Commodity Prices, Capital Flows and the Financing of Investment. New York & Geneva: UN. 2008.
World trade organization (Wto). "Lamy presents "package of elements" from consultations with Ministers". July 26, 2008. http://www.wto.org/english/news_e/news08_e/meet08_chair_26july08_e.htm
WeB SiteS
Banco Central do Brasil (BACEN) http://www.bacen.gov.br
Banco Central de Paraguay (BCP) http://www.bcp.gov.py
Banco Central de la República Argentina (BCRA) http://www.bcra.gov.ar
Banco Central de Uruguay (BCU) http://www.bcu.gub.uy
Centro de Estudos de Integração e Desenvolvimento (CINDES) http://www.cindesbrasil.org

Economic Commission for Latin America and the Caribbean (ECLAC) http://www.eclac.org
Felix Peña http://www.felixpena.com.ar
Initiative for the Integration of Regional Infrastructure in South America (IIRSA) http://www.iirsa.org
Instituto de Estudos do Comércio e Negociações Comerciais (ICONE) http://www.iconebrasil.org.br
Institute for the Integration of Latin America and the Caribbean (IDB-INTAL) http://www.iadb.org/intal
Instituto de Pesquisa Econômica Aplicada (IPEA) http://www.ipea.gov.br
International Monetary Fund (IMF) http://www.imf.org
Ministerio de Relaciones Externas de Argentina http://www.mrecic.gov.ar
O Globo News Portal http://www.g1.globo.com

INTAL PUBLICATIONS
Regular Publications
Integration & Trade. Two journal issues (English and Spanish) English and Spanish versions: Internet..
INTAL Monthly Newsletter (English, Portuguese and Spanish - Internet).
Sub-regional Integration Reports
Andean Report. Annual publication (Spanish). English version: Internet.
CARICOM Report. Annual publication (English).
Central American Report. Annual publication (Spanish). English version: Internet.
MERCOSUR Report. Annual publication (Portuguese and Spanish). English version: Internet.
Special Reports
Desarrollo rural y comercio agropecuario en América Latina y el Caribe (Spanish, only in PDF format). Paolo Giordano, César Falconi and José María Sumpsi (Comp.) INTAL-INT Series. 2007.
Raúl Prebisch: Power, Principle and the Ethics of Development (English and Spanish). Essays in Honor of David Pollock Marking the Centennial Celebrations of the Birth of Raúl Prebisch. INTAL-ITD Serie 2006.
China y América Latina: nuevos enfoques sobre cooperación y desarrollo. ¿Una segunda ruta de la seda? (Spanish). Sergio Cesarin and Carlos Juan Moneta (Comp). Serie INTAL-ITD 2005.
Solución de Controversias Comerciales e Inter-Gubernamentales: Enfoques Regionales y Multilaterales (Spanish). Julio Lacarte and Jaime Granados. INTAL-ITD Serie. 2004.
Tributación en el MERCOSUR: Evolución, comparación y posibilidades de coordinación (Spanish). Alberto Barreix and Luiz Villela. 2003.
MERCOSUR: Impacto Fiscal de la Integración Económica (Spanish). Luiz Villela, Alberto Barreix and Juan José Taccone (eds.). 2003.
Perspectivas y Desafíos del Proceso de Integración Argentino-Chileno a Diez Años del ACE 16 (Spanish). 2002.
América Latina a principios del Siglo XXI: Integración, Identidad y Globalización. Actitudes y expectativas de las elites latinoamericanas (Spanish, only in PDF format).
INTAL: 35 años de Compromiso con la Integración Regional (Spanish).
Impacto del TLCAN en las exportaciones de prendas de vestir de los países de América Central y República Dominicana (Spanish, only in PDF format)
El impacto sectorial de la integración en el MERCOSUR (Spanish and Portuguese). Juan José Taccone and Luis Jorge Garay (Eds.) 1999.

Integración en el Sector Transporte en el Cono Sur (Spanish):
Transporte Terrestre. José Alex Sant'Anna. 1997.
Puertos y vías navegables. Martín Sgut. 1997.
Los ferrocarriles y su contribución al comercio internacional. Ian Thomson. 1997.
Integración energética en el Cono Sur (Spanish). Mario A. Wiegers. 1996.
Working Papers
Las relaciones de comercio e inversión entre Colombia y Venezuela (Spanish). Eglé Iturbe de Blanco. INTAL DT-03. 1997.
MERCOSUL e Comércio Agropecuario (Portuguese). Ives Chaloult and Guillermo Hillcoat. INTAL DT-02. 1997.
The Integration Movement in the Caribbean at Crossroads: Towards a New Approach of Integration (English). Uziel Nogueira. INTAL WP-01. 1997.
Dissemination Papers
El Tratado de Libre Comercio entre el Istmo Centroamericano y los Estados Unidos de América. Oportunidades, desafíos y riesgos (Spanish). Eduardo Lizano and Anabel González. INTAL DD-09. 2003.
Los países pequeños: Su rol en los procesos de integración (Spanish). Lincoln Bizzozero - Sergio Abreu. INTAL DD-08. 2000.
Capital social y cultura. Claves olvidadas del desarrollo (Spanish). Bernardo Kliksberg. INTAL DD-07. 2000.
La dimensión cultural: base para el desarrollo de América Latina y el Caribe: desde la solidaridad hacia la integración (Spanish) Alejandra Radl. INTAL DD-06. 2000.
Cómo expandir las exportaciones de los países dentro de una economía globalizada (Spanish). Rubens Lopes Braga. INTAL DD-05. 1999.
Comercio Electrónico: conceptos y reflexiones básicas (Spanish). Gerardo Gariboldi. INTAL DD-04. 1999.
Evolución institucional y jurídica del MERCOSUR (Spanish). Vicente Garnelo. INTAL DD-03. 1998.
Estado de evolución en la elaboración e implementación de las Normas ISO 14.000 y CODEX Alimentarius (Spanish). Laura Berón. INTAL DD-02. 1997.
Integración y democracia en América Latina y el Caribe (Spanish). Alvaro Tirado Mejía. INTAL DD-01. 1997.
Databases - Software
DATAINTAL (CD-ROM) Sistema de estadísticas de comercio de América.
Base INTAL MERCOSUR (BIM).
Base de datos bibliográficos (INTEG).
Directorio de las Relaciones Económicas de América Latina y el Caribe con Asia-Pacífico (CD-ROM).
Instrumentos básicos de integración económica en América Latina y el Caribe.
Rueda de Negocios.

Red INT SERIES
The Integration Research Centers Network (RedINT)
Second Call:
Visión microeconómica de los impactos de la integración regional en las inversiones inter e intrarregionales: El caso de la CAN (only in Spanish- Short and Full version). 2003.
Integración regional e Inversión Extranjera Directa: El caso del MERCOSUR (only in Spanish- Short and Full version). 2002.
Condiciones y efectos de la IED y del proceso de integración regional en México durante los años noventa: Una perspectiva macroeconómica (only in Spanish) (short version). 2003.
First Call:
El impacto sectorial del proceso de integración subregional en la Comunidad Andina: sector lácteo y sector textil (only in Spanish). 2000.
El impacto sectorial del proceso de integración subregional en Centroamérica: sector lácteo y sector metalmecánico (aparatos eléctricos) (only in Spanish). 2000.
El impacto sectorial del proceso de integración subregional en el MERCOSUR: sector calzado y sector farmacéutico (only in Spanish). 2000.
La industria láctea de México en el contexto del Tratado de Libre Comercio de América del Norte (TLCAN) (only in Spanish). 2000.
INTAL/INT PUBLICATIONS
Working Papers - Special Initiative on Trade and Integration (SITI)
The FTAA and the Political Economy of Protection in Brazil and the US (English, only in PDF format). Marcelo de Paiva Abreu. INTAL-ITD WP-SITI-12. 2006.
Which “industrial policies” are meaningful for Latin America? (English, only in PDF format). Marcelo de Paiva Abreu. INTAL-ITD WP-SITI-11. 2006.
Building Regional Infrastructure in Latin America (English). Vito Tanzi. INTAL-ITD WP-SITI-10. 2005.
The European Window: Challenges in the Negotiation of Mexico’s Free Trade Agreement with the European Union (English and Spanish). Jaime Zabludovsky and Sergio Gómez Lora. INTAL-ITD WP-SITI-09. 2005.
Trade Liberalization and the Political Economy of Protection in Brazil since 1987 (English). Marcelo de Paiva Abreu. INTAL-ITD WP-SITI-08b. 2004.
The Political Economy of High Protection in Brazil before 1987 (English). Marcelo de Paiva Abreu. INTAL-ITD WP-SITI-08a. 2004.
The Food Industry in Brazil and the United States: The Effects of the FTAA on Trade and Investment (English). Paulo F. Azevedo, Fabio R. Chaddad and Elizabeth M.M.Q. Farina. INTAL-ITD WP-SITI-07. 2004.
MERCOSUR: IN SEARCH OF A NEW AGENDA. MERCOSUR´s Institutionalization Agenda: The Challenges of a Project in Crisis (English and Spanish). Pedro da Motta Veiga. INTAL-ITD WP-SITI-06e. 2003.
MERCOSUR: IN SEARCH OF A NEW AGENDA. Exchange Rate Instability in MERCOSUR: Causes, Problems and Possible Solutions (English and Spanish). José Luis Machinea. INTAL-ITD WP-SITI-06d. 2003.
MERCOSUR: IN SEARCH OF A NEW AGENDA. MERCOSUR: Dillemas and Alternatives for the Trade Agenda (English and Spanish). Sandra Polónia Rios. INTAL-ITD WP-SITI-06c. 2003.
MERCOSUR: IN SEARCH OF A NEW AGENDA. MERCOSUR´s Insertion into a Globalized World (English and Spanish). Juan Ignacio García Pelufo. INTAL-ITD WP-SITI-06b. 2003.
MERCOSUR: IN SEARCH OF A NEW AGENDA. Rapporteur’s Report (English and Spanish). Andrew Crawley. INTAL-ITD WP-SITI-06a. 2004.
Estudio sobre las condiciones y posibilidades políticas de la integración hemisférica (Spanish). Adalberto Rodríguez Giavarini. INTAL-ITD DT-IECI-05. 2003.
The Impacts of US Agricultural and Trade Policy on Trade Liberalization and Integration via a US-Central American Free Trade Agreement (English). Dale Hathaway. INTAL-ITD WP-SITI-04. 2003.
Agricultural Liberalization in Multilateral and Regional Trade Negotiations (English). Marcos Sawaya Jank, Ian Fuchsloch and Géraldine Kutas. INTAL-ITD-STA WP-SITI-03. 2003.
Reciprocity in the FTAA: The Roles of Market Access, Institutions and Negotiating Capacity (English). Julio J. Nogués. INTAL-ITD-STA WP-SITI-02. 2003.
Free Trade Area of the Americas: The Scope of the Negotiations (English and Spanish). Herminio Blanco M. and Jaime Zabludovsky K. INTAL-ITD-STA WP-SITI-01. 2003.
Working Papers
Integration Options for MERCOSUR: A Quantitative Analysis by the AMIDA Model (English, only in PDF format). Renato G. Flôres Jr. and Masakazy Watanuki. INTAL-INT WP-36. 2007.
Nicaragua: inserción internacional en beneficio de la mayoría (Spanish, only in PDF format). Ziga Vodusek, Erick Zeballos, Jaime Granados and Alberto Barreix. INTAL-INT DT-35. 2007.
Convergence in the Rules of Origin Spaghetti Bowl: A Methodological Proposal (English and Spanish, only in PDF format). Rafael Cornejo and Jeremy Harris. INTAL-INT WP-34. 2007.
Fiscal Policy and Equity. Estimation of the Progressivity and Redistribute Capacity of Taxes and Social Public Expenditure in the Andean Countries (English, only in PDF format). Alberto Barreix, Jerónimo Roca and Luiz Villela. INTAL-ITD WP-33. 2007.
Costa Rica: ante un Nuevo Escenario en el Comercio Internacional (Spanish, only in PDF format). Jaime Granados, Ziga Voduzek, Alberto Barreix, José Ernesto López Córdova and Christian Volpe. INTAL-ITD DT-32. 2007.
Honduras: Desafíos de la Inserción en la Economía Internacional (Spanish, only in PDF format). Jaime Granados, Paolo Giordano, José Ernesto López Córdova, Ziga Voduzek and Alberto Barreix. INTAL-ITD DT-31. 2007.
Trade Costs and the Economic Fundamentals of the Initiative for Integration of Regional Infrastructure in South America (IIRSA) (English, only in PDF format). Mauricio Mesquita Moreira. INTAL-ITD WP-30. 2007.
Regional Integration. What is in it for CARICOM? (English, only in PDF format). Mauricio Mesquita Moreira and Eduardo Mendoza. INTAL-ITD WP-29. 2007.
Emigration, Remittances and Labor Force Participation in Mexico (English, only in PDF format). Gordon H. Hanson. INTAL-ITD WP-28. 2007.
La Cooperación al Desarrollo como Instrumento de la Política Comercial de la Unión Europea. Aplicaciones al Caso de América Latina (Spanish, only in PDF format). Antonio Bonet Madurga. INTAL-ITD DT-27. 2007.
Mexican Microenterprise Investment and Employment: The Role of Remittances (English, only in PDF format). Christopher Woodruff. INTAL-ITD WP-26. 2007.

Remittances and Healthcare Expenditure Patterns of Populations in Origin Communities: Evidence from Mexico (English, only in PDF format). Catalina Amuedo-Dorantes, Tania Sainz and Susan Pozo. INTAL-ITD WP-25. 2007.
Leveraging Efforts on Remittances and Financial Intermediation (English, only in PDF format). Manuel Orozco and Rachel Fedewa. INTAL-ITD WP-24. 2006.
Migration and Education Inequality in Rural Mexico (English, only in PDF format). David McKenzie and Hillel Rapoport. INTAL-ITD WP-23. 2006.
How Equation Chapter 1 Section 1Do Rules of Origin Affect Investment Flows? Some Hypotheses and the Case of Mexico (English, only in PDF format). Antoni Estevadeordal, José Ernesto López-Córdova and Kati Suominen. INTAL-ITD WP-22. 2006.
Chile's Integration Strategy: Is There Room for Improvement? (English, only in PDF format) Mauricio Mesquita Moreira and Juan Blyde. INTAL-ITD WP-21. 2006.
Globalization, Migration and Development: The Role of Mexican Migrant Remittances (English, only in PDF format) Ernesto López-Córdova. INTAL-ITD WP-20. 2006.
El desafío fiscal del MERCOSUR (Spanish). Luiz Villela, Jerónimo Roca and Alberto Barreix. INTAL-ITD DT-19. 2005.
Improving the Access of MERCOSUR´s Agriculture Exports to US: Lessons from NAFTA (English). Pablo Sanguinetti and Eduardo Bianchi. INTAL-ITD WP-18. 2004.
Premio INTAL - Segundo Concurso de Ensayos. La coordinación macroeconómica y la cooperación monetaria, sus costos, beneficios y aplicabilidad en acuerdos regionales de integración (Spanish, English and Portuguese). Mauricio de la Cuba; Diego Winkelried; Igor Barenboim; Louis Bertone; Alejandro Jacobo and James Loveday Laghi. INTAL-ITD DT-17. 2004.
Agricultural Exporters in a Protectionist World: Review and Policy Implications of Barriers Against Mercosur (English and Spanish). Julio J. Nogués. INTAL-ITD WP-16. 2004.
Rules of Origin in FTAs in Europe and in the Americas: Issues and Implications for the EU-Mercosur Inter-Regional Association Agreement (English). Antoni Estevadeordal and Kati Suominen. INTAL-ITD WP-15. 2004.
Regional Integration and Productivity: The Experiences of Brazil and Mexico (English). Ernesto López-Córdova and Mauricio Mesquita Moreira. INTAL-ITD-STA WP-14. 2003.
Regional Banks and Regionalism: A New Frontier for Development Financing (English). Robert Devlin and Lucio Castro. INTAL-ITD-STA WP-13. 2002.
Métodos casuísticos de evaluación de impacto para negociaciones comerciales internacionales (Spanish). Antonio Bonet Madurga. INTAL-ITD-STA DT-12. 2002.
Las trabas no arancelarias en el comercio bilateral agroalimentario entre Venezuela y Colombia (Spanish). Alejandro Gutiérrez S. INTAL-ITD-STA DT-11. 2002.
The Outlier Sectors: Areas of Non-Free Trade in the North American Free Trade Agreement (English). Eric Miller. INTAL-ITD-STA WP-10. 2002.
A ALCA no limiar do século XXI: Brasil e EUA na negociação comercial hemisférica (Portuguese). Antonio José Ferreira Simões. INTAL-ITD-STA DT-09. 2002.
Metodología para el análisis de regímenes de origen. Aplicación en el caso de las Américas (Spanish). Luis J. Garay S. and Rafael Cornejo. INTAL-ITD-STA DT-08. 2001.
¿Qué hay de nuevo en el Nuevo Regionalismo de las Américas? (Spanish). Robert Devlin and Antoni Estevadeordal. INTAL-ITD-STA DT-07. 2001.
What’s New in the New Regionalism in the Americas? (English and Spanish). Robert Devlin and Antoni Estevadeordal. INTAL-ITD-STA WP-06. 2001.
The New Regionalism in the Americas: The Case of MERCOSUR (English). Antoni Estevadeordal, Junichi Goto and Raúl Saez. INTAL-ITD WP-05. 2000.
El ALCA y la OMC: Especulaciones en torno a su interacción (Spanish). Jaime Granados. INTAL-ITD DT-04. 1999.

Negotiating Preferential Market Access: The Case of NAFTA (English). Antoni Estevadeordal. INTAL-ITD WP-03. 1999.
Towards an Evaluation of Regional Integration in Latin America in the 1990s (English). Robert Devlin and Ricardo Ffrench-Davis. INTAL-ITD WP-02. 1998.
Una evaluación de la homogeneidad macroeconómica y del desarrollo de la región centroamericana (Spanish). Florencio Ballestero. INTAL-ITD DT-01. 1998.
Occasional Papers - Special Initiative on Trade and Integration (SITI)
International Arbitration Claims against Domestic Tax Measures Deemed Expropriatory or Unfair and the Inequitable (English, only in PDF format). Adrián Rodríguez. INTAL-ITD OP-SITI-11. 2006.
The Entrance to the European Union of 10 New Countries: Consequences for the Relations with MERCOSUR (English). Renato G. Flôres Jr. INTAL-ITD OP-SITI-10. 2005.
Principales retos de la negociación de un tratado de libre comercio con Estados Unidos: disciplinas en materia de inversión (Spanish). Jaime Zabludovsky and Sergio Gómez Lora. INTAL-ITD DD-IECI-09. 2005.
The Production and Financing of Regional Public Goods (English). Vito Tanzi. INTAL-ITD OP-SITI-08. 2005.
The Harmonization of Indirect Taxes in the Andean Community (English and Spanish). Luis A. Arias, Alberto Barreix, Alexis Valencia and Luiz Villela. INTAL-ITD OP-SITI-07. 2005.
Globalization and the Need for Fiscal Reform in Developing Countries (English and Spanish). Vito Tanzi. INTAL-ITD OP-SITI-06. 2004.
Latin American Industrial Competitiveness and the Challenge of Globalization (English and Spanish). Sanjaya Lall, Manuel Albaladejo and Mauricio Mesquita Moreira. INTAL-ITD OP-SITI-05. 2004.
El nuevo interregionalismo trasatlántico: La asociación estratégica Unión Europea-América Latina (Spanish). Luis Xavier Grisanti. INTAL-ITD/SOE IECI-DD-04. 2004.
A Key to Hemispheric Integration (English and Spanish). Herminio Blanco M., Jaime Zabludovsky K. and Sergio Gómez Lora. INTAL-ITD OP-SITI-03. 2004.
A New Approach to Trade Development in Latin America (English and Spanish). Martín Redrado and Hernán Lacunza. INTAL-ITD OP-SITI-02. 2004.
La coordinación y negociación conjunta de los países de la Comunidad Andina en el marco del ALCA y la OMC (Spanish). Victor Rico. INTAL-ITD DD-IECI-01. 2004.
Occasional Papers
Agriculture in Brazil and China: Challenges and Opportunities (English, only in PDF format) Mario Queiroz de Monteiro Jales, Marcos Sawaya Jank, Shunli Yao and Colin A. Carter. INTAL-ITD OP-44. 2006.
Apertura e inserción internacional en la estrategia de desarrollo de Uruguay (Spanish, only in PDF format) Paolo Giordano and Fernando Quevedo. INTAL-ITD DD-43. 2006.
El proceso de negociación de un tratado de libre comercio con Estados Unidos: la experiencia del Tratado de Libre Comercio entre Centroamérica, Estados Unidos y República Dominicana (Spanish, only in PDF format) Anabel González. INTAL-ITD DD-42. 2006.
International Remittances and Development: Existing Evidence, Policies and Recommendations (English, only in PDF format). Ernesto López-Córdova and Alexandra Olmedo. INTAL-ITD OP-41. 2006.
Comercio bilateral Argentina-Brasil: Hechos estilizados de la evolución reciente (Spanish, only in PDF format). Ricardo Carciofi and Romina Gayá. INTAL-ITD DD-40. 2006.

The Relative Revealed Competitiveness of China's Exports to the United States vis á vis other Countries in Asia, the Caribbean, Latin America and the OECD (English, only in PDF format). Peter K. Schott. INTAL-ITD OP-39. 2006.
Achievements, Prospects and Challenges of Hemispheric Cooperation (English and Spanish, only in PDF format). Roberto Iannelli. INTAL-ITD OP-38. 2006.
Libre Comercio en América Central: ¿Con quién y para qué? Las implicancias de CAFTA (Spanish, only in PDF format). Manuel Agosín and Ennio Rodríguez. INTAL-ITD DD-37. 2006.
Fear of China: Is there a Future for Manufacturing in Latin America? (English, only in PDF format). Mauricio Mesquita Moreira. INTAL-ITD OP-36. 2006.
The Role of Geography and Size (English, only in PDF format). David Hummels. INTAL-ITD OP-35. 2006.
Assessing the Impacts of Intellectual Property Rights on Trade Flows in Latin America (English, only in PDF format). Juan S. Blyde. INTAL-ITD OP-34. 2006.
Recientes innovaciones en los regímenes de origen y su incidencia en el proceso de verificación: el caso del CAFTA (Spanish) Rafael Cornejo. INTAL-ITD DD-33. 2005.
Achievements and Challenges of Trade Capacity Building: A Practitioner’s Analysis of the CAFTA Process and its Lessons for the Multilateral System (English) Eric T. Miller. INTAL-ITD OP-32. 2005.
Una aproximación a desarrollo institucional del MERCOSUR: sus fortalezas y debilidades (Spanish). Celina Pena and Ricardo Rozemberg. INTAL-ITD DD-31. 2005.
Jamaica: Trade, Integration and the Quest for Growth (English). Anneke Jessen and Christopher Vignoles. INTAL-ITD OP-30. 2005.
Trade Related Capacity Building: An Overview in the Context of Latin American Trade Policy and the MERCOSUR-EU Association Agreement (English). Robert Devlin and Ziga Vodusek. Intal-itd op-29. 2005.
Barbados: Trade and Integration as a Strategy for Growth (English). Anneke Jessen and Christopher Vignoles. INTAL-ITD OP-28. 2004.
Mirando al MERCOSUR y al mundo: estrategia de comercio e integración para Paraguay (Spanish). Paolo Giordano. INTAL-ITD DD-27. 2004.
El tratamiento de las asimetrías en los acuerdos de integración regional (Spanish). Paolo Giordano, Mauricio Mesquita Moreira and Fernando Quevedo. INTAL-ITD DD-26. 2004.
Centroamérica: La programación regional (2001) y las actividades del Banco (2001-2003) (Spanish). Ennio Rodríguez. INTAL-ITD DD-25. 2004.
Brazil's Trade Liberalization and Growth: Has it Failed? (English). Mauricio Mesquita Moreira. INTAL-ITD OP-24. 2004.
Trinidad and Tobago: Trade Performance and Policy Issues in an Era of Growing Liberalization (English). Anneke Jessen and Christopher Vignoles. INTAL-ITD OP-23. 2004.
The Trade and Cooperation Nexus: How Does MERCOSUR-EU Process Measure Up? (English). Robert Devlin, Antoni Estevadeordal and Ekaterina Krivonos. INTAL-ITD-STA OP-22. 2003.
Desigualdad regional y gasto público en México (Spanish). Rafael Gamboa and Miguel Messmacher. INTAL-ITD-STA DD-21. 2003.
Export Processing Zones and Other Special Regimes in the Context of Multilateral and Regional Trade Negotiations (English and Spanish). Jaime Granados. INTAL-ITD-STA DD-20. 2003.
The External Dimension of MERCOSUR: Prospects for North-South Integration with the European Union (English). Paolo Giordano. INTAL-ITD-STA OP-19. 2003.
Regional Aspects of Brazil's Trade Policy (English). Eduardo A. Haddad (coord.), Edson P. Domínguez and Fernando S. Perobelli. INTAL-ITD-STA OP-18. 2002.

El proceso de integración Argentina-Brasil en perspectiva: El ciclo cambiario y la relación público-privada en Argentina (Spanish). Ricardo Rozemberg and Gustavo Svarzman. INTAL-ITD-STA DD-17. 2002.
A Study on the Activities of IFIs in the Area of Export Credit Insurance and Export Finance (English). Malcom Stephens and Diana Smallridge. INTAL-ITD-STA OP-16. 2002.
Diseños institucionales y gestión de la política comercial exterior en América Latina (Spanish). Jacint Jordana and Carles Ramió. INTAL-ITD-STA DD-15. 2002.
Mercosul em sua primeira década (1991-2001): Uma avaliação política a partir do Brasil (Portuguese). Paulo Roberto de Almeida. INTAL-ITD-STA DD-14. 2002.
The Trade Policy-Making Process Level One of the Two Level Game: Country Studies in the Western Hemisphere (English and Spanish). INTAL-ITD-STA OP-13. 2002.
Search for a New Partnership in Trade and Investment between Latin America and Asia-Pacific (English). Mikio Kuwayama. INTAL-ITD-STA OP-12. 2001. (Spanish version: only in PDF format)
Regional Public Goods in Official Development Assistance (English). Marco Ferroni. INTAL-ITD-STA OP-11. 2001.
Breaking from Isolation: Suriname’s Participation in Regional Integration Initiatives (English). Anneke Jessen and Andrew Katona. INTAL-ITD-STA OP-10. 2001.
NAFTA and the Mexican Economy: Analytical Issues and Lessons for the FTAA (English). J. Ernesto López-Córdova. INTAL-ITD-STA OP-09. 2001.
La integración comercial centroamericana: Un marco interpretativo y cursos de acción plausible (Spanish). Jaime Granados. INTAL-ITD DD-08. 2001.
Negotiating Market Access between the European Union and MERCOSUR: Issues and Prospects (English). Antoni Estevadeordal and Ekaterina Krivonos. INTAL-ITD OP-07. 2000.
The Free Trade Area of the Americas and MERCOSUR-European Union Free Trade Processes: Can they Learn from Each Other? (English). Robert Devlin. INTAL-ITD OP-06. 2000.
The FTAA: Some Longer Term Issues (English). Robert Devlin, Antoni Estevadeordal and Luis Jorge Garay. INTAL-ITD OP-05. 1999.
Financial Services in the Trading System: Progress and Prospects (English). Eric Miller. INTAL-ITD OP-04. 1999.
Government Procurement and Free Trade in the Americas (English). Jorge Claro de la Maza and Roberto Camblor. INTAL-ITD OP-03. 1999.
The Caribbean Community: Facing the Challenges of Regional and Global Integration (English). Anneke Jessen and Ennio Rodríguez. INTAL-ITD OP-02. 1999.
ALCA: Un proceso en marcha (Spanish). Nohra Rey de Marulanda. INTAL-ITD DD-01. 1998.
INTAL/INT /SOE PUBLICATIONS
Euro-Latin Study Network on Integration and Trade (ELSNIT) Issues Papers. Third Annual Conference (English). INTAL-ITD-SOE. 2006.
Issues Papers. Second Annual Conference (English). INTAL-ITD-SOE. 2005.
Issues Papers. First Annual Conference (English). INTAL-ITD-SOE. 2004.

INT PUBLICATIONS
Working Papers
MERCOSUR: Achievements and Challenges. Carlos Sepúlveda and Arturo Vera Aguirre. Working Paper # 222. September 1997 (also available in Spanish).
Transport Infrastructure in Latin America. Arturo Vera Aguirre. Working Paper # 221. July 1997 (also available in Spanish).
Convergence and Divergence Between NAFTA, Chile, and MERCOSUR: Overcoming Dilemmas of North and South American Economic Integration. Raúl A. Hinojosa-Ojeda, Jeffrey D. Lewis and Sherman Robinson. Working Paper # 219. May 1997.
Towards Free Trade in the Western Hemisphere: The FTAA Process and the Technical Support of the Inter-American Development Bank. Enrique V. Iglesias. Working Paper # 217. July 1997 (also available in Spanish)
Economic Integration and Equal Distribution. Willem Molle. Working Paper # 216. May 1997.
What can European Experience Teach Latin America About Integration. L. Alan Winters. Working Paper # 215. May 1997.
Facts, Fallacies and Free Trade: A Note on Linking Trade Integration to Labor Standards. Donald J. Robbins. Working Paper # 214. May 1997.
From Miami to Cartagena: Nine Lessons and Nine Challenges of the FTAA. Robert Devlin and Luis Jorge Garay. Working Paper # 211. July 1996 (also available in Spanish).
Common Market of the Southern Cone: MERCOSUR. Martin Arocena. Working Paper # 204. September 1995 (also available in Spanish).
Special Publications
Periodic Note on Integration and Trade in the Americas (also available in Spanish and 1997 versions also in Portuguese).
The Euro and its Effect on the Economy and the Integration of Latin America and the Caribbean. Roberto Zahler. Paper presented at the Seminar "Euro and its International Impact" on occasion of the Annual Meetings of the Boards of Governors. France, March 16, 1999 (also available in Spanish).
Extract from the Bank's 1996 Report on Economic and Social Progress in Latin America, Part II, Chapter 2: Trade Liberalization, 1996 (also available in Spanish).
European Economic and Monetary Union: Recent Progress and Possible Implications for Latin America and the Caribbean. March 1997 (also available in Spanish).
Globalization and Regional Integration: Consequences for Latin America. Speech delivered by Enrique V. Iglesias at the Seminar on "A Critical View of Globality". Mexico City, November 1997 (also available in Spanish).
Protection, Preferential Tariff Elimination and Rules of Origin in the Americas - An Overview. Luis Jorge Garay and Antoni Estevadeordal. June 1995 (also available in Spanish).
The New Face of Regional Integration in Latin America and the Caribbean. Speech delivered by Enrique V. Iglesias at The Annual World Bank Conference on Development in Latin America and the Caribbean. Montevideo, July 1997 (also available in Spanish).
Free Trade Area of the Americas: From Miami to Belo Horizonte. Speech delivered by Enrique V. Iglesias at the III Business Forum of the Americas. Belo Horizonte, May 1997 (English, Portuguese and Spanish).
Transpacific Partnership: Latin America's Role. Speech delivered by Enrique V. Iglesias at the XII International General Meeting of the Pacific Economic Cooperation Council (PECC XII). Santiago, September, 1997 (also available in Spanish).

