mercer capital's value focus: laboratory services | mid-year 2015
TRANSCRIPT

VALUE FOCUSLaboratory Services Industry
www.mercercapital.com
Executive Summary Inside
The Laboratory Services industry has experi-
enced favorable performance over the last five
years as the industry’s revenue increased at an
average annual rate of 2.3% between 2010 and
2015, reaching an estimated $17.1 billion in 2015.
As defined by IBIS World, the laboratory ser-
vices industry comprises the following segments:
Product Performance & Safety Testing (42.6%),
Product Certification (27.2%), Environmental
Testing (14.9%), Agriculture & Food Testing (7.0%),
Biological and Chemical Testing (6.3%), Other
(2.0%). In addition to these segments, we will also
focus on medical testing laboratories.
The industry’s performance is sensitive to changes
in the general economic environment both inside
the U.S. and internationally. General economic
conditions may impact demand for products and
services which, in turn, trigger demand for labora-
tory services. Most recently, the industry has been
the beneficiary of increasing environmental, indus-
trial, and medical regulatory standards promoting
demand for lab services. In addition to expanding
regulatory regimes, influential growth factors
include the aging population, industry consolida-
tion, pharmacogenomics/companion diagnostics,
cost pressures, and regulation.
Mid-Year 2015
Industry Specific
Macroeconomic Overview 1
M&A Transactions 3
Guideline Company Pricing 6
Valuation Trends 7
Macroeconomic Overview 9
About Mercer Capital 12
Erickson Partners
Merges with Mercer Capital 13
Mercer Capital’s Value Focus: Laboratory Services Industry Mid-Year 2015
© 2015 Mercer Capital 1 www.mercercapital.com
Industry Specific Macroeconomic Overview
2 U.S. Census Bureau
same as those used in the Middle series. The three alternative series are useful for analyzing potential outcomes of different levels of net international migration.
According to the Middle series pro-jections, between 2012 and 2050,
the U.S. population is projected to grow from 314 million in 2012 to 400 million in 2050, an increase of 27 percent. The nation will also become more racially and ethni-cally diverse, with the aggregate minority population projected to
become the majority in 2043.6 The population is also expected to become much older. By 2030, more
6 In this report, the term minority popula-tion refers to everyone other than the non-Hispanic White alone population. The Census Bureau recognizes that there are many dimensions of ethnicity not captured in this distinction.
Figure 1.Population Aged 65 and Over for the United States: 2012 to 2050
0
10
20
30
40
50
60
70
80
90
205020452040203520302025202020152012
0
5
10
15
20
25
205020452040203520302025202020152012
Source: U.S. Census Bureau, 2012 Population Estimates and 2012 National Projections.
Millions
Percent of total population
Keyboxtext
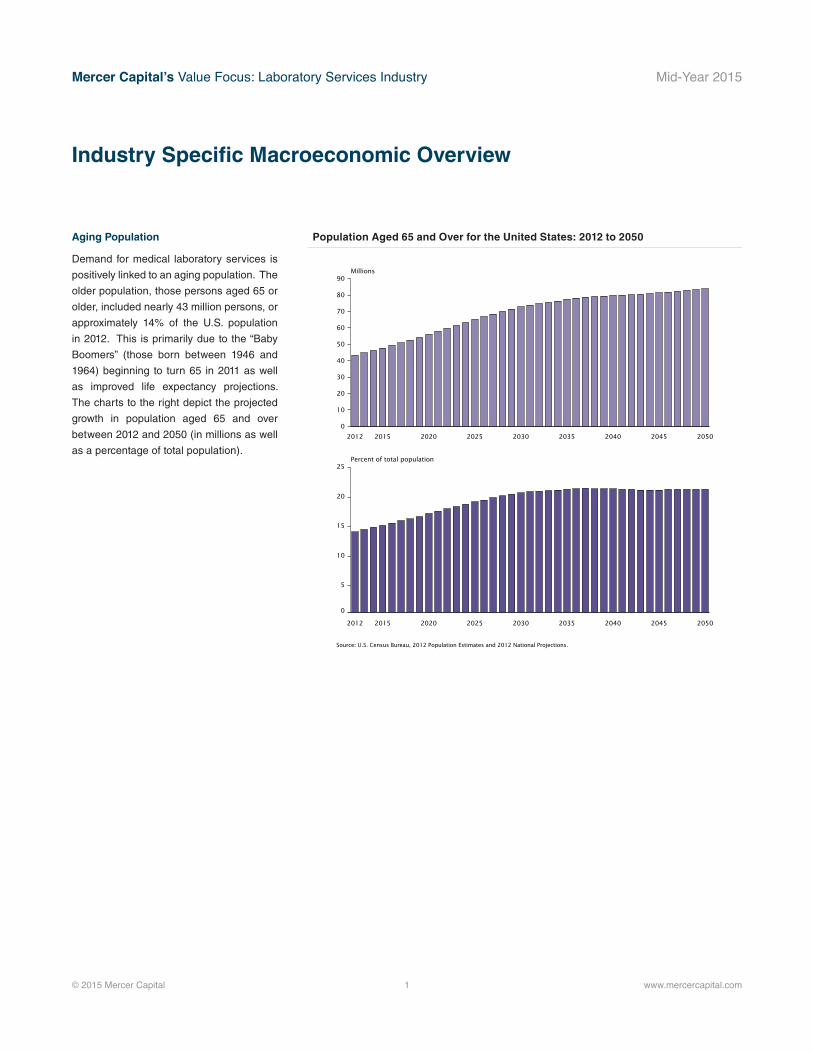
Aging Population
Demand for medical laboratory services is
positively linked to an aging population. The
older population, those persons aged 65 or
older, included nearly 43 million persons, or
approximately 14% of the U.S. population
in 2012. This is primarily due to the “Baby
Boomers” (those born between 1946 and
1964) beginning to turn 65 in 2011 as well
as improved life expectancy projections.
The charts to the right depict the projected
growth in population aged 65 and over
between 2012 and 2050 (in millions as well
as a percentage of total population).
Population Aged 65 and Over for the United States: 2012 to 2050
Mercer Capital’s Value Focus: Laboratory Services Industry Mid-Year 2015
© 2015 Mercer Capital 2 www.mercercapital.com
Industry Specific Macroeconomic Overview (continued)
0
5,000
10,000
15,000
20,000
25,000
30,000
35,000
40,000
2006 2007 2008 2009 2010 2011 2012 2013 2014 2015 2016 2017 2018 2019 2020
# Establishments Revenue ($million)
Source: IBIS World
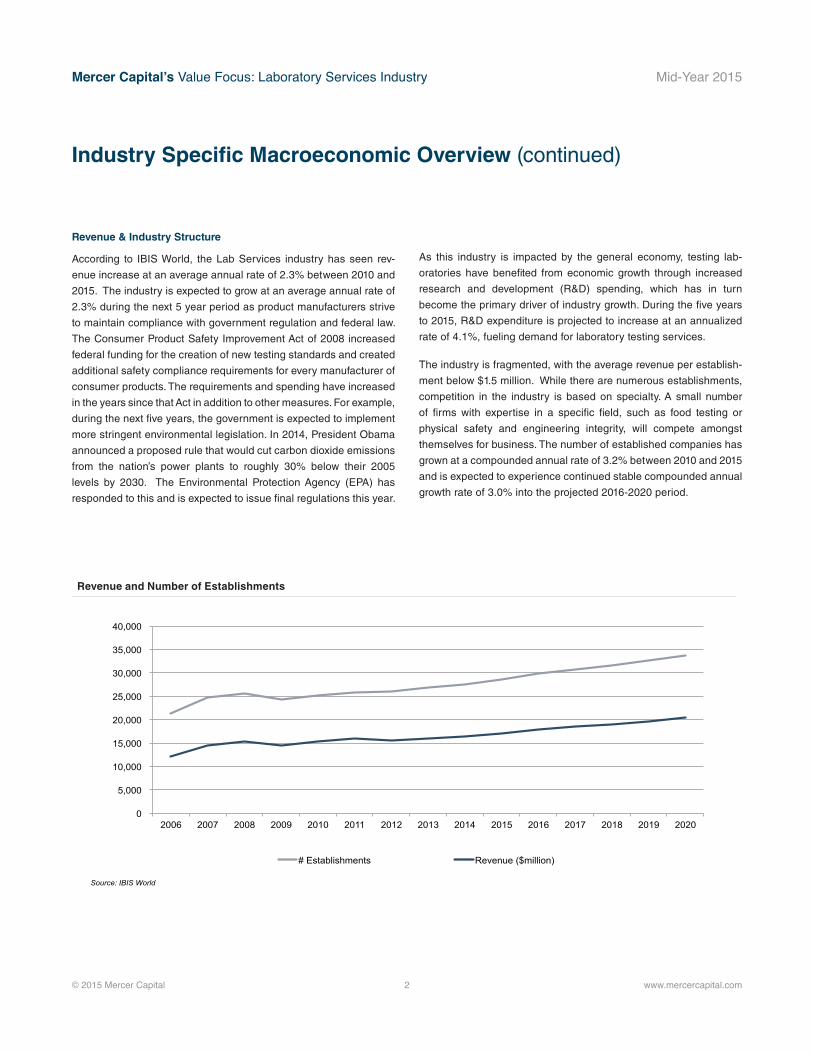
Revenue & Industry Structure
According to IBIS World, the Lab Services industry has seen rev-
enue increase at an average annual rate of 2.3% between 2010 and
2015. The industry is expected to grow at an average annual rate of
2.3% during the next 5 year period as product manufacturers strive
to maintain compliance with government regulation and federal law.
The Consumer Product Safety Improvement Act of 2008 increased
federal funding for the creation of new testing standards and created
additional safety compliance requirements for every manufacturer of
consumer products. The requirements and spending have increased
in the years since that Act in addition to other measures. For example,
during the next five years, the government is expected to implement
more stringent environmental legislation. In 2014, President Obama
announced a proposed rule that would cut carbon dioxide emissions
from the nation’s power plants to roughly 30% below their 2005
levels by 2030. The Environmental Protection Agency (EPA) has
responded to this and is expected to issue final regulations this year.
Revenue and Number of Establishments
As this industry is impacted by the general economy, testing lab-
oratories have benefited from economic growth through increased
research and development (R&D) spending, which has in turn
become the primary driver of industry growth. During the five years
to 2015, R&D expenditure is projected to increase at an annualized
rate of 4.1%, fueling demand for laboratory testing services.
The industry is fragmented, with the average revenue per establish-
ment below $1.5 million. While there are numerous establishments,
competition in the industry is based on specialty. A small number
of firms with expertise in a specific field, such as food testing or
physical safety and engineering integrity, will compete amongst
themselves for business. The number of established companies has
grown at a compounded annual rate of 3.2% between 2010 and 2015
and is expected to experience continued stable compounded annual
growth rate of 3.0% into the projected 2016-2020 period.

Mercer Capital’s Value Focus: Laboratory Services Industry Mid-Year 2015
© 2015 Mercer Capital // Source: Capital IQ 3 www.mercercapital.com
M&A Transactions
Announced Date Target / Issuer
Trans. Types
Trans. Status
Total Trans. Value
($USD mm)
Total Rev. [LTM]
($USDmm) [Target /Issuer]
Buyers / Investors
Geographic Locations [Target/Issuer]
Geographic Region [Buyer/Investor] Business Description [Target/Issuer]
01/30/2015 Enthalpy Analytical, Inc.
Merger/ Acquisition
Closed 5.5 - Montrose Envi-ronmental Group, Inc.
United States and Canada
United States and Canada
Enthalpy Analytical, Inc., a testing laboratory, provides analytical solu-tions and services for environmental industries. It specializes in tobacco and smoke analysis, and ambient air quality and emissions measure-ment. The company was founded in 1993 and is based in Durham, North Carolina. As of January 30, 2015, Enthalpy Analytical, Inc. operates as a subsidiary of Montrose Environmental Group, Inc.
01/31/2015 Diassess Inc. Private Placement
Closed 0.12 - Y Combinator United States and Canada
United States and Canada
Diassess Inc. provides DNA testing services for medical, forensics, chemical, industrial, and agricultural applications. The company was founded in 2013 and is based in Berkeley, California.
04/08/2015 Genesis Organic Assurance Testing Laboratories, Inc.
Private Placement
Announced 2.0 - - United States and Canada
- Genesis Organic Assurance Testing Laboratories, Inc., a laboratory, provides chemical, biological, and chromatographic testing services. The company was founded in 2010 and is headquartered in Vancouver, Washington.
04/09/2015 GreenPlex Services, Inc. (OTCPK:GRPX)
Private Placement
Closed 0.2 0.038 - United States and Canada
- GreenPlex Services, Inc. operates a cannabis testing laboratory in Washington, the United States. It tests cannabis and cannabis related products for growers and processors. The company was founded in 2009 and is based in Spokane, Washington.
05/01/2015 Reterro, Inc. Private Placement
Announced 5.5 - - United States and Canada
- Reterro, Inc. provides soil remediation and waste-stream cleaning services worldwide. The company offers services to clean hydrocarbon contaminated waste in urban, populated, and space-constrained environ-ments. Reterro, Inc. was incorporated in 2012 and is based in Pleasanton, California with an additional office in San Pedro, California. It has facilities in Livermore and Silicon Valley, California; Texas; and Oregon.
As noted in the transactions chart below, the largest acquisition reported during the first half of 2015 was Eurofin’s purchase of Emory Genetics Laboratory (from Emory University’s School of Medicine).
The transaction provided Eurofins a 75% majority stake for approximately $40.0 million cash.
The acquisition advances Eurofins’ footprint in the genetics and genomic segment of the specialty clinical diagnostic testing market. Post-closing, the company will be known as EGL Genetic Diagnostics,
LLC, a joint venture company of Eurofins and Emory University.

Mercer Capital’s Value Focus: Laboratory Services Industry Mid-Year 2015
© 2015 Mercer Capital // Source: Capital IQ 4 www.mercercapital.com
M&A Transactions
Announced Date Target / Issuer
Trans. Types
Trans. Status
Total Trans. Value
($USD mm)
Total Rev. [LTM]
($USDmm) [Target /Issuer]
Buyers / Investors
Geographic Locations [Target/Issuer]
Geographic Region [Buyer/Investor] Business Description [Target/Issuer]
05/12/2015 Testing Services Group LLC
Merger/ Acquisition
Closed - 3.5 SGS SA (SWX:SGSN)
United States and Canada
Europe Testing Services Group LLC, an independent testing laboratory, pro-vides fuel systems testing services for global customers in automotive, small engine, marine, agriculture, portable fuel container, and defense and the United States government markets. The company was founded in 1998 and is based in Lapeer, Michigan. As of May 8, 2015, Testing Services Group LLC operates as a subsidiary of SGS SA.
05/15/2015 Nichromet Extraction Inc. (DB:C3X1)
Private Placement
Closed 4.16 - Investissement Quebec, Invest-ment Arm
United States and Canada
United States and Canada
Nichromet Extraction Inc. develops precious and base metal extraction processes in that the residues of mining operations are totally void of contaminants. In addition, the company provides laboratory testing services for laterites and serpentines, precious metals ores, etc, in Brazil, Cuba, Dominican Republic, Congo, Guatemala, the Philippines, Canada, the United States, Bulgaria, Mexico, Morroco, Tanzania, Chili, Argentina, Peru, Namibia, Haiti, and Bolivia. Nichromet Extraction Inc. was incorporated in 1997 and is based in Montreal, Canada.
05/29/2015 DAI Ceramics, Inc.
Merger/ Acquisition
Closed - 6.4 CeramTec GmbH United States and Canada
Europe DAI Ceramics, Inc. manufactures ceramic cores for foundry and other industries. It also provides laboratory services, such as thermal dilato-metric analysis, particle size distribution, high temperature sintering and testing, and apparent density/bulk density/apparent porosity determining services. The company was founded in 1986 and is based in Willoughby, Ohio. As of May 29, 2015, DAI Ceramics, Inc. operates as a subsidiary of CeramTec GmbH.
06/01/2015 Arista Laboratories, Inc.
Merger/ Acquisition
Closed 0.5 5.2 Enthalpy Analytical, Inc.
United States and Canada
United States and Canada
As of June 1, 2015, Arista Laboratories, Inc. was acquired by Enthalpy Analytical, Inc. Arista Laboratories Inc. operates as tobacco testing lab-oratory which provides testing and analysis of tobacco, tobacco smoke, and other combustion products. It provides its services for governmental and regulatory agencies, and manufacturers of tobacco products; and pharmaceutical, chemical, personal, and neutraceutical industries in the United States and internationally. The company was founded in 2000 and is based in Richmond, Virginia.
06/12/2015 Water Planet Engineering LLC
Private Placement
Announced 14.73 - - United States and Canada
- Water Planet Engineering LLC provides water treatment solutions for desalination and water reuse problems. The company also maintains laboratories for basic water quality analyses, oil/emulsion charac-terization, rheological studies, advanced materials characterization, bench-scale testing of chemical, membrane, media filtration, and phase separation processes. Water Planet Engineering LLC was incorporated in 2011 and is based in Los Angeles, California.

Mercer Capital’s Value Focus: Laboratory Services Industry Mid-Year 2015
© 2015 Mercer Capital // Source: Capital IQ 5 www.mercercapital.com
Announced Date Target / Issuer
Trans. Types
Trans. Status
Total Trans. Value
($USD mm)
Total Rev. [LTM]
($USDmm) [Target /Issuer]
Buyers / Investors
Geographic Locations [Target/Issuer]
Geographic Region [Buyer/Investor] Business Description [Target/Issuer]
06/12/2015 GreenPlex Services, Inc. (OTCPK:GRPX)
Private Placement
Closed 0.1 0.038 - United States and Canada
- GreenPlex Services, Inc. operates a cannabis testing laboratory in Washington, the United States. It tests cannabis and cannabis related products for growers and processors. The company was founded in 2009 and is based in Spokane, Washington.
06/29/2015 Emory Genetics Laboratory
Merger/ Acquisition
Announced 40.0 - Eurofins Scientific SA (ENXTPA:ERF)
United States and Canada
Europe Emory Genetics Laboratory provides biochemical, cytogenetics, and molecular genetic testing services. It serves patients and clients in the United States and internationally. The company was founded in 1970 and is based in Decatur, Georgia.
06/30/2015 Caravel Invest-ments Ltd.
Merger/ Acquisition
Closed - 27.4 WSP Global Inc. (TSX:WSP)
United States and Canada
United States and Canada
Caravel Investments Ltd. provides a range of specialized engineering solutions in the areas of environment, geotechnical, building science, and materials engineering and testing. It offers its services to residential, industrial, and commercial owners; public-sector entities; design-build contractors; architects; and engineering consultants. The company was founded in 1966 and is based in Richmond, Canada with additional in British Columbia and Alberta. As of June 30, 2015, Caravel Investments Ltd. operates as a subsidiary of WSP Global Inc.
M&A Transactions

Mercer Capital’s Value Focus: Laboratory Services Industry Mid-Year 2015
© 2015 Mercer Capital // Source: Bloomberg 6 www.mercercapital.com
Selected Financial Data
(in $Millions, as of June 30, 2015)
Company Name Ticker Exchange SalesLTM
EBITDA
LTM EBITDA Margin
Enterprise Value (EV)
EV / Sales
EV / LTM EBITDA
Medical Testing Labs
Bio-Reference Laboratories Inc BRLI NASDAQ GS 882.5 116.0 13.1% 1,146.7 1.3 9.9
Clinical laboratory serving the medical profession
Laboratory Corp of America Holdings LH New York 7,126.8 1,257.8 17.6% 12,219.0 1.7 9.7
Clinical laboratory company serving the medical profession
Quest Diagnostics Inc DGX New York 7,551.0 1,353.0 17.9% 10,387.6 1.4 7.7
Provides diagnostic testing information services
Life Sciences Tools & Services
Waters Corp WAT New York 2,019.2 645.6 32.0% 10,617.2 5.3 16.4
Provides liquid chromatography products & services for pharm, chemicals, & environmental
Agilent Technologies Inc A New York 5,560.0 946.0 17.0% 12,847.1 2.3 13.6
Provides bio-analytical and electronic measurement solutions and services
PerkinElmer Inc PKI New York 2,241.2 339.8 15.2% 5,959.1 2.7 17.5
Provides products, services, and solutions to diagnostics, research, environmental, industrial and lab services
Thermo Fisher Scientific Inc TMO New York 16,853.9 4,082.9 24.2% 51,707.8 3.1 12.7
Provides analytical instruments, equipment, reagents and consumables, software, and services
Environmental & Facilities Services
Republic Services Inc RSG New York 8,970.1 2,332.1 26.0% 13,682.1 1.5 5.9
Provides non-hazardous solid waste collection, transfer, and recycling and disposal services
Stericycle Inc SRCL NASDAQ GS 2,723.8 623.8 22.9% 11,358.7 4.2 18.2
Provides regulated and compliance solutions to the healthcare and commercial businesses
Waste Management Inc WM New York 13,394.0 3,490.0 26.1% 20,942.9 1.6 6.0
Provides waste management environmental services
Other Labs & Related Services
Danaher Corp DHR New York 20,124.4 4,377.8 21.8% 68,112.5 3.4 15.6
Provides environmental, life sciences, & industrial technologies services to medical, industrial and commercial
Ecology and Environment Inc EEI NASDAQ GM 124.8 6.9 5.5% 43.7 0.3 6.3
Environmental consulting firm
IDEXX Laboratories Inc IDXX NASDAQ GS 1,531.3 331.8 21.7% 5,941.7 3.9 17.9
Provides diagnostic, detection, and information systems for veterinary, food, and water testing
Clean Harbors Inc CLH New York 3,365.2 360.7 10.7% 3,139.9 0.9 8.7
Provides a variety of environmental remediation and industrial waste management services
Average (of above) 6,604.9 1,447.4 19.4% 16,293.3 2.4 11.9
Median (of above) 4,462.6 795.8 19.8% 10,987.9 2.0 11.3
Guideline Company Pricing

Mercer Capital’s Value Focus: Laboratory Services Industry Mid-Year 2015
Historical Valuation Trends for Guideline Comparable Companies
(Enterprise Value/LTM EBITDA Multiple)
Company Name 6/30/15 3/31/15 12/31/14 9/30/14 6/30/14 3/31/14 12/31/13 9/30/13 6/30/13
Medical Testing Labs
Bio-Reference Laboratories Inc 9.9 na 9.8 8.6 9.7 8.8 7.4 8.3 8.2
Laboratory Corp of America Holdings 9.7 9.2 10.6 10.1 10.2 9.7 8.9 9.3 9.5
Quest Diagnostics Inc 7.7 8.5 10.4 9.7 9.8 9.6 8.5 9.5 9.1
Life Sciences Tools & Services
Waters Corp 16.4 16.9 17.5 15.7 17.2 18.2 16.4 17.9 16.9
Agilent Technologies Inc 13.6 12.9 13.5 11.9 12.3 12.0 12.3 11.2 9.5
PerkinElmer Inc 17.5 17.5 15.0 14.5 15.8 16.5 15.8 22.1 21.5
Thermo Fisher Scientific Inc 12.7 12.8 16.9 17.0 18.6 20.3 19.4 15.7 14.9
Environmental & Facilities Services
Republic Services Inc 5.9 6.4 8.7 8.5 8.5 8.7 8.7 8.9 9.3
Stericycle Inc 18.2 18.0 19.5 17.9 18.2 17.6 18.2 18.6 18.5
Waste Management Inc 6.0 6.9 13.7 13.0 12.2 11.9 12.7 8.7 8.7
Other Labs & Related Services
Danaher Corp 15.6 13.7 14.5 12.9 13.3 13.2 13.7 12.5 11.8
Ecology and Environment Inc 6.3 8.4 11.3 12.0 nm nm 27.0 35.5 6.9
IDEXX Laboratories Inc 17.9 22.9 22.9 18.6 21.7 20.3 18.4 17.2 15.9
Clean Harbors Inc 8.7 8.6 11.2 12.2 10.5 9.7 10.4 11.2 11.2
Average (of above) 11.9 12.5 14.0 13.0 13.7 13.6 14.1 14.8 12.3
Median (of above) 11.3 12.8 13.6 12.5 12.3 12.0 13.2 11.9 10.4
Valuation Trends
© 2014 Mercer Capital // Source: Bloomberg 7 www.mercercapital.com
We assessed the historical valuation trends of the fifteen companies by comparing each company’s enterprise value divided by LTM
EBITDA over the last two years at each quarter-end. The median multiple over the period analyzed ranged from 10.4x to 13.6x; the
median multiple at June 30, 2015, was 11.3x, compared to 12.8 at the prior quarter-end. Companies focused on the life sciences tool
and services garner the highest multiple (median of 15.0x) on the strength of more robust growth expectations.

Mercer Capital’s Value Focus: Laboratory Services Industry Mid-Year 2015
© 2015 Mercer Capital 8 www.mercercapital.com
Valuation Trends (continued)
In addition, we created an index based on the above fifteen companies and compared the performance to the S&P 500 over the last year as
well as the last three years. As previously, mentioned, the laboratory services industry is influenced by general macroeconomic conditions.
During the first half of 2015, shares of lab services and related companies underperformed the broader equity markets.
-20%
-10%
0%
10%
20%
30%
40%
50%
60%
70%
Jun-12 Jun-13 Jun-14 Jun-15
% Change Index % Change S&P 500 Source: Bloomberg
Historical Market Trends
Last 3 Years
-10.0%
0.0%
10.0%
20.0%
Jun-14 Dec-14 Jun-15
% Change Index % Change S&P 500 Source: Bloomberg
Historical Market Trends
LTM

Mercer Capital’s Value Focus: Laboratory Services Industry Mid-Year 2015
© 2015 Mercer Capital 9 www.mercercapital.com
Macroeconomic Overview
$0
$2,000
$4,000
$6,000
$8,000
$10,000
$12,000
$14,000
$16,000
$18,000
$20,000
-10.0%
-8.0%
-6.0%
-4.0%
-2.0%
0.0%
2.0%
4.0%
6.0%
GD
P (in Billions)
Ann
ualiz
ed R
eal G
row
th R
ate
Quarterly Annualized Real Growth Rate Annual Real Growth Rate
GDP (Current Dollars) GDP (Chained 2009 Dollars)
Source: Bureau of Economic Analysis
-6.0%
-4.0%
-2.0%
0.0%
2.0%
4.0%
6.0%
8.0%
10.0%
Annualized Quarterly Change Annual Change
Source: Bureau of Labor Statistics
Gross Domestic Product
According to advance estimates released by
the Department of Commerce’s Bureau of
Economic Analysis (the “BEA”), Real Gross
Domestic Product (“GDP”), the output of goods
and services produced by labor and property
located in the United States, increased at an
annualized rate of 2.3% during the second
quarter of 2015. The increase was attributable
to gains in personal consumption expendi-
tures, exports, state and local government
spending, and residential fixed investment.
Federal government spending, private inven-
tory investment, and nonresidential fixed
investment spending decreased. Imports,
which are subtracted from the national income
and product accounts used in the calculation
of GDP, increased.
Business & Manufacturing Productivity
According to the Bureau of Labor Statistics,
seasonally adjusted nonfarm business pro-
ductivity, as measured by the hourly output of
all persons, increased at an annual rate of 1.3%
in the second quarter of 2015. The increase
was a function of the 2.8% increase in output
combined with an increase of 1.5% in hours
worked. Labor productivity, hourly compen-
sation and unit labor costs also experienced
increases, while real hourly compensation
declined 1.1%. The productivity increase fol-
lows decreases in productivity of 2.2% and
1.1% in the fourth quarter of 2014 and the first
quarter of 2015, respectively. Annual average
productivity increased 0.3% in the second
quarter of 2015 relative to the second quarter
of 2014. Productivity increased 1.7% for the
business sector (inclusive of farming activity)
in the second quarter of 2015. This was the
result of a 2.8% increase in output and a 1.1%
increase in hours worked. Manufacturing pro-
ductivity, generally more volatile in its quarterly
measures, increased 2.5% during the quarter.
Gross Domestic Product
Change in Nonfarm Business Productivity

Mercer Capital’s Value Focus: Laboratory Services Industry Mid-Year 2015
© 2015 Mercer Capital 10 www.mercercapital.com
Macroeconomic Overview (continued)
1/19/061/20/061/23/061/24/061/25/061/26/061/27/061/30/061/31/062/1/062/2/062/3/062/6/062/7/062/8/062/9/06
2/10/062/13/062/14/062/15/062/16/062/17/062/21/062/22/062/23/062/24/062/27/062/28/063/1/063/2/06
-60.0%
-40.0%
-20.0%
0.0%
20.0%
40.0%
60.0%
80.0%
100.0%
120.0%
140.0%
160.0%
Dow Jones Industrial Average S&P 500 NASDAQ Composite Source: Bloomberg L.P.
0.0%
0.5%
1.0%
1.5%
2.0%
2.5%
3.0%
3.5%
4.0%
2Q15 (Current) 1Q15 (Previous) 2Q14 (Previous Year) Source: Federal Reserve Statistical Release H.15 Note: Figures shown are the average yield for the last month of the quarter.
The Financial Markets
Due to the Greek financial crisis spurring
a sell-off at the end of the quarter, the
Dow Jones, the S&P, and the NASDAQ
experienced losses during June 2015.
The Dow Jones and the S&P also posted
losses for the second quarter of 2015, while
the NASDAQ posted its tenth consecu-
tive quarterly gain. Driven by signs of an
improving economy and the anticipation
of the Federal Reserve increasing rates,
most U.S. Treasury yields rose during the
second quarter of 2015.
The following chart shows the relative price
performance of the Dow Jones Industrial
Average, S&P 500, and NASDAQ Com-
posite Indices.
Yield Curve
The number of nonfarm payroll jobs
increased by 223,000 in June 2015. June’s
gain follows increases of 187,000 and
254,000 jobs in April and May, respectively.
During 2008 and 2009, the economy lost
nearly 8.7 million nonfarm payroll jobs. In
2014, the economy added approximately 3.0
million nonfarm payroll jobs, with the private
services sector being the largest producer
of jobs. Economists surveyed by The Wall
Street Journal anticipate payroll gains of
approximately 220,000 jobs per month over
the next year.
Equity Index Price Return
U.S. Tresury Yield Curve

Mercer Capital’s Value Focus: Laboratory Services Industry Mid-Year 2015
© 2015 Mercer Capital 11 www.mercercapital.com
Macroeconomic Overview (continued)
Housing Market
Home building activity has traditionally been
a primary driver of overall economic activity
because new home construction stimulates
a broad range of industrial, commercial,
and consumer spending and investment.
According to the U.S. Census Bureau, new
privately-owned housing starts were at a sea-
sonally adjusted annualized rate of 1,174,000
units in June 2015, 9.8% above the revised
May rate of 1,069,000 units, and 26.6%
above the June 2014 level. The seasonally
adjusted annual rate of private housing units
authorized by building permits (considered
the best indicator of future housing starts)
was 1,343,000 units in June 2015, 7.4%
above the revised May estimate of 1,250,000,
and 30.0% above the June 2014 level.
0.2 0.3 0.4 0.5 0.6 0.7 0.8 0.9 1.0 1.1 1.2 1.3 1.4 1.5 1.6 1.7 1.8 1.9 2.0 2.1 2.2 2.3 2.4
Private Housing Starts Single Family Starts Source: U.S. Census Bureau Note: Permits at a given date are generally a leading indicator of future starts. Beginning with January 2004, building permit data reflects the change to the 20,000 place series.
Private Housing
Single Family Housing
Seasonally Adjusted Annualized Rates of New Housing Starts and Building Permits
(millions of units)
0.0%
1.0%
2.0%
3.0%
4.0%
5.0%
6.0%
7.0%
8.0%
9.0%
10.0%
11.0%
Bureau of Labor Statistics
Unemployment and Payroll Jobs
According to the Labor Department’s Bureau
of Labor Statistics (“BLS”), the unemployment
rate was 5.3% in June 2015, down slightly
from 5.4% and 5.5% in April and May, respec-
tively. Unemployment rates increased steadily
throughout 2008 and into 2009, peaking at
10% in October 2009. The October 2009
unemployment rate represented the highest
level since 1983. Pre-recession unemploy-
ment levels were reached in December 2014.
The June 2015 unemployment rate is the
lowest rate since April 2008, though some
experts believe that is due to a shrinking work-
force. Excluding the recent trend, the last time
the labor force participation rate was lower
than its current level was 1977. As job avail-
ability increases the labor force could increase
due to individuals re entering the workforce,
which could lead to periodic increases in the
unemployment rate in the foreseeable future.
Economists surveyed by The Wall Street
Journal anticipate an unemployment rate of
5.1% by year-end 2015 and a further decline
to 4.9% by June 2016.
Civilian Unemployment Rate

Mercer CapitalLaboratory Services Industry
Contact Us
Copyright © 2015 Mercer Capital Management, Inc. All rights reserved. It is illegal under Federal law to reproduce this publication or any portion of its contents without the publisher’s permission. Media
quotations with source attribution are encouraged. Reporters requesting additional information or editorial comment should contact Barbara Walters Price at 901.685.2120. Mercer Capital’s Industry
Focus does not constitute legal or financial consulting advice. It is offered as an information service to our clients and friends. Those interested in specific guidance for legal or accounting matters should
seek competent professional advice. Inquiries to discuss specific valuation matters are welcomed. To add your name to our mailing list to receive this complimentary publication, visit our web site at
www.mercercapital.com.
Mercer Capital has expertise providing business valuation and financial advisory services to companies in the laboratory services industry.
Mercer Capital provides business valuation and financial advisory services to laboratory
service companies throughout the nation. We provide valuation services for tax purposes,
buy-sell agreements, partner buyouts, and other corporate planning purposes. Mercer Capital
also works with owners who are considering the sale of their dealership or the acquisition of
other laboratories.
Services Provided
• Valuation of laboratory services industry companies
• Transaction advisory for acquisitions and divestitures
• Valuations for purchase accounting and impairment testing
• Fairness and solvency opinions
• Litigation support for economic damages and valuation and shareholder disputes
Contact a Mercer Capital professional to discuss your needs in confidence.
Travis W. Harms, CFA, CPA/[email protected]
Timothy R. Lee, [email protected]
Nicholas J. Heinz, [email protected]
Karolina Grabowicz, CPA/[email protected]
Mercer Capital5100 Poplar Avenue, Suite 2600Memphis, Tennessee 38137901.685.2120 (P)
www.mercercapital.com
BUSINESS VALUATION & FINANCIAL ADVISORY SERVICES
Erickson Partners Merges with Mercer Capital
Mercer Capital, a national business valuation and financial advisory firm specializing in Cor-porate Valuation, Litigation Support, Financial Reporting Valuation, and Transaction Advisory Consulting, and Erickson Partners, Inc., a Texas-based Valuation and Litigation Support firm, announce their merger effective July 1, 2015.
Mercer Capital, with its strong presence throughout the Southeast and Midwest, and Erickson Partners, with its strong presence in Texas and Oklahoma, are a perfect fit.
Both firms maintain the highest standards of quality for financial analysis and client service and believe deeply in hiring and developing the best professionals.
“The culture of both firms is so similar and that was important to us. The professionals of Er-ickson Partners are well-known in the valuation profession as some of the best and brightest. Their work product and reputation are stellar. This merger not only allows us to broaden our geographic reach but also our industry expertise,” said Matt Crow, President of Mercer Capital.
Erickson Partners enhances Mercer Capital’s broad base of industry concentrations with their exceptional history working with and knowledge of professional sports franchises and the en-ergy sector.
“Over our 30 plus year history, Mercer Capital has developed several industry concentrations. By adding the knowledge, insight, and expertise of Don Erickson, Bryce Erickson, and the rest of the professionals of Erickson Partners, we now bring deep experience and insight to a broader range of industries than we could as separate firms,” said Chris Mercer, CEO of Mercer Capital.
“Combining with Mercer Capital, we will now be able to offer new or expanded services that complement our existing services, as well as additional industry expertise,” said Bryce Erick-
son, Managing Director of Erickson Partners. “In addition to our sports franchise and energy industry concentrations, we will be able to offer deep industry concentrations in construction and building materials, agribusiness, manufacturing and financial institutions, which includes depository institutions, insurance companies, fintech companies, asset management firms, and PE firms.”
“The combined firm will have over 40 valuation professionals positioned in five markets through-out the southwest and southeast. Such a deep bench will provide us with a tremendous op-portunity to better serve the expanding needs of our clients,” said Don Erickson, President of Erickson Partners. “Joining with Mercer Capital gives us national resources that will benefit our clients in Texas and beyond.”
About Mercer Capital
Mercer Capital is a national business valuation and financial advisory firm offering corporate valua-tion, litigation support, financial reporting valuation, and transaction advisory consulting services to a national client base. Clients include private and public operating companies, financial institutions, asset holding companies, high-net worth families, and private equity/hedge funds.
About Erickson Partners, Inc.
Erickson Partners is a professional valuation and advisory firm specializing in business valuation, litigation support, financial investigations and strategic corporate advisory services. Founded by Don & Bryce Erickson, Erickson Partners has served large and small clients by providing complex financial and economic analysis, leading to reasonable valuation opinions that withstand scrutiny.
BUSINESS VALUATION & FINANCIAL ADVISORY SERVICES
CONTACT US
Z. Christopher Mercer, ASA, CFA, ABAR
901.685.2120
Matthew R. Crow, CFA, ASA
901.685.2120
Donald Erickson, ASA
214.468.8400
Bryce Erickson, ASA, MRICS
214.468.8400
MERCER CAPITAL
Headquarters
5100 Poplar Avenue, Suite 2600
Memphis, TN 38137
901.685.2120
Dallas
12201 Merit Drive, Suite 480
Dallas, TX 75251
214.468.2120
Nashville
102 Woodmont Blvd., Suite 231
Nashville, TN 37205
615.345.0350
www.mercercapital.com
COMBINING CULTURES OF EXCELLENCE