menlo park fire protection district - amazon web …menlo park fire protection district principal...
TRANSCRIPT


Menlo Park Fire Protection District
Menlo Park, California
Comprehensive Annual Financial Report
For the Year Ended June 30, 2016
Prepared By the Administrative Services Department
of the Menlo Park Fire Protection District


Menlo Park Fire Protection District Comprehensive Annual Financial Report
For the Year Ended June 30, 2016
Table of Contents
i
Page INTRODUCTORY SECTION Table of Contents ......................................................................................................................................................... i Principal Officials ......................................................................................................................................................... iii Organization Chart ....................................................................................................................................................... iv Station Map Location ................................................................................................................................................... v Fire House Pictures ...................................................................................................................................................... vi Letter of Transmittal ..................................................................................................................................................... vii GFOA Certificate of Achievement ............................................................................................................................... xvi FINANCIAL SECTION Independent Auditors’ Report on Financial Statements ........................................................................................ 1 Report on Internal Control Over Financial Reporting and on Compliance and Other Matters Based on an Audit of Financial Statements Performed in Accordance with Government Auditing Standards ........................................................................................ 3 Management’s Discussion and Analysis (Required Supplementary Information - Unaudited) ......................... 5 Basic Financial Statements: Government-Wide Financial Statements: Statement of Net Position ................................................................................................................................ 37 Statement of Activities .................................................................................................................................... 38 Fund Financial Statements: Governmental Fund Financial Statements: Balance Sheet ............................................................................................................................................ 45 Reconciliation of the Governmental Funds Balance Sheet to the Government-Wide Statement of Net Position ............................................................................. 46 Statement of Revenues, Expenditures, and Changes in Fund Balances ................................................... 47 Reconciliation of the Governmental Statement of Revenues, Expenditures, and Changes in Fund Balances to the Government-Wide Statement of Activities ........................................................................................................................... 48 Notes to the Basic Financial Statements ............................................................................................................ 53 Required Supplementary Information (unaudited): Budgetary Comparison Schedules: General Fund ................................................................................................................................................... 83 FEMA Special Revenue Fund ......................................................................................................................... 84
Notes to the Budgetary Comparison Schedules ..................................................................................................... 85

Menlo Park Fire Protection District Comprehensive Annual Financial Report
For the Year Ended June 30, 2016
Table of Contents (Continued)
ii
FINANCIAL SECTION (Continued) Required Supplementary Information (unaudited) (Continued): Schedule of the District’s Proportionate Share of the Net Pension Liability and Related Ratios .......................... 86 Schedule of Contributions...................................................................................................................................... 87 Schedule of Funding Progress of the Other Postemployment Healthcare Plan ..................................................... 88 Supplementary Information: Budgetary Comparison Schedules: Capital Improvement Capital Projects Fund ................................................................................................... 91 Debt Service Fund ........................................................................................................................................... 92 STATISTICAL SECTION
Statistical Section Index ............................................................................................................................................... 93 Financial Trends: Net Position by Component – Last Ten Fiscal Years ............................................................................................ 94 Changes in Net Position – Last Ten Fiscal Years .................................................................................................. 95 Fund Balances of Governmental Funds – Last Ten Fiscal Years .......................................................................... 96 Changes in Fund Balance of Governmental Fund – Last Ten Fiscal Years .......................................................... 97
Revenue Capacity: Assessed Value and Actual Value of Taxable Property – Last Ten Fiscal Years .................................................. 98 Direct and Overlapping Property Tax Rates – Last Ten Fiscal Year ..................................................................... 99 Principal Property Taxpayers – Current and Nine Years Ago ............................................................................... 100 Property Tax Levies and Collections – Last Ten Fiscal Years .............................................................................. 101 Debt Capacity: Ratio of Outstanding Debt by Type ....................................................................................................................... 102 Demographic and Economic Information: Demographic and Economic Statistics – Last Ten Calendar Years ....................................................................... 103 Operating Information: Principal Employers ............................................................................................................................................... 104 Full-Time Equivalent City Government Employees by Function/Program – Last Ten Fiscal Years .................... 105 Operating Indicators by Function/Program – Last Ten Fiscal Years ..................................................................... 106 Capital Assets Statistics by Function/Program – Last Ten Fiscal Years ............................................................... 107

Menlo Park Fire Protection DistrictPrincipal Officers
For the Year Ended June 30, 2016
Board of Directors
Rob Silano Peter CarpenterPresident Vice President
Rex IansonDirector
Harold Schapelhouman Fire Chief Kathleen Jackson Administrative Services Manager Donald Long Deputy Chief Manny Navarro Division Chief (Operations and Training) James Stevens Division Chief (Support Services) Jonathan Johnston Fire Marshal Michael Shaffer Battalion Chief Ben Marra Battalion Chief Tom Calvert Battalion Chief Dan Coyle Battalion Chief
Principal Staff
Chuck BernsteinDirector
Virginia Chang KiralyDirector
iii

Menlo Park Fire Protection District Organizational Chart
iv
Board of Directors
Fire Chief
Deputy Chief
Division Chief Operations
Battalion Chiefs A/B/C
7 Stations & Personnel
Battalion Chief Training
Administrative Assistant
Shift PTO's
EMS Manager
US&R Senior Management
Analyst
Records Specialist
Warehouse Specialist
Division Chief Emergency Management and Support Services
Disaster Response Manager
Public Education Officer
Emergency Services
Specialist
Fleet Supervisor
Mechanic
Information Technology
Manager
Senior IT Analyst
IT Specialist
Human Resources Manager
Senior Human Resources
Analyst
0.5 Administrative
Assistant
Fire Marshal
Fire Prevention Coordinator
Fire Plans Examiner
Deputy Fire Marshal
Fire Inspector I/II
Fire Inspector I/II
Administrative Services
Manager
Senior Accountant
Senior Management
Analyst
Accounting/Payroll
Technician
Clerk of the Board
Accounting/Payroll
Technician
General & NegotiationLegal Counsel
Contractor

Adm
inis
trat
ion
and
Fi
re P
reve
ntio
n O
ffic
e 17
0 M
iddl
efie
ld R
oad
Men
lo P
ark,
CA
940
25
Stat
ion
1 30
0 M
iddl
efie
ld R
oad
Men
lo P
ark,
CA
940
25
Stat
ion
2 22
90 U
nive
rsity
Ave
nue
East
Pal
o A
lto, C
A 9
4303
St
atio
n 3
32 A
lmen
dral
Ave
nue
Ath
erto
n, C
A 9
4027
St
atio
n 4
3322
Ala
med
a D
e La
s Pul
gas
Men
lo P
ark,
CA
940
25
Stat
ion
5 41
01 F
airo
aks A
venu
e M
enlo
Par
k, C
A 9
4025
St
atio
n 6
700
Oak
Gro
ve A
venu
e M
enlo
Par
k, C
A 9
4025
St
atio
n 77
14
67 C
hilc
o A
venu
e M
enlo
Par
k, C
A 9
4025
1
2 3 4
5
6
77 AD
MIN
Dis
trict
Bou
ndar
ies
v

MENLO PARK FIRE PROTECTION DISTRICT
Administration and Fire Prevention Office
170 Middlefield Road, Menlo Park
Station 2
2290 University Avenue, East Palo Alto
Station 4
3322 Alameda de las Pulgas, Menlo Park
Station 6
700 Oak Grove Avenue, Menlo Park
Station 1
300 Middlefield Road, Menlo Park
Station 3
32 Almendral Avenue, Atherton
Station 5
4101 Fair Oaks Avenue, Menlo Park
Station 77
1467 Chilco Street, Menlo Park
vi

_____________________________________________________________________________________2016 Menlo Park Fire Protection District Comprehensive Annual Financial Report vii
December 19, 2016 Board of Directors Menlo Park Fire Protection District 170 Middlefield Road Menlo Park, California 94025 Honorable Members of the Board: I am pleased to submit the Menlo Park Fire Protection District’s Comprehensive Annual Financial Report (CAFR) for the fiscal year ending June 30, 2016, to you and to the residents of the District. This report has been prepared by the Administrative Services Division following the guidelines recommended by the Government Finance Officers Association of the United States and Canada (GFOA) and is in conformance with generally accepted accounting principles for state and local governmental entities established by the Governmental Accounting Standards Board (GASB). Responsibility for the accuracy, completeness and fairness of the presented data and the clarity of presentation, including all disclosures, rests with the management of the District. The information in this report is intended to present the reader with a comprehensive view of the District’s financial position and the results of its operations for the fiscal year ending June 30, 2016, along with additional disclosures and financial information designed to enable the reader to gain an understanding of the District’s financial position and activities. This report was prepared as prescribed in Governmental Accounting Standards Board (GASB) Statement No. 34, Basic Financial Statements and Management’s Discussion and Analysis for State and Local Governments (GASB 34). GASB No. 34 requires a narrative introduction, overview, and analysis to accompany the basic financial statements in the form of a Management’s Discussion and Analysis (MD&A). This letter of transmittal is designed to complement the MD&A and should be read in conjunction with it. The MD&A can be found in the financial section of this report. The Reporting Entity and Its Service History of the Menlo Park Fire Protection District When the brass bell that hung in the first firehouse in Menlo Park on Merrill Street rang, Menlo Park Hose Company No. 1 sprang into action. A horse-drawn wagon was pulled from the small wooden structure at the end of Santa Cruz Avenue, to an awaiting a team of horses. Then the race was on from the livery stable to the site of the emergency. Two Express Companies in town, that boarded and used horses, competed for the privilege to pull the Hose Wagon, they were paid for their use but only if they arrived first at the Fire Station. There were seventeen
Menlo Park Fire Protection District170 Middlefield Road • Menlo Park, CA 94025 • Tel: 650.688.8400 • Fax: 650.323.9129
Website: www.menlofire.org • Email: [email protected]
Fire Chief Harold Schapelhouman
Board of Directors Robert J. Silano Peter Carpenter Chuck Bernstein
Rex Ianson Virginia Chang Kiraly

_____________________________________________________________________________________viii 2016 Menlo Park Fire Protection District Comprehensive Annual Financial Report
volunteer members in total serving Menlo Park at the time, and responses to fire incidents could be chaotic. On September 16, 1915, a note of order was introduced to the community when a group of 62 residents petitioned the San Mateo County Board of Supervisors to approve the formation of a Special District to provide fire services to the area and thus the Menlo Park Fire Protection District was created. The boundaries of the Fire District eventually followed lines similar to those drawn for the original incorporation of Menlo
Park, which included Fair Oaks, (later Atherton) and Ravenswood, (later East Palo Alto). The original incorporation of the City of Menlo Park was approved on March 23, 1874, making it the second incorporated city in San Mateo County. This incorporation, which was undertaken primarily to provide a quick way to raise money for road repairs, was short-lived and had been undone by 1876. A second incorporation effort was initiated in 1923 and would have included what is now the Town of Atherton. The residents of Atherton, however, had incorporation ideas of their own and beat Menlo Park representatives to the County Courthouse to file incorporation papers by only minutes. The residents of Menlo Park delayed the submission of its incorporation petition and the city was not finally incorporated until 1927. East Palo Alto remained as an unincorporated area until 1983. The Menlo Park Fire District is thus actually older than the three cities it protects. Three years after the Fire District was formed a new firehouse was put into service and it housed an electrically operated siren, replacing the old brass bell. The new firehouse, which was a brick building at 1077 Merrill Street in Menlo Park, served as the main firehouse for the District until 1955, when operations were moved to what is now Fire Station 1, at 300 Middlefield Road. The District has been served by many Fire Chiefs. The first of these was Fire Chief Frank P. Roach, a volunteer. Four years after the District’s formation, Fred Whitaker became the first paid Fire Chief in 1919. Whitaker was a retired captain from the San Francisco Fire Department who brought with him an extensive background in fire fighting techniques. During the first nine years of Whitaker’s tenure, there was only one paid firefighter, Leslie Brown, who had been hired in 1918. He worked a demanding schedule of twenty-four hours a day, seven days a week for very meager wages. He was ultimately promoted to Assistant Chief. The paid staff remained at two until 1928, when a second paid firefighter joined the payroll. When Chief Whitaker left the District in 1936, Thomas F. Cuff, a former Berkeley Fire Department captain, assumed the Chief's position. He headed the department until 1955. The Menlo Park Firefighters’ Association has named its antique fire apparatus "Old Tom" in his honor. George B. Carter followed Chief Whitaker. He started his 44-year career with the District in 1928. Before his retirement in 1972, Carter had worked his way up through the ranks and was promoted to Fire Chief in 1955. In 1972, the Chief's position was filled by Robert Whitney who, like Carter, ascended through the ranks, starting his career with the District in 1946. He was succeeded by Vince Del Pozzo in 1978, another career Menlo Park firefighter.

_____________________________________________________________________________________2016 Menlo Park Fire Protection District Comprehensive Annual Financial Report ix
Following Chief Del Pozzo's retirement in 1984, Winfred Baker won the top position, but served for less than a year. Several interim Fire Chiefs served the District until Jack Bennett was hired as Chief in 1985, after completing a career with the Los Angeles City Fire Department, having retired from that agency as Assistant Chief. Bennett served until his retirement in 1992, and was replaced by Rick Tye, who was Chief of the Marysville Fire Department prior to his appointment to the Menlo Park Fire Protection District’s position. It was toward the end of Chief Bennett's term and during Chief Tye's that the District began training paramedics. The District was the first fire agency in San Mateo County to have paramedics on each fire engine, beginning on December 19, 1994. Engineer Paramedic Michael Cochrane administered the first Advanced Life Support treatment to a pediatric patient in respiratory distress four minutes into the morning of that first day. In November of 1998, the Board of Directors hired Chief Miles Julihn, who retired in 2002. In September of 2002, the Board appointed Paul S. Wilson as the Fire Chief. He served for not quite three years. On August 22, 2005, Douglas Sporleder was appointed as the District’s Fire Chief. Chief Sporleder retired from the District and was followed by the District’s current Fire Chief, Harold Schapelhouman. Chief Schapelhouman joined the District in 1981, and was appointed Fire Chief in January of 2007. Chief Schapelhouman sets an example of resilience, fortitude and a commitment to public service. His leadership and foresight support the District’s Board, employees and their collective mission. Over the years, the population of the Menlo Park Fire Protection District has grown significantly, and stations have been added as new communities formed. The District boundaries grew to cover approximately seventeen square miles by the 1940's. In recent years, much of the marshland and bay water area has been added to the District's responsibilities, enlarging the District’s geographic area to thirty square miles. The District provides emergency response services from seven fire stations. The seventh fire station was added in the eastern portion of the City of Menlo Park in 1997. On October 12, 1993, the Menlo Park Fire Protection District entered into an agreement with the Federal Emergency Management Administration (FEMA) and the State of California and became the sponsoring agency for California Task Force 3 Urban Search and Rescue. The Task Force provides critical emergency response services as one of twenty-eight teams that comprise the National Search and Rescue Response System. Chief Schapelhouman led the District’s deployment to New York in response to the September 11th tragedy and to the District’s deployment to New Orleans during the aftermath of hurricane Katrina. The Menlo Park Fire Protection District’s Urban Search and Rescue Task Force has a distinguished record of response to the nation’s most significant emergencies. The Fire District Today The Menlo Park Fire Protection District is a Special District as defined under the Fire Protection District Law of 1987, Health and Safety Code Section 13800, of the State of California. The Board of Directors consists of five locally elected citizens, who serve four-year terms. Any resident of the Fire District who is over the age of eighteen and a registered voter, may run for a Board seat. Elections are held every two years, on the years ending in odd numbers. In November of 2015, two seats were open and the two current incumbents were appointed for another four-year term. The Board President and the Vice President are elected by the Board

_____________________________________________________________________________________x 2016 Menlo Park Fire Protection District Comprehensive Annual Financial Report
from its own ranks and serve for one-year terms. The Board meets once a month in the classroom at Fire Station 1. The Fire District budgeted 113.8 full time equivalent employees (FTE). Of this total, 94 FTE provide direct fire services. These frontline Fire District employees are supported by 19.8 staff members who provide day-to-day administrative and financial services, maintain and manage the Fire District’s fleet of vehicles, and oversee emergency preparedness, including the management of citizen volunteers in the Community Emergency Response Team (CERT) program. The Fire District also has a robust succession planning program to ensure that the Fire District has the staff resources needed to maintain a high-level service to the community. Promotional tests and academies are held annually to advance high performing firefighters to Engineers and Captains and to recruit new firefighters to fill vacancies. The Fire District is responsible for providing the highest level of emergency and non-emergency services to the community in an effort to protect and preserve life and property from the impact of fire, disaster, injury and illness. The Menlo Park Fire Protection District protects a growing population of over 100,000 residents with seven fire stations, strategically placed to minimize response times. Within the Fire District’s response area are Facebook’s corporate headquarters, the office of the United States Geological Survey (USGS), a Veteran’s Affairs Hospital (VA), and the Stanford Research Institute (SRI). As the primary first responder, the Menlo Park Fire Protection District answers approximately 8,500 calls a year that are reported to the National Fire Incident Reporting System (NIFRS). Emergency call dispatching is provided through a countywide consolidated Fire Dispatch Center. The Menlo Park Fire Protection District is also the proud sponsor of California Task Force 3, an Urban Search and Rescue Program affiliated with the Federal Emergency Management Agency (FEMA). In the past, the Task Force has responded to hurricanes, earth quakes, acts of terrorism, tornadoes, floods, and most recently a large mudslide.
The Task Force in December of 2015 completed a Full-Scale Mobilization Exercise executed for a consecutive 33 hours at Levi’s Stadium and California’s Great America, Santa Clara. The exercise tested the mobilization and operations of California Task Force 3 Type-1 Team with Support personnel (79 people). To manage the exercise 21 Exercise Controllers, 24 Support Staff, 14 Peer Evaluators comprised from the other seven California Task Forces were also deployed. Additionally the Santa Clara Fire Department (AHJ), Santa Clara County Fire Department, San Jose Fire Department, California Task Force 5 – Type I Cache, Department of the Energy Radiological Assistance Program (RAP), Region 7 and the California Office of Emergency Services – Fire and Rescue Branch all participated in the exercise.
The exercise was scenario based assuming damage subsequent to a magnitude 7.8 earthquake on the San Andreas Fault. Injects assumed reports of damaged structures, numerous missing and trapped personnel. The scenario design incorporated activities exercising the National US&R Response System Operations Manual 2012, ANNEX B Concept of Operations, US&R Operations in a Contaminated Environment (US&R HazMat Operations) October 2013, ANNEX C Concept of Operations and US&R Operations in the Water Environment (US&R Water Operations) August 2013. The Task Force successfully met all the set objectives and completed all five sections of the FEMA OREEP: Activation of a Type I US&R Team,
_____________________________________________________________________________________2016 Menlo Park Fire Protection District Comprehensive Annual Financial Report xi
Transportation of Personnel and Cache Equipment, Establish a Base of Operations, On-Site Operations and Demobilization/After Action/Improvement Planning.
Overall, the Fire District provides a wide range of emergency services consisting of fire suppression, prevention, rescue, emergency medical services, emergency preparedness, public education, arson investigation, and fire and hazardous materials inspections. In March 2012, with the adoption by the Board of Directors of Resolution No. 1516-2012, the District began providing fire protection services to the Stanford Linear Accelerator Center (SLAC) under a memorandum of agreement, upon receiving a request from Stanford University for such services. This agreement was renewed in March of 2015 for a period of five years. The scope of assistance, as defined in the agreement, includes the provision by the Fire District of fire suppression, technical rescue, and emergency medical services within the SLAC Service Area. The scope of assistance is determined based on an incident-by-incident basis and the volume of calls and type of response. The Fire District’s fire suppression activities include responses to structural, wild land, and vehicular fires, as well as emergency medical services. The Fire District also provides management, planning, and training services to SLAC. The Fire District receives fees on a monthly basis related to ongoing, site specific reviews, training, and preparation. Basic emergency services are not subject to a fee, unless they involve significant incidents lasting over two hours. Such services are billed at rates set within the agreement. The Fire District places a high priority on injury and illness prevention in all areas of emergency response, daily operations and administrative activities, and it provides safe and healthy working conditions for Fire District employees. The Fire District’s safety policy, “Injury and Illness Prevention Program,” ensures employees have a safe and healthy workplace by identifying responsibilities to be followed by management and employees. The Fire District’s program meets or exceeds the requirements of California Code of Regulations, Title 8, and section 3203. It applies to all full and part-time employees, cadets, interns, temporary employees and volunteers working for the Fire District. In addition, the District completed the implementation of the OSHA required safety programs in 2014. Furthermore, the Fire District completed a Standards of Cover Assessment (SOC) in June 2015. The study included a review of the current deployment system from existing District fire station locations, current deployment models that include apparatus configurations and personnel staffing, changing local development activity and the related traffic impact and congestion models along with other helpful risk related data and information. The Board of Directors met in early 2016 to review a 5-10 year plan with short and long term goals to address the SOC study recommendations and consider the potential impact on District finances. The Fire District’s Fire Prevention Bureau implemented a new key secure program on all engines and code enforcement vehicles, which has increased security and protection for the community. Adoption of the 2013 Fire Code and District Ordinance allows the Fire District to enforce regulations that relate to non-construction related items such as fire access roads, administrative functions and guidelines and standards related to local infrastructure. The Fire District’s Comprehensive Annual Financial Report The Pun Group LLP, a firm of certified public accountants, has audited the Fire District’s financial statements for the fiscal year ended June 30, 2016. The independent audit provides the reader reasonable assurance that the financial statements are free of material misstatements. The independent audit involved examining, on a test basis, evidence supporting the amounts and

_____________________________________________________________________________________xii 2016 Menlo Park Fire Protection District Comprehensive Annual Financial Report
disclosures in the financial statements, assessing the accounting principles used, and evaluating the overall financial statement presentation. Based upon the audit, the independent auditors concluded that there was reasonable basis for rendering an unqualified opinion that the Fire District’s financial statements for the fiscal year ended June 30, 2016 are fairly presented in conformity with generally accepted accounting principles (GAAP). The independent auditor’s report is presented with the financial section of this report. This Comprehensive Annual Financial Report is presented in five sections:
1. Introductory section, which includes the transmittal letter and general information. 2. Management’s Discussion and Analysis. 3. The Basic Financial Statements, including the government-wide and the fund financial
statements, along with notes to the financial statements. 4. Required supplemental information. 5. Statistical information.
This Comprehensive Annual Financial Report will be submitted to the Government Finance Officers Association (GFOA) for consideration to be awarded its Achievement of Excellence in financial reporting certification. This award is granted only to entities whose reports meet the highest standards of municipal financial reporting. Accounting System and Budgetary Control The Fire District’s accounting records are maintained on a modified accrual basis. Revenues are recorded when both measurable and available, and expenditures are recorded when goods or services are received. The Fire District’s budget is adopted by resolution prior to the Special District State-mandated deadline of October 1st. The Fire District targets the final Board meeting in June for the annual adoption of the budget, tying the process to the fiscal year. Revenues and expenditures in the General Fund are authorized in the final budget resolution at the fund level. The Division Chiefs are held accountable at the Division level, by major expenditure categories. The Transfers into the Debt Service Funds are budgeted based on the average total coupon payment, less the final two payments, which are part of the reserve balance requirement. Capital projects are budgeted at the individual project level. California Urban Search and Rescue Task Force 3 is budgeted based upon a cooperative agreement in compliance with the restrictions of the grant. Amounts set aside as reserves or designations in a fund which in the opinion of the Board are no longer necessary, amounts appropriated as contingencies in a fund, transfers between budget units, and other budgetary designations may be created, eliminated, revised in amount, or otherwise amended by an affirmative vote of three members of the Board at any regular or special meeting. In June 2011, the Board of Directors authorized by Resolution No. 1458-2011 and No. 1505-2011, the adoption of a formal fund balance policy and the reclassification of the Fire District’s fund balance to comply with GASB Statement No. 54. The Fund Balance Policy is designed to strengthen the Fire District’s oversight of reserve funds and to ensure that the Fire District is optimally positioned to respond to fiscal challenges. The policy is reviewed and reauthorized by a Board Resolution annually.

_____________________________________________________________________________________2016 Menlo Park Fire Protection District Comprehensive Annual Financial Report xiii
Internal Control On August 6, 2008, in order to comply with Statement on Auditing Standards (SAS) No. 114, regarding the auditors’ communication with those charged with governance, the Board of Directors appointed the Fire District’s Finance Committee, which is comprised of two Board members and a member of the public community, to act as a point of contact for communication with the Fire District’s auditors and established a process for the Board Members to receive full disclosure of the Fire District’s audit results. For the year ended June 30, 2016, the auditors had no comments or findings to report to the Audit Committee. Leveraging the limited staff resources available, the Fire District has put in place all reasonable checks and balances and taken steps to ensure the effectiveness of internal accounting controls. Internal accounting controls are designed to provide reasonable assurance. Local Economic Factors The Fire District benefited financially from a strengthening local and State economy in recent years. The Fire District is dependent on property taxes to support operations. In 2015-16, the net property tax revenue accounted for almost 91% of operating revenue received. The improvement in the economy directly impacts the Fire District’s property tax base. During fiscal years 2010-11 and 2011-12, growth in the assessed valuation roll was minimal, leading to a flattening in property tax receipts. In 2012-13, however, assessed values grew by over five percent and continued to grow into the 2016-17 fiscal year. The San Mateo County Assessor’s Office is projecting continued growth for 2017-18. The following chart demonstrates ten years of assessed valuation history for the Fire District.
Highlighting the recovery of the local economy is the social networking service, Facebook, which moved to the city of Menlo Park in 2011. The firm entered into a fifteen-year building lease with the Oracle Corporation East campus, with an option to purchase the property after five years. Facebook conducted a major redevelopment of the property and the Fire District is in the process of working closely with the company on the construction of its West campus, which consists of about 1,000,000 square feet on the old Tyco Electronics property. With a growing number of employees and a growing campus, Facebook has helped the local economy

_____________________________________________________________________________________xiv 2016 Menlo Park Fire Protection District Comprehensive Annual Financial Report
tremendously. The Fire District has received permit fees and other fees, such as a Traffic Pre-emption device fee, and provides fire services and emergency services as needed. Management’s Discussion and Analysis, which follows this Introductory Section, includes an extensive discussion on the Fire District’s property tax base and other economic factors. Fiscal and Financial Planning The Board of Directors places a high priority on closely monitoring the impact of changing economic conditions on the Fire District’s finances and upon the District’s ability to maintain current service levels, meet infrastructure needs, and build and maintain sufficient reserve balances. The Board is committed to following fiscally responsible decision-making criteria. The budget preparation and adoption process is guided by several basic fiscal tenets:
Ongoing operating expenditures are to be paid with ongoing operating revenues. Services provided by Fire District Staff that have a cost recovery element should
be as close to a 100% cost recovery as is feasible. Alternate revenue sources such as grants are encouraged with the caveat that the
associated expenditures have a limited life equal to that of the revenue source. Paid time off balances, such as annual leave, will be funded at 100% pay out
values per Memorandum(s) of Understanding and compensation and benefit plans effective at the end of each fiscal year.
The Fire District has incorporated these tenets into its fiscal strategies and uses them to set fiscally responsible short and long-term goals. The District is currently in a period of revenue growth after recovering from the greatest recession since the Great Depression. The District was able to minimize the negative impacts on our residents and customers, and continue to provide superior level services, and weathered those tough economic times while continuing to balance the General Fund. Awards and Acknowledgments The Government Finance Officers Association of the United States of America and Canada (GFOA) awarded a Certificate of Achievement for Excellence in Financial Reporting to the Menlo Park Fire Protection District for its comprehensive annual financial report for the year ended June 30, 2015. This was the fifth year the Fire District has achieved this prestigious fiscal award. In order to be awarded a Certificate of Achievement, a governmental entity must publish an easily readable and efficiently organized Comprehensive Annual Financial Report (CAFR). This report must satisfy both generally accepted accounting principles and applicable legal requirements.
The Menlo Park Fire Protection District believes that submitting the Fire District’s CAFR for award consideration provides reassurance to readers of the CAFR of the document’s quality and accountability.

_____________________________________________________________________________________2016 Menlo Park Fire Protection District Comprehensive Annual Financial Report xv
I would like to thank all the members of the Fire District’s staff who were involved in the preparation of the 2015-16 CAFR and who continue to provide outstanding support to the day-to-day financial management of the Fire District. I would also like to thank the Board of Directors and the Finance Committee for their continuing support of the Fire District’s efforts to achieve excellence in financial reporting. Respectfully submitted, __________________________ Harold Schapelhouman Fire Chief

xvi

INDEPENDENT AUDITORS’ REPORT To the Honorable Board of Directors
of the Menlo Park Fire Protection District Menlo Park, California Report on Financial Statements We have audited the accompanying financial statements of the governmental activities and each major fund of the Menlo Park Fire Protection District (the “District”), as of and for the year ended June 30, 2016, and the related notes to the basic financial statements, which collectively comprise the District’s basic financial statements as listed in the table of contents. Management’s Responsibility for the Financial Statements
Management is responsible for the preparation and fair presentation of these financial statements in accordance with accounting principles generally accepted in the United States of America; this includes the design, implementation, and maintenance of internal control relevant to the preparation and fair presentation of financial statements that are free from material misstatement, whether due to fraud or error.
Auditor’s Responsibility Our responsibility is to express opinions on these financial statements based on our audit. We conducted our audit in accordance with auditing standards generally accepted in the United States of America. Those standards require that we plan and perform the audit to obtain reasonable assurance about whether the financial statements are free from material misstatement. An audit involves performing procedures to obtain audit evidence about the amounts and disclosures in the financial statements. The procedures selected depend on the auditor’s judgment, including the assessment of the risks of material misstatement of the financial statements, whether due to fraud or error. In making those risk assessments, the auditor considers internal control relevant to the entity’s preparation and fair presentation of the financial statements in order to design audit procedures that are appropriate in the circumstances, but not for the purpose of expressing an opinion on the effectiveness of the entity’s internal control. Accordingly, we express no such opinion. An audit also includes evaluating the appropriateness of accounting policies used and the reasonableness of significant accounting estimates made by management, as well as evaluating the overall presentation of the financial statements. We believe that the audit evidence we have obtained is sufficient and appropriate to provide a basis for our audit opinions. Opinions In our opinion, the financial statements referred to above present fairly, in all material respects, the respective financial position of the governmental activities, and each major fund of the District, as of June 30, 2016, and the respective changes in financial position for the year then ended in accordance with accounting principles generally accepted in the United States of America. 2121 North California Blvd., Suite 290, Walnut Creek, California 94596
Tel: 925-974-3394 • Fax: 925-974-3501www.pungroup.com
3939352 Pun & McGeady_L_final.pdf 3 1/14/14 3:48 PM

To the Honorable Board of Directors of the Menlo Park Fire Protection District
Menlo Park, California Page 2
2
Other Matters
Required Supplementary Information
Accounting principles generally accepted in the United States of America require that the Management’s Discussion and Analysis, Budgetary Comparison Schedules, Schedule of Proportionate Share of Net Pension Liability, Schedule of Contributions and Schedule of Funding Progress for Other Postemployment Benefits, on pages 5 to 31 and 83 to 92 be presented to supplement the basic financial statements. Such information, although not a part of the basic financial statements, is required by the Governmental Accounting Standards Board, who considers it to be an essential part of financial reporting for placing the basic financial statements in an appropriate operational, economic, or historical context. We have applied certain limited procedures to the required supplementary information in accordance with auditing standards generally accepted in the United States of America, which consisted of inquiries of management about the methods of preparing the information and comparing the information for consistency with management’s responses to our inquiries, the basic financial statements, and other knowledge we obtained during our audit of the basic financial statements. We do not express an opinion or provide any assurance on the information because the limited procedures do not provide us with sufficient evidence to express an opinion or provide any assurance.
Other Information
Our audit was conducted for the purpose of forming opinions on the financial statements that collectively comprise the District’s basic financial statements. The Introductory Section, Budgetary Comparison Schedules, and Statistical Section, are presented for purposes of additional analysis and are not a required part of the basic financial statements.
The Budgetary Comparison Schedules are the responsibility of management and were derived from and relate directly to the underlying accounting and other records used to prepare the basic financial statements. Such information has been subjected to the auditing procedures applied in the audit of the basic financial statements and certain additional procedures, including comparing and reconciling such information directly to the underlying accounting and other records used to prepare the basic financial statements or to the basic financial statements themselves, and other additional procedures in accordance with auditing standards generally accepted in the United States of America. In our opinion, the Budgetary Comparison Schedules are fairly stated in all material respects in relation to the basic financial statements as a whole.
The Introductory and Statistical Sections have not been subjected to the auditing procedures applied in the audit of the basic financial statements, and accordingly, we do not express an opinion or provide any assurance on them.
Other Reporting Required by Government Auditing Standards
In accordance with Government Auditing Standards, we have also issued our report dated December 19, 2016, on our consideration of the District’s internal control over financial reporting and on our tests of its compliance with certain provisions of laws, regulations, contracts, and grant agreements and other matters. The purpose of that report is to describe the scope of our testing of internal control over financial reporting and compliance and the results of that testing, and not to provide an opinion on internal control over financial reporting or on compliance. That report is an integral part of an audit performed in accordance with Government Auditing Standards in considering the District’s internal control over financial reporting and compliance.
Walnut Creek, California December 19, 2016

REPORT ON INTERNAL CONTROL OVER FINANCIAL REPORTING AND ON COMPLIANCE AND OTHER MATTERS BASED ON AN AUDIT OF FINANCIAL STATEMENTS PERFORMED IN
ACCORDANCE WITH GOVERNMENT AUDITING STANDARDS
Independent Auditors’ Report
To the Honorable Board of Directors of the Menlo Park Fire Protection District
Menlo Park, California
We have audited, in accordance with the auditing standards generally accepted in the United States of America and the standards applicable to financial audits contained in Government Auditing Standards issued by the Comptroller General of the United States, the financial statements of the governmental activities and each major fund of the Menlo Park Fire Protection District (the “District”), as of and for the year ended June 30, 2016, and the related notes to the financial statements, which collectively comprise the District’s basic financial statements, and have issued our report thereon dated December 19, 2016.
Internal Control over Financial Reporting
In planning and performing our audit of the financial statements, we considered the District’s internal control over financial reporting (internal control) to determine the audit procedures that are appropriate in the circumstances for the purpose of expressing our opinions on the financial statements, but not for the purpose of expressing an opinion on the effectiveness of the District’s internal control. Accordingly, we do not express an opinion on the effectiveness of the District’s internal control.
A deficiency in internal control exists when the design or operation of a control does not allow management or employees, in the normal course of performing their assigned functions, to prevent, or detect and correct, misstatements on a timely basis. A material weakness is a deficiency, or a combination of deficiencies, in internal control, such that there is a reasonable possibility that a material misstatement of the entity’s financial statements will not be prevented, or detected and corrected on a timely basis. A significant deficiency is a deficiency, or a combination of deficiencies, in internal control that is less severe than a material weakness, yet important enough to merit attention by those charged with governance.
Our consideration of internal control was for the limited purpose described in the first paragraph of this section and was not designed to identify all deficiencies in internal control that might be material weaknesses or, significant deficiencies. Given these limitations, during our audit we did not identify any deficiencies in internal control that we consider to be material weaknesses. However, material weaknesses may exist that have not been identified.
2121 North California Blvd., Suite 290, Walnut Creek, California 94596 Tel: 925-974-3394 • Fax: 925-974-3501
www.pungroup.com
3939352 Pun & McGeady_L_final.pdf 3 1/14/14 3:48 PM

To the Honorable Board of Directors of the Menlo Park Fire Protection District
Menlo Park, California Page 2
4
Compliance and Other Matters
As part of obtaining reasonable assurance about whether the District’s financial statements are free from material misstatement, we performed tests of its compliance with certain provisions of laws, regulations, contracts, and grant agreements, noncompliance with which could have a direct and material effect on the determination of financial statement amounts. However, providing an opinion on compliance with those provisions was not an objective of our audit, and accordingly, we do not express such an opinion. The results of our tests disclosed no instances of noncompliance or other matters that are required to be reported under Government Auditing Standards.
The purpose of this report is solely to describe the scope of our testing of internal control and compliance and the results of that testing, and not to provide an opinion on the effectiveness of the entity’s internal control or on compliance. This report is an integral part of an audit performed in accordance with Government Auditing Standards in considering the entity’s internal control and compliance. Accordingly, this communication is not suitable for any other purpose.
Walnut Creek, California December 19, 2016

Menlo Park Fire Protection District Management’s Discussion and Analysis
For the Year Ended June 30, 2016
5
INTRODUCTION The following provides an overview and analysis of fiscal operations during the fiscal year ended June 30, 2016 for the Menlo Park Fire Protection District. The Management’s Discussion and Analysis (MD&A) is to be read in conjunction with the annual Transmittal Letter and the Basic Financial Statements. Management’s Discussion and Analysis is a component of the Comprehensive Annual Financial Report. FISCAL YEAR 2015-16 FINANCIAL HIGHLIGHTS Government-wide:
The District ended its fiscal year with a total net position of $54.6 million. Total program expenses, including depreciation and interest on long-term debt, were $34.7
million. Total program revenues were $3.3 million. Total general revenues were $42.4 million. Net position increased by $10.9 million over the prior year.
General Fund:
The General Fund operating revenue exceeded expenditures by $13.9 million before transfers out to other funds of $11 million are considered.
Total fund balance for the General Fund increased by $2.9 million during 2015-16. The actual revenues received in the General Fund were $3.5 million, or 8.6%, more than the prior
year. Actual expenditures were $2.8 million, or 8.6%, less than the original budget amount and the final
budgeted amount. As of June 30, 2016, the total fund balance for the General Fund was $41.5 million, of which
$26.2 million was Committed, $13.7 million was Assigned, and $0.9 million was Non-spendable. As of June 30, 2016, the Unassigned fund balance for the General Fund was $0.2 million, or .53%
of total revenue. OVERVIEW OF THE COMPREHENSIVE ANNUAL FINANCIAL REPORT This Comprehensive Annual Financial Report is presented in five sections:
1. Introductory section, which includes the transmittal letter and general information. 2. Management’s Discussion and Analysis. 3. Basic Financial Statements, including the government-wide and the fund financial statements, along
with notes to the basic financial statements. 4. Required Supplemental Information. 5. Statistical information.

Menlo Park Fire Protection District Management’s Discussion and Analysis (Continued)
For the Year Ended June 30, 2016
6
The Basic Financial Statements The Basic Financial Statements are comprised of Government-wide Financial Statements and Governmental Fund Financial Statements. These two sets of financial statements provide the reader with two different viewpoints of the District’s financial activities and financial position. Government-wide Financial Statements provide a longer-term view of the District’s activities as a whole, and comprise the Statement of Net Position and the Statement of Activities. The Statement of Net Position provides information about the financial position of the District as a whole, including all its capital assets and long-term liabilities on a full accrual basis, similar to that used by private corporations. The Statement of Activities provides information about all of the District’s revenues and/or expenses for each of the District’s programs. The Statement of Activities explains in detail the change in Net Position for the fiscal year. All of the District’s activities are required to be grouped into government activities and business type activities. All of the amounts in the Statement of Net Position and the Statement of Activities are separated into governmental activities and business-type activities in order to provide a summary of these two activities of the District as a whole. In the case of the Menlo Park Fire Protection District, there are no business-type activities as of June 30, 2016. The Statement of Net Position and the Statement of Activities present information about the following:
Governmental activities – All of the District’s basic services are considered to be governmental activities, specifically public safety. These services are supported by general District revenues such as taxes, and by specific program revenues, such as permit fees.
Business-type activities - Enterprise activities are reported here. They would include activities such as services that are supported by charges paid by users based on the level of use of the service. The District does not have any business-type activities at this time.
Government-wide financial statements are prepared on an accrual basis, which means they measure the flow of all economic resources of the District. Fund Financial Statements report the District’s operations in more detail than the government-wide statements and focus primarily on the short-term activities of the District’s General Fund and other major funds. The Fund Financial Statements measure only current revenues, current expenses and fund balances. They exclude capital assets, long-term debt, and other long-term amounts. Fund financial statements provide detailed information about each of the District’s most significant funds, called major funds. The concept of major funds, and the determination of which are major funds, was established by Governmental Accounting Standards Board Statement No. 34 (GASB No. 34) and replaces the concept of combining like funds and presenting them in total. Instead, each major fund is presented individually, with all non-major funds summarized and presented only in a single column. Major funds present the major activities of the District for the fiscal year, and may change from year-to-year as a result of changes in the pattern of the District’s activities. For the year ended June 30, 2016, the district presents all funds as major.

Menlo Park Fire Protection District Management’s Discussion and Analysis (Continued)
For the Year Ended June 30, 2016
7
Also, as reflected in the balance sheet of the governmental funds and in the notes to basic financial statements, in June of 2011 the District implemented several changes in the structure of the District’s fund balance to comply with GASB No. 54. The District’s reserve policy distinguishes fund balances between amounts that are considered non-spendable, such as fund balances associated with inventories, and other amounts classified based on the relative strength of the constraints that control the purposes for which specific amounts can be spent. In June 2012, the District’s Board of Directors strengthened the reserve policy to ensure that the District is optimally positioned to respond to fiscal downturns. The reclassification of unassigned fund balances supports long term fiscal planning by the Board of Directors. In June 2015, the Board of Directors approved simplifying the structure of fund balances by combining the ones close in nature. In addition, the District’s financial statements are presented in compliance with GASB No. 68. This Statement establishes standards for measuring and recognizing liabilities, deferred outflows of resources, deferred inflows of resources, and expenses related to the Pension Plans. For defined benefit pensions, the Statement identifies the methods and assumptions that should be used to project benefit payments and specifies the note disclosure and supplementary information requirements. Governmental Fund Financial Statements are prepared on the modified accrual basis, which means they measure only current financial resources and uses. Capital assets and other long-lived assets, along with long-term liabilities, are not presented in the Governmental Fund Financial Statements. Unlike the Government-wide Financial Statements, Governmental Fund Financial Statements focus on the near-term inflows and outflows of spendable resources, as well as on balances of spendable resources available at the end of the fiscal year. Such information may be useful in evaluating the District’s near-term financing requirements. Enterprise Funds – The Menlo Park Fire Protection District does not have any Enterprise Funds at this time. Proprietary Funds – The Menlo Park Fire Protection District does not have any Proprietary Funds at this time. Fiduciary Funds – These funds are used to account for the assets held by the District in a trustee capacity or as an agent for individuals, private organizations, other governmental units, and/or other funds. The Menlo Park Fire Protection District does not have any Fiduciary Funds at this time. Notes to Basic Financial Statements Notes to the Financial Statements provide additional information that is essential to understand the data provided in the Government-wide and Fund Financial Statements. Required Supplemental Information Required supplemental information follows the basic financial statements and includes a budgetary comparison schedule which includes a reconciliation between the statutory fund balance for budgetary purposes and the fund balance for the General Fund as presented in the governmental fund financial statements.

Menlo Park Fire Protection District Management’s Discussion and Analysis (Continued)
For the Year Ended June 30, 2016
8
Combining and Individual Fund Statements and Schedules Combining and individual Fund Statements and schedules provide information for non-major governmental funds, and special revenue funds. The District does not have non-major governmental funds.
Government-wide Financial Analysis A governmental entity’s net financial position, roughly defined as assets minus liabilities, provides an indication of the entity’s ability to meet current year obligations with available resources. However, the net position should not include inflows or outflows of resources that are applicable to the future period. GASB No. 65 and 68 specifically address the issue of properly accounting for resources in the period in which they are applicable. It is designed to ensure what is called “inter period equity,” and accurate current period financial reporting is essential to provide oversight boards and stakeholders a clear picture of the entity’s financial health. To fully comply with GASB No. 65 and 68, the District’s fiscal year 2015-16 financial statements are presented with the appropriate deferred inflows and outflows of resources, as well as the District’s net pension liability, properly stated alongside the District’s assets and other liabilities. Chart 1 presents the 2015-16 financial data. The significant variances and change in net position are noted in the chart and explained further below. Note that the change in net position is reflective of the adoption of GASB No. 68 in the latest fiscal year. Chart 1 provides a comparison of the District’s net position as of June 30th for fiscal years ending in 2015 and 2016. Long-term liabilities substantially decreased primarily as result of the pension plan investment earnings. The deferred outflow of resources increased due to purchases of capital assets for the District’s ongoing operation. Almost 29% of the District’s net position is invested in capital assets (e.g., land, buildings, general governmental infrastructure, equipment, etc.) less any related outstanding debt used to acquire those assets. The District uses these capital assets to support its ongoing services to the community, so these assets are not available for future spending. About 68% of the District’s net position consists of unrestricted funds that may be used to support the District’s ongoing operations and obligations.

Menlo Park Fire Protection District Management’s Discussion and Analysis (Continued)
For the Year Ended June 30, 2016
9
Chart 1 – Governmental Activities Net Position (000’s)
Category 2014-15 2015-16 Inc/(Dec) $ Inc/(Dec) %
Cash and Investments 63,607$ 71,331$ 7,724$ 12.1%
Other Assets 6,983 7,193 210 3.0%
Capital Assets, Net of Depreciation 22,863 26,438 3,575 15.6%
Total Assets 93,453$ 104,962$ 11,509$ 12.3%
Deferred Outflow of Resources 15,713$ 8,683$ (7,030)$ -44.7%
Total Assets & Def. Outflow of Resources 109,166$ 113,645$ 4,479$ 4.1%
Current Liabilities 5,929$ 5,602$ (327)$ -5.5%
Long-term Liabilities 48,133 41,537 (6,596) -13.7%
Total Liabilities 54,062$ 47,139$ (6,923)$ -12.8%
Deferred Inflow of Resources 11,422$ 11,889$ 467$ 4.1%
Total Liabilities & Def. Inflow of Resources 65,484$ 59,028$ (6,456)$ -9.9%
Net Position:
Net Investment in Capital Assets 11,848$ 15,683$ 3,835$ 32.4%
Restricted:
FEMA - 10 10 0.0%
Debt Service 1,391 1,097 (294) -21.1%
Contractual requirements - 456 456 0.0%
Unrestricted 30,443 37,371 6,928 22.8%
Total Net Position 43,682$ 54,617$ 10,935$ 25.0%
Net Position as % of Total:
Invested in Capital 27.1% 28.7%
Restricted 3.2% 2.9%
Unrestricted 69.7% 68.4%
Total 100.0% 100.0%

Menlo Park Fire Protection District Management’s Discussion and Analysis (Continued)
For the Year Ended June 30, 2016
10
Chart 2 highlights revenues and expenses for the same two fiscal years and shows the impact on the net position.
Chart 2 – Governmental Activities
Statement of Activities (000’s)
Category 2014-15 2015-16 Inc/(Dec) $ Inc/(Dec) %
Program Revenues
Operating Grants and Contributions 1,701$ 1,843$ 142$ 8.3%
Charges for Services 1,292 1,462 170 13.2%
General Revenues
Property Taxes 37,954 41,309 3,355 8.8%
Use of Money and Property 150 205 55 36.7%
Other Revenue and Gain on Assets Sales 1,256 864 (392) -31.2%
Total Revenues 42,353$ 45,683$ 3,330$ 7.9%
Public Safety - Fire 29,885$ 33,977$ 4,092$ 13.7%
Interest on Long-term Debt 979 771 (208) -21.2%
Total Program Expenses 30,864$ 34,748$ 3,884$ 12.6%
Change in Net Position 11,489$ 10,935$ (554)$ -4.8%
Net Position July 1st 32,193 43,682 11,489 35.7%
Net Position, June 30th 43,682$ 54,617$ 10,935$ 25.0% Government-wide revenues increased by almost $3.3 million, or 7.9%, year-over-year. During the fiscal year, the District did not have any special items or unanticipated revenue to report. The following provides an overview of the components of the increase in revenues:
Property Taxes: The District’s total net property taxes increased by $3.4 million, or 8.8%. This was the net result of several factors. The secured and unsecured property tax revenue increased by 10% due to higher assessed property values within San Mateo County. The increased in secured and unsecured property taxes revenues were offset with other decreased in property taxes. The District’s net Educational Revenue Augmentation Fund (ERAF) Rebate was 5.8% lower than the 2014-15 amount. The revenue received from this source can fluctuate significantly from year-to-year. It is expected that this revenue will decrease in the next fiscal year and may be eliminated in future years. Redevelopment Agency revenues from the Successor Agencies decreased by 37%. Finally, Homeowners’ Property Tax Relief (HOPTR) revenues decreased by 35%. Additional discussion of the District’s property tax revenues is included later in this MD&A in the discussion of General Fund performance.
Operating Grants and Contributions: Revenues increased by $0.1 million in 2015-16 compared
to 2014-15. This reflects the fact that in fiscal year 2015-16, the Federal Emergency Management Administration (FEMA) was approved for additional funding from a new grant.
Charges for Services: Revenues increased by $0.2 million. With the gradual improvement in the local economy, development activity increased during 2015-16.

Menlo Park Fire Protection District Management’s Discussion and Analysis (Continued)
For the Year Ended June 30, 2016
11
Other Revenue: Revenues decreased by $0.4M in 2015-16 compared to 2014-15. The District realized revenues for some emergency equipment such as Thermal Imaging and Defibrillators in 2014-15 and there were no such revenues in 2015-16.
Use of Money and Property: Revenue from interest earnings increased in 2015-16 because the rate of return earned by the District on idle funds increased slightly during the fiscal year. The Local Agency Investment Fund (LAIF) average annual yields for 2014-15 was 0.269% and for 2015-16, it was 0.434%.
Chart 3 illustrates the percentage of total revenues that each individual revenue source comprises. Property taxes are the most significant source of District revenues, representing about 90.5% of total revenues.
Chart 3 – Governmental Activities
2015-16 Revenues by Source

Menlo Park Fire Protection District Management’s Discussion and Analysis (Continued)
For the Year Ended June 30, 2016
12
Chart 4 provides a graphic depiction of the change in total revenue from 2014-15 to 2015-16, for each revenue source.
Chart 4 Governmental Activities 2015-16 Increase/Decrease in Revenue (000’s)
As Chart 2 illustrates, total program expenses within governmental activities increased by 12.6%, from $30.9 million to $34.7 million, a $3.9 million increase. The most significant increase in expenses was for Public Safety, which includes all of the operating costs of the District’s core services. Public Safety expenses were $34 million in 2015-16, which is about 98% of total governmental activities expenses. Chart 5 provides further detail about the program expenses of the District, comparing 2014-15 and 2015-16.
Chart 5 – Governmental Activities Expense Detail Comparison (000’s)
Category 2014-15 2015-16 Inc/(Dec) $ Inc/(Dec) %
Salaries and Benefits 23,618$ 27,185$ 3,567$ 15.1%Service and Supplies 5,366 5,786 420 7.8%Depreciation 901 1,006 105 11.7% Total Public Safety - Fire 29,885$ 33,977$ 4,092$ 13.7%
Interest on Long-term Debt 979 771 (208) -21.2% Total Program Expenses 30,864$ 34,748$ 3,884$ 12.6%
The following factors provide an explanation for the 12.6% increase in total expenses:
Salaries and Benefits: Salaries and benefits increased by $3.6 million, or 15.1% in 2015-16. The primary reason for this increase was the increase in wages for the Districts’ employees.

Menlo Park Fire Protection District Management’s Discussion and Analysis (Continued)
For the Year Ended June 30, 2016
13
Services and Supplies: Expenses were $0.4 million higher in this category than in 2014-15. The District increased spending due to new development in 2015-16 and some expenses were from prior year’s postponement in spending that were incurred in this fiscal year.
Annual Depreciation: Depreciation expense increased by 11.7% due to additional improvements and the purchase of new fixed assets, such as vehicles and equipment.
Long-term Debt Interest Expense: Even though the interest payments on the Series A Certificates of Participation (COPS) will decrease gradually throughout the remaining life of the bond, for the fiscal year the interest expense shows a decreased of 21.2%.

Menlo Park Fire Protection District Management’s Discussion and Analysis (Continued)
For the Year Ended June 30, 2016
14
The District’s Fund Financial Statements As previously noted, the District uses fund accounting to ensure and demonstrate compliance with all applicable standards. Performance of Governmental Funds The focus of the District’s governmental funds is to provide information on the near-term inflows, outflows, and balances of spendable reserves. Such information is useful in assessing the District’s financing requirements. In particular, the unassigned fund balance may serve as a useful measure of the District’s new resources at the end of each fiscal year. The total balance of the District’s Governmental Funds as of June 30, 2016, was $72.2 million, an increase of $9.3 million, or 14.9% higher than at June 30, 2015. Chart 6 provides a comparison of the balance sheets for the Governmental Funds at June 30th for 2014-15 and 2015-16.
Chart 6 – Governmental Funds Balance Sheet Comparison (000’s)
Category 2014-15 2015-16 Inc/(Dec) $ Inc/(Dec) %
Cash and Investments 64,871$ 72,725$ 7,854$ 12.1%
Other Assets 2,410 2,694 284 11.8%
Total Assets 67,281$ 75,419$ 8,138$ 12.1%
Current Liabilities 3,817$ 2,579$ (1,238)$ -32.4%
Deferred Inflows of Resources;
Unavailable Revenues 623 659 36 5.8%
Total Liabilities & Def. Inflow of Resources 4,440$ 3,238$ (1,202)$ -27.1%
Fund Balances:
Nonspendable 617$ 921$ 304$ 49.3%
Restricted 1,391 1,563 172 12.4%
Committed 49,287 55,755 6,468 13.1%
Assigned 10,988 13,744 2,756 25.1%
Unassigned 558 198 (360) -64.5%
Total Fund Balances 62,841$ 72,181$ 9,340$ 14.9% As Chart 6 demonstrates, as of June 30, 2016, $72.2 million in the District’s Governmental Funds balance is allocated to several major categories, with $55.8 million in “Committed” fund balances and $13.7 million in “Assigned” fund balances. The District’s governmental funds include three “Major” funds: the General Fund, the Capital Improvement Fund, and the Debt Service Fund. A separate discussion of each provides a better understanding of the District’s financial position.

Menlo Park Fire Protection District Management’s Discussion and Analysis (Continued)
For the Year Ended June 30, 2016
15
The General Fund The General Fund is the main operating fund of the District. During the 2015-16 fiscal year, the total fund balance of the General Fund increased by $2.9 million, or 7.5%. As of June 30, 2016, the total fund balance was $41.5 million. Chart 7 provides a two-year comparison of the Balance Sheet for the General Fund.
Chart 7 – General Fund
Two-year Balance Sheet Comparison (000’s)
Category 2014-15 2015-16 Inc/(Dec) $ Inc/(Dec) %
Cash and Investments 40,328$ 41,624$ 1,296$ 3.2%
Other Assets 2,351 2,577 226 9.6%
Total Assets 42,679$ 44,201$ 1,522$ 3.6%
Current Liabilities 3,463$ 2,071$ (1,392)$ -40.2%
Deferred Inflows of Resources;
Unavailable Revenues 623 659 36 5.8%
Total Liabilities & Def. Inflow of Resources 4,086$ 2,730$ (1,356)$ -33.2%
Fund Balances:
Nonspendable 617$ 921$ 304$ 49.3%
Restricted 278 456 178 64.0%
Committed 26,152 26,152 - 0.0%
Assigned 10,988 13,744 2,756 25.1%
Unassigned 558 198 (360) -64.5%
Total Fund Balances 38,593$ 41,471$ 2,878$ 7.5% In order to analyze the factors leading to the General Fund’s increase in total fund balance, a review of the elements of the Statement of Revenues, Expenditures, and Changes in Fund Balance is essential. Chart 8 provides a two-year comparison of General Fund revenues and Chart 12 provides the same two-year comparison of General Fund expenditures.
Chart 8 – General Fund Two-year Revenue Comparison (000’s)
Category 2014-15 2015-16 Inc/(Dec) $ Inc/(Dec) %
Property Taxes 37,954$ 41,308$ 3,354$ 8.8%
Licenses and Permits 1,102 1,277 175 15.9%
Charges for Services 189 185 (4) -2.1%
Rents 155 78 (77) -49.7%
Grants 320 625 305 95.3%
Interest 130 205 75 57.7%
Other Revenue 891 576 (315) -35.4%
Total Revenues 40,741$ 44,254$ 3,513$ 8.6% Because the General Fund revenues are the primary source of funding support for the District, the performance of these revenues have been briefly discussed in the preceding Government-wide Financial Analysis. The importance of property tax revenues to the District, however, warrants additional discussion as they provide ninety-three percent of the District’s current resources. Property tax revenues grew by
Menlo Park Fire Protection District Management’s Discussion and Analysis (Continued)
For the Year Ended June 30, 2016
16
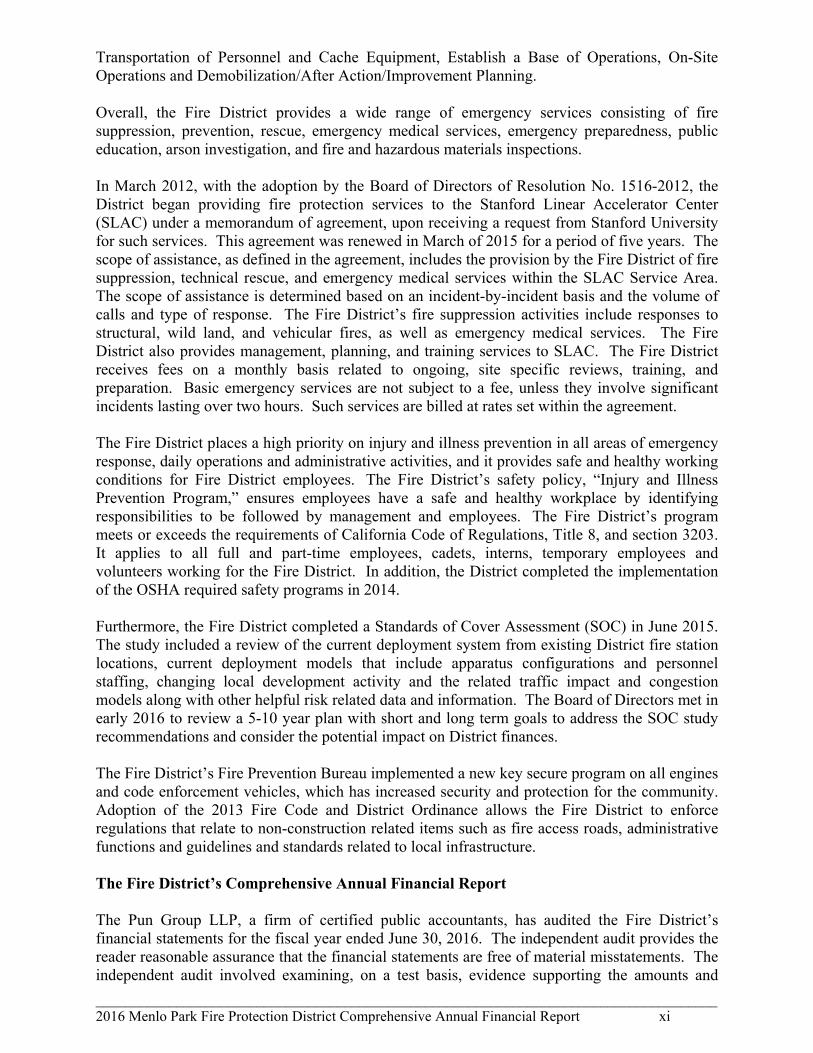
8.8%, or about $3.4 million, in 2015-16. The property tax revenues included in Chart 8 are net numbers and include all components, such as secured, unsecured, and prior year tax receipts. Also included is the net Educational Revenue Augmentation Fund (ERAF) impact upon property taxes. This is the difference between what the County shifts away from the District in property taxes for local schools and what is rebated back to the District as the prior year “excess” shift amount. Chart 9 shows the net ERAF impact for 2014-15 and 2015-16.
Chart 9 – Net ERAF Impact Two-year Comparison (000’s)
Description 2014-15 2015-16
ERAF Shift (4,317)$ (4,745)$ ERAF Rebate 3,174 2,990 Net Impact (1,143)$ (1,755)$
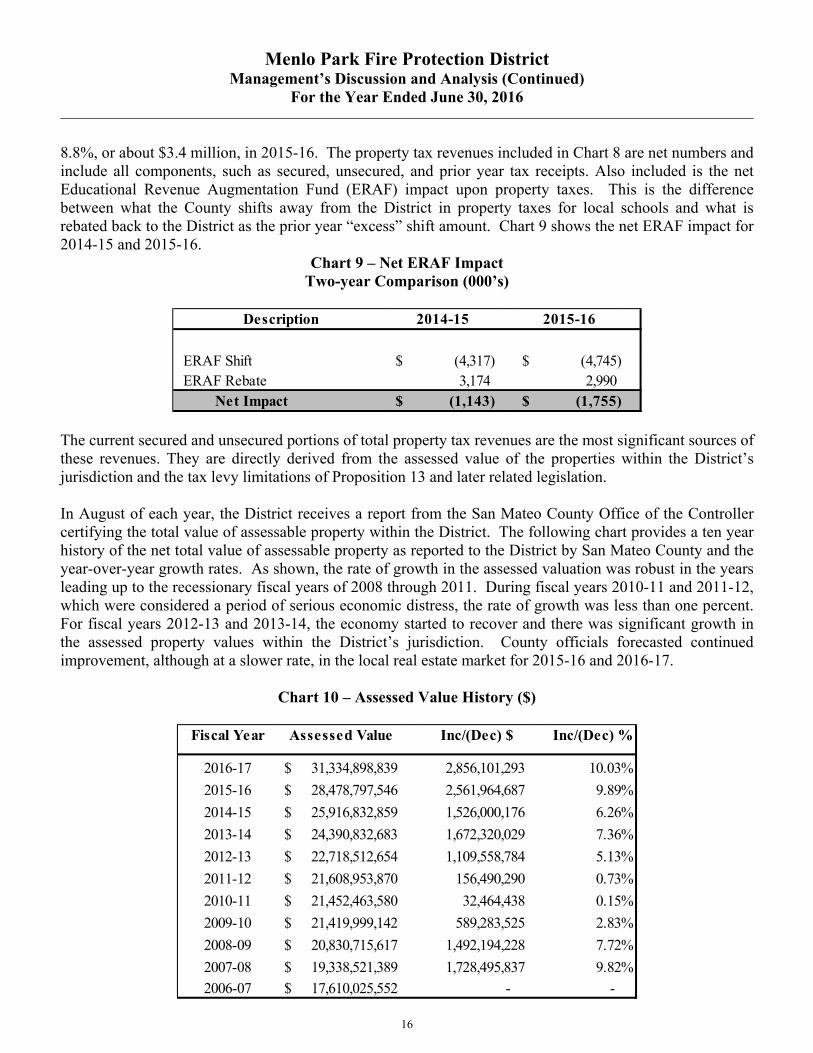
The current secured and unsecured portions of total property tax revenues are the most significant sources of these revenues. They are directly derived from the assessed value of the properties within the District’s jurisdiction and the tax levy limitations of Proposition 13 and later related legislation. In August of each year, the District receives a report from the San Mateo County Office of the Controller certifying the total value of assessable property within the District. The following chart provides a ten year history of the net total value of assessable property as reported to the District by San Mateo County and the year-over-year growth rates. As shown, the rate of growth in the assessed valuation was robust in the years leading up to the recessionary fiscal years of 2008 through 2011. During fiscal years 2010-11 and 2011-12, which were considered a period of serious economic distress, the rate of growth was less than one percent. For fiscal years 2012-13 and 2013-14, the economy started to recover and there was significant growth in the assessed property values within the District’s jurisdiction. County officials forecasted continued improvement, although at a slower rate, in the local real estate market for 2015-16 and 2016-17.
Chart 10 – Assessed Value History ($)
Fiscal Year Assessed Value Inc/(Dec) $ Inc/(Dec) %
2016-17 31,334,898,839$ 2,856,101,293 10.03%
2015-16 28,478,797,546$ 2,561,964,687 9.89%
2014-15 25,916,832,859$ 1,526,000,176 6.26%
2013-14 24,390,832,683$ 1,672,320,029 7.36%
2012-13 22,718,512,654$ 1,109,558,784 5.13%
2011-12 21,608,953,870$ 156,490,290 0.73%
2010-11 21,452,463,580$ 32,464,438 0.15%
2009-10 21,419,999,142$ 589,283,525 2.83%
2008-09 20,830,715,617$ 1,492,194,228 7.72%
2007-08 19,338,521,389$ 1,728,495,837 9.82%
2006-07 17,610,025,552$ - -

Menlo Park Fire Protection District Management’s Discussion and Analysis (Continued)
For the Year Ended June 30, 2016
17
Chart 11 graphically illustrates the assessed value history provided in Chart 10.
Chart 11 – Assessed Value History
The 8.8% increase in the District’s property tax revenues in 2015-16 is thus tied to the growth in the property assessment rolls. Based upon current economic trends and projections, the revenue is likely to continue its solid 2016-17 performance into the next fiscal year(s). The General Fund supports the District’s day-to-day operations. In 2015-16, General Fund expenditures decreased by about $10.6 million, or 25.8%, as is shown in Chart 12.
Chart 12 – General Fund Two-year Expenditure Comparison (000’s)
Category 2014-15 2015-16 Inc/(Dec) $ Inc/(Dec) %
Salaries and Benefits 35,262$ 24,566$ (10,696)$ -30.3%Service and Supplies 4,519 4,965 446 9.9%Capital Outlay 1,176 855 (321) -27.3% Total Expenses 40,957$ 30,386$ (10,571)$ -25.8%
Salaries and benefits accounted for 81% of General Fund expenditures in 2015-16, and experienced a significant decrease, which is attributable to the unfunded actuarial accrued liability of the Safety group retirement was paid down by $12 million in 2014-15. The General Fund services and supplies expenditure increase is primarily due to more spending on emergency repairs and consultant fees. This was primarily due to consultant services for temporary staffing, the Nexus study, and the Standards of Coverage study. In addition, the capital outlay expenditure decrease is due to delays in acquisition of new vehicles and equipment.

Menlo Park Fire Protection District Management’s Discussion and Analysis (Continued)
For the Year Ended June 30, 2016
18
The General Fund’s ending fund balance increase, as demonstrated in Chart 13, is the result of the net impact of the performance of its revenues and expenditures, adjusted for net Other Financing Uses.
Chart 13 – General Fund
Two-year Net Change in Fund Balance Comparison (000’s)
Category 2014-15 2015-16 Inc/(Dec) $ Inc/(Dec) %
Total Revenues 40,741$ 44,254$ 3,513$ 8.6%
Total Expenditures 40,957 30,386 (10,571) -25.8%
Excess of Revenue over Expenditures (216)$ 13,868$ 14,084$ -6520.4%
Net Other Financing Uses (6,523) (10,989) (4,466) 68.5%
Net Change in Fund Balance (6,739)$ 2,879$ 9,618$ -142.7%
Fund Balance at Beginning of Year 45,332 38,593 (6,739) -14.9%
Fund Balance at End of Year 38,593$ 41,472$ 2,879$ 7.5%
The “Other Financing Uses” in 2015-16 included a $10 million transfer to the Capital Improvement Fund and a $1 million transfer to the Debt Service Fund. In 2015-16, the total transfers to the Capital Improvement Fund significantly increased in comparison to the prior year. In the next section of this MD&A, the Capital Improvement Fund projects are explained. In summary, the most recent fiscal year saw revenues exceed expenditures. This was primarily due to the growth in assessed property valuation for the District and delays in spending on capital outlay. In future years, it is expected that the General Fund will be stable.

Menlo Park Fire Protection District Management’s Discussion and Analysis (Continued)
For the Year Ended June 30, 2016
19
Capital Improvement capital Projects Fund The District’s Capital Improvement Fund is used to account for the acquisition and/or construction of all major capital assets. Chart 14 provides a two-year comparison of the fund’s performance.
Chart 14 – Capital Improvement Fund Two-year Performance Comparison (000’s)
Category 2014-15 2015-16 Inc/(Dec) $
Revenues: Other Revenue -$ -$ -$ Total Revenues -$ -$ -$ Expenditures: - Capital Outlay 2,955$ 3,727$ 772$ Total Expenses 2,955$ 3,727$ 772 Excess of Revenues over Expenditures (2,955) (3,727) (772)$ Transfer In 5,674$ 10,039$ 4,365 Net Change in Fund Balance 2,719 6,312 3,593 Fund Balance at Beginning of Year 19,178 21,897 2,719 Fund Balance at End of Year 21,897$ 28,209$ 6,312
The Capital Improvement Fund’s ending fund balances grew by approximately $6.3 million, a 28.8% increase. This growth is mostly from the transfer of funds from the District’s General Fund for the purchase of a new building to accommodate the growing administrative personnel and to the Capital Improvement Project (CIP) Reserve for the continuation of the Station replacement projects. The District has a vital CIP Program and is continually seeking new one-time funds to support the projects needed due to growth and development in its jurisdictions. On November 27, 2007, the District’s Board approved the purchase of three properties through the adoption of Resolution Nos. 1186-07 and 1187-07. These properties were dedicated to the rebuilding of Fire Station No. 2 in East Palo Alto, which had the highest priority, and the rebuilding of Fire Station No. 6 in downtown Menlo Park. Fire Station 77 plan has increased in size and will require the purchase of property and has moved higher in the priority list due to the anticipated development in east Menlo Park which includes large developments by Facebook and the Gateway Project. Fire Station No. 1 is also slated for a construction project to replace the existing building and build a new, multi-story training tower. In 2015-16, Fire Station No. 2 was completed and is now occupied.

Menlo Park Fire Protection District Management’s Discussion and Analysis (Continued)
For the Year Ended June 30, 2016
20
Debt Service Fund
The District’s Debt Service Fund is used to account for the principal, interest, and related cost of debt payments. Chart 15 provides a two-year comparison of the fund’s performance.
Chart 15 – Debt Service Fund
Two-year Performance Comparison (000’s)
Category 2014-15 2015-16 Inc/(Dec) $
Revenues: Interest 20$ (16)$ (36)$ Other Revenue 210 210 - Total Revenues 230$ 194$ -$ Expenditures: Services and Supplies -$ -$ -$ Principal Payment 245 255 10 Interest and Fiscal Agent Charges 757 749 (8) Total Expenses 1,002$ 1,004$ 2$ Excess of Revenues over Expenditures (772) (810) (38)$ Transfer In 950$ 950$ - Net Change in Fund Balance 178 140 (38) Fund Balance at Beginning of Year 2,173 2,351 178 Fund Balance at End of Year 2,351$ 2,491$ 140$
The fund balance of the Debt Service Fund increased by just under $0.1 million, or 6%. This reflects a decision made by the District in 2010-11 to establish an annual transfer of the average coupon payments from the General Fund to the Debt Service Fund. Certificates of Participation Series B principal payments are not due until fiscal year 2023-24 and the payment amounts increase thereafter. In order to mitigate the future impact on the General Fund, the Board of Directors approved a constant average transfer to the Debt Service Fund. These transfers will create a reserve in the Debt Service Fund, providing for much higher payments in the future without a negative fiscal impact on the General Fund. Additional information about the District’s debt and its administration is available in a later section of the MD&A and in Note 5 to the Basic Financial Statements.

Menlo Park Fire Protection District Management’s Discussion and Analysis (Continued)
For the Year Ended June 30, 2016
21
Governmental Funds – Fund Balance Designations Chart 16 provides a further breakdown of the fund balances outlined in Chart 6, again comparing fiscal years 2014-15 and 2015-16.
Chart 16 – Governmental Funds
Fund Balance Detail Comparison (000’s)
Category 2014-15 2015-16 Inc/(Dec) $ Inc/(Dec) %
Nonspendable:
Total Nonspendable 617$ 921$ 304$ 49.3%
Restricted:
Employees 3% Contribution 278$ 456$ 178$ 64.0%
FEMA - 10 10 0.0%
Debt Service 1,113 1,097 (16) -1.4%
Total Restricted 1,391$ 1,563$ 172$ 12.4%
Committed:
Budgetary Deficit 18,128$ 18,128$ -$ 0.0%
FEMA Deployments 3,000 3,000 - 0.0%
Apparatus 5,024 5,024 - 0.0%
Capital Improvements 21,897 28,209 6,312 28.8%
Debt Service 1,238 1,394 156 12.6%
Total Committed 49,287$ 55,755$ 6,468$ 13.1%
Assigned:
Compensated Absences 2,544$ 2,544$ -$ 0.0%
Equipment Replacement 2,155 2,234 79 3.7%
Future PERS Payments 3,256 5,756 2,500 76.8%
General Services 932 932 - 0.0%
Workers' Compensation 1,893 1,893 - 0.0%
Encumbrances 208 386 178 85.6%
Total Assigned 10,988$ 13,745$ 2,757$ 25.1%
Total Unassigned 558$ 198$ (360)$ -64.5%
Total Fund Balance 62,841$ 72,182$ 9,341$ 14.9% By Resolutions No. 1458-2011 and No. 1505-2012, the Board of Directors authorized the adoption of a formal fund balance policy and the reclassification of the District's fund balances to comply with GASB No. 54. The District’s financial statements for governmental funds are comprised of five fund balance classifications as recommended by that statement, as follows:
Non-spendable—fund balance amounts that are not in a spendable form or are required to be maintained intact.
Restricted—fund balance amounts that can be used only for the specific purpose(s) stipulated by external resource providers, such as creditors, grantors, contributors, laws, regulations, or enabling legislation. Restrictions may be changed or lifted only with the consent of resource providers.
Committed—fund balance amounts that can be used only for the specific purposes determined by a formal action of the government’s highest level of decision-making authority. Commitments may be

Menlo Park Fire Protection District Management’s Discussion and Analysis (Continued)
For the Year Ended June 30, 2016
22
changed or lifted only by the government’s highest level of authority taking the same formal action that imposed the constraints originally. The Board of Directors is considered the highest authority for the District.
Assigned—fund balance amounts constrained by the government’s intent that they be used for a specific purpose. Assignment of resources can be done by the highest level of decision making or by a committee or official designated for the purpose. The Board of Directors has given the authorization to the Fire Chief and/or the Administrative Service Manager to assign any net fund resources.
Unassigned— residual fund balance amounts not contained in the other classification and technically available for any purpose.
Non-spendable Funds: As of June 30, 2016, the District had approximately $0.9 million in Non-spendable Funds, attributable to the prepayment of an Aerial Mount. Restricted Funds: As of June 30, 2016, the District had approximately $1.6 million in Restricted Funds, attributable to the represented safety employees’ 3 percent contribution towards their pension benefit and to the Debt Service Fund which is held in trust for future debt service payments. Committed Funds: As of June 30, 2016, the District had $55.8 million in Committed Funds. The District Board, authorized by a resolution, established a reserve for Budgetary Deficit to provide a source of resources for future fiscal years’ budgets if the District should suffer from an unanticipated financial shortfall or deficit. The requirement for the use of funds is a budget deficit of greater than 5 percent and the maximum set aside is 50 percent of the operating expenditures plus 50 percent of the annual Transfer Out from the General Fund to other funds. Other significant Committed Funds are set aside for capital improvements, emergency deployments, apparatus equipment, and debt services. Authorized by Resolution No. 1797-2015, the Board of Directors approved an improvement in the structure of the fund balances, combining reserves that were close in nature such as Budgetary Deficit and Cash Flow Management as well as IT equipment, emergency and medical equipment and rolling stocks. This restructuring reduced the number of reserves and simplified the fund balances. Assigned Funds: As of June 30, 2016, the District had $13.7 million in Assigned Funds. These funds have been primarily earmarked to offset District liabilities for its potential obligations to the California Public Employees’ Retirement System (CalPERS) for retirement/pension liabilities, for the cost of compensated absences, for equipment replacement, for general services and for potential Workers’ Compensation liabilities. Unassigned Funds: As of June 30, 2016, the District had just over $0.2 million in Unassigned Funds. The District’s policies and practices concerning its fund balance designations are guided by prudent and conservative financial management tenets and provide the District with fiscal stability as it continues to develop its long-term financial plan. Having adequate fund balances has helped the District achieve a current financial rating of AA+. In FY 15-16 Standard & Poor’s Rating Service reaffirmed “it’s AA+ long-term rating, with a stable outlook.” Chart 17 provides a graphic depiction of the fund balance specific designations.

Menlo Park Fire Protection District Management’s Discussion and Analysis (Continued)
For the Year Ended June 30, 2016
23
Chart 17 – General Fund Fund Balance Distribution
CalPERS Obligations As Chart 16 denotes, $5.8 million has been assigned to the CalPERS Reserve to be used to pay down the District’s Unfunded Actuarial Liability (UAL) for the California Public Employees’ Retirement System (CalPERS) obligations. Its other use may be to mitigate the effect on the General Fund if rates for Safety personnel increase to 41%, which has been forecasted for future years if the unfunded liability is not paid down and if yields on the CalPERS portfolio remain below the 7.5% used by the actuaries. Although the District accumulated reserves during the economic expansions from the late 1990’s to mid-2000, it continues to be confronted with the same dilemma facing other local governments throughout California. Pension costs have risen statewide because of changes in staffing levels and benefits and investment losses in the CalPERS portfolio during the recent economic downturn. On an annual basis, the employer contribution rate to CalPERS has increased and will continue to rise. In order to ensure that the retirement liability is adequately funded, CalPERS has made improvements to the actuarial policies, assumptions, and methods governing the administration of employer retirement plans. The changes have impacted local agencies participating in CalPERS. In response to future increases in its CalPERS obligation and to mitigate the pension unfunded actuarial liability, the District’s Board has adopted a budget philosophy that sets the annual employer contribution rate for safety employees at 41 percent and at 15 percent for non-safety employees. The actual contribution rates are applied during the course of each fiscal year and any savings that results from the difference in the budgeted and the actual rates is set aside for future use. Once the actual employer rates increase above the budgeted 41 percent and 15 percent levels, the PERS Stabilization Fund balance will be used to mitigate the effect on the General Fund.

Menlo Park Fire Protection District Management’s Discussion and Analysis (Continued)
For the Year Ended June 30, 2016
24
Cash Flow Management The primary source of revenue to the District is from property taxes. These revenues are distributed to the District throughout the year by the San Mateo County Office of the Controller. Cash flow management is a significant and carefully managed process for the District. The following chart shows the cumulative impact of monthly cash flow, based on actual expenditures and the receipt of property taxes and other fees revenues. The District receives 5% of the property taxes due in November, 45% in December, 30% in April and the remaining 20% is received in February, March, May and June.
Chart 18 – General Fund 2015-16 Cash Flow (000’s)

Menlo Park Fire Protection District Management’s Discussion and Analysis (Continued)
For the Year Ended June 30, 2016
25
Capital Assets As of June 30, 2016, the District had $26.4 million in net capital assets, an increase of 15.6% over the prior year. The increase is primarily due to the completion of construction of Fire Station No. 2 in the City of East Palo Alto, which was completed in 2015-16, as well as an increase number of new vehicles to replace older vehicles or vehicles needed by new Fire Prevention FTEs. Note 4 to the Basic Financial Statements shows the detail of capital asset activity. The following chart identifies the specific governmental activities:
Chart 19 – Governmental Activities Capital Assets (000’s)
FY Ended FY Ended
6/30/2015 6/30/2016 Inc/(Dec) $ Inc/(Dec) %
Capital Assets
Land 5,090$ 5,090$ -$ 0.0%
Construction in Progress 7,274 10,628 3,354 46.1%
Buidings & Improvement 12,632 13,005 373 3.0%
Vehicles 5,839 6,409 570 9.8%
Vehicles - FEMA 1,073 1,028 (45) -4.2%
Furniture & Equipment 2,291 2,310 19 0.8%
Furniture & Equipment - FEMA 465 474 9 1.9%
Accumulated Depreciation (11,802) (12,506) (704) 6.0%
Total Capital Assets 22,862$ 26,438$ 3,576$ 15.6%
Annual Depreciation Expense:
Structures & Improvements 311$ 313$ 2$ 0.6%
Vehicles 397 415 18 4.5%
Vehicles - FEMA 35 38 3 8.6%
Furniture & Equipment 117 181 64 54.7%
Furniture & Equipment - FEMA 41 59 18 43.9%
Total Annual Depreciation 901$ 1,006$ 105$ 11.7% All capital assets are valued at historical cost, or estimated historical cost, if the actual historical cost is not available. Contributed capital assets are valued at estimated fair market value on the date contributed. Assets with a value of $5,000 or more are recorded as capital assets. All capital assets are depreciated over estimated useful lives, using the straight line method. Debt Administration On December 1, 2009, the Board of Directors adopted Resolution No. 1347-2009, which authorized the issuance of lease financing of certain capital projects with the Public Property Financing Corporation of California. The lease financing provided funds to the District for acquisitions and construction improvement projects. Piper Jaffray, on behalf of the District, conducted lease financing serial certificates offerings in the amount of $12.0 million, with a premium amount of $0.22 million on December 8, 2009, closing date of December 23, 2009. A summary of the sources and uses of funds is shown in Chart 20.

Menlo Park Fire Protection District Management’s Discussion and Analysis (Continued)
For the Year Ended June 30, 2016
26
Chart 20 – Governmental Activities Long-term Debt (000’s)
Series A Series B
Certificates Certificates Total % of Total
Sources
Principal Amount of Certificate 3,055$ 8,935$ 11,990$ 98.2%
Original Issue Premium 225 - 225 1.8%
Total Capital Assets 3,280$ 8,935$ 12,215$ 100.0%
Uses
Project Fund Reimbursement 2,918$ 5,982$ 8,900$ 72.9%
Future CIP Project Funds Available - 2,000 2,000 16.4%
Reserve Fund 306 779 1,085 8.9%
Cost of Issuance 32 103 135 1.1%
Underwriter's Discount 24 71 95 0.8%
Total Annual Depreciation 3,280$ 8,935$ 12,215$ 100.0% Additional information on the District’s long term debt can be found in Note 5 to the Basic Financial Statements. GENERAL FUND BUDGET HIGHLIGHTS The budget comparison schedule for the General Fund is located in the Required Supplementary Information section following the Notes to the Financial Statements. Over the course of the fiscal year, the Board of Directors authorized revisions to the adopted budget as more accurate data became available. Overall, the General Fund closed the 2015-16 fiscal year with an operating surplus of $13.9 million. This was the result of an increase in property taxes revenues and delay in capital outlay expenditures. In addition, last fiscal year the District made a large CalPERS unfunded liability payment and the PERB related expenses and there was no costs in this fiscal year. Current revenue and expenditure trends point to a stable and fiscally sound budget picture for next year. Further discussion is provided below. General Fund Revenues
Year-end budget was $37.1 million. Year-end actual revenue was $44.3 million.
The District does not budget for prior year property tax adjustments and other revenues such as insurance claims, donations, and one-time revenues from emergency services. These are year-by-year activities and may vary greatly in magnitude from year-to-year. Such funds received are a source of variance to the adopted budget. The difference between the adopted budget and the actual revenue is primarily due to the annual SLAC fee, higher RDA Successor Agency pass through funds, OES and FEMA reimbursements, and increase in property tax revenue.

Menlo Park Fire Protection District Management’s Discussion and Analysis (Continued)
For the Year Ended June 30, 2016
27
General Fund Expenditures
Year-end budget was $33.2 million. Year-end actual expenditure was $30.4 million.
Actual expenditures were less than the year-end budget. The year-end budget was significantly higher than the actual expenditures as a result of the delays in various capital outlay expenditures. Economic Factors and the 2016-17 Budget The 2016-17 budget was developed by District staff and adopted by the Board of Directors based upon clear budget priorities and an established philosophy. In reaffirming the budget philosophy for the District, the Board of Directors has identified four key policy components:
1. Ongoing operating expenditures are to be paid with ongoing operating revenues. 2. Services provided by District Staff that have a cost recovery element should be as close to a 100%
cost recovery as is feasible. 3. Alternate revenue sources such as grants are encouraged with the caveat that the expenditures have a
limited life equal to that of the revenue source. 4. Paid time off balances, such as annual leave, will be funded at 100% pay out values per
Memorandum(s) of Understanding and compensation and benefit plans effective at the end of each fiscal year.
External Considerations: The State of California Budget: Although the State’s economic outlook has improved for the current fiscal year, continued caution is prudent when considering economic factors that may impact the District’s budget. One factor that continues to impact the District’s budget philosophy is the Educational Revenue Augmentation Fund (ERAF) Rebate. In October of 2003, the San Mateo County Controller announced that there would be a refund to local tax-receiving agencies from excess funds in the ERAF trust fund. These refunds are primarily a result of the local tax base increasing at a rate faster than the increase in the funding limits of the Schools and Community Colleges. Beginning with the 2012-13 budget and based upon advice from the San Mateo County Controller, the District’s budgeted revenue projections no longer include the ERAF Rebate as a source of ongoing revenue to the District. In the event that ERAF Rebate funds are received in 2016-17, the Board of Directors will decide how to earmark those funds. Another factor that must be considered is Redevelopment Agency (RDA) Revenue. Annually, the District receives revenue from the Redevelopment Successor Agencies of the Cities of Menlo Park, Palo Alto, and East Palo Alto. Effective February 1, 2010, ABX1 26 implemented the State-wide dissolution of all RDA’s. The 2016-17 budget includes an estimate of $1.5 million from RDA revenue, based on the concept that the District will receive the funds as they revert to property tax revenue. In order to provide a basis for establishing the level of resources available to support the 2016-17 budget, the District’s Finance Committee developed options that would fund an expenditure budget of $48.5 million. As shown, there were three analytical approaches derived from an average of the last two years percentage growth rates or 8.02%; the annual average inflation factor of 1.02%; and last year’s assumption

Menlo Park Fire Protection District Management’s Discussion and Analysis (Continued)
For the Year Ended June 30, 2016
28
of 4% growth rate. The committee voted to set the growth rate at 4%. The budgeted amount of the RDA revenues will continue to be received by the District throughout the dissolution of the Agencies, potentially to be reclassified as property tax revenue. The following two charts show the results of the application of each of the above analytical approaches when applied to the current secured property tax of $38.6 million, consistently for a five year period.
Chart 21 - Secured Property Tax 5 Year Estimates
Chart 22 – Secured Property Tax 5 Year Estimates Year-to-Year Increase

Menlo Park Fire Protection District Management’s Discussion and Analysis (Continued)
For the Year Ended June 30, 2016
29
CalPERS Safety Group Rates: The recent economic downturn, which hit California particularly hard in many areas, resulted in a significant reduction in State revenue collections, assessed property valuations, and losses in the CalPERS retirement fund portfolio. The worst period for CalPERS, naturally coincided with the substantial fall in the financial markets starting in late 2007 and going into the March 2009 market lows. For fiscal year 2015-16, CalPERS’ investment rate of return was 1.02%. While concern remains over the funding of future benefits and the District’s contribution rates are likely to rise in the future, CalPERS’ success in achieving its target rate of return of 7.5% will determine to what extent contribution rates change. On March 10, 2014 CalPERS issued Circular Letter No. 200-013-14, in which the CalPERS Board of Administration approved a recommendation to change the actuarial policies, methods and assumptions governing the administration of employer retirement plans. In order to ensure that the retirement liability is adequately funded, CalPERS is planning to change the discount rate (economic assumptions) in the future. The changes to the actuarial policies and methods began to impact local agencies participating in CalPERS in fiscal year 2015-16 and changes to the actuarial assumptions will impact local agencies participating in CalPERS in fiscal year 2016-17. The impact of these changes will spread the cost over twenty years with the increases phased in over the first five years and ramped down over the last five years of the twenty year amortization period. In November 2015 CalPERS is planning to establish risk mitigation strategies to benefit employees and employers in the long term. Despite these adjustments, the rate of return on the CalPERS portfolio remains highly uncertain. The District’s retirement benefit costs could increase significantly if market conditions become unfavorable. Actual CalPERS Employer Contribution Rate History: At the March 16, 2010 District Board meeting, the Board of Directors adopted Resolution No. 1361-2010, authorizing a pay down of the Safety Group Side Fund in the amount of $7 million. The payment was made to CalPERS on April 1, 2010, and this resulted in about a 10% reduction in the Safety Group rate. Resolutions No. 1388-2010 and No. 1409-2010 authorized the payoff of the remaining Safety Side Fund obligation in the amount of $5.5 million. On March 17, 2015, authorized by Resolution No. 1779-2015, the Board of Directors approved a pay down of $12 million, towards the pre-2013 pool unfunded actuarial liability (UAL). The District anticipates additional pay down of the Safety UAL in the next fiscal year.
The chart below provides the history of the District’s contribution rate to CalPERS for the Safety group.
Chart 23 – CalPERS Obligations Employer Contribution Rate
FY 05 FY 06 FY 07 FY 08 FY 09 FY 10 FY 11 FY 12 FY 13 FY 14 FY 15 FY 16
Series1 36.23% 34.04% 35.96% 37.08% 39.02% 39.09% 20.88% 25.82% 26.42% 27.88% 29.56% 27.20%
20.00%
25.00%
30.00%
35.00%
40.00%
45.00%

Menlo Park Fire Protection District Management’s Discussion and Analysis (Continued)
For the Year Ended June 30, 2016
30
As demonstrated in the chart, the District’s contribution rate has increased significantly since 2010-11 because of the performance of the CalPERS investment portfolio and asset valuations. The increase is anticipated to continue given that CalPERS modified its actuarial assumptions in April of 2013 and March 2014, applying a more conservative basis.
CalPERS Employer Contribution Rate With and Without the UAL Contribution At the Board meeting held on February 17, 2015, a third party Sr. Actuary made a presentation to educate the Board about the CalPERS actuarial issues and the result of the District partially paying down the current estimated unfunded liability using $12 million held in the PERS Rate Stabilization Fund. The Sr. Actuary presented possible scenarios as illustrated below:
Chart 23 – Employer Projected Contribution Rate Contribution Rate Summary
FY 16 FY 17 FY 18 FY 19 FY 20 FY 21 FY 22 FY 23
$12M(Pre-2013 Base) 27.20% 30.40% 32.20% 34.10% 36.00% 35.60% 35.20% 34.60%
$12M(Gain/Loss Base) 32.90% 34.70% 35.10% 35.60% 36.10% 35.50% 35.10% 34.60%
Without $12M 34.30% 37.50% 39.30% 41.30% 43.20% 42.70% 42.20% 41.80%
20.00%
25.00%
30.00%
35.00%
40.00%
45.00%
MOVING FORWARD The staff and the Board of Directors are committed to the fiscal stability and viability of the District. Although there have been strong signs of an improving local economy and a strengthening of the local housing and development markets within the District’s jurisdictions, the Board remains cognizant of the need for cautious optimism as it moves forward. The Board of Directors, therefore, continues to take a prudent and conservative approach when it reviews and adopts its budgets and sets authorized expenditure levels. In order to proactively position the District financially, the District’s fiscal position is continuously evaluated and adjustments are made to reflect the impact of any economic climate changes.
The following chart applies several basic budget parameters defined by the Board of Directors and an economic trend analysis to the FY 2016-17 budget. This data is used to forecast out to FY 2020-21, giving Staff and the Board of Directors a model from which to make both short- and long-term financial decisions.

Menlo Park Fire Protection District Management’s Discussion and Analysis (Continued)
For the Year Ended June 30, 2016
31
Chart 24 – Five Year Forecast
FY 2012-13 FY 2013-14 FY 2014-15 FY 2015-16 FY 2016-17 FY 2017-18 FY 2018-19 FY 2019-20 FY 2020-21
Gross Prop. Tax Growth Rates 1.00% 1.02% 4.00% 4.00% 4.00% 4.00% 4.00% 4.00% 4.00%
Other Revenues 1.00% 1.02% 4.00% 4.00% 4.00% 4.00% 4.00% 4.00% 4.00%
FY 2012-13 FY 2013-14 FY 2014-15 FY 2015-16 FY 2016-17 FY 2017-18 FY 2018-19 FY 2019-20 FY 2020-21
Staff 1.00% 1.02% 4.00% 4.00% 4.00% 4.00% 4.00% 4.00% 4.00%
Operating Expense 1.00% 1.02% 4.00% 4.00% 4.00% 4.00% 4.00% 4.00% 4.00%
Budgetary Deficit 0.00% 0.00% 0.00% 0.00% 0.00% 0.00% 0.00% 0.00% 0.00%
Cash Flow Management 0.00% 0.00% 0.00% 0.00% 0.00% 0.00% 0.00% 0.00% 0.00%
REVENUE ASSUMPTIONS
EXPENDITURE ASSUMPTIONS
RESERVE ASSUMPTIONS
Under the current fiscal assumptions the District will not need to rely on reserves to balance its future years’ budgets. These assumptions are reviewed and modified each year, as the ongoing fiscal performance is measured. The Board of Directors will conduct a study session to review the economic growth within the County, outlook for property tax growth, and the pension liability. In addition, the Board of Directors is planning to implement a long term capital improvement plan and funding. Also, of particular concern is the rate of population and development growth within the District’s jurisdiction. The increased number of people and structures places additional demands on District resources. In addition, increasing traffic congestion may adversely impact emergency response times. To address this concern, the Fire Chief has been working diligently with local city and county officials to evaluate the need for impact fees and a possible increase in the District’s emergency response resources.
CONTACTING THE DISTRICT’S FINANCIAL MANAGEMENT This Comprehensive Annual Financial Report is intended to provide citizens, taxpayers, investors, and creditors with a general overview of the District’s finances. Questions about this report should be directed to the Administrative Services Division, at 170 Middlefield Road, Menlo Park, California, 94025.

32
This page intentionally left blank

BASIC FINANCIAL STATEMENTS
33

This page intentionally left blank
34

GOVERNMENT-WIDE FINANCIAL STATEMENTS
35

This page intentionally left blank
36

GovernmentalActivities
ASSETS
Current assets:Cash and investments 71,331,337$ Receivables:
Accounts 100,778 Taxes 768,083 Interest 65,195
Due from other governments 809,333 Prepaid items 921,302 Inventories -
Total current assets 73,996,028
Noncurrent assets:Restricted cash and investments 1,394,111 Net OPEB asset 3,134,332 Non-depreciable capital assets 15,717,579 Depreciable capital assets, net 10,720,784
Total noncurrent assets 30,966,806
Total assets 104,962,834
DEFERRED OUTFLOWS OF RESOURCES
Pension related deferred outflows of resources 8,682,572
Total deferred outflows of resources 8,682,572
LIABILITIES
Current liabilities:Accounts payable 918,475 Accrued liabilities 1,589,570 Interest payable 309,578 Unearned revenue 41,156 Compensated absences - due within one year 1,767,655 Claims payable - due within one year 715,917 Long-term debt - due within one year 260,000
Total current liabilities 5,602,351
Noncurrent liabilities:Tax refund payable 60,026 Compensated absences - due in more than one year 819,500 Claims payable - due in more than one year 903,071 Long-term debt - due in more than one year 10,755,000 Aggregate net pension liabilities (Note 8) 28,999,212
Total noncurrent liabilities 41,536,809
Total liabilities 47,139,160
DEFERRED INFLOWS OF RESOURCES
Pension related deferred inflows of resources 11,888,797
Total deferred inflows of resources 11,888,797
NET POSITION
Net investment in capital assets 15,683,363 Restricted:
Special Revenue 9,692 Debt service 1,097,412 Contractual requirements 456,066
Total restricted 1,563,170
Unrestricted 37,370,916
Total net position 54,617,449$
Menlo Park Fire Protection District
June 30, 2016Statement of Net Position
See accompanying Notes to the Basic Financial Statements.37

GovernmentalActivities
ExpensesPublic safety - fire 33,976,184$ Interest payment of long-term debt 771,255
Total expenses 34,747,439
Program revenuesOperating grants and contributions 1,843,494 Charges for services 1,462,055
Total program revenues 3,305,549
Net program expenses 31,441,890
General revenues:Property taxes 41,308,495 Use of money and property 205,107 Other revenues 864,228
Total general revenues 42,377,830
Change in net position 10,935,940
Net Position - beginning of year 43,681,509
Net Position - end of year 54,617,449$
Menlo Park Fire Protection DistrictStatement of Activities
For the Year Ended June 30, 2016
See accompanying Notes to the Basic Financial Statements.38

FUND FINANCIAL STATEMENTS
39

This page intentionally left blank
40

GOVERNMENTAL FUND FINANCIAL STATEMENTS
41

This page intentionally left blank
42

Menlo Park Fire Protection District
Governmental Fund Finanical Statements
General Fund – This is the general operating fund of the District. It is used to account for all financial resources except those required to be accounted for in another fund.
FEMA Special Revenue Fund - This fund is used to account separately for funds received and disbursed for federal emergencies. The District participates in a program with the Federal Emergency Management Agency (FEMA) who grants the District money for the reimbursement of certain expenditures allocated for activities performed at the request of the Federal government.
Capital Improvement Capital Projects Fund - This fund is used to account for the acquisition and/or construction of all governmental general capital assets.
Debt Service Fund - This fund is used to account for the resources accumulated and payments made for principal and interest on long-term debt of governmental funds.
43

This page intentionally left blank
44

CapitalFEMA Improvement Debt Total
General Special Revenue Capital Projects Service GovernmentalFund Fund Fund Fund Funds
ASSETS
Cash and investments 41,623,848$ 10,060$ 28,303,734$ 1,393,695$ 71,331,337$ Restricted cash and investments - - 296,700 1,097,411 1,394,111 Receivables:
Accounts 100,778 - - - 100,778 Taxes 768,083 - - - 768,083 Interest 65,195 - - - 65,195
Due from other funds 29,315 - - - 29,315 Due from other governments 693,406 115,927 - - 809,333 Prepaid items 921,302 - - - 921,302
Total assets 44,201,927$ 125,987$ 28,600,434$ 2,491,106$ 75,419,454$
LIABILITIES, DEFERRED INFLOWSOF RESOURCES AND FUND BALANCES
Liabilities:Accounts payable 449,835$ 77,557$ 391,083$ -$ 918,475$ Accrued liabilities 1,580,147 9,423 - - 1,589,570 Unearned revenue 41,156 - - - 41,156 Due to other funds - 29,315 - - 29,315
Total liabilities 2,071,138 116,295 391,083 - 2,578,516
Deferred inflows of resources:Unavailable revenues 658,605 - - - 658,605
Total deferred inflows of resources 658,605 - - - 658,605
Fund balances:Nonspendable 921,302 - - - 921,302 Restricted 456,066 9,692 - 1,097,412 1,563,170 Committed 26,152,356 - 28,209,351 1,393,694 55,755,401 Assigned 13,744,266 - - - 13,744,266 Unassigned 198,194 - - - 198,194
Total fund balances 41,472,184 9,692 28,209,351 2,491,106 72,182,333
Total liabilities, deferred inflowsof resources and fund balances 44,201,927$ 125,987$ 28,600,434$ 2,491,106$ 75,419,454$
Governmental FundsBalance Sheet
Menlo Park Fire Protection District
June 30, 2016
Major Funds
See accompanying Notes to the Basic Financial Statements.45

Total Fund Balances - Total Governmental Funds 72,182,333$
Amounts reported for governmental activities in the Statement of Net Position were different because:
Capital assets used in governmental activities were not financial resources and therefore were not reported in governmentalfunds. 26,438,363 Interest payable on long-term debt did not require current financial resources. Therefore, interest payable was not reportedas a liability in Governmental Funds Balance Sheet. (309,578) Long-term liabilities were not due and payable in the current period and therefore were not reported in the governmentalfunds.
Amount reported in Government-Wide Statement of Net Position:Compensated absences - due within one year (1,767,655) Compensated absences - due in more than one year (819,500) Claims payable - due within one year (715,917) Claims payable - due in more than one year (903,071) Long-term debt - due within one year (260,000) Long-term debt - due in more than one year (10,755,000) Tax Refund Payable (60,026)
Total long-term debt (15,281,169)
Revenues earned but not available to pay for current expenditures for governmental funds are unavailable. 658,605
Pension contributions made during the year after the measurement date are reported as expenditures in governmental funds and as deferred outflow of resources in the government-wide financial statements. 1,609,499
Net pension liability is not due and payable in the current period and therefore is not reported in the governmental funds. (28,999,212)
Net OPEB Asset is not available in the current period and therefore is not reported in the governmental funds. 3,134,332
Differences in proportions are reported in the government-wide financial statements:
Deferred adjustments due negative differences between expected and actual experience (399,296)
Deferred adjustments due positive differences between expected and actual experience 17,423
Negative changes in assumptions are reported in the government-wide financial statements: (2,001,348)
Differences in proportions are reported in the government-wide financial statements:
Deferred adjustments due negative differences in pension cost-sharing proportion (8,474,763)
Deferred adjustments due positive differences in pension cost-sharing proportion 6,783,990
Difference between employer actual contribution and employer's proportionate share of contribution
Employer's actual contribution in excess of the Employer's proportionate share of contributions 271,660
Difference between projected and actual earnings on pension plan investments are reported in the government-wide financialstatements:
Actual earnings under projected earnings (1,013,390)
Net Position of Governmental Activities 54,617,449$
Menlo Park Fire Protection District
June 30, 2016to the Government-Wide Statement of Net Position
Reconciliation of the Governmental Funds Balance Sheet
See accompanying Notes to the Basic Financial Statements.46

CapitalFEMA Improvement Debt Total
General Special Revenue Capital Projects Service GovernmentalFund Fund Fund Fund Funds
REVENUES:
Property taxes - secured and unsecured 40,300,377$ -$ -$ -$ 40,300,377$ Redevelopment Projects in Menlo Park 612,259 - - - 612,259 Homeowner's property tax relief 121,608 - - - 121,608 Redevelopment projects in East Palo Alto 274,251 - - - 274,251 Licenses and permits 1,276,787 - - - 1,276,787 Charges for services - JPA ambulance service 185,268 - - - 185,268 Rent revenue 77,533 - - - 77,533 Grant revenue 624,778 1,218,716 - - 1,843,494 Intergovermental - - - 210,448 210,448 Interest 205,005 - 102 - 205,107 Other revenue 576,247 - - - 576,247
Total revenues 44,254,113 1,218,716 102 210,448 45,683,379
EXPENDITURES:
Current:Salaries and benefits 24,566,605 378,382 - - 24,944,987 Services and supplies 4,964,604 821,327 - - 5,785,931
Capital Outlay 855,236 9,315 3,726,774 - 4,591,325 Debt service:
Principal - - - 255,000 255,000 Interest and fiscal charges - - - 765,489 765,489
Total expenditures 30,386,445 1,209,024 3,726,774 1,020,489 36,342,732
REVENUES OVER(UNDER) EXPENDITURES 13,867,668 9,692 (3,726,672) (810,041) 9,340,647
OTHER FINANCING SOURCES (USES):
Proceeds from sale of property 1,065 - - - 1,065 Transfers in - - 10,039,544 950,100 10,989,644 Transfers out (10,989,644) - - - (10,989,644)
Total other financing sources (uses) (10,988,579) - 10,039,544 950,100 1,065
CHANGES IN FUND BALANCES 2,879,089 9,692 6,312,872 140,059 9,341,712
FUND BALANCES:
Beginning of year 38,593,095 - 21,896,479 2,351,047 62,840,621
End of year 41,472,184$ 9,692$ 28,209,351$ 2,491,106$ 72,182,333$
Statement of Revenues, Expenditures, and Changes in Fund BalanceMenlo Park Fire Protection District
For the Year Ended June 30, 2016Governmental Funds
Major Funds
See accompanying Notes to the Basic Financial Statements.47

Net Change in Fund Balances - Total Governmental Funds 9,341,712$
Amounts reported for governmental activities in the Statement of Activities were different because:
Governmental funds reported capital outlay as expenditures. However, in the Government-Wide Statement of Activities, thecost of those assets was allocated over their estimated useful lives as depreciation expense. This was the amount of capitalassets recorded in the current period.
Purchase of capital assets 4,591,325 Net effect of disposal of capital assets (10,018)
Depreciation expense on capital assets was reported in the Government-Wide Statement of Activities, but they did not requirethe use of current financial resources. Therefore, depreciation expense was not reported as expenditures in the GovernmentalFunds. (1,005,590)
Repayment of long-term liabilities was an expenditures in governmental funds, but the repayment reduced long-term liabilitiesin the Government-Wide Statement of Net Position.
Principal payment of long-term debt 255,000
Changes in net pension liability reported in the Statement of Activities does not require the use of current financial resources and, therefore, is not reported as an expenditure in governmental funds (Note 8). (5,261,929)
The net effect of various miscellaneous transactions involving pension plans (i.e. deferred inflow/outflow amortization, contributions after measurement date) increased Net Position. 3,026,211
Certain long-term assets and liabilities were reported in the Government-Wide Statement of Activities, but they did not requirethe use of current financial resources. Therefore, long-term assets and liabilities were not reported as expenditures ingovernmental funds. These amounts represented the changes in long-term liabilities from prior year.
Changes in compensated absences 30,017 Changes in claims payable 52,384 Changes in net OPEB asset (187,403) Changes in tax refund payable 65,420
Interest expense on long-term debt was reported in the Government-Wide Statement of Activities, but it did not require the useof current financial resources. This amount represented the change in accrued interest from prior year. 3,187
Unavailable revenues were reported as deferred inflows of resources in the Governmental Funds but were reported as revenuesin the Government-Wide Statement of Statement of Activities 35,624
Change in Net Position of Governmental Activities 10,935,940$
Menlo Park Fire Protection District
For the Year Ended June 30, 2016in Fund Balances to the Government-Wide Statement of Activities
Reconciliation of the Governmental Statement of Revenues, Expenditures, and Changes
See accompanying Notes to the Basic Financial Statements.48

49
NOTES TO THE BASIC FINANCIAL STATEMENTS

50
This page intentionally left blank

Menlo Park Fire Protection District Notes to the Basic Financial Statements
For the Year Ended June 30, 2016
51
NOTE DESCRIPTION PAGE 1 Reporting Entity and Summary of Significant Accounting Policies 53 2 Cash and Investments 61 3 Interfund Balances and Transactions 64 4 Capital Assets 65 5 Long-Term Debt 65 6 Compensated Absences 66 7 Self-Insurance 67 8 Pension Plans 67 9 Deferred Compensation Plan 75 10 Other Post-Employment Benefits 75 11 Emergency Medical Response 78 12 Classification of Fund Balances 79 13 Commitments and Contingencies 80

52
This page intentionally left blank

Menlo Park Fire Protection District Notes to the Basic Financial Statements
For the Year Ended June 30, 2016
53
Note 1 – Reporting Entity and Summary of Significant Accounting Policies
The basic financial statements of the Menlo Park Fire Protection District (the “District”) have been prepared in conformity with accounting principles generally accepted of the United States of America (“U.S. GAAP”) as applied to Governmental agencies. The Governmental Accounting Standards Board (“GASB”) is the accepted standard setting body for establishing accounting and financial reporting principles. The more significant of the District’s accounting policies are described below.
A. Reporting Entity
The Menlo Park Fire Protection District (District) was organized in 1915 and operates under the State of California Health and Safety Code. The District protects around 90,000 residents covering an area of 30 square miles in Southern San Mateo County, which includes the City of Menlo Park, the Town of Atherton, and City of East Palo Alto. The District also covers unincorporated adjacent areas including Dumbarton Oaks, North Fair Oaks, Ravenswood and lands adjacent to Stanford University. The District operates 7 Fire Stations and 1 Fire Prevention and Administration office. The District also has working agreements with the neighboring Fire departments, Palo Alto, Redwood City, and Woodside Fire District, to provide automatic aid. A five-member Board of Directors, elected to four-year terms, establishes policy of the District. The present Board consists of Rex Ianson (retired firefighter), Virginia Chang Kiraly (Corporate Finance), Rob Silano (Public Safety Expert), Peter Carpenter (Entrepreneur) and Chuck Bernstein (President and Founder of Private Educational Organization). The District has 111 employees. The command staff includes a Fire Chief, two Division Chiefs, one Fire Marshal, and four Battalion Chiefs. Each of the Division chiefs has a primary function responsibility. The responsibilities include Operations and Training. In addition, each Battalion Chief is also a shift supervisor for one of the three suppression shifts. The fourth Battalion Chief assists with training.
The District maintains its headquarters at 170 Middlefield Road, Menlo Park, California 94025. The Menlo Park Fire Protection District is not blended with any other governmental unit, thus its financial statements do not include any financial activity of any other agency. It is not a component unit of any other reporting entity.
B. Basis of Accounting and Measurement Focus
The accounts of the District are organized on the basis of funds, each of which is considered a separate accounting entity. The operations of each fund are accounted for by providing a separate set of self-balancing accounts that comprise its assets, liabilities, fund equity, revenues and expenditures. Fund accounting segregates funds according to their intended purpose and is used to aid management in demonstrating compliance with finance-related legal and contractual provisions. The minimum number of funds is maintained in accordance with legal and managerial requirements. In accordance with GASB Statement No. 63, Financial Reporting of Deferred Outflows of Resources, Deferred Inflows of Resources, and Net Position, the Statement of Net Position reports separate sections for Deferred Outflows of Resources, and Deferred Inflows of Resources, when applicable.
Deferred Outflows of Resources represent outflows of resources (consumption of net position) that apply to future periods and that, therefore, will not be recognized as an expense until that time.

Menlo Park Fire Protection District Notes to the Basic Financial Statements (Continued)
For the Year Ended June 30, 2016
54
Note 1 – Reporting Entity and Summary of Significant Accounting Policies (Continued)
B. Basis of Accounting and Measurement Focus (Continued)
Deferred Inflows of Resources represent inflows of resources (acquisition of net position) that apply to future periods and that, therefore, are not recognized as revenue until that time.
Government - Wide Financial Statements The District’s Government-Wide Financial Statements include a Statement of Net Position and a Statement of Activities and Change in Net Position. These statements present summaries of governmental activities for the District. These financial statements are presented on an “economic resources” measurement focus and the accrual basis of accounting. Accordingly, all of the District’s assets and liabilities, including capital assets, and long-term liabilities, are included in the accompanying Statement of Net Position. The Statement of Activities presents change in Net Position. Under the accrual basis of accounting, revenues are recognized in the period in which they are earned while expenses are recognized in the period in which the liability is incurred. Certain types of transactions are reported as program revenues for the District in two categories:
Charges for services Operating grants and contributions
Certain eliminations have been made in regards to interfund activities, payables and receivables. All internal balances in the Statement of Net Position have been eliminated. The following interfund activities have been eliminated:
Due to/from other funds Transfers in/out
Fund Financial Statements Fund Financial Statements include a Balance Sheet and a Statement of Revenues, Expenditures and Changes in Fund Balances. The District considers all funds as major funds since they met the applicable criteria in accordance with GASB Statement No. 34. An accompanying schedule is presented to reconcile and explain the differences in Net Position as presented in these statements to the Net Position presented in the Government-Wide Financial Statements.
All funds are accounted for on a spending or "current financial resources" measurement focus and the modified accrual basis of accounting. Accordingly, only current assets and current liabilities are included on the Balance Sheet. The Statement of Revenues, Expenditures and Changes in Fund Balances presents increases (revenues and other financing sources) and decreases (expenditures and other financing uses) in net current assets. Under the modified accrual basis of accounting, revenues are recognized in the accounting period in which they become both measurable and available to finance expenditures of the current period. Revenues are recognized as soon as they are both “measurable” and “available”. Revenues are considered to be available when they are collectible within the current period as soon enough thereafter to pay liabilities of the current period. For this purpose, the District considers revenues to be available if they are collected within 60 days of the end of the current fiscal period. The primary revenue sources, which have been treated as susceptible to accrual by the District, are property tax, intergovernmental revenues and other taxes. Expenditures are recorded in the accounting period in which the related fund liability is incurred.

Menlo Park Fire Protection District Notes to the Basic Financial Statements (Continued)
For the Year Ended June 30, 2016
55
Note 1 – Reporting Entity and Summary of Significant Accounting Policies (Continued) B. Basis of Accounting and Measurement Focus (Continued)
Fund Financial Statements (Continued) Non-exchange transactions, in which the District gives or receives value without directly receiving or giving equal value in exchange, include taxes, grants, entitlements, and donations. On the accrual basis, revenue from taxes is recognized in the fiscal year for which the taxes are levied or assessed. Revenue from grants, entitlements, and donations is recognized in the fiscal year in which all eligibility requirements have been satisfied. The Reconciliation of the Fund Financial Statements to the Government-Wide Financial Statements is provided to explain the differences created by the integrated approach of GASB Statement No. 34. The District reports the following major funds:
General Fund - The General Fund is the general operating fund of the District. It is used to account for all financial resources of the District except those required to be accounted for in another fund. FEMA Special Revenue Fund – The FEMA Special Revenue Fund is used to account separately for funds received and disbursed for federal emergencies. The District participates in a program with the Federal Emergency Management Agency (FEMA) who grants the District money for the reimbursement of certain expenditures allocated for activities performed at the request of the Federal government. Capital Improvement Capital Projects Fund – The Capital Improvement Capital Projects Fund is used to account for the acquisition and/or construction of all major governmental general capital assets. Debt Service Fund – The Debt Service Fund is used to account for accumulation of resources and payments made for the principal and interest on long-term debt of governmental funds.
C. Cash and Investments
Cash includes cash on hand and demand deposits. Investments are reported at fair value. Changes in fair value that occur during the fiscal year are recognized as investment income for that fiscal year. The District participates in an investment pool managed by the State of California titled Local Agency Investment Fund (“LAIF”), which has invested a portion of the pool funds in structured notes and asset-backed securities. LAIF’s investments are subject to credit risk with the full faith and credit of the State of California collateralizing these investments. In addition, these structured notes and asset-backed securities are subject to market risk and to change in interest rates. The reported value of the pool is the same as the fair value of the pool shares. Certain disclosure requirements, if applicable, for Deposits and Investment Risks in the following areas:
Interest Rate Risk Credit Risk
- Overall - Custodial Credit Risk - Concentration of Credit Risk
Foreign Currency Risk

Menlo Park Fire Protection District Notes to the Basic Financial Statements (Continued)
For the Year Ended June 30, 2016
56
Note 1 – Reporting Entity and Summary of Significant Accounting Policies (Continued)
D. Restricted Cash and Investments
Cash and investments with fiscal agents are restricted due to limitations on their use by bond covenants or donor limitations. Fiscal agents acting on behalf of the District hold investment funds arising from the proceeds of long-term debt issuances. The funds may be used for specific capital outlays or for the payment of certain bonds, and have been invested only as permitted by specific State statutes or applicable District ordinance, resolution or bond indenture.
E. Inventories and Prepaid items
Inventories are valued on an average-cost basis which are adjusted to annual physical counts or estimates under the consumption method of accounting. Prepaid items are items the District has paid in advance and will receive future benefit from.
F. Interfund Transactions
Activities between funds that are representative of lending/borrowing arrangements outstanding at the end of the fiscal year are referred to as “due to/from other funds”. Interfund balances arise in the normal course of operations to cover cash shortages and are expected to be repaid shortly after the end of the fiscal year.
G. Capital Assets and Depreciation
Capital assets are valued at historical cost or estimated historical cost if actual historical cost was not available. Donated capital assets are valued at their estimated fair market value on the date donated. District policy has set the capitalization threshold for reporting capital assets at $5,000. Depreciation is recorded on a straight-line basis over estimated useful lives of the assets as follows:
Buildings and Site Improvements 7 -50 years Furniture and Equipment 5 -20 years Vehicles 5 -15 years
Major outlays for capital assets are capitalized as construction in progress, once constructed, and repairs and maintenance costs are expensed. Interest accrued during capital assets construction, if any, is capitalized as part of the asset cost, net of interest income on construction bond proceeds.
H. Compensated Absences
Compensated absences comprise vested vacation, sick, comp time and annual leave. Employees do not gain a vested right to accumulated sick leave, unless they take retirement through PERS or are laid off. The annual leave plan combines vacation and sick leave, which is settled annually. In government-wide financial statements compensated absences are recorded as expenses and liabilities as incurred. In Fund financial statements, compensated absences are recorded as expenditures in the years paid, as it is the District’s policy to liquidate any unpaid annual leave at year-end from future resources rather than currently available and expendable resources. The General Fund is typically used to liquidate compensated absences.

Menlo Park Fire Protection District Notes to the Basic Financial Statements (Continued)
For the Year Ended June 30, 2016
57
Note 1 – Reporting Entity and Summary of Significant Accounting Policies (Continued)
I. Pensions
For purposes of measuring the net pension liability, deferred outflows of resources and deferred inflows of resources related to pensions, and pension expense, information about the fiduciary net position of the plans and additions to/deductions from the plans’ fiduciary net position have been determined on the same basis as they are reported by the plans (Note 8). For this purpose, benefit payments (including refunds of employee contributions) are recognized when due and payable in accordance with benefit terms. Investments are reported at fair value. The following timeframes are used for pension reporting:
CalPERS
Valuation Date June 30, 2014 Measurement Date June 30, 2015 Measurement Period July 1, 2014 to June 30, 2015
Gains and losses related to changes in total pension liability and fiduciary net position are recognized in pension expense systematically over time. The first amortized amounts are recognized in pension expense for the year the gain or loss occurs. The remaining amounts are categorized as deferred outflows and deferred inflows of resources related to pensions and are to be recognized in future pension expense. The amortization period differs depending on the source of the gain or loss. The difference between projected and actual earnings is amortized straight-line over 5 years. All other amounts are amortized straight-line over the average expected remaining service lives of all members that are provided with benefits (active, inactive, and retired) as of the beginning of the measurement period.
J. Long-Term Debt
Government-Wide Financial Statements Long-term debt and other financial obligations are reported as liabilities in the appropriate funds. Bond premiums and discounts are deferred and amortized over the life of the bonds using the effective interest method. Bonds payable are reported net of the applicable premium or discount. Issuance costs are expensed when incurred. Fund Financial Statements
The fund financial statements do not present long-term debt but are shown in the Reconciliation of the governmental Funds Balance Sheet to the Government-Wide Statement of Net Position.
K. Tax Refund Payable
Tax Refund Payable comprises the District’s share of the tax refund to be paid over seven years due to the County of San Mateo overcharging Genentech for property taxes over multiple years.

Menlo Park Fire Protection District Notes to the Basic Financial Statements (Continued)
For the Year Ended June 30, 2016
58
Note 1 – Reporting Entity and Summary of Significant Accounting Policies (Continued) L. Property Taxes
Bond premiums and discounts are deferred and amortized over the life of the bonds using the effective interest method. Bonds payable are reported net of the applicable premium or discount. Issuance costs are expensed when incurred.
Property taxes are levied on March 1 and are payable in two installments: November 1 and February 1 of each year. Property taxes become delinquent on December 10 and April 10, for the first and second installments, respectively. The lien date is January 1. The County of San Mateo, California (County) bills and collects property taxes and remits them to the District according to a payment schedule established by the County.
Property tax revenue is recognized in the fiscal year for which the taxes have been levied, provided the taxes are received within 60 days after the end of the fiscal year. Property taxes received after this date are not considered available as a resource that can be used to finance the current year operations of the District and, therefore, are not recorded as revenue until collected. No allowance for doubtful accounts was considered necessary.
M. Unearned Revenue
Unearned revenue recorded in the Government-Wide Statement of Net Position for activities and the Fund Financial Statements consist of federal and state capital grants, representing voluntary nonexchange transactions, for which advance payments have been received from the provider for which eligibility requirements, other than timing requirements, have not been satisfied.
N. Net Position
In government-wide financial statements, net position is categorized as follows:
Net Investment in Capital Assets – This component of net position consists of capital assets, net of accumulated depreciation, reduced by the outstanding balances of debt that are attributable to the acquisition, construction, or improvement of those assets.
Restricted – This component of net position consists of restricted assets reduced by liabilities and deferred inflows of resources related to those assets. Unrestricted – This component of net position is the amount of the assets, deferred outflows of resources, liabilities, and deferred inflows of resources that are not included in the determination of net investment in capital assets or the restricted component of net position.
O. Fund Balances
In fund financial statements, fund balances are categorized as follows:
Nonspendable – Items that cannot be spent because they are not in spendable form, such as prepaid items and inventories, items that are legally or contractually required to be maintained intact, such as principal of an endowment or revolving loan funds. Restricted – Restricted fund balances encompass the portion of net fund resources subject to externally enforceable legal restrictions. This includes externally imposed restrictions by creditors, such as through debt covenants, grantors, contributors, laws or regulations of other governments, as well as restrictions imposed by law through constitutional provisions or enabling legislation.

Menlo Park Fire Protection District Notes to the Basic Financial Statements (Continued)
For the Year Ended June 30, 2016
59
Note 1 – Reporting Entity and Summary of Significant Accounting Policies (Continued)
O. Fund Balances (Continued)
Committed – Committed fund balances encompass the portion of net fund resources, the use of which is constrained by limitations that the government imposes upon itself at its highest level of decision making, normally the governing body and that remain binding unless removed in the same manner. The Board of Directors is considered the highest authority for the District. A Board resolution is required to have fund balance committed. Assigned – Assigned fund balances encompass the portion of net fund resources reflecting the government’s intended use of resources. Assignment of resources can be done by the highest level of decision making or by a committee or official designated for that purpose. The Board of Directors has authorized the District Manager to determine and define the amount of assigned fund balances. Unassigned – This amount is for any portion of the fund balances that do not fall into one of the above categories. The general fund is the only fund that reports a positive unassigned fund balance amount. In other funds, it is not appropriate to report a positive unassigned fund balance amount. However, in funds other than general fund, if expenditures incurred for specific purposes exceed the amounts that are restricted, committed, or assigned to those purposes, it may be necessary to report a negative unassigned fund balance in that fund.
P. Spending Policy
Government-Wide Financial Statements
When an expense is incurred for purposes for which both restricted and unrestricted Net Position are available, the District’s policy is to apply restricted Net Position first.
Fund Financial Statements When expenditures are incurred for purposes where only unrestricted fund balances are available, the District uses the unrestricted resources in the following order: committed, assigned, and unassigned.
Q. Fair Value Measurement In accordance with GASB Statement No. 72, Fair Value Measurement and Application, this statement defines fair value, establishes a framework for measuring fair value and establishes disclosures about fair value measurement. Investments, unless otherwise specified, recorded at fair value in the Statements of Net Position, are categorized based upon the level of judgment associated with the inputs used to measure their fair value. Levels of inputs are as follows:
Level 1 – Inputs are unadjusted, quoted prices for identical assets and liabilities in active markets at the measurement date.
Level 2 – Inputs, other than quoted prices included in Level 1, that are observable for the assets or liabilities through corroboration with market data at the measurement date.
Level 3 – Unobservable inputs that reflect management’s best estimate of what market participants
would use in pricing the assets or liabilities at the measurement date.

Menlo Park Fire Protection District Notes to the Basic Financial Statements (Continued)
For the Year Ended June 30, 2016
60
Note 1 – Reporting Entity and Summary of Significant Accounting Policies (Continued) R. Use of Estimates
The preparation of basic financial statements in conformity with U.S. GAAP requires management to make estimates and assumptions that affect the reported amounts and disclosures. Actual results could differ from these estimates and assumptions.
S. Accounting Changes GASB has issued Statement No. 72, Fair Value Measurement and Application. This Statement addresses accounting and financial reporting issues related to fair value measurements. This Statement provides guidance for determining a fair value measurement for financial reporting purposes and also provides guidance for applying fair value to certain investments and disclosures related to all fair value measurements. This statement became effective for periods beginning after June 15, 2015 and did not have any new measurement impact and additional disclosure is reflected in the notes to the financial statements on the District’s financial statements for the year ended June 30, 2016.
GASB has issued Statement No. 73, Accounting and Financial reporting for Pensions and Related Assets That Are Not within the Scope of GASB Statement 68, and Amendments to Certain Provisions of GASB Statements 67 and 68. This Statement establishes requirements for defined benefit pensions that are not within the scope of Statement No. 68, Accounting and Financial Reporting for Pensions, as well as for the assets accumulated for purposes of providing those pensions. In addition, it establishes requirements for defined contribution pensions that are not within the scope of Statement 68. It also amends certain provisions of Statement No. 67, Financial Reporting for Pension Plans, and Statement 68 for pension plans and pensions that are within their respective scopes. This statement became effective for periods beginning after June 15, 2015 and did not have a significant impact on the District’s financial statements for the year ended June 30, 2016. GASB has issued Statement No. 76, The Hierarchy of Generally Accepted Accounting Principles for State and Local Governments. This statement establishes standards relating to the hierarchy of generally accepted accounting principles (GAAP). The “GAAP hierarchy” consists of the sources of accounting principles used to prepare financial statements of state and local governmental entities in conformity with GAAP and the framework for selecting those principles. This Statement reduces the GAAP hierarchy to two categories of authoritative GAAP and addresses the use of authoritative and nonauthoritative literature in the event that the accounting treatment for a transaction or other event is not specified within a source of authoritative GAAP. This statement became effective for periods beginning after June 15, 2015, and should be applied retroactively. This statement did not have a significant impact on the District’s financial statements for the year ended June 30, 2016. GASB has issued Statement No. 79, Certain External Investment Pools and Pool Participants. This statement establishes standards relating accounting and financial reporting for certain external investment pools and pool participants. This statement became effective for periods beginning after June 15, 2015, except for certain provisions on portfolio quality, custodial credit risk, and shadow pricing. Those provisions are effective for reporting periods beginning after December 15, 2015 and did not have a significant impact on the District’s financial statements for the year ended June 30, 2016.

Menlo Park Fire Protection District Notes to the Basic Financial Statements (Continued)
For the Year Ended June 30, 2016
61
Note 2 – Cash and Investments
The following is a summary of cash and investments and cash and investments with fiscal agents at June 30, 2016:
Cash and investments 71,331,337$ Restricted cash and investments 1,394,111
Total cash and investments 72,725,448$
Cash, cash equivalents and investments consisted of the following at June 30, 2016:
Cash on hand 5,650$ Demand deposits with financial institutions 24,769,315
Total cash 24,774,965
Local Agency Investment Fund (LAIF) 47,950,483
Total investments 47,950,483
Total cash and investments 72,725,448$
A. Deposits
The carrying amount of the District’s cash deposits were $24,769,315 at June 30, 2016. Bank balances before reconciling items were $24,836,942 at that date, the total amount of which was insured or collateralized with securities held by the pledging financial institutions in the District’s name as discussed below. The California Government Code requires California banks and savings and loan associations to secure the District’s cash deposits by pledging securities as collateral. This Code states that collateral pledged in this manner shall have the effect of perfecting a security interest in such collateral superior to those of a general creditor. Thus, collateral for cash deposits is considered to be held in the District's name. The market value of pledged securities must equal at least 110% of the District's cash deposits. California law also allows institutions to secure District deposits by pledging first trust deed mortgage notes having a value of 150% of the District’s total cash deposits. The District may waive collateral requirements for cash deposits, which are fully insured up to $250,000 by the Federal Deposit Insurance Corporation. The District, however, has not waived the collateralization requirements.

Menlo Park Fire Protection District Notes to the Basic Financial Statements (Continued)
For the Year Ended June 30, 2016
62
Note 2 – Cash and Investments (Continued) B. Investments
Investments Authorized by the California Government Code and the District’s Investment Policy
The table below identifies the investment types that are authorized for the District by the California Government Code (or the District’s investment policy, where more restrictive). The table also identifies certain provisions of the California Government Code (or the District’s investment policy, where more restrictive) that address interest rate risk, credit risk, and concentration of credit risk. This table does not address investments of debt proceeds held by bond trustee that are governed by the provisions of debt agreements of the District, rather than the general provisions of the California Government Code or the District’s investment policy.
Maximum Maximum
Authorized Maximum Percentage of Investment inInvestment Type Maturity Portfolio* One Issuer
Local Agency Investment Fund N/A None $50 Million**California Asset Management Trust N/A None $50 Million***Certificates of Deposits 5 years 20% 5%Negotiable Certificates of Deposits 5 years 30% 5%Banker’s Acceptances 180 days 40% 30%U.S. Treasury Obligations 5 years None NoneU.S. Agency and U.S. Government Sponsored Enterprise Securitites 5 years None NoneCalifornia Municipal Obligations 5 years 10% 10%Repurchase Agreement 30 days 20% 10%Commercial Paper of Prime Quality 270 days 25% 10%Money Market Mutual Funds 5 years 20% 10%Local Agency Bonds 5 years None 10%
* Excluding amounts held by bond trustee that are not subject to California Government Code restriction.** Maximum is $50 million per account.*** Maximum is $50 million (net of bond proceeds)
Investments Authorized by Debt Agreements
Investments of debt proceeds held by bond trustee are governed by provisions of the debt agreement rather than the general provisions of the California Government Code or the District’s investment policy. The table below identifies certain provisions of these debt agreements that address interest rate risk, credit risk, and concentration of credit risk.
Maximum Maximum
Authorized Maximum Percentage of Investment inInvestment Type Maturity Portfolio One Issuer
U.S. Treasury Obligations None None NoneU.S. Agency Securities None None NoneBanker’s Acceptances 360 days None NoneCommercial Paper 270 days None NoneMoney Market Mutual Funds N/A None NoneInvestment Contracts 30 years None NoneCertificates of Deposit None None NoneRepurchase Agreements None None NoneMortgage Pass-Through Securities None None NoneState Bonds or Notes None None NoneMunicipal Bonds or Notes None None NoneAsset-Backed Securities 5 years 20% 20%

Menlo Park Fire Protection District Notes to the Basic Financial Statements (Continued)
For the Year Ended June 30, 2016
63
Note 2 – Cash and Investments (Continued) C. Risk Disclosures
Interest Rate Risk Interest rate risk is the risk that changes in market interest rates will adversely affect the fair value of an investment. Generally, the longer the maturity, the greater the sensitivity its fair value is to changes in market interest rates. As a means of limiting its exposure to fair value losses arising from rising interest rates, the District’s investment policy provides that final maturities of securities cannot exceed five years. Specific maturities of investments depend on liquidity needs. At June 30, 2016, the District’s pooled cash and investments had the following maturities: As of June 30, 2016, the District had the following investments and maturities:
MaturityCredit Fair Value 12 Months or
Investments Rating June 30, 2016 Less
Investments:Local Agency Investment Fund (LAIF) N/A 47,950,483$ 47,950,483$
Total Treasury Investments 47,950,483$ 47,950,483$
Credit Risk Credit risk is the risk that an issuer of an investment will not fulfill its obligation to the holder of the investment. This is measured by the assignment of a rating by nationally recognized statistical rating organization. As of June 30, 2016, the Local Agency Investment Fund was not rated.
Custodial Credit Risk Custodial credit risk is the risk that in the event of a bank failure, the District’s deposits may not be returned to it. The District does not have a policy for custodial credit risk for deposits. However, the California Government Code requires that a financial institution secure deposits made by State of local governmental units pledging securities in an undivided collateral pool held by a depository regulated under State law (unless so waived by the governmental unit). The market value of the pledged securities in the collateral pool must equal at least 110% of the total amount deposited by the public agencies. California law also allows financial institutions to secure public deposited by pledging first trust deed mortgage notes having a value of 150% of the secured public deposits and letters of credit issued by the Federal Home Loan Bank of San Francisco having a value of 105% of the secured deposits. Cash in banks is fully insured by the Federal Depository Insurance Corporation and so there is no exposure to custodial credit risk. Concentration of Credit Risk The investment policy of the District contains no limitations on the amount that can be invested in any one issuer beyond the amount stipulated by the California Government Code. District investments that are greater than 5 percent of the total investments are in either an external investment pool or mutual funds and are therefore exempt.

Menlo Park Fire Protection District Notes to the Basic Financial Statements (Continued)
For the Year Ended June 30, 2016
64
Note 2 – Cash and Investments (Continued) D. Investments in Local Agency Investment Fund
The District is a participant in LAIF which is regulated by California Government Code Section 16429 under the oversight of the Treasurer of the State of California. The District’s investments in LAIF at June 30, 2016 included a portion of pool funds invested in Structure Notes and Asset-Backed Securities:
Structured Notes are debt securities (other than asset-backed securities) whose cash-flow characteristics (coupon rate, redemption amount, or stated maturity) depend upon one or more indices and/or that have embedded forwards or options. Asset-Backed Securities, the bulk of which are mortgage-backed securities, entitle their purchasers to receive a share of the cash flows from pool of assets such as principal and interest repayments from a pool of mortgages (such as Collateralized Mortgage Obligations) or credit card receivables.
As of June 30, 2016, the District had $47,950,483 invested in LAIF, which had invested 2.81% of the pool investment funds in Structured Notes and Asset-Back Securities. LAIF determines fair value on its investment portfolio based on market quotations for those securities where market quotations are readily available and based on amortized cost or best estimate for those securities where market value is not readily available. The District valued its investments in LAIF As of June 30, 2016, by multiplying its account balance with LAIF times a fair value factor determined by LAIF. This fair value factor was determined by dividing all LAIF participants’ total aggregate amortized cost by total aggregate fair value(level 2 inputs). The fair value of the District’s position in the pool is the same as the value of the pool shares. The credit quality rating of LAIF is unrated As of June 30, 2016.
Note 3 – Interfund Balances and Transactions
A. Due to/Due from other funds
At June 30, 2016, interfund receivables and payables were as follows:
Due To Other Funds
FEMADue From Other Funds Fund
General Fund 29,315$
Current interfund balances arise in the normal course of operations to cover cash shortages and are expected to be repaid shortly after the end of the fiscal year.
B. Transfers In/Out
For the year ended June 30, 2016, interfund transfers were as follows:
Transfers To Other Funds
GeneralTransfers from Other Funds Fund
Capital Improvement Fund 10,039,544$ Debt Service Fund 950,100
Total 10,989,644$

Menlo Park Fire Protection District Notes to the Basic Financial Statements (Continued)
For the Year Ended June 30, 2016
65
Note 3 – Interfund Balances and Transactions (Continued) B. Transfers In/Out (Continued)
General Fund – Transfers were for operating support to the district capital projects and debt services fund. The total amount of transfers out for capital projects was $10,039,544; $3,150,000 for the purchase and remodel of 114 Santa Margarita building, $2,989,544 for Station 77 for land acquisition and construction project, $2,500,000 for Station 4 for the design and construction of a new station, and $1,400,000 for Station 1 for additional land acquisition and architect services. In addition, a transfer was made to pay debt service in the amount of $950,100. The General Fund transfers out total $10,989,644.
Note 4 – Capital Assets
Summary of change in capital assets activity for the year ended June 30, 2016, is shown below:
Balance BalanceJuly 1, 2015 Additions Deletions June 30, 2016
Capital assets, not being depreciated:Land 5,090,013$ -$ -$ 5,090,013$ Construction in progress 7,274,044 3,353,522 - 10,627,566
Total capital assets, not being depreciated 12,364,057 3,353,522 - 15,717,579
Capital assets, being depreciated:Building and improvements 12,631,627 373,253 - 13,004,880 Vehicles - MPFPD 5,839,517 619,117 (49,649) 6,408,985 Vehicles - FEMA 1,073,475 8,916 (54,571) 1,027,820 Furniture & Equipment - MPFPD 2,291,033 227,202 (207,573) 2,310,662 Furniture & Equipment - FEMA 464,763 9,315 - 474,078
Subtotal 22,300,415 1,237,803 (311,793) 23,226,425
Less accumulated depreciationBuilding and improvements (5,532,472) (312,748) - (5,845,220) Vehicles - MPFPD (3,982,838) (415,075) 49,649 (4,348,264) Vehicles - FEMA (951,758) (37,902) 54,571 (935,089) Furniture & Equipment - MPFPD (1,126,686) (180,905) 197,555 (1,110,036) Furniture & Equipment - FEMA (208,072) (58,960) - (267,032)
Subtotal (11,801,826) (1,005,590) 301,775 (12,505,641)
Total capital assets, being depreciated 10,498,589 232,213 (10,018) 10,720,784
Total capital assets, net 22,862,646$ 3,585,735$ (10,018)$ 26,438,363$
Depreciation expense of $1,005,590 was charged to public safety-fire governmental activities.
Note 5 – Long-Term Debt
A summary of changes in long-term debt for the year ended June 30, 2016 is as follows:
Original Issue Balance Debt Balance Due within Due in MoreAmount July 1, 2015 Retired June 30, 2016 One Year Than One Year
2009 Certificates of Participation Series A2%-5%, due 8/1/2022 3,055,000$ 2,335,000$ (255,000)$ 2,080,000$ 260,000$ 1,820,000$
2009 Certificates of Participation Series B2%-5%, due 8/1/2022 8,935,000 8,935,000 - 8,935,000 - 8,935,000
Total 11,270,000$ (255,000)$ 11,015,000$ 260,000$ 10,755,000$
Classification

Menlo Park Fire Protection District Notes to the Basic Financial Statements (Continued)
For the Year Ended June 30, 2016
66
Note 5 – Long-Term Debt (Continued)
2009 Certificates of Participation
On behalf of the District, in December 2009, the Public Property Financing Corporation of California (a nonprofit public benefit corporation) issued Certificates of Participation in the original principal amount of $11,990,000, bearing interest at 2-7%. Bond proceeds were used to finance a portion of the costs of the acquisition, construction, improvements and/or rehabilitation of facilities and improvements to be owned and operated by the District. Under a non-cancelable lease of these assets extending to August 1, 2039, the District makes annual payments on August 1, from any source of available funds of the District which are sufficient to pay the principal and interest on the 2009 Certificates of Participation. The costs of the assets securing this lease and the balance of the debt evidenced by the 2009 Certificates of Participation have been included in the District’s financial statements as this lease is in essence a financing arrangement, with ownership of the financed assets reverting to the District at its conclusion.
The taxable 2009 B Bonds were sold as “Build America Bonds” pursuant to the American Recovery and Reinvestment Act of 2009. The interest on Build America Bonds is not tax-exempt and therefore the bonds carry a higher interest rate. However, this higher interest rate will be offset by a subsidy payable by the United States Treasury up to 35 percent of the interest payable on the Bonds. The subsidy will be payable on or about the date that the District makes its debt service payments and the total subsidy received in fiscal year 2016 was $210,448 The annual debt services requirements for the Certificates of Participation Bonds, Series A and B, outstanding at June 30, 2016 are as follows:
Year EndingJune 30, Principal Interest Total
2017 260,000$ 739,085$ 999,085$ 2018 270,000 729,785 999,785 2019 280,000 717,385 997,385 2020 295,000 703,010 998,010 2021 310,000 687,885 997,885
2021-2025 1,395,000 3,150,631 4,545,631 2026-2030 2,135,000 2,606,104 4,741,104 2031-2035 2,685,000 1,740,921 4,425,921 2036-2040 3,385,000 639,704 4,024,704
Total 11,015,000$ 11,714,510$ 22,729,510$
Note 6 – Compensated Absences
Summary of changes in compensated absences for the year ended June 30, 2016 is as follows:
Balance Balance Due within Due in MoreJuly 1, 2015 Additions Deletions 6/30/2016 One Year Than One Year
Compensated Absences 2,617,172$ 1,737,638$ (1,767,655)$ 2,587,155$ 1,767,655$ 819,500$
Total 2,617,172$ 1,737,638$ (1,767,655)$ 2,587,155$ 1,767,655$ 819,500$
Classification
The District’s liability for vested and unpaid compensated absences (accrued vacation, sick time, comp time and annual leave) has been accrued and amounts to $2,587,155 at June 30, 2016.

Menlo Park Fire Protection District Notes to the Basic Financial Statements (Continued)
For the Year Ended June 30, 2016
67
Note 7 – Self-Insurance
A. General Liability
The District has commercial insurance coverage over its property, portable equipment, comprehensive crime, management liability and automobiles. The District also has excess liability insurance up to $10,000,000 per occurrence ($20,000,000 in aggregate). During the current year, there were no significant reductions in insurance coverage from the prior year. For each of the past three fiscal years, the settlements have not exceeded the District’s insurance coverage.
B. Workers’ Compensation
The District is self-insured for workers’ compensation claims up to the first $750,000 of each insurance claim. The District has insurance coverage for potential losses in excess of the workers’ compensation self-insurance limit. The District has contracted with a workers’ compensation administrator to handle its claims. As of June 30, the accrued workers’ compensation claims liabilities were:
2016 2015 2014
Claims liabilities - beginning balance 1,671,372$ 1,665,553$ 1,658,307$ Incurred claims, representing the total of a provision
for events of the current fiscal year and any changein the provision for events of prior fiscal years 663,533 553,595 393,926
Payments on claims attributable to events of boththe current fiscal year and prior fiscal years (715,917) (547,776) (386,680)
Claims liabilities - ending balance 1,618,988$ 1,671,372$ 1,665,553$
C. Dental Plan
The District has a self-insured dental plan. The District contributes $122 per month for each full time employee toward the employee dental plan. The benefit for part time staff is prorated depending upon the number of hours worked. In October for each year, claims are submitted by the District employees to a third party administrator (TPA) for reimbursement on November 30. The District paid $159,218 to the TPA during the year ended June 30, 2016.
Note 8 – Pension Plans A. Summary
Aggregate Net Pension Liability Aggregate Net Pension Liability is reported in the accompanying statement of net position as follows:
Net Pension
Liability
Miscellaneous Plans 1,536,010$ Safety Plans 27,463,202
Total 28,999,212$

Menlo Park Fire Protection District Notes to the Basic Financial Statements (Continued)
For the Year Ended June 30, 2016
68
Note 8 – Pension Plans (Continued)
A. Summary (Continued)
Deferred Outflows of Resources Deferred Outflows of Resources are reported in the accompanying statement of net position as follows:
Deferred employer Employer's actualpension contributions Adjustments due to Difference between contributions in excess of Total
made after positive diferrerences actual and expected Employer's proportionate pension-relatedmeasurement date in proportions experience share of contributions deferred outflows
Miscellaneous Plans 114,712$ 271,660$ 17,423$ 82,574$ 486,369$ Safety Plans 1,494,787 - - 6,701,416 8,196,203
Total 1,609,499$ 271,660$ 17,423$ 6,783,990$ 8,682,572$
Deferred Inflows of Resources Deferred Inflows of Resources are reported in the accompanying statement of net position as follows:
Investment earnings Adjustments due to Difference between Totalgreater than negative diferrerences Changes in actual and expected pension-related
expected earnings in proportions assumptions experience deferred outflows
Miscellaneous Plans 82,636$ -$ 164,839$ -$ 247,475$ Safety Plans 930,754 8,474,763 1,836,509 399,296 11,641,322
Total 1,013,390$ 8,474,763$ 2,001,348$ 399,296$ 11,888,797$
Pension Expense
Pension expenses are included in the accompanying statement of revenues, expenses, and Change in Net Position as follows:
Net PensionExpense
Miscellaneous Plans 43,006$
Safety Plans 3,802,211
Total 3,845,217$
B. CalPERS Pension Plans
Plan Description
Substantially all District employees working the equivalent of 1,000 hours per fiscal year are eligible to participate in the Safety Classic, Miscellaneous Classic, Safety PEPRA or Miscellaneous PEPRA cost-sharing multiple employer defined benefit plans administered by California Public Employees Retirement System (CalPERS), which acts as a common investment and administrative agent for its participating member employers. The Classic Plans are closed to new entrants only eligible for employees hired prior to January 1, 2013. Employees hired after January 1, 2013 are eligible to enroll in the PEPRA plans. Benefit Provisions under the Plans are established by State statutes within the Public Employee’s Retirement Law. CalPERS issues publicly available reports that include a full description of the pension plans regarding benefit provisions, assumptions and membership information that can be found on the CalPERS website. Copies of the CalPERS annual financial report may be obtained from the CalPERS Executive Office – 400 P Street, Sacramento, CA 95814.

Menlo Park Fire Protection District Notes to the Basic Financial Statements (Continued)
For the Year Ended June 30, 2016
69
Note 8 – Pension Plans (Continued) B. CalPERS Pension Plans (Continued)
Benefits Provided
CalPERS provides retirement and disability benefits, annual cost-of-living adjustments, and death benefits to plan members and beneficiaries. A classic safety and miscellaneous CalPERS member becomes eligible for Service Retirement upon attainment of age 50 and 55, respectively, with at least 5 years of credited service. Public Employee Pension Reform Act (PEPRA) safety and miscellaneous members become eligible for service retirement upon attainment of age 57 and 62, respectively, with at least 5 years of service. The service retirement benefit is a monthly allowance equal to the product of the benefit factor, years of service, and final compensation. The final compensation is the monthly average of the member's highest 12 full-time equivalent monthly pay. Retirement benefits for classic safety miscellaneous employees are calculated as 3% and 2.7%, respectively, of the average final 12 months compensation. Retirement benefits for PEPRA safety and miscellaneous employees are calculated as 2.7% and 2%, respectively, of the average final 36 months compensation.
Participant is eligible for non-industrial disability retirement if becomes disabled and has at least 5 years of credited service. There is no special age requirement. The standard non-industrial disability retirement benefit is a monthly allowance equal to 1.8% of final compensation, multiplied by service. Industrial disability benefits are not offered to miscellaneous employees.
An employee's beneficiary may receive the basic death benefit if the employee dies while actively employed. The employee must be actively employed with the District to be eligible for this benefit. An employee's survivor who is eligible for any other pre-retirement death benefit may choose to receive that death benefit instead of this basic death benefit. The basic death benefit is a lump sum in the amount of the employee's accumulated contributions, where interest is currently credited at 7.5% per year, plus a lump sum in the amount of one month's salary for each completed year of current service, up to a maximum of six months' salary. For purposes of this benefit, one month's salary is defined as the member's average monthly full-time rate of compensation during the 12 months preceding death. Upon the death of a retiree, a one-time lump sum payment of $500 will be made to the retiree's designated survivor(s), or to the retiree's estate. Benefit terms provide for annual cost-of-living adjustments to each employee’s retirement allowance. Beginning the second calendar year after the year of retirement, retirement and survivor allowances will be annually adjusted on a compound basis by 2%. Employees Covered
At June 30, 2015 measurement date, the following employees were covered by the benefit terms for each Plan:
Active employees
Inactive employees or beneficiaries currently
receiving benefits
Inactive employees entitled to but not yet
receiving benefits
Miscellaneous Plans 18 15 9 Safety Plans 84 144 20

Menlo Park Fire Protection District Notes to the Basic Financial Statements (Continued)
For the Year Ended June 30, 2016
70
Note 8 – Pension Plans (Continued) B. CalPERS Pension Plans (Continued)
Contributions Section 20814(c) of the California Public Employees’ Retirement Law (PERL) requires that the employer contribution rates for all public employers be determined on an annual basis by the actuary and shall be effective on the July 1 following notice of a change in the rate. The total plan contributions are determined through the CalPERS’ annual actuarial valuation process. For public agency cost-sharing plans covered by either the Miscellaneous or Safety risk pools, the Plan’s actuarially determined rate is based on the estimated amount necessary to pay the Plan’s allocated share of the risk pool’s costs of benefits earned by employees during the year, and any unfunded accrued liability. The employer is required to contribute the difference between the actuarially determined rate and the contribution rate of employees. For the measurement period ended June 30, 2015 (the measurement date), the active contribution rate was 12% of annual payroll for the Safety Classic Plan, 8% for the Miscellaneous Classic Plan, and 12.25% for the Safety PEPRA Plan, and 6.25%, for Miscellaneous PEPRA Plan. The average employer’s contribution rate was 10.958% of annual payroll for the Miscellaneous Classic Plan, 17.23% for the Safety Classic Plan, 11.923% for the Safety PEPRA Plan, and 11.923% for the Miscellaneous PEPRA Plan. For the measurement period ended June 30, 2015, the plan’s proportionate share of aggregate employer contributions made for each Plan was as follows:
Contributions - employer
Miscellaneous Plans 271,845$ Safety Plans 15,005,389
Total 15,005,389$
Pension Liabilities, Pension Expenses and Deferred Outflows/Inflows of Resources Related to Pensions The District’s net pension liability for each Plan is measured as the proportionate share of the net pension liability. The net pension liability of the Plans is measured as of June 30, 2015, and the total pension liability for each Plan used to calculate the net pension liability was determined by an actuarial valuation as of June 30, 2014 rolled forward to June 30, 2015 using standard update procedures. The District’s proportion of the net pension liability was based on a projection of the District’s long-term share of contributions to the pension plans relative to the projected contributions of all participating employers, actuarially determined. As of June 30, 2016, the District reported net pension liabilities for its proportionate shares of the net pension liability of each Plan as follows:
Plan Total Pension Plan Fiduciary Net Plan Net PensionLiability Position Liability/(Asset)
Miscellaneous Plans:Balance at: 6/30/14 (Valuation date) 7,123,724$ 5,914,739$ 1,208,985$ Balance at: 6/30/15 (Measurement date) 7,634,848 6,098,838 1,536,010 Net Changes during 2014-2015 511,124 184,099 327,025
Safety Plans:Balance at: 6/30/14 (Valuation date) 177,878,051$ 144,825,895$ 33,052,156$ Balance at: 6/30/15 (Measurement date) 177,411,391 149,948,189 27,463,202 Net Changes during 2014-2015 (466,660) 5,122,294 (5,588,954)
Increase (Decrease)

Menlo Park Fire Protection District Notes to the Basic Financial Statements (Continued)
For the Year Ended June 30, 2016
71
Note 8 – Pension Plans (Continued) B. CalPERS Pension Plans (Continued)
Pension Liabilities, Pension Expenses and Deferred Outflows/Inflows of Resources Related to Pensions (Continued) The following is the approach established by the plan actuary to allocate the net pension liability and pension expense to the individual employers within the risk pool.
(1) In determining a cost-sharing plan’s proportionate share, total amounts of liabilities and assets are first calculated for the risk pool as a whole on the valuation date (June 30, 2014). The risk pool’s fiduciary net position (“FNP”) subtracted from its total pension liability (“TPL”) determines the net pension liability (“NPL”) at the valuation date.
(2) Using standard actuarial roll forward methods, the risk pool TPL is then computed at the measurement date (June 30, 2015). Risk pool FNP at the measurement date is then subtracted from this number to compute the NPL for the risk pool at the measurement date. For purposes of FNP in this step and any later reference thereto, the risk pool’s FNP at the measurement date denotes the aggregate risk pool’s FNP at June 30, 2015 less the sum of all additional side fund (or unfunded liability) contributions made by all employers during the measurement period (2014-15).
(3) The individual plan’s TPL, FNP and NPL are also calculated at the valuation date.
(4) Two ratios are created by dividing the plan’s individual TPL and FNP as of the valuation date from (3) by the amounts in step (1), the risk pool’s total TPL and FNP, respectively.
(5) The plan’s TPL as of the Measurement Date is equal to the risk pool TPL generated in (2) multiplied by the TPL ratio generated in (4). The plan’s FNP as of the Measurement Date is equal to the FNP generated in (2) multiplied by the FNP ratio generated in (4) plus any additional side fund (or unfunded liability) contributions made by the employer on behalf of the plan during the measurement period.
(6) The plan’s NPL at the Measurement Date is the difference between the TPL and FNP calculated in (5).
The District’s proportionate share of the net pension liability for each Plan as of June 30, 2014 and 2015 was as follows:
Miscellaneous SafetyPlans Plans
Proportion June 30, 2014 0.01943% 0.53117%Proportion June 30, 2015 0.05599% 0.66651%
Change - Increase (Decrease) 0.03656% 0.13534%
For the year ended June 30, 2016, the District recognized pension expense in the amounts of $43,006 and $3,802,211, for the Miscellaneous plans and Safety plans, respectively.
The amortization period differs depending on the source of the gain or loss. The difference between projected and actual earnings is amortized over 5-years straight line. All other amounts are amortized straight-line over the average expected remaining service lives of all members that are provided with benefits (active, inactive and retired) as of the beginning of the measurement period.
The Expected Average Remaining Service Lifetime (“EARSL”) is calculated by dividing the total future service years by the total number of plan participants (active, inactive, and retired) in the risk pool. The EARSL for risk pool for the 2014-15 measurement period is 3.8 years, which was obtained by dividing the total service years of 467,023 (the sum of remaining service lifetimes of the active employees) by 122,410 (the total number of participants: active, inactive, and retired).

Menlo Park Fire Protection District Notes to the Basic Financial Statements (Continued)
For the Year Ended June 30, 2016
72
Note 8 – Pension Plans (Continued) B. CalPERS Pension Plans (Continued)
Pension Liabilities, Pension Expenses and Deferred Outflows/Inflows of Resources Related to Pensions (Continued) At June 30, 2016, the District reported deferred outflows of resources and deferred inflows of resources related to pensions from the following sources:
Deferred outflows Deferred inflowsof Resources of Resources
Difference between projected and actual earning on pension plan investments -$ (82,636)$
Adjustment due to differences in proportions 271,660 - Changes in assumptions - (164,839) Difference between actual and expected experience 17,423 - Difference between Employer's actual contributions
and proportionate share of contributions 82,574 -
Total 371,657$ (247,475)$
Deferred outflows Deferred inflowsof Resources of Resources
Difference between projected and actual earning on pension plan investments -$ (930,754)$
Adjustment due to differences in proportions - (8,474,763) Changes in assumptions - (1,836,509) Difference between actual and expected experience - (399,296) Difference between Employer's actual contributions
and proportionate share of contributions 6,701,416 -
Total 6,701,416$ (11,641,322)$
Safety Plans
Miscellaneous Plans
For the Miscellaneous plans and Safety plans, $114,712 and $1,494,787, respectively, was reported as deferred outflows of resources related to pensions resulting from District’s contributions subsequent to the measurement date will be recognized as a reduction of the net pension liability in the year ended June 30, 2017. Other amounts reported as deferred outflows of resources and deferred inflows of resources related to pensions will be recognized in pension expense as follows:
Miscellaneous SafetyYear Ended June 30, Plans Plans
2016 7,869$ (2,196,236)$ 2017 9,681 (2,155,192) 2018 1,002 (1,731,040) 2019 105,630 1,142,562 2020 - -
Thereafter - -
124,182$ (4,939,906)$
Deferred Outflows/(Inflows) of Resources

Menlo Park Fire Protection District Notes to the Basic Financial Statements (Continued)
For the Year Ended June 30, 2016
73
Note 8 – Pension Plans (Continued) B. CalPERS Pension Plans (Continued)
Actuarial Methods and Assumptions Used to Determine Total Pension Liability For the measurement period ended June 30, 2015 (the measurement date), the total pension liability was determined by rolling forward the June 30, 2014 total pension liability. The June 30, 2015 total pension liability was based on the following actuarial methods and assumptions: Actuarial Cost MethodActuarial Assumptions:
Discount RateInflationSalary IncreasesInvestment Rate of ReturnMortality Rate Table
Post Retirement Benefit Increase
7.65%2.75%Varies by Entry Age and Service
Entry Age Normal in accordance with the requirement of GASB Statement No. 68
Contract COLA up to 2.75% until Purchasing Power Protection Allowance Floor on Purchasing Power applies, 2.75% thereafter.
Derived using CalPERS’ Membership Data for all Funds. The mortality table used was developed based on CalPERS' specfic data. The table includes 20 years of mortality improvements using Society of Actuaries Scale BB.
7.50% Net of Pension Plan Investment and Administrative Expenses; includes Inflation
All other actuarial assumptions used in the June 30, 2014 valuation were based on the results of an actuarial experience study for the period from 1997 to 2011, including updates to salary increase, mortality and retirement rates. The Experience Study report can be obtained at CalPERS’ website under Forms and Publications.
Change of Assumption In accordance with GASB 68, the long-term expected rate of return should be determined net of pension plan investment expense but without reduction for pension plan administrative expense. The discount rate was changed from 7.5% (net of administrative expense in 2014) to 7.65% as of the June 30, 2015 measurement date to correct the adjustment which previously reduced the discount rate for administrative expenses.
Discount Rate The discount rate used to measure the total pension liability was 7.65%. To determine whether the municipal bond rate should be used in the calculation of a discount rate for each plan, CalPERS stress tested plans that would most likely result in a discount rate that would be different from the actuarially assumed discount rate. Based on the testing, none of the tested plans run out of assets. Therefore, the current 7.65% discount rate is adequate and the use of the municipal bond rate calculation is not necessary. The long term expected discount rate of 7.65% is applied to all plans in the Public Employees Retirement Fund. The stress test results are presented in a detailed report called “GASB Crossover Testing Report” that can be obtained at CalPERS’ website under the GASB 68 section. According to Paragraph 30 of Statement 68, the long-term discount rate should be determined without reduction for pension plan administrative expense. The 7.50% investment return assumption used in this accounting valuation is net of administrative expenses. Administrative expenses are assumed to be 15 basis points. An investment return excluding administrative expenses would have been 7.65%. Using this lower discount rate has resulted in a slightly higher total pension liability and net pension liability. This difference was deemed immaterial to the Public Agency Cost-Sharing Multiple-Employer Defined Benefit Pension Plan.

Menlo Park Fire Protection District Notes to the Basic Financial Statements (Continued)
For the Year Ended June 30, 2016
74
Note 8 – Pension Plans (Continued) B. CalPERS Pension Plans (Continued)
Discount Rate (Continued)
CalPERS is scheduled to review all actuarial assumptions as part of its regular Asset Liability Management review cycle that is scheduled to be completed in February 2018. Any changes to the discount rate will require Board action and proper stakeholder outreach. For these reasons, CalPERS expects to continue using a discount rate net of administrative expenses for GASB 67 and 68 calculations through at least the 2017-18 fiscal year. CalPERS will continue to check the materiality of the difference in calculation until such time as we have changed our methodology.
The long-term expected rate of return on pension plan investments was determined using a building-block method in which best-estimate ranges of expected future real rates of return (expected returns, net of pension plan investment expense and inflation) are developed for each major asset class. In determining the long-term expected rate of return, staff took into account both short-term and long-term market return expectations as well as the expected pension fund cash flows. Such cash flows were developed assuming that both members and employers will make their required contributions on time and as scheduled in all future years. Using historical returns of all the funds’ asset classes, expected compound (geometric) returns were calculated over the short-term (first 10 years) and the long-term (11-60 years) using a building block approach. Using the expected nominal returns for both short-term and long-term, the present value of benefits was calculated for each fund. The expected rate of return was set by calculating the single equivalent expected return that arrived at the same present value of benefits for cash flows as the one calculated using both short-term and long-term returns. The expected rate of return was then set equivalent to the single equivalent rate calculated above and rounded down to the nearest one quarter of one percent. The table below reflects long-term expected real rate of return by asset class. The rate of return was calculated using the capital market assumptions applied to determine the discount rate and asset allocation. These geometric rates of return are net of administrative expenses.
The long-term expected real rate of return by asset class for the measurement period ended June 30, 2016 was as follows:
New Strategic Real Return Real Return
Asset Class Allocation Years 1-101 Years 11+2
Global Equity 50.00% 5.25% 5.71%Global Fixed Income 17.00% 0.99% 2.43%Inflation Sensitive 4.00% 0.45% 3.36%Private Equity 14.00% 6.83% 6.95%Real Estate 11.00% 4.50% 5.13%Infrastructure and Forestland 0.00% 4.50% 5.09%Liquidity 4.00% -0.55% -1.05%
100%1An expected inflation of 2.5% used for this period2An expected inflatin of 3.0% used for this period.

Menlo Park Fire Protection District Notes to the Basic Financial Statements (Continued)
For the Year Ended June 30, 2016
75
Note 8 – Pension Plans (Continued) B. CalPERS Pension Plans (Continued)
Sensitivity of the Proportionate Share of the Net Pension Liability to Changes in the Discount Rate The following presents the District’s proportionate share of the net pension liability for each Plan type, calculated using the discount rate for each Plan, as well as what the District’s proportionate share of the net pension liability would be if it were calculated using a discount rate that is one percentage point lower or one percentage point higher than the current rate:
Discount Rate - 1% Current Discount Discount Rate + 1%(6.65%) Rate (7.65%) (8.65%)
Miscellaneous Plans 2,575,996 1,536,010 677,381
Safety Plans 44,032,944 27,463,202 13,876,318
46,608,940$ 28,999,212$ 14,553,699$
Plan's Aggregate Net Pension Liability/(Asset)
Pension Plan Fiduciary Net Position Detailed information about each pension plan’s fiduciary net position is available in the separately issued CalPERS financial reports. Payable to the Pension Plan At June 30, 2016, the District reported a payable of $364,392 for the outstanding amount of contributions to the pension plan required for the year ended June 30, 2016.
Note 9 – Deferred Compensation Plan
The District offers its eligible employees a deferred compensation plan created in accordance with Internal Revenue Code Section 457. The plan, available to all regular employees, permits them to defer a portion of their salary until future years. The deferred compensation is available to employees upon termination, retirement, disability or death.
Note 10 – Other Post-Employment Benefits
Plan Descriptions The District provides various post-employment health benefits for all employees who retire from the District. These benefits include contributions to the employees Post Employment Health Plan (PEHP), Retiree Medical Stipends, and Public Employees' Medical and Hospital Care Act (PEHMCA). The benefits are based on Memorandum of Understanding with the Unions, and/or Board adopted Resolutions. An employee is eligible to participate in a District sponsored health plan if he or she retires within 120 days of separation from employment, and receives a monthly retirement allowance from CalPERS. If the member meets this requirement, he or she may continue his or her enrollment at retirement and enrolls within 60 days of retirement.

Menlo Park Fire Protection District Notes to the Basic Financial Statements (Continued)
For the Year Ended June 30, 2016
76
Note 10 – Other Post-Employment Benefits (Continued)
Plan Descriptions (Continued) As of June 30, 2016, 64 retirees participated in the CalPERS Medical Plan. The District currently pays only the PEHMCA Portion of the premium. For the 2016 calendar year the PEHMCA fee is $125 per retiree participating in a CalPERS Medical Plan. Post-Employment Health Plan (PEHP) Currently, the District contributes to the PEHP Plan for International Association of Fire Fighters (“IAFF”) Local 2400 and non-represented non-Safety staff. Authorized by Board Resolution No. 1431-2011, the District contributes a monthly allotment of $442 to each represented Safety employee's individual Post Employment Health Account. As of June 30, 2016 there are 81 active employees receiving the benefit. Authorized by Board Resolution No. 1606-2013, the District contributes a monthly allotment of $250 to each non-represented non-Safety employee's individual Post Employment Health Account. As of June 30, 2016, there are 28 active employees receiving the benefit.
Retiree Medical Stipend Employees retiring from the District, and meeting the years of service requirement, are eligible for a medical stipend until they are eligible for Medicare (Age 65). The amount varies for Represented and Unrepresented employees as outlined below. Election of CalPERS medical coverage is not required to receive this benefit. Employees in the IAFF represented group retiring on or after January 1, 2002, and hired before January 1, 2012, with at least 20 years of District service are eligible to receive $250 per month towards the cost of coverage. Employees in the non-represented Safety group and Non-Safety group retiring on or after January 1, 2002, and hired before January 1, 2012, with at least 15 years of District service are eligible to receive $300 per month toward the cost of coverage.
Funding Policy
The District’s policy is to partially prefund these benefits by accumulating assets with Public Agency Retirement Services (PARS) discussed above along with making pay-as-you-go payments.
Annual OPEB Cost and Net OPEB Asset
The District’s annual other postemployment benefit (OPEB) cost (expense) is calculated based on the annual required contribution of the employer (ARC), an amount actuarially determined in accordance with the parameters of GASB Statement No. 45. The ARC represents a level of funding that, if paid on an ongoing basis, is projected to cover normal cost each year and amortize any unfunded actuarial liabilities (or funding excess) over a period not to exceed thirty years. Generally accepted accounting principles permits contributions to be treated as OPEB assets and deducted from the Actuarial Accrued Liability when such contributions are placed in an irrevocable trust or equivalent arrangement. The following table shows the components of the District’s annual OPEB cost for the year, the actual amount contributed to PARS, the amount actually contributed to pay premiums, and changes in the District’s net OPEB obligation for these benefits.

Menlo Park Fire Protection District Notes to the Basic Financial Statements (Continued)
For the Year Ended June 30, 2016
77
Note 10 – Other Post-Employment Benefits (Continued)
Annual OPEB Cost and Net OPEB Asset (Continued)
Annual required contribution 550,516$ Interest on net OPEB (asset) (162,433) Adjustment to the annual required contribution 149,320
Annual OPEB cost 537,403 Contributions to PARS trust fund - Contributions (Implicit) (101,061) Contributions (Explicit) (248,939)
(Decrease) in net OPEB asset 187,403 Net OPEB (asset), beginning of the year (3,321,735)
Net OPEB (asset), end of year (3,134,332)$
The District’s annual OPEB cost, the percentage of annual OPEB cost contributed to the plan, and the net OPEB obligation for 2014, 2015 and 2016 were as follows:
Percentage of Net
Annual Actual Annual OPEB OPEBFiscal Year OPEB Cost Contributions Cost Contributed Obligation (Asset)
2014 391,274$ 174,536$ 45% (840,090)$ 2015 319,355 212,382 67% (3,321,735) 2016 537,403 248,939 46% (3,134,332)
Funded Status and Funding Progress As of June 30, 2015, the most recent actuarial valuation date, the plan was partially funded with assets that had been transferred to PARS as of that date. The actuarial accrued liability for benefits was $9,260,194, and the actuarial value of assets was $4,931,712, resulting in an unfunded actuarial liability (“UAAL”) of $4,328,482 and a funded ratio (actuarial value of assets as a percentage of the actuarial liability) of 53,26%. The covered payroll (annual payroll of active employees covered by the plan) was $12,100,730 and the ratio of the UAAL to the covered payroll was negative 35.77%. Actuarial valuations of an ongoing plan involve estimates of the value of reported amounts and assumptions about the probability of occurrence of events far into the future. Examples include assumptions about the future employment, mortality and the healthcare cost trend. Amounts determined regarding the funded status of the plan and the annual required contributions of the employer are subject to continual revision as actual results are compared with past expectations and new estimates are made about the future. The schedule of funding progress, presented as required supplementary information following the notes to financial statements, presents multi-year trend information about whether the actuarial value of plan assets is increasing or decreasing over time relative to the actuarial accrued liabilities for the benefits.

Menlo Park Fire Protection District Notes to the Basic Financial Statements (Continued)
For the Year Ended June 30, 2016
78
Note 10 – Other Post-Employment Benefits (Continued) Actuarial Methods and Assumptions Projections of benefits for financial reporting purposes are based on the substantive plan (the plan as understood by the employer and the plan members) and include the types of benefits provided at the time of each valuation and the historical pattern of sharing of benefit costs between employer and plan members to that point. The actuarial methods and assumptions used include techniques that are designed to reduce the effects of short-term volatility in actuarial accrued liabilities and the actuarial assets, consistent with the long-term perspective of the calculations.
The actuarial cost method used for determining the benefit obligations is the Frozen Entry Age Actuarial Cost Method. The actuarial assumptions included a 4.89% percent investment rate of return, which is the assumed rate of the expected long-term investment returns on plan assets calculated based on the funded level of the plan at the valuation date. The UAAL is being amortized as a level percentage of projected payroll over 15 years on a closed-basis. Additional actuarial assumptions include (a) 3.25% projected annual salary increase, (b) 4.50% health inflation increases, and (c) inflation rate of 3%.
Note 11 – Emergency Medical Response
In September 1997, the District began its participation with other fire departments of cities and fire districts throughout San Mateo County in the development of a Joint Power Agreement to establish the San Mateo Pre-Hospital Emergency Services Providers Group, which provides pre-hospital emergency services in San Mateo County. The District receives revenue on a monthly basis for the services provided. For the year ended June 30, 2016, the District received a net amount of $185,268 for its portion of revenue from the Emergency Medical Response JPA.

Menlo Park Fire Protection District Notes to the Basic Financial Statements (Continued)
For the Year Ended June 30, 2016
79
Note 12 – Classification of Fund Balances
A. Fund Balances
Capital
Improvement DebtGeneral FEMA Capital Projects Service
Fund Fund Fund Fund TotalNonspendable
Prepaid Fire Engine 921,302$ - - - 921,302$
Total nonspendable 921,302 - - - 921,302 Restricted
FEMA - 9,692 - - 9,692 Debt Service - - - 1,097,412 1,097,412 Employees 3% Contribution To PERS Reserve 456,066 - - - 456,066
Total restricted 456,066 9,692 - 1,097,412 1,563,170
CommittedBudgetary Deficit 18,128,125 - - - 18,128,125 FEMA Deployments 3,000,000 - - - 3,000,000 Apparatus 5,024,231 - - - 5,024,231 Debt Service - - - 1,393,694 1,393,694 Admin/Fire Prevention - - 3,148,260 - 3,148,260 Station 1 - - 1,670,646 - 1,670,646 Station 2 - - 1,566,786 - 1,566,786 Station 3 - - 25,000 - 25,000 Station 4 - - 10,209,492 - 10,209,492 Station 5 - - 37,800 - 37,800 Station 6 - - 8,415,846 - 8,415,846 Station 7 - - 3,135,521 - 3,135,521
Total committed 26,152,356 - 28,209,351 1,393,694 55,755,401
AssignedEncumbrances (Purchase Orders) 385,765 - - - 385,765 PERS-Future PERS Payments 5,756,233 - - - 5,756,233 General Services 931,973 - - - 931,973 Workers' Compensation 1,892,771 - - - 1,892,771 Compensated Absences 2,543,781 - - - 2,543,781 Equipment Replacement 2,233,743 - - - 2,233,743
Total assigned 13,744,266 - - - 13,744,266 Unassigned 198,194 - - - 198,194
Total fund balances 41,472,184$ 9,692$ 28,209,351$ 2,491,106$ 72,182,333$
B. Stabilization and Contingency Arrangements
In June of 2012, the District, by Resolution #1536, replaced two unassigned Reserve Funds, one for Economic Uncertainty and one for Fluctuating Property Tax Growth with a new committed Budgetary Deficit Fund. The balance is equal to the projected excess of budgeted expenditures over budgeted revenues by fund. As of June 30, 2016 the Reserve for Budgetary Deficit Fund had a balance of $18,128,125. The District has only had to use this committed fund balance once in the last 10 years.

Menlo Park Fire Protection District Notes to the Basic Financial Statements (Continued)
For the Year Ended June 30, 2016
80
Note 13 – Commitments and Contingencies Litigation The District is presently involved in certain matters of litigation that have risen in the normal course of conducting District business. District management believes, based upon consultation with the District Attorney, that these cases, in the aggregate, are not expected to result in a material adverse financial impact on the District. Additionally, District management believes that the District’s insurance programs are sufficient to cover any potential losses should an unfavorable outcome materialize.
Federal and State Grant Programs The District participates in Federal and State grant programs. These programs have been audited through the fiscal year ended June 30, 2016 by the District’s independent accountants in accordance with the provisions of the federal Single Audit Act as amended and applicable State requirements. No cost disallowances were proposed as a result of these audits; however, these programs are still subject to further examination by the grantors and the amount, if any, of expenditures which may be disallowed by the granting agencies cannot be determined at this time. The District expects such amounts, if any, to be immaterial.

81
REQUIRED SUPPLEMENTARY INFORMATION (UNAUDITED)

82
This page intentionally left blank

Menlo Park Fire Protection District Required Supplementary Information (Unaudited)
Budget Comparison Schedule - General Fund For the Year Ended June 30, 2016
83
Actual Variance withOriginal Final Amounts Final Budget
REVENUES:Property taxes - secured and unsecured 34,345,700$ 34,345,700$ 40,300,377$ 5,954,677$ Redevelopment Projects in Menlo Park 623,600 623,600 612,259 (11,341) Homeowner's property tax relief 190,900 190,900 121,608 (69,292) Redevelopment projects in East Palo Alto 520,000 520,000 274,251 (245,749) Licenses and permits 925,000 925,000 1,276,787 351,787 Charges for services - JPA ambulance service 267,000 267,000 185,268 (81,732) Rent revenue 81,600 81,600 77,533 (4,067) Grant revenue - - 624,778 624,778 Interest 124,800 124,800 205,005 80,205 Other revenue 50,000 50,000 576,247 526,247
Total revenues 37,128,600 37,128,600 44,254,113 7,125,513
EXPENDITURES:
Current:Salaries and benefits 25,187,200 25,107,636 24,566,605 541,031 Services and supplies 4,832,100 5,133,364 4,964,604 168,760
Capital outlay 3,007,900 2,994,700 855,236 2,139,464 Total expenditures 33,027,200 33,235,700 30,386,445 2,849,255
REVENUES OVER (UNDER) EXPENDITURES 4,101,400 3,892,900 13,867,668 9,974,768
OTHER FINANCING SOURCES (USES)Proceeds from sales of property - - 1,065 1,065 Transfers out 3,450,100 (10,989,644) (10,989,644) -
Total other financing sources (uses) 3,450,100 (10,989,644) (10,988,579) 1,065
Net change in fund balance 7,551,500$ (7,096,744)$ 2,879,089 9,975,833$
Fund Balance:
Beginning of year 38,593,095
End of year 41,472,184$
Budgeted Amounts

Menlo Park Fire Protection District Required Supplementary Information (Unaudited) (Continued) Budget Comparison Schedule – FEMA Special Revenue Fund
For the Year Ended June 30, 2016
84
Actual Variance withOrginal Final Amounts Final Budget
REVENUES:
Grant revenue 1,142,466$ 1,218,716$ 1,218,716$ -$ Total revenues 1,142,466 1,218,716 1,218,716 -
EXPENDITURES:
Current:Salaries and benefits 401,616 378,382 378,382 -
Services and supplies 740,850 821,327 821,327 -
Capital outlay - 9,315 9,315 - Total expenditures 1,142,466 1,209,024 1,209,024 -
REVENUES OVER (UNDER) EXPENDITURES - 9,692 9,692 -
Net change in fund balance -$ 9,692$ 9,692 -$
Fund Balance:
Beginning of year -
End of year 9,692$
Budgeted Amounts

Menlo Park Fire Protection District Required Supplementary Information (Unaudited) (Continued)
Notes to the Budgetary Comparison Schedules For the Year Ended June 30, 2016
85
Annual budgets are adopted by the Board of Directors prior to July 1st, the beginning of the fiscal year, for the general, special revenue, debt service, and capital projects funds. The budget includes appropriations (budgeted expenditures) and the means of financing them (budgeted revenues). All unencumbered appropriations lapse at the end of the fiscal year. Encumbered appropriations are carried forward in the subsequent fiscal year. These budgets are revised by the District’s governing board during the year to give consideration to unanticipated income and expenditures. A formal budget was used as a management control device during the year for all District funds. The District’s budget allocations are based on their chart of accounts, which includes major objects, minor objects and individual appropriation accounts for department, division and expenditure type. Expenditures cannot legally exceed appropriations by major object account. Budgets are adopted on a basis consistent with generally accepted accounting principles for all funds. Sufficient resources were available within this fund to finance this expenditure. Encumbrance accounting is employed in funds. Encumbrances (e.g., purchase orders, contracts) outstanding at year-end are reported as reservations of fund balances and do not constitute expenditures or liabilities because the commitments will be honored during the subsequent year.

Menlo Park Fire Protection District Required Supplementary Information (Unaudited) (Continued)
Schedule of the District's Proportionate Share of the Net Pension Liability and Related Ratios For the Year Ended June 30, 2016
86
Measurement Period June 30, 20151 June 30, 20141
District's Proportion of the Net Pension Liability 0.05599% 0.01943%
District's Proportionate Share of the net Pension Liability 3, 4 1,536,010$ 1,208,985$
District's Covered-Employee Payroll 2 1,718,188$ 1,706,342$
District's Proportionate Share of the Net Pension Liability
as a Percentage of Its Covered-Employee Payroll 89.40% 70.85%
Plan's Proportionate Share of the Fiduciary Net Position as a Percentage of the Total Pension Liability 79.88% 83.03%
Measurement Period June 30, 20151 June 30, 20141
District's Proportion of the Net Pension Liability 0.66651% 0.53117%
District's Proportionate Share of the net Pension Liability 3, 4 27,463,202$ 33,052,156$
District's Covered-Employee Payroll 2 10,553,488$ 10,785,618$
District's Proportionate Share of the Net Pension Liability
as a Percentage of Its Covered-Employee Payroll 260.23% 306.45%
Plan's Proportionate Share of the Fiduciary Net Position as a Percentage of the Total Pension Liability 84.52% 81.42%
Notes to Schedule:
* - Fiscal year 2015 was the first year of implementation, therefore only two years are shown.
California Public Employees' Retirement System ("CalPERS") Safety Plans
California Public Employees' Retirement System ("CalPERS") Miscellaneous Plans
Changes in assumptions. In 2015, amounts reported as changes in assumptions resulted primarily from adjustments to expected retirementages of miscellaneous employees.
1 Historical information is required only for measurement periods for which GASB 68 is applicable. 2 Covered-Employee Payroll represented above is based on pensionable earnings provided by the employer. However, GASB 68 definescovered-employee payroll as the total payroll of employees that are provided pensions through the pension plan. Accordingly, if pensionableearnings are different than total earnings for covered-employees, the employer should display in the disclosure footnotes the payroll based ontotal earnings for the covered group and recalculate the required payroll-related ratios.3 The plan’s proportionate share of aggregate contributions may not match the actual contributions made by the employer during themeasurement period. The plan’s proportionate share of aggregate contributions is based on the plan’s proportion of fiduciary net positionshown on line 5 of the table above as well as any additional side fund (or unfunded liability) contributions made by the employer during themeasurement period.
4 This data is not required to be displayed by GASB 68 for employers participating in cost-sharing plans, but it is being shown here because itis used in the calculation of the Plan’s pension expense.

Menlo Park Fire Protection District Required Supplementary Information (Unaudited) (Continued)
Schedule of Contributions For the Year Ended June 30, 2016
87
2015-161 2014-151 2013-141
Actuarially Determined Contribution2 114,712$ 271,845$ 241,133$ Contribution in Relation to the Actuarially Determined Contribution2 (114,712) (271,845) (241,133)
Contribution Deficiency (Excess) -$ -$ -$
Covered-Employee Payroll31,769,734$ 1,718,188$ 1,706,342$
Contributions as a Percentage of Covered-Employee Payroll 6.48% 15.82% 14.13%
2015-161 2014-151 2013-141
Actuarially Determined Contribution2 1,494,787$ 3,005,389$ 1,291,173$ Contribution in Relation to the Actuarially Determined Contribution2 (1,494,787) (15,005,389) (1,291,173)
Contribution Deficiency (Excess) -$ (12,000,000)$ -$
Covered-Employee Payroll 3, 410,870,093$ 10,553,488$ 10,785,618$
Contributions as a Percentage of Covered-Employee Payroll 13.75% 142.18% 11.97%
Notes to Schedule
Valuation date: 6/30/2014
Methods and assumptions used to determine contribution rates:
Actuarial cost method
Amortization method/period
Asset valuation method
Inflation 2.75%
Salary increases Varies by entry age and service
Payroll growth 3.00%
Investment rate of return 7.50%, net of pension plan investment and administrative expenses, including inflation
Retirement age
Mortality
4 Payroll from prior year was assumed to increase by the 3.00% payroll growth assumption.
The actuarial methods and assumptions used to set the actuarially determined contributions for Fiscal Year 2013-14 were from the June 30, 2011 public agency valuations.
2 Employers are assumed to make contributions equal to the actuarially determined contributions. However, some employers may choose to make additionalcontributions towards their unfunded liability. Employer contributions for such plans exceed the actuarially determined contributions.
3 Covered-Employee Payroll represented above is based on pensionable earnings provided by the employer. However, GASB 68 defines covered-employee payroll asthe total payroll of employees that are provided pensions through the pension plan. Accordingly, if pensionable earnings are different than total earnings for covered-employees, the employer should display in the disclosure footnotes the payroll based on total earnings for the covered group and recalculate the required payroll-relatedratios.
1 Historical information is required only for measurement periods for which GASB 68 is applicable.
California Public Employees' Retirement System ("CalPERS") Miscellaneous Plans
California Public Employees' Retirement System ("CalPERS") Safety Plans
For details, see June 30, 2011 Funding Valuation Report
Entry Age Normal
Actuarial Value of Assets. For details, see June 30, 2011 Funding Valuation Report.
The probabilities of retirement are based on the 2010 CalPERS Experience study for the period from1997 to 2007.
The probabilities of mortality are based on the 2010 CalPERS Experience Study for the period from1997 to 2007. Pre-retirement and Post-retirement mortality rates include 5 years of projected mortalityimprovement using Scale AA published by the Society of Actuaries.

Menlo Park Fire Protection District Required Supplementary Information (Unaudited) (Continued)
Schedule of Funding Progress For the Year Ended June 30, 2016
88
The following Schedule of Funding Progress of the Other Postemployment Healthcare Plan shows the recent history of the actuarial value of assets, actuarial accrued liability, their relationship, and the relationship of the unfunded actuarial accrued liability to payroll.
Entry Age UAAL asActuarial Unfunded a % of
Actuarial Actuarial Accured AAL Funded Covered CoveredValuation Value of Liability (UAAL) Ratio Payroll Payroll
Date Assets (a) (b) [(b) - (a)] [(a) / (b)] (c) [(b) - (a)] / (c)
April 1, 2011 823,487$ 2,967,179$ 2,143,692$ 27.75% 11,563,896$ 18.54%June 30, 2013 1,812,694 4,563,112 2,750,418 39.72% 11,841,085 23.23%July 1, 2015 4,931,712 9,260,194 4,328,482 53.26% 12,100,730 35.77%

SUPPLEMENTARY INFORMATION
89

This page intentionally left blank
90

Actual Variance withOriginal Final Amounts Final Budget
REVENUES:Interest -$ -$ 102$ 102$
Total revenues - - 102 102
EXPENDITURES:Capital outlay 3,489,000 6,223,122 3,726,774 (2,496,348)
Total expenditures 3,489,000 6,223,122 3,726,774 (2,496,348)
REVENUES OVER (UNDER) EXPENDITURES (3,489,000) (6,223,122) (3,726,672) 2,496,450
OTHER FINANCING SOURCES (USES):Transfers in 2,500,000 10,039,544 10,039,544 -
Total other financing sources (uses) 2,500,000 10,039,544 10,039,544 -
CHANGE IN FUND BALANCE (989,000)$ 3,816,422$ 6,312,872 2,496,450$
FUND BALANCE:
Beginning of year 21,896,479
End of year 28,209,351$
For the Year Ended June 30, 2016Capital Improvement Fund
Schedule of Revenues, Expenditures, and Change in Fund Balance - Budget and ActualMenlo Park Fire Protection District
Budgeted Amounts
91

Actual Variance withOriginal Final Amounts Final Budget
REVENUES:Intergovernmental 209,900$ 209,900$ 210,448$ (548)$ Interest 8,500 8,500 - 8,500
Total revenues 218,400 218,400 210,448 7,952
EXPENDITURES:Debt Service:
Principal 255,000 255,000 255,000 - Interest and fiscal charges 749,800 749,800 765,489 (15,689)
Total expenditures 1,004,800 1,004,800 1,020,489 (15,689)
REVENUES OVER (UNDER) EXPENDITURES (786,400) (786,400) (810,041) (7,737)
OTHER FINANCING SOURCES (USES):Transfers in 950,100 950,100 950,100 -
Total other financing sources (uses) 950,100 950,100 950,100 -
CHANGE IN FUND BALANCE 163,700$ 163,700$ 140,059 (7,737)$
FUND BALANCE:
Beginning of year 2,351,047
End of year 2,491,106$
For the Year Ended June 30, 2016Debt Service Fund
Schedule of Revenues, Expenditures, and Change in Fund Balance - Budget and ActualMenlo Park Fire Protection District
Budgeted Amounts
92

Index Page
Financial Trends
1 Net Position by Component 942 Changes in Net Position 953 Fund Balances of Governmental Funds 964 Changes in Fund Balances of Governmental Funds 97
Revenue Capacity
1 Assessed Value and Estimated Actual Value of Taxable Property 982 Direct and Overlapping Property Tax Rates 993 Principal Property Taxpayers 1004 Property Tax Levies and Collections 101
Debt Capacity
1 Ratio of Outstanding Debt by Type 102
Demographic and Economic Information
1 Demographic and Economic Statistics 103
Operating Information
1 Principal Employers – information available only for the City of Menlo Park 1042 Full-time Equivalent Employees by Function/Program 1053 Operating Indicators 1064 Capital Asset Statistics by Function/Program 107
Sources
These schedules contain information to help the reader assess the District’s most significant localrevenue source, the property tax:
These schedules present information to help the reader assess the affordability of the District’s currentlevels of outstanding debt and the District’s ability to issue additional debt in the future:
These schedules offer demographic and economic indicators to help the reader understand theenvironment within which the District’s financial activities take place:
These schedules contain service data to help the reader understand how the information in theDistrict’s financial report relates to the services the District provides and the activities it performs:
Unless otherwise noted, the information in these schedules is derived from the Comprehensive Annual Financial Reports for the relevant year.
STATISTICAL SECTION(Unaudited)
This part of the District’s Comprehensive Annual Financial Report presents detailed information as a context forunderstanding what the information in the financial statements, note disclosures, and required supplementaryinformation says about the District’s overall financial health. In contrast to the financial section, the statistical sectioninformation is not subject to independent audit.
These schedules contain trend information to help the reader understand how the District’s financialperformance and well being have changed over time:
93

2007 2008 2009 2010 2011 2012 2013 2014 (B) 2015 2016
Governmental activities
Net investment in capital assets 8,575,363$ 10,899,127$ 12,531,135$ 3,281,789$ 4,599,421$ 5,775,696$ 6,682,020$ 7,918,800$ 11,847,646$ 15,683,363$
Restricted - - - 3,120,636 2,873,309 2,209,876 1,084,916 1,093,440 1,390,863 1,553,478
Unrestricted 22,177,699 23,403,691 28,018,133 30,630,832 35,712,673 42,430,956 53,419,064 23,180,769 30,443,000 26,123,698
Total governmental activities net position 30,753,062$ 34,302,818$ 40,549,268$ 37,033,257$ 43,185,403$ 50,416,528$ 61,186,000$ 32,193,009$ 43,681,509$ 43,360,539$
(A) The District implemented the provisions of GASB Statement 63 in fiscal year 2013, which replaced the term "net assets" with the term "net position".
(B) Unrestricted net position was restated due to implementation of GASB No. 68 and No. 71.
Menlo Park Fire Protection DistrictNet Position by Component
Last Ten Fiscal Years(Accrual Basis of Accounting)
$0
$10,000
$20,000
$30,000
$40,000
$50,000
$60,000
$70,000T
hou
san
ds
Net Investment in Capital Assets Restricted Unrestricted
94

2007 2008 2009 2010 2011 2012 2013 (A) 2014 2015 2016
Expenses
Governmental Activities:
Public Safety 20,539,218$ 24,624,356$ 26,062,237$ 35,057,044$ 25,329,356$ 25,229,433$ 26,883,046$ 26,149,042$ 29,885,087$ 45,233,094$
Interest on long-term debt 773,090 719,276 764,835 889,008 889,008 769,867 767,527 761,585 979,592 771,255
Total Governmental Activities Expenses 21,312,308 25,343,632 26,827,072 35,946,052 26,218,364 25,999,300 27,650,573 26,910,627 30,864,679 46,004,349
Program Revenues
Charges for Services:
Public Safety 267,188 262,862 898,000 751,026 906,383 904,300 1,114,934 1,858,611 1,701,160 1,843,494
Operating Grants and Contributions:
Public Safety 1,104,766 1,161,274 2,691,651 1,304,364 1,292,507 872,243 1,423,594 1,896,239 1,291,789 1,462,055
Total Government Activities Program Revenues 1,371,954 1,424,136 3,589,651 2,055,390 2,198,890 1,776,543 2,538,528 3,754,850 2,992,949 3,305,549
General Revenues and Other Changes in Net Assets
Governmental Activities:
Taxes Levied for General Purposes 21,843,503 26,016,797 28,871,188 29,935,412 29,412,338 30,808,906 32,500,796 35,203,720 37,954,413 41,308,495
Investment Earnings 867,048 814,859 440,308 214,790 161,423 138,564 129,950 124,890 150,180 205,107
Premiums Received on Issuance of Long Term Deb - - - 225,165 225,165 0 - - - -
Miscellaneous 3,386,025 1,667,071 172,375 224,449 597,859 506,412 3,250,771 1,689,162 1,255,637 864,228
Special Item:
Gain (loss) on Sale of Assets (17,436) (18,963) 0 - - - - - - -
Total General Revenues and Other Assets 26,079,140 28,479,764 29,483,871 30,599,816 30,396,785 31,453,882 35,881,517 37,017,772 39,360,230 42,377,830
Change in Net Position 6,138,786$ $4,560,268 $6,246,450 ($3,290,846) $6,377,311 $7,231,125 $10,769,472 $13,861,995 $11,488,500 ($320,970)
(A) The District implemented the provisions of GASB Statement 63 in fiscal year 2013, which replaced the term "net assets" with the term "net position".
Menlo Park Fire Protection DistrictChanges in Net PositionLast Ten Fiscal Years
(Accrual Basis of Accounting)
95

2007 2008 2009 2010 2011 (b)
General FundReserved -$ -$ 1,592,699$ 1,174,398$ 50,547$ Unreserved - 26,697,028 28,194,244 30,733,635 -
Total General Fund 25,050,884$ 26,697,028$ 29,786,943$ 31,908,033$ 7,809,136$ , ,All Other Governmental Funds 18,271,937
Unreserved, reported in: 37,965,984 Special revenue funds 8,985$ (104,717)$ -$ -$ Capital projects fund - - 2,893,400 2,564,152 Debt service fund - - 15,226 3,104,716 2,873,309
Total all other governmental funds 8,985$ (104,717)$ 2,908,626$ 5,668,868$ 932,373$ $ , ,
2012 2013 2014 2015 2016
General FundNonspendable 2,505$ 7,074$ 52,256$ 616,581$ 921,302$ Restricted - - - 277,608 456,066 Committed 20,505,679 23,198,591 25,763,023 26,152,356 26,152,356 Assigned 14,734,978 19,358,110 18,793,736 10,988,306 13,744,266 Unassigned 1,464,701 207,006 722,896 558,244 198,194
Total General Fund 36,707,863$ 42,770,781$ 45,331,911$ 38,593,095$ 41,472,184$
All Other Governmental FundsRestricted 2,209,876$ 1,084,916$ 1,093,440$ 1,113,255$ 1,097,412$ Committed 8,520,017 13,487,748 20,257,435 23,134,271 29,603,045Unassigned - - - - 9,692
Total all other governmental funds 10,729,893$ 14,572,664$ 21,350,875$ 24,247,526$ 30,710,149$
(a)
(b) The District implemented the provisions of GASB 54 in fiscal year 2011. Fund balance is presented in accordance with those requirements beginning in that year.
The change in total fund balance for the General Fund and other governmental funds is explained in Management's Discussion and Analysis.
(Modified Accrual Basis of Accounting)
Menlo Park Fire Protection DistrictFund Balances of Governmental Funds
Last Ten Fiscal Years
FISCAL YEAR ENDED JUNE 30,
FISCAL YEAR ENDED JUNE 30,
$0
$10,000
$20,000
$30,000
$40,000
$50,000
$60,000
$70,000
$80,000
2007 2008 2009 2010 2011 2012 2013 2014 2015 2016
Thousands
Reserved Unreserved Nonspendable Restricted
Committed Assigned Unassigned
96

2007 2008 2009 2010 2011 2012 2013 2014 2015 2016
Revenues
Property taxes - current secured and unsecured $21,602,412 $26,732,155 $28,183,521 $29,702,116 $29,916,257 $30,846,354 $32,314,304 $34,934,265 $36,354,540 40,300,377$ Property taxes - prior secured and unsecured 60,477 14,787 751,067 54,854 67,007 128,336 15,108 (49,102) - - Redevelopment projects in Menlo Park 0 696,281 714,950 663,874 647,452 519,713 506,686 624,429 705,356 612,259Interest 867,048 211,912 440,308 214,790 161,423 138,564 129,950 124,890 150,180 205,107Homeowner's property tax relief 180,614 (1,638,338) 178,634 182,416 186,271 184,445 186,499 186,346 185,592 121,608Licenses and permits 568,029 611,933 777,388 560,934 719,171 719,140 917,906 1,147,754 1,102,357 1,276,787Charges and services - JPA ambulance service 143,024 870,252 120,612 190,092 187,212 185,160 197,028 193,154 189,432 185,268Rents 124,164 125,892 124,745 134,052 130,847 99,033 127,857 138,589 155,177 77,533Redevelopment projects in East Palo Alto 1,125,421 136,970 757,873 600,228 570,155 575,493 667,756 679,407 708,925 274,251Grant revenues 1,104,766 1,161,274 2,660,639 1,320,431 1,067,153 734,736 1,303,938 1,773,615 1,701,160 1,843,494Intergovernmental - - - - - - 2,639,992 1,013,945 209,997 210,448ERAF rebate 1,248,486 814,859 (1,714,857) (1,268,076) (1,449,036) (1,445,435) (1,189,557) (1,171,625) - - Other revenue 444,089 214,786 47,630 95,892 354,633 386,379 482,922 536,628 890,463 576,247
Total Revenues 27,468,530 29,952,763 33,042,510 32,451,603 32,558,545 33,071,918 38,300,389 40,132,295 42,353,179 45,683,379
Expenditures
Salary and benefits 17,481,803 19,758,720 20,335,776 30,338,934 20,510,293 20,057,751 19,883,737 19,917,186 35,586,863 24,944,987Services and supplies 2,854,288 4,956,810 3,901,953 5,397,241 4,660,425 4,847,594 5,918,898 7,964,629 5,366,421 5,785,931Capital outlay 1,280,236 4,513,880 2,521,173 3,638,265 429,582 1,751,616 1,589,538 1,909,554 4,340,850 4,591,325Debt service:
Principal repayment - 13,345 28,741 31,084 1,884,835 - 235,000 240,000 245,000 255,000Interest and fiscal charges - 89,481 151,609 379,912 929,945 769,867 767,527 761,585 757,210 765,489
Total Expenditures 21,616,327 29,332,236 26,939,252 39,785,436 28,415,080 27,426,828 28,394,700 30,792,954 46,296,344 36,342,732Excess (deficiency) of revenues over
(under) expenditures 5,852,203 620,527 6,103,258 (7,333,833) 4,143,465 5,645,090 9,905,689 9,339,341 (3,943,165) 9,340,647
Other Financing Sources (Uses)
Proceeds from sales of property - - - - - - - - 101,000 1,065 Other financing sources - 1,958,005 - 11,990,000 112,379 21,000 - - - - Other financing uses - - - 225,165 (61,079) - - - - - Transfers in 4,685,695 7,442,500 11,832,472 4,274,200 1,003,196 8,968,200 3,575,300 8,285,456 6,623,700 10,989,644Transfers (out) (4,685,695) (7,442,500) (11,832,472) (4,274,200) (1,003,196) (8,968,200) (3,575,300) (8,285,456) (6,623,700) (10,989,644)
Total Other Financing Sources (Uses) - 1,958,005 - 12,215,165 51,300 21,000 - - 101,000 1,065
Net Change in Fund Balances $5,852,203 $2,578,532 $6,103,258 $4,881,332 $4,194,765 $5,666,090 $9,905,689 $9,339,341 ($3,842,165) $9,341,712
Debt service as a percentage ofnoncapital expenditures N/A .41% .74% 1.13% 10.05% 2.60% 3.7% 3.5% 2.4% 3.3%
Menlo Park Fire Protection DistrictChanges in Fund Balances of Governmental Funds
Last Ten Fiscal Years(Modified Accrual Basis of Accounting)
97

Fiscal Secured SBE Unsecured Percent Total Assessed Total DirectYear Property Nonunitary Property Change Value (a) Tax Rate (b)
2007 $17,105,590,407 $1,398,302 $586,053,680 9.49% $17,693,042,389 1%2008 18,650,827,884 1,764,612 767,657,595 9.76% 19,420,250,091 1%2009 20,113,643,461 1,749,366 796,105,392 7.68% 20,911,498,219 1%2010 20,722,802,857 1,642,644 775,766,123 0.16% 21,500,211,624 1%2011 20,728,676,930 1,642,644 803,762,383 0.16% 21,534,081,957 1%2012 20,921,926,083 988,815 767,084,182 0.72% 21,689,999,080 1%2013 21,946,534,043 988,815 850,536,564 5.11% 22,798,059,422 1%2014 23,641,313,362 869,020 826,556,204 7.33% 24,468,738,586 1%2015 25,158,692,499 869,020 833,420,014 6.23% 25,992,981,533 1%2016 27,600,304,486 1,326,395 952,356,222 9.85% 28,553,987,103 1%
(a) The State Constitution requires property to be assessed at one hundred percent of the most recent purchase price, plusan increment of no more than two percent annually, plus any local over-rides. These values are considered to be full market values.
(b) California cities do not set their own direct tax rate. The state constitution establishes the rate at 1% and allocatesa portion of that amount, by an annual calculation to all the taxing entities within a tax rate area. The Menlo ParkFire Protection District encompasses more than 235 tax rate areas.
Source: San Mateo County Assessor
Menlo Park Fire Protection DistrictAssessed Value and Estimated Actual Value of Taxable Property
Last Ten Fiscal Years
$0$2,500$5,000$7,500
$10,000$12,500$15,000$17,500$20,000$22,500$25,000$27,500$30,000$32,500$35,000
2007 2008 2009 2010 2011 2012 2013 2014 2015 2016
Millions
Unsecured Secured
98

BasicCounty Local
Fiscal Wide SpecialYear Levy District Schools Cities Total
2007 $1.0000 $0.0030 $0.0679 $0.0046 $1.07552008 1.0000 0.0039 0.0633 0.0044 1.07162009 1.0000 0.0141 0.1323 0.2052 1.35162010 1.0000 0.1601 0.3284 0.2409 1.72942011 1.0000 0.1601 0.3640 0.1222 1.64632012 1.0000 0.1601 0.3973 0.1222 1.67962013 1.0000 0.1601 0.1996 0.0156 1.37532014 1.0000 0.0170 0.1903 0.1601 1.36742015 1.0000 0.0140 0.2320 0.1601 1.40612016 1.0000 0.0102 0.1948 0.1601 1.3651
Source: San Mateo County Assessor
Menlo Park Fire Protection DistrictDirect and Overlapping Property Tax Rates
Last Ten Fiscal Years
$0.0
$0.2
$0.4
$0.6
$0.8
$1.0
$1.2
20072008
20092010
20112012
20132014
20152016
Per
Hun
dred
$
Cities Schools Local Special District Basic County Wide Levy
99

Principal Property TaxpayersCurrent Fiscal Year and Nine Years Ago
2015-2016
Percentage Percentage
of Total City of Total City
Taxable Taxable Taxable Taxable
Assessed Assessed Assessed Assessed
ASSESSEE NAME Value Value Value Value
Wells Reit II University Circle $333,161,508 1.17% $293,000,000 1.66%
Quadrus Sand Hill LLC 235,077,713 0.83%
BRE FMCA LLC 173,539,263 0.61%
Stanford Research Institute 164,613,404 0.58% 138,380,771 0.79%
EQR Woodland Park 159,788,973 0.56%
Sand Hill Commons Reit Inc. 149,524,704 0.53% 37,164,242 0.21%
Giant Properties LLC 135,042,133 0.47%
Kilroy Realty LP 134,258,348 0.47%
Facebook Inc. 132,540,758 0.47%
Menlo Prehc I LLC 130,500,528 0.46%
Sun Microsystems Inc 0.00% 331,310,844 1.88%
Tyco Electronics Corp 0.00% 265,780,727 1.51%
Menlo Oaks Partners L P 0.00% 80,245,834 0.46%
Menlo Business Park Llc 0.00% 66,385,500 0.38%
Henry J Kaiser Family Found 0.00% 63,253,187 0.36%
Amb Property L P 0.00% 61,411,902 0.35%
Ld Riviera Llc 0.00% 54,538,417 0.31%
Alza Corp 0.00% 41,144,873 0.23%
Hd Devel Of Maryland Inc 0.00% 34,858,941 0.20%
Exponent Realty Llc 0.00% 32,793,082 0.19%
Total - Principal taxpayers $1,748,047,332 6.14% $1,500,268,320 8.52%
Total - All real properties assessed
by the County (1): $28,477,157,719 $17,608,574,756
(1) Assessed value includes only net secured real properties
Source: San Mateo County Assessor
2006-2007
Menlo Park Fire Protection District
100

212212213
Total
District Property Tax Percent Subsequent
Fiscal Property Tax Levied and of Levy Year
Year Levied Collected Collected Collection
2007 24,773,178 21,564,349 87% 0
2008 27,126,724 23,601,908 87% 0
2009 29,251,403 25,397,976 87% 0
2010 30,387,813 26,571,508 87% 0
2011 30,530,950 26,763,091 88% 02012 30,940,694 27,505,511 89% 02013 32,095,412 28,636,735 89% 02014 34,554,691 29,957,491 87% 02015 36,713,323 31,884,886 87% 02016 40,214,051 34,954,388 87% 0
Source: San Mateo County Property Tax Levy Letter
Menlo Park Fire Protection DistrictProperty Tax Levies and Collections
Last Ten Fiscal Years
$10,000,000
$12,000,000
$14,000,000
$16,000,000
$18,000,000
$20,000,000
$22,000,000
$24,000,000
$26,000,000
$28,000,000
$30,000,000
$32,000,000
2007 2008 2009 2010 2011 2012 2013 2014 2015 2016
Total Property Tax Levied and Collected District Property Tax Levied
101

Total TotalFiscal Mortgage Certificate of Governmental Primary Per Percent of Year Loan Participation Activities Government Capita Population Personal Income
2009 1,915,919 1,915,919 1,915,919 14.00 94,647 Not Available2010 1,884,835 $11,990,000 13,874,835 13,874,835 145.01 95,679 Not Available2011 11,990,000 11,990,000 11,990,000 136.37 87,921 Not Available2012 11,990,000 11,990,000 11,990,000 135.34 88,591 Not Available2013 11,755,000 11,755,000 11,755,000 131.56 89,254 Not Available2014 11,515,000 11,515,000 11,515,000 127.95 89,997 Not Available2015 11,270,000 11,270,000 11,270,000 124.01 90,883 Not Available2016 11,015,000 11,015,000 11,015,000 124.14 88,733 Not Available
Notes: Menlo Park Fire Protection District did not have any outstanding debt prior to FY 2008
Governmental Activities
Menlo Park Fire Protection DistrictRatio of Outstanding Debt by Type
Last Eight Fiscal Years
102

Personal IncomePopulation Total (thousands
Fiscal City of City of City of Population of dollars)Year Atherton East Palo Alto Menlo Park Unincorporated (1) (2)
2007 7,391 32,489 31,017 21,759 92,656 Not Available
2008 7,475 32,897 31,490 21,948 93,810 Not Available
2009 7,468 33,174 31,865 22,140 94,647 Not Available
2010 7,554 33,524 32,185 22,416 95,679 Not Available
2011 6,917 28,366 32,069 20,569 87,921 Not Available
2012 6,888 28,467 32,266 20,898 88,591 Not Available
2013 6,893 28,675 32,485 21,201 89,254 Not Available
2014 6,917 28,934 32,754 21,392 89,997 Not Available
2015 6,935 29,137 33,273 21,538 90,883 Not Available
2016 6,914 28,155 32,026 21,638 88,733 Not Available
County
Per Capita Public School Unemployment
Fiscal Personal Income Median Age Enrollment Rate
Year (3) (4) (5) (6)
2007 Not Available 39.7 9,854 3.9%
2008 Not Available Not Available 10,346 4.7%
2009 Not Available 40.1 Not Available 8.3%
2010 Not Available Not Available Not Available 9.8%
2011 Not Available 39 Not Available 13.0%
2012* Not Available Not Available Not Available 7.0%
2013 Not Available 39 Not Available 5.4%
2014 Not Available 39.0 Not Available 4.3%
2015 Not Available Not Available Not Available 3.2%
2016 Not Available Not Available Not Available 3.1%
(1) California State Dept. of Finance - Population Research Unit (January 2007)(2) California State Dept. of Finance - Estimate equals county per capita average times population(3) U.S. Department of Commerce - Bureau of Economic Analysis(4) Association of Bay Area Census (California)(5) Menlo Park City School District, Las Lomitas Elementary, and Menlo Atherton High School
(Sequoia Union High School District)(6) County of San Mateo Profile
* 2012 data source: Employment Development Department
Menlo Park Fire Protection DistrictDemographic and Economic Statistics
Last Ten Fiscal Years
103

Current Fiscal Year and Ten Years Ago
2015-2016 2006-2007
Firm Name RankTotal
Employees
Percentage of Total City's Labor Force
Total Employees
Percentage of Total City's Labor Force
Facebook, Inc * 1 6,068 31% n/a n/aSRI International 2 1,373 7% 1,185 8%TE Corporation 3 598 3% 1,040 7%SHR Hotel LLC 4 457 2% n/a n/aE*Trade Financial Corporation 5 432 2% n/a n/aUnited Parcel Service 6 388 2% 270 2%Pacific Biosciences of California 9 293 2% n/a n/aIntuit Inc 7 275 1% n/a n/aSafeway Stores, Inc. 8 245 1% 232 2%City of Menlo Park 10 237 1% n/a n/a
Top 10 Employers 10,366 54% 2,727 18%
19,300 100% 15,429 100%
Note:1) The Principal Employers list for the City of East Palo Alto is not reported since the City does not record or
report employer size information.2) The Town of Atherton is mostly residential.
Source:*City of Menlo Park, Finance, Business Licenses**State of California, Employment Development Department, Labor Force Report, June 2004,2013
Total Employment of the City's Labor Force **
Menlo Park Fire Protection DistrictPrincipal Employers
June 30, 2016
104

2006-07 2007-08 2008-09 2009-10 2010-11 2011-12 2012-13 2013-14 2014-15 2015-16
Fire District 107.20 107.20 110.30 110.30 110.80 112.05 112.60 112.85 115.50 111.00
Total 107.20 107.20 110.30 110.30 110.80 112.05 112.60 112.85 115.50 111.00
Function/Program
Menlo Park Fire Protection DistrictFull-Time-Equivalent Employees
Last Ten Fiscal Years
105

Function/Program 2006-07 2007-08 2008-09 2009-10 2010-11 2011-12 2012-13 2013-14 2014-15 2015-16
Fire Prevention
Fire Safety Inspections (Construction/Code Compliance) 3,579 3,523 2,917 3,041 3,483 3,365 3,687 5,595 3,319 3,622
Fire Investigations 56 37 31 69 55 61 46 33 34 41
Weed Abatement Inspections 150 230 260 48 406 491 268 33 155 170
Public Education and Training (Number of Events) 247 299 132 439 430 381 389 376 402 282
Plan Review and Permits 1,211 1,516 1,408 1,151 1,262 1,287 1,629 1,703 1,539 2,011
Source: Menlo Park Fire Protection District, Finance Department
Fiscal Year
Menlo Park Fire Protection DistrictOperating IndicatorsLast Ten Fiscal Years
106

2006-07 2007-08 2008-09 2009-10 2010-11 2011-12 2012-13 2013-14 2014-15 2015-16
Buildings & LandNumber of Stations 7 7 7 7 7 7 7 7 7 7Number of Administration Buildings 0 1 1 1 1 1 1 1 1 1
VehiclesNumber of MPFPD Vehicles 21 24 26 28 19 24 26 25 26 22Number of US&R Vehicles 19 20 20 16 14 14 14 10 6 6
EquipmentNumber of Types of Engine Equipment:
Thermal Imagining Cameras 14 15 12 10 10 12 10 8 18 16Autopulse & Charger 7 7 7 7 4 0 0 0 0 0Lifepack - 12 Defibrillator 11 11 10 5 3 3 3 3 0 2Hurst Spreader 2 2 2 2 2 2 3 3 3 2High Pressure Air Bag Rescue Kit 1 1 1 0 0 0 0 0 0 0Aegis 8 Channel Safety Net Radio Bridge Un 1 1 1 1 0 0 0 0 0 0Hurst Cutter 1 1 1 2 2 2 2Hurst Power unit 1 1 1 2 2 2 2Lucas Device 1 8 8 8 9 2Amkus Rope Resuce System 1 1 1 1Combi Tool 1 1SCBA Gear 62 62
Number of Types of Station Equipment:Zetron 7 7 7 7 7 7 7 7 7 0Servers 5 8 7 10 9 9 10 10 13 14Laminated Front Desk w/ counter & lock dra 3 4 4 4 4 4 4 4 4 4Bodymaster Weight Station & Trainer 8 8 8 8 8 8 0 0 0 0HP 960 Mounted Tape Drive 1 1 1 1 0 0 0 0 0 0BullEx Intelligent Training System 1 1 1 1 0 0 0 0 0 0Generators 2 2 2 2 2 2 2 2 2 2Software/Applications 3 3 3 4 4 4 2 0 1 2Generic Stationary Generator 2 2 2 2 2 2 2 2 2 2HP300 18HP Port Pump 1 1 1 1 1 1 1 1 1 1Hoses 5 5 2 2 2 2 2 2 2 0Positive Check 1 1 1 1 1 1 0Turnout Washer 1 1 1 1 1 0Scanner 1 1 1 1 1 0
David Clark Radio System 2 2 2Simulation Training Manikin 1 0 1 1Emergency Alerting System 6 7SCBA Compressor 1 1SCBA Air Fill Station 1 1Radio Repeater 1 1Quantifit Respirator Testing System 1
Number of Assets at the Mechanic Shop & Rescue Site:Lifts 0 4 4 4 4 4 4 4 8 4Snap On Modis 0 1 1 1 1 1 1 1 0 0Live Fire Prop 0 1 1 2 2 2 2 0 0 1Warning Siren 1 1 1 1 1 1 1Water Recycle Unit 1 1Traffic Pre-Emption System 1 1Hurst Spreader 1
Number of US&R & Equipment:Search Cam 2000 1 1 1 0 0 0 0 0 0 0Chevy Crew Cab 2 2 2 2 2 2 2 2 0 0Air Bag Rescue Kit 1 1 1 0 1 0 0 0 0 0Portable Air Compressor 2 2 2 2 0 0 0 0 0 0HVAC System 1 1 1 1 1 1 1 1 1 0Satellite Phone 0 2 2 2 2 2 6 4 4 4Printer 1 0 0 0 0 0 0 0 0 0Water Heater 2 2 3 6 4 4 4Home Security 1 1 1 1 0 0 0Copier 1 1 1 1 0 0 0Area Rae Hazmat Equipment 3 3 3 1 1 0McKesson I-STAT 1 1 1 1 1 1Viasat Portable Internt Device 1 1 1Hazmat Detectors 2 2 2 2Hasty Search Communication Kits 2 2 2 2Resuce Cages 2 2 2 2RDK Ruggedized Host Controller 1 1 1 1Nano Raider ZH Isotope Detection Monitor 1 1 1 1Multi Rae Pro 1 1Mobile Radio 1 1Portable Radio 10 10Defibrillators 2 2Autovent 4000 Venilator 2 2Quantifit Respirator Testing System 1
Note: Certain data required by GASB 44 was not available prior to 2006/07
Source: Menlo Park Fire Protection District, Finance Department
Function/Program
Menlo Park Fire Protection DistrictCapital Asset Statistics by Function/Program
Last Ten Fiscal Years
107