mendon-upton regional school district operating budget fiscal year 2010
TRANSCRIPT

Mendon-Upton Regional School District
Operating BudgetFiscal Year 2010
Dec. 7, 2009Mendon Upton Regional
School District 2
Agenda Impact of Chapter 70 Funding Changes on
Budget FY10 Budget Overview Recent Reimbursement Reductions /
Consequences Cost Control Measures District Comparisons Help Needed / Call to Action Questions / Answers

Dec. 7, 2009Mendon Upton Regional
School District 3
MURSD’s FY10 Foundation Budget
Foundation budget is used to calculate:
Amount of aid provided by state Minimum required funding amounts for
Upton and Mendon
- Average state aid : $9659/pupil- State aid to MURSD: $8559/pupil

Dec. 7, 2009Mendon Upton Regional
School District 4Mendon Upton Regional
School District 4
MA General Law Chapter 70School Funds and State Aid for Public Schools
Transition to target local share means the state will reduce its share of aid each year and require greater local contributions.
Historically Mendon and Upton have contributed a low target local share (~40-45%), with the state providing a higher aid share (~55-60%).
Within a few years Mendon’s target: ~59.4%; Upton’s target: ~58.5%
Transition factors are used so that the shift to target will occur gradually over many years.
For FY10 the state contributed~55% vs. ~57% in ’09 (of the foundation amount, not the total budget needs).

Dec. 7, 2009Mendon Upton Regional
School District 5Mendon Upton Regional
School District 5
Implications of Chapter 70 Formula: Structural Deficit for MURSD
MURSD’s foundation budget is ~$1100 less per pupil than the state average.
The State is gradually decreasing the amount of aid it provides our District, and local town contributions will slowly increase until target levels (~59%) are reached.
Local revenues remain constrained by Proposition 2½ legislation and limited new growth.
Expenses are rising faster than revenues; future budgets will continue to be constrained.
Dec. 7, 2009Mendon Upton Regional
School District 6Mendon Upton Regional
School District 6
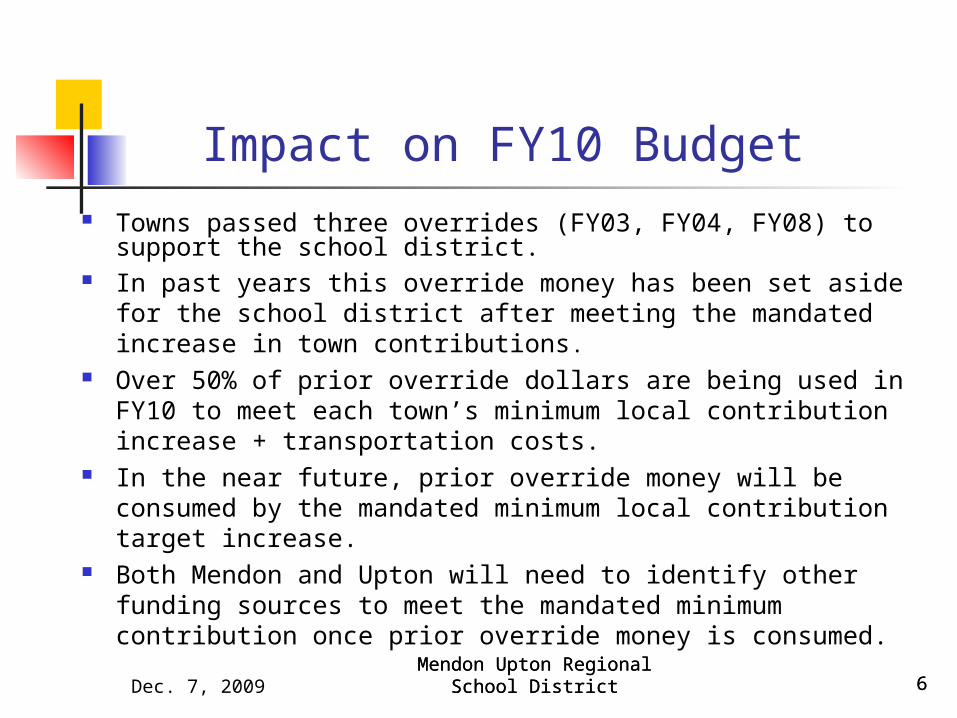
Impact on FY10 Budget Towns passed three overrides (FY03, FY04, FY08) to support
the school district. In past years this override money has been set aside for the
school district after meeting the mandated increase in town contributions.
Over 50% of prior override dollars are being used in FY10 to meet each town’s minimum local contribution increase + transportation costs.
In the near future, prior override money will be consumed by the mandated minimum local contribution target increase.
Both Mendon and Upton will need to identify other funding sources to meet the mandated minimum contribution once prior override money is consumed.

Dec. 7, 2009Mendon Upton Regional
School District 7Mendon Upton Regional
School District 7
FY10 MURSD Budget Timeline
Budget was certified in March – 45 days prior to first annual town meeting in either town
Each town’s funding amount was approved in early May at the annual town meetings
State budget wasn’t finalized until late June Reductions in state aid were realized after
budget was certified. IMPACT: additional cuts were needed No longer have sufficient E&D account (free
cash) to make up for these reductions

Dec. 7, 2009Mendon Upton Regional
School District 8Mendon Upton Regional
School District 8
FY10 Level Service Budget Drivers
Special Education $805,201 Personnel $757,529 Health Insurance $200,000 Transportation $ 48,600 Worcester County Retirement $ 39,164
If we maintained all services from FY09 into FY10, the budget increase would be: ~$1.94 million
Dec. 7, 2009Mendon Upton Regional
School District 9Mendon Upton Regional
School District 9
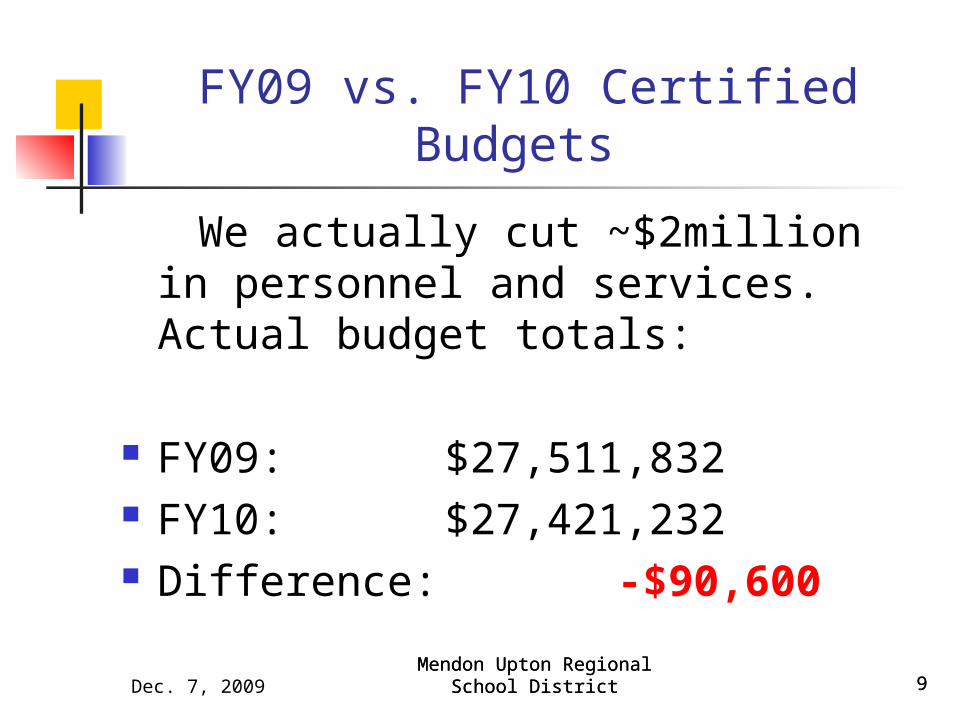
FY09 vs. FY10 Certified Budgets
We actually cut ~$2million in personnel and services. Actual budget totals:
FY09: $27,511,832 FY10: $27,421,232 Difference: -$90,600
Dec. 7, 2009Mendon Upton Regional
School District 10
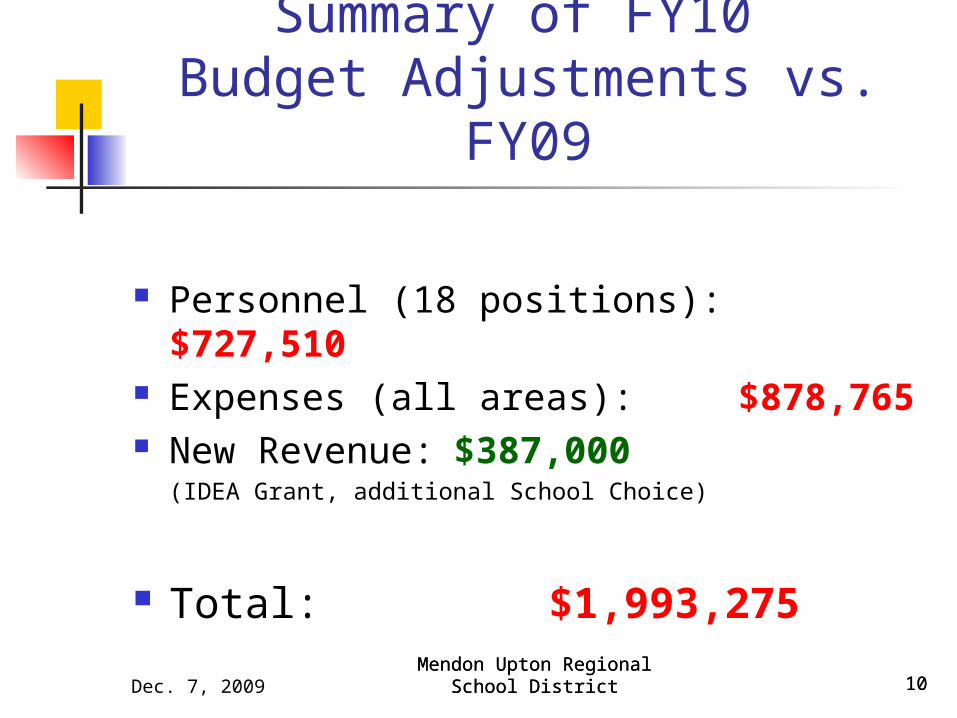
Summary of FY10 Budget Adjustments vs. FY09
Personnel (18 positions): $727,510 Expenses (all areas): $878,765 New Revenue: $387,000
(IDEA Grant, additional School Choice)
Total: $1,993,275
Mendon Upton Regional School District 10

Dec. 7, 2009Mendon Upton Regional
School District 11Mendon Upton Regional
School District 11
Other Aid Reductions that Occurred After Certifying the FY10 Budget
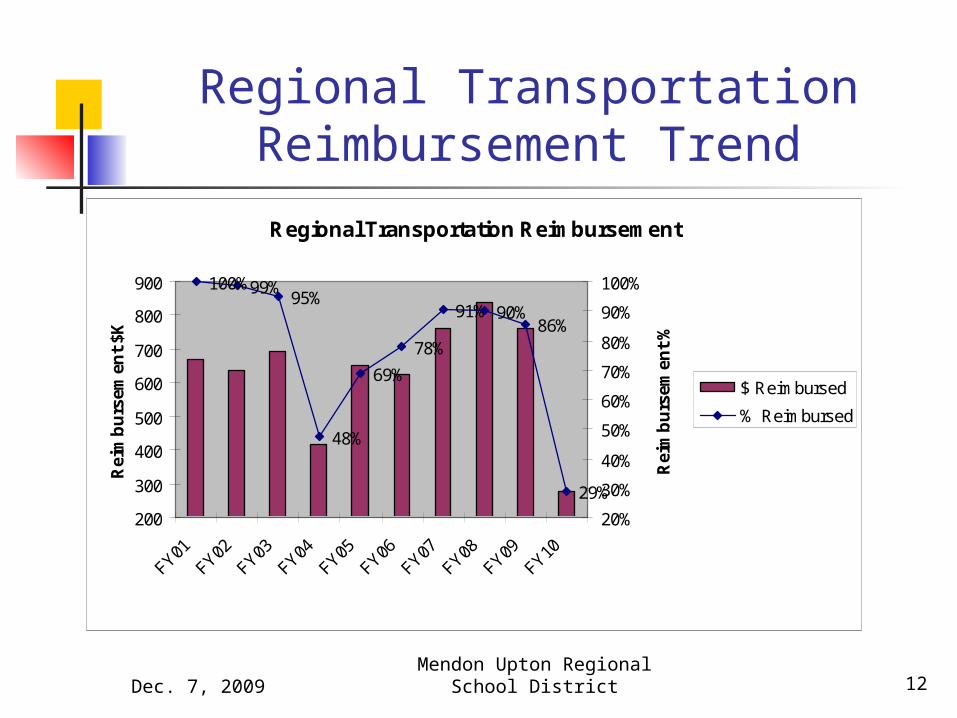
Regional transportation reimbursement funds from the state continue to be reduced: - FY10 reimbursement is $278,090 vs. $762,235 in FY09
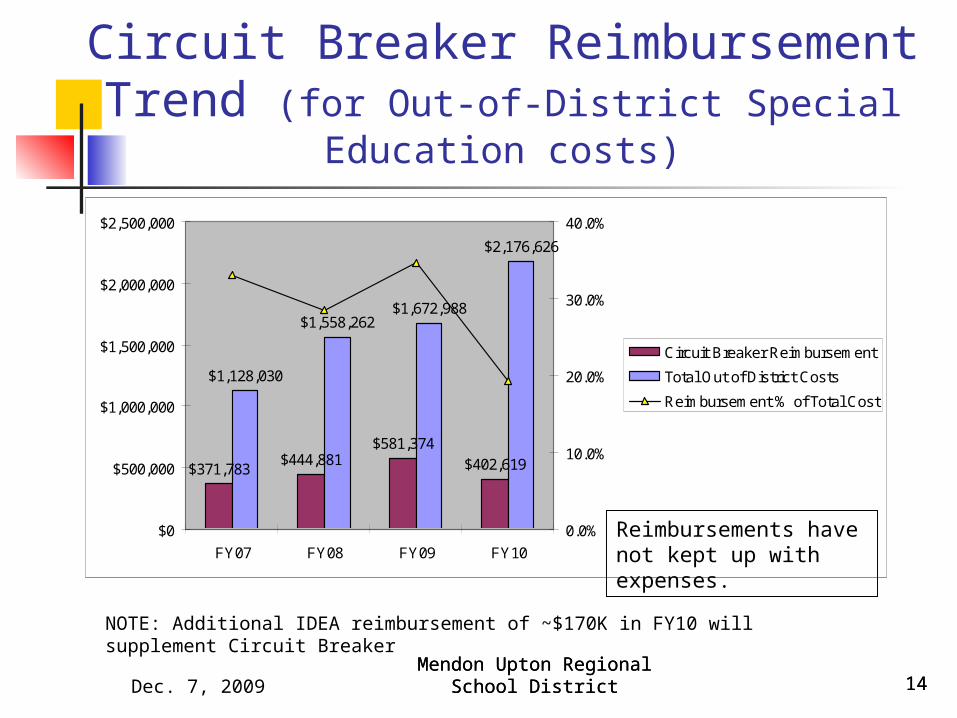
Special Education costs continue to rise, while state and federal reimbursement rates decline- FY10 reimbursement is ~$403K vs. ~$581K in FY09
Dec. 7, 2009Mendon Upton Regional
School District 12
Regional Transportation Reimbursement Trend
Regional Transportation Reimbursement
100%99%95%
48%
69%
78%
91% 90%86%
29%
200
300
400
500
600
700
800
900
FY01FY02
FY03FY04
FY05FY06
FY07FY08
FY09FY10
Rei
mb
urs
emen
t $K
20%
30%
40%
50%
60%
70%
80%
90%
100%
Rei
mb
urs
emen
t %
$ Reimbursed
% Reimbursed

Dec. 7, 2009Mendon Upton Regional
School District 13
Special Education Budget TrendsPersonnel & Non-Personnel
Expenses
FY07 FY08 FY09Salaries $2,805,765 $3,298,638 $3,467,687
Out of District Tuition $787,353 $790,450 $1,250,000
Non-Salary Expenses $1,221,955 $1,117,256 $1,322,327(i.e. district programs, transportation, supplies, consultants)
TOTAL Budgeted $4,815,073 $5,206,344 $6,040,014
Each year’s actual SPED costs exceeded the budget:FY10 budget is $6.53M (~24% of total budget), with
unanticipated increases already driving this number up
Dec. 7, 2009Mendon Upton Regional
School District 14Mendon Upton Regional
School District 14
Circuit Breaker Reimbursement Trend (for Out-of-District Special Education
costs)
NOTE: Additional IDEA reimbursement of ~$170K in FY10 will supplement Circuit Breaker
$371,783$444,881
$581,374$402,619
$1,128,030
$1,558,262$1,672,988
$2,176,626
$0
$500,000
$1,000,000
$1,500,000
$2,000,000
$2,500,000
FY07 FY08 FY09 FY10
0.0%
10.0%
20.0%
30.0%
40.0%
Circuit Breaker Reimbursement
Total Out of District Costs
Reimbursement % of Total Cost
Reimbursements have not kept up with expenses.

Dec. 7, 2009Mendon Upton Regional
School District 15
Most Recent Reimbursement Reductions Requiring Action
Regional Transportation: ($281,910) Circuit Breaker: ($147,381) Vision, SPED Tuition, Interest: ($217,000)
Total: ($646,291)

Dec. 7, 2009Mendon Upton Regional
School District 16
Consequences of Recent Reimbursement Reductions
Professional Development 2 Day Reduction: Teachers ($141,096) & Administration ($7530)
Additional Reductions: 6 Aides 1 Custodian (retirement) 1 Technology Teacher Many other line item budget adjustment
Revenue Offsets – School Choice, health care reduction, Medicaid, etc.

Dec. 7, 2009Mendon Upton Regional
School District 17Mendon Upton Regional
School District 17
District Cost Control Measures
Acquired a grant from National Grid to retrofit the schools with new lighting fixtures, motion sensors and to reduce energy costs.
Acquired a grant from ANP Bellingham Energy Co. to furnish and install electric hot water heaters at no cost to the District in 3 schools.
Negotiated greater health insurance cost sharing with employees.
Conducted transportation audit and investigating other cost sharing opportunities with other districts: sharing special education transportation services and personnel sharing with neighboring town (Hopedale). Looking to bring additional services in-house.
Increased our school choice population at Clough and Nipmuc.
Under a grant from MUEF, provided grant writing instruction to staff in order to bring additional funds to the District.

Dec. 7, 2009Mendon Upton Regional
School District 18Mendon Upton Regional
School District 18Mendon Upton Regional
School District 18
FY08 State Rankings (1=highest,
323=lowest) Per Pupil Expenditures: Overall – 284th ($10,007 vs. $12,496 state avg) Administration – 314th
Instructional Leadership – 293rd Classroom and Specialist Teachers – 247th Other Teaching Services – 292nd
Professional Development – 177th
Instructional Materials – 48th Guidance Counseling/Testing – 201st
Pupil Services – 201st
Operations/Maintenance – 218th Insurance/Retirement – 280th
Out-of District PPE’s – 120th
Staffing: Student to Instructional Personnel Ratio – 258th
Information source: MA DESE Website
Dec. 7, 2009Mendon Upton Regional
School District 19
Enrollment Increase
From 1999-2009, Massachusetts’ overall student enrollment dropped by 0.5%.
Of 330 districts reporting, MURSD ranked #1 in state in enrollment growth at 56.4%!
Increase in enrollment has driven a need for budget increases.Information source:http://www.doe.mass.edu/boe/docs/1009/item8_percentchng.xls
Dec. 7, 2009Mendon Upton Regional
School District 20Mendon Upton Regional
School District 20
Summary
In FY09, school district cut ~10 positions, half of them classroom teachers
For FY10 budget, another 18 positions were cut, including five classroom teachers
Most recent cuts: 8 positions, including one teacher
Budget will be much more challenging in FY11 Education costs are rising faster than what Prop
2½ can support; result = a structural deficit School Committee will continue to work with
town and state officials on future funding and cost reduction opportunities

Dec. 7, 2009Mendon Upton Regional
School District 21Mendon Upton Regional
School District 21
Help Needed
Restore regional transportation reimbursement to >80% level – where’s the incentive to regionalize?
Better control of out-of-district Special Education cost increases
Out-of-district costs can sometimes approach as much as $300K due to medical needs
Any perspective on additional 9C cuts during the remainder of FY10?
Any insight into Chapter 70 and/or stimulus funding to expect for FY11 budgeting purposes?
What happens if towns can’t meet state mandated minimum contribution?

Dec. 7, 2009Mendon Upton Regional
School District 22Mendon Upton Regional
School District 22
Thank You• Rep. John V. Fernandes• Senator Michael O. Moore • Senator Richard T. Moore• Rep. George N. Peterson, Jr
For advocating for the restoration of full transportation reimbursement and for your
efforts to develop a education resource study

Dec. 7, 2009Mendon Upton Regional
School District 23Mendon Upton Regional
School District 23
FY10 Certified BudgetPersonnel Reductions (18 positions)
Consolidation of SPED program (1) $ 56,000 Paraprofessionals (4) $ 95,000 Administrative Assistants (2) $
51,575 Custodians (2) $ 90,272 Food Service (2) $ 26,663 Financial Officer $108,000 HS Asst. Principal $ 70,000 SPED Aide $ 25,000 Professional Staff (4) $205,000
Personnel Total: $727,510

Dec. 7, 2009Mendon Upton Regional
School District 24Mendon Upton Regional
School District 24
FY10 Certified BudgetExpense Reductions
Retirement Offsets (6) $179,000 Utilities / Fuel Savings $150,000 General School Supplies $ 46,979 Maintenance Account $ 46,000 Athletics (supplies) $ 34,000 Department Supplies (Nipmuc) $ 31,469 Stipends (2) $ 8,536 Late Bus $ 3,600 Adjust Paraprofessional Hours $ 80,000 SPED Transportation Collaborative $ 75,000 Reduce Health Care co-pay line item $ 20,000 Health Care (lower anticipated increase) $ 90,000 SPED out-of-district reductions $ 96,000 Security $ 9,000 Attendance Services $ 11,000
Expenses Total: $878,765
Dec. 7, 2009Mendon Upton Regional
School District 25Mendon Upton Regional
School District 25
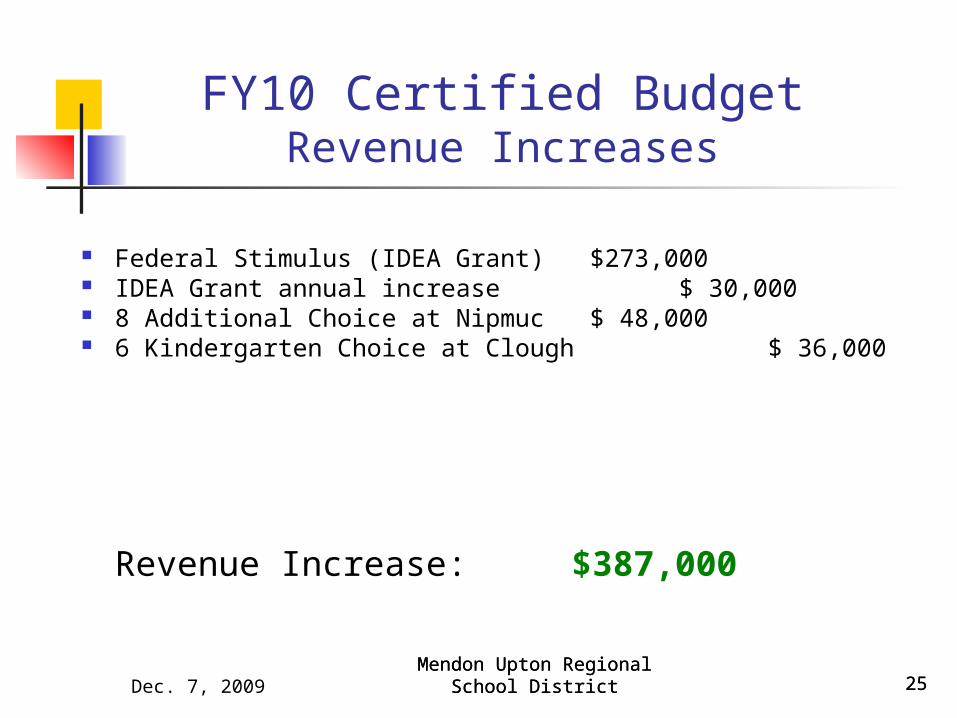
FY10 Certified BudgetRevenue Increases
Federal Stimulus (IDEA Grant) $273,000 IDEA Grant annual increase $ 30,000 8 Additional Choice at Nipmuc $ 48,000 6 Kindergarten Choice at Clough $ 36,000
Revenue Increase: $387,000

Dec. 7, 2009Mendon Upton Regional
School District 26
MURSD’s FY10 Foundation Budget
Return to Index
710 MENDON UPTON -------------------------------------- Base Foundation Components ----------------------------------------------------------- --- Incremental Costs Above The Base ------
(1) (2) (3) (4) (5) (6) (7) (8) (9) (10) (11) (12) (13) (14)
Pre- ------ Kindergarten ------ Jr High/ High ELL ELL ELL Voca- Special Ed Special Ed ---- Low Income ----
School Half-Day Full-Day Elementary Middle School PK K Half KF - 12 tional In District Out of Dist Elem Other TOTAL*
Foundation Enrollment 63 211 1 1,067 701 733 0 0 9 0 98 26 76 13 2,649
1 Administration 11,121 37,246 353 376,687 247,477 258,774 0 0 3,177 0 238,786 63,351 0 0 1,236,973
2 Instructional Leadership 20,085 67,269 638 680,343 446,973 467,377 0 0 5,739 0 0 0 0 0 1,688,425
3 Classroom and Specialist Teachers 92,097 308,452 2,924 3,119,569 1,803,567 2,773,374 0 0 39,629 0 787,936 0 199,912 25,834 9,153,293
4 Other Teaching Services 23,620 79,109 750 800,102 378,394 329,397 0 0 5,396 0 735,683 968 0 0 2,353,419
5 Professional Development 3,643 12,201 116 123,458 87,928 89,142 0 0 1,410 0 38,009 0 4,400 753 361,060
6 Instructional Equipment & Tech 12,841 43,008 408 434,995 285,784 478,121 0 0 3,669 0 31,962 0 0 0 1,290,787
7 Guidance and Psychological 6,701 22,443 213 226,992 198,521 260,212 0 0 2,549 0 0 0 0 0 717,630
8 Pupil Services 2,665 8,927 85 135,464 145,360 350,503 0 0 1,143 0 0 0 0 0 644,147
9 Operations and Maintenance 25,574 85,654 812 866,267 617,015 625,567 0 0 9,892 0 266,737 0 30,875 5,281 2,533,674
10 Employee Benefits/Fixed Charges 22,208 74,380 705 752,278 469,915 472,081 0 0 7,982 0 291,116 0 19,549 3,344 2,113,559
11 Special Ed Tuition 0 0 0 0 0 0 0 0 0 0 0 579,469 0 0 579,469
12 Total 220,557 738,689 7,002 7,516,156 4,680,935 6,104,547 0 0 80,585 0 2,390,228 643,788 254,737 35,212 22,672,436
13 Wage Adjustment Factor 103.8% Foundation Budget Per Pupil 8,559
* Total foundation enrollment does not include columns 11 through 14, because those columns represent increments above the base. The pupils are already counted in columns 1 to 10.
Total foundation enrollment assigns pupils in pre-kindergarten and half-time kindergarten an enrollment count of .5.
Special education in-district headcount is an assumed percentage, representing 3.75 percent of K to 12 non-vocational enrollment and 4.75 percent of vocational enrollment.
Special education out-of-district headcount is also an assumed percentage, representing 1 percent of non-vocational K-12 enrollment.
Low income headcounts are the number of pupils in columns 1 through 10 who are eligible for free or reduced lunch.
Each component of the foundation budget represents the enrollment on line 1 multiplied by the appropriate state-wide foundation allotment.
The wage adjustment factor is applied to underlying rates in all functions except instructional equipment, benefits and special education tuition.
Massachusetts Department of Elementary and Secondary Education
Office of School Finance
FY10 Chapter 70 Foundation Budget
State avg: $9659

Dec. 7, 2009Mendon Upton Regional
School District 27
Mendon’s Target Local Share
179 MENDON
Effort Goal FY10 Increments Toward Goal
1) 2008 equalized valuation 976,126,600 13) Required local contribution FY09 4,487,7842) Property percentage 0.2961% 14) Municipal revenue growth factor (DOR) 2.38%3) Local effort from property wealth 2,890,483 15) FY10 preliminary contribution (13 x 14) 4,594,593
16) Preliminary contribution pct of foundation (15/8) 42.83%4) 2006 income 232,343,0005) Income percentage 1.4977% If preliminary contribution is above the target share:6) Local effort from income 3,479,897 17) Excess local effort (15 - 10)
18) 15% reduction toward target (17 x 15%) 7) Combined effort yield (row 3+ row 6) 6,370,379 19) FY10 required local contribution (15 - 18)
20) Contribution as percentage of foundation (19 / 8) 8) Foundation budget FY10 10,728,0459) Maximum local contribution (82.5% * row 8) 8,850,637 If preliminary contribution is below the target share:
21) Shortfall from target local share (11 - 16) 16.55%10) Target local contribution (lesser of row 7 or row 9) 6,370,379 22) Added increment toward target (13 x 1% or 2%)* 89,756
*1% if shortfall is between 5% and 10%; 2% if shortfall > 10%
11) Target local share (row 10 as % of row 8) 59.38% 24) Shortfall from target after adding increment (10 - 15 - 22)1,686,030
12) Target aid share (100% minus row 11) 40.62% 25) 95% of FY08 actual contribution (reg'l allocation sheet, row 1 )4,882,507
26) Lesser of target or 95% of FY08 contribution (10 or 25) 4,882,507
27) Increment to reach target or 95% of FY08 (26 - 15 - 22) 198,158
See a listing of all 351 communities 28) FY10 required local contribution (15 + 22 + 27) 4,882,507
29) Contribution as percentage of foundation (28 / 8) 45.51%
Determination of City and Town Total Required Contribution FY10
Massachusetts Department of Elementary and Secondary Education
Target Local Share

Dec. 7, 2009Mendon Upton Regional
School District 28
Upton’s Target Local Share
303 UPTON
Effort Goal FY10 Increments Toward Goal
1) 2008 equalized valuation 1,194,158,900 13) Required local contribution FY09 5,383,8112) Property percentage 0.2961% 14) Municipal revenue growth factor (DOR) 3.36%3) Local effort from property wealth 3,536,115 15) FY10 preliminary contribution (13 x 14) 5,564,707
16) Preliminary contribution pct of foundation (15/8) 42.65%4) 2006 income 273,630,0005) Income percentage 1.4977% If preliminary contribution is above the target share:6) Local effort from income 4,098,269 17) Excess local effort (15 - 10)
18) 15% reduction toward target (17 x 15%) 7) Combined effort yield (row 3+ row 6) 7,634,384 19) FY10 required local contribution (15 - 18)
20) Contribution as percentage of foundation (19 / 8) 8) Foundation budget FY10 13,046,3279) Maximum local contribution (82.5% * row 8) 10,763,220 If preliminary contribution is below the target share:
21) Shortfall from target local share (11 - 16) 15.86%10) Target local contribution (lesser of row 7 or row 9) 7,634,384 22) Added increment toward target (13 x 1% or 2%)* 107,676
*1% if shortfall is between 5% and 10%; 2% if shortfall > 10%
11) Target local share (row 10 as % of row 8) 58.52% 24) Shortfall from target after adding increment (10 - 15 - 22)1,962,001
12) Target aid share (100% minus row 11) 41.48% 25) 95% of FY08 actual contribution (reg'l allocation sheet, row 1 )5,758,213
26) Lesser of target or 95% of FY08 contribution (10 or 25) 5,758,213
27) Increment to reach target or 95% of FY08 (26 - 15 - 22) 85,830
See a listing of all 351 communities 28) FY10 required local contribution (15 + 22 + 27) 5,758,213
29) Contribution as percentage of foundation (28 / 8) 44.14%
Determination of City and Town Total Required Contribution FY10
Massachusetts Department of Elementary and Secondary Education
Target Local Share

Dec. 7, 2009Mendon Upton Regional
School District 29Mendon Upton Regional
School District 29
Percentage of Total Budget From All Sources - FY10
Upton 24.60%
Mendon 20.60%
State Aid & Stimulus 47.72%
District 7.08%

Dec. 7, 2009Mendon Upton Regional
School District 30Mendon Upton Regional
School District 30Mendon Upton Regional
School District 30
Per Pupil Expendituresvs. comparable communities (FY08)
(based on income, population and student enrollment)
DEDHAM $13,893 ASHLAND $11,332
CANTON $11,324 HOLLISTON $11,217
GROTON DUNSTABLE $10,790 FOXBOROUGH $10,542 HANOVER $10,121 MENDON-UPTON $10,007MEDFIELD $9,957 NORTH READING $9,908MEDWAY $9,714
MA State Average: $12,496
Information source: MA DESE Website (comparable communities selected by DESE)

Dec. 7, 2009Mendon Upton Regional
School District 31Mendon Upton Regional
School District 31
Student to Instructional Personnel Ratio (not class size)MURSD ranked last of 10 comparable communities
Dedham13.0
Hanover13.0
Holliston 13.4
Foxborough 14.5 Ashland
14.9Medway
14.9 Medfield
15.1 Canton
15.4 Groton-Dunstable 16.0North Reading
16.4Mendon-Upton
19.0Information source: MA DESE Website (FY07 – most recent data available)

Dec. 7, 2009Mendon Upton Regional
School District 32
Budget Summary Mendon-Upton Regional Schools - FY09
Instruction47%
Other School Services
1% Special Education
22%
Fixed Charges14%Administration
2%
Transportation4%
Maintenance and Utilities
10%

Dec. 7, 2009Mendon Upton Regional
School District 33
Prioritized Capital Needs
1. Boilers – Miscoe Hill ($200,000) Boilers are over 20 years old; one was repaired last summer. We estimate that they are running at 50% efficiency. When the temperature reads zero degrees Fahrenheit or below the
boilers use 500 gallons of oil per day. Our request to replace the boilers isn’t to necessarily save on oil --- the
boilers are simply deteriorating.2. Water Supply – Miscoe Hill ($100,000)
The well is approximately 350 feet deep, and is located in the boiler room, making it difficult to access for repairs.
The yield of water is becoming less and less each year. The bottom of the well continues to build-up with rocks and other debris
from the veins, which is contributing to a reduced yield and longer time to recover. The water is generally brown and rusty.
A filter system was installed recently, and it needs to be cleaned regularly to allow the water to run into the school's storage tanks.
The gallon per day (GPD) demand is increasing due to a larger student population. When school is in session we use 2,000 gallons per day.
On a number of occasions over the past couple of years the school lost water.

Dec. 7, 2009Mendon Upton Regional
School District 34
Prioritized Capital Needs (cont.) 3. Hot Water Tanks – Nipmuc ($80,000)
The two tanks are 12 years old. The normal life expectancy is 10 yrs. They are corroding and the inner lining is breaking apart and going through
our water supply, causing the water to become discolored. They are not just storage tanks. They have their own fuel source to heat the
water. Each tank holds 600 gallons of water. We cannot replace the lining of the tanks. They are deteriorating. We would prefer electric nickel plated lining tanks equipped with a timer.
This system has a 20 year life expectancy. We’ve determined that with a newer system we would most likely not need
600 gallon tanks, thus reducing the estimated cost.4. Roof Repair – Miscoe ($250,000)
The roof at Miscoe leaks in a number of sections. A number of areas are very spongy or brittle and others where tar patches are separating from previous repair work.
The total square footage of the roof is approximately 143,000 square feet. We need to replace 100,000 square feet of the roof. We need to replace the white portion which is constructed from PVC. The total replacement would include a rubber roof with insulation applied
under the rubber coating.

Dec. 7, 2009Mendon Upton Regional
School District 35
Prioritized Capital Needs (cont.) 5. Back-up generator – Miscoe ($200,000)
Miscoe is the only school without a back-up generator system. This is a concern, given that this site is used as an emergency shelter by the town of Mendon. It is also a concern for the day to day operation should we lose power.
A generator is needed to operate the normal life support systems such as: water, refrigeration, essential lighting, heat and sewer discharge in the event that we lose power.
A 200 amp generator would be needed. Unsure at this time of any potential grant opportunities.
6. Energy Control System - Miscoe Hill ($400,000 estimate). Miscoe currently has an antiquated fifty year old system that is air
driven. It is in constant need of repair. The purpose of a control system is to regulate heat and circulate outdoor air throughout the school. The other schools have more modern computer driven control systems.
7. Energy Management System (HVAC - Nipmuc) ($100,000). This is a computer driven system (unlike Miscoe), and is not the entire
management system. It is currently working, but it is not as efficient as it should be and parts are being more difficult to replace due to its age.

Dec. 7, 2009Mendon Upton Regional
School District 36
Capital Needs Summary
Miscoe Hill School Sub Total = $1,150,000 Nipmuc School Sub Total = $ 180,000 TOTAL $1,330,000
MSBA Statement of Interest filed for Miscoe Hill renovations on Nov. 13, 2009.
Dec. 7, 2009Mendon Upton Regional
School District 37Mendon Upton Regional
School District 37
Thank you for your support forMendon-Upton Regional Schools!

Dec. 7, 2009Mendon Upton Regional
School District 38
710 MENDON UPTON
Aid Calculation FY10 Comparison to FY09
FY09 FY10 Change Pct ChgPrior Year Aid Enrollment 2,658 2,649 -9 -0.34%
1 Chapter 70 FY09 12,546,934 Foundation budget 21,996,366 22,672,457 676,091 3.07%Required district contribution 9,449,432 10,147,020 697,588 7.38%
FY10 Chapter 70 Aid Chapter 70 aid 11,227,445 12,295,995 1,068,550 9.52%2 FY10 Chapter 70 Aid after 2 pct reduction (1 x .98) 12,295,995 Required net school spending (NSS) 20,676,877 22,443,015 1,766,138 8.54%
SFSF Grant To Reach Foundation (Federal) SFSF Grant 1,319,489 229,442 -1,090,047 -82.61%
3 Foundation budget FY10 22,672,457 Chapter 70 plus stabilization aid 12,546,934 12,525,437 -21,497 -0.17%
4 Required district contribution FY10 10,147,020 target aid share 39.64% 41.09%
5 Grant to reach foundation (3 - 4 - 2 if >0) 229,442 C70 & SFSF as % of foundation 57.04% 55.25%
Required NSS plus SFSF 21,996,366 22,672,457 676,091 3.07%
Req NSS & SFSF % of foundation 100.00% 100.00%
Massachusetts Department of Elementary and Secondary EducationFY10 Chapter 70 Summary
-5,000,000
0
5,000,000
10,000,000
15,000,000
20,000,000
25,000,000
En
rollm
en
t
Fo
un
da
tion
bu
dg
et
Re
qu
ired
dis
tric
t co
ntr
ibu
tion
FY09 FY10 Change Pct Chg FY10
0
5,000,000
10,000,000
15,000,000
20,000,000
25,000,000
foundation budget required district contribution chapter 70 aid + SFSF
FY06 FY07 FY08 FY09 FY10

Dec. 7, 2009Mendon Upton Regional
School District 39
710 MENDON UPTON Required Required Actual Dollars Percent
Foundation Pct Foundation Pct Local Con- Chapter 70 Pct Net School Pct Net School Pct Over/Under Over/
Enrollment Chg Budget Chg tribution Aid Chg Spending (NSS) Chg Spending Chg Requirement Under
FY93 1,207 6,245,879 3,487,840 2,241,514 5,729,354 5,729,354 0 0.0
FY94 1,256 4.1 6,523,032 4.4 3,663,544 2,550,886 13.8 6,214,430 8.5 6,286,360 9.7 71,930 1.2
FY95 1,324 5.4 7,052,307 8.1 4,128,293 2,643,516 3.6 6,771,809 9.0 6,897,514 9.7 125,705 1.9
FY96 1,432 8.2 7,806,564 10.7 4,381,412 2,948,940 11.6 7,330,352 8.2 7,585,108 10.0 254,756 3.5
FY97 1,464 2.2 8,163,534 4.6 4,891,028 3,067,258 4.0 7,958,286 8.6 8,301,233 9.4 342,947 4.3
FY98 1,563 6.8 8,876,645 8.7 5,417,225 3,254,956 6.1 8,672,181 9.0 9,240,255 11.3 568,074 6.6
FY99 1,622 3.8 9,484,272 6.8 5,074,188 3,518,826 8.1 8,593,014 -0.9 10,201,282 10.4 1,608,268 18.7
FY00 1,708 5.3 10,008,472 5.5 5,592,133 4,552,365 29.4 10,144,498 18.1 11,238,289 10.2 1,093,791 10.8FY01 1,870 9.5 11,385,638 13.8 5,970,573 5,415,065 19.0 11,385,638 12.2 12,267,282 9.2 881,644 7.7
FY02 2,010 7.5 12,953,204 13.8 6,353,977 6,599,227 21.9 12,953,204 13.8 13,931,841 13.6 978,637 7.6FY03 2,120 5.5 13,764,476 6.3 6,704,690 7,059,786 7.0 13,764,476 6.3 15,534,828 11.5 1,770,352 12.9
FY04 2,252 6.2 14,814,664 7.6 6,993,990 7,820,674 10.8 14,814,664 7.6 16,768,757 7.9 1,954,093 13.2
FY05 2,387 6.0 16,128,165 8.9 7,359,617 8,768,548 12.1 16,128,165 8.9 18,651,175 11.2 2,523,010 15.6
FY06 2,495 4.5 17,625,772 9.3 7,917,147 9,708,625 10.7 17,625,772 9.3 20,406,325 9.4 2,780,553 15.8
FY07 2,556 2.4 19,301,063 9.5 8,448,890 10,852,173 11.8 19,301,063 9.5 22,181,930 8.7 2,880,867 14.9
FY08 2,626 2.7 20,644,958 7.0 8,956,960 11,687,998 7.7 20,644,958 7.0 24,436,132 10.2 3,791,174 18.4
FY09 2,658 1.2 21,996,366 6.5 9,449,432 12,546,934 7.3 21,996,366 6.5 25,811,311 * 5.6 3,814,945 17.3
Chapter 70 Foundation Ch 70 Actual Required Actual Percent of Budget Aid NSS Ch 70 NSS NSS Actual NSS
FY93 5,175 1,857 4,747 35.9 91.7 91.7 39.1FY94 5,193 2,031 5,005 39.1 95.3 96.4 40.6FY95 5,327 1,997 5,210 37.5 96.0 97.8 38.3FY96 5,452 2,059 5,297 37.8 93.9 97.2 38.9FY97 5,576 2,095 5,670 37.6 97.5 101.7 36.9FY98 5,679 2,083 5,912 36.7 97.7 104.1 35.2FY99 5,847 2,169 6,289 37.1 90.6 107.6 34.5FY00 5,860 2,665 6,580 45.5 101.4 112.3 40.5FY01 6,089 2,896 6,560 47.6 100.0 107.7 44.1FY02 6,444 3,283 6,931 50.9 100.0 107.6 47.4FY03 6,493 3,330 7,328 51.3 100.0 112.9 45.4FY04 6,578 3,473 7,446 52.8 100.0 113.2 46.6FY05 6,757 3,673 7,814 54.4 100.0 115.6 47.0FY06 7,064 3,891 8,179 55.1 100.0 115.8 47.6FY07 7,551 4,246 8,678 56.2 100.0 114.9 48.9FY08 7,862 4,451 9,305 56.6 100.0 118.4 47.8FY09 8,276 4,720 9,711 57.0 100.0 117.3 48.6
Foundation enrollment is reported in October of the prior fiscal year (e.g. FY08 enrollment = Oct 1, 2006 headcount).Foundation budget is the state's estimate of the minimum amount needed in each district to provide an adequate educational program.Required Net School Spending is the annual minimum that must be spent on schools, including carryovers from prior years.Net School Spending includes municipal indirect spending for schools but excludes capital expenditures and transportation. * Budgeted
Massachusetts Department of Elementary and Secondary Education
Chapter 70 Trends, FY93 Through FY09
Percentage of FoundationDollars Per Foundation Enrollment

Dec. 7, 2009Mendon Upton Regional
School District 40
Direct Special Education Expenditures as a Percentage of School Budgets, FY98 to FY08
SpecialCombined Total Education
Mass. Public Mass Private Special Ed School PercentageOther Schools and and Out-of- Expenditures Operating of Budget
FY Teaching Instructional Collaboratives State Schools (A+B+C+D) Budget (E as & of F)1998 1,104,579 315,917 343,017 292,208 2,055,721 9,240,255 22.21999 1,275,724 269,911 251,043 407,456 2,204,134 10,201,282 21.62000 1,472,559 157,915 289,278 641,360 2,561,112 11,238,289 22.82001 1,602,844 182,407 273,742 483,647 2,542,640 12,267,282 20.72002 1,776,930 335,011 391,651 503,536 3,007,128 13,931,841 21.62003 2,105,020 427,633 454,784 656,224 3,643,661 15,534,828 23.52004 2,201,488 445,526 406,339 825,724 3,879,077 17,021,260 22.82005 2,592,929 451,145 459,100 697,196 4,200,370 19,199,737 21.92006 2,746,931 482,981 498,626 751,998 4,480,536 20,705,338 21.62007 3,017,757 530,732 559,552 956,565 5,064,606 22,553,713 22.52008 3,428,542 594,132 551,048 1,147,343 5,721,065 24,984,942 22.9
In-District Instruction Out-of-District Tuition