mems scanner enabled real-time depth sensitive hyperspectral imaging of biological tissue
TRANSCRIPT
MEMS scanner enabled real-time depth sensitive hyperspectral imaging of biological tissue
Youmin Wang,1,2
Sheldon Bish,2 James W Tunnell,
2 and Xiaojing Zhang
1,2,*
1Microelectronics Research Center,The University of Texas at Austin, Austin, TX, 78758 USA
2 [email protected], Department of Biomedical Engineering, The University of Texas at Austin, 107 W. Dean Keeton St Austin, TX 78712 USA
Abstract: We demonstrate a hyperspectral and depth sensitive diffuse optical imaging microsystem, where fast scanning is provided by a CMOS compatible 2-axis MEMS mirror. By using lissajous scanning patterns, large field-of-view (FOV) of 1.2cm x 1.2cm images with lateral resolution of 100µm can be taken at 1.3 frames-per-second (fps). Hyperspectral and depth-sensitive images were acquired on tissue simulating phantom samples containing quantum dots (QDs) patterned at various depths in Polydimethylsiloxane (PDMS). Device performance delivers 6 nm spectral resolution and 0.43 wavelengths per second acquisition speed. A sample of porcine epithelium with subcutaneously placed QDs was also imaged. Images of the biological sample were processed by spectral unmixing in order to qualitatively separate chromophores in the final images and demonstrate spectral performance of the imaging system.
©2010 Optical Society of America
OCIS codes: (110.0113) Imaging through turbid media; (300.2530) Fluorescence, laser-induced; (170.0170) Medical and biological imaging; (170.3890) medical optics instrumentation; (230.4685) Optical microelectromechanical devices.
References and links
1. Y. G. Patel, K. S. Nehal, I. Aranda, Y. Li, A. C. Halpern, and M. Rajadhyaksha, “Confocal reflectance mosaicing of basal cell carcinomas in Mohs surgical skin excisions,” J. Biomed. Opt. 12(3), 034027 (2007).
2. N. Rajaram, T. J. Aramil, K. Lee, J. S. Reichenberg, T. H. Nguyen, and J. W. Tunnell, “Design and validation of a clinical instrument for spectral diagnosis of cutaneous malignancy,” Appl. Opt. 49(2), 142–152 (2010).
3. K. Kumar, R. Avritscher, Y. Wang, N. Lane, D. C. Madoff, T. K. Yu, J. W. Uhr, and X. Zhang, “Handheld histology-equivalent sectioning laser-scanning confocal optical microscope for interventional imaging,” Biomed. Microdevices 12(2), 223–233 (2010).
4. K. Kumar, J. Condit, A. McElroy, N. Kemp, K. Hoshino, T. Milner, and X. Zhang, “Fast 3D in vivo swept-source optical coherence tomography using a two-axis MEMS scanning micromirror,” J. Opt. A, Pure Appl. Opt. 10(4), 044013 (2008).
5. K. Kumar, R. Avritscher, D. Madoff, and X. Zhang, Handheld Single-Cell-Layer Optical Sectioning Reflectance Confocal Microscope for Interventional Imaging, p 1¨C5. (format).
6. G. K. Fedder, R. T. Howe, T.-J. K. Liu, and E. P. Quevy, “Technologies for Cofabricating MEMS and Electronics,” Proc. IEEE 96(2), 306–322 (2008).
7. S. A. Burgess, M. B. Bouchard, B. Yuan, and E. M. Hillman, “Simultaneous multiwavelength laminar optical tomography,” Opt. Lett. 33(22), 2710–2712 (2008).
1. Introduction
The clinical need for noninvasive skin cancer detection devices has led to intensive commercial and research efforts to develop novel instruments for imaging, spectroscopy or the combination of both [1]. In particular, portable hyperspectral screening devices are highly desirable for the sensitive, biopsy-free characterization of diseases in situ and precision guided microsurgery. This will not only prevent the costly millions of unnecessary biopsies performed every year, but also to make the diagnosis and treatment for diseases like melanoma more convenient and timely. A single-point spectral diagnosis (SDx) device has been developed for the noninvasive diagnosis of skin cancer using optical fiber based probes placed in gentle contact with the skin surface [2]. The high accuracy of the preliminary results
#133137 - $15.00 USD Received 27 Aug 2010; revised 18 Oct 2010; accepted 22 Oct 2010; published 3 Nov 2010(C) 2010 OSA 8 November 2010 / Vol. 18, No. 23 / OPTICS EXPRESS 24101
demonstrate the potential of SDx for the non-invasive, real-time diagnosis of skin cancer; however, these results suffer from inaccuracies due to “sampling error” inherent in point measurements. While SDx provides detailed physiological data that can be useful for diagnosis, it does not allow for mapping or imaging of skin sites.
In this paper, we report the design and characterization of a MEMS scanner based hyperspectral imaging system combining the advantages of both functional imaging and spectroscopy. Integrating the CMOS compatible dual-axis micromirror, we have already demonstrated imaging modalities, including a handheld forward-imaging confocal microscope capable of sub-micrometer lateral resolution [3] and OCT [4]. However, the new system is capable of hyperspectral and depth-sensitive imaging with adjustable field of view and spatial resolution.
2. Methods
2.1 Instrumentation
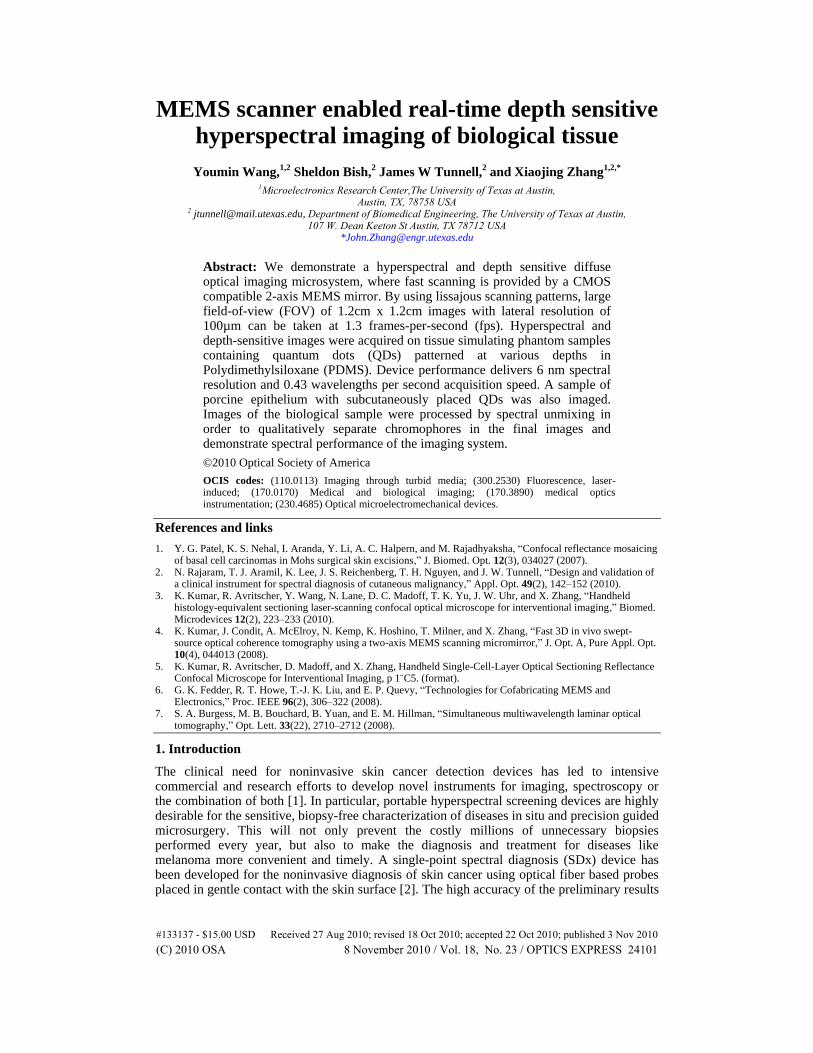
The implementation of the hyperspectral imaging system is shown in Fig. 1.
Fig. 1. Schematic of the MEMS HSI system.
The light source we use for experiments is a 405nm 25mW diode laser (Coherent Inc.). The laser beam is narrowed to a diameter of 1mm and deflected onto the reflective surface of the MEMS scanner via a 500nm cutoff cold mirror (Thorlabs), and then focused onto the sample with an 80mm achromatic lens (Thorlabs). The fraction of fluorescence light that emerges within the collection solid angle (as dictated by the diameter of the scanner and the focal length of the lens) from the sample is de-scanned and transferred across the cold mirror. This fluorescence is simultaneously focused onto a “ring aperture” that spatially filters all collected fluorescence that does not emerge a given distance from the source spot on the tissue surface (source-detector “SD” separation) for depth sensitive imaging. The collected fluorescence is then refocused with a cylindrical lens, and dispersed by a prism for hyperspectral imaging, before being acquired by the photomultiplier tube (PMT) (Hamamatsu H9858). The slit on the front of the PMT anode ensures that only a narrow band of fluorescence is collected at any given time. Before collection by the PMT, the dispersed fluorescence is reflected onto the PMT slit by a mirror positioned on a motorized rotational stage. The rotational stage rotates slightly between each acquisition until images comprising the entire spectral band of interest are collected. Each acquired signal (pixel) is representative of the sampling volume where the scan resided at the time of acquisition. These signals are amplified (Stanford Research Systems) and assembled into an image (National Instruments LabView®) by matching the x-y phases of the lissajous scan and temporally interpolating the signals with the mapped positions.
#133137 - $15.00 USD Received 27 Aug 2010; revised 18 Oct 2010; accepted 22 Oct 2010; published 3 Nov 2010(C) 2010 OSA 8 November 2010 / Vol. 18, No. 23 / OPTICS EXPRESS 24102
2.2 Scanning micromirror
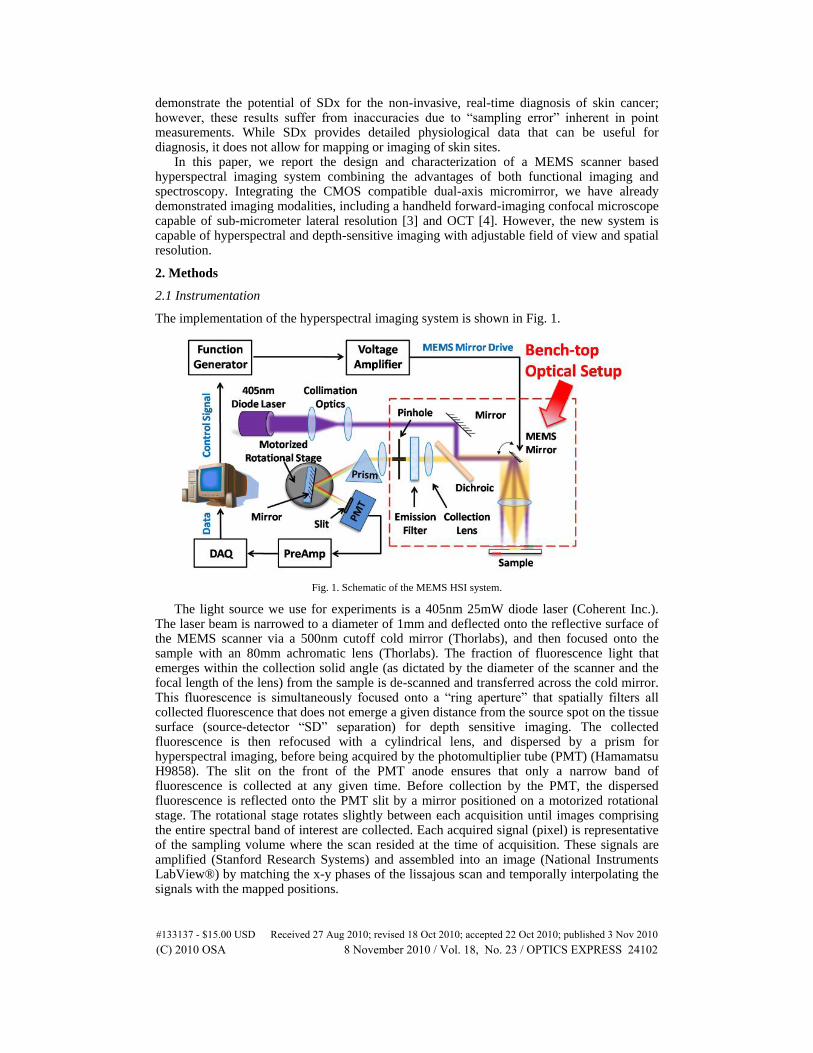
Our scanning micromirror was the core component (shown in Fig. 2) enabling the current system and providing the possibility toward scaling down the system to a handheld portable device. The MEMS micromirror was fabricated using a simple method [5] that is compatible with the complementary metal-oxide-semiconductor (CMOS) processes employed in the electronics industry. CMOS-compatible processing can allow on-chip integration of sensors and electronics to improve scanning precision, wafer yield and device lifetimes, while reducing fabrication costs and barriers to commercial market acceptance [6]. The mirrors were measured 1024 μm in diameter and were fabricated on chips of size 2.8 mm2. Out-of-plane rotation about two orthogonal axes intersecting at the mirror center, based on a gimbal design, was generated by two pairs of electrostatic staggered vertical comb drives on each axis. The maximum optical deflection angles are 22° and 12° respectively, at resonant frequencies of 2.67 kHz and 1.19 kHz for the inner and outer rotation axes. Image data was acquired after aligning the acquisition‟s x-y phase with that of the x-y scan. Trigger waveforms from the signal generators synchronized the Labview® and Matlab® image acquisition code with micromirror position.
Fig. 2. SEMs of CMOS compatible microscanner. (a) Scanning electron micrograph of micromirror.(b) Roughness measurement showing a 8nm roughness in average (split in to two figures, one on SEM + deflection + f, one on surface characterizations)
3. Experimental results
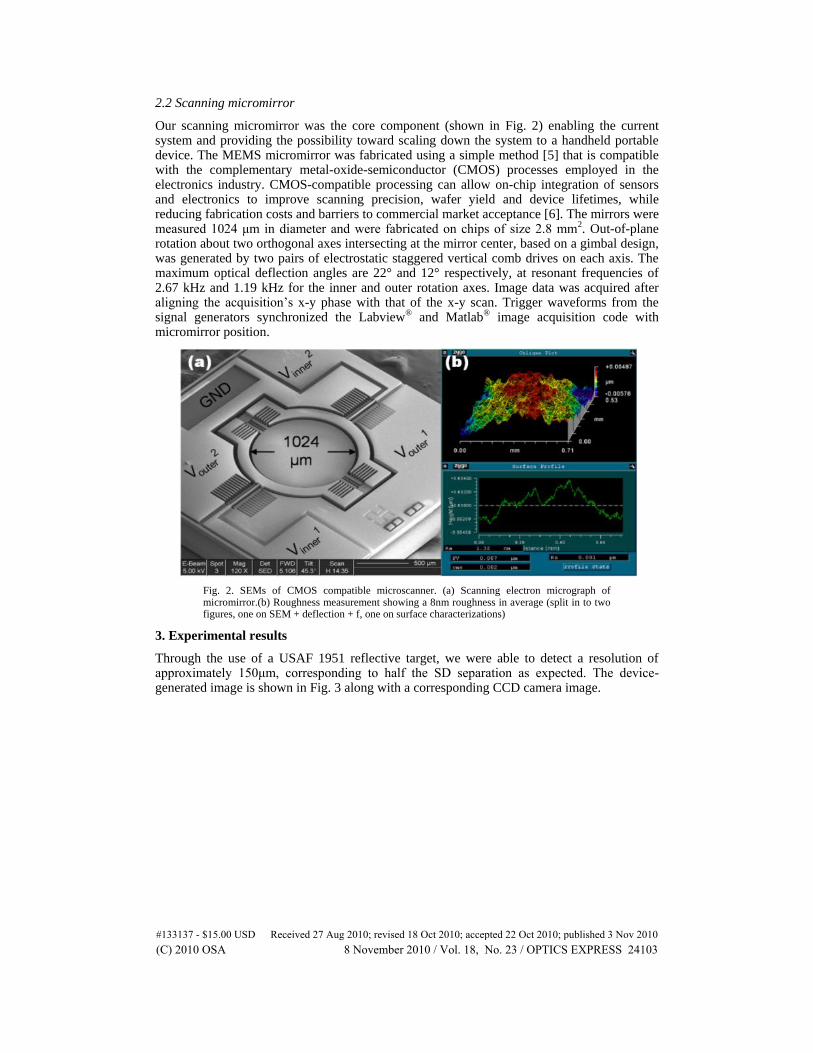
Through the use of a USAF 1951 reflective target, we were able to detect a resolution of approximately 150μm, corresponding to half the SD separation as expected. The device-generated image is shown in Fig. 3 along with a corresponding CCD camera image.
#133137 - $15.00 USD Received 27 Aug 2010; revised 18 Oct 2010; accepted 22 Oct 2010; published 3 Nov 2010(C) 2010 OSA 8 November 2010 / Vol. 18, No. 23 / OPTICS EXPRESS 24103
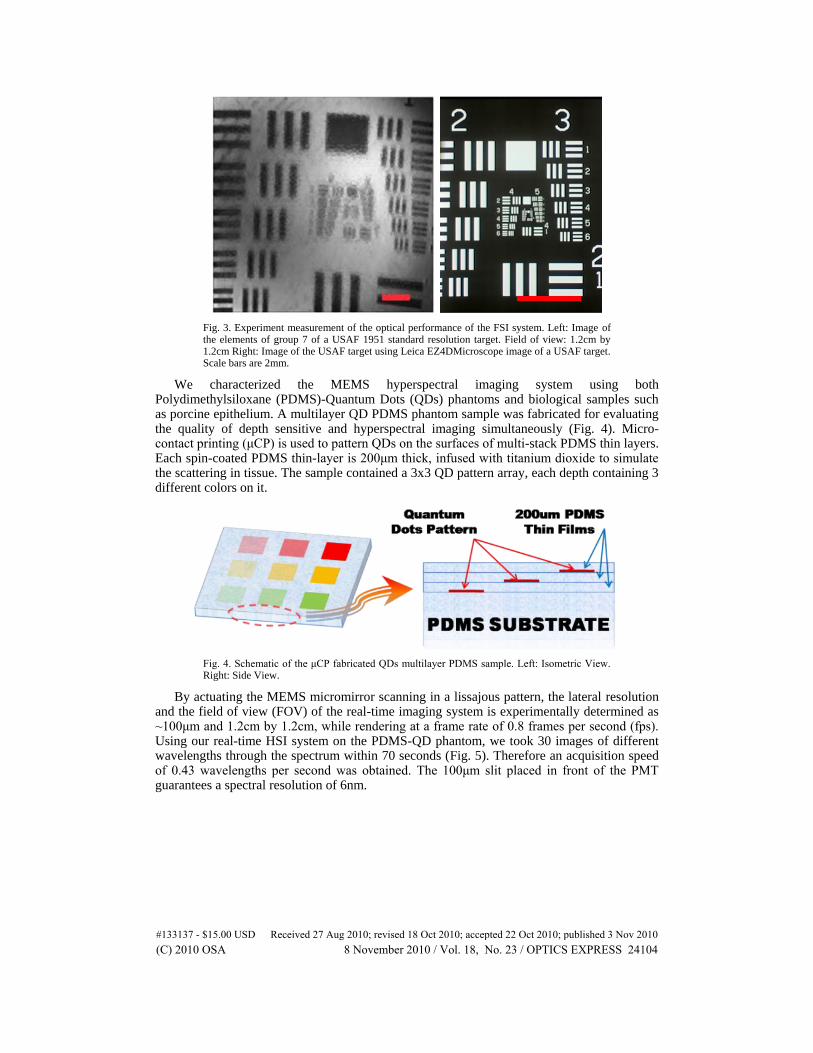
Fig. 3. Experiment measurement of the optical performance of the FSI system. Left: Image of the elements of group 7 of a USAF 1951 standard resolution target. Field of view: 1.2cm by 1.2cm Right: Image of the USAF target using Leica EZ4DMicroscope image of a USAF target. Scale bars are 2mm.
We characterized the MEMS hyperspectral imaging system using both Polydimethylsiloxane (PDMS)-Quantum Dots (QDs) phantoms and biological samples such as porcine epithelium. A multilayer QD PDMS phantom sample was fabricated for evaluating the quality of depth sensitive and hyperspectral imaging simultaneously (Fig. 4). Micro-contact printing (μCP) is used to pattern QDs on the surfaces of multi-stack PDMS thin layers. Each spin-coated PDMS thin-layer is 200μm thick, infused with titanium dioxide to simulate the scattering in tissue. The sample contained a 3x3 QD pattern array, each depth containing 3 different colors on it.
Fig. 4. Schematic of the μCP fabricated QDs multilayer PDMS sample. Left: Isometric View. Right: Side View.
By actuating the MEMS micromirror scanning in a lissajous pattern, the lateral resolution and the field of view (FOV) of the real-time imaging system is experimentally determined as ~100μm and 1.2cm by 1.2cm, while rendering at a frame rate of 0.8 frames per second (fps). Using our real-time HSI system on the PDMS-QD phantom, we took 30 images of different wavelengths through the spectrum within 70 seconds (Fig. 5). Therefore an acquisition speed of 0.43 wavelengths per second was obtained. The 100μm slit placed in front of the PMT guarantees a spectral resolution of 6nm.
#133137 - $15.00 USD Received 27 Aug 2010; revised 18 Oct 2010; accepted 22 Oct 2010; published 3 Nov 2010(C) 2010 OSA 8 November 2010 / Vol. 18, No. 23 / OPTICS EXPRESS 24104
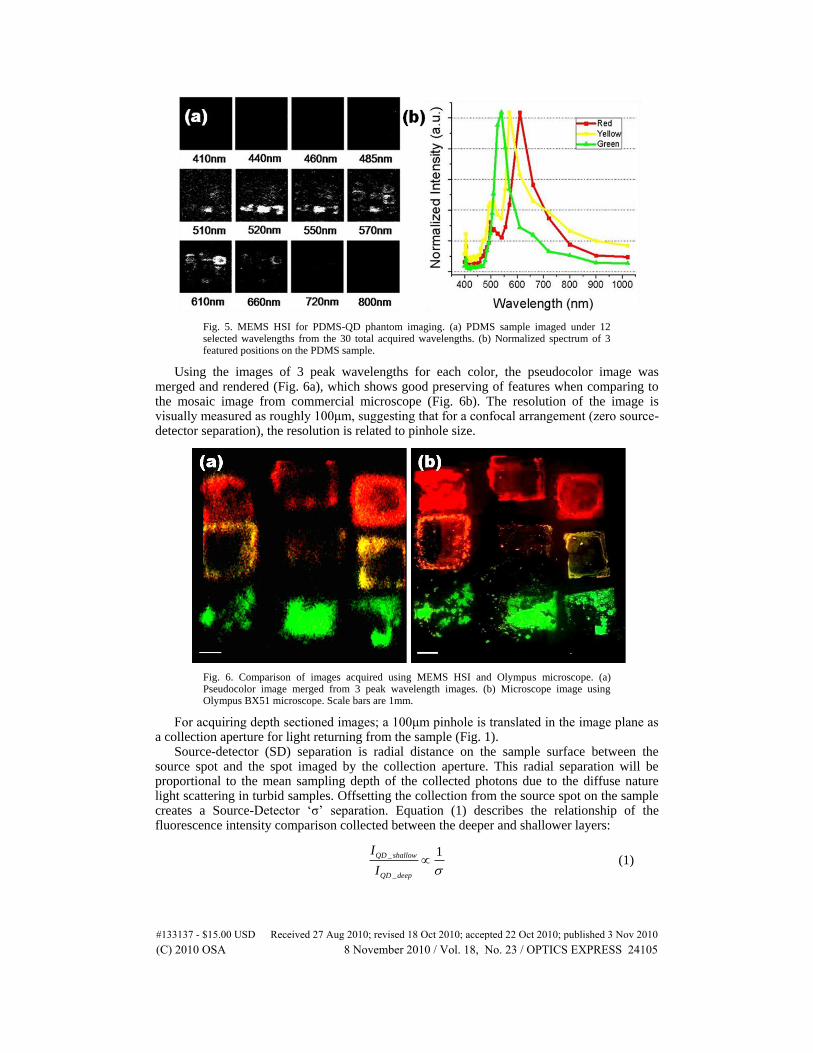
Fig. 5. MEMS HSI for PDMS-QD phantom imaging. (a) PDMS sample imaged under 12 selected wavelengths from the 30 total acquired wavelengths. (b) Normalized spectrum of 3 featured positions on the PDMS sample.
Using the images of 3 peak wavelengths for each color, the pseudocolor image was merged and rendered (Fig. 6a), which shows good preserving of features when comparing to the mosaic image from commercial microscope (Fig. 6b). The resolution of the image is visually measured as roughly 100μm, suggesting that for a confocal arrangement (zero source-detector separation), the resolution is related to pinhole size.
Fig. 6. Comparison of images acquired using MEMS HSI and Olympus microscope. (a) Pseudocolor image merged from 3 peak wavelength images. (b) Microscope image using Olympus BX51 microscope. Scale bars are 1mm.
For acquiring depth sectioned images; a 100μm pinhole is translated in the image plane as a collection aperture for light returning from the sample (Fig. 1).
Source-detector (SD) separation is radial distance on the sample surface between the source spot and the spot imaged by the collection aperture. This radial separation will be proportional to the mean sampling depth of the collected photons due to the diffuse nature light scattering in turbid samples. Offsetting the collection from the source spot on the sample creates a Source-Detector „σ‟ separation. Equation (1) describes the relationship of the fluorescence intensity comparison collected between the deeper and shallower layers:
_
_
1QD shallow
QD deep
I
I (1)
#133137 - $15.00 USD Received 27 Aug 2010; revised 18 Oct 2010; accepted 22 Oct 2010; published 3 Nov 2010(C) 2010 OSA 8 November 2010 / Vol. 18, No. 23 / OPTICS EXPRESS 24105
Here I refer to the collected fluorescent light intensity from the quantum dots layers, and σ stands for different source-detector seperation values.
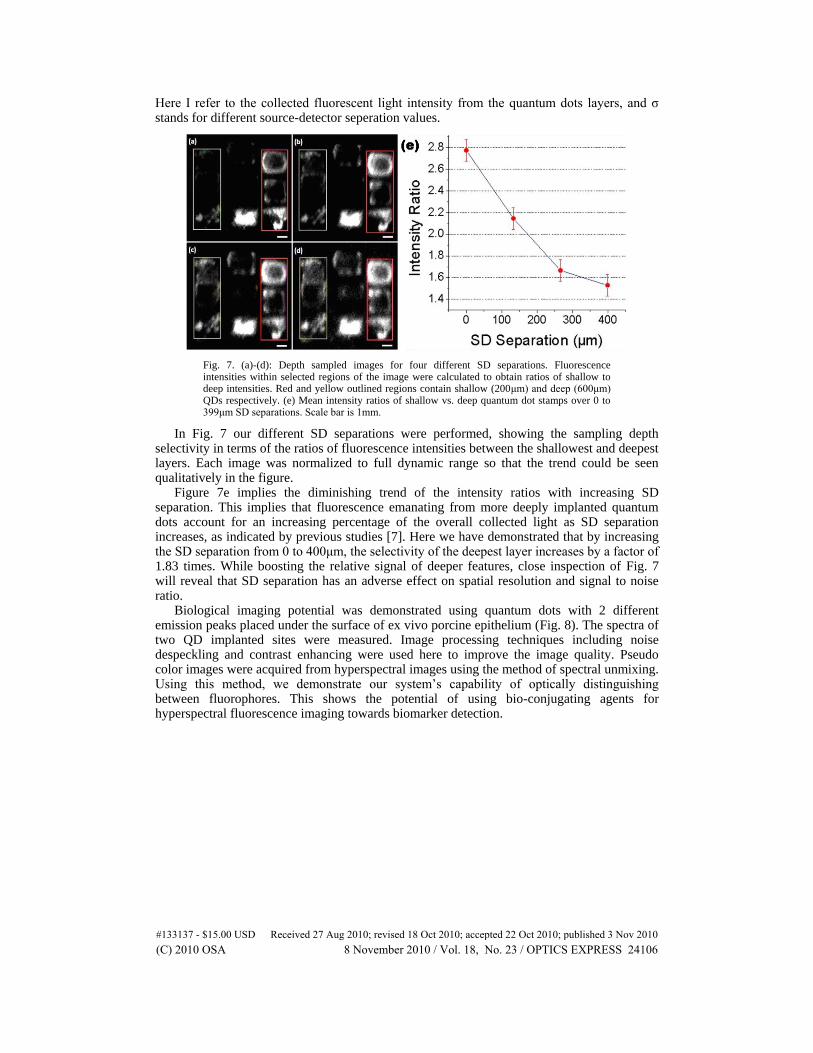
Fig. 7. (a)-(d): Depth sampled images for four different SD separations. Fluorescence intensities within selected regions of the image were calculated to obtain ratios of shallow to deep intensities. Red and yellow outlined regions contain shallow (200μm) and deep (600μm) QDs respectively. (e) Mean intensity ratios of shallow vs. deep quantum dot stamps over 0 to 399μm SD separations. Scale bar is 1mm.
In Fig. 7 our different SD separations were performed, showing the sampling depth selectivity in terms of the ratios of fluorescence intensities between the shallowest and deepest layers. Each image was normalized to full dynamic range so that the trend could be seen qualitatively in the figure.
Figure 7e implies the diminishing trend of the intensity ratios with increasing SD separation. This implies that fluorescence emanating from more deeply implanted quantum dots account for an increasing percentage of the overall collected light as SD separation increases, as indicated by previous studies [7]. Here we have demonstrated that by increasing the SD separation from 0 to 400μm, the selectivity of the deepest layer increases by a factor of 1.83 times. While boosting the relative signal of deeper features, close inspection of Fig. 7 will reveal that SD separation has an adverse effect on spatial resolution and signal to noise ratio.
Biological imaging potential was demonstrated using quantum dots with 2 different emission peaks placed under the surface of ex vivo porcine epithelium (Fig. 8). The spectra of two QD implanted sites were measured. Image processing techniques including noise despeckling and contrast enhancing were used here to improve the image quality. Pseudo color images were acquired from hyperspectral images using the method of spectral unmixing. Using this method, we demonstrate our system‟s capability of optically distinguishing between fluorophores. This shows the potential of using bio-conjugating agents for hyperspectral fluorescence imaging towards biomarker detection.
#133137 - $15.00 USD Received 27 Aug 2010; revised 18 Oct 2010; accepted 22 Oct 2010; published 3 Nov 2010(C) 2010 OSA 8 November 2010 / Vol. 18, No. 23 / OPTICS EXPRESS 24106
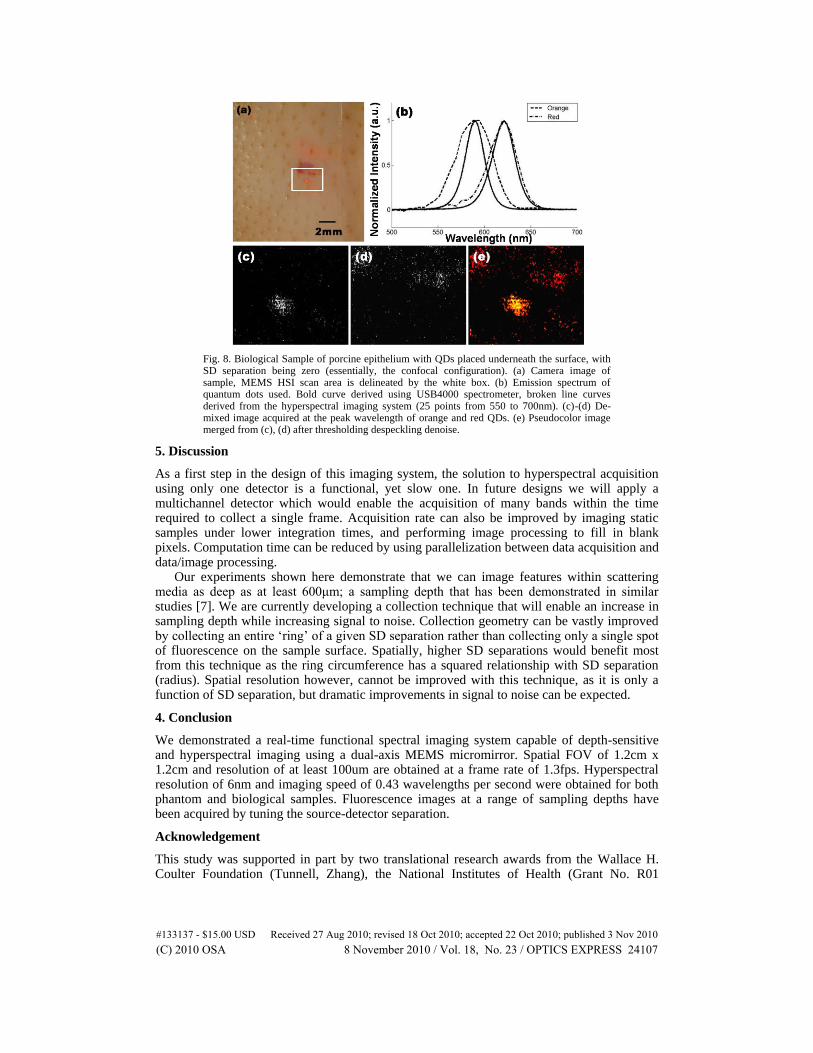
Fig. 8. Biological Sample of porcine epithelium with QDs placed underneath the surface, with SD separation being zero (essentially, the confocal configuration). (a) Camera image of sample, MEMS HSI scan area is delineated by the white box. (b) Emission spectrum of quantum dots used. Bold curve derived using USB4000 spectrometer, broken line curves derived from the hyperspectral imaging system (25 points from 550 to 700nm). (c)-(d) De-mixed image acquired at the peak wavelength of orange and red QDs. (e) Pseudocolor image merged from (c), (d) after thresholding despeckling denoise.
5. Discussion
As a first step in the design of this imaging system, the solution to hyperspectral acquisition using only one detector is a functional, yet slow one. In future designs we will apply a multichannel detector which would enable the acquisition of many bands within the time required to collect a single frame. Acquisition rate can also be improved by imaging static samples under lower integration times, and performing image processing to fill in blank pixels. Computation time can be reduced by using parallelization between data acquisition and data/image processing.
Our experiments shown here demonstrate that we can image features within scattering media as deep as at least 600μm; a sampling depth that has been demonstrated in similar studies [7]. We are currently developing a collection technique that will enable an increase in sampling depth while increasing signal to noise. Collection geometry can be vastly improved by collecting an entire „ring‟ of a given SD separation rather than collecting only a single spot of fluorescence on the sample surface. Spatially, higher SD separations would benefit most from this technique as the ring circumference has a squared relationship with SD separation (radius). Spatial resolution however, cannot be improved with this technique, as it is only a function of SD separation, but dramatic improvements in signal to noise can be expected.
4. Conclusion
We demonstrated a real-time functional spectral imaging system capable of depth-sensitive and hyperspectral imaging using a dual-axis MEMS micromirror. Spatial FOV of 1.2cm x 1.2cm and resolution of at least 100um are obtained at a frame rate of 1.3fps. Hyperspectral resolution of 6nm and imaging speed of 0.43 wavelengths per second were obtained for both phantom and biological samples. Fluorescence images at a range of sampling depths have been acquired by tuning the source-detector separation.
Acknowledgement
This study was supported in part by two translational research awards from the Wallace H. Coulter Foundation (Tunnell, Zhang), the National Institutes of Health (Grant No. R01
#133137 - $15.00 USD Received 27 Aug 2010; revised 18 Oct 2010; accepted 22 Oct 2010; published 3 Nov 2010(C) 2010 OSA 8 November 2010 / Vol. 18, No. 23 / OPTICS EXPRESS 24107

CA132032, Tunnell), the National Science Foundation (Grant No. 0846313, Zhang) and the Texas Higher Education Coordinating Board (Tunnell).
#133137 - $15.00 USD Received 27 Aug 2010; revised 18 Oct 2010; accepted 22 Oct 2010; published 3 Nov 2010(C) 2010 OSA 8 November 2010 / Vol. 18, No. 23 / OPTICS EXPRESS 24108