memory usage on nas systems final · 11/8/2017 · •ps–eopid,ppid,psr,vsize,rss,cmd(usage by...
TRANSCRIPT

National Aeronautics and Space Administration
www.nasa.gov
Memory Usage on NAS Xeon-Based Systems
Nov 8, 2017NASA Advanced Supercomputing Division

N A S A H i g h E n d C o m p u t i n g C a p a b i l i t y Question? Use the Webex chat facility to ask the Host
Outline
• Physical Memory vs Virtual Memory • Amount of Physical Memory in a Node• What Consumes Memory?• A Few Scenarios When the Amount of Physical Memory
Is Not Enough and Their Failure Modes• Existing Tools for Memory Usage Monitoring• The New vnuma Tool for Memory Usage and Non-Local
Memory Access Monitoring• How to Get More Memory for Your Processes?
2

N A S A H i g h E n d C o m p u t i n g C a p a b i l i t y Question? Use the Webex chat facility to ask the Host
Units• Old system
KB, MB, GB, TB, PB, … can be either binary or decimalBinary: 1 KB (kilobytes) = 1024 bytes used for memoryDecimal: 1 KB (kilobytes) = 1000 bytes used for disk capacity
• International System of Quantities (ISQ)KiB, MiB, GiB, TiB, PiB, … are binary1 KiB (kibibytes) = 1024 bytesKB, MB, GB, TB, PB, ……. are decimal1 KB (kilobytes) = 1000 bytes
• Choice of units is not yet consistent among tools, but more and more are moving toward ISQ.
3

N A S A H i g h E n d C o m p u t i n g C a p a b i l i t y Question? Use the Webex chat facility to ask the Host
Physical Memory vs Virtual Memory
4
Process 1 Process 2
RAMMain Memory
GiB to TiB
TiB to PiB/homeX;
/nobackup…
DiskSecondary Storage
4K page mappingby MMU
Kernel Space
X86-64system:128 or 256 TiB
Unused X86-64system:
128 or 256 TiBUser Space
Virtual VirtualPhysical
2^64 = 16 EiB
Main Memory<< Virtual Memory Kernel
Space
X86-64system:128 or 256 TiB
Unused X86-64system:
128 or 256 TiBUser Space

N A S A H i g h E n d C o m p u t i n g C a p a b i l i t y Question? Use the Webex chat facility to ask the Host
Amount of Physical Memory in a Node
5
16 GiB Memory
Memory Controller
Socket 0 Socket 1
QPI
Cluster Node Type Cores/node Mem/node Mem/coreMerope Westmere 12 48 GiB 4 GiB
Pleiades Sandy Bridge 16 32 GiB 2 GiB
Pleiades Ivy Bridge 20 64 GiB 3.2 GiB
Pleiades Haswell 24 128 GiB 5.3 GiB
Pleiades/Electra Broadwell 28 128 GiB 4.5 GiB
Electra Skylake 40 192 GiB 4.8 GiB
Memory Controller
QPI
8 9 10 1115 14 13 12
0 1 2 37 6 5 4Example:
Sandy Bridge Node Configuration
16 GiB Memory

N A S A H i g h E n d C o m p u t i n g C a p a b i l i t y Question? Use the Webex chat facility to ask the Host
What Consumes Memory ?• Your program: amount varies- Virtual: Text (instructions), data (pre-defined), bss, heap and stack- Physical: Resident Set Size (RSS or RES)
• Operating system: about 2 to 4 GB- System call interface- Device drivers- Kernel services (process, memory, file, I/O managements)
• Buffer (page) cache: amount varies- For speeding up disk I/O of your program- Amount consumed by buffer cache depends on the size of I/O and the efficiency
of the OS in grabbing/releasing memory for/from buffer cache(OS is less efficient in releasing buffer cache memory since SLES11SP4)
• /tmp: up to 50% of total physical memory- As a local fast RAM-based temporary filesystem on each node- PBS creates $TMPDIR /tmp/pbs.jobid.pbspl1.nas.nasa.gov
(useful if a node is shared, but currently not)6
stack
shared libraries
heap
bss
data
text

N A S A H i g h E n d C o m p u t i n g C a p a b i l i t y Question? Use the Webex chat facility to ask the Host 7
A Few Scenarios When the Amount of Physical Memory
Is Not Enoughand Their Failure Modes

N A S A H i g h E n d C o m p u t i n g C a p a b i l i t y Question? Use the Webex chat facility to ask the Host
Not Enough Free Memory When a Job Starts• Sometimes, for a node assigned to your job
free memory < Total memory – memory used by OS• Nodes are not rebooted between jobs- A previous job used buffer cache and it has not been
completely cleaned up when your job starts.- PBS tries to clean up caches (i.e., drop_caches) before
(prologue) and after (epilogue) a job. - PBS prologue checks to make sure that a node assigned to
your job has free memory at least 85% of total memory. If less than 85%, job won’t start and it is placed back in the queue. That’s why your job goes from R back to Q state.
Req’d ElapJobID User Queue Jobname TSK Nds wallt S wallt ----------- ----- ----- -------- --- --- ----- - -----1234.pbspl1 zsmith normal Test 64 64 04:00 R --
8

N A S A H i g h E n d C o m p u t i n g C a p a b i l i t y Question? Use the Webex chat facility to ask the Host
Running Out of /tmp on a Node
• When the usage of /tmp is going over 50% of total memory, the following error occurs:
‘No space left on device’Note: /tmp is treated a local filesytem
• Reading, writing or copying files to /tmp may consume both /tmp and buffer cache. So, 20 GB of I/O on /tmp may also use 20 GB of buffer cache, a total of 40 GB.
9

N A S A H i g h E n d C o m p u t i n g C a p a b i l i t y Question? Use the Webex chat facility to ask the Host
A Job Nearly Uses All the Memory
• If program’s memory usage is under but near the memory limit- Kernel takes longer time to find free memory for your program to use
- Job runs slower.
- A job that used to stay under the limit may go over with a different OS or MPT version/setting.
★ SLES12 seems to use more memory than an old version of SLES11
★ MPI library consumes memory: 2.14 and earlier < 2.15 and later. The amount is different for different node types, san/ivy < has/bro/sky.
- Good to know how much memory your processes need and have enough head room.
10

N A S A H i g h E n d C o m p u t i n g C a p a b i l i t y Question? Use the Webex chat facility to ask the Host
A Note on Swapping• Swapping: A method for OS to deal with multiple processes
running simultaneously in extremely low memory conditions- (Old definition) The OS moves an entire process and its
memory to secondary storage temporarily and later moving them back in.
- (With Linux kernel) The OS “pages” out many pages simultaneously of a process to a swap space (on disk)
• “Swapping” is enabled on NAS front-ends (PFEs) but disabled on NAS compute nodes.
• This may be a reason why your code runs on your local system or PFEs but runs out of memory (OOM) on compute nodes.
11

N A S A H i g h E n d C o m p u t i n g C a p a b i l i t y Question? Use the Webex chat facility to ask the Host
A Job Slowly Runs Out of Memory• If OOM occurs during a slow memory growth - Allows detection by system tools. Node(s) is rebooted. Job is killed by PBS
and an automatic email (below) is sent to job owner. Job will not be rerun.- Sample OOM email to user from [email protected]:
Your Pleiades job 2465851.pbspl1.nas.nasa.gov terminated due to one or more nodes running out of memory. Node r329i1n11 ran out of memory and rebooted; others may have run out of memory as well.While this is typically caused by a user program using too much memory, it may also be caused by a system issue. If you need help determining the source of the problem, please email [email protected] and we will be happy to help. For information on how to check the memory usage or request more memoryfor your PBS jobs, seehttp://www.nas.nasa.gov/hecc/support/kb/memory-usage-overview_216.html
- OOM message in system log file:
Wed Sep 13 17:43:57 2017 R r329i1n11 sec[9551]: SEC_EVENT |msgoom_boom|host r329i1n11|job 2465851.pbspl1.nas.nasa.gov|time Wed Sep 13 17:43:57 2017|mark_time Wed Sep 13 17:00:00 2017
12

N A S A H i g h E n d C o m p u t i n g C a p a b i l i t y Question? Use the Webex chat facility to ask the Host
A Job Abruptly Runs Out of Memory• If OOM occurs during a fast memory growth (such as when
many processes all try to grab lots of memory at the same time)- Node that OOMs becomes unresponsive and crashes; job not gaining time
- System tools cannot catch the OOM; harder to figure out what happened- A single-node job cannot be deleted by ‘qdel’ or even ‘qdel –Wforce’.
Requires NAS control-room to reboot the node from console. PBS then deletes the job.
- For an MPI job with multiple nodes, if a sister node of the same job notices that it could not communicate with the node that crashes, PBS assumes it is a system issue, and kills the job.
- Since PBS does not know it is an application issue, it re-queues the job (if there is no #PBS –r n). This is bad because the same abrupt OOM will happen over and over again until a staff catches it!
13

N A S A H i g h E n d C o m p u t i n g C a p a b i l i t y Question? Use the Webex chat facility to ask the Host 14
Tools for Memory Usage Monitoring
Frequency of report:• a snapshot (at a given time or high-water mark)• continuous as time progresses
What does the reported “memory used” include?• per node or per process• RSS of a process of your program• kernel usage• buffer cache• /tmp

N A S A H i g h E n d C o m p u t i n g C a p a b i l i t y Question? Use the Webex chat facility to ask the Host
• PBS Output Report (sum of RSS of processes for first node) Real Memory Used : 174376196kb
- Highest “memory used” captured by PBS, may not be true high-water mark- May not be accurate under SLES 12
• cgroup report in system log file (mainly checked by staff)2448843.pbspl1.0.log.txt:Sun Sep 10 17:11:33 2017 M r311i6n7 epilogue(2448843): epilogue pre-lflushcgroup highwater: 30096496 (93%)2448843.pbspl1.0.log.txt:Sun Sep 10 17:11:33 2017 M r311i6n8 epilogue(2448843): epilogue pre-lflushcgroup highwater: 687604 (02%)2448843.pbspl1.0.log.txt:Sun Sep 10 17:11:33 2017 M r311i7n0 epilogue(2448843): epilogue pre-lflushcgroup highwater: 686332 (02%)
- High-water mark usage shown in KiB- Includes app’s RSS, /tmp and buffer cache usage (but not kernel usage)- If a node spontaneously reboots, the memory usage info is lost
15
Following-the-Event Reports

N A S A H i g h E n d C o m p u t i n g C a p a b i l i t y Question? Use the Webex chat facility to ask the Host
You can ssh into the nodes of your running job and run• cat /proc/meminfo (usage on the node, no usage by process) watch cat /proc/meminfo (display updated every 2 seconds)MemTotal: 32390300 kB (I believe this is KiB)MemFree: 9578248 kB…
• ps –eo pid,ppid,psr,vsize,rss,cmd (usage by process) watch ps –eo … (display updated every 2 seconds)
PID PPID PSR VSZ RSS CMD51367 51361 0 99311228 64904252 a.out
(kiB)
• top (usage on the node and usage by process)Automatically refreshed every 3 seconds
16
Commonly Used Active Monitoring Tools

N A S A H i g h E n d C o m p u t i n g C a p a b i l i t y Question? Use the Webex chat facility to ask the Host
NAS In-House Active Monitoring Tools – qtop.pl• /u/scicon/tools/bin/qtop.pl [options] PBS-Jobid - SSH into and run top on all of your nodes for you- Show system summary and process info - Sample snapshot on first node
- Add /u/scicon/tools/bin to your $PATH to avoid typing the full path- qtop.pl info page http://www.nas.nasa.gov/hecc/support/kb/entry/218
17
r621i4n14top - 13:01:55 up 20 days, 37 min, 0 users, load average: 28.00, 28.00, 27.81Tasks: 795 total, 29 running, 766 sleeping, 0 stopped, 0 zombie%Cpu(s): 46.0 us, 0.1 sy, 0.0 ni, 53.8 id, 0.1 wa, 0.0 hi, 0.0 si, 0.0 stKiB Mem: 13139048+total, 30021788 used, 10136868+free, 0 buffersKiB Swap: 0 total, 0 used, 0 free. 5088136 cached Mem
PID USER PR NI VIRT RES SHR S %CPU %MEM TIME+ COMMAND 7756 jsmith 20 0 0.129t 986164 194124 R 100.00 0.751 45:10.46 a.out7757 jsmith 20 0 0.129t 984128 192932 R 100.00 0.749 45:13.00 a.out7759 jsmith 20 0 0.129t 985464 192828 R 100.00 0.750 45:11.45 a.out7761 jsmith 20 0 0.129t 984940 192972 R 100.00 0.750 45:11.42 a.out7763 jsmith 20 0 0.129t 977956 192840 R 100.00 0.744 45:12.95 a.out7773 jsmith 20 0 0.129t 966496 192988 R 100.00 0.736 45:14.18 a.out 7776 jsmith 20 0 0.129t 967116 193004 R 100.00 0.736 45:14.85 a.out7781 jsmith 20 0 0.129t 972252 192632 R 100.00 0.740 45:13.58 a.out7783 jsmith 20 0 0.129t 965648 192684 R 100.00 0.735 45:13.29 a.out
Buffer cache usage(include /tmp usage)
Phyical memory used (in KiB if no unit shown) by each process
It is not13139048 KiB.It is~131390480 KiB.

N A S A H i g h E n d C o m p u t i n g C a p a b i l i t y Question? Use the Webex chat facility to ask the Host
NAS In-House Monitoring Tools – gm.x
• /u/scicon/tools/bin/gm.x (suggest adding to your $PATH)- Unlike top or qtop.pl where you need to babysit while job is running, you
simply add gm.x inside your PBS script
- Only tracks memory usage by your program, not by OS or buffer cache- mpiexec –np xx gm.x a.out | gm_post.x -v
«prints peak memory usage (high-water mark) per process at end of job
«gm_post.x does post-processing to print additional usage statistics- mpiexec –np xx gm.x –c10 a.out | gm_post.x –v
«prints memory usage every 10 seconds
«good for cases when the job may crash due to OOM
- gm.x info page http://www.nas.nasa.gov/hecc/support/kb/entry/220
18

N A S A H i g h E n d C o m p u t i n g C a p a b i l i t y Question? Use the Webex chat facility to ask the Host
NAS In-House Monitoring Tools – gm.x
- Sample gm.x output of a 2 nodes x 2 processes job
Memory usage for (r513i4n7,pid=27960): 33.684 MB (rank=0)
Memory usage for (r513i4n7,pid=27961): 33.608 MB (rank=1)
Memory usage for (r515i2n17,pid=29585): 33.704 MB (rank=2)
Memory usage for (r515i2n17,pid=29586): 33.604 MB (rank=3)
Number of nodes = 2
Number of processes = 4
Processes per node = 2
Total memory = 134.600 MB
Memory per node = 67.300 MB
Minimum node memory = 67.292 MB
Maximum node memory = 67.308 MB
Memory per process = 33.650 MB
Minimum proc memory = 33.604 MB
Maximum proc memory = 33.704 MB
19
reported by gm_post.xMB here is decimal

N A S A H i g h E n d C o m p u t i n g C a p a b i l i t y Question? Use the Webex chat facility to ask the Host
New NAS In-house tool - vnuma
A user friendly memory usage monitoring tool that captures a lot of information and where you can view results either in text or graphically when the job is done.
Created by Paul Kolano
% vnuma -hhttp://www.nas.nasa.gov/hecc/support/kb/entry/552
20

N A S A H i g h E n d C o m p u t i n g C a p a b i l i t y Question? Use the Webex chat facility to ask the Host
New NAS In-house tool - vnuma
• User friendly, no need to baby-sit the job- Method 1: Submit job first, then invoke vnuma
pfe% module load savors/2.xpfe% qsub your_pbs_script1234.pbspl1pfe% vnuma --save=/save/dir [other options] 1234/save/dir should be clean with no output from other jobs.If /save/dir does not exist, it will be created.
★ You can logout.★ vnuma waits for your job to start, collects data, and exits when done. ★ If the job dies, you do not lose the data already collected.★ You can stop data collection with vnuma --stop pbs_jobid
21

N A S A H i g h E n d C o m p u t i n g C a p a b i l i t y Question? Use the Webex chat facility to ask the Host
New NAS In-house tool - vnuma
-Method 2: add vnuma inside PBS script
module load savors/2.xvnuma --save=/save/dir [other options] $PBS_JOBIDmpiexec –np x a.outvnuma --stop $PBS_JOBID <-- optional
In PBS epilogue, root runs stream benchmark which uses a lot of memory. This is included if you do not stop data collection.
22

N A S A H i g h E n d C o m p u t i n g C a p a b i l i t y Question? Use the Webex chat facility to ask the Host
New NAS In-house tool - vnuma
• A lot of information- Collect usage every 1 second (default)★--period=n to collect every n seconds
- From /proc/meminfo, /proc/$pid/[stat,cmdline,numa_maps]- Report both per-node and per-process memory usage- Can have a rough estimate of buffer cache usage- Collect data on head node (default)★--all to collect on all nodes (avoid this for large jobs)★--hosts=0+10i (collect from head node and every 10th node)
- Data are organized one file for each node★ time (keeps collection parameters used internally by vnuma)★out.r621i4n14 (contains text output of memory usage)★out.r621i5n12
23

N A S A H i g h E n d C o m p u t i n g C a p a b i l i t y Question? Use the Webex chat facility to ask the Host
Example• An artificial case with 6 Ivy Bridge nodes x 20p• A ~24GB file is copied to /tmp on the head node• A 120-p nasrotor Overflow case is then run on the 6 nodes.
During the run, memory usage per process grows from 0 at the beginning to ~600 MB at the end.
• Data collection:pfe% qsub my_job2646009.pbspl1pfe% vnuma --save=./vnuma_dir --all 2646009
• Graphical view of data: pfe% vnuma --load=./vnuma_dir [other options]
24

N A S A H i g h E n d C o m p u t i n g C a p a b i l i t y Question? Use the Webex chat facility to ask the Host
vnuma --load=./vnuma_dir --all --total --geometry=2000x1000
25
r431i4n16
-: All Processes-: User Processes
r431i4n2
-: All Processes-: User Processes
r431i5n9
-: All Processes-: User Processes
r431i4n1
-: All Processes-: User Processes
r431i4n11
-: All Processes-: User Processes
r431i4n13
-: All Processes-: User Processes
--total: line plot, showing all/user memory usage against left axisHead node (upper left most graph): ~40 GB by everything (orange)
and < 10 GB by user processes (yellow)Other nodes: ~ 9GB by everything and < 7 GB by user processes

N A S A H i g h E n d C o m p u t i n g C a p a b i l i t y Question? Use the Webex chat facility to ask the Host
vnuma --load=./vnuma_dir --total --process --min=20 --geometry=2000x1000
26
--total: line plot, showing all/user (orange/yellow) memory usage against right axis--process: point plot, showing per process memory usage against left axis--min: remove plots for processes with memory usage less than specified number MBs
r431i4n1
-: All Processes-: User Processes34481: mpiexec -n 120 gm.x -c10 overflowmpi34541: overflowmpi34542: overflowmpi34543: overflowmpi34544: overflowmpi34545: overflowmpi34546: overflowmpi34547: overflowmpi34548: overflowmpi34549: overflowmpi34550: overflowmpi34551: overflowmpi34552: overflowmpi34553: overflowmpi34554: overflowmpi34555: overflowmpi34556: overflowmpi34557: overflowmpi34558: overflowmpi34559: overflowmpi34560: overflowmpi

N A S A H i g h E n d C o m p u t i n g C a p a b i l i t y Question? Use the Webex chat facility to ask the Host
Non-Uniform Memory Access (NUMA)
• Local memory access- Default policy: allocate memory for a process from the local socket when possible
• Non-local memory access - Occurs when local memory on the socket of the process has exhausted; or when
local socket has free memory now, but data were first touched on the memory of the non-local socket earlier
- This hurts performance because of increased latency and possible bandwidth limitation of the inter-socket links (QPI or UPI)
2727
Memory
Socket 0 Socket 1
QPI
MemoryQPI
8 9 10 1115 14 13 12
0 1 2 37 6 5 4

N A S A H i g h E n d C o m p u t i n g C a p a b i l i t y Question? Use the Webex chat facility to ask the Host
vnuma text output
28
time node pid psr socket local non-local command(MB) (MB)
1508445415 r431i4n1 34541 0 0 584.964 50.628 /u/…/overflowmpi1508445415 r431i4n1 34542 1 0 451.176 194.56 /u/…/overflowmpi1508445415 r431i4n1 34543 2 0 408.208 146.704 /u/…/overflowmpi1508445415 r431i4n1 34544 3 0 410.096 145.752 /u/…/overflowmpi1508445415 r431i4n1 34545 4 0 408.356 147.2 /u/…/overflowmpi1508445415 r431i4n1 34546 5 0 407.348 186.04 /u/…/overflowmpi1508445415 r431i4n1 34547 6 0 409.268 184.136 /u/…/overflowmpi1508445415 r431i4n1 34548 7 0 408.736 165.908 /u/…/overflowmpi1508445415 r431i4n1 34549 8 0 407.076 176.872 /u/…/overflowmpi1508445415 r431i4n1 34550 9 0 408.312 184.616 /u/…/overflowmpi1508445415 r431i4n1 34551 10 1 543.1 11.08 /u/…/overflowmpi1508445415 r431i4n1 34552 11 1 549.036 11.772 /u/…/overflowmpi1508445415 r431i4n1 34553 12 1 545.372 11.484 /u/…/overflowmpi1508445415 r431i4n1 34554 13 1 559.884 10.416 /u/…/overflowmpi1508445415 r431i4n1 34555 14 1 572.656 9.764 /u/…/overflowmpi1508445415 r431i4n1 34556 15 1 579.368 9.212 /u/…/overflowmpi1508445415 r431i4n1 34557 16 1 582.18 9.38 /u/…/overflowmpi1508445415 r431i4n1 34558 17 1 582.98 10.264 /u/…/overflowmpi1508445415 r431i4n1 34559 18 1 579.952 10.392 /u/…/overflowmpi1508445415 r431i4n1 34560 19 1 593.952 9.608 /u/…/overflowmpi1508445415 r431i4n1 - -1 45041.264 0 0 All Processes ß from meminfo1508445415 r431i4n1 - -1 11715.112 0 0 User Processes
I believe this is MiB
N A S A H i g h E n d C o m p u t i n g C a p a b i l i t y Question? Use the Webex chat facility to ask the Host
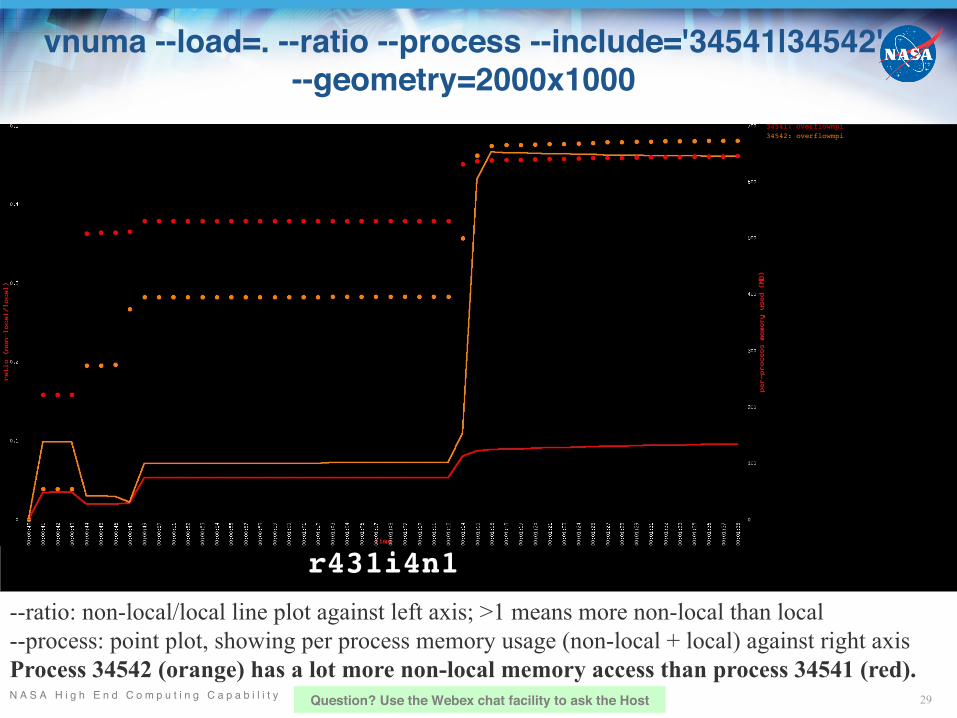
vnuma --load=. --ratio --process --include='34541|34542' --geometry=2000x1000
29
--ratio: non-local/local line plot against left axis; >1 means more non-local than local--process: point plot, showing per process memory usage (non-local + local) against right axisProcess 34542 (orange) has a lot more non-local memory access than process 34541 (red).
r431i4n1
34541: overflowmpi34542: overflowmpi

N A S A H i g h E n d C o m p u t i n g C a p a b i l i t y Question? Use the Webex chat facility to ask the Host
How to Get More Memory for Your Processes ?
Watch out for possible non-local memory access when applying some of these strategies
30

N A S A H i g h E n d C o m p u t i n g C a p a b i l i t y Question? Use the Webex chat facility to ask the Host
Need More Memory on the Head Node?
• Typical for jobs that use MPI rank 0 to do IO• Use a node type with more memory for the first node- For example, change
#PBS –lselect=10:ncpus=20:model=ivyto #PBS –lselect=1:ncpus=20:model=ivy:bigmem=True+9:ncpus=20:model=ivyor#PBS –lselect=1:ncpus=20:model=has+9:ncpus=20:model=ivyHaswell has 24 cores. By default, due to MPI_DSM_DISTRIBUTE, running on only 20 cores causes 12 processes to run on socket 0 and 8 on socket 1. Memory in socket 0 will be used up faster, and this may cause non-local memory access. Solution: spread the processes and do pinning
mpiexec –np 200 mbind.x –cs –n20 –v a.out• Assign rank 0 to a node by itself- #PBS –lselect=1:ncpus=1:model=ivy+10:ncpus=20:model=ivy
31

N A S A H i g h E n d C o m p u t i n g C a p a b i l i t y Question? Use the Webex chat facility to ask the Host
Need More Memory on the Head Node? (cont’d)• Use pagecache management to limit buffer cache usage- Estimate/choose a buffer cache size that will leave enough memory for
your processes on socket 0 to use module load pagecache-management/0.5
setenv PAGECACHE_MAX_BYTES 8589934592 ß 8 GB pagecache
mpiexec -n XX pcachem -- a.out
- Drawback: IO may not run as fast as when you have a larger buffer cache, but this should not be a big issue if IO occurs only at the beginning and/or at the end of your job.
- Benefit: Computation by processes should be more balanced and faster
- Pagecache management info page http://www.nas.nasa.gov/hecc/support/kb/entry/505
32

N A S A H i g h E n d C o m p u t i n g C a p a b i l i t y Question? Use the Webex chat facility to ask the Host
Best Practices• Avoid situations when memory usage is near limit- Job behaviors may vary from run to run. Depending on the amount of
free memory left for your program, sometimes your job runs slower, sometimes it may get OOM.
• Avoid non-local memory access for better performance- The ability of the kernel to reclaim the memory in page cache is highly
variable, causing run-to-run time variation
- Get more memory for first rank that does IO
- Or limit buffer cache size with pagecache management
- Use process pinning (dplace, mbind.x)
33
N A S A H i g h E n d C o m p u t i n g C a p a b i l i t y Question? Use the Webex chat facility to ask the Host 34
A PDF and recording of this webinar will be available within 48 hours at:
http://www.nas.nasa.gov/hecc/support/training.html
Previous Webinar recordings athttp://www.nas.nasa.gov/hecc/support/past_webinars.html
Suggestions for future webinar topics are welcome
Questions?