memory system behavior of java programs: methodology …csl.skku.edu/papers/sigmetrics00.pdf ·...
TRANSCRIPT

Memory System Behavior of Java Programs: Methodology and Analysis
Jin-Soo Kim Elec t ron ics and Te l ecommunica t i ons
Resea rch I n s t i t u t e ( E T R I ) Tae jon 305-350, K o r e a
jinsoo @ computer.org
Yarsun Hsu t
Dept . of E lec t r i ca l Eng inee r ing N a t i o n a l Ts ing H u a Unive r s i ty
Hsinchu, Ta iwan
yshsu @ ee.nthu.edu.tw
ABSTRACT This paper studies the memory system behavior of Java programs by analyzing memory reference traces of several SPECjvm98 applications running with a Just- In-Time (JIT) compiler. Trace information is collected by an exception- based tracing tool called JTRAeE, without any instrumenta- tion to the Java programs or the J IT compiler.
First , we find tha t the overall cache miss ratio is increased due to garbage collection, which suffers from higher cache misses compared to the application. We also note tha t going beyond 2-way cache associativity improves the cache miss ratio marginally. Second, we observe tha t Java programs generate a substantial amount of short-lived objects. How- ever, the size of frequently-referenced long-lived objects is more important to the cache performance, because it tends to determine the application's working set size. Finally, we note that the default heap configuration which s tar ts from a small initial heap size is very inefficient since it invokes a garbage collector frequently. Although the direct costs of garbage collection decrease as we increase the available heap size, there exists an optimal heap size which minimizes the total execution t ime due to the interaction with the virtual memory performarLce.
1. INTRODUCTION Although the Java programming language [7] is rapidly gain- ing in populari ty and importance for the development of serious applications, very litt le is known about the execu- tion characteristics and the architectural requirements of the Java programs. Most of the architectural evaluations have been performed using scientific or commercial workloads [14; 1], which are writ ten in C, C + + , or Fortran languages. Un- like those languages, Java has several distinctive features
*This work was done while the author was visiting the IBM T. J. Watson Research Center. tOn leave from IBM T. J. Watson Research Center.
Permission to make digital or hard copies of all or part of this work for personal or classroom use is granted without fee provided that copies are not made or distributed for profit or commercial advant -age and that copies bear this notice and the full citation on the first page. To copy otherwise, to republish, to post on servers or to redistribute to lists, requires prior specific permission and/or a fee. SIGMETRICS 2000 6K)0 Santa Clara, California, USA © 2000 ACM 1-58113-194-110010006...$5.00
such as automat ic memory management, a support for mul- t i threading, the existence of architecture-neutral intermedi- ate codes (bytecodes), etc. Thus, it is very interesting to see whether Java applications share similar characteristics with the t radi t ional applications or not.
Wi th the increasing gap between the speeds of CPU and memory, memory system has become a major performance bottIeneck in modern computer systems. Java has a poten- tial to stress the underlying memory system further because of its automat ic memory management and the accompany- ing garbage collection (GC). Typically, Java applications al- locate a substantial amount of objects in a heap memory. Since the size of heap memory is limited, it is quickly ex- hausted and a garbage collector is invoked to reclaim mem- ory allocated to objects tha t will not be used again. De- pending on the characteristics of the application and the available heap size, Java applications can spend consider- able t ime on garbage collection. The applicat ion's cache and virtual memory performance will be also affected by the heap size. This paper examines the memory system be- havior of Java programs focusing on the various factors tha t affect the memory system performance under the different heap memory configurations.
Java programs can be executed either by a virtual ma- chine interpreter or by a Just- In-Time (JIT) compiler. Al- ternatively, they can be t ransla ted into native codes by tra- ditional ahead-of-time compilers. In this paper, however, we only consider Java programs executed with a J IT com- piler for the following reasons. First , the interpreter turns an applicat ion's instruction reference stream into da ta ref- erence stream, which makes it hard to s tudy the applica- t ion's original da t a reference behavior. I t is also noted in [17] tha t application-specific behavior is overwhelmed by the performance of the interpreter itself if the application is interpreted. Second, a J IT compiler promises some signif- icant speedup and there is no argument tha t J IT compilers help [21]. For the benchmark programs studied in this pa- per, running them with a J IT compiler was faster than with an interpreter by 1.7 to 14.3 times. Finally, using a J IT compiler is a more general way to run the Java programs, because the J IT compiler is already becoming an integral par t of the Java Virtual Machine (JVM).
In spite of the wide acceptance of J IT compilers as a mechanism to run the Java applications, the characteristics of JIT-compiled Java programs has not been investigated thoroughly. We think the main reason is due to the lack of suitable ins t rumentat ion methodology for JIT-compiled
264

Table 1: The general characteristics of SPECjvm98 benchmarks. [ COMPRESS JESS DB JAVAC MTRT [ JACK
classes loaded (user/ total) 27 / 87 1 5 4 / 219 156 / 220 40 / 102 methods called (x 10 a) bytecodes executed (× 10 ~) Number of objects allocated Average object size (Byte) Heapmin (MB) Heapm~ (MB)
225,961 12,474,021
7,446 14,823
15 106
101,884 1,820,852 8,131,609
40
308
18 / 81 114,282
3,700,062 3,262,899
31 12 98
89,887 1,953,961 6,244,896
i 36 12
217
280,340 2,122,522 6,695,116
25
161
67 / 131 43,795
2,996,618 6,955,528
31
203
programs. The existing trace-driven simulators, such as ATOM [18] or EEL [12], rely on static code annotations inserted to the target program at the object or the binary level. However, when a J IT compiler is present, it takes the Java bytecodes and compiles them into native codes at run time. Because the actual executable codes are generated dy- namically, the approaches based on stat ic instrumentat ion fail to handle them. Instead, we use an exception-based approach that can trace virtually every instruction without any instrumentat ion to Java programs or the J IT compiler.
The rest of the paper is organized as follows. Section 2 summarizes the related work and Section 3 presents our evaluation methodology including descriptions of the bench- mark programs and the exception-based tracing tool called JTRACE. In section 4, we analyze the cache performance, the behavior of objects, and the performance impact of garbage collection and heap size. We conclude in section 5.
2. R E L A T E D W O R K Romer et al. [17] and Hsieh et al. [8] evaluate the perfor- mance of Java programs, but their studies are limited to the interpreted Java programs and/or stat ic executable images generated by a bytecode to native code translator. Radhakr- ishnan et al. [15] compare the characteristics of both the J IT and the interpreter and their interaction with the ar- chitectural features such as the cache and branch prediction hardware. None of the previous studies, however, examined the behavior of Java objects and its implication on the cache performance, nor did they analyze the performance impact of garbage collection and heap size.
The impact of garbage collection has been studied mainly for functional languages such as Lisp [22], Scheme [16] or Standard ML [6; 3]. Some observations from functional pro- grams can be applicable to Java programs. However, all the run-time systems of functional languages employ a sort of generational garbage collectors, while the Sun's s tandard implementation of JDK 1.1 uses a simple mark-and-sweep garbage collector. In addition, there is no notion of native methods in functional languages. Due to these differences, it is hard to draw any conclusion for Java programs from the results of functional programs.
3. M E T H O D O L O G Y
3.1 B e n c h m a r k s We use SPECjvm98 [19] as our benchmark programs. The SPECjvm98 benchmark suite is the result of an effort to defiiae an industry s tandard benchmark for Java programs. Most applications are derived from real applications and de- signed to evaluate the performance of both hardware and software aspects of the JVM. Among eight applications in
SPECjvm98, we exclude _200_cheek, which i s a synthetic benchmark to check various features of the JVM and the Java language. . . 222_mpegaud io is found to use a very small amount of heap memory (less than 1MB), and thus it is not s tudied either. We now briefly describe the structures and input da ta of benchmark programs used in this paper 1.
_201_compress COMPRESS is a Java port of the 129.corn- p r e s s benchmark from SPEC CPU95. The benchmark compresses and decompresses each input file in mem- ory using two buffers whose sizes are equal to the input file size. I t makes five loops over five input files, hence handles 25 files.
_202_jess JESS is the Java Exper t Shell System based on NASA's CLIPS system. The benchmark solves a word puzzle and 14 number puzzles. For the number puz- zles, each t ime it asserts a new set of facts represent- ing the same puzzle but With different literals. Thus, the inference engine must search through progressively larger rule sets as execution proceeds.
_209_db DB emulates multiple database operations on mem- ory resident database. The database is normally ac- cessed via an index structure, where the references to database records are sorted based on a certain field. Each database record consists of 8 fields.
_213_javac 3AVAC is a Java compiler from the JDK 1.0.2. The same Java source file is compiled four times.
_227_rntr t MTRT is a mul t i threaded raytracer that works on a scene depicting a dinosaur. The main thread forks two threads and each thread is responsible for generating rendering results to the left or the right half of the output canvas.
_228_jack JACK is a Java parser generator tha t is based on the Purdue Compiler Construction Tool Set (PCCTS). The input file contains instructions for the generation of JACK itself, and is fed to JACK 17 times.
In the experiments, we ran the above benchmarks as stand-alone applications rather than as applets, using IBM JDK 1.1.6 with a J IT compiler on an AIX platform. To minimize nondeterminist ic behavior of Java programs across multiple runs, we turn off the asynchronous garbage collec- tor. Also, all the synchronous garbage collection calls in the benchmarks are disabled so tha t the garbage collector is in- voked only if there is not enough space in the heap memory.
1Three different da ta set sizes are available for each bench- mark, but we always used full scale benchmarks by specify- ing - s l 0 0 at the command line.
265

Table 1 shows the general characteristics of benchmark pro- grams including the number of objects allocated, dynamic bytecode counts, and the average object size. In table 1, H e a p ~ denotes the minimum heap size that should be provided to run the application, while Heapma~ means the heap size that the application begins to have no garbage col- lection. In contrast to the Sun's standard implementation, IBM JDK uses an enhanced object layout to improve the performance of the JVM. In the new object layout, handles axe removed, and each object has two-word header instead of a handle. Therefore, the average object size in table 1 includes 12 bytes of the space overhead; two words for a header and one word for heap maintenance [20]. We can see that most objects are very small except for COMPRESS, where a small number of large buffers increase the average object size.
3.2 Tracing tool To collect memory reference traces of Java programs, we have built an exception-based tracing tool called JTRACE. Some implementations of PowerPC architecture have a built- in capability to generate a trace exception whenever a single instruction is successfully completed, by turning on a special flag in MSR (Machine Status Register) [10]. The main ad- vantage of the exception-based approach is that it is possible to trace virtually every instruction including system activity without any modification to executable images. Moreover, no instrumentation to Java programs or a JIT compiler is required to trace dynamic codes generated by the JIT com- piler.
The type of instruction and the effective address of an operand for a load or a store instruction are available to the exception handler. The exception handler can save this information into a trace buffer for future analysis. There is, however, one serious restriction when we use trace excep- tions; normally operating system requires that the exception handler should not cause any page fault [9]. In other words, all the codes and data structures used by the exception han- dler should be pinned. This means that the amount of traces we can capture is essentially limited by the amount of phys- ical memory of the machine on which traces are collected.
To overcome this problem, JTRACE dynamically controls the execution of the workload process. JTRACE consists of three components as shown in figure 1; (1) a kernel exten- sion, (2) JTRACE process, and (3) a backend process. The kernel extension contains the exception handler, system call routines and control information shared by all the compo- nents. Initially, JTRACE reserves a small portion of physical memory as a trace buffer and forks two processes, a target workload (Java) process and a backend process. And then JTRACE itself becomes idle waiting for the completion of the workload process.
Only the tracing flag of the workload process is enabled when it is created by JTRACE. As soon as the workload process starts its execution, it generates a trace exception for each instruction. If the current instruction is either a load or a store, the exception handler places the corresponding data address on the trace buffer. JTRACE also provides the workload process with several system calls. These system calls can be used to turn on or off the tracing selectively, or to insert special tracing records into £he trace buffer, in case the source code of the workload is available.
When the exception handler detects the trace buffer is
trace bt
trace records
backend WOrKIOEIO uava) process Jtrece process
Figure 1: The organization of JTRACE.
near full, it sends a signal to the backend process, which was sleeping till then. To avoid the buffer overrun, the backend process first suspends the execution of the workload using a standard UNIX signal (SIGSTOP). It is a responsibility of the backend to consume the trace records in the buffer, either by running a trace-driven simulator on-the-fly or by storing them into a file. Eventually, the state of the trace buffer is reset t o be empty and the execution of the work- load is resumed for another set of tracing records. This re- peats until the workload finishes its execution, in which case JTRACE wakes up and asks the backend to finalize the cur- rent tracing. By reusing the small trace buffer in this way, we are able to trace long-running applications regardless of the l~hysical memory size.
Because the tracing significantly slows down the execu- tion of the workload, a special care has been taken so that the workload receives roughly the same number of clock in- terrupts during its scheduling quantum. This is done by compensating timing related registers according to the ac- tual number of instructions traced. Otherwise, the tracing results will exaggerate the kernel activity due to excessive context switches.
The hardware platform used for tracing is an RS/6000 model 7043-140 running IBM AIX 4.3.2, with 332MHz Pow- erPC 604e microprocessor and 768MB of main memory. The slowdown factor of tracing is about 100 to 200, with the backend simulating a stack algorithm (described in the next section). The size of the trace buffer was generally indepen- dent of the tracing speed and a small trace buffer (64MB - 128MB) worked quite well.
3.3 Evaluation methodology Several clifferent backends are used to study, various aspects of Java programs. For cache performance, we have con- structed a backend Simulating the stack algorithm [5] that can generate miss ratios for different sizes of fully-associative caches in one pass. Our implementation of the stack sim- ulation algorithm is based on [11], where the algorithm is
266

compress (Fully essociative, 32B fine size)
1....- : : , ................................................... ~<>~ ?:::~o-,:~,<>~-.. I ",. - . i t .- GC (16Me) -J/li-,ovo~4141 B ] .................. ~::: ............................. ::¢~:: ae (~M~)'"==e=:'~,i~. ~%~ ....
] . . . . . . . . . . . . . . . . . . . . . . . . . ::~'~ ~" ~ " - . . .e . ; ; . ' : .~ ' . G C (48MB) d.4-- Overall (4~4~) .... ,o-I . . . . . . . . . . . "" * - : "GC "~,4 M,~) - - t ~ C~erall (64MB)
i l , , . : - l ~ Overall (INF) /
IX ~K 4K aK L~K Z~K MK I~K ~6K SI2K fM c a c h e size
javac (Ful ly associat ive, 32B l ine s ize)
jess (Ful ly associative, 32B l ine size)
IK 2K 4K ~K 16K }~K ~ INK ~6K $12K IM cache size
mtr l (Ful ly associative, 32B line size)
db (Ful ly associative, 32B l ine size)
........................................................... e..~C.~DEE)..... ~ ,O'Jerall ~.DEE) ...... -*~.- GC (16MB) --N-- Overall (16Me)
........ • ~- ............................................. +-- GC .(48M8)..--+-- Overatl (4~MB) ....
I* . ~ .-- i -" ~C 64Me ~ Overall (64MB) . . . . . . . . . . . . . . . . . . . . ~ Ov~.!,N~ .
' . i
ix 2x 4K sx ,sx ~2x ~x L~K ~ SIlK IM Cache size
Jack (Fully ~ l a t l v e , 32B line size)
. . . . . . . . e,, GC (DEF) - -Q- Or•rai l (DEF) .. I~.- GC ( leMB) ~ Overall (16MB)
• . . ~ - G¢ (~2MB) ' - . 0 - Ova'aft (32MB) ...................................... - p . OG .~48MB) . . . . .~ Ovorall (48MB) .... . . . . . . . . . . . . . . . . . . . . . . . . . . . . . . . . . . . . • " ~':..G~ (~.MB) ... =~::: ~ r ~ ! ! ~ u s )
........ = ~ z ~ v e ~ (,N~i ....
• " * " ' t ' " ' " ' * ' " - ' 4 1
ix 2K 4K 3K i~K ]2X ~ i ~ ~eK 512K IM IK 2K 4K IK lAX J ~ MK I~X ~ 51~ IM IK ~ 4K IX 16K 32K ~ I~g ~ K 5IlK IM Cache size Cache size Cache size
Figure 2: Data cache miss ratios with different heap configurations. DEF and INF correspond to the default and the infinite heap configuration, respectively.
accelerated by considering cache sizes that are powers of 2 only. For comparison, direct-mapped and set-associative caches are simulated using another backend built from a conventional cache simulator, diner• IV [4]. We use a fixed line size of 32 bytes for the cache simulation.
Additionally, we instrument the JVM so tha t it malces system calls before and after garbage collection, which noti- fies the exception handler if the Java program is in the mid- dle of garbage collection. This enables us to count the exact number of instructions, da ta references, and cache misses that took place during garbage collection. We find out tha t the percentage of system activity is small in most applica- tions, and only user da ta references are used in this paper.
We are also interested in the memory system behavior of Java programs at the object level. Memory reference traces alone, however, do not carry any information on the ob- jects. To collect object-level statistics, we modify the JVM to produce a file which contains the s tar t address and the size of each object by traversing the entire heap memory at the end of the execution. During tracing, a backend simply keeps track of the number of references and the first and the last reference for each 8-byte heap memory block 2. When the backend receives a finalization signal from JTRACE, it identifies which memory blocks belong to the same object by reading through the file generated by the JVM. Then, the backend merges the statistics for those memory blocks and converts it into that of the object. The first and the last reference are t imestamped with the number of total mem- ory references (including non-heap references) instead of the actual time. Also, for this measurement, we provide enough heap space (320MB) to prevent objects from being moved or reclaimed by the garbage collector.
2This is an allocation unit used for heap memory in JDK 1.1.6.
Finally, we quanti tat ively analyze the impact of garbage collection on the performance of Java programs. We take into account the instruction overhead of garbage collection, cache performance, and virtual memory performance caused by TLB misses a~d page faults. TLB misses and the number of page faults are obtained in the same way as cache misses by setting the line size to 4KB. An LRU policy is assumed for page replacements.
The JVM has two run-t ime flags, "-ms" and "-tax", which specify the initial and the maximum size of heap mem- ory. On JDK 1.1.6 for AIX, default values for these flags are 1MB and 32MB, respectively. We consider the follow- ing six heap configurations in this paper; default (-mslM -mx32M), 16MB (-msl6M -mxl6M), 32MB (-ms32M -mx32M), 48MB (-ms48M -mx48M), 64MB (-ms64M -mx64M), and in- finite (-ms320M -rax320M). Wi th the infinite heap configu- ration, no benchmark has any garbage collection, because we provide 320MB of heap memory, which is larger than Heapma~ values in table 1.
4. ANALYSIS We analyze the various memory system behavior of Java pro- grams using memory reference traces collected by ../TRACE. First , we s tudy the cache performance of Java programs in- cluding temporal locality and the effects of cache associativ- ity. Second, we investigate the behavior of objects and their lifetime characteristics. Finally, the instruction overhead of garbage collection and the performance impact of heap size are studied.
4.1 Cache performance T e m p o r a l loca l i ty . Figure 2 displays the fully-associative da ta cache miss ratios of SPECjvm98 applications under different heap configurations, where the miss ratios during
267

compress (32MB heap, 32B line size) jess (32MB heap, 32B line size) db (32MB heap, 32B l ine dzo)
4K IK 16K 32K MK iNK ~ K 512K tM Cache =ize
javac (32MB heap, 32B line size)
L
J
iK ~ 4K ~ L~K 32l~ ~l¢ I=~K ~ K 512~ ~H 4K ~ ~K 32K ~K L~K ~ ~,~ Cache ~ze Cache ~zo
mt~ (32MB heap, 32B l ine size) jack (32MB heap, 32B line size)
4K ~ , ~ x ~2K ~ K t ~ K ~ K 5LZK IM IK 2K 4K ~ , ~ ~2K ~ K I N K ~ K ~=2K IM IK 2X * ~ RK , 6 ~ J ~ ~ X I ~ ~ a ~ ~L2K
Cache =ze Cache dze Cache aiza
Figure 3: Effects of the cache associativity (with 32MB of heap memory).
garbage collection are separately plot ted in dot ted lines (la- beled as GC).
First, we observe tha t the miss ratios during garbage col- lection axe generally higher than the overall miss ratios and appear to be insensitive to the cache sizes. This is likely because the garbage collector should sweep through the en- tire heap memory and its working set size will be connected to the total heap size. However, the garbage collector shows the first working set at near 2KB in most applications which is independent of the heap size. Since the garbage collector suffers from higher cache miss ratios than the application itself, all the SPECjvm98 applications studied in this pa- per show the lowest cache miss ratios with the infinite heap configuration, where the applications do not experience any garbage collection (marked as diamonds with a solid line in figure 2).
As observed in. [16], the garbage collector imposes both direct and indirect costs on the overall performance. Di- rectly, the garbage collector itself executes its own instruc- tions and causes cache misses. Indirectly, it interferes with the application's temporal locality, making the application suffer from cache misses right after the garbage collection. In addition, the garbage collector can move objects, which may improve (or degrade) the application's locality. Indirect costs of garbage collection are, however, found to be negligi- ble; if we exclude da ta references issued by the collector, all the applications show the same curves as with the infinite heap, regardless of the heap size used. This means tha t the differences in overall cache miss ratios mostly result from the cache misses occurred in garbage collection. Since the variations in the miss ratios during garbage collection are small across different heap sizes, usually it is the percentage of the garbage collector's da ta references tha t determines how much the ow;rall miss ratios are affected. For example, in the default heap configuration, 37.3% of da ta references are from the garbage collector in JAVAC, while 10.8% in DB.
Hence, the overall miss ratio of JAVAC is more affected com- pared to DB. We will see in section 4.3 tha t the overhead of garbage collection is decreasing as we increase the heap size. Therefore, the curves of overall miss ratios approach toward tha t of the infinite heap with the increased heap size.
Note tha t JESS and JACK exhibit noticeably lower miss ra- tios during garbage collection with the default heap config- uration. This is because, under the default heap configura- tion, the JVM uses less than 2MB of heap memory for these applications, which improves the garbage collector's locality. In spite of the improvement, the actual miss ratios are still worst with the default heap configuration for JESS and JACK, since the garbage collector is more frequently invoked due to the small heap size (cf. section 4.3). The large miss ra- tios in garbage collection for COMPRESS are not meaningful, because the absolute number of cache misses is very small. In COMPRESS, the garbage collector only accounts for 0.3% (with the default heap size) or less than 0.04% (otherwise) of total da t a references. The impact of garbage collection will be discussed in more detail in section 4.3. P e r f o r m a n c e o n d i r e c t - m a p p e d a n d s e t - a s s o c l a t i v e caches . The results presented in figure 2 are the miss ra- tios for fully-associative caches obtained via the stack simu- lation. We now consider more realistic caches such as direct- mapped and set-associative (2-way and 4-way) caches.
Figure 3 shows tha t the miss ratios during garbage col- lection are finally converged to the same level, no mat ter which cache associativity is used. In fully-associative caches, the garbage collector has about 2KB (64 cache entries) of the working set size in most applications (cf. figure 2). I t appears tha t this small number of memory blocks causes many conflicts when the cache size is small, especially in the d i rec t -mapped caches. As the cache size increases, these blocks are more evenly dis t r ibuted over the entire cache, and the conflict misses become insignificant.
Looking at the overall miss ratios in figure 3, 2-way set-
268

! t
t | !
Ttm eratm m | ' r t m ~ m | T t m ~
Figure 4: Changes in the number and the space of objects which last more than 1 million references.
associative caches perform very well under practical cache sizes; 2-way set-associative caches lead to a large improve- ment over direct-mapped caches, while the additional advan- tages of 4-way set-associative caches are small. The similar observation has been reported for several SPEC95 bench- marks [2] and for standard ML programs [6].
4.2 The behavior of objects We define an object is live with respect to the memory ref- erence, if it is being actively referenced by the application. We call an object long-lived (short-lived), if it is live for a relatively long (short) time. On the other hand, we define an object is reachable, if it is accessible by following object links from the root set. The root set usually includes the lo- cal variables in run-time stacks and static variables defined in loaded classes. We will call an object long-resident, if it is reachable for a relatively long time, to distinguish it from a long-lived object. In this section, we analyze the char- acteristics of live objects and its implication on the cache performance. The reachable objects are more important to understand and model the cost of garbage collection, and will be discussed in section 4.3. T h e b e h a v i o r of l ive ob jec t s . As mentioned in sec- tion 3.3, we timestamp the first and the last reference to an object with the number of total data references made up to that point. Assume that the first reference to an object is made at the t l - th data reference and the last one at the t2-th data reference. According to our definition, the object is live from tl to t2 and the lifetime of the object is the du- ration that it remains live, i.e., t2 - tl . If an object is not referenced anymore, it is not visible to the memory system and we consider the object is dead even though it is still occupying a heap space.
Figure 4 plots the changes of live objects and their sizes, as each program executes. To reduce the number of data points, every 1 million references are grouped together and we exclude the objects whose lifetimes are less than 1 rail-
lion references. The upper solid line in figure 4 represents the cumulative percentage of objects which come into ex- istence, while the lower dotted line denotes the cumulative percentage of dead objects. These lines are associated with the right-hand scale. The difference between two lines is the percentage of live objects and the gray region indicates the size of heap memory occupied by the live objects.
The repeated patterns of COMPRESS, JAVAC, and JACK clearly demonstrate the benchmarks' loop structures over the same input data. In COMPRESS, most of live spaces come from two buffers allocated for each input file, while the com- pression phase uses some additional tables. The number of live objects is roughly constant and only 12 - 15 objects are newly created and destroyed for each (de)compression phase. For JESS, the first peak is for the word puzzle, and the remaining 14 peaks for the number puzzles. Because the older sets are not retracted during the number puzzles, the number of live objects are slightly increasing and it takes longer to solve the same puzzle. However, the amount of ob- jects kept across the iterations is quite small. In DB, there are several points that many objects suddenly die, which is due to the ceased access to a certain database field. For example, the size of live objects drops quickly around the 870 millionth reference when the benchmark sorts database records on the second field. All the objects that store the second field of database records become dead, since the field is not used anymore after this sort operation. The live spaces are gradually decreasing in MTRT, probably because some of scene data are not referenced as the rendering proceeds. We note that, unlike other benchmarks, most of live objects are allocated at the very beginning in DB and MTRT.
Our measurements show that the size of live objects re- mains very small compared to the total heap memory al- located. For instance, JACK demands about 14MB of heap memory up to the 200 millionth reference, but only less than 0.7MB are used for the objects which survive more than 1 million references. This suggests that Java programs gener-
269
compress
r r ~ . . . . . ]
- thlll I . . . . ! ,~ Llfel l~ (rr/ANon f e r a l L.eOme (r~nk~ ~renr~)
db i ~ z
z~.~ ....................................................................................................... 1.1"~
rr
/ / i i i ii i/i/iiiii iiiiiii i///i/ii/i/i iii i i Ill
U~e {Akin refiNt, r ~ )
l
~,vae
t.iletJme (milan relm~,ces)
i!: ,!
!
Lifetl~ (n'4)~n r e f ~ )
Jack
I! liiiiiiiiiiiiiii!iiiiiiiiiiii!iiiiiiiiiii!iii!iiiiiiiiiiiiiiiiiii ii : ..... i'l
LI~U~ (million mferwm}
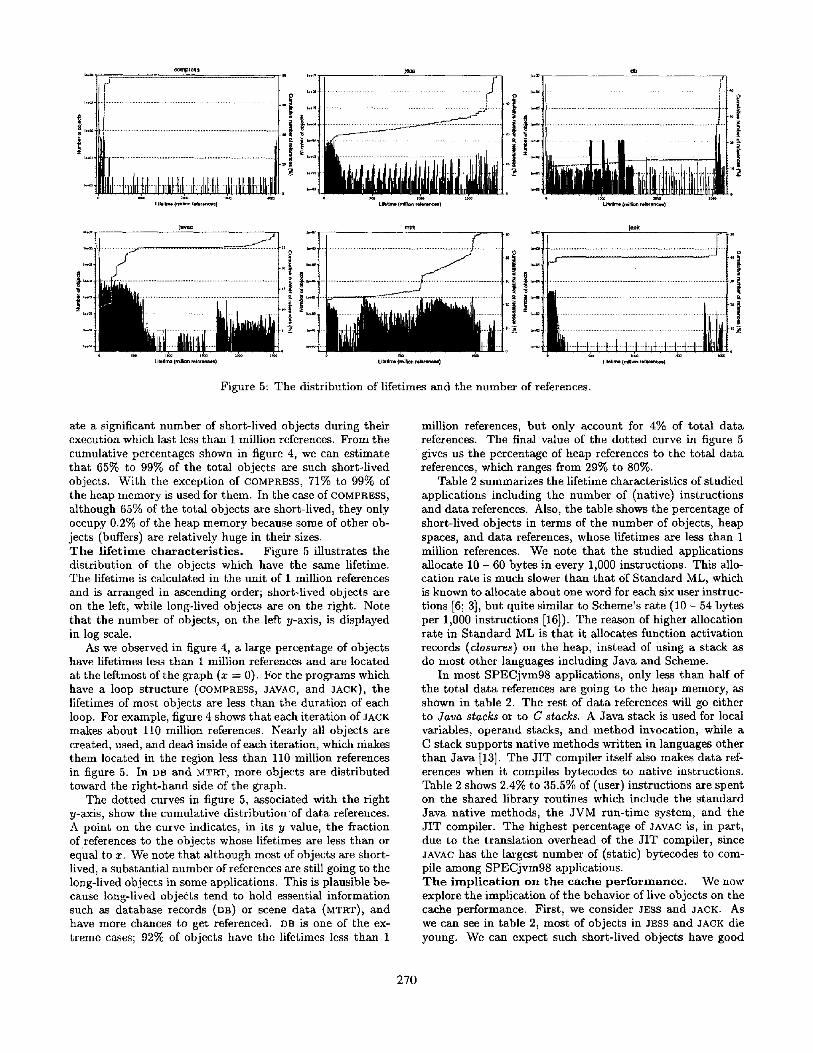
Figure 5: The distribution of lifetimes and the number of references.
ate a significant number of short-lived objects during their execution which last less than 1 million references. From the cumulative percentages shown in figure 4, we can estimate that 65% to 99% of the total objects are such short-lived objects. With the exception of COMPRESS, 71% to 99% of the heap memory is used for them. In the case of COMPRESS, although 65% of the total objects are short-lived, they only occupy 0.2% of the heap memory because some of other ob- jects (buffers) are; relatively huge in their sizes. T h e l i fe t ime cha rac t e r i s t i c s . Figure 5 illustrates the distribution of the objects which have the same lifetime. The lifetime is calculated in the unit of 1 million references and is arranged in ascending order; short-lived objects are on the left, while long-lived objects are on the right. Note that the number of objects, on the left y-axis, is displayed in log scale.
As we observed in figure 4, a large percentage of objects have lifetimes less than 1 million references and are located at the leftmost of the graph (x = 0). For the programs which have a loop structure (COMPRESS, JAVAC, and JACK), the lifetimes of most objects are less than the duration of each loop. For example, figure 4 shows that each iteration of JACK makes about 110 million references. Nearly all objects are created, used, and dead inside of each iteration, which makes them located in the region less than 110 million references in figure 5. In DB and MTRT, more objects are distributed toward the right-hand side of the graph.
The dotted curves in figure 5, associated with the right y-axis, show the cumulative distribution of data references. A point on the curve indicates, in its y value, the fraction of references to the objects whose lifetimes are less than or equal to x. We note that although most of objects are short- lived, a substantial number of references are still going to the long-lived objects in some applications. This is plausible be- cause long-lived objects tend to hold essential information such as database records (o13) or scene data (MTRT), and have more chances to get referenced. DB is one of the ex- treme cases; 92°£ of objects have the lifetimes less than 1
million references, but only account for 4% of total data references. The final value of the dotted curve in figure 5 gives us the percentage of heap references to the total data references, which ranges from 29% to 80%.
Table 2 summarizes the lifetime characteristics of studied applications including the number of (native) instructions and data references. Also, the table shows the percentage of short-lived objects in terms of the number of objects, heap spaces, and data references, whose lifetimes are less than 1 million references. We note that the studied applications allocate 10 - 60 bytes in every 1,000 instructions. This allo- cation rate is much slower than that of Standard ML, which is known to allocate about one word for each six user instruc- tions [6; 3], but quite similar to Scheme's rate (10 - 54 bytes per 1,000 instructions [16]). The reason of higher allocation rate in Standard ML is that it allocates function activation records (closures) on the heap, instead of using a stack as do most other languages including Java and Scheme.
In most SPECjvm98 applications, only less than half of the total data references are going to the heap memory, as shown in table 2. The rest of data references will go either to Java stacks or to C stacks. A Java stack is used for local variables, operand stacks, and method invocation, while a C stack supports native methods writ ten in languages other than Java [13]. The JIT compiler itself also makes data ref- erences when it compiles bytecodes to native instructions. Table 2 shows 2.4% to 35.5% of (user) instructions are spent on the shared library routines which include the standard Java native methods, the JVM run-t ime system, and the JIT compiler. The highest percentage of JAVAC is, in part, due to the translation overhead of the JIT compiler, since JAVAC has the largest number of (static) bytecodes to com- pile among SPECjvm98 applications. T h e i m p l i c a t i o n o n t he cache p e r f o r m a n c e . We now explore the implication of the behavior of live objects on the cache performance. First, we consider JESS and JACK. As we can see in table 2, most of objects in JESS and JACK die young. We can expect such short-lived objects have good
270

Table 2: The dynamic statistics of SPECjvm98 benchmarks (with the infinite heap configuration). C O M P R E S S JESS DB JAVAC MTRT J A C K
11,100,907 5,327,589 9,167,372 7,716,669 3,916,519 6,552,677 Instructions executed (x 10 u) Data references (x 10 '~) 4,121,794
% heap references % instructions from shared lib. 2.41%
80.27% Heap memory allocated (KB) 107,787 Average allocation rate 10
(bytes/1000 instructions) Average lifetime (million refs.) ~ 155.6 Average number of references
per each object per cache line (32B)
Lifetime < 1 million references % objects % heap memory % heap references % total da ta references
444,366 959
64.40% 0.21%
0.0061% 0.0049%
1,797,615 21.99% 39.40% 314,533
60
113
87 70
99.19% 98.88% 37.15% 14.64%
3,211,373 13.25% 45.61% 99,927
11
129.5
449 458
92.33% 71.15%
4.14% 1.89%
2,515,695 35.53% 28.71% 221,206
29
55.2
116 102
66.20% 68.64% 26.47%
7.60%
1,129,016 14.92% 50.97% 164,444
43
10.8
86 109
98.03% 97.60% 42.91% 21.87%
2,014,066 31.04% 50.74% 207,550
32
1.6
147 154
97.33% 95.48% 67.97% 34.48%
temporal locality, and do not cause capacity misses. How- ever, they touch more than 95% of the total heap memory and the average number of references per cache line is rel- atively small (70 in JEss and 154 in J A C K for 32-byte line size). Consequently, the short-lived objects produce a large amount of cold misses. I t is possible to reduce the num- ber of cold misses by decreasing the available heap size and reusing the same line for different objects. But in this case, the cache misses during garbage collection quickly offset the benefit of reduced cold misses, as we can see in figure 2.
JESS and JACK also have some frequently-referenced long- lived objects. Although these objects can cause capacity misses by interfering with short-lived objects, their total size is very small. Therefore, if the cache size is big enough to accommodate them, the capacity misses almost disappear. For instance, 244 objects (33KB in size) account for about 9% of da ta references in JACK, with the lifetime of around 1950 million references (cf. figure 5). Once the cache size is larger than 32KB, the miss ratio of JACK does not change, as shown in figure 2. Most of cache misses in these cache sizes result from the cold misses of short-lived objects. Similarly, in JESS, long-lived objects, whose lifetimes are more than 1690 million references, are responsible for 12% of the total references. They can fit into a 16KB cache and consti tute the first working set. Another 8% of da ta references are dis- t r ibuted over the objects with the lifetimes ranging from 140 million to 1690 million references. Wi th the caches larger than 256KB, these objects can stay in the cache and they determine the second working set of JESS, as can be seen in figure 2. In any case, the size of frequently-referenced long- lived objects is closely related to the application's working set size. Long-lived objects which are not referenced fre- quently do not contribute to the overall cache miss ratio, and can be ignored.
The same observation holds for DB, JAVAC and MTRT. However, these applications have more long-lived objects and keep a larger amount of live objects (3MB - 8MB) com- pared to JESS and JACK. Thus, even with a 1MB of cache, it is not possible to accommodate all the frequently-referenced long-lived objects and some capacity misses are inevitable. For JAVAC a n d MTRT, the most-frequently-referenced long- lived objects appear to fit into about 64KB and 256KB re-
spectively, where the applications exhibit the first working set sizes (cf. figure 2). Still, a significant number of refer- ences are made to other long-lived objects, thereby resulting in capacity misses. In DB, 33% of the total references are going to the objects that exist throughout the lifetime of the application. Their total size is larger than 1MB and this is the reason the miss ratio of DB is continuously decreasing in figure 2. Among the cache misses caused by heap refer- ences at a 512KB cache, 28% and 35% of misses are due to capacity misses for JAVAC and MTRT respectively, while the percentage for DB is 96%.
When the cache is not fully-associative, the application experiences conflict misses, which explain the differences between the miss ratios of fully-associative cache and set- associative caches in figure 3. Reinhold [16] showed that the sequential allocation scheme is natural ly suited to direct- mapped caches, because it tends to spread the objects spa- tially throughout the cache. He also noted, when most ob- jects are short-lived, they are dead by the t ime their cache lines are reused for newer dynamic objects, based on his ob- servation of garbage-collected Scheme programs. Among our benchmark programs, JESS and JACK have similar character- istics as Scheme programs in the sense tha t they have few frequently-referenced long-lived objects and tha t most ob- jects are allocated rather linearly and short-lived. However, when comparing the miss ratio curves of JESS and JACK to other Java applications in figure 3, we do not see any signif- icant benefit of d i rect -mapped caches in these applications. One possible explanation is that , unlike Scheme programs, many conflict misses are produced by the interferences from non-heap references, which are mostly to Java stacks and C stacks. As we move to 2-way set-associative caches, such conflict misses are reduced significantly.
Finally, we mention that the characteristics of COMPRESS is very different from other benchmark programs; the com- putat ion is done with the small number of large objects without creating many temporary objects. The garbage col- lection can be done quickly, hence the performance of the application is not affected by the heap size. In the perspec- tive of the memory usage patterns, we believe COMPRESS is not much different from the corresponding C version in SPEC95.
271

Table 3: The number of garbage collections and the instruction overhead (shown in parentheses). ~ JESS DB JAVAC MTRT
I )efault 687 (116.7%) 38 (16.0%) 90 (72.2%) 71 (62.6%) L6MB 21 (10.1%) 11 (5.8%) 29 (28.4%) 17 (25.7%) }2MB 10 (7.9%) 3 (2.9%) 9 (11.1%) 6 (15.7%) 18MB 6 (6.6%) 2 (2.7%) 5 (7.3%) 3 (11.6%) i4MB 4 (5.6%) 1 (1.1%) 3 (4.9%) 2 (10.4%)
JACK
301 (36.9%) 13 (5.2%)
6 (4.3%) 4 (4.3%) 3 (4.2%)
4.3 I mp ac t o f garbage col lect ion and heap size T h e i n s t r u c t i o n o v e r h e a d o f g a r b a g e co l l ec t i on . Be- fore we analyze the performance impact of garbage collection and heap size, we examine one of the direct costs of garbage collection, the instruction overhead. Note tha t our analy- sis is highly dependent on the garbage collection algorithm employed in the JVM. In this paper, we only deal with the "mark-and-sweep" collection algorithm used in IBM JDK 1.1.6.
The mark-and-sweep algorithm collects garbages in three phases. The mark phase visits and marks all reachable ob- jects start ing from a special set of object links called the root set. After the reachable objects have been identified, the remaining objects are known to be garbages and can be reused. In the sweep phase, the collector sweeps sequentially through the heap memory, adding unmarked objects to the free list of objects. Finally, the compaction phase relocates the reachable objects to eliminate dead space between them and to improve the spatial locality of objects. In the current implementation, the compaction phase may not be called if the heap memory is not fully fragmented.
Table 3 compares the number of garbage collections oc- curred with different heap configurations. The numbers in parentheses denote the ratio of the number of instructions executed for garbage collection to the number of instructions for the application itself. We exclude COMPRESS, because the overhead of garbage collection is too small. One notable thing in table 3 is tha t the garbage collector is invoked very frequently in the default heap configuration, especially for JESS and JACK. Wi th the default heap configuration, the JVM initially sets the available heap size to 1MB. The heap is increased incrementally up to 32MB if the collector fails to satisfy a new allocation request after garbage collection. For JESS and JACK, the collector does not increase the heap beyond 2MB, because the size of reachable objects is very small and the collector can still find some space after garbage collection. However, the available space after garbage collec- tion is usually less than 1MB and this small space is quickly exhausted, which leads to another garbage collection. Due to this problem, the default heap configuration results in great inefficiency, especially when the size of reachable ob- jects is small. As we can see in table 3, setting the initial heap size to at least 16MB significantly reduces the number of garbage collections. The default heap configuration may improve the cache (cf. figure 2) and the virtual memory performance because the application has smaller da ta foot- prints. The benefit is, however, easily overwhelmed by the additional costs of garbage collection.
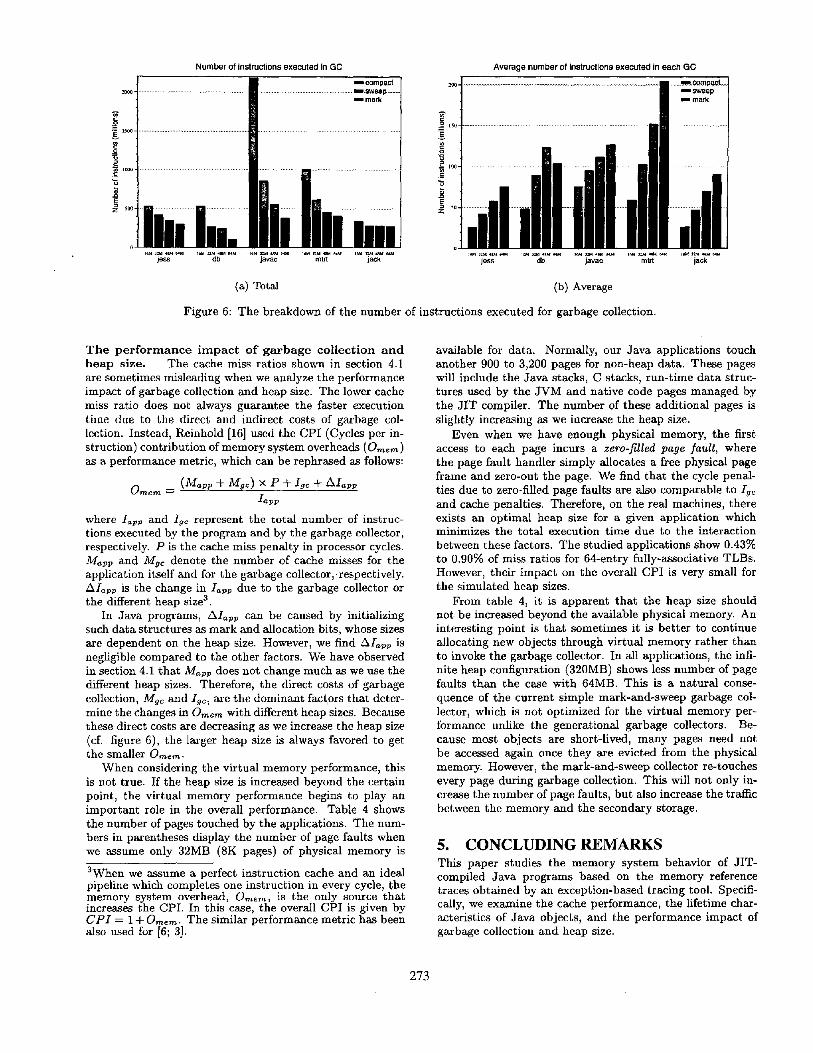
The instruction overhead of garbage collection, Igc, can be given by:
/~o = N~c x W~ = N~ × (Wma~k + W,~.~ + W ~ o ~ , )
where Nat and W~c denote the number of garbage collec-
tions (shown in table 3) and the average number of in- structions executed for each garbage collection, respectively. Wm~k, Wsw~p, and W~ompact represent the average number of instructions spent on each mark, sweep, and compaction phase. Figure 6 shows the changes in Igc (figure 6(a)) and Wgc (figure 6(b)) with different heap sizes. Even though Wgc increases with the larger heap size, the increasing rate of Wgc is slower than the decreasing rate of Ngc. Thus, Igc is always decreased as we increase the heap size.
Figure 6 also breaks down the cost of each garbage col- lection phase. The collector has to visit every reachable ob- jects during the mark phase, which makes Wmark depend on the number of reachable objects. Our measurements show the size of reachable objects remains constant or changes very regularly for s tudied applications, and this is the rea- son Wm~rk is roughly independent of the heap size for a given application in figure 6(b).
On the contrary, the cost of the sweep phase, W ~ p , is directly proport ional to the heap size. More specifically, it appears tha t W s ~ p depends on the total number of objects (the reachable objects plus garbages) in the heap memory, because the collector should check every object to see if it is marked or not. Therefore, MTRT, which has the smallest average object size (cf. table 1), spends longer t ime on the sweep phase than any other applications.
For the cost of the compaction phase, we have two trends; for DB and MTRT, the total cost of the compaction phase (Ngc x Wcompa~t) is roughly constant, while the average cost (W~ompa~t) is constant for JESS, JAVAC, and JACK. We have observed in figure 4 tha t most of long-resident objects in DB and MTRT are created at the beginning of the execu- tion. Once the long-resident objects are compacted, they do not have to be compacted again in the subsequent garbage collections, which makes the to ta l cost of the compaction phase constant. Other applications, however, have a loop structure, in which new objects are generated and replace the current reachable objects. Therefore, the garbage col- lector finds uncompacted reachable objects every t ime it is invoked. Since the size of reachable objects does not change much, the average cost of each compaction phase is constant. Note tha t in DB with 64MB of heap memory, the garbage collector skipped the compaction phase because it thought the heap was not fragmented yet.
Overall, the decrease in Igc with the larger heap size is mainly due to the decrease in the cost of the mark phase (Ngc x Wmark) and sometimes in the cost of the compaction phase (Ngc × Wco~p~ct). When the size of reachable objects is very small, the garbage collector spends most of its t ime on the sweep phase, as can be seen in JESS and JACK. While the results presented in this 'section are obtained by turning off the asynchronous garbage collector, we have verified tha t the results with the asynchronous garbage collector are also similar.
272
Number of instructions executed in GC
[ ] --compact I 2ooo-1 .................................................................... [ ] ........................................................... ,lsweep........I
1 i - -
i i ° ~ -
o
jess db javac rntrt jack
Average number of instructions executed in each GC
jess javac mtrt jack
(a) Total (b) Average
Figure 6: The breakdown of the number of instructions executed for garbage collection.
T h e p e r f o r m a n c e i m p a c t o f g a r b a g e c o l l e c t i o n a n d h e a p size. The cache miss ratios shown in section 4.1 axe sometimes misleading when we analyze the performance impact of garbage collection and heap size. The lower cache miss ratio does not always guarantee the faster execution time due to the direct and indirect costs of garbage col- lection. Instead, Reinhold [16] used the CPI (Cycles per in- struction) contribution of memory system overheads (Om~m) as a performance metric, which can be rephrased as follows:
Om,m = (M~pp + Mgc) × P + Igc + AIapp Iapp
where Iapp and Iac represent the total number of instruc- tions executed by the program and by the garbage collector, respectively. P is the cache miss penalty in processor cycles. Mapp and Mgc denote the number of cache misses for the application itself and for the garbage collector,respectively. Al~pp is the change in lapp due to the garbage collector or the different heap size 3.
In Java programs, Alapp can be caused by initializing such data structures as mark and allocation bits, whose sizes are dependent on the heap size. However, we find AI~pp is negligible compared to the other factors. We have observed in section 4.1 that Mapp does not change much as we use the different heap sizes. Therefore, the direct costs of garbage collection, Mac and lac , are the dominant factors that deter- mine the changes in Omem with different heap sizes. Because these direct costs are decreasing as we increase the heap size (cf. figure 6), the larger heap size is always favored to get the smaller O~e~.
When considering the virtual memory performance, this is not true. If the heap size is increased beyond the certain point, the virtual memory performance begins to play an important role in the overall performance. Table 4 shows the number of pages touched by the applications. The num- bers in parentheses display the number of page faults when we assume only 32MB (8K pages) of physical memory is
3When we assume a perfect instruction cache and an ideal pipeline which completes one instruction in every cycle, the memory system overhead, O,,em, is the only source tha t increases the CPI. In this case, the overall CPI is given by C P I = 1 + Om~m. The similar performance metric has been also used for [6; 3].
available for data. Normally, our Java applications touch another 900 to 3,200 pages for non-heap data. These pages will include the Java stacks, C stacks, run-t ime da ta struc- tures used by the JVM and native code pages managed by the J IT compiler. The number of these addit ional pages is slightly increasing as we increase the heap size.
Even when we have enough physical memory, the first access to each page incurs a zero-filled page fault, where the page fault handler simply allocates a free physical page frame and zero-out the page. We find that the cycle penal- ties due to zero-filled page faults are also comparable to Ig¢ and cache penalties. Therefore, on the real machines, there exists an opt imal heap size for a given application which minimizes the total execution t ime due to the interaction between these factors. The studied applications show 0.43% to 0.90% of miss ratios for 64-entry fully-associative TLBs. However, their impact on the overall CPI is very small for the simulated heap sizes.
From table 4, it is apparent tha t the heap size should not be increased beyond the available physical memory. An interesting point is that sometimes it is bet ter to continue allocating new objects through virtual memory rather than to invoke the garbage collector. In all applications, the infi- nite heap configuration (320MB) shows less number of page faults than the case with 64MB. This is a natural conse- quence of the current simple mark-and-sweep garbage col- lector, which is not optimized for the virtual memory per- formance unlike the generational garbage collectors. Be- cause most objects are short=lived, many pages need not be accessed again once they are evicted from the physical memory. However, the mark-and-sweep collector re-touches every page during garbage collection. This will not only in- crease the number of page faults, but also increase the traffic between the memory and the secondary storage.
5. CONCLUDING REMARKS This paper studies the memory system behavior of JIT- compiled Java programs based on the memory reference traces obtained by an exception-based tracing tool. Specifi- cally, we examine the cache performance, the lifetime char- acteristics of Java objects, and the performance impact of gaxbage collection and heap size.
273

Table 4: The number of pages touched by the SPECjvm98 applications and the number of page faults when we assume only 32MB of physical memory is available for data (shown in parentheses).
Default 1541 (0) 16MB 5284 (0) 32MB 9572 (58403) 48MB 13860 (95130) 64MS 18148 (118464)
320MB 83484 (85103)
JESS DB JAVAC MTRT I JACK
3804 (0) 4995 (0) 9282 (18832)
13570 (39015) 17858 (37664) 29557 (30253)
5538 (0) 6533 (0)
10823 (69110) 15110 (156946) 19399 (115102) 61400 (79404)
5421 (0) 6818 (0)
11047 (56939) 15334 (83164) 19622 (82613) 47431 (51128)
1626 (0) 5381 (0) 9669 (47361)
13956 (87869) 18245 (94305) 56820 (57988)
All the SPECjvm98 applications studied in this paper show the lowest data miss ratios with the infinite heap con- figuration. This is because the garbage collector suffers from higher cache misses and tends to inflate the overall cache miss ratios. Additionally, we find that going beyond 2-way cache associativity improves the cache miss ratio marginally. We also observe that Java programs generate a substantial amount of short-lived objects, but in general, the size of frequently-referenced long-lived objects is closely related to the application's working set size and is critical to the cache performance. Finally, the direct costs of the garbage collec- tion are the dominant factors that affect the overall perfor- mance with different heap sizes. These costs are decreasing as we increase the heap size, but the optimal heap size which minimizes the total execution time can be determined by considering cache performance, the instruction overhead of garbage collection, and the virtual memory performance.
Since the SPECjvm98 benchmark suite can not be a sin- gle representative of all the Java programs and Java is an evolving language mad environment, the characterization of Java programs should be an on-going effort. In this paper, we only studied the mark-and-sweep garbage collector, orig- inally come from the Sun's standard implementation of JDK 1.1. Recently, Sun has announced the HotSpot technology (JDK 1.2), which employs an improved generational copying collector. Therefore, it is necessary to compare and contrast the performance of these garbage collectors. In addition, since most of our benchmark programs are single-threaded, the characteristics of multithreaded Java programs needs to be investigated further to completely understand the behav- ior of Java programs. We believe the methodology used in this paper is directly applicable to other Java applications and environments, and we plan to continue our study of characterizing Java programs.
6. A C K N O W L E D G M E N T S The authors would like to thank Luc Smolders and Patrick Bohrer in IBM Austin, whose helps were essential to the development of the tracing tool described in this paper.
7. R E F E R E N C E S [1] L. A. Barroso, K. Gharachorloo, and E. Bugnion. Memory
system characterization of commercial workloads. In ISCA- 25, pages 3-14, 1998.
[2] S. Dasgupta and. E. Servan-Schreiber. Cache behavior of the SPEC95 benchmark suite. University of California at Berke- ley, hZtp ://ht'ep. cs. berkeley, edu/'dasgupta, 1996.
[3] A. Diwan, D. Tarditi, and E. Moss. Memory-system per- formance of programs with intensive heap allocation. ACM Trans. on Computer Systems, 13(3):244-273, Aug. 1995.
[4] J. Edler and M. D. Hill. Dinero IV trace-driven unipro- cessor cache simulator, ht't:p://www.neci.nj .nee.corn/ homepages/edler/d4/, 1998.
[5] J. Gecsei, D. R. Slutz, and I. L. Traiger. Evaluation techniques for storage hierarchies. IBM Systems Journal, 9(2):78-117, 1970.
[6] M. J. R. Gon~alves and A. W. Appel. Cache performance of fast-allocating programs. In Proc. of the ACM Conf. on Functional Programming Languages and Computer Archi- tecture, pages 293-305, 1995.
[7] J. Gosling, B. Joy, and G. Steele. The Java Language Spec- ification. Addison-Wesley, 1996.
[8] C.-H. Hsieh, M. T. Conte, T. L. Johnson, J. C. Gyllenhall, and W. W. Hwu. A study of the cache and branch perfor- mance issues with running Java on current hardware plat- forms. In Proc. of IEEE Compcon, pages 211-216, 1997.
[9] IBM Corp. AIX Version ~.3 Kernel Extensions and Device Support Programming Concepts. 1998.
[10] IBM Corp. PowerPC 604e RISC Microprocessor User's Manual. 1998.
[11] Y. H. Kim, M. D. Hill, and D. A. Wood. Implementing stack simulation for highly-associative memories. In Proc. of 1991 ACM SIGMETRICS Conf. on Measurement and Modeling of Computer Systems, pages 212-213, 1991.
[12] J. R. Larus and E. Schnarr. EEL: Machine-independent ex- ecutable editing. In PLDI, pages 291-300, 1995.
[13] T. Lindholm and F. Yellin. The Java Virtual Machine Spec- ification. Addison-Wesley, 1997.
[14] A. M. G. Maynard, C. M. Donnelly, and B. R. Olszewski. Contrasting characteristics and cache performance of tech- nical and multi-user commercial workloads. In ASPLOS VI, pages 145-156, 1994.
[15] R. Radhakrishnan, J. Rubio, L. K. John, and N. Vijaykr- ishnan. Execution characteristics of just-in-time compilers. Technical Report TR-990717-01, University of Texas at Austin, 1999..
[16] M. B. Reinhold. Cache performance of garbage-collected pro- grams. In PLDI, pages 206-217, 1994.
[17] T. H. Romer et al. The structure and performance of inter- preters. In ASPLOS VII, pages 150-159, 1996.
[18] A. Srivastava and A. Eustace. ATOM: A system for building customized program analysis tools. In PLDI, pages 196-205, 1994.
[19] Standard Performance Evaluation Council. SPEC JVM98 benchmarks, http ://www. spec. org/osg/j vm98/, 1998.
[20] T. Suganuma et al. Overview of the IBM Java just-in-time compiler. IBM Systems Journal, 39(1):175-193, Jan. 2000.
[21] P. Tyma. Why are we using Java again? Commun. ACM, 41(6):38-42, Jun. 1998.
[22] B. G. ZOrn. The effect of garbage collection on cache perfor- mance. Technical Report CU-CS-528-91, University of Col- orado at Boulder, May 1991.
274