memorandum - imperial metals · this memorandum provides brief summary a and ... (figure 1;...
TRANSCRIPT

Memorandum
Date: April 8, 2016 To: Dale Reimer, Mount Polley Mining Corporation From: Pierre Stecko, Minnow Environmental Inc. Cc: Colleen Hughes, Katie McMahen, Mount Polley Mining Corporation ‘Lyn Anglin, Imperial Metals Corporation
Re: Results of Diffusive Gradients in Thin Films Device Deployment – August to October 2015
The ongoing assessment of the impact to aquatic environmental health following the failure of the Mount Polley tailings dam in August 2014 includes monitoring of water and sediment chemistry. A number of evaluations have indicated low mobility of metals in Mount Polley tailings and tailings-influenced sediment (e.g., SRK 2015a,b; Minnow 2015a, 2016) and this has been supported by the results of water quality monitoring (Golder 2015). Water quality monitoring has focused on total and dissolved metals, both of which over-represent the metal fraction that is available for uptake by aquatic organisms in natural surface waters (i.e., free metal ions and weakly complexed metals, often referred to as the “labile” metal fraction).
This memorandum provides a brief summary and interpretation of metal concentration results associated with diffusive gradients in thin films (DGT) passive sampling devices deployed in waterbodies adjacent to the Mount Polley Mine from August to October 2015. The objective of the deployment of DGT devices in waterbodies adjacent to the Mount Polley Mine was to characterize concentrations of DGT-labile metal in water overlying sediments impacted by the Mount Polley Mine tailings dam failure relative to reference areas.
Background
DGT devices are small devices that contain a membrane filter, a gel diffusion layer and a gel binding layer (e.g., Davison and Zhang 1994). The devices are designed to accumulate labile (free and weakly complexed) substances by diffusion in a controlled manner. Labile metals are the fraction of metals that are considered to be potentially bioavailable (i.e., that can be readily transported across biological membranes of aquatic organisms; e.g., Campbell and Tessier 1996; Luoma and Rainbow 2008). DGT devices used in this
D. Reimer, Mount Polley Mining Corporation DGT Deployment
2
evaluation are optimized for metals and include a 0.45 µm Millipore™ cellulose nitrate membrane, a polyacrylamide gel diffusion layer, and a mixed binding layer composed of Chelex-100™ and Metsorb™ binding resins, all housed in a small polypropylene container approximately two inches in diameter (Panther et al. 2014). Only the membrane is exposed to the sampling environment (as a “window” in the DGT device). Labile metals diffuse through the membrane and gel diffusion layer and are captured in the resin. Following deployment for a time period that results in accumulation to detectable concentrations (but not to resin saturation, which can be calculated based on water chemistry data and avoided), the DGT devices are retrieved and the resin removed, digested, and analyzed. Analytical results are expressed as the mass of metal accumulated in the resin, which can also be used to back-calculate average labile metal concentrations during deployment. DGT-measured labile metal concentrations better represent the fraction of metals that are potentially bioavailable than do total or dissolved concentrations (e.g., Tusseau-Vuillemin 2004; Martin 2008; Simpson et al. 2012; Peijnenburg et al. 2014; Greenberg et al. 2014). This is because total metals include metals associated with particulate and dissolved binding materials (ligands), and dissolved metals include metals associated with binding materials (ligands) that are dissolved and those associated with very small particles and colloids (<0.45 µm in diameter).
Methods
Study Design
A simple study was undertaken to characterize labile metal concentrations using DGT devices in water overlying sediments at areas impacted by the tailings dam failure, as well as at un-impacted reference areas. DGT devices were deployed at five areas from late August to early October 2015; two lake areas impacted by the tailings dam failure, two reference areas for the impacted lake areas, and Hazeltine Creek (Figure 1; Appendix Table A1). Four replicate DGT devices were deployed at each area.
Deployment and Retrieval
In lakes, DGT devices were installed in the lower water column approximately one meter above the sediment surface. This was achieved by placing a line with anchor and float at each sample location. A flat tray was placed above the anchor to prevent excessive sinking into the sediment. A loop was tied in the rope one meter above the tray and the DGT device was tied to the loop using fishing line. In Hazeltine Creek, DGT devices were placed in small pools within a canyon (Figure 1), where they were tied to a loop of rope, which was then tied to two brick anchors placed in the creek in a manner that kept them approximately 15 centimeters above the creek bottom. At the time of sampling, Hazeltine Creek was not

MAP INFORMATIONDatum: NAD 83 Map Projection: UTM Zone 10NData Source: Department of Natural Resources Canada. All rights reserved.Creation Date: February 2016Project No.: 2574
Figure 1: Polley Lake, Bootjack Lake, Quesnel Lake and Hazeltine Creek Passive Sampler Locations, Mount Polley Mine, 2016.
³±
!.!.!.!.
!.!.!.!.
!.!.!.!.
!.!.!.!.
!.!.!.!.
EastRDS NEZ
Dump
PAGStockpile
NorthBell
Dump
BoundaryDump
MillArea
BoundaryPit
WightPit
RockQuarry
SpringerPit
OreStockpile
#1HighOxide
Stockpile
NEZ/WightPit
SoilStockpiles
CaribooOre
Stockpile
BiosolidsStockpile
LowerSERDS
SoilStockpile
TailingsStorageFacility
MainEmbankment
PerimeterEmbankment
SEZStockpile 1
SERDS
SoutheastPit
PondZone Pit
CaribooPit
Main EmbankmentSeepage
Collection Pond
PerimeterEmbankment Seepage
Collection Pond
South EmbankmentSeepage
Collection Pond
BootjackLake
PolleyLakeMount Polley
Mine Hazelt in e Cr eek
Bootjack Cree k
CaribooPit
QuesnelLake
POL-1POL-2 POL-3
POL-4
BOL-1BOL-2BOL-3BOL-4
PNF-1PNF-2PNF-3PNF-4
PREF1-1PREF1-2
PREF1-3PREF1-4
HAC-1HAC-2
HAC-3HAC-4
20
20
2010
30
30
5
10
10
BootjackCreek Dam
Horsefly
Likely Forest Service Road
Teasdale Creek Road
Edney Lake Road
Spanish Lake Road
GavinLake
Road
Winkley Creek Road
Horsefly
Quesn
el Lake
Road
110100
8050
9060
2010
100
8030
9060
70
50
10080
605050
40
70
4080
20
10
110
90
70
10
591,000
591,000
592,000
592,000
593,000
593,000
594,000
594,000
595,000
595,000
596,000
596,000
597,000
597,000
598,000
598,000
599,000
599,000
600,000
600,000
601,000
601,000
602,000
602,000
603,000
603,000
604,000
604,000
605,000
605,000
606,000
606,000
607,000
607,000
608,000
608,000
609,000
609,000
610,000
610,000
611,000
611,0005,811
,000
5,811
,000
5,812
,000
5,812
,000
5,813
,000
5,813
,000
5,814
,000
5,814
,000
5,815
,000
5,815
,000
5,816
,000
5,816
,000
5,817
,000
5,817
,000
5,818
,000
5,818
,000
5,819
,000
5,819
,000
5,820
,000
5,820
,000
5,821
,000
5,821
,000
5,822
,000
5,822
,000
5,823
,000
5,823
,000
5,824
,000
5,824
,000
5,825
,000
5,825
,000
5,826
,000
5,826
,000
LEGENDPassive Sampler Locations!. Exposed!. Reference³± Bootjack Creek Dam
Seepage Collection PondMine InfrastructureWaterbodyWater Collection DitchQuesnel Lake Bathymetry (10 mIntervals)Bootjack Lake Bathymetry (5 mIntervals)Polley Lake Bathymetry (10 mIntervals)WatercourseRoads
E Water Flow Direction
²
Long Ditch
West Ditch
0 1,600 3,200800Meters
!
!
!
!
!
!
B R I T I S HC O L U M B I A A L B E R T A
Mount Polley592,000 mE582,2000 mN
Vancouver
Likely
Fort St. John
Williams Lake
Fort Nelson
Prince George

D. Reimer, Mount Polley Mining Corporation DGT Deployment
3
considered to be fish habitat as: 1) access to fish was blocked; and 2) it was subject to rehabilitation. During all DGT deployments, exposure to air was kept to a minimum (less than one minute) to avoid desiccation of the DGT devices.
DGT devices were retrieved 34 to 38 days after deployment (Appendix Table A1). DGT devices in Polley Lake, Bootjack Lake and Hazeltine Creek were retrieved by hand hauling, whereas DGT devices in Quesnel Lake (mean depth approximately 100 meters) were retrieved with the assistance of a commercial line hauler (Ace Line Hauler Brutus Plus 40). Upon retrieval, DGT devices were handled with care while wearing metal free disposable nitrile gloves. Particular care was taken not to touch the DGT window. Each DGT device was gently rinsed with metal free water and placed into a labelled glass soil jar with a few drops of metal free water to prevent desiccation. Jars were then placed into clean Ziploc™ bags and then into a dedicated cooler with ice packs, where they were maintained cool prior to transport to the field laboratory. At the field laboratory, the bagged jars were placed in a refrigerator and held until shipment to the analytical laboratory. After collection of all DGT devices, the DGT devices (in bagged jars) were placed in a cooler with frozen ice packs and a chain-of-custody form was prepared and packed with the samples. Coolers were shipped overnight for next day delivery to Maxxam Analytics (Burnaby, BC).
Supporting Measures
Supporting information collected at each deployment location included GPS (Geographic Positioning System) coordinates, sampling depth, Secchi depth (lakes only), field meter measurements of temperature, specific conductance, dissolved oxygen and pH (using a YSI EXO™ handheld portable field meter equipped with YSI EXO2™ Sonde), site photographs (including photographs of the DGT devices), and notes on the presence or absence of any fouling of the DGT devices. Supporting water samples were also collected from each sampling area, including field-filtered samples for dissolved analytes (0.45 µm filter). Water samples were placed into a dedicated cooler with frozen ice packs, where they were maintained cool prior to transport to the field laboratory where they were placed in a refrigerator and held until shipment to the analytical laboratory. At program completion, water samples were placed in a cooler with frozen ice packs and a chain-of-custody form was prepared and packed with the samples. Coolers were shipped overnight for next day delivery to ALS Environmental (Burnaby, BC).
Laboratory Analysis
Upon receipt of the DGT devices, Maxxam opened the coolers, measured temperature to verify the maintenance of cold samples, removed each device from the coolers, logged the sample, and assigned each sample a unique sample identification code. A sample receipt

D. Reimer, Mount Polley Mining Corporation DGT Deployment
4
confirmation was then sent to Minnow for verification. Laboratory analysis of the DGT devices involved dismantling the devices followed by digestion of the resin to provide a determination of total metal in the resin by ICP-MS (Inductively Coupled Plasma – Mass Spectrometry). Free metal ion was subsequently calculated by Maxxam based on total metal in the resin, water temperature during deployment, total deployment time, and manufacturer-supplied peer-reviewed diffusion coefficients, which, in turn, are based on Fick’s first law of diffusion (Zhang and Davison 1995; Panther et al. 2014). Upon completion of the analyses, a data report was provided by Maxxam to Minnow electronically in Adobe Acrobat Portable Document Format (PDF; Appendix C) and in MSExcel. Similarly, upon receipt of the water samples, ALS Environmental opened the coolers, measured temperature to verify the maintenance of cold samples, removed each sample from the coolers, logged the sample, and assigned each sample a unique identification code. A sample receipt confirmation was then sent to MPMC and Minnow for verification. Laboratory analyses included all analytes in the Mount Polley routine surface water quality monitoring program, including total and dissolved metals by ICP-MS. Upon completion of the analyses, a data report was provided by ALS to MPMC and Minnow electronically in Adobe Acrobat PDF (Appendix D) and in MSExcel.
Data Analysis
Upon receipt of the analytical data, a Data Quality Assessment (DQA) was completed, including an examination of data completeness, method detection limits achieved, field blank and travel blank results, laboratory precision, laboratory accuracy, and field precision. Following the completion of DQA, in-situ water quality data, DGT mass accumulation data, and DGT-based free metal concentration data were summarized by area, by calculating mean, standard deviation, standard error and 95% confidence limits. In-situ water quality data and DGT-based free metal concentration data were then evaluated by comparing concentrations of detectable analytes in failure-affected areas (Polley Lake and Quesnel Lake exposed area) to reference concentrations. In-situ water quality data and DGT-based free metal concentration data were also compared to British Columbia Water Quality Guidelines (BCWQG) for the protection of aquatic life (BCMOE 2016). Lastly, concentrations of DGT-detectable analytes were compared to total and dissolved concentrations.
Results
Supporting Measures
Supporting meter measurements indicated some differences between Polley Lake (impacted by the 2014 dam failure) and Bootjack Lake (reference), whereas conditions in

D. Reimer, Mount Polley Mining Corporation DGT Deployment
5
the impacted area of Quesnel Lake were very similar to the Quesnel Lake reference (Appendix Table A.2; Appendix Figures A.1 and A.2). Differences between Polley and Bootjack lakes included lower temperature and higher dissolved oxygen at depth in Polley Lake, as well as slightly higher pH and specific conductance throughout the water column of Polley Lake (Appendix Figure A.1). Specific conductance and pH of Hazeltine Creek were notably higher (up to 439 µS/cm and 8.46 pH units; Appendix Table A.2) than at any of the other area evaluated.
Conventional Water Chemistry
Data Quality Assessment indicated good water data quality, meaning that data can be used with a high level of confidence for interpretation and the derivation of conclusions (Appendix B). Copper was the only analyte present at impacted areas at total concentrations greater than BCWQG (Appendix Table C.2). At Hazeltine Creek, which is not currently fish habitat, mean total copper concentration was 0.015 mg/L (compared to an applicable hardness-based 30-day BCWQG of 0.0083 mg/L). At the Quesnel Lake near-field exposed area, mean total copper concentration was 0.0021 mg/L (compared to a mean hardness-based 30-day BCWQG of 0.0023 mg/L), but total concentration at deployment (0.0027 mg/L) was slightly greater than the applicable BCWQG (Appendix Table C.2). Concentrations of total manganese and dissolved iron in water samples from reference Bootjack Lake were elevated relative to BCWQG at DGT deployment and retrieval, but were not similarly elevated at impacted areas (Appendix Table C.2).
DGT Device Results
Data Quality Assessment indicated good DGT data quality with the exception of one trip blank result that suggested contamination but was inconsistent with field blank results and individual sample results (Appendix B). A total of 13 metals accumulated in DGT devices to detectable concentrations (Appendix Table D.1). Four of these (copper, manganese, iron and zinc) were previously identified as Parameters of Interest (POIs) representing the chemical influence of the tailings dam failure on sediment quality (Minnow 2015a) and two more (phosphorus and molybdenum) were previously identified as POIs representing the chemical influence of the tailings dam failure on water quality (Golder 2015).
Examination of total, dissolved, and time-weighted average labile concentrations of the POIs (Appendix Table C.2 and Table 1, respectively) indicated that copper was the only DGT-detectable analyte with some concentrations greater than BCWQG (above) and a spatial pattern consistent with impact from the tailings dam failure (i.e., greater concentrations at the impacted lake areas than at reference lake areas; Figure 2a; Appendix Figures D.1 to D.6). DGT-labile copper concentrations were detectable in Hazeltine Creek

Table 1: Detectable metals in DGT devices and calculated time-weighted free metal concentrations, Mount Polley 2015
A) Metal accumulated in DGT-device resin
Mean Standard Deviation Mean Standard
Deviation Mean Standard Deviation Mean Standard
Deviation Mean Standard Deviation
Aluminum (Al) 0.59 1.96 µg 3.00 1.67 <0.59 - <0.59 - 2.31 0.7 2.24 0.56Barium (Ba) 0.063 0.25 µg 6.57 2.22 1.86 0.10 3.31 0.54 1.75 0.24 1.51 0.07Calcium (Ca) 20 66 µg 172 26 116 13 <66 - 125 10 117 23Copper (Cu) 0.025 0.13 µg 2.38 0.19 0.15 0.01 <0.13 - <0.13 - <0.13 -Iron (Fe) 1.25 6.3 µg <1.25 - <1.25 - 137 16 <6.3 - <1.25 -Magnesium (Mg) 1.25 6.3 µg 7.7 1.2 <6.3 - <1.25 - <1.25 - <1.25 -Manganese (Mn) 0.05 0.25 µg 0.77 0.19 2.69 0.50 22.5 4.2 1.14 0.12 1.19 0.47Molybdenum (Mo) 0.044 0.15 µg <0.15 - 1.23 0.06 0.23 0.01 <0.15 - <0.15 -Phosphorus (P) 1.25 6.3 µg <1.25 - <1.25 - 15.1 2.9 <1.25 - <1.25 -Strontium (Sr) 0.082 0.27 µg 1.94 0.91 0.99 0.12 0.71 0.08 0.84 0.14 0.86 0.12Uranium (U) 0.0025 0.013 µg 0.020 0.010 0.04 0.00 <0.0025 - 0.03 0.00 0.02 0.00Vanadium (V) 0.025 0.063 µg 0.33 0.04 0.15 0.01 <0.025 - <0.063 - <0.025 -Zinc (Zn) 0.125 0.63 µg <0.125 - <0.125 - <0.125 - 1.78 3.30 <0.125 -
B) Calculated time-weighted free metal concentrations
Mean Standard Deviation Mean Standard
Deviation Mean Standard Deviation Mean Standard
Deviation Mean Standard Deviation
Aluminum (Al) 0.0016 0.0054 mg/L 0.0083 0.0045 <0.0016 - <0.0016 - 0.0071 0.0033 0.0071 0.0033Barium (Ba) 0.00017 0.00068 mg/L 0.018 0.006 0.006 0.000 0.010 0.002 0.006 0.001 0.006 0.000Calcium (Ca) 0.033 0.109 mg/L 0.29 0.05 0.23 0.03 <0.011 - 0.28 0.02 0.28 0.05Copper (Cu) 0.000058 0.00029 mg/L 0.0056 0.0005 0.00039 0.00007 <0.00029 - <0.00029 - <0.00029 -Iron (Fe) 0.0027 0.013 mg/L <0.0027 - <0.0027 - 0.32 0.04 <0.013 - <0.0027 -Magnesium (Mg) 0.0023 0.012 mg/L 0.015 0.002 <0.012 - <0.0023 - <0.0023 - <0.0023 -Manganese (Mn) 0.00014 0.0007 mg/L 0.0021 0.0005 0.0090 0.0018 0.0688 0.0127 0.0043 0.0005 0.0048 0.0019Molybdenum (Mo) 0.000091 0.0003 mg/L <0.0003 - 0.0030 0.0002 0.0005 0.0000 <0.0003 - <0.0003 -Phosphorus (P) 0.0027 0.013 mg/L <0.0027 - <0.013 - 0.036 0.007 <0.0027 - <0.0027 -Strontium (Sr) 0.00013 0.00045 mg/L 0.0032 0.0015 0.0019 0.0002 0.0013 0.0002 0.0019 0.0003 0.0021 0.0003Uranium (U) 0.000005 0.000024 mg/L 0.000038 0.000019 0.000091 0.000004 <0.000005 - 0.078 0.006 0.000061 0.000007Vanadium (V) 0.000059 0.00015 mg/L 0.00077 0.00009 0.00043 0.00003 <0.000059 - <0.00015 - <0.000059 -Zinc (Zn) 0.0002 0.001 mg/L <0.0002 - <0.0002 - <0.0002 - 0.0039 0.0074 <0.0002 -
Hazeltine Creek Polley Lake (P2) Bootjack Lake (B2) Qusenel LakeProfundal - Exposed
Qusenel LakeProfundal - ReferenceMetal Name
Method Detection
Limit
Reporting Detection
LimitUnits
Metal NameMethod
Detection Limit
Bootjack Lake (B2)Hazeltine Creek Polley Lake (P2)Reporting Detection
LimitUnits
Qusenel LakeProfundal - Exposed
Qusenel LakeProfundal - Reference

Figure 2: Concentrations of copper in water. A) DGT-labile concentrations (± standarddeviation); B) total, dissolved and DGT-labile concentrations 1
1 open bars indicate less than detect results
0.000
0.001
0.002
0.003
0.004
0.005
0.006
0.007
HazeltineCreek
PolleyLake (P2)
BootjackLake (B2)
Quesnel LakeProfundalExposed
Quesnel Lake -ProfundalReference
DG
T-La
bile
Cop
per (
mg/
L)
0.000
0.004
0.008
0.012
0.016
0.020
0.024
HazeltineCreek
PolleyLake (P2)
BootjackLake (B2)
Quesnel LakeProfundalExposed
Quesnel LakeProfundalReference
Cop
per (
mg/
L)
total dissolved DGT-labile BCWQG ‐maximumBCWQG ‐ 30 day

D. Reimer, Mount Polley Mining Corporation DGT Deployment
6
and Polley Lake only (0.0056 ± 0.0005 mg/L and 0.00039 ± 0.00007 mg/L, respectively; Table 1 and Figure 2a). Despite average sediment copper concentrations of 823 mg/kg at Polley Lake versus 382 mg/kg at Bootjack Lake, and despite average sediment copper concentrations of 859 mg/kg at the Quesnel Lake profundal exposed area versus 55.1 mg/kg at the Quesnel Lake profundal reference area (Appendix Table D.3), near-bottom DGT-labile copper concentrations at all of these lake areas were ≤ 0.0004 mg/L (Figure 2a). This suggests limited mobility of the sediment-associated copper, which is consistent with previous observations of limited mobility and bioavailability of metals associated with Mount Polley tailings and tailings-influenced sediments (e.g., SRK 2015a,b; Minnow 2015a, 2016).
Concentrations of total copper greater than the 30-day BCWQG for the protection of aquatic life were observed at Hazeltine Creek and at the Quesnel Lake profundal exposed area (Appendix Table C.2). As previously indicated, Hazeltine Creek is not currently considered fish habitat. At the Quesnel Lake profundal exposed area, concentration of total copper was slightly greater than the 30-day BCWQG at deployment (0.0027 mg/L versus an applicable BCWG of 0.0023 mg/L) but not at retrieval (Appendix Table C.2). Dissolved copper was 54% of total, indicating that approximately half the total copper concentration was particulate (Figure 2b; Appendix Table D.3). DGT-labile copper was a fraction of total and dissolved (<13% and <25%, respectively; Figure 2b; Appendix Table D.3). This indicates that a substantial fraction of copper classified as dissolved after filtration using a 0.45 µm filter is not DGT-labile (i.e., is not in free ion and/or weakly complexed forms) and an even larger fraction of total metal is not DGT-labile.
Although copper was the only POI with a spatial pattern consistent with impact from the tailings dam failure, measurement of DGT-labile metal concentrations provided some perspective on water concentrations of several additional metals. Despite the near-bottom concentrations of total manganese and dissolved iron greater than BCWQG at Bootjack Lake (perhaps related to low near-bottom dissolved oxygen concentrations), DGT-labile concentrations were low and the DGT-labile fraction was 30% for iron and only 6% for manganese (Appendix Table D.3; Appendix Figures D.2 and D.3). This suggests that the majority of total and dissolved iron and manganese was in fine colloidal form unavailable to the DGT-device. Molybdenum was present at total concentrations well below BCWQG, but was highest at Hazeltine Creek and Polley Lake, suggesting some influence of proximity to the Mount Polley Mine (Appendix Figure D.4). The DGT-labile molybdenum fraction was highest at Polley Lake, where it was approximately 30% of total and dissolved concentrations (Appendix Table D.3). Phosphorus concentrations in Polley and Bootjack lakes were greater than the BCWQG range for lakes supporting salmonids, but were only DGT-detectable in Bootjack Lake, with DGT-labile concentrations of 24% and 34% of total

D. Reimer, Mount Polley Mining Corporation DGT Deployment
and dissolved phosphorus, respectively (Appendix Figure D.5; Appendix Table D.3). Lastly,
one of the four replicate DGT-labile zinc results for Quesnel Lake was elevated (0.015 mg/L;
Appendix Table D.1). Although this may represent an anomaly, verification is justified.
Summarv
Measurement of DGT-labile metal concentrations (i.e., free metal ions and weakly
complexed metals) in water near the bottom of lakes impacted by the Mount Polley Mine
tailings dam failure (Polley Lake and Quesnel Lake) indicate DGT-labile metal
concentrations that are a fraction of total and dissolved. For copper, the POI of greatest
concern and the only DGT-detectable analyte with elevated total concentrations and a
spatial pattern consistent with impact from the tailings dam failure, DGT-labile
concentrations were less than 13% of total and less than 25% of dissolved concentrations
in bottom waters of these lakes. These low concentrations add to the weight-of-evidence
of the apparent post-depositional stability of the Mount Polley tailings and tailings-impacted
sediment (e.g., SRK 2015a,b; Minnow 2015a,2016).
Recommendations
DGT-devices provide a promising means of evaluating the mobility of metals associated
with tailings-influenced sediments and tracking Iabile metal concentrations over time. lt is
therefore recommended that DGT devices are deployed in 2016 in areas impacted by the
2014 tailings dam failure. Lower method detection limits can likely be achieved by
extending the deployment period.

D. Reimer, Mount Polley Mining Corporation DGT Deployment
8
References
BCMOE (British Columbia Ministry of Environment). 2016. British Columbia Approved Water Quality Guidelines: Aquatic Life, Wildlife & Agriculture – Summary Report. http://www2.gov.bc.ca/assets/gov/environment/air-land-water/water/waterquality/ waterqualityguidesobjs/approved-wat-qual-guides/final_approved_wqg_summary_march_ 2016.pdf
Campbell, P.G.C. and A. Tessier. 1996. Ecotoxicology of Metals in the Aquatic Environment: Geochemical Aspects. In: Ecotoxicology: A Hierarchical Treatment. M.C. Newman and C.H. Jagoe (Eds.). Lewis Publishers. pp. 11-58.
CCME (Canadian Council of Ministers of the Environment). 1999. Canadian Sediment Quality Guidelines for the Protection of Aquatic Life - Copper. In: Canadian Environmental Quality Guidelines, CCME, Winnipeg. 4 pp.
Davison, W. and H. Zhang. 1994. In situ Speciation Measurements of Trace Components in Natural Waters using Thin-Film Gels. Nature: 546-548.
Golder (Golder Associates). 2015. Mount Polley Tailings Dam Failure – Surface Water Quality Impact Assessment. Report Number 1411734-036-R-Rev0-10000 Prepared for Mount Polley Mining Corporation, June 2015.
Greenberg, M.S., P.M. Chapman, I.J. Allan, K.A. Anderson, S.E. Apitz, C. Beegan, T.S. Bridges, S.S. Brown, J.G. Cargill IV, M.M. McCulloch, C.A. Menzie, J.P. Shine and T.F. Parkerton. 2014. Passive Sampling Methods for Contaminated Sediments: Risk Assessment and Management. Integr. Environ. Assess. Manage. 10(2): 224-236.
Luoma, S.N. and P.S. Rainbow. 2008. Metal Contamination in Aquatic Environments: Science and Lateral Management. Cambridge University Press. 573 pp.
Martin, A.J. 2008. Applications of Diffusive Gradients in Thin Films (DGT) for Metals-Related Environmental Assessments. Integr. Environ. Assess. Manage. 4: 377-379.
Minnow (Minnow Environmental Inc.). 2015a. Mount Polley Tailings Dam Failure – Sediment Quality Impact Characterization. Prepared for Mount Polley Mining Corporation, May 2015.
Minnow (Minnow Environmental Inc.). 2015b. Sediment Quality Data Report – August 2015 Collections. Memorandum to Dale Reimer, Mount Polley Mining Corporation from Pierre Stecko and Katharina Batchelar, October 2015.

D. Reimer, Mount Polley Mining Corporation DGT Deployment
9
Minnow (Minnow Environmental Inc.). 2016. Application of the SEM-AVS Method and Selective Extraction Analysis in Evaluating Sediments Collected in the Vicinity of the Mount Polley Mine – August 2015. Memorandum to Mr. Dale Reimer, Mount Polley Mining Corporation from Pierre Stecko and Katharina Batchelar. January 29, 2016.
Panther, J., W. Bennett, D. Welsh, and P. Teasdale. 2014. Simultaneous Measurement of Trace Metals and Oxyanion Concentrations in Water using Diffusive Gradients in Thin Films with a Chelex-Metsorb Mixed Binding Layer. Anal. Chem. 86: 427-434.
Peijnenburg, W.J.G.M., P. R. Teasdale, D. Reible, J. Mondon, W.W. Bennett and P.G.C. Campbell. 2014. Passive Sampling Methods for Contaminated Sediments: State of the Science for Metals. Integr. Environ. Assess. Manage. 10(2): 179-196.
Simpson, S.L., Y. Heloise, A. Cremazy and H. Price. 2012. DGT-Induced copper Flux Predicts Bioaccumulation and Toxicity to Bivalves in Sediments with Varying Properties. Environ. Sci. Technol. 46(16): 9038-9046.
SRK (SRK Consulting). 2015a. Mount Polley Mine Tailings Breach: Geochemical Characterization of Spilled Tailings. Prepared for Mount Polley Mining Corporation. June 2015.
SRK (SRK Consulting). 2015b. Mount Polley Mine Tailings Dam Failure: Update on Geochemical Characterization of Spilled Tailings. Prepared for Mount Polley Mining Corporation. November 2015.
Tusseau-Vuillemin, M.-H., R. Gilbin, E. Bakkaus and J. Garric. 2004. Performance of Diffusion Gradient in Thin Films to Evaluate the Toxic Fraction of Copper to Daphnia magna. Environ. Toxicol. Chem. 23(9): 2154-2161.
Zhang, H. and W. Davison. 1994. Performance Characteristics of Diffusion Gradients in Thin Films for the In Situ Measurement of Trace Metals in Aqueous Solution. Anal. Chem. 67: 3391-3400.

APPENDIX A
SAMPLE LOCATIONS AND SUPPORTING DATA

Table A.1: Sampling locations and dates of passive sampler (DGT) deployment and retrieval, Mount Polley Mine, August 2015
Easting Northing Date Time Date Time
1 595122 5822187 28-Aug-15 11:39 5-Oct-15 17:12 917.52 595141 5822212 28-Aug-15 12:02 5-Oct-15 17:03 917.03 595172 5822229 28-Aug-15 12:20 5-Oct-15 16:57 916.64 595150 5822183 28-Aug-15 12:43 5-Oct-15 17:07 916.41 591279 5821629 28-Aug-15 17:06 5-Oct-15 13:57 908.92 591253 5821623 28-Aug-15 17:21 5-Oct-15 13:53 908.53 591241 5821676 28-Aug-15 17:35 5-Oct-15 13:46 908.24 591218 5821665 28-Aug-15 17:53 5-Oct-15 13:49 907.91 601906 5818200 31-Aug-15 17:55 6-Oct-15 8:21 854.42 601849 5818258 31-Aug-15 18:12 6-Oct-15 8:14 854.03 601782 5818289 31-Aug-15 18:33 6-Oct-15 8:33 854.04 601649 5818354 31-Aug-15 18:49 6-Oct-15 8:44 853.91 610306 5814797 2-Sep-15 14:52 6-Oct-15 11:01 823.22 610362 5814849 2-Sep-15 15:07 6-Oct-15 10:52 822.63 610458 5814834 2-Sep-15 15:26 6-Oct-15 10:43 822.04 610527 5814860 2-Sep-15 15:42 6-Oct-15 10:35 821.51 600184 5817232 29-Aug-15 11:39 6-Oct-15 16:35 916.92 600106 5817179 29-Aug-15 12:02 6-Oct-15 16:11 916.23 599989 5817210 29-Aug-15 12:20 6-Oct-15 16:00 915.74 599951 5817204 29-Aug-15 12:43 6-Oct-15 15:47 915.1
Deployment duration (hours)
Retrieval
ExposedHACHazeltine Creek
Quesnel Lake - Profundal Near-Field PNF Exposed
Quesnel Lake - Profundal Reference PREF1 Reference
Polley Lake - South Basin POL-P2 Exposed
Bootjack Lake - South Basin BOL-B2 Reference
DeploymentLocation Area Code Type Replicate
GPS Coordinates

Table A.2: Supporting measures for passive sampler (DGT) deployment and retrieval, Mount Polley Mine, August 2015
A) Surface Water
Temp. DO DO SpC pH Temp. DO DO SpC pH°C mg/L % µS/cm pH units °C mg/L % µS/cm pH units
Polley Lake POL-P2 18.0 8.49 90 288 8.3 12.1 10.3 96 291 8.12Bootjack Lake BOL-B2 17.9 8.34 88 99 7.92 11.8 10.7 99 100 7.32
PNF 17.2 9.01 94 110 7.98 12.6 10.7 101 111 8.26PREF1 17.0 9.00 93 111 7.97 12.6 11.1 105 110 8.24
1 13.0 9.46 90 402 8.34 8.8 12.1 104 439 8.46
2 13.2 9.41 90 404 8.39 8.9 12.0 104 436 8.43
3 13.2 9.41 90 405 8.33 9.1 12.0 104 438 8.464 13.2 9.41 85 402 8.32 9.2 11.7 102 435 8.37
B) Lake Bottom Water
Temp. DO DO SpC pH Temp. DO DO SpC pH°C mg/L % µS/cm pH units °C mg/L % µS/cm pH units
Polley Lake POL-P2 6.0 2.04 16.4 297 7.02 6.1 1.11 8.9 298 7.26Bootjack Lake BOL-B2 8.9 0.01 0.1 107 6.64 8.72 0.66 5.7 160 6.64
PNF 4.5 10.3 80 118 7.38 4.6 12.5 97 116 7.67PREF1 3.9 10.4 79 114 7.44 3.9 13.4 102 113 7.68
RetrievalDeployment
Deployment Retrieval
Exposed
Reference
Quesnel LakeExposed
Reference
Location Area Code Type Replicate
Location Area Code
HACHazeltine Creek
Reference
ExposedQuesnel Lake
Exposed
Exposed
Type Replicate
Reference

Figure A.1: Vertical profiles of temperature, pH, dissolved oxygen, and specific conductance in Polley Lake and Bootjack Lak during the deployment of Diffusive Gradient in Thin-Film (DGT) passive samplers, Mount Polley Mine, August 201
0
5
10
15
20
25
300 5 10 15 20
Dep
th (m
)
Temperature (°C)
Temperature
POL-P2 BOL-B2
0
5
10
15
20
25
300 2 4 6 8 10
Dep
th (m
)
pH
pH
POL-P2 BOL-B2
0
5
10
15
20
25
300 2 4 6 8 10
Dep
th (m
)
Dissolved Oxygen (mg/L)
Dissolved Oxygen (mg/L)
POL-P2 BOL-B2
0
5
10
15
20
25
300 20 40 60 80 100
Dep
th (m
)
Dissolved Oxygen (%)
Dissolved Oxygen (%)
POL-P2 BOL-B2
Page 1 of 2

Figure A.1: Vertical profiles of temperature, pH, dissolved oxygen, and specific conductance in Polley Lake and Bootjack Lak during the deployment of Diffusive Gradient in Thin-Film (DGT) passive samplers, Mount Polley Mine, August 201
0
5
10
15
20
25
300 100 200 300 400
Dep
th (m
)
Specific Conductance (µS/cm)
Specific Conductance (µS/cm)
POL-P2 BOL-B2
Page 2 of 2

Figure A.2: Vertical profiles of temperature, pH, dissolved oxygen, and specific conductance in Quesnel Lake profundal area during the deployment of Diffusive Gradient in Thin-Film (DGT) passive samplers, Mount Polley Mine, August 201
0
20
40
60
80
100
1200 5 10 15 20
Dep
th (m
)
Temperature (°C)
Temperature
PNF PREF1
0
20
40
60
80
100
1200 2 4 6 8 10
Dep
th (m
)
pH
pH
PNF PREF1
0
20
40
60
80
100
1200 5 10 15
Dep
th (m
)
Dissolved Oxygen (mg/L)
Dissolved Oxygen (mg/L)
PNF PREF1
0
20
40
60
80
100
1200 20 40 60 80 100
Dep
th (m
)
Dissolved Oxygen (%)
Dissolved Oxygen (%)
PNF PREF1
Page 1 of 2

Figure A.2: Vertical profiles of temperature, pH, dissolved oxygen, and specific conductance in Quesnel Lake profundal area during the deployment of Diffusive Gradient in Thin-Film (DGT) passive samplers, Mount Polley Mine, August 201
0
20
40
60
80
100
1200 50 100 150
Dep
th (m
)
Specific Conductance (µS/cm)
Specific Conductance (µS/cm)
PNF PREF1
Page 2 of 2

Figure A.3: Vertical profiles of temperature, pH, dissolved oxygen, and specific conductance in Polley Lake and Bootjack Lake during the retrieval of Diffusive Gradient in Thin-Film (DGT) passive samplers, Mount Polley Mine, October 2015
0
5
10
15
20
25
300 5 10 15
Dep
th (m
)
Temperature (°C)
Temperature
POL-P2 BOL-B2
0
5
10
15
20
25
300 2 4 6 8 10
Dep
th (m
)
pH
pH
POL-P2 BOL-B2
0
5
10
15
20
25
300 5 10 15
Dep
th (m
)
Dissolved Oxygen (mg/L)
Dissolved Oxygen (mg/L)
POL-P2 BOL-B2
0
5
10
15
20
25
300 50 100 150
Dep
th (m
)
Dissolved Oxygen (%)
Dissolved Oxygen (%)
POL-P2 BOL-B2
0
5
10
15
20
25
300 100 200 300 400
Dep
th (m
)
Specific Conductance (µS/cm)
Specific Conductance (µS/cm)
POL-P2 BOL-B2

Figure A.4: Vertical profiles of temperature, pH, dissolved oxygen, and specific conductance in Quesnel Lake profundal areas during the retrieval of Diffusive Gradient in Thin-Film (DGT) passive samplers, Mount Polley Mine, October 2015.
0102030405060708090
1000 5 10 15
Dep
th (m
)
Temperature (°C)
Temperature
PNF PREF1
0102030405060708090
1000 2 4 6 8 10
Dep
th (m
)
pH
pH
PNF PREF1
0102030405060708090
1000 5 10 15
Dep
th (m
)
Dissolved Oxygen (mg/L)
Dissolved Oxygen (mg/L)
PNF PREF1
0102030405060708090
1000 50 100 150
Dep
th (m
)
Dissolved Oxygen (%)
Dissolved Oxygen (%)
PNF PREF1
0102030405060708090
1000 50 100 150
Dep
th (m
)
Specific Conductance (µS/cm)
Specific Conductance (µS/cm)
PNF PREF1

APPENDIX B
DATA QUALITY ASSESSMENT

Data Quality Assessment – DGT Memo Mount Polley Mining Corp.
Minnow Environmental Inc. B.1 April 2016 Project No. 2574
APPENDIX B: DATA QUALITY ASSESSMENT B1.0 INTRODUCTION ................................................................................................ 3
B1.1 Background ..................................................................................................... 3 B1.2 Types of Quality Control Samples ................................................................... 4
B2.0 WATER SAMPLES ............................................................................................ 6
B2.1 Detection Limits ............................................................................................... 6 B2.2 Laboratory Blank Sample Analysis ................................................................. 6 B2.3 Data Precision ................................................................................................. 6 B2.4 Data Accuracy ................................................................................................. 7 B2.5 Holding Time and General Laboratory Flags .................................................. 8
B3.0 DGT SAMPLES .................................................................................................. 9
B3.1 Detection Limits ............................................................................................... 9 B3.2 Laboratory Blank Sample Analysis ................................................................. 9 B3.3 Fabrication Controls ........................................................................................ 9 B3.4 Field Blank Sample Analysis ........................................................................... 9 B3.5 Data Accuracy ............................................................................................... 10 B3.6 Holding Time and General Laboratory Flags ................................................ 10
B4.0 DATA QUALITY STATEMENT ........................................................................ 11 B5.0 REFERENCES ................................................................................................. 12

Data Quality Assessment – DGT Memo Mount Polley Mining Corp.
Minnow Environmental Inc. B.2 April 2016 Project No. 2574
LIST OF TABLES After Page…
Table B.1: MDL achieved for non-detectable analytes in water samples ..............B.6
Table B.2: RPD between field duplicate water samples ........................................B.6
Table B.3: MDL and RDL achieved for DGT samples ...........................................B.6

Data Quality Assessment – DGT Memo Mount Polley Mining Corp.
Minnow Environmental Inc. B.3 April 2016 Project No. 2574
B1.0 INTRODUCTION
Data Quality Assessment (DQA) was conducted on data collected as part of the Mount
Polley Mining Corporation 2015 Diffusive Gradients in Thin Films (DGT) Device
Deployment. The objective of the DQA is to define the overall quality of the data presented
in the report, and, by extension, the confidence with which the data can be used to derive
conclusions.
B1.1 Background
A variety of factors can influence the physical, chemical and biological measurements
made in an environmental study and thus affect the accuracy and/or precision of the data.
Inconsistencies in sampling or laboratory methods, use of instruments that are
inadequately calibrated or which cannot measure to the desired level of accuracy or
precision, and contamination of samples in the field or laboratory are just some of the
potential factors that can lead to the reporting of data that do not accurately reflect actual
environmental conditions. Depending on the magnitude of the problem, inaccuracy or
imprecision have the potential to affect the reliability of any conclusions made from the
data. Therefore, it is important to ensure that programs incorporate appropriate steps to
control the non-natural sources of data variability (i.e., minimize the variability that does
not reflect natural spatial and temporal variability in the environment) and thus assure the
quality of the data.
Data quality as a concept is meaningful only when it relates to the intended use of the
data. That is, one must know the context in which the data will be interpreted in order to
establish a relevant basis for judging whether or not the data set is adequate. DQA
involves comparison of actual field and laboratory measurement performance to data
quality objectives (DQOs) established for a particular study, such as evaluation of method
detection limits, blank sample data, data precision (based on field and laboratory duplicate
samples), and data accuracy (based on matrix spike recoveries and/or analysis of
standards or certified reference materials). Only trusted and certified laboratories (e.g.,
analytical chemistry laboratories certified by Canadian Association for Laboratory
Accreditation [CALA]) were involved in the current program and such certified laboratories
have rigorous internal quality assurance programs that ensure the highest possible quality.
DQOs were established a-priori at the outset of the program to reflect reasonable and
achievable performance expectations. Programs involving a large number of samples and
analytes usually yield some results that exceed the DQOs. This is particularly so for multi-
element scans since the analytical conditions are not necessarily optimal for every

Data Quality Assessment – DGT Memo Mount Polley Mining Corp.
Minnow Environmental Inc. B.4 April 2016 Project No. 2574
element included in the scan. Generally, scan results may be considered acceptable if no
more than 20% of the parameters fail to meet the DQOs. Overall, the intent of DQA is not
to reject any measurement that did not meet a DQO, but to ensure that any questionable
data received more scrutiny to determine what effect, if any, this had on interpretation of
results within the context of this project.
B1.2 Types of Quality Control Samples
Several types of quality control (QC) samples were assessed based on samples collected
(or prepared) in the field and laboratory. These samples include the following:
Blanks are samples of de-ionized water, sampling devices, and/or appropriate
reagent(s) that are handled and analyzed the same way as regular samples.
These samples will reflect any contamination that occurred in the field (in the case
of field or trip blanks) or the laboratory (in the case of laboratory or method blanks).
Analyte concentrations should be non-detectable, although a data quality objective
of twice the method detection limit allows for slight “noise” around the detection
limit.
Fabrication Controls are blank DGT resins that are digested and analyzed in the
same manner as regular samples. The fabrication controls account for
interferences or contamination from the DGT sampler components, storage and
analysis.
Field Duplicates are replicate samples collected from a randomly selected field
station using identical collection and handling methods that are then analyzed
separately in the laboratory. The duplicate samples are handled and analyzed in
an identical manner in the laboratory. The data from field duplicate samples reflect
natural variability, as well as the variability associated with sample collection
methods, and therefore provide a measure of field precision.
Laboratory Duplicates are replicate sub-samples created in the laboratory from
randomly selected field samples which are sub-sampled and then analyzed
independently using identical analytical methods. The laboratory duplicate sample
results reflect any variability introduced during laboratory sample handling and
analysis and thus provide a measure of laboratory precision.
Certified Reference Materials and QC Standards are samples containing known
chemical concentrations that are processed and analyzed along with batches of
environmental samples. The sample results are then compared to target results

Data Quality Assessment – DGT Memo Mount Polley Mining Corp.
Minnow Environmental Inc. B.5 April 2016 Project No. 2574
to provide a measure of analytical accuracy. The results are reported as the
percent of the known amount that was recovered in the analysis.
Data Quality Assessment – DGT Memo Mount Polley Mining Corp.
Minnow Environmental Inc. B.6 April 2016 Project No. 2574
B2.0 WATER SAMPLES
B2.1 Detection Limits
Method detection limits (MDLs) achieved by ALS Environmental for the supporting water
samples were examined and assessed in all cases where sample results were reported
as less than the MDL. For analytes for which a water quality guideline for the protection
of aquatic life is available, the MDL should be lower than the guideline value (Table B.1).
All reported MDLs were lower than the applicable guideline values (Table B.1), and were
therefore of good quality for effective data interpretation.
B2.2 Laboratory Blank Sample Analysis
All laboratory blank results reported for the ALS Environmental laboratory reports
L1666722, L1668250, L1684482, L1685536 (a total of 657 results) were non-detectable
with the exception of a handful of results (0.6% of results; Appendix C). Detectable
laboratory method blank results were reported for alkalinity and conductivity but in all
cases the associated sample results were at least five times greater than the blank levels,
therefore the sample results were deemed reliable by the laboratory (Appendix C).
Overall, this indicates no inadvertent contamination of samples within the laboratory during
analysis.
B2.3 Data Precision
Field Duplicate Samples
One duplicate water sample was collected in the field as part of the water sampling
conducted to support the evaluation of Diffusive Gradient in Thin-Film (DGT) passive
samplers deployed in Hazeltine Creek, Polley Lake, Bootjack Lake and Quesnel Lake.
The duplicates showed excellent agreement in concentrations of all analytes except
dissolved orthophosphate, dissolved phosphorus, and total silver which had relative
percent differences (RPD) among the duplicates of 40.0%, 43.1%, and 57.1%,
respectively (Table B.2). Although the data quality objective of a relative percent
difference (RPD) of ≤ 25% was not met for these three analytes, each analyte had low
reported results, with one detectable and one undetectable result. Consequently,
although the absolute difference was small (approximately 0.001 mg/L in the case of
dissolved orthophosphate and dissolved phosphorus and < 0.00001 mg/L in the case of
silver) the relative percent differences exceeded the DQO (Table B.2). Overall, the field

Table B.1: Laboratory method detection limit (MDL) evaluation for water chemistry analysis relative to guidelines. Highlighting indicate MDLs that did not meet guideline.
Parameter UnitsBritish Columbia Water
Quality Guidelines aMaximum Method
Detection Limit Achieved
Physical Tests Total Suspended Solids mg/L - 3Anions and NutrientsTotal Ammonia (as N) mg/L 0.102 / 0.681 b 0.005Chloride mg/L 150/600 0.5Nitrate and Nitrite (as N) mg/L - 0.0051Nitrate (as N) mg/L 3.0 / 32.8 0.005Nitrite (as N) mg/L 0.02 / 0.06 c 0.001Orthophosphate (Dissolved) mg/L - 0.001Phosphorus (Total Dissolved) mg/L - 0.002Phosphorus (Total) mg/L -/0.005 0.002Total MetalsAntimony mg/L 0.009/ - 0.0001Beryllium mg/L 0.00013 / - 0.0001Bismuth mg/L - 0.00005Boron mg/L - /1.2 0.01Cadmium mg/L - 0.000005Chromium mg/L 0.001/- d 0.0005Cobalt mg/L 0.004/0.11 0.0001Iron mg/L - /1 0.03Lead mg/L 0.005/0.033 e 0.00005Lithium mg/L - 0.001Nickel mg/L - /0.025 e 0.0005Silver mg/L 0.00005/0.0001 e 0.00001Thallium mg/L 0.0008/- 0.00001Tin mg/L - 0.0001Titanium mg/L - 0.01Vanadium mg/L - 0.0005Zinc mg/L 0.0075/0.033 e 0.003Dissolved MetalsAluminum mg/L 0.05/0.10 0.003Antimony mg/L - 0.0001Arsenic mg/L - 0.0001Beryllium mg/L - 0.0001Bismuth mg/L - 0.00005Boron mg/L - 0.01Cadmium mg/L 0.0001/0.0003 e 0.000005Chromium mg/L - 0.0005Cobalt mg/L - 0.0001Copper mg/L - 0.0005Iron mg/L -/0.35 0.03Lead mg/L - 0.00005Lithium mg/L - 0.001Nickel mg/L - 0.0005Silver mg/L - 0.00001Thallium mg/L - 0.00001Tin mg/L - 0.0001Titanium mg/L - 0.01Vanadium mg/L - 0.0005Zinc mg/L - 0.003
a British Columbia Water Quality Guidelines (BCMOE 2015a, BCMOE 2015b); Chronic / Acute. b Lowest tabulated chornic and acute ammonia guidelines based on pH and temperature reported in BCMOE (2015a).c For low chloride water (< 2mg/L) d Applies to chromium as Cr (IV); guideline for Cr(III) is 0.0089 mg/L.e Guideline value calculated using the lowest hardness for surface water hardness for applicable water bodies (Quesnel Lake, Bootjack Lake, Polley Lake, and Hazeltine Creek) of 48.8 mg/L.

Table B.2: Field duplicate results for water chemistry analyses. Highlighted values did not meet the data quality objective of ≤ 25% Relative Percent Difference (RPD).
PNF-DGT PNF-XDate Sampled 6-Oct-15 6-Oct-15ALS Sample ID L1684482-1 L1684482-2
Physical Tests Conductivity µS/cm 114 115 0.9Hardness (as CaCO3) mg/L 57.3 57.4 0.2pH pH 7.73 7.73 0.0Total Suspended Solids mg/L <3.0 <3.0 0.0Total Dissolved Solids mg/L 72 71 1.4Turbidity NTU 0.37 0.47 23.8Anions and Nutrients Alkalinity, Total (as CaCO3) mg/L 53.2 52.7 0.9Ammonia, Total (as N) mg/L <0.0050 <0.0050 0.0Chloride (Cl) mg/L <0.50 <0.50 0.0Fluoride (F) mg/L 0.036 0.036 0.0Nitrate and Nitrite (as N) mg/L 0.153 0.151 1.3Nitrate (as N) mg/L 0.153 0.151 1.3Nitrite (as N) mg/L <0.0010 <0.0010 0.0Total Nitrogen mg/L 0.221 0.220 0.5Orthophosphate-Dissolved (as P) mg/L <0.0010 0.0015 40.0Phosphorus (P)-Total Dissolved mg/L <0.0020 0.0031 43.1Phosphorus (P)-Total mg/L 0.0022 0.0028 24.0Sulfate (SO4) mg/L 6.90 6.90 0.0Organic / Inorganic Carbon Dissolved Organic Carbon mg/L 2.00 1.91 4.6Total Metals Aluminum mg/L 0.0288 0.0247 15.3Antimony mg/L <0.00010 <0.00010 0.0Arsenic mg/L 0.00016 0.00015 6.5Barium mg/L 0.00663 0.00649 2.1Beryllium mg/L <0.00010 <0.00010 0.0Bismuth mg/L <0.000050 <0.000050 0.0Boron mg/L <0.010 <0.010 0.0Cadmium mg/L 0.0000109 0.0000106 2.8Calcium mg/L 19.5 18.7 4.2Chromium mg/L <0.00050 <0.00050 0.0Cobalt mg/L <0.00010 <0.00010 0.0Copper mg/L 0.00165 0.00161 2.5Iron mg/L <0.030 <0.030 0.0Lead mg/L 0.000054 0.000053 1.9Lithium mg/L <0.0010 0.0010 0.0Magnesium mg/L 2.21 2.12 4.2Manganese mg/L 0.00415 0.00386 7.2Molybdenum mg/L 0.000897 0.000858 4.4Nickel mg/L <0.00050 <0.00050 0.0Potassium mg/L 0.571 0.546 4.5Selenium mg/L 0.000102 0.000108 5.7Silicon mg/L 1.96 1.87 4.7Silver mg/L 0.000018 <0.000010 57.1Sodium mg/L 1.24 1.22 1.6Strontium mg/L 0.144 0.143 0.7Thallium mg/L <0.000010 <0.000010 0.0Tin mg/L <0.00010 <0.00010 0.0Titanium mg/L <0.010 <0.010 0.0Uranium mg/L 0.000191 0.000185 3.2Vanadium mg/L <0.00050 <0.00050 0.0Zinc mg/L 0.0073 0.0073 0.0
a The method detection limit (MDL) value was used in instances where values less than the MDL were reported. RPD calculation: =(Absolute(Replicate 1 - Replicate 2))/Average(Replicate 1, Replicate 2)*100
RPD (%) aUnits
Lab report L1684482Client Sample ID
Page 1 of 2

Table B.2: Field duplicate results for water chemistry analyses. Highlighted values did not meet the data quality objective of ≤ 25% Relative Percent Difference (RPD).
PNF-DGT PNF-XDate Sampled 6-Oct-15 6-Oct-15ALS Sample ID L1684482-1 L1684482-2
RPD (%) aUnits
Lab report L1684482Client Sample ID
Dissolved Metals Aluminum mg/L 0.0068 0.0067 1.5Antimony mg/L <0.00010 <0.00010 0.0Arsenic mg/L 0.00013 0.00013 0.0Barium mg/L 0.00596 0.00599 0.5Beryllium mg/L <0.00010 <0.00010 0.0Bismuth mg/L <0.000050 <0.000050 0.0Boron mg/L <0.010 <0.010 0.0Cadmium mg/L <0.0000050 <0.0000050 0.0Calcium mg/L 19.4 19.4 0.0Chromium mg/L <0.00050 <0.00050 0.0Cobalt mg/L <0.00010 <0.00010 0.0Copper mg/L 0.00109 0.00108 0.9Iron mg/L <0.030 <0.030 0.0Lead mg/L <0.000050 <0.000050 0.0Lithium mg/L 0.0011 0.0011 0.0Magnesium mg/L 2.16 2.17 0.5Manganese mg/L 0.00107 0.00114 6.3Molybdenum mg/L 0.000780 0.000780 0.0Nickel mg/L <0.00050 <0.00050 0.0Potassium mg/L 0.548 0.549 0.2Selenium mg/L 0.000089 0.000100 11.6Silicon mg/L 1.84 1.84 0.0Silver mg/L <0.000010 <0.000010 0.0Sodium mg/L 1.19 1.20 0.8Strontium mg/L 0.137 0.138 0.7Thallium mg/L <0.000010 <0.000010 0.0Tin mg/L <0.00010 <0.00010 0.0Titanium mg/L <0.010 <0.010 0.0Uranium mg/L 0.000167 0.000168 0.6Vanadium mg/L <0.00050 <0.00050 0.0Zinc mg/L <0.0030 <0.0030 0.0
a The method detection limit (MDL) value was used in instances where values less than the MDL were reported. RPD calculation: =(Absolute(Replicate 1 - Replicate 2))/Average(Replicate 1, Replicate 2)*100
Page 2 of 2

Data Quality Assessment – DGT Memo Mount Polley Mining Corp.
Minnow Environmental Inc. B.7 April 2016 Project No. 2574
duplicate sampling did not indicate any inconsistencies in sampling technique nor issues
that could impair data interpretability.
Laboratory Duplicate Samples
All laboratory duplicate results evaluated within laboratory reports L1666722, L1668250,
L1684482, L1685536 (1,474 results in total) met ALS Environmental’s data quality
objectives for the parameters reported (generally < 25% RPD; Appendix C). Among the
four laboratory reports, 34 laboratory duplicate samples were evaluated for dissolved
metals and alkalinity, 33 for conductivity, 30 for pH, sulphate, and nitrate, and 29 samples
were evaluated for nitrite. In addition, 25 laboratory duplicate samples were evaluated for
the precision of fluoride, 23 for chloride, 17 for total nitrogen, 15 for ammonia, 13 for
dissolved orthophosphate, 12 for total suspended solids and turbidity, and 11 for dissolved
organic carbon. Ten laboratory duplicate samples were assessed for precision of total
dissolved solids results, five samples for total metals and dissolved phosphorus, and three
samples were evaluated for the precision of total phosphorus results. Overall, the
laboratory precision achieved in this study is considered good.
B2.4 Data Accuracy
The accuracy of laboratory data from within laboratory reports L1666722, L1668250,
L1684482, L1685536 was assessed based on the results of certified reference materials
(CRM), laboratory control samples (LCS) and matrix spike samples (MS; Appendix C).
Specifically, the following CRM samples were used among the four laboratory reports to
assess the accuracy of various analyses; forty one CRM samples were analysed to assess
the accuracy of pH and conductivity analyses, forty for alkalinity, twenty five for ammonia,
sixteen for turbidity, nine for dissolved orthophosphate, five for dissolved phosphorus, and
four CRM samples were used to assess the accuracy of total phosphorus analyses
(Appendix C). Sixteen LCS samples were used to evaluate the accuracy of total nitrogen
samples, twelve for total suspended solids and dissolved organic carbon analyses, and
eleven samples were used to assess chloride, fluoride, nitrate, nitrite, and sulfate analyses
accuracy. An additional ten LCS samples were used to assess the accuracy of total
dissolved solids analyses, five for total metals, and four LCS samples were analysed to
evaluate the accuracy of dissolved metals analyses (Appendix C). Finally, MS samples
were also used to assess the accuracy of multiple parameters, with twenty eight MS
samples used to evaluate the accuracy of dissolved metals, nitrite, and sulphate analyses,
fourteen for ammonia and total nitrogen accuracy, eight for dissolved orthophosphate,
eight for dissolved organic carbon, five for total metals and dissolved phosphorus

Data Quality Assessment – DGT Memo Mount Polley Mining Corp.
Minnow Environmental Inc. B.8 April 2016 Project No. 2574
accuracy, and four MS samples used to assess the accuracy of total phosphorus analyses
(Appendix C). All CRM, LCS, and MS results (a total of 1,479 results) met ALS
Environmental’s data quality objectives for accuracy (Appendix C) and thus laboratory
accuracy associated with water samples in this study is considered excellent.
B2.5 Holding Time and General Laboratory Flags
Several hold times were exceeded due to the combination of short optimal hold times and
remote sampling (Appendix C). Analytes for which recommended hold times were
exceeded included nitrate/nitrite (3-day hold time), pH (15-minute hold time), dissolved
phosphorus (3-day hold time), turbidity (3-day hold time), and dissolved orthophosphate
(3-day hold time). Results associated with the hold time exceedances appear not to have
been affected as they were comparable to those associated with samples where hold
times were met, or comparable to field measures in the case of pH. Furthermore, water
samples were collected primarily to provide supporting water metals concentration data
for the deployed Diffusive Gradient in Thin-Film (DGT) passive samplers and hold time for
metals analyses were not exceeded, therefore the observed hold time exceedences will
not affect data interpretability. There were no general laboratory flags associated with the
water quality data (Appendix C).

Data Quality Assessment – DGT Memo Mount Polley Mining Corp.
Minnow Environmental Inc. B.9 April 2016 Project No. 2574
B3.0 DGT SAMPLES
B3.1 Detection Limits
Method detection limits (MDLs) and reporting detection limits (RDLs) achieved by Maxxam
for the DGT devices were reported for both mass analyses and for estimated average
water concentrations (Appendix D). Data quality assessment of MDLs and RDLs is
focussed on the average water concentrations as these are ultimately the data of greatest
interest, and because water quality guidelines for the protection of aquatic life are
available, the MDLs and RDLs should be lower than the guideline value. Of the analytes
for which estimated average water concentrations were reported (27 analytes), some less
than MDL or RDL results were returned for all but three analytes due to very low
concentrations (Appendix D). However, all MDLs were well below water quality guidelines
and RDLs for all but one analyte were below water quality guidelines (Table C.3). This
exception occurred for chromium, where the RDL (0.0016 mg/L) was slightly greater than
the guideline of 0.001 mg/L. Overall, detection limits were good and appropriate for data
interpretation. In addition, chromium, the only analyte with a RDL greater than guideline,
as not been identified as a parameter of interest within the study area.
B3.2 Laboratory Blank Sample Analysis
Results for the analysis of four blanks were reported in association DGT analyses – two
water blanks and two method blanks. All analytes except sodium were reported as below
MDL or RDL (Appendix D). This result does not indicate contamination; rather is due to a
digestion solution that contains sodium (sodium hydroxide). Furthermore, all DGT data
for sodium were reported as less than MDL.
B3.3 Fabrication Controls
Three fabrication control results were reported in association DGT analyses and returned
results below MDL or RDL for all analytes except sodium (Appendix D). As noted above,
this result does not indicate contamination; rather is due to a digestion solution that
contains sodium (sodium hydroxide). Furthermore, all DGT data for sodium were reported
as less than MDL.
B3.4 Field Blank Sample Analysis
Two field blanks and one trip blank were included in the program. The two field blanks
returned results below MDL or RDL for all analytes (Appendix D). The trip blank returned
results below MDL or RDL for all analytes except copper (Appendix D). Based on this

Table B.3: Laboratory method detection limit (MDL) evaluation for DGT-estimated average water concentrations relative to guidelines. Highlighting indicate MDLs that did not meet guideline.
30-day maximum
Aluminum mg/L 0.05 0.10 d 0.0016 0.0054Antimony mg/L 0.009 - t 0.000053 0.00026Arsenic mg/L - 0.005 t 0.000054 0.00027Barium mg/L 1.0 - t 0.00017 0.00068Beryllium mg/L - - - 0.000054 0.00027Cadmium 2 mg/L 0.00013 0.00029 d 0.0000059 0.000029Calcium mg/L - - - 0.033 0.109Chromium mg/L 0.001 - t 0.00032 0.0016Cobalt mg/L 0.004 0.11 t 0.000031 0.00015Copper mg/L 0.002 0.007 t 0.000058 0.00029Iron mg/L - 0.35 d 0.0027 0.013Lead 2 mg/L 0.0046 0.034 t 0.00002 0.0001Lithium mg/L - - - 0.00016 0.00079Magnesium mg/L - - - 0.0023 0.012Manganese 2 mg/L 0.83 1.09 t 0.00014 0.0007Molybdenum mg/L - 0.073 t 0.000091 0.0003Nickel 2 mg/L - 0.06 t 0.00024 0.00081Phosphorus mg/L - - - 0.0027 0.013Potassium mg/L - - - 0.0033 0.017Selenium mg/L 0.002 - t 0.000073 0.00037Silver 2 mg/L 0.00005 0.0001 t 0.0000023 0.000012Sodium mg/L - - - 93 310Strontium mg/L - - - 0.00013 0.00045Thallium mg/L 0.0008 - t 0.00000081 0.0000041Uranium mg/L - - - 0.0000047 0.000024Vanadium mg/L - - - 0.000059 0.00015Zinc 2 mg/L 0.0075 0.033 t 0.0002 0.001
1 British Columbia Water Quality Guidelines (BCMOE 2015a,b) except for molybdenum, which is the Canadian Water Quality Guideline (CCME 2015). 2 at lowest applicable hardness of 50 mg/L
Application (d or t) MDLw RDLw
British Columbia Water Quality Guidelines 1Metal Units

Data Quality Assessment – DGT Memo Mount Polley Mining Corp.
Minnow Environmental Inc. B.10 April 2016 Project No. 2574
result (1.06 ug in the gel), a request was sent to the analytical laboratory for re-analysis,
which confirmed the original result, suggesting contamination. Despite this results, there
was no evidence of contamination in the field sample results – all reference results were
less than RDL (<0.39 ug) and all results from exposed areas showed good agreement
among replicates.
B3.5 Data Accuracy
Spikes of cadmium, thallium and uranium were added to method blanks and DGT resins
to evaluate recovery. In all cases, recovery was well within the acceptable range
(Appendix D).
B3.6 Holding Time and General Laboratory Flags
There were no hold time exceedences or general laboratory flags associated with the DGT
samples (Appendix D).

Data Quality Assessment – DGT Memo Mount Polley Mining Corp.
Minnow Environmental Inc. B.11 April 2016 Project No. 2574
B4.0 DATA QUALITY STATEMENT
Water quality data collected in support of the Diffusive Gradient in Thin-Film passive
sampler deployment at the Mount Polley Mine were of good quality. This was
characterized by good detectability, negligible analyte concentrations in method blanks,
good field and laboratory precision, and good laboratory accuracy. Therefore, the
supporting water quality data can be used with a high level of confidence in the derivation
of conclusions. Similarly, the DGT data were characterized by good detectability, as well
as negligible analyte concentrations in most blanks and all fabrication controls. Copper
was detected in a trip blank, suggesting contamination, but was not supported by results
from two field blanks, nor in the field samples themselves, which had low concentrations
in reference areas and higher concentrations with good agreement among stations at the
exposed areas. Although this data point is considered to most likely represent an
anomaly, it does detract from the overall confidence in DGT copper results.
Data Quality Assessment – DGT Memo Mount Polley Mining Corp.
Minnow Environmental Inc. B.12 April 2016 Project No. 2574
B5.0 REFERENCES
BCMoE (British Columbia Ministry of Environment). 2015a. Working Water Quality
Guidelines for British Columbia (2015). Updated April 2015.
BCMoE (British Columbia Ministry of Environment). 2015b. British Columbia Water Quality
Guidelines (Criteria) Reports. http://www2.gov.bc.ca/gov/topic.page?
id=044DD64C7E24415D83D07430964113C9&title=Approved%20Water%20
Quality%20Guidelines. Accessed April 2015.
Minnow (Minnow Environmental Inc.). 2015. Mount Polley Tailings Dam Failure –
Sediment Quality Impact Characterization. Prepared for Mount Polley Mining
Corporation, May 2015.

APPENDIX C
SUPPORTING WATER CHEMISTRY DATA

Table C.1: British Columbia Water Quality Guidelines for the Protection of Aquatic Life
50 130 200 50 130 200
Temperature C approvedpH pH approved
Lab Dissolved Oxygen mg/L 8.0 minimum 5.0 minimum approved - - - - - -Alkalinity (total) mg/L 10 - 20 minimum - working - - - - - -Total Suspended Solids mg/L approved - - - - - -Sulphate (dissolved) mg/L approved - - - 218 309 429Fluoride (dissolved) mg/L approved - - - 1.1 1.4 1.6Nitrate (as nitrogen) mg/L 3.0 32.8 approved - - - - - -Nitrite (as nitrogen) 3 mg/L 0.020 0.06 approved - - - - - -Ammonia (as nitrogen) 4 mg/L 0.45 1.9 approved - - - - - -Phosphorus (total) 5 mg/L approved - - - - - -Dissolved Organic Carbon mg/L approved - - - - - -Aluminum mg/L 0.05 0.10 approved - - - - - -Cadmium mg/L e^(0.736(ln(hardness))-4.943) e^(1.03(ln(hardness))-5.274) approved 0.00013 0.00026 0.00035 0.00029 0.00077 0.0012Iron mg/L - 0.35 approved - - - - - -Antimony mg/L 0.009 - working - - - - - -Arsenic mg/L - 0.005 approved - - - - - -Barium mg/L 1.0 - working - - - - - -Beryllium mg/L 0.00013 - working - - - - - -Boron mg/L - 1.2 approved - - - - - -Chromium 6 mg/L 0.001 CrVI; 0.0089 CrIII - working - - - - - -Cobalt mg/L 0.004 0.11 approved - - - - - -Copper mg/L 0.04*hardness 0.094*hardness + 2 approved 0.0020 0.0052 0.0080 0.007 0.014 0.021Iron mg/L - 1.0 approved - - - - - -Lead mg/L 3.31+ e^(1.273(ln(hardness))-4.704) e^(1.273(ln(hardness))-1.46) approved 0.0046 0.0078 0.0110 0.034 0.114 0.197Manganese mg/L 0.0044*hardness - 0.605 0.01102*hardness + 0.54 approved 0.83 1.18 1.49 1.09 1.97 2.74Mercury mg/L 0.00001 when meHg = 1% - approved - - - - - -Molybdenum mg/L - 0.073 approved - - - - - -Nickel mg/L - e^(0.76(ln(hardness))+1.06) working - - - 0.06 0.12 0.16Selenium mg/L 0.002 - approved - - - - - -Silver mg/L 0.0001 when hardness ≤ 100 mg/L 0.0001 when hardness ≤ 100 mg/L approved 0.00005 0.0015 0.0015 0.0001 0.003 0.003Thallium mg/L 0.0008 - working - - - - - -Zinc 7 mg/L 0.0075 when hardness < 90 0.033 when hardness < 90 approved 0.0075 0.038 0.090 0.033 0.063 0.12
1 British Columbia Water Quality Guidelines (BCMOE 2015a,b) except for molybdenum, which is the Canadian Water Quality Guideline (CCME 2015). 2 Hardness value of 50 mg/L is representive of Quesnel Lake and Bootjack Lake, 130 mg/L is representative of Polley Lake, and 200 mg/L is representative of Hazeltine Creek. However, exact hardness values were used in the data screening presented in Table C.2. 3 Applicable to low chloride water (<2 mg/L chloride) as observed at all sampling locations.4 Ammonia guideline values were selected based on a high pH (8.4) and temperature (15⁰C)5 Applicable to lakes where salmonids are the predominant fish species6 Guideline for Chromium VI (0.001 mg/L) was selected, as this is the principal species found in surface waters.7 30-d guideline when hardness is greater than 90 mg/L is 7.5+0.75(hardness-90) and maximum is 33+0.75(hardness-90)
Analyte UnitsGuidelines for the Protection of Aquatic Life 1
Guideline Status
Hardness-Dependent Guidelines for the Protection of Aquatic Life applicable at Three Benchmark Hardness Concentrations 2
30-day MaximumMaximum30-day
Field narrative 0.9 -6.5 - 9.0 - -
Dissolved Metals
Total Metals
Aggregatenarrative
Ions 218 - 429-51.73 + 92.57(log(hardness)) x 0.01
Nutrients
narrative0.005 - 0.015 (inclusive)

Table C.2: Supporting water quality data collected at the deployment and retrieval of Diffusive Gradient in Thin-Film (DGT) passive samplers, Mount Polley Mine, August and October 2015.
Sampling Period: Deployment Retrieval Deployment Retrieval Deployment Retrieval Deployment Retrieval Deployment RetrievalDate Sampled: 28-Aug-15 5-Oct-15 28-Aug-15 5-Oct-15 2-Sep-15 6-Oct-15 31-Aug-15 6-Oct-15 29-Aug-15 6-Oct-15
Physical Tests Conductivity uS/cm - - 104 107 291 284 108 110 116 114 402 422Hardness (as CaCO3) mg/L - - 48.8 50.3 134 137 56 55.3 56.9 57.3 199 216pH pH 7.49 7.37 7.86 7.73 7.73 7.75 7.75 7.73 8.41 8.38Total Suspended Solids mg/L <3.0 <3.0 <3.0 <3.0 <3.0 <3.0 <3.0 <3.0 <3.0 18.2Total Dissolved Solids mg/L - - 65 83 175 194 80 71 68 72 238 283Turbidity NTU 2.26 4.34 1.79 2.38 0.26 0.15 1.09 0.37 0.49 1.07Anions and Nutrients Alkalinity, Total (as CaCO3) mg/L 46.5 52.7 95.5 100 48.5 50.7 50.6 53.2 158 178
Ammonia, Total (as N) 2 mg/L 0.45 1.9 0.122 0.253 0.0108 0.0225 <0.0050 <0.0050 <0.0050 <0.0050 0.0115 <0.0050Chloride (Cl) mg/L - - 1.32 1.32 1.41 1.37 <0.50 <0.50 <0.50 <0.50 1.55 1.56
Fluoride (F) 3 mg/L 0.054 0.055 0.084 0.086 0.032 0.033 0.037 0.036 0.149 0.149Nitrate and Nitrite (as N) mg/L - - 0.0143 <0.0051 0.448 0.445 0.142 0.145 0.147 0.153 0.084 0.010Nitrate (as N) mg/L 3.0 32.8 0.0125 <0.0050 0.448 0.444 0.142 0.145 0.147 0.153 0.084 0.010Nitrite (as N) mg/L 0.02 0.06 0.0017 <0.0010 <0.0010 0.0013 <0.0010 <0.0010 <0.0010 <0.0010 <0.0010 <0.0010Total Nitrogen mg/L - - 0.419 0.564 0.691 0.728 0.193 0.199 0.203 0.221 0.244 0.145Orthophosphate-Dissolved (as P) mg/L 0.0282 0.196 0.0744 0.0885 <0.0010 <0.0010 <0.0010 <0.0010 0.0074 0.0037Phosphorus (P)-Total Dissolved mg/L 0.0337 0.176 0.0819 0.0960 0.0029 <0.0020 0.0032 <0.0020 0.0106 0.0051
Phosphorus (P)-Total 4 mg/L 0.0751 0.231 0.0794 0.0890 0.0024 <0.0020 0.0050 0.0022 0.0122 0.0079
Sulfate (SO4) 3 mg/L 3.79 3.05 47.8 47.4 6.16 6.30 7.04 6.90 52.6 55.9Organic / Inorganic Carbon Dissolved Organic Carbon mg/L 6.94 6.73 6.32 5.85 1.99 1.70 1.95 2.00 4.08 3.66Total Metals Aluminum mg/L 0.0081 0.0164 0.0264 0.0193 0.0123 0.0098 0.0871 0.0288 0.0485 0.102Antimony mg/L 0.00010 0.00012 0.00014 0.00013 <0.00010 <0.00010 <0.00010 <0.00010 0.00021 0.00018Arsenic mg/L 0.00088 0.00117 0.00105 0.00097 0.00013 0.00011 0.00028 0.00016 0.00153 0.00143Barium mg/L 0.0222 0.0303 0.0125 0.0102 0.00533 0.00514 0.00798 0.00663 0.0355 0.0364Beryllium mg/L <0.00010 <0.00010 <0.00010 <0.00010 <0.00010 <0.00010 <0.00010 <0.00010 <0.00010 <0.00010Bismuth mg/L <0.000050 <0.000050 <0.000050 <0.000050 <0.000050 <0.000050 <0.000050 <0.000050 <0.000050 <0.000050Boron mg/L 0.049 0.046 0.029 0.030 <0.010 <0.010 <0.010 <0.010 0.041 0.042Cadmium mg/L - - <0.0000050 0.0000691 <0.0000050 0.0000096 <0.0000050 <0.0000050 <0.0000050 0.0000109 0.0000136 0.0000117Calcium mg/L 15.3 15.4 43.9 43.3 18.9 18.7 18.7 19.5 57.6 63.1Chromium mg/L <0.00050 <0.00050 <0.00050 <0.00050 <0.00050 <0.00050 <0.00050 <0.00050 <0.00050 <0.00050Cobalt mg/L 0.004 0.011 <0.00010 0.00013 <0.00010 <0.00010 <0.00010 <0.00010 <0.00010 <0.00010 <0.00010 <0.00010
Copper 3 mg/L 0.002 - 0.008 0.007 - 0.021 0.00167 0.00194 0.00292 0.00286 0.00066 0.00061 0.00270 0.00165 0.0154 0.0146Iron mg/L 0.642 1.76 <0.030 <0.030 <0.030 <0.030 0.075 <0.030 0.034 0.101
Lead 3 mg/L 0.005 - 0.011 0.034 - 0.197 <0.000050 0.000219 <0.000050 <0.000050 <0.000050 <0.000050 0.000061 0.000054 <0.000050 0.000061Lithium mg/L <0.0010 <0.0010 <0.0010 <0.0010 0.0013 <0.0010 <0.0010 <0.0010 0.0019 0.0024Magnesium mg/L 2.44 2.52 5.66 5.93 2.13 2.09 2.07 2.21 11.4 13.8
Manganese 3 mg/L 0.83 - 1.5 1.1 - 2.7 0.946 1.28 0.202 0.225 0.00639 0.00129 0.0154 0.00415 0.00353 0.00661Molybdenum mg/L 0.00136 0.00130 0.0110 0.0104 0.000379 0.000326 0.00103 0.000897 0.0127 0.0123
Nickel 3 mg/L <0.00050 <0.00050 <0.00050 <0.00050 <0.00050 <0.00050 <0.00050 <0.00050 <0.00050 <0.00050Potassium mg/L 0.573 0.571 1.49 1.48 0.496 0.491 0.626 0.571 1.71 1.72Selenium mg/L 0.000150 0.000128 0.000851 0.000803 0.000093 0.000074 0.000115 0.000102 0.000925 0.000967Silicon mg/L 3.42 3.42 4.30 4.47 1.80 1.77 1.97 1.96 5.05 5.89Silver mg/L <0.000010 0.000073 <0.000010 0.000039 <0.000010 <0.000010 <0.000010 0.000018 <0.000010 <0.000010Sodium mg/L 2.54 2.41 10.3 10.1 0.956 0.946 1.40 1.24 14.3 15.1Strontium mg/L 0.134 0.143 0.318 0.331 0.138 0.143 0.136 0.144 0.488 0.576Thallium mg/L <0.000010 <0.000010 <0.000010 <0.000010 <0.000010 <0.000010 <0.000010 <0.000010 <0.000010 <0.000010Tin mg/L <0.00010 0.00020 <0.00010 <0.00010 <0.00010 <0.00010 <0.00010 <0.00010 <0.00010 <0.00010Titanium mg/L <0.010 <0.010 <0.010 <0.010 <0.010 <0.010 <0.010 <0.010 <0.010 <0.010Uranium mg/L 0.000042 0.000039 0.000289 0.000257 0.000162 0.000158 0.000220 0.000191 0.00122 0.00140Vanadium mg/L <0.00050 0.00060 0.00090 0.00059 <0.00050 <0.00050 0.00056 <0.00050 0.00146 0.00152
Zinc 3 mg/L 0.0075 - 0.09 0.033 - 0.12 <0.0030 0.0171 <0.0030 0.0039 <0.0030 <0.0030 <0.0030 0.0073 <0.0030 <0.0030Dissolved Metals Aluminum mg/L 0.05 0.10 <0.0030 0.0051 <0.0030 <0.0030 0.0048 0.0049 0.0089 0.0068 0.0095 0.0054Antimony mg/L - - <0.00010 <0.00010 0.00012 0.00010 <0.00010 <0.00010 <0.00010 <0.00010 0.00018 0.00014Arsenic mg/L - - 0.00075 0.00114 0.00097 0.00093 0.00011 <0.00010 0.00015 0.00013 0.00149 0.00137Barium mg/L - - 0.0214 0.0301 0.0107 0.00898 0.00515 0.00504 0.00660 0.00596 0.0356 0.0351Beryllium mg/L - - <0.00010 <0.00010 <0.00010 <0.00010 <0.00010 <0.00010 <0.00010 <0.00010 <0.00010 <0.00010Bismuth mg/L - - <0.000050 <0.000050 <0.000050 <0.000050 <0.000050 <0.000050 <0.000050 <0.000050 <0.000050 <0.000050Boron mg/L - - 0.043 0.044 0.026 0.027 <0.010 <0.010 <0.010 <0.010 0.036 0.037
Cadmium 3 mg/L 0.00013 - 0.00035 0.00029 - 0.0012 <0.0000050 0.0000430 <0.0000050 0.0000089 <0.0000050 <0.0000050 <0.0000050 <0.0000050 0.0000102 0.0000055Calcium mg/L - - 15.4 15.8 44.2 44.9 18.9 18.8 19.3 19.4 60.3 63.6Chromium mg/L - - <0.00050 <0.00050 <0.00050 <0.00050 <0.00050 <0.00050 <0.00050 <0.00050 <0.00050 <0.00050Cobalt mg/L - - <0.00010 0.00014 <0.00010 <0.00010 <0.00010 <0.00010 <0.00010 <0.00010 <0.00010 <0.00010Copper mg/L - - 0.00123 0.00128 0.00223 0.00220 0.00064 <0.00050 0.00125 0.00109 0.0143 0.0114Iron mg/L 0.518 1.70 <0.030 <0.030 <0.030 <0.030 <0.030 <0.030 <0.030 <0.030Lead mg/L - - <0.000050 0.000057 <0.000050 <0.000050 <0.000050 <0.000050 <0.000050 <0.000050 <0.000050 <0.000050Lithium mg/L - - <0.0010 <0.0010 <0.0010 <0.0010 0.0012 0.0011 <0.0010 0.0011 0.0016 0.0019Magnesium mg/L - - 2.47 2.60 5.65 6.00 2.15 2.06 2.10 2.16 11.8 13.9Manganese mg/L - - 0.921 1.29 0.00261 0.00661 0.00532 0.00047 0.0117 0.00107 0.00240 0.00348Molybdenum mg/L - - 0.00130 0.00122 0.0101 0.00930 0.000315 0.000323 0.000957 0.000780 0.0123 0.0112Nickel mg/L - - <0.00050 <0.00050 <0.00050 <0.00050 <0.00050 <0.00050 <0.00050 <0.00050 <0.00050 <0.00050Potassium mg/L - - 0.565 0.595 1.46 1.46 0.478 0.486 0.588 0.548 1.73 1.67Selenium mg/L - - 0.000159 0.000170 0.000893 0.000790 0.000082 0.000086 0.000098 0.000089 0.00101 0.000910Silicon mg/L - - 3.38 3.45 4.17 4.43 1.76 1.70 1.85 1.84 5.11 5.71Silver mg/L - - <0.000010 <0.000010 <0.000010 <0.000010 <0.000010 <0.000010 <0.000010 <0.000010 <0.000010 <0.000010Sodium mg/L - - 2.44 2.44 9.99 9.93 0.992 0.927 1.30 1.19 14.4 14.6Strontium mg/L - - 0.130 0.139 0.311 0.318 0.136 0.135 0.131 0.137 0.485 0.552Thallium mg/L - - <0.000010 0.000021 <0.000010 <0.000010 <0.000010 <0.000010 <0.000010 <0.000010 <0.000010 0.000012Tin mg/L - - <0.00010 <0.00010 <0.00010 <0.00010 <0.00010 <0.00010 <0.00010 <0.00010 <0.00010 <0.00010Titanium mg/L - - <0.010 <0.010 <0.010 <0.010 <0.010 <0.010 <0.010 <0.010 <0.010 <0.010Uranium mg/L - - 0.000039 0.000036 0.000269 0.000234 0.000154 0.000141 0.000206 0.000167 0.00119 0.00128Vanadium mg/L - - <0.00050 0.00057 0.00051 <0.00050 <0.00050 <0.00050 <0.00050 <0.00050 0.00123 0.00099Zinc mg/L - - <0.0030 0.0341 <0.0030 0.0061 <0.0030 <0.0030 <0.0030 <0.0030 <0.0030 <0.0030
1 British Columbia Water Quality Guidelines (BCMOE 2015a,b) except for molybdenum, which is the Canadian Water Quality Guideline (CCME 2015). Guidelines applied as chronic (long term) unless separate 30-day and maximum guidelines are available 2 Ammonia guideline values were selected based on a high pH (8.4) and temperature (15⁰C)3 Concurrent hardness values were used for all screening against hardness-based water quality guidelines; see Appendix Table C.1 for applicable equations 4 Guideline of 0.005 to 0.015 mg/L (inclusive) is not applied as too few samples are available for adequate application yellow shading indicates a concentration greater than an applicable guideline (long term)
Analyte
Quesnel Lake Profundal
Reference(Bootjack Lake)
Exposed(Polley Lake P2)
Reference(Horsefly Bay)
Exposed(Near-field)
PNFPREF1POL-P2BOL-B2
Polley LakeBootjack LakeHazeltine CreekGuidelines for the Protection of
Aquatic Life 1
Units
30-day MaximumHAC
6.5 - 9.0narrative
narrative
10-20 minimum
narrative
0.002
0.35
- 4
1.0
1.1 - 1.6
218 - 429
0.0730.06 - 0.16
0.0090.0051.0
1.2
0.001 CrVI; 0.0089 CrIII

APPENDIX D
DGT (DIFFUSIVE GRADIENTS IN THIN FILMS) DATA

Table D.1: Mass of Metals extracted by Diffusive Gradients in Thin Films (DGT), Mount Polley Mine, August to October, 2015 a,b,c
Client ID HAC-1 HAC-2 HAC-3 HAC-4 P2-1 P2-2 P2-3 P2-4 B2-1 B2-2 B2-3 B2-4Deployment time 38.2 days 38.2 days 38.2 days 38.1 days 38.2 days 38.2 days 38.2 days 38.2 days 37.9 days 37.9 days 37.8 days 37.8 days
Temperature 10.9 °C 11.1 °C 11.2 °C 11.2 °C Mean SD 6.05 °C 6.05 °C 6.05 °C 6.05 °C Mean SD 8.65 °C 8.65 °C 8.65 °C 8.65 °C Mean SDMetal Name MDL RDL UnitsAluminum (Al) 0.59 1.96 µg 2.19 5.49 2.35 <RDL 3.00 1.67 <MDL <MDL <MDL <MDL <0.59 - <MDL <MDL <MDL <MDL <0.59 -
Antimony (Sb) 0.025 0.13 µg <MDL <MDL <MDL <MDL <0.025 - <MDL <MDL <MDL <MDL <0.025 - <MDL <MDL <MDL <MDL <0.025 -
Arsenic (As) 0.025 0.13 µg <RDL <RDL <RDL <RDL <0.13 - <RDL <RDL <RDL <RDL <0.13 - <RDL <RDL <RDL <RDL <0.13 -
Barium (Ba) 0.063 0.25 µg 6.87 9.60 5.01 4.81 6.57 2.22 1.76 1.86 1.99 1.84 1.86 0.10 2.70 3.14 3.43 3.98 3.31 0.54Beryllium (Be) 0.013 0.063 µg <MDL <MDL <MDL <MDL <0.013 - <MDL <MDL <MDL <MDL <0.013 - <MDL <MDL <MDL <MDL <0.013 -
Bismuth (Bi) 0.077 0.26 µg <MDL <MDL <MDL <MDL <0.077 - <MDL <MDL <MDL <MDL <0.077 - <MDL <MDL <MDL <MDL <0.077 -
Boron (B) 0.25 1.3 µg <MDL <MDL <MDL <RDL <0.25 - <MDL <RDL <RDL <RDL <1.3 - <RDL <RDL <MDL <RDL <1.3 -
Cadmium (Cd) 0.0025 0.013 µg <MDL <MDL <MDL <RDL <0.0025 - <MDL <MDL <MDL <MDL <0.0025 - <MDL <MDL <MDL <MDL <0.0025 -
Calcium (Ca) 20 66 µg 168 210 152 158 172 26 112 114 134 103 116 13 <RDL <RDL <RDL <RDL <66 -
Chromium (Cr) 0.125 0.63 µg <MDL <MDL <MDL <MDL <0.125 - <MDL <MDL <MDL <MDL <0.125 - <MDL <MDL <MDL <MDL <0.125 -
Cobalt (Co) 0.013 0.063 µg <MDL <MDL <MDL <MDL <0.013 - <MDL <MDL <MDL <MDL <0.013 - <RDL <RDL <RDL <RDL <0.013 -
Copper (Cu) 0.025 0.13 µg 2.34 2.64 2.37 2.18 2.38 0.19 0.15 <RDL 0.14 0.16 0.15 0.01 <RDL <RDL <RDL <RDL <0.13 -
Iron (Fe) 1.25 6.3 µg <MDL <MDL <MDL <MDL <1.25 - <MDL <MDL <MDL <MDL <1.25 - 145 147 113 142 137 16Lead (Pb) 0.013 0.063 µg <MDL <MDL <MDL <MDL <0.013 - <MDL <MDL <MDL <MDL <0.013 - <MDL <MDL <MDL <MDL <0.013 -
Lithium (Li) 0.125 0.63 µg <MDL <MDL <MDL <MDL <0.125 - <MDL <MDL <MDL <MDL <0.125 - <MDL <MDL <MDL <MDL <0.125 -
Magnesium (Mg) 1.25 6.3 µg 7.78 9.3 7.5 <RDL 7.7 1.2 <MDL <MDL <RDL <MDL <6.3 - <MDL <MDL <MDL <MDL <1.25 -
Manganese (Mn) 0.05 0.25 µg 0.68 1.05 0.68 0.65 0.77 0.19 3.18 2.71 2.00 2.87 2.69 0.50 18.41 20.83 22.61 28.22 22.5 4.2Molybdenum (Mo) 0.044 0.15 µg <RDL <RDL <RDL <MDL <0.15 - 1.16 1.20 1.30 1.24 1.23 0.06 0.22 0.23 0.23 0.24 0.23 0.01Nickel (Ni) 0.095 0.32 µg <MDL <MDL <MDL <MDL <0.095 - <MDL <MDL <MDL <MDL <0.095 - <MDL <MDL <MDL <MDL <0.095 -
Phosphorus (P) 1.25 6.3 µg <MDL <MDL <MDL <MDL <1.25 - <RDL <RDL <RDL <RDL <1.25 - 11.46 14.73 15.77 18.5 15.1 2.9Potassium (K) 5 25 µg <MDL <MDL <MDL <MDL <5 - <MDL <MDL <MDL <MDL <5 - <MDL <MDL <MDL <MDL <5 -
Selenium (Se) 0.05 0.25 µg <MDL <MDL <MDL <MDL <0.05 - <MDL <MDL <MDL <MDL <0.05 - <MDL <MDL <MDL <MDL <0.05 -
Strontium (Sr) 0.082 0.27 µg 1.97 3.22 1.28 1.28 1.94 0.91 0.88 0.94 1.15 0.97 0.99 0.12 0.62 0.70 0.69 0.82 0.71 0.08Silver (Ag) 0.0025 0.013 µg <RDL <MDL <MDL <MDL <0.0025 - <MDL <MDL <MDL <MDL <0.0025 - <MDL <MDL <MDL <MDL <0.0025 -
Sodium (Na) 94000 310000 µg <MDL <MDL <MDL <MDL <94000 - <MDL <MDL <MDL <MDL <94000 - <MDL <MDL <MDL <MDL <94000 -
Thallium (Tl) 0.0013 0.013 µg <MDL <MDL <MDL <MDL <0.0013 - <MDL <MDL <MDL <MDL <0.0013 - <MDL <MDL <MDL <MDL <0.0013 -
Tin (Sn) 0.092 0.31 µg <MDL <MDL <MDL <MDL <0.092 - <MDL <MDL <MDL <MDL <0.092 - <MDL <MDL <MDL <MDL <0.092 -
Uranium (U) 0.0025 0.013 µg 0.020 0.034 <RDL <RDL 0.020 0.010 0.04 0.04 0.04 0.04 0.04 0.00 <MDL <MDL <MDL <MDL <0.0025 -
Vanadium (V) 0.025 0.063 µg 0.29 0.36 0.36 0.30 0.33 0.04 0.15 0.14 0.16 0.16 0.15 0.01 <MDL <MDL <MDL <MDL <0.025 -
Zinc (Zn) 0.125 0.63 µg <MDL <MDL <MDL <MDL <0.125 - <MDL <MDL <MDL <MDL <0.125 - <MDL <MDL <MDL <MDL <0.125 -
a mean and standard deviation calculated using substitution of the method detection limit (MDL) or reporting detection limit (RDL)b in cases where all replicates were reported as less than MDL or RDL, the mean is reported as the applicable MDL or RDLc in cases where results were a mixture of less than MDL and less than RDL, the mean is reported as less than RDL
Mass Extracted by DGT
Hazeltine Creek
Hazeltine Creek Polley Lake
Polley Lake
Bootjack Lake
Bootjack Lake
Page 1 of 2

Table D.1: Mass of Metals extracted by Diffusive Gradients in Thin Films (DGT), Mount Polley Mine, August to October, 2015 a,b,c
Client IDDeployment timeTemperatureMetal Name MDL RDL UnitsAluminum (Al) 0.59 1.96 µg
Antimony (Sb) 0.025 0.13 µg
Arsenic (As) 0.025 0.13 µg
Barium (Ba) 0.063 0.25 µg
Beryllium (Be) 0.013 0.063 µg
Bismuth (Bi) 0.077 0.26 µg
Boron (B) 0.25 1.3 µg
Cadmium (Cd) 0.0025 0.013 µg
Calcium (Ca) 20 66 µg
Chromium (Cr) 0.125 0.63 µg
Cobalt (Co) 0.013 0.063 µg
Copper (Cu) 0.025 0.13 µg
Iron (Fe) 1.25 6.3 µg
Lead (Pb) 0.013 0.063 µg
Lithium (Li) 0.125 0.63 µg
Magnesium (Mg) 1.25 6.3 µg
Manganese (Mn) 0.05 0.25 µg
Molybdenum (Mo) 0.044 0.15 µg
Nickel (Ni) 0.095 0.32 µg
Phosphorus (P) 1.25 6.3 µg
Potassium (K) 5 25 µg
Selenium (Se) 0.05 0.25 µg
Strontium (Sr) 0.082 0.27 µg
Silver (Ag) 0.0025 0.013 µg
Sodium (Na) 94000 310000 µg
Thallium (Tl) 0.0013 0.013 µg
Tin (Sn) 0.092 0.31 µg
Uranium (U) 0.0025 0.013 µg
Vanadium (V) 0.025 0.063 µg
Zinc (Zn) 0.125 0.63 µg
a mean and standard deviation calculated using substitution of the meb in cases where all replicates were reported as less than MDL or RDLc in cases where results were a mixture of less than MDL and less tha
PNF-1 PNF-2 PNF-3 PNF-4 PRef1-1 PRef1-2 PRef1-3 PRef1-435.6 days 35.6 days 35.6 days 35.6 days 34.3 days 34.3 days 34.3 days 34.2 days
4.55 °C 4.55 °C 4.55 °C 4.55 °C Mean SD 3.9 °C 3.9 °C 3.9 °C 3.9 °C Mean SD
<RDL 3.36 <RDL <RDL 2.31 0.70 <RDL <RDL 3.08 <RDL 2.24 0.56<MDL <MDL <MDL <MDL <0.025 - <MDL <MDL <MDL <MDL <0.025 -
<MDL <MDL <MDL <MDL <0.025 - <MDL <MDL <MDL <MDL <0.025 -
1.88 1.73 1.42 1.98 1.75 0.24 1.49 1.44 1.6 1.49 1.51 0.07<MDL <MDL <MDL <MDL <0.013 - <MDL <MDL <MDL <MDL <0.013 -
<MDL <MDL <MDL <MDL <0.077 - <MDL <MDL <MDL <MDL <0.077 -
<MDL <MDL <RDL <RDL <1.3 - <RDL <MDL <RDL <MDL <1.3 -
<MDL <MDL <MDL <MDL <0.0025 - <MDL <MDL <MDL <MDL <0.0025 -
139 125 119 118 125 10 83 121 131 132 117 23<MDL <MDL <MDL <MDL <0.125 - <MDL <MDL <MDL <MDL <0.125 -
<MDL <MDL <MDL <MDL <0.013 - <MDL <MDL <MDL <MDL <0.013 -
<RDL <RDL <RDL <RDL <0.13 <RDL <RDL <RDL <MDL <0.13 -
<MDL <RDL <MDL <MDL <6.3 <MDL <MDL <MDL <MDL <1.25 -<MDL <MDL <MDL <MDL <0.013 - <MDL <MDL <MDL <MDL <0.013 -
<MDL <MDL <MDL <MDL <0.125 - <MDL <MDL <MDL <MDL <0.125 -
<MDL <MDL <MDL <MDL <1.25 - <MDL <MDL <MDL <MDL <1.25 -
1.05 1.3 1.03 1.17 1.14 0.12 1.13 0.60 1.28 1.74 1.19 0.47<RDL <RDL <RDL <RDL <0.15 <MDL <MDL <MDL <RDL <0.15 -
<MDL <MDL <MDL <MDL <0.095 - <MDL <MDL <MDL <MDL <0.095 -
<MDL <MDL <MDL <MDL <1.25 - <MDL <MDL <MDL <MDL <1.25 -
<MDL <MDL <MDL <MDL <5 - <MDL <MDL <MDL <MDL <5 -
<MDL <MDL <MDL <MDL <0.05 - <MDL <MDL <MDL <MDL <0.05 -
0.98 0.83 0.65 0.89 0.84 0.14 0.68 0.92 0.93 0.92 0.86 0.12<MDL <MDL <MDL <MDL <0.0025 - <MDL <MDL <MDL <MDL <0.0025 -
<MDL <MDL <MDL <MDL <94000 - <MDL <MDL <MDL <MDL <94000 -
<MDL <MDL <MDL <MDL <0.0013 - <MDL <MDL <MDL <MDL <0.0013 -
<MDL <RDL <MDL <MDL <0.092 - <MDL <MDL <MDL <MDL <0.092 -
0.03 0.03 0.03 0.03 0.03 0.00 0.03 0.02 0.02 0.02 0.02 0.00<RDL <RDL <MDL <RDL <0.063 - <MDL <MDL <MDL <MDL <0.025 -<MDL 6.73 <MDL <MDL 1.78 3.30 <MDL <MDL <MDL <MDL <0.125 -
Quesnel Lake Profundal Exposed
Quesnel Lake Profundal Reference
Quesnel Lake Profundal Exposed Quesnel Lake Profundal Reference
Mass Extracted by DGT
Page 2 of 2

Table D.2: Calculated labile metal concentrations using Diffusive Gradients in Thin Films (DGT), Mount Polley Mine, August to October 2015 a,b,c
Client ID HAC-1 HAC-2 HAC-3 HAC-4 P2-1 P2-2 P2-3 P2-4 B2-1 B2-2 B2-3 B2-438.2 days 38.2 days 38.2 days 38.1 days 38.2 days 38.2 days 38.2 days 38.2 days 37.9 days 37.9 days 37.8 days 37.8 days
10.9 °C 11.1 °C 11.2 °C 11.2 °C Mean SD 6.0 °C 6.0 °C 6.0 °C 6.0 °C Mean SD 8.6 °C 8.6 °C 8.6 °C 8.6 °C Mean SDMetal Name MDLw RDLw UnitsAluminum (Al) 1.6 5.4 μg/L 6.1 15 6.5 <RDLw 8.3 4.5 <MDLw <MDLw <MDLw <MDLw <1.6 - <MDLw <MDLw <MDLw <MDLw <1.6 -
Antimony (Sb) 0.053 0.26 μg/L <MDLw <MDLw <MDLw <MDLw <0.053 - <MDLw <MDLw <MDLw <MDLw <0.053 - <MDLw <MDLw <MDLw <MDLw <0.053 -
Arsenic (As) 0.054 0.27 μg/L <RDLw <RDLw <RDLw <RDLw <0.27 - <RDLw <RDLw <RDLw <RDLw <0.27 - <RDLw <RDLw <RDLw <RDLw <0.27 -
Barium (Ba) 0.17 0.68 μg/L 19 26 14 13 18.0 5.9 5.7 6 6.4 5.9 6.0 0.3 8.1 9.4 10 12 9.9 1.6Beryllium (Be) 0.054 0.27 μg/L <MDLw <MDLw <MDLw <MDLw <0.054 - <MDLw <MDLw <MDLw <MDLw <0.054 - <MDLw <MDLw <MDLw <MDLw <0.054 -
Bismuth (Bi) n/a n/a μg/L n/a n/a n/a n/a - - n/a n/a n/a n/a - - n/a n/a n/a n/a - -
Boron (B) n/a n/a μg/L n/a n/a n/a n/a - - n/a n/a n/a n/a - - n/a n/a n/a n/a - -
Cadmium (Cd) 0.0059 0.029 μg/L <MDLw <MDLw <MDLw <RDLw <0.029 - <MDLw <MDLw <MDLw <MDLw <0.0059 - <MDLw <MDLw <MDLw <MDLw <0.0059 -
Calcium (Ca) 33 109 μg/L 280 350 250 260 285 45 220 220 260 200 225 25 <RDLw <RDLw <RDLw <RDLw <109 -
Chromium (Cr) 0.32 1.6 μg/L <MDLw <MDLw <MDLw <MDLw <0.32 - <MDLw <MDLw <MDLw <MDLw <0.32 - <MDLw <MDLw <MDLw <MDLw <0.32 -
Cobalt (Co) 0.031 0.15 μg/L <MDLw <MDLw <MDLw <MDLw <0.031 - <MDLw <MDLw <MDLw <MDLw <0.031 - <RDLw <RDLw <RDLw <RDLw <0.15 -
Copper (Cu) 0.058 0.29 μg/L 5.5 6.2 5.5 5.1 5.6 0.5 0.42 <RDLw 0.39 0.45 0.39 0.07 <RDLw <RDLw <RDLw <RDLw <0.29 -
Iron (Fe) 2.7 13 μg/L <MDLw <MDLw <MDLw <MDLw <2.7 - <MDLw <MDLw <MDLw <MDLw <2.7 - 340 350 264 333 322 39Lead (Pb) 0.02 0.1 μg/L <MDLw <MDLw <MDLw <MDLw <0.02 - <MDLw <MDLw <MDLw <MDLw <0.02 - <MDLw <MDLw <MDLw <MDLw <0.02 -
Lithium (Li) 0.16 0.79 μg/L <MDLw <MDLw <MDLw <MDLw <0.16 - <MDLw <MDLw <MDLw <MDLw <0.16 - <MDLw <MDLw <MDLw <MDLw <0.16 -
Magnesium (Mg) 2.3 12 μg/L 15 17 14 <RDLw 14.5 2.1 <MDLw <MDLw <RDLw <MDLw <12 - <MDLw <MDLw <MDLw <MDLw <2.3
Manganese (Mn) 0.14 0.7 μg/L 1.9 2.9 1.9 1.8 2.1 0.5 11 9 6.6 9.5 9.0 1.8 56 64 69 86 69 13Molybdenum (Mo) 0.091 0.3 μg/L <RDLw <RDLw <RDLw <MDLw <0.3 - 2.8 2.9 3.2 3.0 3.0 0.2 0.51 0.53 0.52 0.54 0.53 0.01Nickel (Ni) 0.24 0.81 μg/L <MDLw <MDLw <MDLw <MDLw <0.24 - <MDLw <MDLw <MDLw <MDLw <0.24 - <MDLw <MDLw <MDLw <MDLw <0.24 -
Phosphorus (P) 2.7 13 μg/L <MDLw <MDLw <MDLw <MDLw <2.7 - <RDLw <RDLw <RDLw <RDLw <13 - 27 35 37 44 36 7Potassium (K) 3.3 17 µg/L <MDLw <MDLw <MDLw <MDLw <3.3 - <MDLw <MDLw <MDLw <MDLw <3.3 - <MDLw <MDLw <MDLw <MDLw <3.3 -
Selenium (Se) 0.073 0.37 μg/L <MDLw <MDLw <MDLw <MDLw <0.073 - <MDLw <MDLw <MDLw <MDLw <0.073 - <MDLw <MDLw <MDLw <MDLw <0.073 -
Silver (Ag) 0.0023 0.012 μg/L <RDLw <MDLw <MDLw <MDLw <0.012 - <MDLw <MDLw <MDLw <MDLw <0.0023 - <MDLw <MDLw <MDLw <MDLw <0.0023 -
Sodium (Na) 93000 310000 μg/L <MDLw <MDLw <MDLw <MDLw <93000 - <MDLw <MDLw <MDLw <MDLw <93000 - <MDLw <MDLw <MDLw <MDLw <93000 -
Strontium (Sr) 0.13 0.45 μg/L 3.3 5.3 2.1 2.1 3.2 1.5 1.7 1.8 2.2 1.9 1.9 0.2 1.1 1.3 1.2 1.5 1.3 0.2Thallium (Tl) 0.00081 0.0041 μg/L <MDLw <MDLw <MDLw <MDLw <0.00081 - <MDLw <MDLw <MDLw <MDLw <0.00081 - <MDLw <MDLw <MDLw <MDLw <0.00081 -
Tin (Sn) n/a n/a μg/L n/a n/a n/a n/a - - n/a n/a n/a n/a - - n/a n/a n/a n/a - -
Titanium (Ti) n/a n/a μg/L n/a n/a n/a n/a - - n/a n/a n/a n/a - - n/a n/a n/a n/a - -
Uranium (U) 0.0047 0.024 μg/L 0.041 0.064 <RDLw <RDLw 0.038 0.019 0.086 0.093 0.091 0.094 0.091 0.004 <MDLw <MDLw <MDLw <MDLw <0.0047 -
Vanadium (V) 0.059 0.15 μg/L 0.7 0.85 0.85 0.69 0.77 0.09 0.43 0.39 0.46 0.44 0.43 0.03 <MDLw <MDLw <MDLw <MDLw <0.059 -
Zinc (Zn) 0.2 1 μg/L <MDLw <MDLw <MDLw <MDLw <0.2 - <MDLw <MDLw <MDLw <MDLw <0.2 - <MDLw <MDLw <MDLw <MDLw <0.2 -
a mean and standard deviation calculated using substitution of the method detection limit (MDL) or reporting detection limit (RDL)b in cases where all replicates were reported as less than MDL or RDL, the mean is reported as the applicable MDL or RDLc in cases where results were a mixture of less than MDL and less than RDL, the mean is reported as less than RDL
Deployment timeTemperature
Calculated Labile Metals Extracted by DGT
Polley Lake Bootjack LakeHazeltine Creek
Hazeltine Creek Polley Lake Bootjack Lake
Page 1 of 2

Table D.2: Calculated labile metal concentrations using Diffusive Gradients in Thin Films (DGT), Mount Polley Mine, August to October 2015 a,b,c
Client ID
Metal Name MDLw RDLw UnitsAluminum (Al) 1.6 5.4 μg/L
Antimony (Sb) 0.053 0.26 μg/L
Arsenic (As) 0.054 0.27 μg/L
Barium (Ba) 0.17 0.68 μg/L
Beryllium (Be) 0.054 0.27 μg/L
Bismuth (Bi) n/a n/a μg/L
Boron (B) n/a n/a μg/L
Cadmium (Cd) 0.0059 0.029 μg/L
Calcium (Ca) 33 109 μg/L
Chromium (Cr) 0.32 1.6 μg/L
Cobalt (Co) 0.031 0.15 μg/L
Copper (Cu) 0.058 0.29 μg/L
Iron (Fe) 2.7 13 μg/L
Lead (Pb) 0.02 0.1 μg/L
Lithium (Li) 0.16 0.79 μg/L
Magnesium (Mg) 2.3 12 μg/L
Manganese (Mn) 0.14 0.7 μg/L
Molybdenum (Mo) 0.091 0.3 μg/L
Nickel (Ni) 0.24 0.81 μg/L
Phosphorus (P) 2.7 13 μg/L
Potassium (K) 3.3 17 µg/L
Selenium (Se) 0.073 0.37 μg/L
Silver (Ag) 0.0023 0.012 μg/L
Sodium (Na) 93000 310000 μg/L
Strontium (Sr) 0.13 0.45 μg/L
Thallium (Tl) 0.00081 0.0041 μg/L
Tin (Sn) n/a n/a μg/L
Titanium (Ti) n/a n/a μg/L
Uranium (U) 0.0047 0.024 μg/L
Vanadium (V) 0.059 0.15 μg/L
Zinc (Zn) 0.2 1 μg/L
Deployment timeTemperature
PNF-1 PNF-2 PNF-3 PNF-4 PRef1-1 PRef1-2 PRef1-3 PRef1-435.6 days 35.6 days 35.6 days 35.6 days 34.3 days 34.3 days 34.3 days 34.2 days
4.5 °C 4.5 °C 4.5 °C 4.5 °C Mean SD 3.9 °C 3.9 °C 3.9 °C 3.9 °C Mean SD
<RDLw 12 <RDLw <RDLw 7.1 3.3 <RDLw <RDLw 12 <RDLw 7.1 3.3<MDLw <MDLw <MDLw <MDLw <0.053 - <MDLw <MDLw <MDLw <MDLw <0.053 -
<MDLw <MDLw <MDLw <MDLw <0.054 - <MDLw <MDLw <MDLw <MDLw <0.054 -
6.9 6.3 5.2 7.2 6.4 0.9 5.8 5.6 6.2 5.8 5.9 0.3<MDLw <MDLw <MDLw <MDLw <0.054 - <MDLw <MDLw <MDLw <MDLw <0.054 -
n/a n/a n/a n/a - - n/a n/a n/a n/a - -
n/a n/a n/a n/a - - n/a n/a n/a n/a - -
<MDLw <MDLw <MDLw <MDLw <0.0059 - <MDLw <MDLw <MDLw <MDLw <0.0059 -
310 280 260 260 278 24 200 290 310 310 278 53<MDLw <MDLw <MDLw <MDLw <0.32 - <MDLw <MDLw <MDLw <MDLw <0.32 -
<MDLw <MDLw <MDLw <MDLw <0.031 - <MDLw <MDLw <MDLw <MDLw <0.031 -
<RDLw <RDLw <RDLw <RDLw <0.29 - <RDLw <RDLw <RDLw <MDLw <0.29 -
<MDLw <RDLw <MDLw <MDLw <2.7 - <MDLw <MDLw <MDLw <MDLw <2.7 -
<MDLw <MDLw <MDLw <MDLw <0.02 - <MDLw <MDLw <MDLw <MDLw <0.02 -
<MDLw <MDLw <MDLw <MDLw <0.16 - <MDLw <MDLw <MDLw <MDLw <0.16 -
<MDLw <MDLw <MDLw <MDLw <2.3 <MDLw <MDLw <MDLw <MDLw <2.3
3.9 4.9 3.9 4.4 4.3 0.5 4.5 2.4 5.1 7.0 4.8 1.9<RDLw <RDLw <RDLw <RDLw <0.3 - <MDLw <MDLw <MDLw <RDLw <0.3 -
<MDLw <MDLw <MDLw <MDLw <0.24 - <MDLw <MDLw <MDLw <MDLw <0.24 -
<MDLw <MDLw <MDLw <MDLw <2.7 - <MDLw <MDLw <MDLw <MDLw <2.7 -
<MDLw <MDLw <MDLw <MDLw <3.3 - <MDLw <MDLw <MDLw <MDLw <3.3 -
<MDLw <MDLw <MDLw <MDLw <0.073 - <MDLw <MDLw <MDLw <MDLw <0.073 -
<MDLw <MDLw <MDLw <MDLw <0.0023 - <MDLw <MDLw <MDLw <MDLw <0.0023 -
<MDLw <MDLw <MDLw <MDLw <93000 - <MDLw <MDLw <MDLw <MDLw <93000 -
2.2 1.8 1.4 2.0 1.9 0.3 1.6 2.2 2.2 2.2 2.1 0.3<MDLw <MDLw <MDLw <MDLw <0.00081 - <MDLw <MDLw <MDLw <MDLw <0.00081 -
n/a n/a n/a n/a - - n/a n/a n/a n/a - -
n/a n/a n/a n/a - - n/a n/a n/a n/a - -
0.072 0.078 0.075 0.086 0.078 0.006 0.07 0.054 0.061 0.058 0.061 0.007<RDLw <RDLw <MDLw <RDLw <0.15 - <MDLw <MDLw <MDLw <MDLw <0.059 -
<MDLw 15 <MDLw <MDLw 3.9 7.4 <MDLw <MDLw <MDLw <MDLw <0.2 -
a mean and standard deviation calculated using substitution of the method detection limit (MDL) or reporting detection limit (RDL)b in cases where all replicates were reported as less than MDL or RDL, the mean is reported as the applicable MDL or RDLc in cases where results were a mixture of less than MDL and less than RDL, the mean is reported as less than RDL
Quesnel Lake Profundal Reference
Calculated Labile Metals Extracted by DGT
Quesnel Lake Profundal Exposed
Quesnel Lake Profundal Reference
Quesnel Lake Profundal Exposed
Page 2 of 2

Appendix Table D.3: Comparison of Concentrations of Parameters of Interest in Sediment and Water (Total, Dissolved and DGT-Labile)
Copper in Sediment and Water
Total Dissolved DGT-Labilemg/kg mg/L mg/L mg/L T / S 1 D / S 2 D / T 3 DGT / T 4 DGT / D 5
Hazeltine Creek 469 0.015 0.013 0.0056 0.0032% 0.0027% 86% 37% 44%Polley Lake 823 0.0029 0.0022 0.00039 0.0004% 0.0003% 77% 13% 18%Bootjack Lake 382 0.0018 0.0013 <0.00029 0.0005% 0.0003% 70% < 16% < 23%Quesnel Lake - Exposed 859 0.0022 0.0012 <0.00029 0.0003% 0.0001% 54% < 13% < 25%Quesnel Lake - Reference 55.1 0.00064 0.00057 <0.00029 0.0012% 0.0010% 90% < 46% < 51%
Iron in Sediment and Water
Total Dissolved DGT-Labilemg/kg mg/L mg/L mg/L T / S 1 D / S 2 D / T 3 DGT / T 4 DGT / D 5
Hazeltine Creek 50,580 0.068 <0.030 <0.0027 0.0001% < 0.0001% < 44% < 4% -Polley Lake 29,760 <0.030 <0.030 <0.0027 - - - - -Bootjack Lake 30,067 1.2 1.1 0.32 0.0040% 0.0037% 92% 27% 29%Quesnel Lake - Exposed 40,620 <0.030 <0.030 <0.013 - - - - -Quesnel Lake - Reference 31,300 <0.030 <0.030 <0.0027 - - - - -
Manganese in Sediment and Water
Total Dissolved DGT-Labilemg/kg mg/L mg/L mg/L T / S 1 D / S 2 D / T 3 DGT / T 4 DGT / D 5
Hazeltine Creek 725 0.00507 0.00294 0.0021 0.0007% 0.0004% 58% 41% 71%Polley Lake 2,574 0.2135 0.0046 0.0090 0.0083% 0.0002% 2% 4% 195%Bootjack Lake 3,327 1.113 1.106 0.069 0.0335% 0.0332% 99% 6% 6%Quesnel Lake - Exposed 1,033 0.0098 0.006385 0.0043 0.0009% 0.0006% 65% 44% 67%Quesnel Lake - Reference 491 0.00384 0.002895 0.0048 0.0008% 0.0006% 75% 125% 166%
Molybdenum in Sediment and Water
Total Dissolved DGT-Labilemg/kg mg/L mg/L mg/L T / S 1 D / S 2 D / T 3 DGT / T 4 DGT / D 5
Hazeltine Creek 2.47 0.0130 0.0120 <0.0003 0.5263% 0.4858% 92% < 2% < 3%Polley Lake 10.1 0.011 0.010 0.0030 0.1059% 0.0960% 91% 28% 31%Bootjack Lake 4.32 0.0013 0.0013 0.0005 0.0301% 0.0301% 100% 38% 38%Quesnel Lake - Exposed 4.05 0.0010 0.0009 <0.0003 0.0237% 0.0215% 91% < 31% < 34%Quesnel Lake - Reference 1.08 0.00035 0.00032 <0.0003 0.0324% 0.0296% 91% < 86% < 94%
Phosphorus in Sediment and Water
Total Dissolved DGT-Labilemg/kg mg/L mg/L mg/L T / S 1 D / S 2 D / T 3 DGT / T 4 DGT / D 5
Hazeltine Creek 1,558 0.0101 0.0079 <0.0027 0.0006% 0.0005% 78% < 27% < 34%Polley Lake 1,200 0.0840 0.0890 <0.013 0.0070% 0.0074% 106% < 15% < 15%Bootjack Lake 2,537 0.153 0.105 0.036 0.0060% 0.0041% 69% 24% 34%Quesnel Lake - Exposed 1,352 0.0036 0.0026 <0.0027 0.0003% 0.0002% 72% < 75% < 104%Quesnel Lake - Reference 1,180 0.0022 0.0025 <0.0027 < 0.0002% 0.0002% 114% < 123% < 108%
Zinc in Sediment and Water
Total Dissolved DGT-Labilemg/kg mg/L mg/L mg/L T / S 1 D / S 2 D / T 3 DGT / T 4 DGT / D 5
Hazeltine Creek 73.9 <0.0030 <0.0030 <0.0002 - - - - -Polley Lake 86.4 0.0035 0.0046 <0.0002 0.0040% 0.0053% 132% < 6% < 4%Bootjack Lake 82.8 0.010 0.019 <0.0002 0.0121% 0.0224% 185% < 2% < 1%Quesnel Lake - Exposed 96.0 0.0052 <0.0030 0.0039 0.0054% < 0.0031% < 58% 76% > 100%Quesnel Lake - Reference 79.8 <0.0030 <0.0030 <0.0002 < 0.0038% < 0.0038% - - -
1 total water / sediment; 2 dissolved water / sediemnt; 3 dissolved water / total water; 4 DGT-labile water / total water; 5 DGT-labile water / dissolved water
Sampling Area
Sediment
Water
Water
Sampling Area
Sediment
RATIOS
RATIOS
RATIOS
RATIOS
Water
Water
Water RATIOS
Water RATIOS
Sampling Area
Sediment
Sampling Area
Sediment
Sampling Area
Sediment
Sampling Area
Sediment

Appendix Figure D.1: Copper concentrations measured in water, Mount Polley 2015. a) DGT-labile; b) total, dissolved and DGT-labile (full y-axis); c) total, dissolved and DGT-labile (truncated y-axis); d) proportions (dissolved/total, DGT-labile/total and DGT-labile/dissolved)
0.000
0.005
0.010
0.015
0.020
0.025
HazeltineCreek
PolleyLake (P2)
BootjackLake (B2)
Quesnel LakeProfundalExposed
Quesnel LakeProfundalReference
Cop
per (
mg/
L)
T D DGT BCWG - 30 dayBCWQG - maximum
0%10%20%30%40%50%60%70%80%90%
100%
HazeltineCreek
PolleyLake (P2)
BootjackLake (B2)
Quesnel LakeProfundalExposed
Quesnel LakeProfundalReference
Cop
per R
atio
sD/T DGT / T DGT / D
BCWQG ‐maximum
0.000
0.002
0.004
0.006
0.008
0.010
0.012
0.014
0.016
HazeltineCreek
PolleyLake (P2)
BootjackLake (B2)
Quesnel LakeProfundalExposed
Quesnel LakeProfundalReference
Cop
per (
mg/
L)
T D DGT BCWQG - maximumBCWQG - 30 day
0.000
0.001
0.002
0.003
0.004
0.005
0.006
0.007
HazeltineCreek
PolleyLake (P2)
BootjackLake (B2)
Quesnel LakeProfundalExposed
Quesnel LakeProfundalReference
DG
T-La
bile
Cop
per (
mg/
L)
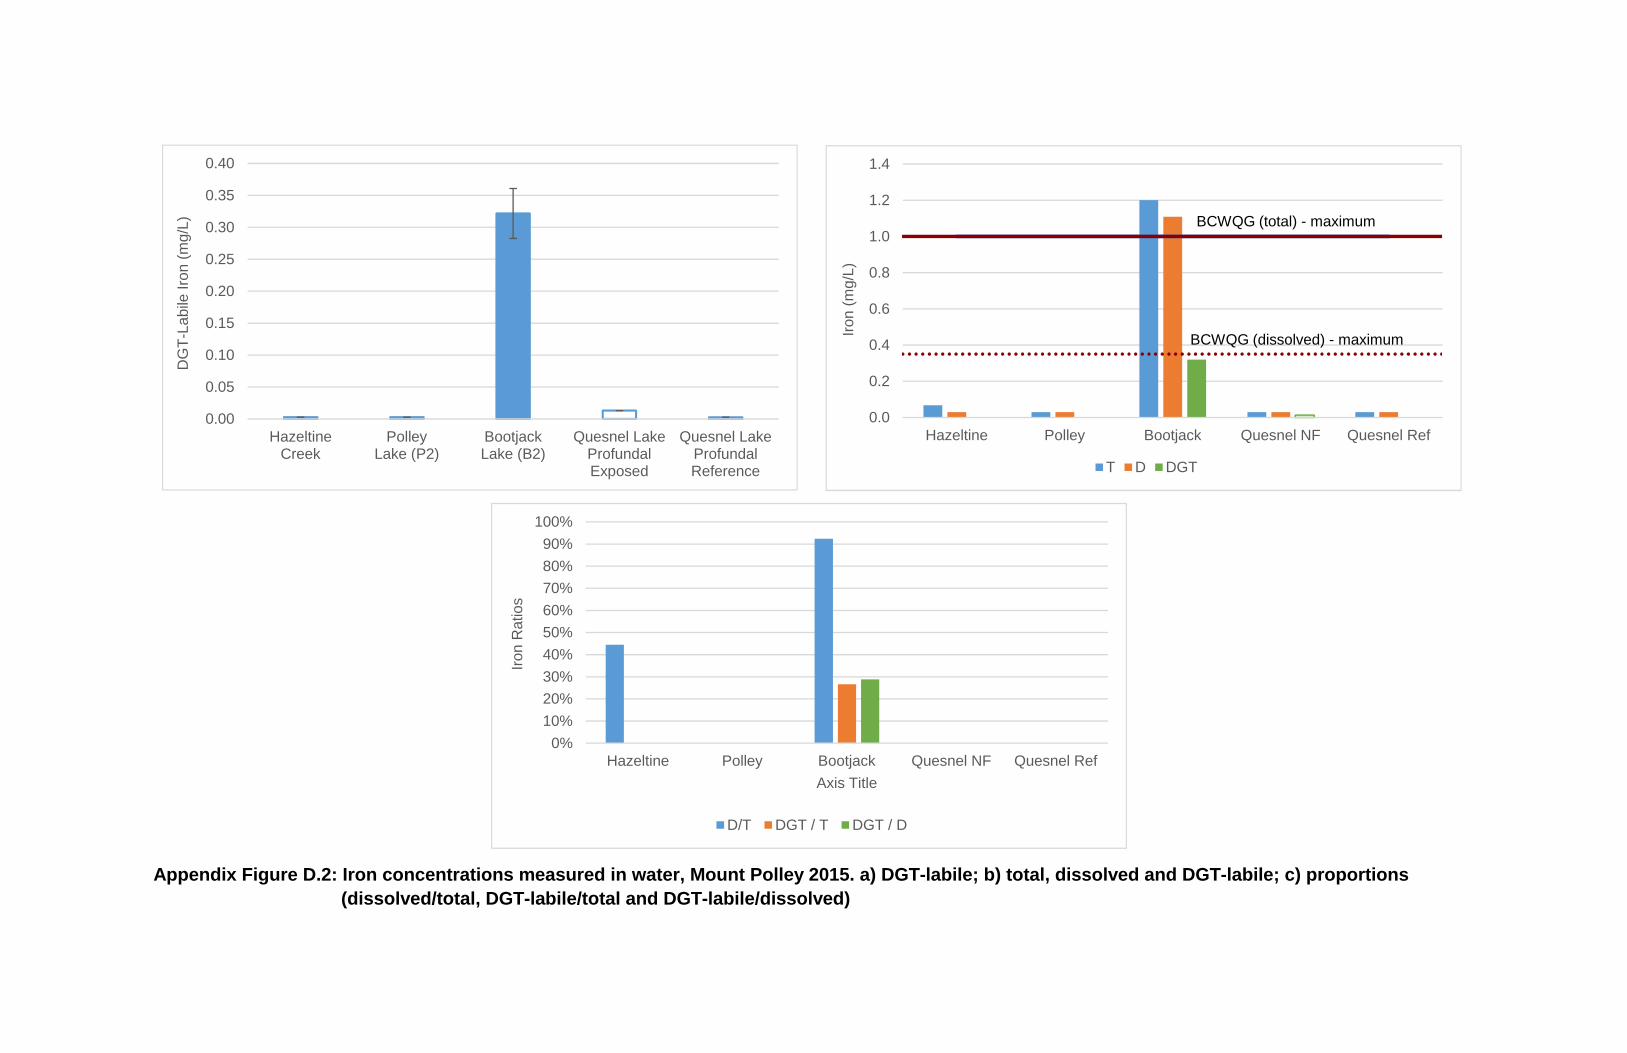
Appendix Figure D.2: Iron concentrations measured in water, Mount Polley 2015. a) DGT-labile; b) total, dissolved and DGT-labile; c) proportions (dissolved/total, DGT-labile/total and DGT-labile/dissolved)
0.0
0.2
0.4
0.6
0.8
1.0
1.2
1.4
Hazeltine Polley Bootjack Quesnel NF Quesnel Ref
Iron
(mg/
L)
T D DGT
BCWQG (total) - maximum
BCWQG (dissolved) - maximum
0%10%20%30%40%50%60%70%80%90%
100%
Hazeltine Polley Bootjack Quesnel NF Quesnel Ref
Iron
Rat
ios
Axis Title
D/T DGT / T DGT / D
0.00
0.05
0.10
0.15
0.20
0.25
0.30
0.35
0.40
HazeltineCreek
PolleyLake (P2)
BootjackLake (B2)
Quesnel LakeProfundalExposed
Quesnel LakeProfundalReference
DG
T-La
bile
Iron
(mg/
L)

Appendix Figure D.3: Manganese concentrations measured in water, Mount Polley 2015. a) DGT-labile; b) total, dissolved and DGT-labile (full y-axis); c) total, dissolved and DGT-labile (truncated y-axis); d) proportions (dissolved/total, DGT-labile/total and DGT-labile/dissolved)
0.0
0.5
1.0
1.5
2.0
2.5
3.0
Hazeltine Polley Bootjack Quesnel NF Quesnel Ref
Man
gane
se (m
g/L)
T D DGT BCWQG ‐maximumBCWQG - 30 day
0%
50%
100%
150%
200%
250%
Hazeltine Polley Bootjack Quesnel NF Quesnel Ref
D/T DGT / T DGT / D
0.0
0.2
0.4
0.6
0.8
1.0
1.2
Hazeltine Polley Bootjack Quesnel NF Quesnel Ref
Man
gane
se (m
g/L)
T D DGT BCWQG ‐maximumBCWQG ‐ 30 day
0.00
0.01
0.02
0.03
0.04
0.05
0.06
0.07
0.08
0.09
HazeltineCreek
PolleyLake (P2)
BootjackLake (B2)
Quesnel LakeProfundalExposed
Quesnel LakeProfundalReference
DG
T-La
bile
Man
gane
se (m
g/L)

Appendix Figure D.4: Molybdenum concentrations measured in water, Mount Polley 2015. a) DGT-labile; b) total, dissolved and DGT-labile; c) proportions (dissolved/total, DGT-labile/total and DGT-labile/dissolved)
0.000
0.002
0.004
0.006
0.008
0.010
0.012
0.014
Hazeltine Polley Bootjack Quesnel NF Quesnel Ref
Mol
ybde
num
(mg/
L)
T D DGT
BCWQG - maximum = 0.073 mg/L
0%
20%
40%
60%
80%
100%
120%
Hazeltine Polley Bootjack Quesnel NF Quesnel Ref
D/T DGT / T DGT / D
0.000
0.001
0.002
0.003
0.004
HazeltineCreek
PolleyLake (P2)
BootjackLake (B2)
Quesnel LakeProfundalExposed
Quesnel LakeProfundalReference
Labi
le M
olyb
denu
m (m
g/L)

Appendix Figure D.5: Phosphorus concentrations measured in water, Mount Polley 2015. a) DGT-labile (mean ± standard deviation); b) mean total, dissolved and DGT-labile; c) mean proportions (dissolved/total, DGT-labile/total and DGT-labile/dissolved)
0.00
0.02
0.04
0.06
0.08
0.10
0.12
0.14
0.16
Hazeltine Polley Bootjack Quesnel NF Quesnel Ref
Pho
spho
rus
(mg/
L)
T D DGT
0%
20%
40%
60%
80%
100%
120%
140%
Hazeltine Polley Bootjack Quesnel NF Quesnel Ref
Pho
spho
rus
Rat
ios
D/T DGT / T DGT / D
0.000
0.005
0.010
0.015
0.020
0.025
0.030
0.035
0.040
0.045
HazeltineCreek
PolleyLake (P2)
BootjackLake (B2)
Quesnel LakeProfundalExposed
Quesnel LakeProfundalReference
DG
T-La
bile
Pho
spho
rus
(mg/
L)

Appendix Figure D.6: Zinc concentrations measured in water, Mount Polley 2015. a) DGT-labile; b) total, dissolved and DGT-labile (full y-axis); c) total, dissolved and DGT-labile (truncated y-axis); d) proportions (dissolved/total, DGT-labile/total and DGT-labile/dissolved)
0.00
0.02
0.04
0.06
0.08
0.10
0.12
0.14
Hazeltine Polley Bootjack Quesnel NF Quesnel Ref
Zinc
(mg/
L)
T D DGT BCWQG ‐maximumBCWQG ‐ 30 day
0%
20%
40%
60%
80%
100%
120%
140%
160%
180%
200%
Hazeltine Polley Bootjack Quesnel NF Quesnel Ref
Zinc
Rat
ios
D/T DGT / T DGT / D
0.000
0.005
0.010
0.015
0.020
Hazeltine Polley Bootjack Quesnel NF Quesnel Ref
Zinc
(mg/
L)
T D DGT BCWQG ‐maximumBCWQG ‐ 30 day
0.000
0.002
0.004
0.006
0.008
0.010
0.012
HazeltineCreek
PolleyLake (P2)
BootjackLake (B2)
Quesnel LakeProfundalExposed
Quesnel LakeProfundalReference
DG
T-La
bile
Zin
c (m
g/L)

Page 1 of 18 6740 Campobello Road, Mississauga, ON L5N 2L8
Project #: 2574
Attention: Pierre Stecko Minnow Environmental #101 - 1025 Hillside Avenue Victoria, BC V8T 2A2
Report Date: 2015/11/13 Revision Date: 2015/11/27
DGT MASS ANALYSIS REPORT
MAXXAM JOB #: B5K6077 (C.O.C. #08412522, #08412523, #08412524) Maxxam (Burnaby) Job #: B588897
Received: 2015/10/09, 08:30 AM
Sample Matrix: SOLID (DGT) # Samples Received: 23
Analyses Quantity Instrumental Analysis Primary Reference Free metals in DGT units 23 CAM SOP-00447 DGT Research, Technical Document
Remarks: DGT water samplers loaded with Chelex-Metsorb resin gel were purchased from Griffith University (Brisbane, Australia). Samplers were received by Maxxam and were shipped to the client as received, on ice.
Upon receipt after deployment, DGTs were digested along with 3 fabrication controls, 4 blanks and 4 spikes for quality control purposes. The procedures for instrumental analyses were based on CAM SOP-00447/16 with some deviations due to the different nature of the matrix. The sample preparation and digestion procedures were in line with the practices recommended by the DGT Supplier1, 2 and with the additional method optimization by Maxxam.
1DGT – for measurements in waters, soils and sediments. Technical Documentation published by DGT Research Ltd. http://www.dgtresearch.com/dgtresearch/dgtresearch.pdf 2Panther, J., Bennett, W., Welsh, D. and Teasdale, P. (2014). Simultaneous measurement of trace metals and oxyanion concentrations in water using Diffusive Gradients in Thin Films with a Chelex-Metsorb mixed binding layer. Analytical Chemistry, 86, 427-434.
Due to the extent of the deviations taken from the stated SOP, this analysis is not considered as accredited. This analysis has not been fully validated. A detailed description of the DGT preparation, digestion, analysis, and calculation of metal detection limits is available upon request.
The Chelex-Metsorb resin is selective towards di-and tri-valent cationic metal species and oxyanionic species; as a result, monovalent metal species including Lithium (Li), Sodium (Na), Potassium (K), and Silver (Ag) have extremely low affinity and data for these metals should be interpreted with caution. Similarly Calcium (Ca),

Page 2 of 18 6740 Campobello Road, Mississauga, ON L5N 2L8
despite being divalent is known to have a low affinity for this resin. Titanium cannot be reported because the Chelex-Metsorb is a titanium-based resin.
We trust this report is sufficient for your purposes. If you have any questions or concerns, please do not hesitate to contact the undersigned.
Sincerely,
Heather Lord, Ph.D. Manager, Environmental R&D Maxxam Analytics Corporation

Maxxam Job #: B5K6077 Maxxam (Burnaby) Job #: B588897 Report Date: 13 November 2015 Revision Date: 27 November 2015 Analysis Date: 22 October 2015
Page 3 of 18 6740 Campobello Road, Mississauga, ON L5N 2L8
Minnow Environmental Project #: 2574
Metals Extracted by Diffusive Gradient Thin Films (DGT)
Maxxam ID BDF184-01 BDF185-01 BDF186-01 BDF187-01
Client ID HAC-1 HAC-2 HAC-3 HAC-4
N14265 N14266 N14267 N14268
Deployment time 38.2 days 38.2 days 38.2 days 38.1 days QC BATCH Temperature 10.9 °C 11.1 °C 11.2 °C 11.2 °C
Note Metal Name MDL RDL Units Mass Extracted by DGT
3 Aluminum (Al) 0.59 1.96 µg 2.19 5.49 2.35 <RDL 4226452 Antimony (Sb) 0.025 0.13 µg <MDL <MDL <MDL <MDL 4226452 Arsenic (As) 0.025 0.13 µg <RDL <RDL <RDL <RDL 4226452 Barium (Ba) 0.063 0.25 µg 6.87 9.60 5.01 4.81 4226452 Beryllium (Be) 0.013 0.063 µg <MDL <MDL <MDL <MDL 4226452
3 Bismuth (Bi) 0.077 0.26 µg <MDL <MDL <MDL <MDL 4226452 Boron (B) 0.25 1.3 µg <MDL <MDL <MDL <RDL 4226452 Cadmium (Cd) 0.0025 0.013 µg <MDL <MDL <MDL <RDL 4226452
1, 3 Calcium (Ca) 20 66 µg 167.91 209.62 152.20 157.53 4226452 Chromium (Cr) 0.125 0.63 µg <MDL <MDL <MDL <MDL 4226452 Cobalt (Co) 0.013 0.063 µg <MDL <MDL <MDL <MDL 4226452 Copper (Cu) 0.025 0.13 µg 2.34 2.64 2.37 2.18 4226452 Iron (Fe) 1.25 6.3 µg <MDL <MDL <MDL <MDL 4226452 Lead (Pb) 0.013 0.063 µg <MDL <MDL <MDL <MDL 4226452
1 Lithium (Li) 0.125 0.63 µg <MDL <MDL <MDL <MDL 4226452 Magnesium (Mg) 1.25 6.3 µg 7.78 9.30 7.50 <RDL 4226452 Manganese (Mn) 0.05 0.25 µg 0.68 1.05 0.68 0.65 4226452
3 Molybdenum (Mo) 0.044 0.15 µg <RDL <RDL <RDL <MDL 4226452 3 Nickel (Ni) 0.095 0.32 µg <MDL <MDL <MDL <MDL 4226452 Phosphorus (P) 1.25 6.3 µg <MDL <MDL <MDL <MDL 4226452
1 Potassium (K) 5 25 µg <MDL <MDL <MDL <MDL 4226452 Selenium (Se) 0.05 0.25 µg <MDL <MDL <MDL <MDL 4226452
3 Strontium (Sr) 0.082 0.27 µg 1.97 3.22 1.28 1.28 4226452 1 Silver (Ag) 0.0025 0.013 µg <RDL <MDL <MDL <MDL 4226452
1, 3 Sodium (Na) 94000 31000
µg <MDL <MDL <MDL <MDL 4226452 Thallium (Tl) 0.0013 0.013 µg <MDL <MDL <MDL <MDL 4226452
3 Tin (Sn) 0.092 0.31 µg <MDL <MDL <MDL <MDL 4226452 2 Titanium (Ti) n/a n/a µg n/a n/a n/a n/a 4226452 Uranium (U) 0.0025 0.013 µg 0.02 0.034 <RDL <RDL 4226452 Vanadium (V) 0.025 0.063 µg 0.29 0.36 0.36 0.30 4226452 Zinc (Zn) 0.125 0.63 µg <MDL <MDL <MDL <MDL 4226452 1 – Metal has very low affinity for the resin 2 – Metal cannot be reported when using Chelex-Metsorb resin (titanium based resin) 3 – MDL and RDL were raised due to presence in the fabrication controls and/or blanks (see QA report)
Notes: a. The data presented here have not been rounded due to the wide range of concentrations reported and to facilitate
further data manipulation. In any final data presentation, only two significant figures should be reported. b. <MDL: Target compound not detected (below Method Detection Limit). c. <RDL: Target compound detected above MDL but below Reporting Detection Limit.

Maxxam Job #: B5K6077 Maxxam (Burnaby) Job #: B588897 Report Date: 13 November 2015 Revision Date: 27 November 2015 Analysis Date: 22 October 2015
Page 4 of 18 6740 Campobello Road, Mississauga, ON L5N 2L8
Minnow Environmental Project #: 2574
Metals Extracted by Diffusive Gradient Thin Films (DGT)
Maxxam ID BDF188-01 BDF189-01 BDF190-01 BDF191-01
Client ID P2-1 P2-2 P2-3 P2-4
N14269 N14270 N14271 N14272
Deployment time 38.2 days 38.2 days 38.2 days 38.2 days QC BATCH Temperature 6.05 °C 6.05 °C 6.05 °C 6.05 °C
Note Metal Name MDL RDL Units Mass Extracted by DGT
3 Aluminum (Al) 0.59 1.96 µg <MDL <MDL <MDL <MDL 4226452 Antimony (Sb) 0.025 0.13 µg <MDL <MDL <MDL <MDL 4226452 Arsenic (As) 0.025 0.13 µg <RDL <RDL <RDL <RDL 4226452 Barium (Ba) 0.063 0.25 µg 1.76 1.86 1.99 1.84 4226452 Beryllium (Be) 0.013 0.063 µg <MDL <MDL <MDL <MDL 4226452
3 Bismuth (Bi) 0.077 0.26 µg <MDL <MDL <MDL <MDL 4226452 Boron (B) 0.25 1.3 µg <MDL <RDL <RDL <RDL 4226452 Cadmium (Cd) 0.0025 0.013 µg <MDL <MDL <MDL <MDL 4226452
1, 3 Calcium (Ca) 20 66 µg 112.32 113.97 133.52 103.02 4226452 Chromium (Cr) 0.125 0.63 µg <MDL <MDL <MDL <MDL 4226452 Cobalt (Co) 0.013 0.063 µg <MDL <MDL <MDL <MDL 4226452 Copper (Cu) 0.025 0.13 µg 0.15 <RDL 0.14 0.16 4226452 Iron (Fe) 1.25 6.3 µg <MDL <MDL <MDL <MDL 4226452 Lead (Pb) 0.013 0.063 µg <MDL <MDL <MDL <MDL 4226452
1 Lithium (Li) 0.125 0.63 µg <MDL <MDL <MDL <MDL 4226452 Magnesium (Mg) 1.25 6.3 µg <MDL <MDL <RDL <MDL 4226452 Manganese (Mn) 0.05 0.25 µg 3.18 2.71 2.00 2.87 4226452
3 Molybdenum (Mo) 0.044 0.15 µg 1.16 1.20 1.30 1.24 4226452 3 Nickel (Ni) 0.095 0.32 µg <MDL <MDL <MDL <MDL 4226452 Phosphorus (P) 1.25 6.3 µg <RDL <RDL <RDL <RDL 4226452
1 Potassium (K) 5 25 µg <MDL <MDL <MDL <MDL 4226452 Selenium (Se) 0.05 0.25 µg <MDL <MDL <MDL <MDL 4226452
3 Strontium (Sr) 0.082 0.27 µg 0.88 0.94 1.15 0.97 4226452 1 Silver (Ag) 0.0025 0.013 µg <MDL <MDL <MDL <MDL 4226452
1, 3 Sodium (Na) 94000 310000 µg <MDL <MDL <MDL <MDL 4226452 Thallium (Tl) 0.0013 0.013 µg <MDL <MDL <MDL <MDL 4226452
3 Tin (Sn) 0.092 0.31 µg <MDL <MDL <MDL <MDL 4226452 2 Titanium (Ti) n/a n/a µg n/a n/a n/a n/a 4226452 Uranium (U) 0.0025 0.013 µg 0.04 0.04 0.04 0.04 4226452 Vanadium (V) 0.025 0.063 µg 0.15 0.14 0.16 0.16 4226452 Zinc (Zn) 0.125 0.63 µg <MDL <MDL <MDL <MDL 4226452 1 – Metal has very low affinity for the resin 2 – Metal cannot be reported when using Chelex-Metsorb resin (titanium based resin) 3 – MDL and RDL were raised due to presence in the fabrication controls and/or blanks (see QA report)
Notes: a. The data presented here have not been rounded due to the wide range of concentrations reported and to facilitate
further data manipulation. In any final data presentation, only two significant figures should be reported. b. <MDL: Target compound not detected (below Method Detection Limit). c. <RDL: Target compound detected above MDL but below Reporting Detection Limit.

Maxxam Job #: B5K6077 Maxxam (Burnaby) Job #: B588897 Report Date: 13 November 2015 Revision Date: 27 November 2015 Analysis Date: 22 October 2015
Page 5 of 18 6740 Campobello Road, Mississauga, ON L5N 2L8
Minnow Environmental Project #: 2574
Metals Extracted by Diffusive Gradient Thin Films (DGT)
Maxxam ID BDF192-01 BDF193-01 BDF194-01 BDF195-01
Client ID B2-1 B2-2 B2-3 B2-4
N14273 N14274 N14275 N14276
Deployment time 37.9 days 37.9 days 37.8 days 37.8 days QC BATCH Temperature 8.65 °C 8.65 °C 8.65 °C 8.65 °C
Note Metal Name MDL RDL Units Mass Extracted by DGT
3 Aluminum (Al) 0.59 1.96 µg <MDL <MDL <MDL <MDL 4226452 Antimony (Sb) 0.025 0.13 µg <MDL <MDL <MDL <MDL 4226452 Arsenic (As) 0.025 0.13 µg <RDL <RDL <RDL <RDL 4226452 Barium (Ba) 0.063 0.25 µg 2.70 3.14 3.43 3.98 4226452 Beryllium (Be) 0.013 0.063 µg <MDL <MDL <MDL <MDL 4226452
3 Bismuth (Bi) 0.077 0.26 µg <MDL <MDL <MDL <MDL 4226452 Boron (B) 0.25 1.3 µg <RDL <RDL <MDL <RDL 4226452 Cadmium (Cd) 0.0025 0.013 µg <MDL <MDL <MDL <MDL 4226452
1, 3 Calcium (Ca) 20 66 µg <RDL <RDL <RDL <RDL 4226452 Chromium (Cr) 0.125 0.63 µg <MDL <MDL <MDL <MDL 4226452 Cobalt (Co) 0.013 0.063 µg <RDL <RDL <RDL <RDL 4226452 Copper (Cu) 0.025 0.13 µg <RDL <RDL <RDL <RDL 4226452 Iron (Fe) 1.25 6.3 µg 144.89 147.38 112.57 142.27 4226452 Lead (Pb) 0.013 0.063 µg <MDL <MDL <MDL <MDL 4226452
1 Lithium (Li) 0.125 0.63 µg <MDL <MDL <MDL <MDL 4226452 Magnesium (Mg) 1.25 6.3 µg <MDL <MDL <MDL <MDL 4226452 Manganese (Mn) 0.05 0.25 µg 18.41 20.83 22.61 28.22 4226452
3 Molybdenum (Mo) 0.044 0.15 µg 0.22 0.23 0.23 0.24 4226452 3 Nickel (Ni) 0.095 0.32 µg <MDL <MDL <MDL <MDL 4226452 Phosphorus (P) 1.25 6.3 µg 11.46 14.73 15.77 18.50 4226452
1 Potassium (K) 5 25 µg <MDL <MDL <MDL <MDL 4226452 Selenium (Se) 0.05 0.25 µg <MDL <MDL <MDL <MDL 4226452
3 Strontium (Sr) 0.082 0.27 µg 0.62 0.70 0.69 0.82 4226452 1 Silver (Ag) 0.0025 0.013 µg <MDL <MDL <MDL <MDL 4226452
1, 3 Sodium (Na) 94000 310000 µg <MDL <MDL <MDL <MDL 4226452 Thallium (Tl) 0.0013 0.013 µg <MDL <MDL <MDL <MDL 4226452
3 Tin (Sn) 0.092 0.31 µg <MDL <MDL <MDL <MDL 4226452 2 Titanium (Ti) n/a n/a µg n/a n/a n/a n/a 4226452 Uranium (U) 0.0025 0.013 µg <MDL <MDL <MDL <MDL 4226452 Vanadium (V) 0.025 0.063 µg <MDL <MDL <MDL <MDL 4226452 Zinc (Zn) 0.125 0.63 µg <MDL <MDL <MDL <MDL 4226452 1 – Metal has very low affinity for the resin 2 – Metal cannot be reported when using Chelex-Metsorb resin (titanium based resin) 3 – MDL and RDL were raised due to presence in the fabrication controls and/or blanks (see QA report)
Notes: a. The data presented here have not been rounded due to the wide range of concentrations reported and to facilitate
further data manipulation. In any final data presentation, only two significant figures should be reported. b. <MDL: Target compound not detected (below Method Detection Limit). c. <RDL: Target compound detected above MDL but below Reporting Detection Limit.

Maxxam Job #: B5K6077 Maxxam (Burnaby) Job #: B588897 Report Date: 13 November 2015 Revision Date: 27 November 2015 Analysis Date: 22 October 2015
Page 6 of 18 6740 Campobello Road, Mississauga, ON L5N 2L8
Minnow Environmental Project #: 2574
Metals Extracted by Diffusive Gradient Thin Films (DGT)
Maxxam ID BDF196-01 BDF197-01 BDF198-01 BDF199-01
Client ID PNF-1 PNF-2 PNF-3 PNF-4
N14277 N14278 N14279 N14280
Deployment time 35.6 days 35.6 days 35.6 days 35.6 days QC BATCH Temperature 4.55 °C 4.55 °C 4.55 °C 4.55 °C
Note Metal Name MDL RDL Units Mass Extracted by DGT
3 Aluminum (Al) 0.59 1.96 µg <RDL 3.36 <RDL <RDL 4226452 Antimony (Sb) 0.025 0.13 µg <MDL <MDL <MDL <MDL 4226452 Arsenic (As) 0.025 0.13 µg <MDL <MDL <MDL <MDL 4226452 Barium (Ba) 0.063 0.25 µg 1.88 1.73 1.42 1.98 4226452 Beryllium (Be) 0.013 0.063 µg <MDL <MDL <MDL <MDL 4226452
3 Bismuth (Bi) 0.077 0.26 µg <MDL <MDL <MDL <MDL 4226452 Boron (B) 0.25 1.3 µg <MDL <MDL <RDL <RDL 4226452 Cadmium (Cd) 0.0025 0.013 µg <MDL <MDL <MDL <MDL 4226452
1, 3 Calcium (Ca) 20 66 µg 138.96 124.76 118.51 118.45 4226452 Chromium (Cr) 0.125 0.63 µg <MDL <MDL <MDL <MDL 4226452 Cobalt (Co) 0.013 0.063 µg <MDL <MDL <MDL <MDL 4226452 Copper (Cu) 0.025 0.13 µg <RDL <RDL <RDL <RDL 4226452 Iron (Fe) 1.25 6.3 µg <MDL <RDL <MDL <MDL 4226452 Lead (Pb) 0.013 0.063 µg <MDL <MDL <MDL <MDL 4226452
1 Lithium (Li) 0.125 0.63 µg <MDL <MDL <MDL <MDL 4226452 Magnesium (Mg) 1.25 6.3 µg <MDL <MDL <MDL <MDL 4226452 Manganese (Mn) 0.05 0.25 µg 1.05 1.30 1.03 1.17 4226452
3 Molybdenum (Mo) 0.044 0.15 µg <RDL <RDL <RDL <RDL 4226452 3 Nickel (Ni) 0.095 0.32 µg <MDL <MDL <MDL <MDL 4226452 Phosphorus (P) 1.25 6.3 µg <MDL <MDL <MDL <MDL 4226452
1 Potassium (K) 5 25 µg <MDL <MDL <MDL <MDL 4226452 Selenium (Se) 0.05 0.25 µg <MDL <MDL <MDL <MDL 4226452
3 Strontium (Sr) 0.082 0.27 µg 0.98 0.83 0.65 0.89 4226452 1 Silver (Ag) 0.0025 0.013 µg <MDL <MDL <MDL <MDL 4226452
1, 3 Sodium (Na) 94000 310000 µg <MDL <MDL <MDL <MDL 4226452 Thallium (Tl) 0.0013 0.013 µg <MDL <MDL <MDL <MDL 4226452
3 Tin (Sn) 0.092 0.31 µg <MDL <RDL <MDL <MDL 4226452 2 Titanium (Ti) n/a n/a µg n/a n/a n/a n/a 4226452 Uranium (U) 0.0025 0.013 µg 0.03 0.03 0.03 0.03 4226452 Vanadium (V) 0.025 0.063 µg <RDL <RDL <MDL <RDL 4226452 Zinc (Zn) 0.125 0.63 µg <MDL 6.73 <MDL <MDL 4226452 1 – Metal has very low affinity for the resin 2 – Metal cannot be reported when using Chelex-Metsorb resin (titanium based resin) 3 – MDL and RDL were raised due to presence in the fabrication controls and/or blanks (see QA report)
Notes: a. The data presented here have not been rounded due to the wide range of concentrations reported and to facilitate
further data manipulation. In any final data presentation, only two significant figures should be reported. b. <MDL: Target compound not detected (below Method Detection Limit). c. <RDL: Target compound detected above MDL but below Reporting Detection Limit.

Maxxam Job #: B5K6077 Maxxam (Burnaby) Job #: B588897 Report Date: 13 November 2015 Revision Date: 27 November 2015 Analysis Date: 22 October 2015
Page 7 of 18 6740 Campobello Road, Mississauga, ON L5N 2L8
Minnow Environmental Project #: 2574
Metals Extracted by Diffusive Gradient Thin Films (DGT)
Maxxam ID BDF200-01 BDF201-01 BDF202-01 BDF203-01
Client ID PRef1-1 PRef1-2 PRef1-3 PRef1-4
N14281 N14282 N14283 N14284
Deployment time 34.3 days 34.3 days 34.3 days 34.2 days QC BATCH Temperature 3.9 °C 3.9 °C 3.9 °C 3.9 °C
Note Metal Name MDL RDL Units Mass Extracted by DGT
3 Aluminum (Al) 0.59 1.96 µg <RDL <RDL 3.08 <RDL 4226452 Antimony (Sb) 0.025 0.13 µg <MDL <MDL <MDL <MDL 4226452 Arsenic (As) 0.025 0.13 µg <MDL <MDL <MDL <MDL 4226452 Barium (Ba) 0.063 0.25 µg 1.49 1.44 1.60 1.49 4226452 Beryllium (Be) 0.013 0.063 µg <MDL <MDL <MDL <MDL 4226452
3 Bismuth (Bi) 0.077 0.26 µg <MDL <MDL <MDL <MDL 4226452 Boron (B) 0.25 1.3 µg <RDL <MDL <RDL <MDL 4226452 Cadmium (Cd) 0.0025 0.013 µg <MDL <MDL <MDL <MDL 4226452
1, 3 Calcium (Ca) 20 66 µg 83.08 121.31 131.30 132.49 4226452 Chromium (Cr) 0.125 0.63 µg <MDL <MDL <MDL <MDL 4226452 Cobalt (Co) 0.013 0.063 µg <MDL <MDL <MDL <MDL 4226452 Copper (Cu) 0.025 0.13 µg <RDL <RDL <RDL <MDL 4226452 Iron (Fe) 1.25 6.3 µg <MDL <MDL <MDL <MDL 4226452 Lead (Pb) 0.013 0.063 µg <MDL <MDL <MDL <MDL 4226452
1 Lithium (Li) 0.125 0.63 µg <MDL <MDL <MDL <MDL 4226452 Magnesium (Mg) 1.25 6.3 µg <MDL <MDL <MDL <MDL 4226452 Manganese (Mn) 0.05 0.25 µg 1.13 0.60 1.28 1.74 4226452
3 Molybdenum (Mo) 0.044 0.15 µg <MDL <MDL <MDL <RDL 4226452 3 Nickel (Ni) 0.095 0.32 µg <MDL <MDL <MDL <MDL 4226452 Phosphorus (P) 1.25 6.3 µg <MDL <MDL <MDL <MDL 4226452
1 Potassium (K) 5 25 µg <MDL <MDL <MDL <MDL 4226452 Selenium (Se) 0.05 0.25 µg <MDL <MDL <MDL <MDL 4226452
3 Strontium (Sr) 0.082 0.27 µg 0.68 0.92 0.93 0.92 4226452 1 Silver (Ag) 0.0025 0.013 µg <MDL <MDL <MDL <MDL 4226452
1, 3 Sodium (Na) 94000 310000 µg <MDL <MDL <MDL <MDL 4226452 Thallium (Tl) 0.0013 0.013 µg <MDL <MDL <MDL <MDL 4226452
3 Tin (Sn) 0.092 0.31 µg <MDL <MDL <MDL <MDL 4226452 2 Titanium (Ti) n/a n/a µg n/a n/a n/a n/a 4226452 Uranium (U) 0.0025 0.013 µg 0.03 0.02 0.02 0.02 4226452 Vanadium (V) 0.025 0.063 µg <MDL <MDL <MDL <MDL 4226452 Zinc (Zn) 0.125 0.63 µg <MDL <MDL <MDL <MDL 4226452 1 – Metal has very low affinity for the resin 2 – Metal cannot be reported when using Chelex-Metsorb resin (titanium based resin) 3 – MDL and RDL were raised due to presence in the fabrication controls and/or blanks (see QA report)
Notes: a. The data presented here have not been rounded due to the wide range of concentrations reported and to facilitate
further data manipulation. In any final data presentation, only two significant figures should be reported. b. <MDL: Target compound not detected (below Method Detection Limit). c. <RDL: Target compound detected above MDL but below Reporting Detection Limit.

Maxxam Job #: B5K6077 Maxxam (Burnaby) Job #: B588897 Report Date: 13 November 2015 Revision Date: 27 November 2015 Analysis Date: 22 October 2015
Page 8 of 18 6740 Campobello Road, Mississauga, ON L5N 2L8
Minnow Environmental Project #: 2574
Metals Extracted by Diffusive Gradient Thin Films (DGT)
Maxxam ID BDF204-01 BDF205-01 BDF206-01
Client ID Field Blank 1 Field Blank 2 Trip Blank
N14289 N14282 N14283
Deployment time n/a n/a n/a QC BATCH Temperature n/a n/a n/a
Note Metal Name MDL RDL Units Mass Extracted by DGT
3 Aluminum (Al) 0.59 1.96 µg <MDL <MDL <MDL 4226497 Antimony (Sb) 0.025 0.13 µg <MDL <MDL <MDL 4226497 Arsenic (As) 0.025 0.13 µg <MDL <MDL <MDL 4226497 Barium (Ba) 0.063 0.25 µg <MDL <MDL <MDL 4226497 Beryllium (Be) 0.013 0.063 µg <MDL <MDL <MDL 4226497
3 Bismuth (Bi) 0.077 0.26 µg <MDL <MDL <MDL 4226497 Boron (B) 0.25 1.3 µg <MDL <MDL <MDL 4226497 Cadmium (Cd) 0.0025 0.013 µg <MDL <MDL <MDL 4226497
1, 3 Calcium (Ca) 20 66 µg <MDL <MDL <MDL 4226497 Chromium (Cr) 0.125 0.63 µg <MDL <MDL <MDL 4226497 Cobalt (Co) 0.013 0.063 µg <MDL <MDL <MDL 4226497 Copper (Cu) 0.025 0.13 µg <MDL <MDL 1.06 4226497 Iron (Fe) 1.25 6.3 µg <MDL <MDL <MDL 4226497 Lead (Pb) 0.013 0.063 µg <MDL <MDL <MDL 4226497
1 Lithium (Li) 0.125 0.63 µg <MDL <MDL <MDL 4226497 Magnesium (Mg) 1.25 6.3 µg <MDL <MDL <MDL 4226497 Manganese (Mn) 0.05 0.25 µg <MDL <MDL <MDL 4226497
3 Molybdenum (Mo) 0.044 0.15 µg <MDL <MDL <MDL 4226497 3 Nickel (Ni) 0.095 0.32 µg <MDL <MDL <MDL 4226497 Phosphorus (P) 1.25 6.3 µg <MDL <MDL <MDL 4226497
1 Potassium (K) 5 25 µg <MDL <MDL <MDL 4226497 Selenium (Se) 0.05 0.25 µg <MDL <MDL <MDL 4226497
3 Strontium (Sr) 0.082 0.27 µg <MDL <MDL <MDL 4226497 1 Silver (Ag) 0.0025 0.013 µg <MDL <MDL <MDL 4226497
1, 3 Sodium (Na) 94000 310000 µg <MDL <MDL <MDL 4226497 Thallium (Tl) 0.0013 0.013 µg <MDL <MDL <MDL 4226497
3 Tin (Sn) 0.092 0.31 µg <MDL <MDL <MDL 4226497 2 Titanium (Ti) n/a n/a µg n/a n/a n/a 4226497 Uranium (U) 0.0025 0.013 µg <MDL <MDL <MDL 4226497 Vanadium (V) 0.025 0.063 µg <MDL <MDL <MDL 4226497 Zinc (Zn) 0.125 0.63 µg <MDL <MDL <MDL 4226497
1 – Metal has very low affinity for the resin 2 – Metal cannot be reported when using Chelex-Metsorb resin (titanium based resin) 3 – MDL and RDL were raised due to presence in the fabrication controls and/or blanks (see QA report)
Notes: a. The data presented here have not been rounded due to the wide range of concentrations reported and to facilitate
further data manipulation. In any final data presentation, only two significant figures should be reported. b. <MDL: Target compound not detected (below Method Detection Limit). c. <RDL: Target compound detected above MDL but below Reporting Detection Limit.

Maxxam Job #: B5K6077 Maxxam (Burnaby) Job #: B588897 Report Date: 13 November 2015 Revision Date: 27 November 2015 Analysis Date: 22 October 2015
Page 9 of 18 6740 Campobello Road, Mississauga, ON L5N 2L8
Minnow Environmental Project #: 2574
Quality Assurance Report
Maxxam Job # B5K6077
Test Summary
Maxxam ID BDF184-01 Collected 2015/10/06 Sample ID HAC-1 N14265 Relinquished 2015/10/07 Matrix DGT sampler Received 2015/10/09
Test Description Instrumentation Batch Digested Analyzed Analysts
Free Metals in DGT CAM SOP-00447/16 4226452 2015/10/13-16 2015/10/22 Christopher Atkinson Prempal Bhatti
Maxxam ID BDF185-01 Collected 2015/10/06 Sample ID HAC-2 N14266 Relinquished 2015/10/07 Matrix DGT sampler Received 2015/10/09
Test Description Instrumentation Batch Digested Analyzed Analysts
Free Metals in DGT CAM SOP-00447/16 4226452 2015/10/13-16 2015/10/22 Christopher Atkinson Prempal Bhatti
Maxxam ID BDF186-01 Collected 2015/10/06 Sample ID HAC-3 N14267 Relinquished 2015/10/07 Matrix DGT sampler Received 2015/10/09
Test Description Instrumentation Batch Digested Analyzed Analysts
Free Metals in DGT CAM SOP-00447/16 4226452 2015/10/13-16 2015/10/22 Christopher Atkinson Prempal Bhatti
Maxxam ID BDF187-01 Collected 2015/10/06 Sample ID HAC-4 N14268 Relinquished 2015/10/07 Matrix DGT sampler Received 2015/10/09
Test Description Instrumentation Batch Digested Analyzed Analysts
Free Metals in DGT CAM SOP-00447/16 4226452 2015/10/13-16 2015/10/22 Christopher Atkinson Prempal Bhatti
Maxxam ID BDF188-01 Collected 2015/10/05 Sample ID P2-1 N14269 Relinquished 2015/10/07 Matrix DGT sampler Received 2015/10/09
Test Description Instrumentation Batch Digested Analyzed Analysts
Free Metals in DGT CAM SOP-00447/16 4226452 2015/10/13-16 2015/10/22 Christopher Atkinson Prempal Bhatti

Maxxam Job #: B5K6077 Maxxam (Burnaby) Job #: B588897 Report Date: 13 November 2015 Revision Date: 27 November 2015 Analysis Date: 22 October 2015
Page 10 of 18 6740 Campobello Road, Mississauga, ON L5N 2L8
Minnow Environmental Project #: 2574
Maxxam ID BDF189-01 Collected 2015/10/05 Sample ID P2-2 N14270 Relinquished 2015/10/07 Matrix DGT sampler Received 2015/10/09
Test Description Instrumentation Batch Digested Analyzed Analysts
Free Metals in DGT CAM SOP-00447/16 4226452 2015/10/13-16 2015/10/22 Christopher Atkinson Prempal Bhatti
Maxxam ID BDF190-01 Collected 2015/10/05 Sample ID P2-3 N14271 Relinquished 2015/10/07 Matrix DGT sampler Received 2015/10/09
Test Description Instrumentation Batch Digested Analyzed Analysts
Free Metals in DGT CAM SOP-00447/16 4226452 2015/10/13-16 2015/10/22 Christopher Atkinson Prempal Bhatti
Maxxam ID BDF191-01 Collected 2015/10/05 Sample ID P2-4 N14272 Relinquished 2015/10/07 Matrix DGT sampler Received 2015/10/09
Test Description Instrumentation Batch Digested Analyzed Analysts
Free Metals in DGT CAM SOP-00447/16 4226452 2015/10/13-16 2015/10/22 Christopher Atkinson Prempal Bhatti
Maxxam ID BDF192-01 Collected 2015/10/05 Sample ID B2-1 N14273 Relinquished 2015/10/07 Matrix DGT sampler Received 2015/10/09
Test Description Instrumentation Batch Digested Analyzed Analysts
Free Metals in DGT CAM SOP-00447/16 4226452 2015/10/13-16 2015/10/22 Christopher Atkinson Prempal Bhatti
Maxxam ID BDF193-01 Collected 2015/10/05 Sample ID B2-2 N14274 Relinquished 2015/10/07 Matrix DGT sampler Received 2015/10/09
Test Description Instrumentation Batch Digested Analyzed Analysts
Free Metals in DGT CAM SOP-00447/16 4226452 2015/10/13-16 2015/10/22 Christopher Atkinson Prempal Bhatti
Maxxam ID BDF194-01 Collected 2015/10/05 Sample ID B2-3 N14275 Relinquished 2015/10/07 Matrix DGT sampler Received 2015/10/09
Test Description Instrumentation Batch Digested Analyzed Analysts
Free Metals in DGT CAM SOP-00447/16 4226452 2015/10/13-16 2015/10/22 Christopher Atkinson Prempal Bhatti

Maxxam Job #: B5K6077 Maxxam (Burnaby) Job #: B588897 Report Date: 13 November 2015 Revision Date: 27 November 2015 Analysis Date: 22 October 2015
Page 11 of 18 6740 Campobello Road, Mississauga, ON L5N 2L8
Minnow Environmental Project #: 2574
Maxxam ID BDF195-01 Collected 2015/10/05 Sample ID B2-4 N14276 Relinquished 2015/10/07 Matrix DGT sampler Received 2015/10/09
Test Description Instrumentation Batch Digested Analyzed Analysts
Free Metals in DGT CAM SOP-00447/16 4226452 2015/10/13-16 2015/10/22 Christopher Atkinson Prempal Bhatti
Maxxam ID BDF196-01 Collected 2015/10/06 Sample ID PNF-1 N14277 Relinquished 2015/10/07 Matrix DGT sampler Received 2015/10/09
Test Description Instrumentation Batch Digested Analyzed Analysts
Free Metals in DGT CAM SOP-00447/16 4226452 2015/10/13-16 2015/10/22 Christopher Atkinson Prempal Bhatti
Maxxam ID BDF197-01 Collected 2015/10/06 Sample ID PNF-2 N14278 Relinquished 2015/10/07 Matrix DGT sampler Received 2015/10/09
Test Description Instrumentation Batch Digested Analyzed Analysts
Free Metals in DGT CAM SOP-00447/16 4226452 2015/10/13-16 2015/10/22 Christopher Atkinson Prempal Bhatti
Maxxam ID BDF198-01 Collected 2015/10/06 Sample ID PNF-3 N14279 Relinquished 2015/10/07 Matrix DGT sampler Received 2015/10/09
Test Description Instrumentation Batch Digested Analyzed Analysts
Free Metals in DGT CAM SOP-00447/16 4226452 2015/10/13-16 2015/10/22 Christopher Atkinson Prempal Bhatti
Maxxam ID BDF199-01 Collected 2015/10/06 Sample ID PNF-4 N14280 Relinquished 2015/10/07 Matrix DGT sampler Received 2015/10/09
Test Description Instrumentation Batch Digested Analyzed Analysts
Free Metals in DGT CAM SOP-00447/16 4226452 2015/10/13-16 2015/10/22 Christopher Atkinson Prempal Bhatti
Maxxam ID BDF200-01 Collected 2015/10/06 Sample ID PRef1-1 N14281 Relinquished 2015/10/07 Matrix DGT sampler Received 2015/10/09
Test Description Instrumentation Batch Digested Analyzed Analysts
Free Metals in DGT CAM SOP-00447/16 4226452 2015/10/13-16 2015/10/22 Christopher Atkinson Prempal Bhatti

Maxxam Job #: B5K6077 Maxxam (Burnaby) Job #: B588897 Report Date: 13 November 2015 Revision Date: 27 November 2015 Analysis Date: 22 October 2015
Page 12 of 18 6740 Campobello Road, Mississauga, ON L5N 2L8
Minnow Environmental Project #: 2574
Maxxam ID BDF201-01 Collected 2015/10/06 Sample ID PRef1-2 N14282 Relinquished 2015/10/07 Matrix DGT sampler Received 2015/10/09
Test Description Instrumentation Batch Digested Analyzed Analysts
Free Metals in DGT CAM SOP-00447/16 4226452 2015/10/13-16 2015/10/22 Christopher Atkinson Prempal Bhatti
Maxxam ID BDF202-01 Collected 2015/10/06 Sample ID PRef1-3 N14283 Relinquished 2015/10/07 Matrix DGT sampler Received 2015/10/09
Test Description Instrumentation Batch Digested Analyzed Analysts
Free Metals in DGT CAM SOP-00447/16 4226452 2015/10/13-16 2015/10/22 Christopher Atkinson Prempal Bhatti
Maxxam ID BDF203-01 Collected 2015/10/06 Sample ID PRef1-4 N14284 Relinquished 2015/10/07 Matrix DGT sampler Received 2015/10/09
Test Description Instrumentation Batch Digested Analyzed Analysts
Free Metals in DGT CAM SOP-00447/16 4226452 2015/10/13-16 2015/10/22 Christopher Atkinson Prempal Bhatti
Maxxam ID BDF204-01 Collected n/a Sample ID Field Blank 1 N14289 Relinquished 2015/10/07 Matrix DGT sampler Received 2015/10/09
Test Description Instrumentation Batch Digested Analyzed Analysts
Free Metals in DGT CAM SOP-00447/16 4226497 2015/10/13-16 2015/10/22 Christopher Atkinson Prempal Bhatti
Maxxam ID BDF205-01 Collected n/a Sample ID Field Blank 2 N14290 Relinquished 2015/10/07 Matrix DGT sampler Received 2015/10/09
Test Description Instrumentation Batch Digested Analyzed Analysts
Free Metals in DGT CAM SOP-00447/16 4226497 2015/10/13-16 2015/10/22 Christopher Atkinson Prempal Bhatti
Maxxam ID BDF206-01 Collected n/a Sample ID Trip Blank N14291 Relinquished 2015/10/07 Matrix DGT sampler Received 2015/10/09
Test Description Instrumentation Batch Digested Analyzed Analysts
Free Metals in DGT CAM SOP-00447/16 4226497 2015/10/13-16 2015/10/22 Christopher Atkinson Prempal Bhatti

Maxxam Job #: B5K6077 Maxxam (Burnaby) Job #: B588897 Report Date: 13 November 2015 Revision Date: 27 November 2015 Analysis Date: 22 October 2015
Page 13 of 18 6740 Campobello Road, Mississauga, ON L5N 2L8
Minnow Environmental Project #: 2574
Quality Assurance Report Blanks and Fabrication Controls
Maxxam Job # B5K6077 – QC Batch 4226452
Maxxam ID BDK223-01 BDK220-01
RDL MDL QC Parameter Water Blank Method Blank
Matrix RODI water Digest Note Analysis Date Metal name (µg) (µg) (µg) (µg)
2015/10/22 Aluminum (Al) <RDL <RDL 0.63 0.13 2015/10/22 Antimony (Sb) <MDL <MDL 0.13 0.025 2015/10/22 Arsenic (As) <MDL <MDL 0.13 0.025 2015/10/22 Barium (Ba) <MDL <MDL 0.25 0.063 2015/10/22 Beryllium (Be) <MDL <MDL 0.063 0.013 2015/10/22 Bismuth (Bi) <MDL <RDL 0.13 0.025 2015/10/22 Boron (B) <MDL <MDL 1.3 0.25 2015/10/22 Cadmium (Cd) <MDL <MDL 0.013 0.003 2015/10/22 Calcium (Ca) <MDL <MDL 25 5.0 2015/10/22 Chromium (Cr) <MDL <MDL 0.63 0.125 2015/10/22 Cobalt (Co) <MDL <MDL 0.063 0.013 2015/10/22 Copper (Cu) <MDL <MDL 0.13 0.025 2015/10/22 Iron (Fe) <MDL <MDL 6.3 1.25 2015/10/22 Lead (Pb) <MDL <MDL 0.06 0.013 2015/10/22 Lithium (Li) <MDL <MDL 0.63 0.13 2015/10/22 Magnesium (Mg) <MDL <MDL 6.3 1.25 2015/10/22 Manganese (Mn) <MDL <MDL 0.25 0.050 2015/10/22 Molybdenum (Mo) <MDL <RDL 0.063 0.0025 2015/10/22 Nickel (Ni) <MDL <MDL 0.13 0.025 2015/10/22 Phosphorus (P) <MDL <MDL 6.3 1.25 2015/10/22 Potassium (K) <MDL <MDL 25 5.0 2015/10/22 Selenium (Se) <MDL <MDL 0.25 0.050 2015/10/22 Strontium (Sr) <MDL <MDL 0.13 0.025 2015/10/22 Silver (Ag) <MDL <MDL 0.013 0.0025
1 2015/10/22 Sodium (Na) 44.94 33152 13 2.5 2015/10/22 Thallium (Tl) <MDL <MDL 0.013 0.0013 2015/10/22 Tin (Sn) <MDL <MDL 0.13 0.025 2015/10/22 Titanium (Ti) n/a n/a n/a n/a 2015/10/22 Uranium (U) <MDL <MDL 0.013 0.0025 2015/10/22 Vanadium (V) <MDL <MDL 0.063 0.025 2015/10/22 Zinc (Zn) <MDL <MDL 0.63 0.13
1 – Digestion solution is 1M NaOH
Notes:
Water Blank: RODI water used during sample processing of the samples Method Blank: Digestion tube, to which no DGT resin is added, digested and analyzed, used to identify lab contamination Fabrication Control: Blank DGT resin digested and analyzed, accounts for interferences or contamination incurred from the
passive sampler components, storage, processing and analysis

Maxxam Job #: B5K6077 Maxxam (Burnaby) Job #: B588897 Report Date: 13 November 2015 Revision Date: 27 November 2015 Analysis Date: 22 October 2015
Page 14 of 18 6740 Campobello Road, Mississauga, ON L5N 2L8
Minnow Environmental Project #: 2574
Quality Assurance Report Blanks and Fabrication Controls
Maxxam Job # B5K6077 – QC Batch 4226497
Maxxam ID BDK226-01 BDK227-01
RDL MDL QC Parameter Water Blank Method Blank
Matrix RODI water Digest Note Analysis Date Metal name (µg) (µg) (µg) (µg)
2015/10/22 Aluminum (Al) <RDL <RDL 0.63 0.13 2015/10/22 Antimony (Sb) <MDL <MDL 0.13 0.025 2015/10/22 Arsenic (As) <MDL <MDL 0.13 0.025 2015/10/22 Barium (Ba) <MDL <MDL 0.25 0.063 2015/10/22 Beryllium (Be) <MDL <MDL 0.063 0.013 2015/10/22 Bismuth (Bi) <MDL <MDL 0.13 0.025 2015/10/22 Boron (B) <MDL <MDL 1.3 0.25 2015/10/22 Cadmium (Cd) <MDL <MDL 0.013 0.003 2015/10/22 Calcium (Ca) <MDL <MDL 25 5.0 2015/10/22 Chromium (Cr) <MDL <MDL 0.63 0.125 2015/10/22 Cobalt (Co) <MDL <MDL 0.063 0.013 2015/10/22 Copper (Cu) <MDL <MDL 0.13 0.025 2015/10/22 Iron (Fe) <MDL <MDL 6.3 1.25 2015/10/22 Lead (Pb) <MDL <MDL 0.06 0.013 2015/10/22 Lithium (Li) <MDL <MDL 0.63 0.13 2015/10/22 Magnesium (Mg) <MDL <MDL 6.3 1.25 2015/10/22 Manganese (Mn) <MDL <MDL 0.25 0.050 2015/10/22 Molybdenum (Mo) <MDL <MDL 0.063 0.0025 2015/10/22 Nickel (Ni) <MDL <MDL 0.13 0.025 2015/10/22 Phosphorus (P) <MDL <MDL 6.3 1.25 2015/10/22 Potassium (K) <MDL <MDL 25 5.0 2015/10/22 Selenium (Se) <MDL <MDL 0.25 0.050 2015/10/22 Strontium (Sr) <MDL <MDL 0.13 0.025 2015/10/22 Silver (Ag) <MDL <MDL 0.013 0.0025
1 2015/10/22 Sodium (Na) 21.83 31999 13 2.5 2015/10/22 Thallium (Tl) <MDL <MDL 0.013 0.0013 2015/10/22 Tin (Sn) <MDL <MDL 0.13 0.025 2015/10/22 Titanium (Ti) n/a n/a n/a n/a 2015/10/22 Uranium (U) <MDL <MDL 0.013 0.0025 2015/10/22 Vanadium (V) <MDL <MDL 0.063 0.025 2015/10/22 Zinc (Zn) <MDL <MDL 0.63 0.13
1 – Digestion solution is 1M NaOH
Notes:
Water Blank: RODI water used during sample processing of the samples Method Blank: Digestion tube, to which no DGT resin is added, digested and analyzed, used to identify lab contamination Fabrication Control: Blank DGT resin digested and analyzed, accounts for interferences or contamination incurred from the
passive sampler components, storage, processing and analysis

Maxxam Job #: B5K6077 Maxxam (Burnaby) Job #: B588897 Report Date: 13 November 2015 Revision Date: 27 November 2015 Analysis Date: 22 October 2015
Page 15 of 18 6740 Campobello Road, Mississauga, ON L5N 2L8
Minnow Environmental Project #: 2574
Quality Assurance Report
Blanks and Fabrication Controls
Maxxam Job # B5K6077 – QC Batch 4226497
Maxxam ID BDK230-01 BDK242-01 BDK243-01
RDL MDL QC Parameter Fabrication Control 1
Fabrication Control 2
Fabrication Control 3
Matrix DGT DGT DGT Note Analysis Date Metal name (µg) (µg) (µg) (µg) (µg)
2015/10/22 Aluminum (Al) <RDL <RDL <RDL 0.63 0.13 2015/10/22 Antimony (Sb) <MDL <MDL <MDL 0.13 0.025 2015/10/22 Arsenic (As) <MDL <MDL <MDL 0.13 0.025 2015/10/22 Barium (Ba) <MDL <MDL <MDL 0.25 0.063 2015/10/22 Beryllium (Be) <MDL <MDL <MDL 0.063 0.013 2015/10/22 Bismuth (Bi) <MDL <MDL <MDL 0.13 0.025 2015/10/22 Boron (B) <MDL <MDL <MDL 1.3 0.25 2015/10/22 Cadmium (Cd) <MDL <MDL <MDL 0.013 0.003 2015/10/22 Calcium (Ca) <RDL <MDL <MDL 25 5.0 2015/10/22 Chromium (Cr) <MDL <MDL <MDL 0.63 0.125 2015/10/22 Cobalt (Co) <MDL <MDL <MDL 0.063 0.013 2015/10/22 Copper (Cu) <MDL <MDL <MDL 0.13 0.025 2015/10/22 Iron (Fe) <MDL <MDL <MDL 6.3 1.25 2015/10/22 Lead (Pb) <MDL <MDL <MDL 0.06 0.013 2015/10/22 Lithium (Li) <MDL <MDL <MDL 0.63 0.13 2015/10/22 Magnesium (Mg) <MDL <MDL <MDL 6.3 1.25 2015/10/22 Manganese (Mn) <MDL <MDL <MDL 0.25 0.050 2015/10/22 Molybdenum (Mo) <MDL <MDL <MDL 0.063 0.0025 2015/10/22 Nickel (Ni) <RDL <MDL <MDL 0.13 0.025 2015/10/22 Phosphorus (P) <MDL <MDL <MDL 6.3 1.25 2015/10/22 Potassium (K) <MDL <MDL <MDL 25 5.0 2015/10/22 Selenium (Se) <MDL <MDL <MDL 0.25 0.050 2015/10/22 Strontium (Sr) <RDL <RDL <MDL 0.13 0.025 2015/10/22 Silver (Ag) <MDL <MDL <MDL 0.013 0.0025
1 2015/10/22 Sodium (Na) 31617 31154 31398 13 2.5 2015/10/22 Thallium (Tl) <MDL <MDL <MDL 0.013 0.0013 2015/10/22 Tin (Sn) <RDL <RDL <MDL 0.13 0.025 2015/10/22 Titanium (Ti) n/a n/a n/a n/a n/a 2015/10/22 Uranium (U) <MDL <MDL <MDL 0.013 0.0025 2015/10/22 Vanadium (V) <MDL <MDL <MDL 0.063 0.025 2015/10/22 Zinc (Zn) <MDL <MDL <MDL 0.63 0.13
1 – Digestion solution is 1M NaOH
Notes:
Water Blank: RODI water used during sample processing of the samples Method Blank: Digestion tube, to which no DGT resin is added, digested and analyzed, used to identify lab contamination Fabrication Control: Blank DGT resin digested and analyzed, accounts for interferences or contamination incurred from the
passive sampler components, storage, processing and analysis

Maxxam Job #: B5K6077 Maxxam (Burnaby) Job #: B588897 Report Date: 13 November 2015 Revision Date: 27 November 2015 Analysis Date: 22 October 2015
Page 16 of 18 6740 Campobello Road, Mississauga, ON L5N 2L8
Minnow Environmental Project #: 2574
Quality Assurance Report Spikes
Maxxam Job # B5K6077 – QC Batch 4226452
Maxxam ID BDK222-01 BDK221-01
QC Limits QC Batch QC Parameter Resin Spike Method Spike
Matrix DGT Digest
Note Analysis Date Metal (% Recovery) (% Recovery) % 4226452 2015/10/22 Cadmium 108 92 70-130 4226452 2015/10/22 Thallium 83 99 70-130 4226452 2015/10/22 Uranium 83 102 70-130 4226452
Notes:
Resin Spike: Metal solution spiked directly onto DGT resin and digested, used to evaluate method accuracy Method Spike: Digestion tube to which the metal solution is spiked without the presence of a DGT resin, sample is
digested and analyzed, used to evaluate lab process accuracy

Maxxam Job #: B5K6077 Maxxam (Burnaby) Job #: B588897 Report Date: 13 November 2015 Revision Date: 27 November 2015 Analysis Date: 22 October 2015
Page 17 of 18 6740 Campobello Road, Mississauga, ON L5N 2L8
Minnow Environmental Project #: 2574
Quality Assurance Report Spikes
Maxxam Job # B5K6077 – QC Batch 4226497
Maxxam ID BDK229-01 BDK228-01
QC Limits QC Batch QC Parameter Resin Spike Method Spike
Matrix DGT Digest
Note Analysis Date Metal (% Recovery) (% Recovery) % 4226497 2015/10/22 Cadmium 78 103 70-130 4226497 2015/10/22 Thallium 73 97 70-130 4226497 2015/10/22 Uranium 74 102 70-130 4226497
Notes:
Resin Spike: Metal solution spiked directly onto DGT resin and digested, used to evaluate method accuracy Method Spike: Digestion tube to which the metal solution is spiked without the presence of a DGT resin, sample is
digested and analyzed, used to evaluate lab process accuracy

Maxxam Job #: B5K6077 Maxxam (Burnaby) Job #: B588897 Report Date: 13 November 2015 Revision Date: 27 November 2015 Analysis Date: 22 October 2015
Page 18 of 18 6740 Campobello Road, Mississauga, ON L5N 2L8
Minnow Environmental Project #: 2574
Validation Signature Page Maxxam Job #: B5K6077 Maxxam (Burnaby) Job #: B588897 The analytical data and all QC contained in this report were reviewed and validated by the following individual(s):
Angel Rodriguez-Lafuente, Ph.D. Senior Analyst, Environmental Research and Development Maxxam Analytics Corporation
Heather Lynn Lord, Ph.D. Manager, Environmental Research and Development Maxxam Analytics Corporation

Page 1 of 9 6740 Campobello Road, Mississauga, ON L5N 2L8
Project #: 2574 Attention: Pierre Stecko Minnow Environmental #101 ‐ 1025 Hillside Avenue Victoria, BC V8T 2A2
Report Date: 2015/11/23
ESTIMATED AVERAGE WATER CONCENTRATION REPORT FROM DGT PASSIVE SAMPLERS
MAXXAM JOB #: B5K6077 (C.O.C. #08412522, #08412523, #08412524)
Maxxam (Burnaby) Job #: B588897
Received: 2015/10/09, 08:30 AM
Sample Matrix: Water Sampling Media (WSM) # Samples Received: 23
Analyses Quantity Lab Analyses Primary Reference Free metals in water by DGT 23 CAM SOP‐00447 DGT Research, Technical Document
Remarks:
This report provides the estimated integrated water concentrations during the DGT sampler deployments. Accumulated masses of free metals in the DGT devices have been reported separately for the above‐noted job number.
Water concentrations were estimated based on the masses of free metals accumulated in the DGT devices along with the reported average temperature and deployment time, known diffusion coefficients and physical properties of the DGT devices.
We trust this report is sufficient for your purposes. If you have any questions or concerns, please do not hesitate to contact the undersigned.
Sincerely,
Heather Lord, Ph.D. Manager, Environmental R&D Maxxam Analytics Corporation
Angel Rodriguez‐Lafuente, Ph.D. Senior Analyst, Environmental R&D Maxxam Analytics Corporation

Maxxam Job #: B5K6077 Maxxam (Burnaby) Job #: B588897 Report Date: 23 November 2015 Analysis Date: 22 October 2015
Page 2 of 9 6740 Campobello Road, Mississauga, ON L5N 2L8
Minnow EnvironmentalProject #: 2574
Time averaged concentrations of free metal ions in water
Maxxam ID BDF184‐01 BDF185‐01 BDF186‐01 BDF187‐01
Client ID
HAC‐1 N14265
HAC‐2 HAC‐3 HAC‐4
N14266 N14267 N14268
Deployment time 38.2 days 38.2 days 38.2 days 38.1 days QC BATCH Average temperature 10.9 °C 11.1 °C 11.2 °C 11.2 °C
Note Metal Name MDLw RDLw Units Time‐averaged concentration in water, CW
1 Aluminum (Al) 1.6 5.4 μg/L 6.1 15 6.5 <RDLw 4226452
Antimony (Sb) 0.053 0.26 μg/L <MDLw <MDLw <MDLw <MDLw 4226452
6 Arsenic (As) 0.054 0.27 μg/L <RDLw <RDLw <RDLw <RDLw 4226452
Barium (Ba) 0.17 0.68 μg/L 19 26 14 13 4226452
Beryllium (Be) 0.054 0.27 μg/L <MDLw <MDLw <MDLw <MDLw 4226452
3 Bismuth (Bi) n/a n/a μg/L n/a n/a n/a n/a 4226452
3 Boron (B) n/a n/a μg/L n/a n/a n/a n/a 4226452
Cadmium (Cd) 0.0059 0.029 μg/L <MDLw <MDLw <MDLw <RDLw 4226452
1, 4 Calcium (Ca) 33 109 μg/L 280 350 250 260 4226452
Chromium (Cr) 0.32 1.6 μg/L <MDLw <MDLw <MDLw <MDLw 4226452
Cobalt (Co) 0.031 0.15 μg/L <MDLw <MDLw <MDLw <MDLw 4226452
Copper (Cu) 0.058 0.29 μg/L 5.5 6.2 5.5 5.1 4226452
Iron (Fe) 2.7 13 μg/L <MDLw <MDLw <MDLw <MDLw 4226452
Lead (Pb) 0.020 0.10 μg/L <MDLw <MDLw <MDLw <MDLw 4226452
4 Lithium (Li) 0.16 0.79 μg/L <MDLw <MDLw <MDLw <MDLw 4226452
Magnesium (Mg) 2.3 12 μg/L 15 17 14 <RDLw 4226452
Manganese (Mn) 0.14 0.70 μg/L 1.9 2.9 1.9 1.8 4226452
1, 6 Molybdenum (Mo) 0.091 0.30 μg/L <RDLw <RDLw <RDLw <MDLw 4226452
1 Nickel (Ni) 0.24 0.81 μg/L <MDLw <MDLw <MDLw <MDLw 4226452
6 Phosphorus (P) 2.7 13 μg/L <MDLw <MDLw <MDLw <MDLw 4226452
4 Potassium (K) 3.3 17 µg/L <MDLw <MDLw <MDLw <MDLw 4226452
6 Selenium (Se) 0.073 0.37 μg/L <MDLw <MDLw <MDLw <MDLw 4226452
4 Silver (Ag) 0.0023 0.012 μg/L <RDLw <MDLw <MDLw <MDLw 4226452
1, 4 Sodium (Na) 93000 310000 μg/L <MDLw <MDLw <MDLw <MDLw 4226452
1 Strontium (Sr) 0.13 0.45 μg/L 3.3 5.3 2.1 2.1 4226452
Thallium (Tl) 0.00081 0.0041 μg/L <MDLw <MDLw <MDLw <MDLw 4226452
3 Tin (Sn) n/a n/a μg/L n/a n/a n/a n/a 4226452
5 Titanium (Ti) n/a n/a μg/L n/a n/a n/a n/a 4226452
6 Uranium (U) 0.0047 0.024 μg/L 0.041 0.064 <RDLw <RDLw 4226452
6 Vanadium (V) 0.059 0.15 μg/L 0.70 0.85 0.85 0.69 4226452
Zinc (Zn) 0.20 1.0 μg/L <MDLw <MDLw <MDLw <MDLw 4226452
1 DLs increased due to presence in the fabrication control or in the method blanks 2 DLs increased due to presence in the trip blank or in the field blanks 3 No gel or water diffusion coefficient reported, water concentrations cannot be calculated 4 Metal has low affinity for the resin; reported values should be interpreted with caution 5 Metal cannot be reported when using a Chelex‐Metsorb resin 6 Metal present as oxyanion
MDLw – Method Detection Limit in water RDLw – Reporting Detection Limit in water Cw – Estimated concentration in water

Maxxam Job #: B5K6077 Maxxam (Burnaby) Job #: B588897 Report Date: 23 November 2015 Analysis Date: 22 October 2015
Page 3 of 9 6740 Campobello Road, Mississauga, ON L5N 2L8
Minnow EnvironmentalProject #: 2574
Time averaged concentrations of free metal ions in water
Maxxam ID BDF188‐01 BDF189‐01 BDF190‐01 BDF191‐01
Client ID
P2‐1 N14269
P2‐2 P2‐3 P2‐4
N14270 N14271 N14272
Deployment time 38.2 days 38.2 days 38.2 days 38.2 days QC BATCH Average temperature 6.0 °C 6.0 °C 6.0 °C 6.0 °C
Note Metal Name MDLw RDLw Units Time‐averaged concentration in water, CW
1 Aluminum (Al) 1.9 6.4 μg/L <MDLw <MDLw <MDLw <MDLw 4226452
Antimony (Sb) 0.062 0.31 μg/L <MDLw <MDLw <MDLw <MDLw 4226452
6 Arsenic (As) 0.064 0.32 μg/L <RDLw <RDLw <RDLw <RDLw 4226452
Barium (Ba) 0.20 0.81 μg/L 5.7 6.0 6.4 5.9 4226452
Beryllium (Be) 0.065 0.32 μg/L <MDLw <MDLw <MDLw <MDLw 4226452
3 Bismuth (Bi) n/a n/a μg/L n/a n/a n/a n/a 4226452
3 Boron (B) n/a n/a μg/L n/a n/a n/a n/a 4226452
Cadmium (Cd) 0.0070 0.035 μg/L <MDLw <MDLw <MDLw <MDLw 4226452
1, 4 Calcium (Ca) 39 130 μg/L 220 220 260 200 4226452
Chromium (Cr) 0.38 1.9 μg/L <MDLw <MDLw <MDLw <MDLw 4226452
Cobalt (Co) 0.037 0.18 μg/L <MDLw <MDLw <MDLw <MDLw 4226452
Copper (Cu) 0.069 0.35 μg/L 0.42 <RDLw 0.39 0.45 4226452
Iron (Fe) 3.2 16 μg/L <MDLw <MDLw <MDLw <MDLw 4226452
Lead (Pb) 0.024 0.12 μg/L <MDLw <MDLw <MDLw <MDLw 4226452
4 Lithium (Li) 0.19 0.94 μg/L <MDLw <MDLw <MDLw <MDLw 4226452
Magnesium (Mg) 2.7 14 μg/L <MDLw <MDLw <RDLw <MDLw 4226452
Manganese (Mn) 0.17 0.83 μg/L 11 9.0 6.6 9.5 4226452
1, 6 Molybdenum (Mo) 0.11 0.36 μg/L 2.8 2.9 3.2 3.0 4226452
1 Nickel (Ni) 0.29 0.96 μg/L <MDLw <MDLw <MDLw <MDLw 4226452
6 Phosphorus (P) 3.2 16 μg/L <RDLw <RDLw <RDLw <RDLw 4226452
4 Potassium (K) 4.0 20 µg/L <MDLw <MDLw <MDLw <MDLw 4226452
6 Selenium (Se) 0.087 0.44 μg/L <MDLw <MDLw <MDLw <MDLw 4226452
4 Silver (Ag) 0.0027 0.014 μg/L <MDLw <MDLw <MDLw <MDLw 4226452
1, 4 Sodium (Na) 110000 370000 μg/L <MDLw <MDLw <MDLw <MDLw 4226452
1 Strontium (Sr) 0.16 0.53 μg/L 1.7 1.8 2.2 1.9 4226452
Thallium (Tl) 0.0010 0.0048 μg/L <MDLw <MDLw <MDLw <MDLw 4226452
3 Tin (Sn) n/a n/a μg/L n/a n/a n/a n/a 4226452
5 Titanium (Ti) n/a n/a μg/L n/a n/a n/a n/a 4226452
6 Uranium (U) 0.0056 0.028 μg/L 0.086 0.093 0.091 0.094 4226452
6 Vanadium (V) 0.070 0.17 μg/L 0.43 0.39 0.46 0.44 4226452
Zinc (Zn) 0.24 1.2 μg/L <MDLw <MDLw <MDLw <MDLw 4226452
1 DLs increased due to presence in the fabrication control or in the method blanks 2 DLs increased due to presence in the trip blank or in the field blanks 3 No gel or water diffusion coefficient reported, water concentrations cannot be calculated 4 Metal has low affinity for the resin; reported values should be interpreted with caution 5 Metal cannot be reported when using a Chelex‐Metsorb resin 6 Metal present as oxyanion
MDLw – Method Detection Limit in water RDLw – Reporting Detection Limit in water Cw – Estimated concentration in water

Maxxam Job #: B5K6077 Maxxam (Burnaby) Job #: B588897 Report Date: 23 November 2015 Analysis Date: 22 October 2015
Page 4 of 9 6740 Campobello Road, Mississauga, ON L5N 2L8
Minnow EnvironmentalProject #: 2574
Time averaged concentrations of free metal ions in water
Maxxam ID BDF192‐01 BDF193‐01 BDF194‐01 BDF195‐01
Client ID
B2‐1 N14273
B2‐2 B2‐3 B2‐4
N14274 N14275 N14276
Deployment time 37.9 days 37.9 days 37.8 days 37.8 days QC BATCH Average temperature 8.6 °C 8.6 °C 8.6 °C 8.6 °C
Note Metal Name MDLw RDLw Units Time‐averaged concentration in water, CW
1 Aluminum (Al) 1.8 5.9 μg/L <MDLw <MDLw <MDLw <MDLw 4226452
Antimony (Sb) 0.058 0.29 μg/L <MDLw <MDLw <MDLw <MDLw 4226452
6 Arsenic (As) 0.059 0.30 μg/L <RDLw <RDLw <RDLw <RDLw 4226452
Barium (Ba) 0.19 0.75 μg/L 8.1 9.4 10 12 4226452
Beryllium (Be) 0.060 0.30 μg/L <MDLw <MDLw <MDLw <MDLw 4226452
3 Bismuth (Bi) n/a n/a μg/L n/a n/a n/a n/a 4226452
3 Boron (B) n/a n/a μg/L n/a n/a n/a n/a 4226452
Cadmium (Cd) 0.0064 0.032 μg/L <MDLw <MDLw <MDLw <MDLw 4226452
1, 4 Calcium (Ca) 36 120 μg/L <RDLw <RDLw <RDLw <RDLw 4226452
Chromium (Cr) 0.35 1.8 μg/L <MDLw <MDLw <MDLw <MDLw 4226452
Cobalt (Co) 0.034 0.17 μg/L <RDLw <RDLw <RDLw <RDLw 4226452
Copper (Cu) 0.064 0.32 μg/L <RDLw <RDLw <RDLw <RDLw 4226452
Iron (Fe) 2.9 15 μg/L 340 350 264 333 4226452
Lead (Pb) 0.022 0.11 μg/L <MDLw <MDLw <MDLw <MDLw 4226452
4 Lithium (Li) 0.17 0.87 μg/L <MDLw <MDLw <MDLw <MDLw 4226452
Magnesium (Mg) 2.5 13 μg/L <MDLw <MDLw <MDLw <MDLw 4226452
Manganese (Mn) 0.15 0.77 μg/L 56 64 69 86 4226452
1, 6 Molybdenum (Mo) 0.10 0.33 μg/L 0.51 0.53 0.52 0.54 4226452
1 Nickel (Ni) 0.26 0.88 μg/L <MDLw <MDLw <MDLw <MDLw 4226452
6 Phosphorus (P) 3.0 15 μg/L 27 35 37 44 4226452
4 Potassium (K) 3.7 18 µg/L <MDLw <MDLw <MDLw <MDLw 4226452
6 Selenium (Se) 0.080 0.40 μg/L <MDLw <MDLw <MDLw <MDLw 4226452
4 Silver (Ag) 0.0025 0.013 μg/L <MDLw <MDLw <MDLw <MDLw 4226452
1, 4 Sodium (Na) 100000 340000 μg/L <MDLw <MDLw <MDLw <MDLw 4226452
1 Strontium (Sr) 0.15 0.49 μg/L 1.1 1.3 1.2 1.5 4226452
Thallium (Tl) 0.00089 0.0045 μg/L <MDLw <MDLw <MDLw <MDLw 4226452
3 Tin (Sn) n/a n/a μg/L n/a n/a n/a n/a 4226452
5 Titanium (Ti) n/a n/a μg/L n/a n/a n/a n/a 4226452
6 Uranium (U) 0.0052 0.026 μg/L <MDLw <MDLw <MDLw <MDLw 4226452
6 Vanadium (V) 0.064 0.16 μg/L <MDLw <MDLw <MDLw <MDLw 4226452
Zinc (Zn) 0.22 1.1 μg/L <MDLw <MDLw <MDLw <MDLw 4226452
1 DLs increased due to presence in the fabrication control or in the method blanks 2 DLs increased due to presence in the trip blank or in the field blanks 3 No gel or water diffusion coefficient reported, water concentrations cannot be calculated 4 Metal has low affinity for the resin; reported values should be interpreted with caution 5 Metal cannot be reported when using a Chelex‐Metsorb resin 6 Metal present as oxyanion
MDLw – Method Detection Limit in water RDLw – Reporting Detection Limit in water Cw – Estimated concentration in water

Maxxam Job #: B5K6077 Maxxam (Burnaby) Job #: B588897 Report Date: 23 November 2015 Analysis Date: 22 October 2015
Page 5 of 9 6740 Campobello Road, Mississauga, ON L5N 2L8
Minnow EnvironmentalProject #: 2574
Time averaged concentrations of free metal ions in water
Maxxam ID BDF196‐01 BDF197‐01 BDF198‐01 BDF199‐01
Client ID
PNF‐1 N14277
PNF‐2 PNF‐3 PNF‐4
N14278 N14279 N14280
Deployment time 35.6 days 35.6 days 35.6 days 35.6 days QC BATCH Average temperature 4.5 °C 4.5 °C 4.5 °C 4.5 °C
Note Metal Name MDLw RDLw Units Time‐averaged concentration in water, CW
1 Aluminum (Al) 2.2 7.2 μg/L <RDLw 12 <RDLw <RDLw 4226452
Antimony (Sb) 0.071 0.35 μg/L <MDLw <MDLw <MDLw <MDLw 4226452
6 Arsenic (As) 0.073 0.36 μg/L <MDLw <MDLw <MDLw <MDLw 4226452
Barium (Ba) 0.23 0.91 μg/L 6.9 6.3 5.2 7.2 4226452
Beryllium (Be) 0.073 0.37 μg/L <MDLw <MDLw <MDLw <MDLw 4226452
3 Bismuth (Bi) n/a n/a μg/L n/a n/a n/a n/a 4226452
3 Boron (B) n/a n/a μg/L n/a n/a n/a n/a 4226452
Cadmium (Cd) 0.0079 0.039 μg/L <MDLw <MDLw <MDLw <MDLw 4226452
1, 4 Calcium (Ca) 44 150 μg/L 310 280 260 260 4226452
Chromium (Cr) 0.43 2.2 μg/L <MDLw <MDLw <MDLw <MDLw 4226452
Cobalt (Co) 0.041 0.21 μg/L <MDLw <MDLw <MDLw <MDLw 4226452
Copper (Cu) 0.078 0.39 μg/L <RDLw <RDLw <RDLw <RDLw 4226452
Iron (Fe) 3.6 18 μg/L <MDLw <RDLw <MDLw <MDLw 4226452
Lead (Pb) 0.027 0.14 μg/L <MDLw <MDLw <MDLw <MDLw 4226452
4 Lithium (Li) 0.21 1.1 μg/L <MDLw <MDLw <MDLw <MDLw 4226452
Magnesium (Mg) 3.1 16 μg/L <MDLw <MDLw <MDLw <MDLw 4226452
Manganese (Mn) 0.19 0.94 μg/L 3.9 4.9 3.9 4.4 4226452
1, 6 Molybdenum (Mo) 0.12 0.41 μg/L <RDLw <RDLw <RDLw <RDLw 4226452
1 Nickel (Ni) 0.32 1.1 μg/L <MDLw <MDLw <MDLw <MDLw 4226452
6 Phosphorus (P) 3.6 18 μg/L <MDLw <MDLw <MDLw <MDLw 4226452
4 Potassium (K) 4.5 22 µg/L <MDLw <MDLw <MDLw <MDLw 4226452
6 Selenium (Se) 0.10 0.49 μg/L <MDLw <MDLw <MDLw <MDLw 4226452
4 Silver (Ag) 0.0031 0.016 μg/L <MDLw <MDLw <MDLw <MDLw 4226452
1, 4 Sodium (Na) 120000 410000 μg/L <MDLw <MDLw <MDLw <MDLw 4226452
1 Strontium (Sr) 0.18 0.60 μg/L 2.2 1.8 1.4 2.0 4226452
Thallium (Tl) 0.0011 0.0055 μg/L <MDLw <MDLw <MDLw <MDLw 4226452
3 Tin (Sn) n/a n/a μg/L n/a n/a n/a n/a 4226452
5 Titanium (Ti) n/a n/a μg/L n/a n/a n/a n/a 4226452
6 Uranium (U) 0.0064 0.032 μg/L 0.072 0.078 0.075 0.086 4226452
6 Vanadium (V) 0.079 0.20 μg/L <RDLw <RDLw <MDLw <RDLw 4226452
Zinc (Zn) 0.27 1.4 μg/L <MDLw 15 <MDLw <MDLw 4226452
1 DLs increased due to presence in the fabrication control or in the method blanks 2 DLs increased due to presence in the trip blank or in the field blanks 3 No gel or water diffusion coefficient reported, water concentrations cannot be calculated 4 Metal has low affinity for the resin; reported values should be interpreted with caution 5 Metal cannot be reported when using a Chelex‐Metsorb resin 6 Metal present as oxyanion
MDLw – Method Detection Limit in water RDLw – Reporting Detection Limit in water Cw – Estimated concentration in water

Maxxam Job #: B5K6077 Maxxam (Burnaby) Job #: B588897 Report Date: 23 November 2015 Analysis Date: 22 October 2015
Page 6 of 9 6740 Campobello Road, Mississauga, ON L5N 2L8
Minnow EnvironmentalProject #: 2574
Time averaged concentrations of free metal ions in water
Maxxam ID BDF200‐01 BDF201‐01 BDF202‐01 BDF203‐01
Client ID
PRef1‐1 N14281
PRef1‐2 PRef1‐3 PRef1‐4
N14282 N14283 N14284
Deployment time 34.3 days 34.3 days 34.3 days 34.2 days QC BATCH Average temperature 3.9 °C 3.9 °C 3.9 °C 3.9 °C
Note Metal Name MDLw RDLw Units Time‐averaged concentration in water, CW
1 Aluminum (Al) 2.3 7.7 μg/L <RDLw <RDLw 12 <RDLw 4226452
Antimony (Sb) 0.075 0.38 μg/L <MDLw <MDLw <MDLw <MDLw 4226452
6 Arsenic (As) 0.078 0.39 μg/L <MDLw <MDLw <MDLw <MDLw 4226452
Barium (Ba) 0.24 0.97 μg/L 5.8 5.6 6.2 5.8 4226452
Beryllium (Be) 0.078 0.39 μg/L <MDLw <MDLw <MDLw <MDLw 4226452
3 Bismuth (Bi) n/a n/a μg/L n/a n/a n/a n/a 4226452
3 Boron (B) n/a n/a μg/L n/a n/a n/a n/a 4226452
Cadmium (Cd) 0.0084 0.042 μg/L <MDLw <MDLw <MDLw <MDLw 4226452
1, 4 Calcium (Ca) 47 155 μg/L 200 290 310 310 4226452
Chromium (Cr) 0.46 2.3 μg/L <MDLw <MDLw <MDLw <MDLw 4226452
Cobalt (Co) 0.044 0.22 μg/L <MDLw <MDLw <MDLw <MDLw 4226452
Copper (Cu) 0.083 0.42 μg/L <RDLw <RDLw <RDLw <MDLw 4226452
Iron (Fe) 3.8 19 μg/L <MDLw <MDLw <MDLw <MDLw 4226452
Lead (Pb) 0.029 0.15 μg/L <MDLw <MDLw <MDLw <MDLw 4226452
4 Lithium (Li) 0.23 1.1 μg/L <MDLw <MDLw <MDLw <MDLw 4226452
Magnesium (Mg) 3.3 17 μg/L <MDLw <MDLw <MDLw <MDLw 4226452
Manganese (Mn) 0.20 1.0 μg/L 4.5 2.4 5.1 7.0 4226452
1, 6 Molybdenum (Mo) 0.13 0.43 μg/L <MDLw <MDLw <MDLw <RDLw 4226452
1 Nickel (Ni) 0.35 1.2 μg/L <MDLw <MDLw <MDLw <MDLw 4226452
6 Phosphorus (P) 3.9 19 μg/L <MDLw <MDLw <MDLw <MDLw 4226452
4 Potassium (K) 4.8 24 µg/L <MDLw <MDLw <MDLw <MDLw 4226452
6 Selenium (Se) 0.10 0.52 μg/L <MDLw <MDLw <MDLw <MDLw 4226452
4 Silver (Ag) 0.0033 0.017 μg/L <MDLw <MDLw <MDLw <MDLw 4226452
1, 4 Sodium (Na) 130000 440000 μg/L <MDLw <MDLw <MDLw <MDLw 4226452
1 Strontium (Sr) 0.19 0.64 μg/L 1.6 2.2 2.2 2.2 4226452
Thallium (Tl) 0.0012 0.0058 μg/L <MDLw <MDLw <MDLw <MDLw 4226452
3 Tin (Sn) n/a n/a μg/L n/a n/a n/a n/a 4226452
5 Titanium (Ti) n/a n/a μg/L n/a n/a n/a n/a 4226452
6 Uranium (U) 0.0068 0.034 μg/L 0.070 0.054 0.061 0.058 4226452
6 Vanadium (V) 0.084 0.21 μg/L <MDLw <MDLw <MDLw <MDLw 4226452
Zinc (Zn) 0.29 1.5 μg/L <MDLw <MDLw <MDLw <MDLw 4226452
1 DLs increased due to presence in the fabrication control or in the method blanks 2 DLs increased due to presence in the trip blank or in the field blanks 3 No gel or water diffusion coefficient reported, water concentrations cannot be calculated 4 Metal has low affinity for the resin; reported values should be interpreted with caution 5 Metal cannot be reported when using a Chelex‐Metsorb resin 6 Metal present as oxyanion
MDLw – Method Detection Limit in water RDLw – Reporting Detection Limit in water Cw – Estimated concentration in water

Maxxam Job #: B5K6077 Maxxam (Burnaby) Job #: B588897 Report Date: 23 November 2015 Analysis Date: 22 October 2015
Page 7 of 9 6740 Campobello Road, Mississauga, ON L5N 2L8
Minnow EnvironmentalProject #: 2574
Quality Assurance Notes
1. Estimated water concentrations (CW), Method Detection Limits (MDLW) and Reporting Detection Limits (RDLW) were calculated using the average temperature and DGT deployment times reported by the client.
2. A single average Detection Limit is reported for samples from the same site as the temperature and deployment time variability was considered to be not significant compared with analytical variance.
3. The following DGT specifications, provided by the supplier, were used for the water concentration estimations:
Diffusive layer thickness, gel plus membrane, (Δg) = 0.90 mm
Area of exposed diffusive layer = 3.14 cm2
Volume of resin = 0.2 mL
4. Diffusion coefficients in diffusive gel at 25 °C were taken from the Technical Documentation published by DGT Research LTD and other published literature values. Where diffusion coefficients in the diffusion gel were not available, water diffusion coefficients at 25°C were used. Diffusion coefficients at 25 °C were, in turn, used to calculate the diffusion coefficients at the average temperature of deployment.
5. Diffusion coefficients for Bi, B and Sn were not reported in the available sources and therefore water concentration estimates for these metals have not been included in this report. These can be calculated in the future if appropriate diffusion coefficients become available.
6. The Chelex‐Metsorb resin is selective towards di‐and tri‐valent cationic metal species and oxyanionic species; as a result, monovalent metal species including Lithium (Li), Sodium (Na), Potassium (K), and Silver (Ag) have extremely low affinity and data for these metals should be interpreted with caution. Calcium (Ca), despite being divalent, is also known to have a low affinity for this resin.
7. Titanium (Ti) cannot be reported when using a Chelex‐Metsorb mixed binding layer because Metsorb is a titanium‐based resin.
8. All results have been rounded to two significant figures.
9. All DGTS, including fabrication controls, trip blanks and field blanks were from the same lot of DGTs, obtained from the supplier at the same time. Trip blanks and field blanks were shipped to accompany the deployed DGTs while the fabrication controls were retained in the lab for QC purposes. Copper was detected in the trip blank DGT (N14283), which was shipped to the field, double sealed in zip‐lock bags and stored by the client along with the field blanks during the deployment. We note that copper was not detected in the laboratory method blank prepared from the same reagents that were used for all of the resin digests. Copper was also not detected in any of the fabrication controls or most importantly, any of the field blanks. Because of this we suggest the presence of copper in the trip blank may be considered as spurious and we determined that it was not necessary to increase the copper Detection Limits of estimated water concentrations.

Maxxam Job #: B5K6077 Maxxam (Burnaby) Job #: B588897 Report Date: 23 November 2015 Analysis Date: 22 October 2015
Page 8 of 9 6740 Campobello Road, Mississauga, ON L5N 2L8
Minnow EnvironmentalProject #: 2574
Quality Assurance Report
Metals Extracted by Field Blanks and Trip Blanks
Maxxam ID BDF204‐01 BDF205‐01 BDF206‐01
Client ID
Field Blank 1 Field Blank 2 Trip Blank
N14289 N14282 N14283
Deployment time n/a n/a n/a QC BATCH Temperature n/a n/a n/a
Note Metal Name MDL RDL Units Mass Extracted by DGT
3 Aluminum (Al) 0.59 1.96 µg <MDL <MDL <MDL 4226497
Antimony (Sb) 0.025 0.13 µg <MDL <MDL <MDL 4226497
Arsenic (As) 0.025 0.13 µg <MDL <MDL <MDL 4226497
Barium (Ba) 0.063 0.25 µg <MDL <MDL <MDL 4226497
Beryllium (Be) 0.013 0.063 µg <MDL <MDL <MDL 4226497
3 Bismuth (Bi) 0.077 0.26 µg <MDL <MDL <MDL 4226497
Boron (B) 0.25 1.3 µg <MDL <MDL <MDL 4226497
Cadmium (Cd) 0.0025 0.013 µg <MDL <MDL <MDL 4226497
1, 3 Calcium (Ca) 20 66 µg <MDL <MDL <MDL 4226497
Chromium (Cr) 0.125 0.63 µg <MDL <MDL <MDL 4226497
Cobalt (Co) 0.013 0.063 µg <MDL <MDL <MDL 4226497
Copper (Cu) 0.025 0.13 µg <MDL <MDL 1.06 4226497
Iron (Fe) 1.25 6.3 µg <MDL <MDL <MDL 4226497
Lead (Pb) 0.013 0.063 µg <MDL <MDL <MDL 4226497
1 Lithium (Li) 0.125 0.63 µg <MDL <MDL <MDL 4226497
Magnesium (Mg) 1.25 6.3 µg <MDL <MDL <MDL 4226497
Manganese (Mn) 0.05 0.25 µg <MDL <MDL <MDL 4226497
3 Molybdenum (Mo) 0.044 0.15 µg <MDL <MDL <MDL 4226497
3 Nickel (Ni) 0.095 0.32 µg <MDL <MDL <MDL 4226497
Phosphorus (P) 1.25 6.3 µg <MDL <MDL <MDL 4226497
1 Potassium (K) 5 25 µg <MDL <MDL <MDL 4226497
Selenium (Se) 0.05 0.25 µg <MDL <MDL <MDL 4226497
3 Strontium (Sr) 0.082 0.27 µg <MDL <MDL <MDL 4226497
1 Silver (Ag) 0.0025 0.013 µg <MDL <MDL <MDL 4226497
1, 3 Sodium (Na) 94000 310000 µg <MDL <MDL <MDL 4226497
Thallium (Tl) 0.0013 0.013 µg <MDL <MDL <MDL 4226497
3 Tin (Sn) 0.092 0.31 µg <MDL <MDL <MDL 4226497
2 Titanium (Ti) n/a n/a µg n/a n/a n/a 4226497
Uranium (U) 0.0025 0.013 µg <MDL <MDL <MDL 4226497
Vanadium (V) 0.025 0.063 µg <MDL <MDL <MDL 4226497
Zinc (Zn) 0.125 0.63 µg <MDL <MDL <MDL 4226497
1 – Metal has very low affinity for the resin 2 – Metal cannot be reported when using Chelex‐Metsorb resin (titanium based resin) 3 – MDL and RDL were raised due to presence in the fabrication controls and/or blanks (see QA report)
Notes: a. The data presented here have not been rounded due to the wide range of concentrations reported and to facilitate
further data manipulation. In any final data presentation, only two significant figures should be reported. b. <MDL: Target compound not detected (below Method Detection Limit). c. <RDL: Target compound detected above MDL but below Reporting Detection Limit.

Maxxam Job #: B5K6077 Maxxam (Burnaby) Job #: B588897 Report Date: 23 November 2015 Analysis Date: 22 October 2015
Page 9 of 9 6740 Campobello Road, Mississauga, ON L5N 2L8
Minnow EnvironmentalProject #: 2574
Background information
Diffusion coefficients at 25 °C
Metal Name D25 Units
Aluminum (Al) 4.75 10‐6 cm2/s
Antimony (Sb) 6.22 10‐6 cm2/sArsenic (As) 6.02 10‐6 cm2/sBarium (Ba) 4.80 10‐6 cm2/sBeryllium (Be) 3.00 10‐6 cm2/sCadmium (Cd) 6.09 10‐6 cm2/sCalcium (Ca) 7.93 10‐6 cm2/sChromium (Cr) 5.05 10‐6 cm2/sCobalt (Co) 5.94 10‐6 cm2/sCopper (Cu) 6.23 10‐6 cm2/sIron (Fe) 6.11 10‐6 cm2/sLead (Pb) 8.03 10‐6 cm2/sLithium (Li) 10.3 10‐6 cm2/sMagnesium (Mg) 7.05 10‐6 cm2/sManganese (Mn) 5.85 10‐6 cm2/sMolybdenum (Mo) 6.33 10‐6 cm2/sNickel (Ni) 5.77 10‐6 cm2/sPhosphorus (P) 6.05 10‐6 cm2/sPotassium (K) 19.6 10‐6 cm2/sSelenium (Se) 8.91 10‐6 cm2/sSilver (Ag) 14.1 10‐6 cm2/sSodium (Na) 13.3 10‐6 cm2/sStrontium (Sr) 14.1 10‐6 cm2/sThallium (Tl) 13.3 10‐6 cm2/sUranium (U) 5.56 10‐6 cm2/sVanadium (V) 7.98 10‐6 cm2/sZinc (Zn) 6.08 10‐6 cm2/s