membrane technologies by peter s. cartwright, pe cwqa profesional development seminar may 4, 2007...
TRANSCRIPT

MEMBRANE TECHNOLOGIES
By
Peter S. Cartwright, PE
CWQA PROFESIONAL DEVELOPMENT SEMINAR
May 4, 2007
United States Office European office8324 16th Avenue South President Kennedylaan 94Minneapolis, MN 55425-1742 2343 GT OegstgeestPhone: (952) 854-4911 The NetherlandsFax: (952) 854-6964 Phone: [email protected] Fax: 31-71-5156636www.cartwright-consulting.com
Cartwright Consulting Co.
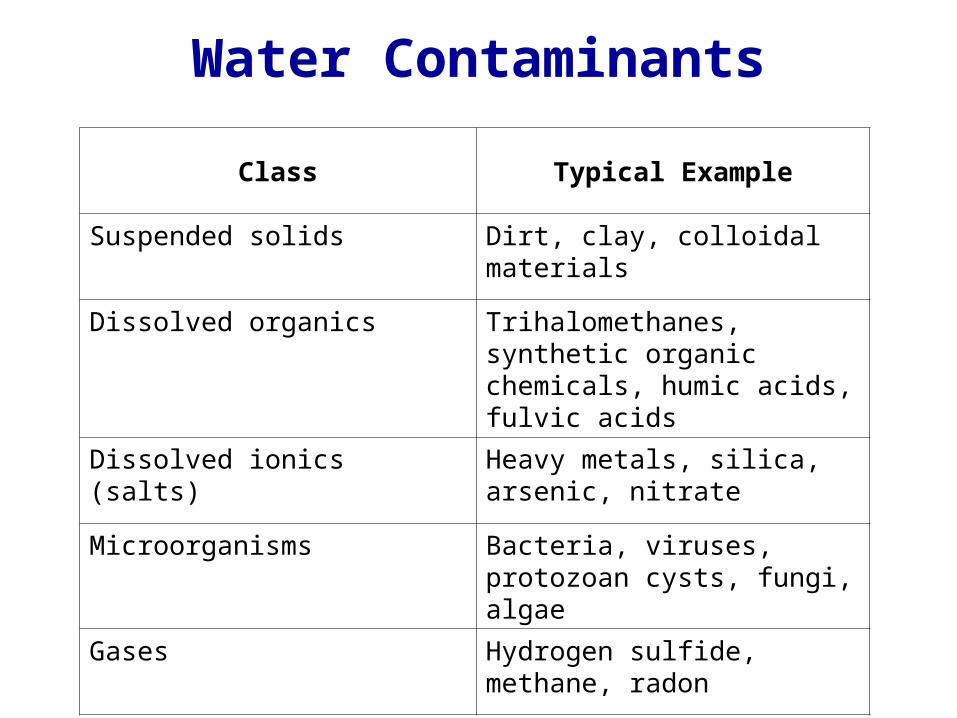
Water Contaminants
Class Typical Example
Suspended solids Dirt, clay, colloidal materials
Dissolved organics Trihalomethanes, synthetic organic chemicals, humic acids, fulvic acids
Dissolved ionics (salts) Heavy metals, silica, arsenic, nitrate
Microorganisms Bacteria, viruses, protozoan cysts, fungi, algae
Gases Hydrogen sulfide, methane, radon

Filtration Range

Particle Size
Human Hair ~ 75 microns
Yeast Cell = 3.00 microns
Bacteria = 0.45 microns
Ferric Iron Molecule = 0.001 microns

Relative Sizes of Particles
xxxSubstance Microns Inches
Grain of table salt
100 0.0039
Human hair 80 0.0032
Lower limit of visibility
40 0.0016
Milled flour 25 0.0010
Red blood cells
8 0.0003
Bacteria 2 0.0001

Feed
Permeate orFiltrate
Barrier media
Conventional “dead-end” Filtration

Crossflow Filtration
Feed Concentrate
Permeate
Membrane

“Sweeping” by Tangential Flow
Feed
Concentrate
Permeate
Membrane

Continuous process resulting in automatic and
uninterrupted operation Low energy utilization involving neither phase nor
temperature changes Modular design – no significant size limitations Minimal moving parts with low maintenance
requirements No effect on form or chemistry of the contaminant Discrete membrane barrier to ensure physical
separation No chemical addition requirements
Membrane Separation Technologies Features

Microfiltration

Microfiltrationxxx

Ultrafiltration

Ultrafiltration

Nanofiltration

Osmosis
Lower concentration
Higherconcentration
Semi-permeableMembrane

Osmosis
Water Flow
Level risesDifference in
level is Osmotic Pressure

Reverse Osmosis
Pressure
Semi-permeableMembrane
Can force (reverse)osmotic flow to
lower-concentrationside

Reverse Osmosis Applied
Pressure
Semi-permeableMembrane
Fresh water
Feed Water
ConcentrateFlow

Reverse Osmosisxxx

Reverse Osmosis

Reverse Osmosis

Pure Water Layer Theory
Membrane
Pure Water Layer7A
o
High Pressure
Bulk Solution
Atmospheric Pressure

RO Fundamentals
Semi-permeable membrane uses two mechanisms for removal of impurities:
Rejection (repels mineral salts involving dielectric and molecular forces)
Sieving (does not allow particulate matter to pass on a small scale ~0.0005 microns. Tiny organics and gas molecules can pass.)

Osmotic Pressure
Equation
= 1.19(T + 273) Mi
= Osmotic Pressure (psi)T = Water Temperature (oC)Mi = Molar Concentration of
individual ions (gmol/L)

Typical Osmotic Pressures (25oC)
Compound
Conc. (mg/L)
Conc. (mol/L)
Osmotic Pressure
(psi)
NaCl 35,000 0.6 398
NaCl 1,000 0.0171 11.4
NaHCO3 1,000 0.0119 12.8
Na2SO4 1,000 0.00705 6
MgSO4 1,000 0.00831 3.6
MgCl2 1,000 0.0105 9.7
CaCl2 1,000 0.009 8.3
Sucrose 1,000 0.00292 1.05
Dextrose 1,000 0.00555 2.0

Solute Concentration as a Function of Osmotic Pressure
500
400
300
200
100
0 5 10 15 20 25 30 35
Concentration in Water (w/w %)
Osm
otic
Pre
ssu
re (
psi
) Lit
hium
chl
orid
eSo
dium
chl
orid
eSe
awat
er
Eth
yl a
lcoh
olE
thyl
ene
glyc
ol
Mag
nesi
um s
ulfa
te
Zin
c su
lfat
eF
ruct
ose
Sucr
ose

RO Performance Equations
Osmotic Pressure: The pressure, due to the effect of TDS in the feed water, that must be overcome in order to generate product water flow.
For monovalent salts, assume 1 psi of osmotic pressure per 100 mg/L of TDS.
For multivalent salts, assume ½ psi of osmotic pressure per 100 mg/L of TDS.

R.O. Contaminant RejectionInorganics CTA Rejection TFC Rejection inorganics CTA
RejectionTFC Rejection
Sodium 85-90% 90-95% Fluoride 85-90% 90-95
Calcium 90-95% 93-98% Phosphate 90-95% 93-98%
Magnesium 90-95% 93-98% Chromate 85-90% 90-95%
Potassium 85-90% 90-95% Cyanide 85-90% 90-95%
Iron 90-95% 93-98% Sulfate 90-95 93-98%
Manganese 90-95% 93-98% Boron 30-40% 55-60%
Aluminum 90-95% 93-98% Arsenic+3 60-70% 70-80%
Copper 90-95% 93-98% Arsenic+5 85-90% 93-98%
Nickel 90-95% 93-98% Selenium 90-95% 93-98%
Zinc 90-95% 93-98% Radioactivity 90-95% 93-98%
Strontium 90-95% 93-98% Biological&Particles
Cadmium 90-95% 93-98% Bacteria >99% >99%
Silver 90-95% 93-98% Protozoa >99% >99%
Mercury 90-95% 93-98% Amoebic Cysts >99% >99%
Barium 90-95% 93-98% Giardia >99% >99%
Chromium 90-95% 93-98% Asbestos >99% >99%
Lead 90-95% 93-98% Sediment/Turbidity >99% >99%
Chloride 85-95% 90-95% Organics
Bicarbonate 85-90% 90-95% Organics MW>300 >90% >99%
Nitrate 40-50% 85-90% Organics MW<300 0-90% 0-99%
CTA-Cellulosic MembraneTFC-Thin Film Composite
All rejections nominal for 60 psi net pressureand at 77oF

Membrane Comparisons
Cellulosic
Thin Film Composite
Effect of Bacteria Some bacteria will attack
Very bacteria resistant
pH Range 4.0 – 8.5 2.0 – 11.0
Chlorine Tolerance
Excellent Resistance
Poor Resistance 200 - 1000 ppm hrs.
% Rejection
Nominal TDS dependence
92%
Decreases as TDS Increases
95%
Constant
Nitrate Rejection 0% - 65% 40% - 90%
Temperature Limit 87oF (31oC) 112oF (45oC)

Membrane Technology Comparison Chart
Feature Microfiltration Ultrafiltration Nanofiltration Reverse Osmosis
Polymers Ceramics, sintered metals, polypropylene, polysulfone, polyethersulfone, polyvinylidene fluoride, polytetrafluoroethy-liene
Ceramics, sintered metals, cellulosics, polysulfone, polyethersulfone, polyvinylidene fluoride
Thin film composites, cellulosics
Thin film composites, cellulosics
Pore Size Range (micrometers)
0.01 - 1.0 0.001 - 0.01 0.0001 - 0.001 <0.0001
Molecular Weight Cutoff Range (Daltons)
>100,000 2,000 - 100,000 300 - 1,000 100 - 200
Operating Pressure Range
<30 20 - 100 50 - 300 225 - 1,000
Suspended Solids Removal
Yes Yes Yes Yes
Dissolved Organics Removal
None Yes Yes Yes
Dissolved Inorganics Removal
None None 20-85% 95-99%
Microorganism Removal Protozoan cysts, algae, bacteria*
Protozoan cysts, algae, bacteria*
All* All*
Osmotic Pressure Effects None Slight Moderate High
Concentration Capabilities High High Moderate Moderate
Permeate Purity High High Moderate-high High
Energy Usage Low Low Low-moderate Moderate
Membrane Stability High High Moderate Moderate

Membrane Devices

Plate & Frame

Capillary (Hollow) Fiber

Hollow Fiber UF

Tubular

Tubular Membrane Elements
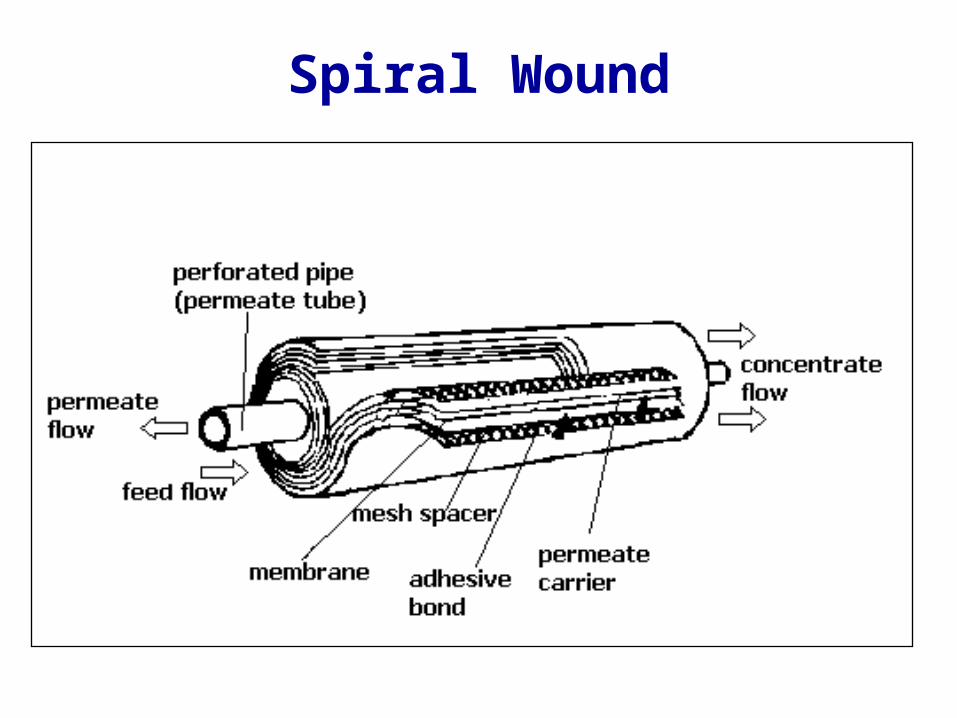
Spiral Wound

Membrane Element Configuration Comparison
Element Configura-
tion
Packing Density *
Fouling Resistance
**
Capillary Fiber
Medium High
Plate and Frame
Low High
Spiral Wound Medium Moderate
Tubular Low high
* Membrane area per unit volume of element ** Tolerance to suspended solids
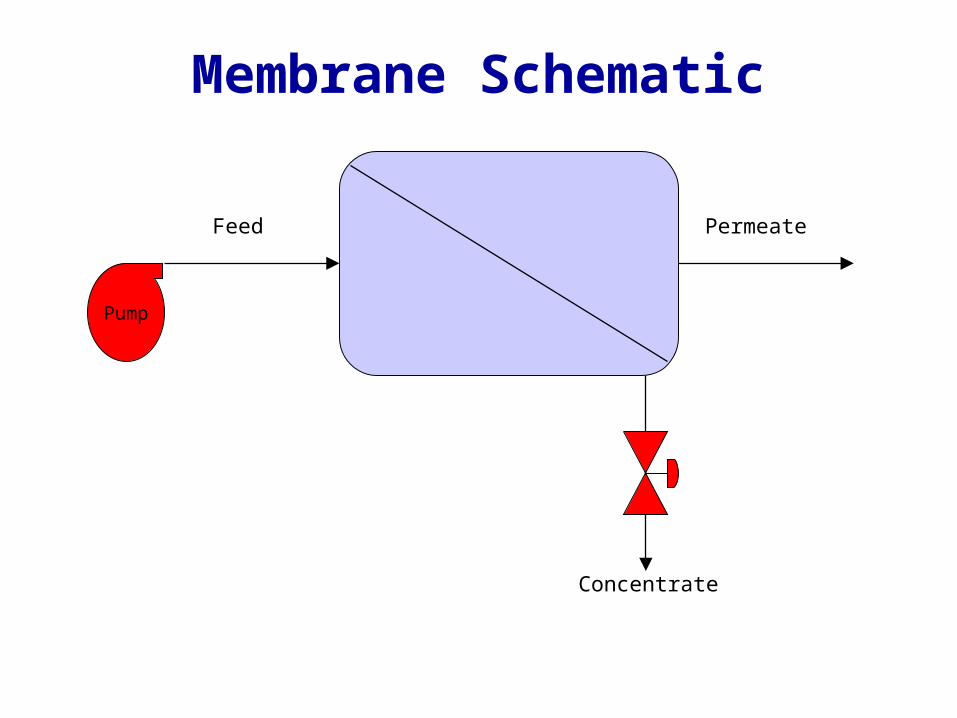
Pump
Permeate
Concentrate
Feed
Membrane Schematic

Concentration Effects
x

Concentration Factor vs. Percent Recovery

POU RO Performance Equations
Production Rate: The rate at which product water is made directly from the RO membrane. It is customarily expressed at Standard Operating Conditions (50-60 psi for POU at 77oF) by applying the appropriate conversion factors.
Conversion Factor: ml/min x 0.38 = gal/day

Reverse Osmosis Recovery
Recovery: the percentage of feed water that passes through the membrane as product water. (i.e. how efficiently water is being used to make product water)

Reverse Osmosis Recovery
Example: A membrane is making 10 gallons per day as product, while 40 gallons go to drain. What is the recovery?
Feed Water = product + reject = 10 + 40 = 50
Recovery = product/feed = 10/50 = 20%
Note: at 50% recovery, reject water TDS is double that of the feed water

Generic POU RO System Flow Diagram

Generic Undersink RO Installation

RO System Controls
Product Water Check Valve: Protects membrane from back pressure.
Automatic Shut-off Valve: Maintains storage tank pressure between ½ to 2/3 feed line pressure.
Brine Flow Restrictor: Maintain reject rinse flow at 3x to 5x product flow; Membrane life and water quality; Prevent water wasting.

Typical Pure Water System

Aerobic MBR Applications