membrane distillation: a comprehensive review - usc viterbi · pdf filethe schematic of the...
TRANSCRIPT
Membrane distillation: A comprehensive review
Abdullah Alkhudhiri a, Naif Darwish b, Nidal Hilal a,c,⁎a Centre Water Advanced Technologies and Environmental Research (CWATER), College of Engineering, Swansea University, Swansea SA2 8PP, UKb American University of Sharjah, College of Engineering, Department of Chemical Engineering, Sharjah, P.O. Box 26666, United Arab Emiratesc Masdar Institute of Science and Technology, Abu Dhabi, United Arab Emirates
a b s t r a c ta r t i c l e i n f o
Article history:
Received 16 June 2011
Received in revised form 10 August 2011
Accepted 11 August 2011
Available online 16 September 2011
Keywords:
Desalination
Membrane distillation
AGMD
Membrane
Membrane Distillation (MD) is a thermally-driven separation process, in which only vapour molecules trans-
fer through a microporous hydrophobic membrane. The driving force in the MD process is the vapour pres-
sure difference induced by the temperature difference across the hydrophobic membrane. This process has
various applications, such as desalination, wastewater treatment and in the food industry.
This review addresses membrane characteristics, membrane-related heat and mass transfer concepts, fouling
and the effects of operating condition. State of the art research results in these different areas will be pre-
sented and discussed.
© 2011 Elsevier B.V. All rights reserved.
Contents
1. Introduction . . . . . . . . . . . . . . . . . . . . . . . . . . . . . . . . . . . . . . . . . . . . . . . . . . . . . . . . . . . . . . . 3
2. Membrane configuration . . . . . . . . . . . . . . . . . . . . . . . . . . . . . . . . . . . . . . . . . . . . . . . . . . . . . . . . . 3
2.1. Direct Contact Membrane Distillation (DCMD) . . . . . . . . . . . . . . . . . . . . . . . . . . . . . . . . . . . . . . . . . . . . 3
2.2. Air Gap Membrane Distillation (AGMD) . . . . . . . . . . . . . . . . . . . . . . . . . . . . . . . . . . . . . . . . . . . . . . . 3
2.3. Sweeping Gas Membrane Distillation (SGMD) . . . . . . . . . . . . . . . . . . . . . . . . . . . . . . . . . . . . . . . . . . . . 3
2.4. Vacuum Membrane Distillation (VMD) . . . . . . . . . . . . . . . . . . . . . . . . . . . . . . . . . . . . . . . . . . . . . . . 4
3. Membrane characteristics . . . . . . . . . . . . . . . . . . . . . . . . . . . . . . . . . . . . . . . . . . . . . . . . . . . . . . . . . 4
3.1. Liquid entry pressure (wetting pressure) . . . . . . . . . . . . . . . . . . . . . . . . . . . . . . . . . . . . . . . . . . . . . . 4
3.2. Membrane thickness . . . . . . . . . . . . . . . . . . . . . . . . . . . . . . . . . . . . . . . . . . . . . . . . . . . . . . . . 4
3.3. Membrane porosity and tortuosity . . . . . . . . . . . . . . . . . . . . . . . . . . . . . . . . . . . . . . . . . . . . . . . . . 5
3.4. Mean pore size and pore size distribution . . . . . . . . . . . . . . . . . . . . . . . . . . . . . . . . . . . . . . . . . . . . . . 5
3.4.1. Scanning Electron Microscopy (SEM) . . . . . . . . . . . . . . . . . . . . . . . . . . . . . . . . . . . . . . . . . . . . 5
3.4.2. Atomic Force Microscopy (AFM) . . . . . . . . . . . . . . . . . . . . . . . . . . . . . . . . . . . . . . . . . . . . . . 5
3.4.3. Bubble point with gas permeation (wet and dry flow method) . . . . . . . . . . . . . . . . . . . . . . . . . . . . . . . . 6
3.4.4. Permeability method . . . . . . . . . . . . . . . . . . . . . . . . . . . . . . . . . . . . . . . . . . . . . . . . . . . 6
3.5. Thermal conductivity. . . . . . . . . . . . . . . . . . . . . . . . . . . . . . . . . . . . . . . . . . . . . . . . . . . . . . . . 6
4. Membrane distillation application . . . . . . . . . . . . . . . . . . . . . . . . . . . . . . . . . . . . . . . . . . . . . . . . . . . . . 6
5. Membrane modules. . . . . . . . . . . . . . . . . . . . . . . . . . . . . . . . . . . . . . . . . . . . . . . . . . . . . . . . . . . . 7
5.1. Plate and frame . . . . . . . . . . . . . . . . . . . . . . . . . . . . . . . . . . . . . . . . . . . . . . . . . . . . . . . . . . 7
5.2. Hollow fibre . . . . . . . . . . . . . . . . . . . . . . . . . . . . . . . . . . . . . . . . . . . . . . . . . . . . . . . . . . . . 7
5.3. Tubular membrane . . . . . . . . . . . . . . . . . . . . . . . . . . . . . . . . . . . . . . . . . . . . . . . . . . . . . . . . . 7
5.4. Spiral wound membrane . . . . . . . . . . . . . . . . . . . . . . . . . . . . . . . . . . . . . . . . . . . . . . . . . . . . . . 7
6. Mechanism. . . . . . . . . . . . . . . . . . . . . . . . . . . . . . . . . . . . . . . . . . . . . . . . . . . . . . . . . . . . . . . . 7
6.1. Mass transfer . . . . . . . . . . . . . . . . . . . . . . . . . . . . . . . . . . . . . . . . . . . . . . . . . . . . . . . . . . . 7
6.1.1. Direct Contact Membrane Distillation (DCMD). . . . . . . . . . . . . . . . . . . . . . . . . . . . . . . . . . . . . . . . 7
6.1.2. Air Gap Membrane Distillation (AGMD) . . . . . . . . . . . . . . . . . . . . . . . . . . . . . . . . . . . . . . . . . . . 9
6.1.3. Vacuum Membrane Distillation (VMD) . . . . . . . . . . . . . . . . . . . . . . . . . . . . . . . . . . . . . . . . . . . 10
6.1.4. Sweeping Gas Membrane Distillation (SGMD) . . . . . . . . . . . . . . . . . . . . . . . . . . . . . . . . . . . . . . . . 10
6.2. Heat transfer . . . . . . . . . . . . . . . . . . . . . . . . . . . . . . . . . . . . . . . . . . . . . . . . . . . . . . . . . . . 11
Desalination 287 (2012) 2–18
⁎ Corresponding author. Tel.: +44 1792 606644.
E-mail address: [email protected] (N. Hilal).
0011-9164/$ – see front matter © 2011 Elsevier B.V. All rights reserved.
doi:10.1016/j.desal.2011.08.027
Contents lists available at SciVerse ScienceDirect
Desalination
j ourna l homepage: www.e lsev ie r .com/ locate /desa l
7. Thermal efficiency and energy consumption . . . . . . . . . . . . . . . . . . . . . . . . . . . . . . . . . . . . . . . . . . . . . . . . 12
8. Temperature polarization and concentration polarization . . . . . . . . . . . . . . . . . . . . . . . . . . . . . . . . . . . . . . . . . . 13
9. Fouling . . . . . . . . . . . . . . . . . . . . . . . . . . . . . . . . . . . . . . . . . . . . . . . . . . . . . . . . . . . . . . . . . 14
10. Operating parameters . . . . . . . . . . . . . . . . . . . . . . . . . . . . . . . . . . . . . . . . . . . . . . . . . . . . . . . . . . 14
10.1. Feed temperature . . . . . . . . . . . . . . . . . . . . . . . . . . . . . . . . . . . . . . . . . . . . . . . . . . . . . . . . . 14
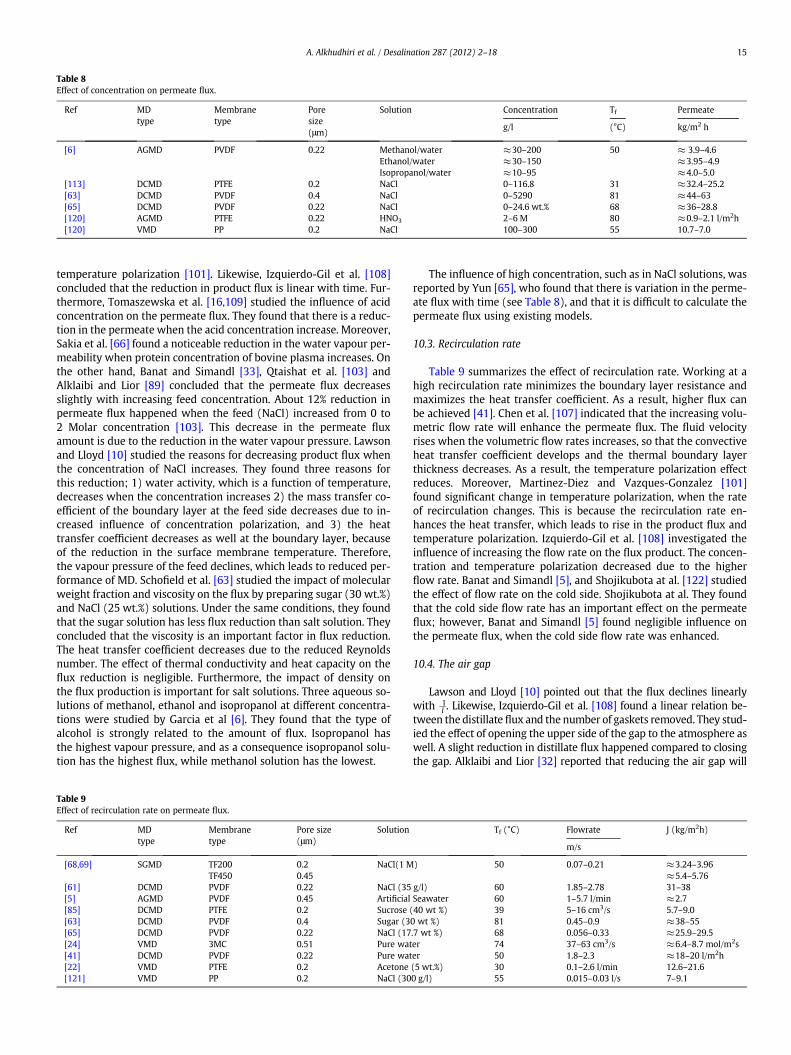
10.2. The concentration and solution feature . . . . . . . . . . . . . . . . . . . . . . . . . . . . . . . . . . . . . . . . . . . . . . . 14
10.3. Recirculation rate . . . . . . . . . . . . . . . . . . . . . . . . . . . . . . . . . . . . . . . . . . . . . . . . . . . . . . . . . 15
10.4. The air gap . . . . . . . . . . . . . . . . . . . . . . . . . . . . . . . . . . . . . . . . . . . . . . . . . . . . . . . . . . . . 15
10.5. Membrane type . . . . . . . . . . . . . . . . . . . . . . . . . . . . . . . . . . . . . . . . . . . . . . . . . . . . . . . . . . 16
10.6. Long operation . . . . . . . . . . . . . . . . . . . . . . . . . . . . . . . . . . . . . . . . . . . . . . . . . . . . . . . . . . 16
11. Conclusions . . . . . . . . . . . . . . . . . . . . . . . . . . . . . . . . . . . . . . . . . . . . . . . . . . . . . . . . . . . . . . . 16
Acknowledgement . . . . . . . . . . . . . . . . . . . . . . . . . . . . . . . . . . . . . . . . . . . . . . . . . . . . . . . . . . . . . . . 16
References . . . . . . . . . . . . . . . . . . . . . . . . . . . . . . . . . . . . . . . . . . . . . . . . . . . . . . . . . . . . . . . . . . . 16
1. Introduction
Supply and demand for freshwater have increased gradually in the
last two decades. In this context, Membrane Distillation (MD) is a
promising technology for desalting highly saline waters. MD is a
thermally-driven separation (microfiltration) process, in which only
vapour molecules are able to pass through a porous hydrophobic
membrane. This separation process is driven by the vapour pressure
difference existing between the porous hydrophobic membrane sur-
faces. Using MD has many attractive features, such as low operating
temperatures in comparison to those encountered in conventional
process; the solution (mainly water) is not necessarily heated up to
the boiling point. Moreover, the hydrostatic pressure encountered in
MD is lower than that used in pressure-driven membrane processes
like reverse osmosis (RO). Therefore, MD is expected to be a cost-
effective process, which requires less demanding of membrane char-
acteristics too. In this respect, less expensive material can be involved
in it such as plastic, for example, thus alleviating corrosion problems.
According to the principle of vapour–liquid equilibrium, the MD pro-
cess has a high rejection factor. As a matter of fact, theoretically, com-
plete separation takes place. In addition, the membrane pore size
required for MD is relatively larger than those for other membrane
separation processes, such as RO. The MD process, therefore, suffers
less from fouling. The MD system has the feasibility to be combined
with other separation processes to create an integrated separation
system, such as ultrafiltration (UF) [1] or with a RO unit [2]. Further-
more, MD has the ability to utilise alternative energy sources, such
as solar energy [3,4]. The MD process is competitive for desalination
of brackish water and sea water [5]. It is also an effective process for
removing organic and heavy metals from aqueous solution [6], from
waste water [7]. MD has also been used to treat radioactive waste,
where the product could be safely discharged to the environment
[8]. However,MD is also attended by some drawbacks such as low per-
meate flux (compared to other separation processes, like RO), high
susceptibility permeate flux to the concentration and temperature of
the feed conditions due to the concentration and temperature polari-
zation phenomenon. Also, the trapped air within themembrane intro-
duces a further mass transfer resistance, which also limits the MD
permeate flux. Moreover, the heat lost by conduction is quite large.
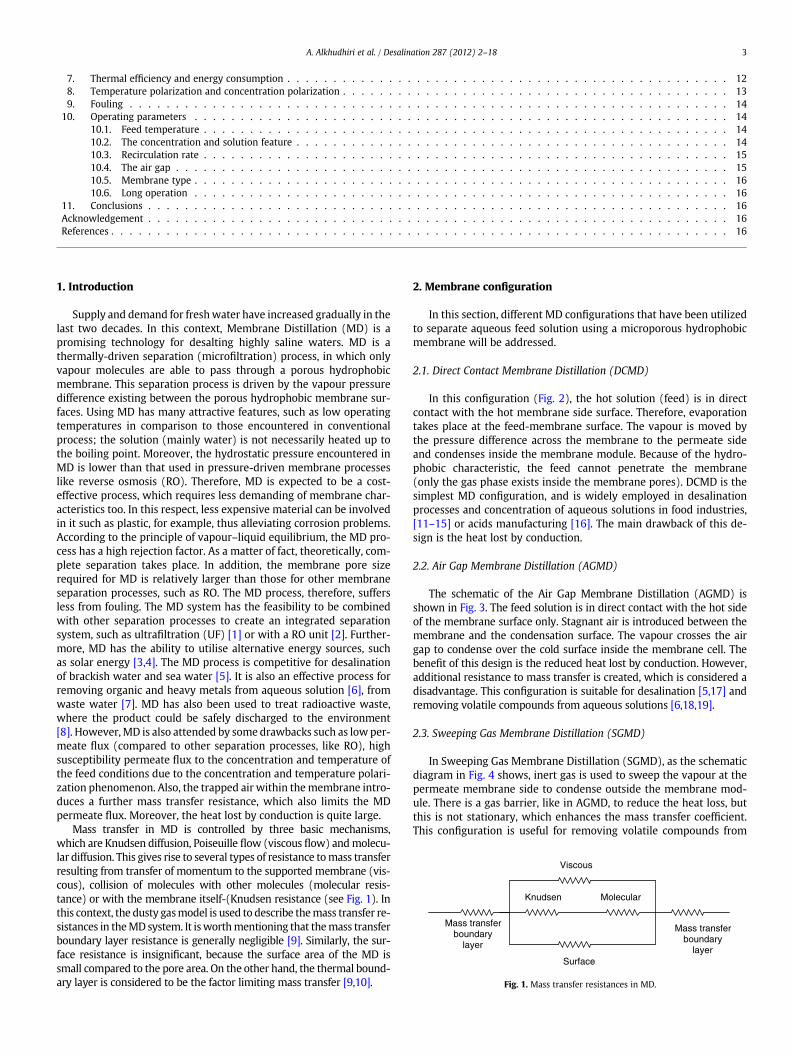
Mass transfer in MD is controlled by three basic mechanisms,
which are Knudsen diffusion, Poiseuille flow (viscous flow) andmolecu-
lar diffusion. This gives rise to several types of resistance tomass transfer
resulting from transfer of momentum to the supported membrane (vis-
cous), collision of molecules with other molecules (molecular resis-
tance) or with the membrane itself-(Knudsen resistance (see Fig. 1). In
this context, the dusty gasmodel is used to describe themass transfer re-
sistances in theMD system. It isworthmentioning that themass transfer
boundary layer resistance is generally negligible [9]. Similarly, the sur-
face resistance is insignificant, because the surface area of the MD is
small compared to the pore area. On the other hand, the thermal bound-
ary layer is considered to be the factor limiting mass transfer [9,10].
2. Membrane configuration
In this section, different MD configurations that have been utilized
to separate aqueous feed solution using a microporous hydrophobic
membrane will be addressed.
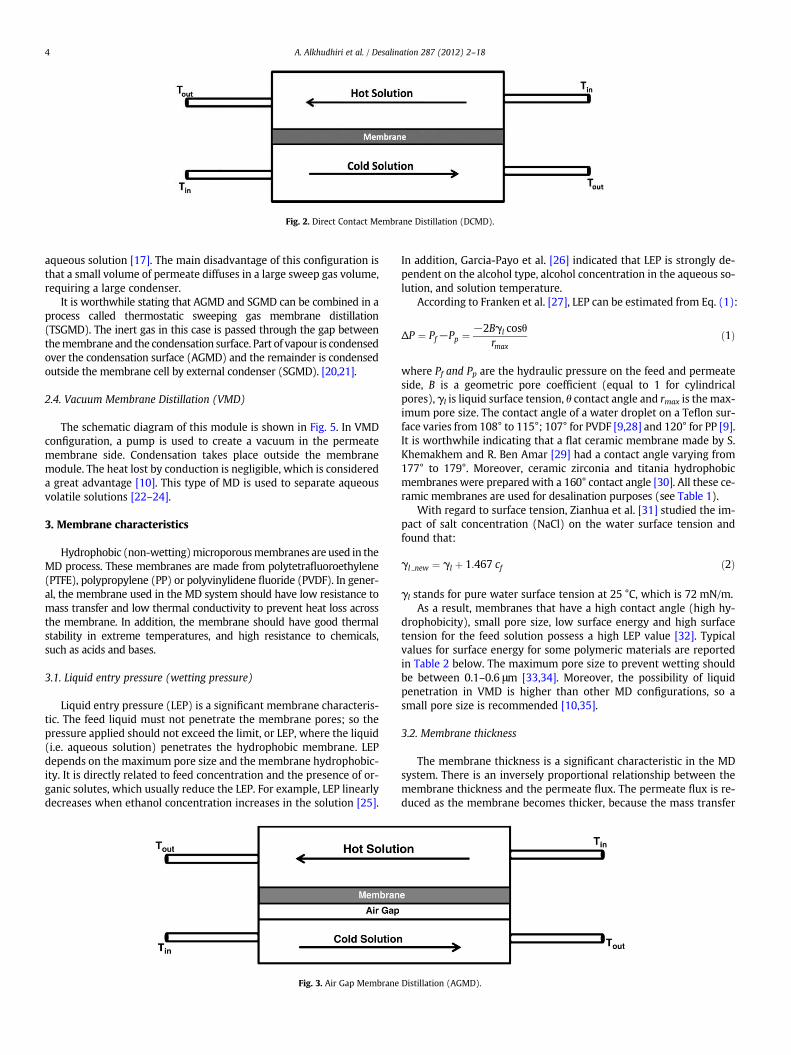
2.1. Direct Contact Membrane Distillation (DCMD)
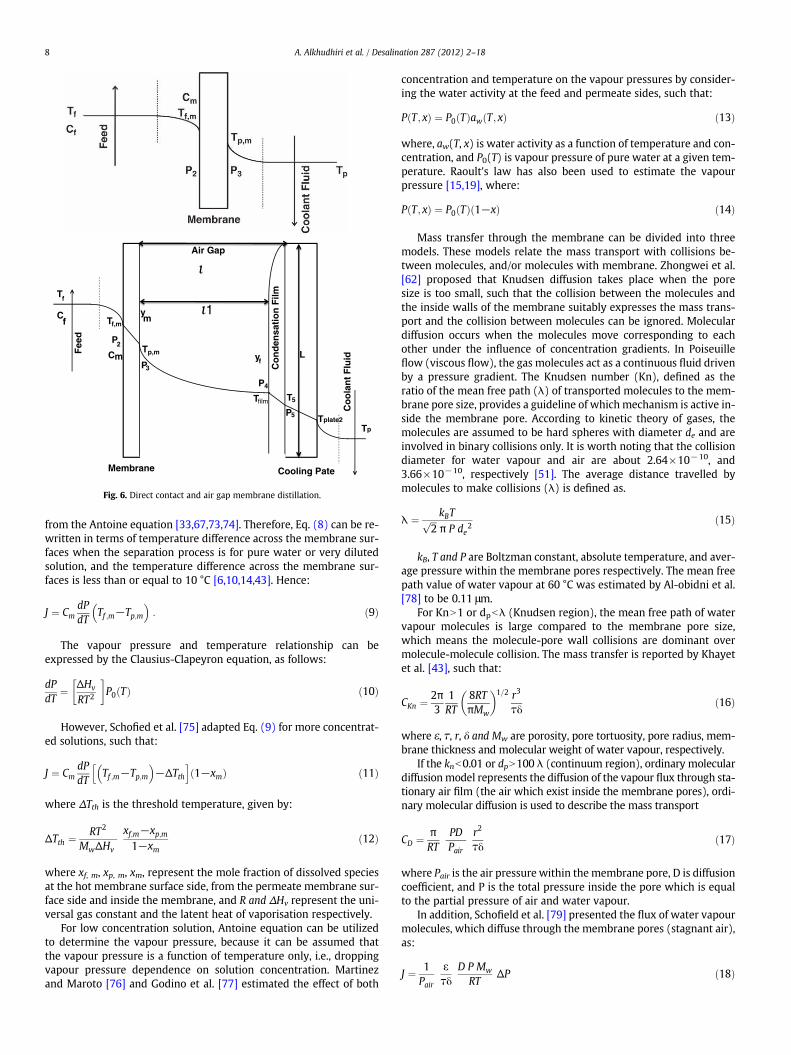
In this configuration (Fig. 2), the hot solution (feed) is in direct
contact with the hot membrane side surface. Therefore, evaporation
takes place at the feed-membrane surface. The vapour is moved by
the pressure difference across the membrane to the permeate side
and condenses inside the membrane module. Because of the hydro-
phobic characteristic, the feed cannot penetrate the membrane
(only the gas phase exists inside the membrane pores). DCMD is the
simplest MD configuration, and is widely employed in desalination
processes and concentration of aqueous solutions in food industries,
[11–15] or acids manufacturing [16]. The main drawback of this de-
sign is the heat lost by conduction.
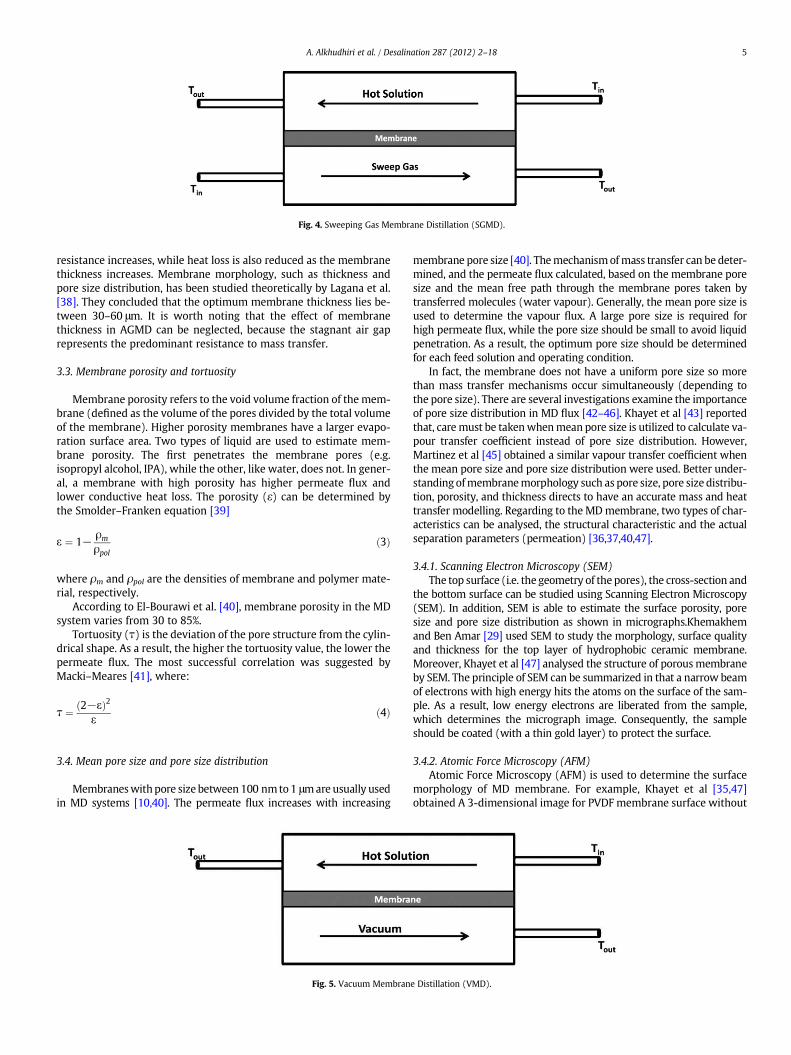
2.2. Air Gap Membrane Distillation (AGMD)
The schematic of the Air Gap Membrane Distillation (AGMD) is
shown in Fig. 3. The feed solution is in direct contact with the hot side
of the membrane surface only. Stagnant air is introduced between the
membrane and the condensation surface. The vapour crosses the air
gap to condense over the cold surface inside the membrane cell. The
benefit of this design is the reduced heat lost by conduction. However,
additional resistance to mass transfer is created, which is considered a
disadvantage. This configuration is suitable for desalination [5,17] and
removing volatile compounds from aqueous solutions [6,18,19].
2.3. Sweeping Gas Membrane Distillation (SGMD)
In Sweeping Gas Membrane Distillation (SGMD), as the schematic
diagram in Fig. 4 shows, inert gas is used to sweep the vapour at the
permeate membrane side to condense outside the membrane mod-
ule. There is a gas barrier, like in AGMD, to reduce the heat loss, but
this is not stationary, which enhances the mass transfer coefficient.
This configuration is useful for removing volatile compounds from
Viscous
Mass transferboundary
layer
Mass transferboundary
layer
Knudsen Molecular
Surface
Fig. 1. Mass transfer resistances in MD.
3A. Alkhudhiri et al. / Desalination 287 (2012) 2–18
aqueous solution [17]. The main disadvantage of this configuration is
that a small volume of permeate diffuses in a large sweep gas volume,
requiring a large condenser.
It is worthwhile stating that AGMD and SGMD can be combined in a
process called thermostatic sweeping gas membrane distillation
(TSGMD). The inert gas in this case is passed through the gap between
themembrane and the condensation surface. Part of vapour is condensed
over the condensation surface (AGMD) and the remainder is condensed
outside the membrane cell by external condenser (SGMD). [20,21].
2.4. Vacuum Membrane Distillation (VMD)
The schematic diagram of this module is shown in Fig. 5. In VMD
configuration, a pump is used to create a vacuum in the permeate
membrane side. Condensation takes place outside the membrane
module. The heat lost by conduction is negligible, which is considered
a great advantage [10]. This type of MD is used to separate aqueous
volatile solutions [22–24].
3. Membrane characteristics
Hydrophobic (non-wetting)microporousmembranes are used in the
MD process. These membranes are made from polytetrafluoroethylene
(PTFE), polypropylene (PP) or polyvinylidene fluoride (PVDF). In gener-
al, the membrane used in the MD system should have low resistance to
mass transfer and low thermal conductivity to prevent heat loss across
the membrane. In addition, the membrane should have good thermal
stability in extreme temperatures, and high resistance to chemicals,
such as acids and bases.
3.1. Liquid entry pressure (wetting pressure)
Liquid entry pressure (LEP) is a significant membrane characteris-
tic. The feed liquid must not penetrate the membrane pores; so the
pressure applied should not exceed the limit, or LEP, where the liquid
(i.e. aqueous solution) penetrates the hydrophobic membrane. LEP
depends on the maximum pore size and the membrane hydrophobic-
ity. It is directly related to feed concentration and the presence of or-
ganic solutes, which usually reduce the LEP. For example, LEP linearly
decreases when ethanol concentration increases in the solution [25].
In addition, Garcia-Payo et al. [26] indicated that LEP is strongly de-
pendent on the alcohol type, alcohol concentration in the aqueous so-
lution, and solution temperature.
According to Franken et al. [27], LEP can be estimated from Eq. (1):
ΔP ¼ Pf−Pp ¼ −2Bγl cosθ
rmax
ð1Þ
where Pf and Pp are the hydraulic pressure on the feed and permeate
side, B is a geometric pore coefficient (equal to 1 for cylindrical
pores), γl is liquid surface tension, θ contact angle and rmax is the max-
imum pore size. The contact angle of a water droplet on a Teflon sur-
face varies from 108° to 115°; 107° for PVDF [9,28] and 120° for PP [9].
It is worthwhile indicating that a flat ceramic membrane made by S.
Khemakhem and R. Ben Amar [29] had a contact angle varying from
177° to 179°. Moreover, ceramic zirconia and titania hydrophobic
membranes were prepared with a 160° contact angle [30]. All these ce-
ramic membranes are used for desalination purposes (see Table 1).
With regard to surface tension, Zianhua et al. [31] studied the im-
pact of salt concentration (NaCl) on the water surface tension and
found that:
γl new ¼ γl þ 1:467 cf ð2Þ
γl stands for pure water surface tension at 25 °C, which is 72 mN/m.
As a result, membranes that have a high contact angle (high hy-
drophobicity), small pore size, low surface energy and high surface
tension for the feed solution possess a high LEP value [32]. Typical
values for surface energy for some polymeric materials are reported
in Table 2 below. The maximum pore size to prevent wetting should
be between 0.1–0.6 μm [33,34]. Moreover, the possibility of liquid
penetration in VMD is higher than other MD configurations, so a
small pore size is recommended [10,35].
3.2. Membrane thickness
The membrane thickness is a significant characteristic in the MD
system. There is an inversely proportional relationship between the
membrane thickness and the permeate flux. The permeate flux is re-
duced as the membrane becomes thicker, because the mass transfer
Fig. 2. Direct Contact Membrane Distillation (DCMD).
Fig. 3. Air Gap Membrane Distillation (AGMD).
4 A. Alkhudhiri et al. / Desalination 287 (2012) 2–18
resistance increases, while heat loss is also reduced as the membrane
thickness increases. Membrane morphology, such as thickness and
pore size distribution, has been studied theoretically by Lagana et al.
[38]. They concluded that the optimum membrane thickness lies be-
tween 30–60 μm. It is worth noting that the effect of membrane
thickness in AGMD can be neglected, because the stagnant air gap
represents the predominant resistance to mass transfer.
3.3. Membrane porosity and tortuosity
Membrane porosity refers to the void volume fraction of the mem-
brane (defined as the volume of the pores divided by the total volume
of the membrane). Higher porosity membranes have a larger evapo-
ration surface area. Two types of liquid are used to estimate mem-
brane porosity. The first penetrates the membrane pores (e.g.
isopropyl alcohol, IPA), while the other, like water, does not. In gener-
al, a membrane with high porosity has higher permeate flux and
lower conductive heat loss. The porosity (ε) can be determined by
the Smolder–Franken equation [39]
ε ¼ 1−ρmρpol
ð3Þ
where ρm and ρpol are the densities of membrane and polymer mate-
rial, respectively.
According to El-Bourawi et al. [40], membrane porosity in the MD
system varies from 30 to 85%.
Tortuosity (τ) is the deviation of the pore structure from the cylin-
drical shape. As a result, the higher the tortuosity value, the lower the
permeate flux. The most successful correlation was suggested by
Macki–Meares [41], where:
τ ¼ 2−εð Þ2ε
ð4Þ
3.4. Mean pore size and pore size distribution
Membraneswithpore size between 100 nmto1 μmare usually used
in MD systems [10,40]. The permeate flux increases with increasing
membrane pore size [40]. Themechanismofmass transfer can be deter-
mined, and the permeate flux calculated, based on the membrane pore
size and the mean free path through the membrane pores taken by
transferred molecules (water vapour). Generally, the mean pore size is
used to determine the vapour flux. A large pore size is required for
high permeate flux, while the pore size should be small to avoid liquid
penetration. As a result, the optimum pore size should be determined
for each feed solution and operating condition.
In fact, the membrane does not have a uniform pore size so more
than mass transfer mechanisms occur simultaneously (depending to
the pore size). There are several investigations examine the importance
of pore size distribution in MD flux [42–46]. Khayet et al [43] reported
that, caremust be takenwhenmean pore size is utilized to calculate va-
pour transfer coefficient instead of pore size distribution. However,
Martinez et al [45] obtained a similar vapour transfer coefficient when
the mean pore size and pore size distribution were used. Better under-
standing ofmembranemorphology such as pore size, pore size distribu-
tion, porosity, and thickness directs to have an accurate mass and heat
transfer modelling. Regarding to the MDmembrane, two types of char-
acteristics can be analysed, the structural characteristic and the actual
separation parameters (permeation) [36,37,40,47].
3.4.1. Scanning Electron Microscopy (SEM)
The top surface (i.e. the geometry of the pores), the cross-section and
the bottom surface can be studied using Scanning Electron Microscopy
(SEM). In addition, SEM is able to estimate the surface porosity, pore
size and pore size distribution as shown in micrographs.Khemakhem
and Ben Amar [29] used SEM to study the morphology, surface quality
and thickness for the top layer of hydrophobic ceramic membrane.
Moreover, Khayet et al [47] analysed the structure of porousmembrane
by SEM. The principle of SEM can be summarized in that a narrow beam
of electrons with high energy hits the atoms on the surface of the sam-
ple. As a result, low energy electrons are liberated from the sample,
which determines the micrograph image. Consequently, the sample
should be coated (with a thin gold layer) to protect the surface.
3.4.2. Atomic Force Microscopy (AFM)
Atomic Force Microscopy (AFM) is used to determine the surface
morphology of MD membrane. For example, Khayet et al [35,47]
obtained A 3-dimensional image for PVDF membrane surface without
Fig. 4. Sweeping Gas Membrane Distillation (SGMD).
Fig. 5. Vacuum Membrane Distillation (VMD).
5A. Alkhudhiri et al. / Desalination 287 (2012) 2–18
sample pre-treatment at ambient temperature and pressure. The pore
size, porosity, pore size distribution and roughness parameter were
determined by using this technique.
3.4.3. Bubble point with gas permeation (wet and dry flow method)
The wet and dry flow method can be applied to measure the maxi-
mum and mean pore sizes, as well as the pore size distribution of the
membrane. This techniquewas used by Khayet andMatsuura [48] to de-
termine the mean pore size and pore size distribution of a PVDF flat
sheet membrane. The method can be summarized in that gas perme-
ation is measured for a dry membrane at different applied pressures; a
straight line relationship is obtained between the gas permeation and
pressure difference. The membrane is then wetted by a liquid with
low surface tension, like isopropyl alcohol (IPA), and again the gas
flow ismeasured as a function of applied pressure. Initially, all themem-
brane pores are filled with IPA, and so at very low applied pressure, the
pores remainfilledwith IPA. By increasing the applied pressure, the larg-
est poreswill be emptied of liquid, and the gasflux starts to increase. The
applied pressure is steadily increased until all pores are empty, and the
gas flux equals that of the gas flux through the dry membrane. A non-
linear graph is obtained in plotting the gas flux as a function of pressure.
3.4.4. Permeability method
Kong and Li [49] improved the gas permeationmethod to determine
themean pore size (dp), effective porosity and pore size distribution. Ni-
trogen can be used as standard gas. The gas permeation is measured at
different operating pressures. The slope and the intercept obtained from
plotting the permeate flux and pressure can be used to calculate the
pore size and effective porosity. The effective porosity can be defined
as the ratio of the porosity (ε) to the effective pore length (Lp) [47].
3.5. Thermal conductivity
The thermal conductivity of the membrane is calculated based on
the thermal conductivity of both polymer ks and gas kg (usually air).
The thermal conductivity of the polymer depends on temperature,
the degree of crystallinity, and the shape of the crystal. The thermal
conductivities of most hydrophobic polymers are close to each
other. For example, the thermal conductivity of PVDF, PTFE and PP
at 23 °C are 0.17–0.19, 0.25–0.27 and 0.11–0.16 Wm−1 K−1 respec-
tively [50]. The thermal conductivity of PTFE can be estimated by [51]
ks ¼ 4:86×10−4
Tþ0:253 ð5Þ
The thermal conductivity of the MD membrane is usually taken a
volume-average of both conductivities ks and kg as follows:
km ¼ 1−εð Þks þ εkg ð6aÞ
However, Phattaranawik et al. [50] suggested that thermal con-
ductivity of an MD membrane is better based on the volume-
average of both resistances (1/kg and 1/ks), i.e.,
km ¼ ε
kgþ 1−εð Þ
ks
" #−1
ð6bÞ
for, the thermal conductivity values for air and water vapour at 25 °C
are of the same order of magnitude. For instance, the thermal conduc-
tivity of air at 25 °C is 0.026 Wm−1K−1 and for water vapour, it is
0.020 Wm−1K−1. As a result, the assumption of one component gas
present inside the pores is justified. Jonsson et al. [52] pointed out
that the thermal conductivity of water vapour and air at around
40 °C can be computed by:
kg ¼ 1:5×10⁻³
ffiffiffi
Tp
ð7Þ
Khayet et al. [53] suggested some ways to reduce the heat loss by
conduction through the membrane; using membrane materials with
low thermal conductivities, using a high porosity membrane, using
thicker membrane, and minimizing heat losses. It is also suggested
that the permeability can be enhanced by using a composite porous
hydrophobic/hydrophilic membrane. In this case, the top layer is very
thin hydrophobic layer to stop liquid penetration, followed by thick hy-
drophilic layer. Both layers reduce the heat losses through the mem-
brane. Imdakm and Matsuura [42] developed a Monte Carlo
simulation model to study the vapour permeate through a composite
membrane and membrane surface temperature simultaneously.
Several studies have made improvements to membrane proper-
ties. Feng et al. [54] prepared two microporous membranes, made
from PVDF and a modified PVDF (polyvinyliden fluoride-co-
tetrafluroethylene). The mechanical performance and hydrophobicity
of themodified PVDFmembranewas better than the normal PVDFmem-
brane. The modified PVDF membrane was used successfully in Direct
Contact Membrane Distillation (DCMD), where the rejection was almost
100%. Furthermore, the hydrophilicmicroporousmembrane can be used
in MDwhen the membrane surface is modified to become hydrophobic.
For example, the surface of a cellulose acetate and cellulose nitrate (hy-
drophilic membrane)wasmodified by radiation grafting polymerization
andplasma polymerization to becomehydrophobic [55]. Hengl et al. [56]
made two flat metallic (stainless steel) hydrophobic membranes, where
silicone was deposited on the top surface. The pore size of those mem-
branes was 2.6 and 5 μm respectively, and during 200 min, the flux
was stable. Lawson et al. [57], also, studied the influence of membrane
compaction on membrane permeability. They found that the flux in-
creased by 11% compared to a non-compacted membrane.
4. Membrane distillation application
Membrane distillation (MD) hasmany applications. Table 3 summa-
rise some of MD application such as fresh water production, heavy
metal removal and food industry. Most of current MD applications are
still in the laboratory or small scale pilot plant phase. Actually, there
are some pilot plants that have been recently developed to produce
fresh water [17,58].
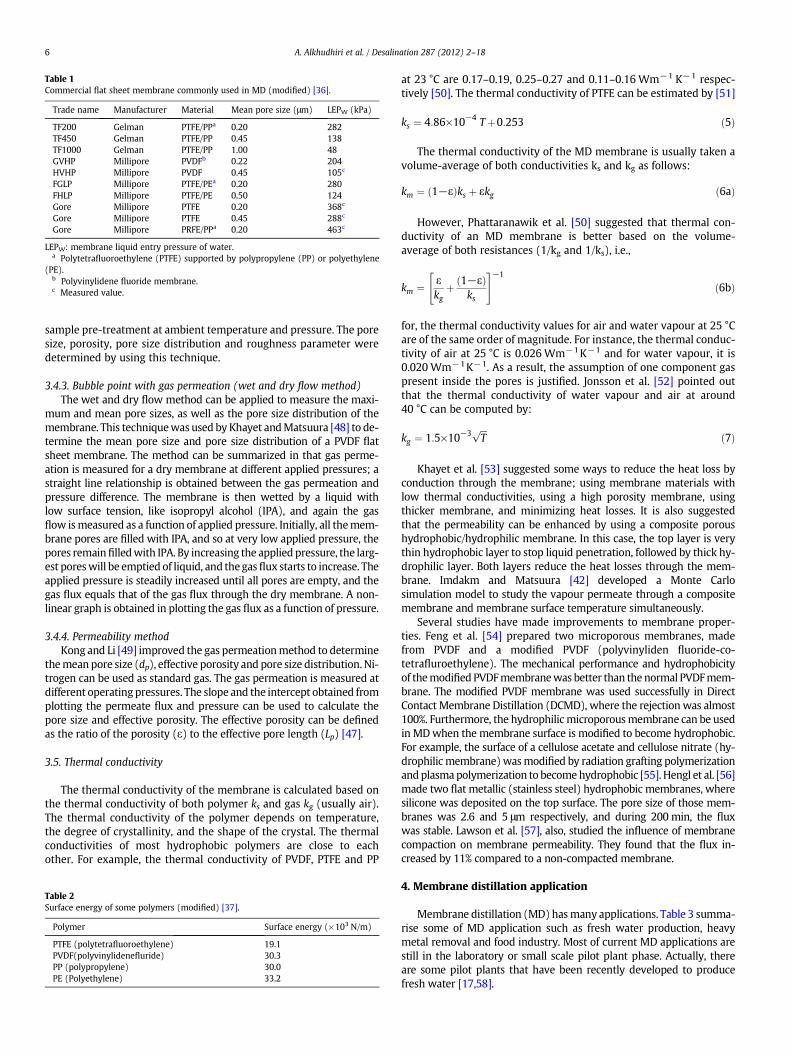
Table 1
Commercial flat sheet membrane commonly used in MD (modified) [36].
Trade name Manufacturer Material Mean pore size (μm) LEPW (kPa)
TF200 Gelman PTFE/PPa 0.20 282
TF450 Gelman PTFE/PP 0.45 138
TF1000 Gelman PTFE/PP 1.00 48
GVHP Millipore PVDFb 0.22 204
HVHP Millipore PVDF 0.45 105c
FGLP Millipore PTFE/PEa 0.20 280
FHLP Millipore PTFE/PE 0.50 124
Gore Millipore PTFE 0.20 368c
Gore Millipore PTFE 0.45 288c
Gore Millipore PRFE/PPa 0.20 463c
LEPW: membrane liquid entry pressure of water.a Polytetrafluoroethylene (PTFE) supported by polypropylene (PP) or polyethylene
(PE).b Polyvinylidene fluoride membrane.c Measured value.
Table 2
Surface energy of some polymers (modified) [37].
Polymer Surface energy (×103 N/m)
PTFE (polytetrafluoroethylene) 19.1
PVDF(polyvinylidenefluride) 30.3
PP (polypropylene) 30.0
PE (Polyethylene) 33.2
6 A. Alkhudhiri et al. / Desalination 287 (2012) 2–18
5. Membrane modules
5.1. Plate and frame
The membrane and the spacers are layered together between two
plates (e.g. flat sheet). The flat sheet membrane configuration is
widely used on laboratory scale, because it is easy to clean and re-
place. However, the packing density, which is the ratio of membrane
area to the packing volume, is low and a membrane support is re-
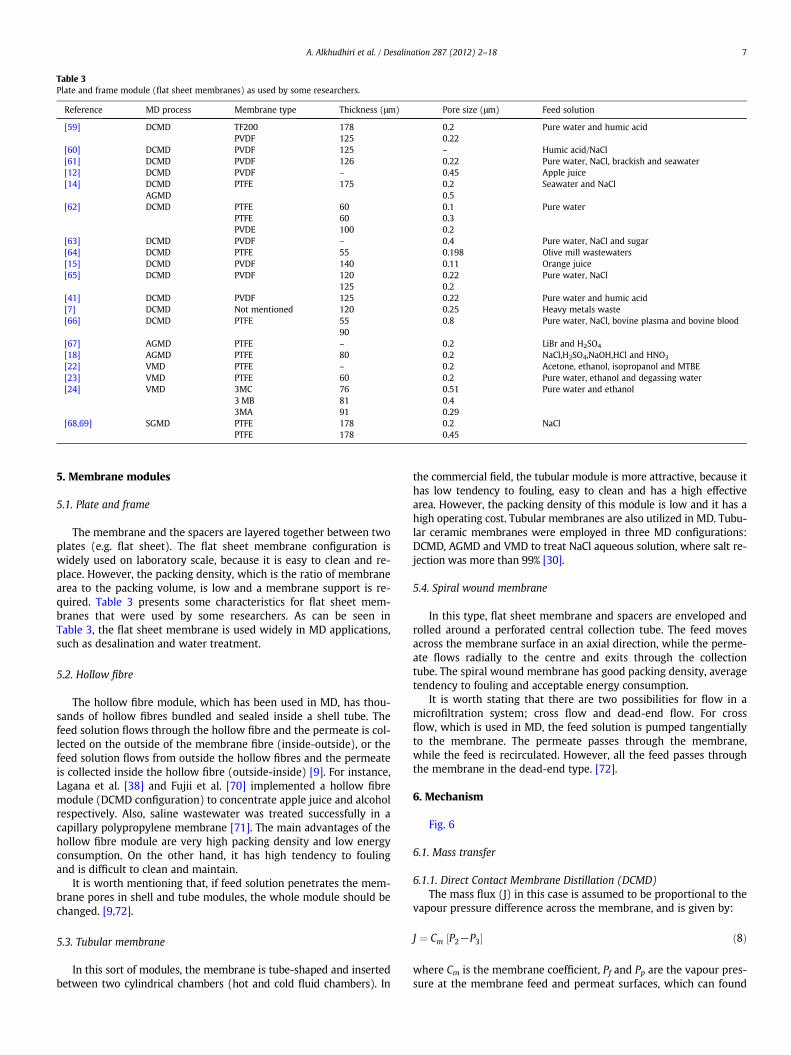
quired. Table 3 presents some characteristics for flat sheet mem-
branes that were used by some researchers. As can be seen in
Table 3, the flat sheet membrane is used widely in MD applications,
such as desalination and water treatment.
5.2. Hollow fibre
The hollow fibre module, which has been used in MD, has thou-
sands of hollow fibres bundled and sealed inside a shell tube. The
feed solution flows through the hollow fibre and the permeate is col-
lected on the outside of the membrane fibre (inside-outside), or the
feed solution flows from outside the hollow fibres and the permeate
is collected inside the hollow fibre (outside-inside) [9]. For instance,
Lagana et al. [38] and Fujii et al. [70] implemented a hollow fibre
module (DCMD configuration) to concentrate apple juice and alcohol
respectively. Also, saline wastewater was treated successfully in a
capillary polypropylene membrane [71]. The main advantages of the
hollow fibre module are very high packing density and low energy
consumption. On the other hand, it has high tendency to fouling
and is difficult to clean and maintain.
It is worth mentioning that, if feed solution penetrates the mem-
brane pores in shell and tube modules, the whole module should be
changed. [9,72].
5.3. Tubular membrane
In this sort of modules, the membrane is tube-shaped and inserted
between two cylindrical chambers (hot and cold fluid chambers). In
the commercial field, the tubular module is more attractive, because it
has low tendency to fouling, easy to clean and has a high effective
area. However, the packing density of this module is low and it has a
high operating cost. Tubular membranes are also utilized in MD. Tubu-
lar ceramic membranes were employed in three MD configurations:
DCMD, AGMD and VMD to treat NaCl aqueous solution, where salt re-
jection was more than 99% [30].
5.4. Spiral wound membrane
In this type, flat sheet membrane and spacers are enveloped and
rolled around a perforated central collection tube. The feed moves
across the membrane surface in an axial direction, while the perme-
ate flows radially to the centre and exits through the collection
tube. The spiral wound membrane has good packing density, average
tendency to fouling and acceptable energy consumption.
It is worth stating that there are two possibilities for flow in a
microfiltration system; cross flow and dead-end flow. For cross
flow, which is used in MD, the feed solution is pumped tangentially
to the membrane. The permeate passes through the membrane,
while the feed is recirculated. However, all the feed passes through
the membrane in the dead-end type. [72].
6. Mechanism
Fig. 6
6.1. Mass transfer
6.1.1. Direct Contact Membrane Distillation (DCMD)
The mass flux (J) in this case is assumed to be proportional to the
vapour pressure difference across the membrane, and is given by:
J ¼ Cm P2−P3½ � ð8Þ
where Cm is the membrane coefficient, Pf and Pp are the vapour pres-
sure at the membrane feed and permeat surfaces, which can found
Table 3
Plate and frame module (flat sheet membranes) as used by some researchers.
Reference MD process Membrane type Thickness (μm) Pore size (μm) Feed solution
[59] DCMD TF200 178 0.2 Pure water and humic acid
PVDF 125 0.22
[60] DCMD PVDF 125 – Humic acid/NaCl
[61] DCMD PVDF 126 0.22 Pure water, NaCl, brackish and seawater
[12] DCMD PVDF – 0.45 Apple juice
[14] DCMD PTFE 175 0.2 Seawater and NaCl
AGMD 0.5
[62] DCMD PTFE 60 0.1 Pure water
PTFE 60 0.3
PVDE 100 0.2
[63] DCMD PVDF – 0.4 Pure water, NaCl and sugar
[64] DCMD PTFE 55 0.198 Olive mill wastewaters
[15] DCMD PVDF 140 0.11 Orange juice
[65] DCMD PVDF 120 0.22 Pure water, NaCl
125 0.2
[41] DCMD PVDF 125 0.22 Pure water and humic acid
[7] DCMD Not mentioned 120 0.25 Heavy metals waste
[66] DCMD PTFE 55 0.8 Pure water, NaCl, bovine plasma and bovine blood
90
[67] AGMD PTFE – 0.2 LiBr and H2SO4
[18] AGMD PTFE 80 0.2 NaCl,H2SO4,NaOH,HCl and HNO3
[22] VMD PTFE – 0.2 Acetone, ethanol, isopropanol and MTBE
[23] VMD PTFE 60 0.2 Pure water, ethanol and degassing water
[24] VMD 3MC 76 0.51 Pure water and ethanol
3 MB 81 0.4
3MA 91 0.29
[68,69] SGMD PTFE 178 0.2 NaCl
PTFE 178 0.45
7A. Alkhudhiri et al. / Desalination 287 (2012) 2–18
from the Antoine equation [33,67,73,74]. Therefore, Eq. (8) can be re-
written in terms of temperature difference across the membrane sur-
faces when the separation process is for pure water or very diluted
solution, and the temperature difference across the membrane sur-
faces is less than or equal to 10 °C [6,10,14,43]. Hence:
J ¼ Cm
dP
dTTf ;m−Tp;m
� �
: ð9Þ
The vapour pressure and temperature relationship can be
expressed by the Clausius-Clapeyron equation, as follows:
dP
dT¼ ΔHv
RT2
� �
P0 Tð Þ ð10Þ
However, Schofied et al. [75] adapted Eq. (9) for more concentrat-
ed solutions, such that:
J ¼ Cm
dP
dTTf ;m−Tp;m
� �
−ΔTth
h i
1−xmð Þ ð11Þ
where ΔTth is the threshold temperature, given by:
ΔTth ¼ RT2
MwΔHv
xf;m−xp;m1−xm
ð12Þ
where xf, m, xp, m, xm, represent the mole fraction of dissolved species
at the hot membrane surface side, from the permeate membrane sur-
face side and inside the membrane, and R and ΔHv represent the uni-
versal gas constant and the latent heat of vaporisation respectively.
For low concentration solution, Antoine equation can be utilized
to determine the vapour pressure, because it can be assumed that
the vapour pressure is a function of temperature only, i.e., dropping
vapour pressure dependence on solution concentration. Martinez
and Maroto [76] and Godino et al. [77] estimated the effect of both
concentration and temperature on the vapour pressures by consider-
ing the water activity at the feed and permeate sides, such that:
P T; xð Þ ¼ P0 Tð Þaw T ; xð Þ ð13Þ
where, aw(T, x) is water activity as a function of temperature and con-
centration, and P0(T) is vapour pressure of pure water at a given tem-
perature. Raoult's law has also been used to estimate the vapour
pressure [15,19], where:
P T; xð Þ ¼ P0 Tð Þ 1−xð Þ ð14Þ
Mass transfer through the membrane can be divided into three
models. These models relate the mass transport with collisions be-
tween molecules, and/or molecules with membrane. Zhongwei et al.
[62] proposed that Knudsen diffusion takes place when the pore
size is too small, such that the collision between the molecules and
the inside walls of the membrane suitably expresses the mass trans-
port and the collision between molecules can be ignored. Molecular
diffusion occurs when the molecules move corresponding to each
other under the influence of concentration gradients. In Poiseuille
flow (viscous flow), the gas molecules act as a continuous fluid driven
by a pressure gradient. The Knudsen number (Kn), defined as the
ratio of the mean free path (λ) of transported molecules to the mem-
brane pore size, provides a guideline of whichmechanism is active in-
side the membrane pore. According to kinetic theory of gases, the
molecules are assumed to be hard spheres with diameter de and are
involved in binary collisions only. It is worth noting that the collision
diameter for water vapour and air are about 2.64×10⁻¹⁰, and
3.66×10⁻¹⁰, respectively [51]. The average distance travelled by
molecules to make collisions (λ) is defined as.
λ ¼ kBTffiffiffi
2p
π P de2
ð15Þ
kB, T and P are Boltzman constant, absolute temperature, and aver-
age pressure within the membrane pores respectively. The mean free
path value of water vapour at 60 °C was estimated by Al-obidni et al.
[78] to be 0.11 μm.
For KnN1 or dpbλ (Knudsen region), the mean free path of water
vapour molecules is large compared to the membrane pore size,
which means the molecule-pore wall collisions are dominant over
molecule-molecule collision. The mass transfer is reported by Khayet
et al. [43], such that:
CKn ¼ 2π
3
1
RT
8RT
πMw
� �1=2 r3
τδð16Þ
where ε, τ, r, δ and Mw are porosity, pore tortuosity, pore radius, mem-
brane thickness and molecular weight of water vapour, respectively.
If the knb0.01 or dpN100 λ (continuum region), ordinary molecular
diffusionmodel represents the diffusion of the vapour flux through sta-
tionary air film (the air which exist inside the membrane pores), ordi-
nary molecular diffusion is used to describe the mass transport
CD ¼ π
RT
PD
Pair
r2
τδð17Þ
where Pair is the air pressure within the membrane pore, D is diffusion
coefficient, and P is the total pressure inside the pore which is equal
to the partial pressure of air and water vapour.
In addition, Schofield et al. [79] presented the flux of water vapour
molecules, which diffuse through the membrane pores (stagnant air),
as:
J ¼ 1
Pair
ε
τδ
D P Mw
RTΔP ð18Þ
Membrane Cooling Pate
Co
nd
en
sa
tio
n F
ilmT
f
T
Tp,m
Air Gap
T T5
Tplate2
Tp
Co
ola
nt
Flu
id
Feed
P2
P3
P4
P5
fC
mC
ym
fy L
film
f,m
ι
ι1
Fig. 6. Direct contact and air gap membrane distillation.
8 A. Alkhudhiri et al. / Desalination 287 (2012) 2–18
where Pair and P are the average air pressure and average gas pressure
within the membrane respectively.
Removing the stagnant air existing inside the pores by degassing
the feed and permeate will reduce the molecular diffusion resistance,
so the membrane permeability will increase [10].
However, If 0.01bknb1 or λbdpb100 λ (transition region), the
water vapour molecules collide with each other, and also diffuse
through the air film. Consequently, the mass transfer takes place by
both the Knudsen/ordinary diffusion mechanism [43], where:
Cc ¼π
RT
1
τδ
2
3
8RT
πMw
� �12
r3
!−1
þ PD
Par2
� �−1" #−1
ð19Þ
The diffusivity of water vapour through the stagnant air inside the
pores is given by [44]
PD ¼ 1:895×10−5
T2:072 ð20Þ
In addition, the Fuller equation, which is a common equation to
predict binary gas diffusion, can be used [80,81]
D ¼ 1×10⁻⁷
T1:75 1
Mwaþ 1
Mwb
� �12
P ∑va 1
3 þ ∑vb 1
3
h i2ð21Þ
where ∑v represents the diffusion volume, T is temperature in Kel-
vin and P is pressure in atmospheres. The diffusion volume of air
and water are 20.1 and 12.7 respectively.
Lawson and Lloyd [10] stated that the molecule-pore wall colli-
sions (Knudsen diffusion) and molecule-molecule collisions (molecu-
lar diffusion) takes place simultaneously for pore size less than
0.5 μm. Moreover, Guijt et al. [82] point out that the flux can be
expressed by molecular diffusion only for large pores. Furthermore,
Schofield et al. [83] and Fane et al. [84] suggested that, the vapour
flux across the membrane can be expressed by Knudsen diffusion
and Poiseuille (viscous) flow model for de-aerated DCMD. On the
other hand, Zhongwei et al. [62] studied the effect of the Poiseuille
flow mechanism in mass transfer through the membrane. They
found that the Poiseuille flow should be considered as one of the
mechanisms of mass transfer model in large pore size membrane.
Martinez and Maroto [76] described the transport resistance of
feed, membrane and permeate resistances for pure water, NaCl and
sucrose in DCMD. They concluded that it is helpful to analyse the
transport in terms of resistances, to identify the controlling role of
each transport step, and as a result the flux permeate can be im-
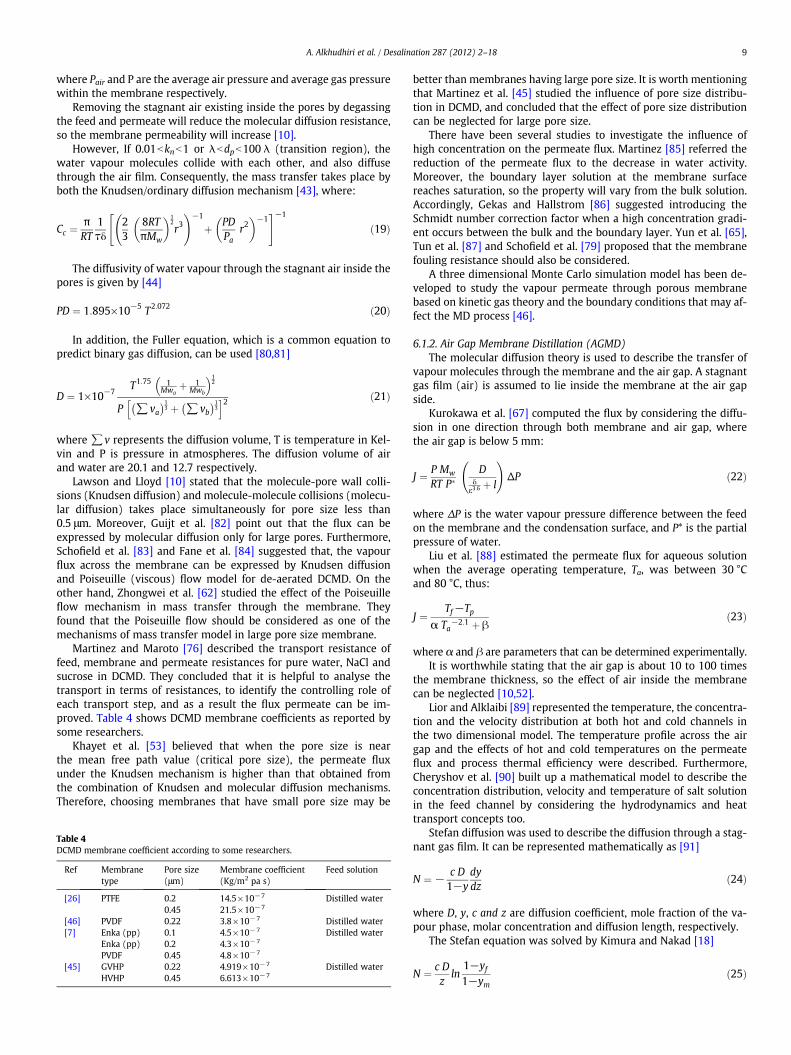
proved. Table 4 shows DCMD membrane coefficients as reported by
some researchers.
Khayet et al. [53] believed that when the pore size is near
the mean free path value (critical pore size), the permeate flux
under the Knudsen mechanism is higher than that obtained from
the combination of Knudsen and molecular diffusion mechanisms.
Therefore, choosing membranes that have small pore size may be
better than membranes having large pore size. It is worth mentioning
that Martinez et al. [45] studied the influence of pore size distribu-
tion in DCMD, and concluded that the effect of pore size distribution
can be neglected for large pore size.
There have been several studies to investigate the influence of
high concentration on the permeate flux. Martinez [85] referred the
reduction of the permeate flux to the decrease in water activity.
Moreover, the boundary layer solution at the membrane surface
reaches saturation, so the property will vary from the bulk solution.
Accordingly, Gekas and Hallstrom [86] suggested introducing the
Schmidt number correction factor when a high concentration gradi-
ent occurs between the bulk and the boundary layer. Yun et al. [65],
Tun et al. [87] and Schofield et al. [79] proposed that the membrane
fouling resistance should also be considered.
A three dimensional Monte Carlo simulation model has been de-
veloped to study the vapour permeate through porous membrane
based on kinetic gas theory and the boundary conditions that may af-
fect the MD process [46].
6.1.2. Air Gap Membrane Distillation (AGMD)
The molecular diffusion theory is used to describe the transfer of
vapour molecules through the membrane and the air gap. A stagnant
gas film (air) is assumed to lie inside the membrane at the air gap
side.
Kurokawa et al. [67] computed the flux by considering the diffu-
sion in one direction through both membrane and air gap, where
the air gap is below 5 mm:
J ¼ P Mw
RT P�D
δε3:6
þ l
!
ΔP ð22Þ
where ΔP is the water vapour pressure difference between the feed
on the membrane and the condensation surface, and P* is the partial
pressure of water.
Liu et al. [88] estimated the permeate flux for aqueous solution
when the average operating temperature, Ta, was between 30 °C
and 80 °C, thus:
J ¼Tf−Tp
α Ta−2:1 þ β
ð23Þ
where α and β are parameters that can be determined experimentally.
It is worthwhile stating that the air gap is about 10 to 100 times
the membrane thickness, so the effect of air inside the membrane
can be neglected [10,52].
Lior and Alklaibi [89] represented the temperature, the concentra-
tion and the velocity distribution at both hot and cold channels in
the two dimensional model. The temperature profile across the air
gap and the effects of hot and cold temperatures on the permeate
flux and process thermal efficiency were described. Furthermore,
Cheryshov et al. [90] built up a mathematical model to describe the
concentration distribution, velocity and temperature of salt solution
in the feed channel by considering the hydrodynamics and heat
transport concepts too.
Stefan diffusion was used to describe the diffusion through a stag-
nant gas film. It can be represented mathematically as [91]
N ¼ −c D
1−y
dy
dzð24Þ
where D, y, c and z are diffusion coefficient, mole fraction of the va-
pour phase, molar concentration and diffusion length, respectively.
The Stefan equation was solved by Kimura and Nakad [18]
N ¼ c D
zln
1−yf1−ym
ð25Þ
Table 4
DCMD membrane coefficient according to some researchers.
Ref Membrane
type
Pore size
(μm)
Membrane coefficient
(Kg/m2 pa s)
Feed solution
[26] PTFE 0.2 14.5×10⁻⁷ Distilled water
0.45 21.5×10⁻⁷
[46] PVDF 0.22 3.8×10⁻⁷ Distilled water
[7] Enka (pp) 0.1 4.5×10⁻⁷ Distilled water
Enka (pp) 0.2 4.3×10⁻⁷
PVDF 0.45 4.8×10⁻⁷
[45] GVHP 0.22 4.919×10⁻⁷ Distilled water
HVHP 0.45 6.613×10⁻⁷
9A. Alkhudhiri et al. / Desalination 287 (2012) 2–18
where ym and yf represent the mole fraction of vapour at the mem-
brane and the condensation film, respectively.
However, Jonson et al. [52] solved the same equation by neglect-
ing the effect of temperature and concentration polarization. They
suggested that, the value of c D for water vapour and air at around
40 °C to be calculated using this equation:
c D ¼ 6:3×10⁻⁵
ffiffiffi
Tp
ð26Þ
In addition, the molar concentration can be calculated from ideal
gas law:
c ¼ P
RTð27Þ
According to the standard condition, the diffusion coefficient can
be corrected to the desired temperature [91] by:
D
D0
¼ T
T0
� �32
ð28Þ
Bouguecha et al. [92] used Stefan diffusion to express the vapour
flux when it is governed by diffusion through the membrane pores
and by natural convection through the air gap:
N ¼ KT
RPf ;m−Pfilm
h i
ð29Þ
where KT is the overall mass transfer coefficient. Stefan diffusion was
also utilized to evaluate the molar flux of seawater [5] as:
N ¼ DP
RT l PlmP2−P4ð Þ ð30Þ
where, P2, P4, Dw and Plm are the vapour pressures at Tf, m, the vapour
pressures at Tfilm, diffusion coefficient and log mean partial pressure
respectively. The log mean partial pressure difference at the air gap
is defined as:
Plm ¼ P4−P2
ln P4P2
ð31Þ
For a multi-component mixture, the Stefan-Maxwell equation was
applied by Gostoli and Sarti [25] to express the ethanol and water va-
pour diffusion in stagnant gas (air). This was given by:
dyidz
¼ ∑n
j¼1
1
cDij
yiNj−yjNi
� �
ð32Þ
The vapour composition at evaporation and condensation inter-
faces can be calculated by assuming liquid-vapour equilibrium, such
that:
yi ¼xiaiP0P
ð33Þ
Vapour pressure P0 can be computed by the Antoine equation at
the temperature of interest. The activity coefficient ai can be calculat-
ed by the Van Laar equation at the temperature and composition of
interest. The condensate composition xi is determined by the compo-
nents flux
xi ¼Ni
∑ Nð34Þ
On the other hand, Banat and Simandl [19] employed Stefan diffu-
sion (Eq. (24)) to represent the molar diffusion flux of an ethanol-
water solution. The molar diffusion flux of ethanol and water through
stagnant gas (air) in terms of pressure is given by:
Ni ¼εDiP
RT l PlmPi 2 −Pi 4ð Þ ð35Þ
For the non-equilibrium thermodynamics case, the ordinary diffu-
sion,which is related to the concentration gradient, and thermal diffusion
which is related to the temperature gradientwere considered to calculate
the total mass flux. A linear relation between flux and vapour pressure
can be assumed, and the thermal diffusion can be neglected [33].
The Stefan–Maxwell model is reported to be more accurate than
the molecular diffusion model (Fick's law) for separation of azeotro-
pic mixtures [93,94].
6.1.3. Vacuum Membrane Distillation (VMD)
In order to remove air trapped in the membrane pores, the de-
aeration of the feed solution or a continuous vacuum in the permeate
side should be applied. Consequently, the ordinary molecular diffu-
sion resistance is neglected. The Knudsen mechanism is used to ex-
press the mass transfer [22,23,95,96], Poisseille flow [48] or both
together [24,33,48]
For example, when the ratio of the pore radius to themean free pathrλ is b0.05, the molecule-pore wall collisions control the gas transport
mechanism (Knudsen flow model) and the molar flow rate is:
Ni ¼2π
3
1
RT
8RT
πMwi
!12 r3
δτΔPi ð36Þ
If r is between 0.05λ and 50λ, both molecular-molecular and
molecular-wall collisions should be considered. The total mass trans-
fer is described by the Knudsen-viscous model and can be repre-
sented by the following equation:
Ni ¼π
RTδτ
2
3
8RT
πMwi
!12
r3 þ r4
8μ i
Pavg
2
4
3
5ΔPi ð37Þ
where μi is the viscosity of species i, and Pavg is the average pressure in
the pore.
When rλ is N50, molecular- molecular collision dominates and the
mass transfer can be expressed by Poisseuille flow (viscous), such that:
Ni ¼π r4
8μ i
PavgRT
1
τδΔPi ð38Þ
6.1.4. Sweeping Gas Membrane Distillation (SGMD)
Khayet [36] points out that the equations, which illustrate the
mass transfer of DCMD can be used in SGMD. A theoretical model
was designed to predict the SGMD flux and temperature profiles in
the system for two PTFE membranes. Knudsen/molecular diffusion
can be used to describe the mass transfer through the membrane
pores. Moreover, the circulation velocity and feed temperature are
significant parameters [68,69].
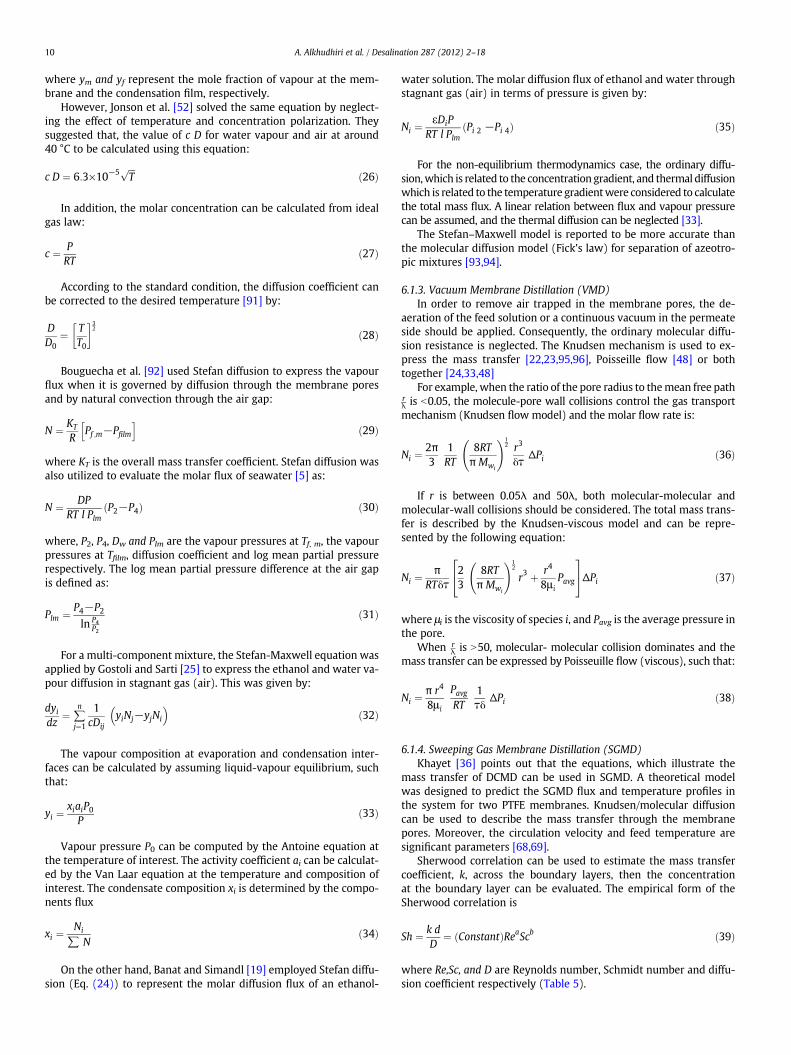
Sherwood correlation can be used to estimate the mass transfer
coefficient, k, across the boundary layers, then the concentration
at the boundary layer can be evaluated. The empirical form of the
Sherwood correlation is
Sh ¼ k d
D¼ Constantð ÞReaScb ð39Þ
where Re,Sc, and D are Reynolds number, Schmidt number and diffu-
sion coefficient respectively (Table 5).
10 A. Alkhudhiri et al. / Desalination 287 (2012) 2–18
Schmidt numbers can be calculated by:
Sc ¼ μ
ρ Dð40Þ
where μ is the viscosity. For a non-circular channel, these correlations
can be utilized if the equivalent (hydraulic) diameter deq is employed.
deq ¼ 4rH ¼ 4S
LPð41Þ
where rH, S and LP are the hydraulic radius, cross sectional area of the
flow channel, and length of wetted perimeter of the flow channel,
respectively.
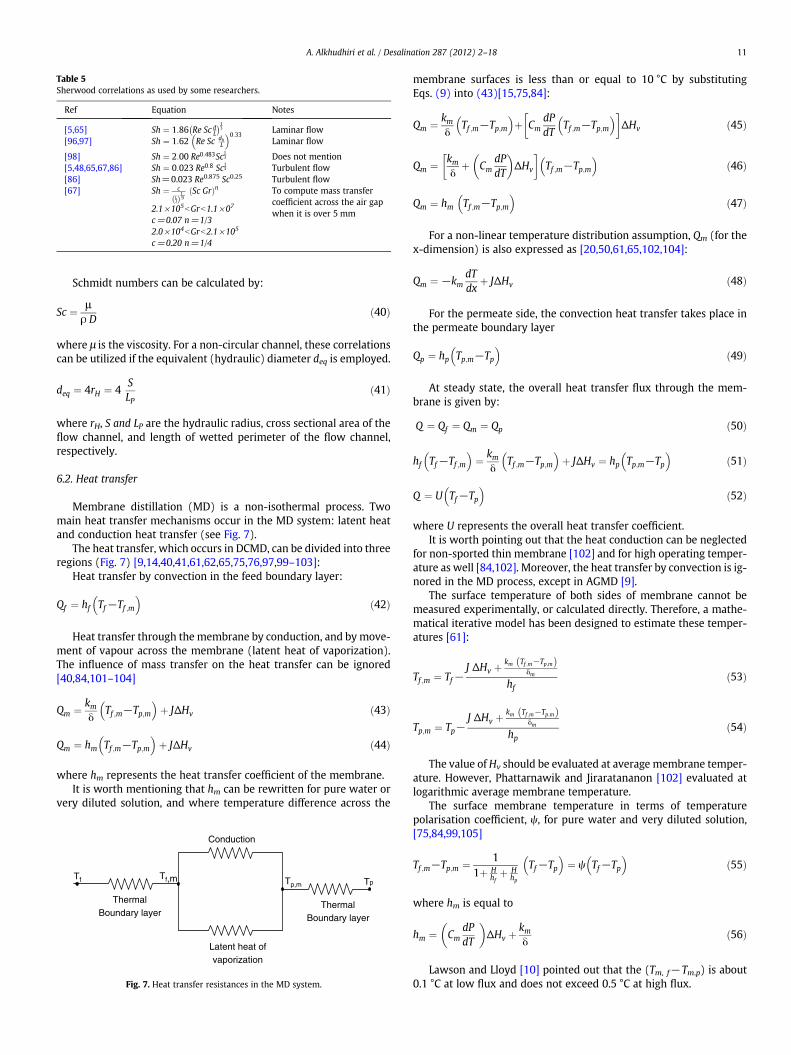
6.2. Heat transfer
Membrane distillation (MD) is a non-isothermal process. Two
main heat transfer mechanisms occur in the MD system: latent heat
and conduction heat transfer (see Fig. 7).
The heat transfer, which occurs in DCMD, can be divided into three
regions (Fig. 7) [9,14,40,41,61,62,65,75,76,97,99–103]:
Heat transfer by convection in the feed boundary layer:
Qf ¼ hf Tf−Tf ;m
� �
ð42Þ
Heat transfer through the membrane by conduction, and by move-
ment of vapour across the membrane (latent heat of vaporization).
The influence of mass transfer on the heat transfer can be ignored
[40,84,101–104]
Qm ¼ kmδ
Tf ;m−Tp;m
� �
þ JΔHv ð43Þ
Qm ¼ hm Tf ;m−Tp;m
� �
þ JΔHv ð44Þ
where hm represents the heat transfer coefficient of the membrane.
It is worth mentioning that hm can be rewritten for pure water or
very diluted solution, and where temperature difference across the
membrane surfaces is less than or equal to 10 °C by substituting
Eqs. (9) into (43)[15,75,84]:
Qm ¼ kmδ
Tf ;m−Tp;m
� �
þ Cm
dP
dTTf ;m−Tp;m
� �
� �
ΔHv ð45Þ
Qm ¼ kmδ
þ Cm
dP
dT
� �
ΔHv
� �
Tf ;m−Tp;m
� �
ð46Þ
Qm ¼ hm Tf ;m−Tp;m
� �
ð47Þ
For a non-linear temperature distribution assumption, Qm (for the
x-dimension) is also expressed as [20,50,61,65,102,104]:
Qm ¼ −kmdT
dxþ JΔHv ð48Þ
For the permeate side, the convection heat transfer takes place in
the permeate boundary layer
Qp ¼ hp Tp;m−Tp
� �
ð49Þ
At steady state, the overall heat transfer flux through the mem-
brane is given by:
Q ¼ Qf ¼ Qm ¼ Qp ð50Þ
hf Tf−Tf ;m
� �
¼ kmδ
Tf ;m−Tp;m
� �
þ JΔHv ¼ hp Tp;m−Tp
� �
ð51Þ
Q ¼ U Tf−Tp
� �
ð52Þ
where U represents the overall heat transfer coefficient.
It is worth pointing out that the heat conduction can be neglected
for non-sported thin membrane [102] and for high operating temper-
ature as well [84,102]. Moreover, the heat transfer by convection is ig-
nored in the MD process, except in AGMD [9].
The surface temperature of both sides of membrane cannot be
measured experimentally, or calculated directly. Therefore, a mathe-
matical iterative model has been designed to estimate these temper-
atures [61]:
Tf ;m ¼ Tf−J ΔHv þ
km Tf ;m−Tp;mð Þδm
hfð53Þ
Tp;m ¼ Tp−J ΔHv þ
km Tf ;m−Tp;mð Þδm
hpð54Þ
The value of Hv should be evaluated at average membrane temper-
ature. However, Phattarnawik and Jiraratananon [102] evaluated at
logarithmic average membrane temperature.
The surface membrane temperature in terms of temperature
polarisation coefficient, ψ, for pure water and very diluted solution,
[75,84,99,105]
Tf ;m−Tp;m ¼ 1
1þ Hhfþ H
hp
Tf−Tp
� �
¼ ψ Tf−Tp
� �
ð55Þ
where hm is equal to
hm ¼ Cm
dP
dT
� �
ΔHv þkmδ
ð56Þ
Lawson and Lloyd [10] pointed out that the (Tm, f−Tm.p) is about
0.1 °C at low flux and does not exceed 0.5 °C at high flux.
Table 5
Sherwood correlations as used by some researchers.
Ref Equation Notes
[5,65] Sh ¼ 1:86 Re Sc dL
13 Laminar flow
[96,97] Sh ¼ 1:62 Re Sc dhL
� �0:33Laminar flow
[98] Sh ¼ 2:00 Re0:483Sc13 Does not mention
[5,48,65,67,86] Sh ¼ 0:023 Re0:8 Sc13 Turbulent flow
[86] Sh=0.023 Re0.875 Sc0.25 Turbulent flow
[67] Sh ¼ c
Llð Þ
19
Sc Grð Þn To compute mass transfer
coefficient across the air gap
when it is over 5 mm2.1×105bGrb1.1×07
c=0.07 n=1/3
2.0×10⁴bGrb2.1×105
c=0.20 n=1/4
Conduction
Latent heat of
vaporization
Thermal
Boundary layerThermal
Boundary layer
Tf Tf,m Tp,m Tp
Fig. 7. Heat transfer resistances in the MD system.
11A. Alkhudhiri et al. / Desalination 287 (2012) 2–18
Gryta et al. [106] studied the presence of free and force convection
in laminar flow in DCMD, and suggested the following equation to
calculate the heat transfer coefficient:
Nu ¼ 0:74 Re0:2
Gr Prð Þ0:1 Pr0:2 ð57Þ
A mathematical model was built by Chen et al. [107] to study the
temperature distribution on both membrane surfaces in the hot and
cold membrane chambers. This model was able to compute the
power consumption of DCMD.
For the AGMD configuration, the heat transfer through the AGMD
was represented as in DCMD, except for the heat transfer across the air
gap, which occurs by conduction and vapour (mass transfer) [6,88,108]
hf Tf−Tf ;m
� �
¼ JΔHv þkmδ
Tf ;m−Tp;m
� �
¼ JΔHv þkgl
Tp;m−Tfilm
� �
¼ hd Tfilm−T5
� �ð58Þ
In addition, Guijt et al. [82], Banat and Simandl [19] and Kimura et
al. [18] suggested the following equation to calculate the heat transfer
coefficient for the condensate film (pure vapour) on a vertical wall:
hd ¼ 2
3
ffiffiffi
2p kfilm
3ρ2gΔHv
c L Tfilm−T5
� �
0
@
1
A
14
ð59Þ
Furthermore, the average membrane temperature was used by
Kimura and Nakao [18] instead of membrane surface temperature.
They concluded that the sensible heat for the MD system can be
neglected, because it has a very small magnitude compared to the
heat of vaporization
Q ¼ JΔHv ð60Þ
Free convection heat transfer between two vertical plates is also
used to describe the heat transfer phenomenon in the air gap region,
when the air gap distance is over 5 mm [67]
Nu ¼ c Pr Grð Þn l
L
� �19
ð61Þ
where
105b Gr b 107; c ¼ 0:07 and n ¼ 1
3
104b Gr b 105; c ¼ 0:2 and n ¼ 1
4
Bouguecha et al. [92] designed a mathematical model for laminar
flow, in which the heat andmass transfer are considered. The temper-
ature profiles at different air gap thicknesses in two dimensions are
plotted. The heat transfer by convection starts to change to natural
convection at 5 mm air gap thickness, and this dominates the heat
transfer mechanism at a wide air gap.
For VMD configuration, heat transfer by convection in the feed
boundary layer can be expressed as:
Qf ¼ hf Tf−Tf ;m
� �
ð62Þ
However, the heat transfer by conduction through the membrane is
ignored [10,35], so the heat transfer across the VMD can be written as:
hf Tf−Tf ;m
� �
¼ JΔHv ð63Þ
For SGMD, the heat transfer equations, which describe the DCMD
can be used [36].
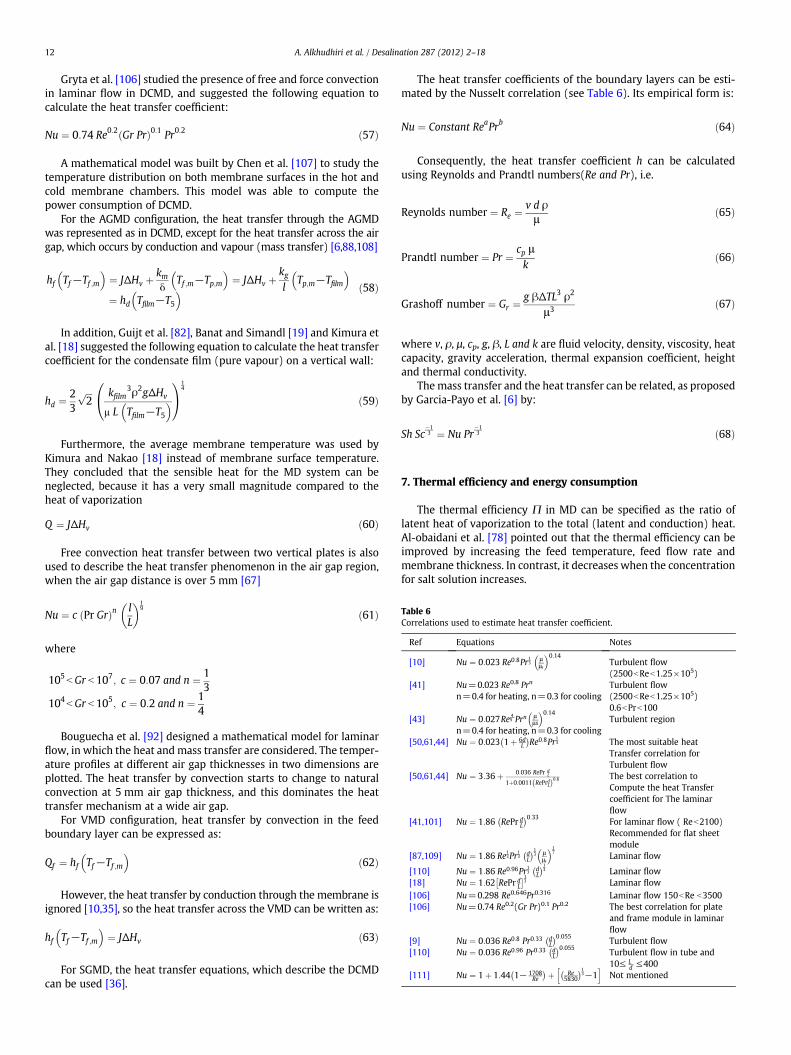
The heat transfer coefficients of the boundary layers can be esti-
mated by the Nusselt correlation (see Table 6). Its empirical form is:
Nu ¼ Constant ReaPr
b ð64Þ
Consequently, the heat transfer coefficient h can be calculated
using Reynolds and Prandtl numbers(Re and Pr), i.e.
Reynolds number ¼ Re ¼v d ρ
μð65Þ
Prandtl number ¼ Pr ¼cp μ
kð66Þ
Grashoff number ¼ Gr ¼g βΔTL3 ρ2
μ3ð67Þ
where v, ρ, µ, cp, g, β, L and k are fluid velocity, density, viscosity, heat
capacity, gravity acceleration, thermal expansion coefficient, height
and thermal conductivity.
The mass transfer and the heat transfer can be related, as proposed
by Garcia-Payo et al. [6] by:
Sh Sc−13 ¼ Nu Pr
−13 ð68Þ
7. Thermal efficiency and energy consumption
The thermal efficiency Π in MD can be specified as the ratio of
latent heat of vaporization to the total (latent and conduction) heat.
Al-obaidani et al. [78] pointed out that the thermal efficiency can be
improved by increasing the feed temperature, feed flow rate and
membrane thickness. In contrast, it decreases when the concentration
for salt solution increases.
Table 6
Correlations used to estimate heat transfer coefficient.
Ref Equations Notes
[10] Nu ¼ 0:023 Re0:8Pr13
μμs
� �0:14Turbulent flow
(2500bReb1.25×105)
[41] Nu=0.023 Re0.8 Prn Turbulent flow
n=0.4 for heating, n=0.3 for cooling (2500bReb1.25×105)
0.6bPrb100
[43] Nu ¼ 0:027Re45 Prn μ
μs
� �0:14Turbulent region
n=0.4 for heating, n=0.3 for cooling
[50,61,44] Nu ¼ 0:023 1þ 6dL
Re0:8Pr13 The most suitable heat
Transfer correlation for
Turbulent flow
[50,61,44] Nu ¼ 3:36þ 0:036 RePr dL
1þ0:0011 RePrdLð Þ0:8 The best correlation to
Compute the heat Transfer
coefficient for The laminar
flow
[41,101] Nu ¼ 1:86 RePr dL
0:33For laminar flow ( Reb2100)
Recommended for flat sheet
module
[87,109] Nu ¼ 1:86 Re13Pr
13
dL
13 μ
μs
� �17
Laminar flow
[110] Nu ¼ 1:86 Re0:96Pr13
dL
13 Laminar flow
[18] Nu ¼ 1:62 RePr dL
� �13 Laminar flow
[106] Nu=0.298 Re0.646Pr0.316 Laminar flow 150bRe b3500
[106] Nu=0.74 Re0.2(Gr Pr)0.1 Pr0.2 The best correlation for plate
and frame module in laminar
flow
[9] Nu ¼ 0:036 Re0:8 Pr0:33 dL
0:055Turbulent flow
[110] Nu ¼ 0:036 Re0:96 Pr0:33 dL
0:055Turbulent flow in tube and
10≤ Ld≤400
[111] Nu ¼ 1þ 1:44 1− 1708Re
þ Re5830
13−1
h i
Not mentioned
12 A. Alkhudhiri et al. / Desalination 287 (2012) 2–18
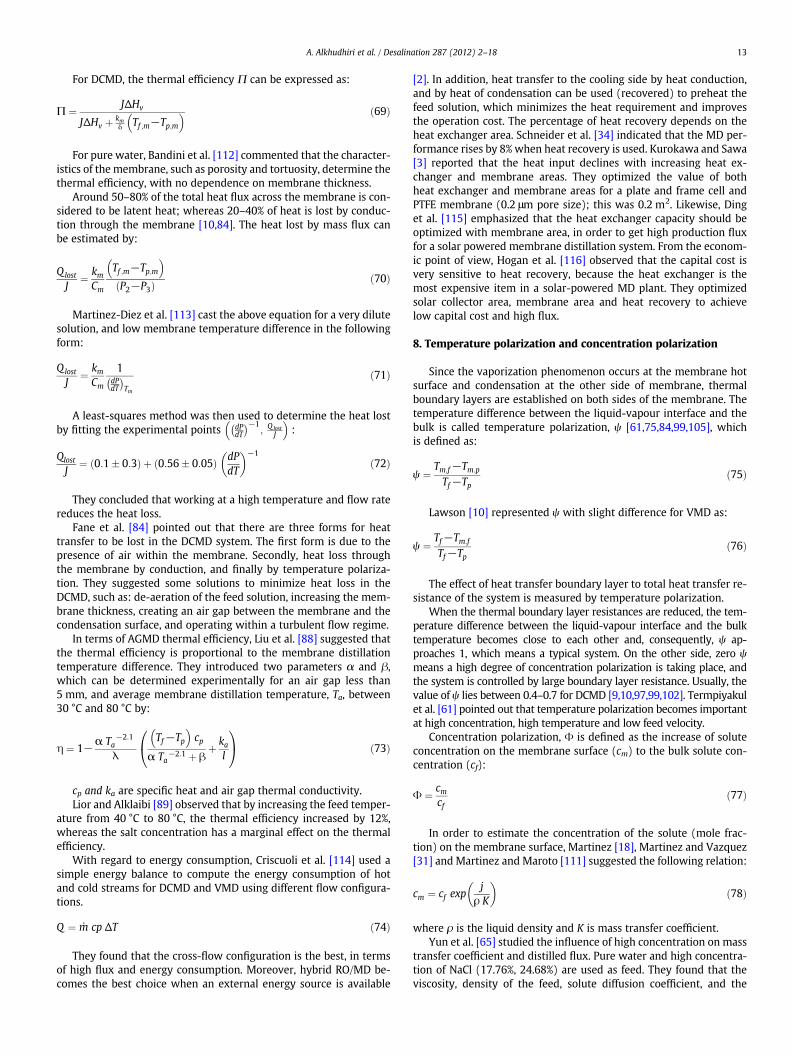
For DCMD, the thermal efficiency Π can be expressed as:
Π ¼ JΔHv
JΔHv þ kmδ Tf ;m−Tp;m
� � ð69Þ
For pure water, Bandini et al. [112] commented that the character-
istics of the membrane, such as porosity and tortuosity, determine the
thermal efficiency, with no dependence on membrane thickness.
Around 50–80% of the total heat flux across the membrane is con-
sidered to be latent heat; whereas 20–40% of heat is lost by conduc-
tion through the membrane [10,84]. The heat lost by mass flux can
be estimated by:
Q lost
J¼ km
Cm
Tf ;m−Tp;m
� �
P2−P3ð Þ ð70Þ
Martinez-Diez et al. [113] cast the above equation for a very dilute
solution, and low membrane temperature difference in the following
form:
Q lost
J¼ km
Cm
1dPdT
Tm
ð71Þ
A least-squares method was then used to determine the heat lost
by fitting the experimental points dPdT
−1; Q lost
J
� �
:
Qlost
J¼ 0:1� 0:3ð Þ þ 0:56� 0:05ð Þ dP
dT
� �−1
ð72Þ
They concluded that working at a high temperature and flow rate
reduces the heat loss.
Fane et al. [84] pointed out that there are three forms for heat
transfer to be lost in the DCMD system. The first form is due to the
presence of air within the membrane. Secondly, heat loss through
the membrane by conduction, and finally by temperature polariza-
tion. They suggested some solutions to minimize heat loss in the
DCMD, such as: de-aeration of the feed solution, increasing the mem-
brane thickness, creating an air gap between the membrane and the
condensation surface, and operating within a turbulent flow regime.
In terms of AGMD thermal efficiency, Liu et al. [88] suggested that
the thermal efficiency is proportional to the membrane distillation
temperature difference. They introduced two parameters α and β,
which can be determined experimentally for an air gap less than
5 mm, and average membrane distillation temperature, Ta, between
30 °C and 80 °C by:
η ¼ 1−α Ta
−2:1
λ
Tf−Tp
� �
cp
α Ta−2:1 þ β
þ kal
0
@
1
A ð73Þ
cp and ka are specific heat and air gap thermal conductivity.
Lior and Alklaibi [89] observed that by increasing the feed temper-
ature from 40 °C to 80 °C, the thermal efficiency increased by 12%,
whereas the salt concentration has a marginal effect on the thermal
efficiency.
With regard to energy consumption, Criscuoli et al. [114] used a
simple energy balance to compute the energy consumption of hot
and cold streams for DCMD and VMD using different flow configura-
tions.
Q ¼ m cp ΔT ð74Þ
They found that the cross-flow configuration is the best, in terms
of high flux and energy consumption. Moreover, hybrid RO/MD be-
comes the best choice when an external energy source is available
[2]. In addition, heat transfer to the cooling side by heat conduction,
and by heat of condensation can be used (recovered) to preheat the
feed solution, which minimizes the heat requirement and improves
the operation cost. The percentage of heat recovery depends on the
heat exchanger area. Schneider et al. [34] indicated that the MD per-
formance rises by 8% when heat recovery is used. Kurokawa and Sawa
[3] reported that the heat input declines with increasing heat ex-
changer and membrane areas. They optimized the value of both
heat exchanger and membrane areas for a plate and frame cell and
PTFE membrane (0.2 μm pore size); this was 0.2 m2. Likewise, Ding
et al. [115] emphasized that the heat exchanger capacity should be
optimized with membrane area, in order to get high production flux
for a solar powered membrane distillation system. From the econom-
ic point of view, Hogan et al. [116] observed that the capital cost is
very sensitive to heat recovery, because the heat exchanger is the
most expensive item in a solar-powered MD plant. They optimized
solar collector area, membrane area and heat recovery to achieve
low capital cost and high flux.
8. Temperature polarization and concentration polarization
Since the vaporization phenomenon occurs at the membrane hot
surface and condensation at the other side of membrane, thermal
boundary layers are established on both sides of the membrane. The
temperature difference between the liquid-vapour interface and the
bulk is called temperature polarization, ψ [61,75,84,99,105], which
is defined as:
ψ ¼Tm;f−Tm:p
Tf−Tpð75Þ
Lawson [10] represented ψ with slight difference for VMD as:
ψ ¼Tf−Tm:f
Tf−Tpð76Þ
The effect of heat transfer boundary layer to total heat transfer re-
sistance of the system is measured by temperature polarization.
When the thermal boundary layer resistances are reduced, the tem-
perature difference between the liquid-vapour interface and the bulk
temperature becomes close to each other and, consequently, ψ ap-
proaches 1, which means a typical system. On the other side, zero ψ
means a high degree of concentration polarization is taking place, and
the system is controlled by large boundary layer resistance. Usually, the
value of ψ lies between 0.4–0.7 for DCMD [9,10,97,99,102]. Termpiyakul
et al. [61] pointed out that temperature polarization becomes important
at high concentration, high temperature and low feed velocity.
Concentration polarization, Φ is defined as the increase of solute
concentration on the membrane surface (cm) to the bulk solute con-
centration (cf):
Φ ¼ cmcf
ð77Þ
In order to estimate the concentration of the solute (mole frac-
tion) on the membrane surface, Martinez [18], Martinez and Vazquez
[31] and Martinez and Maroto [111] suggested the following relation:
cm ¼ cf expj
ρ K
� �
ð78Þ
where ρ is the liquid density and K is mass transfer coefficient.
Yun et al. [65] studied the influence of high concentration on mass
transfer coefficient and distilled flux. Pure water and high concentra-
tion of NaCl (17.76%, 24.68%) are used as feed. They found that the
viscosity, density of the feed, solute diffusion coefficient, and the
13A. Alkhudhiri et al. / Desalination 287 (2012) 2–18

convective heat transfer coefficient are directly related to the concen-
tration and temperature. They noted that the solute accumulated on
the membrane surface during the desalination process; as a conse-
quence, a diffusive flow back to the feed was generated. Therefore,
the concentration polarization and fouling must be considered in
modelling, and the permeate flux cannot be predicted by Knudsen,
molecular and Poiseuille flow, because the properties of the boundary
layer at the membrane surface vary from the bulk solution.
9. Fouling
The fouling problem is significantly lower than that encountered in
conventional pressure-driven membrane separation. Shirazi et al.
[117] pointed out that membrane fouling by inorganic salt depends
on the membrane properties, module geometry, feed solution charac-
teristic and operating conditions. There are several types of fouling,
which may block the membrane pores. Biological fouling is growth on
the surface of the membrane (by bacteria), and scaling (for the high
concentration solution), which will create an additional layer on the
membrane surface, composed of the particles present in the liquid [10].
Kullab and Martin [58] pointed out that fouling and scaling lead to
blocking the membrane pores, which reduces the effective mem-
brane, and therefore the permeate flux obviously decreases. These
may also cause a pressure drop, and higher temperature polarization
effect. Gryta [118] indicated that the deposits formed on the mem-
brane surface leads to the adjacent pores being filled with feed solu-
tion (partial membrane wetting). Moreover, additional thermal
resistance will be created by the fouling layer, which is deposited
on the membrane surface. As a result, the overall heat transfer coeffi-
cient is changed. For DCMD at steady state, Gryta [119] specified:
hf Tf−Tf ;foulig
� �
¼kfoulingδfouling
Tf ;fouling−Tf ;m
� �
¼ kmδ
Tf ;m−Tp;m
� �
þ JΔHv
¼ hp Tp;m−Tp
� �
ð79Þ
where kfouling, δfouling and Tf, fouling are the fouling layer thermal con-
ductivity, thickness, and fouling layer temperature, respectively.
Tun et al. [87] examined the effect of high concentration of NaCl and
Na2SO4 on the permeate flux. The flux gradually decreases during the
MD process, until the feed concentration reaches the supersaturation
point, and then the flux decrease sharply to zero. Afterwards, the mem-
brane was completely covered by crystal deposits. Furthermore, Yun et
al. [65] arrived at the same result, and concluded that when the mem-
brane surface concentration reaches saturation, the properties of the
boundary layer will differ from the bulk solution properties.
Currently, pre-treatment and membrane cleaning are the main
techniques to control fouling. Alklaibi and Lior [32] investigated the
influence of fouling by preparing three different solutions: water
pre-treated by microfiltration, seawater and 3% NaCl. They concluded
that the pre-treatment process increased the product flux by 25%,
which means that the pre-treatment process is important, in order
to enhance the permeate flux. Hsu et al. [14] used the ultrasonic irra-
diation technique to clean fouling from the membrane. Moreover,
pure water for 2 h, followed by 0.1 M NaOHwas used to clean a mem-
brane, which was utilized to filter a mixture of CaCl2 and humic acid.
The permeate flux was about 87% of initial flux [60]. Gryta [119] pro-
posed that the fouling intensity can be limited by operating at low
temperature (feed temperature), and increasing the feed flow rate.
10. Operating parameters
In this section, the influence of feed temperature, concentration
and air gap will be reviewed and major findings will be cited and
discussed.
10.1. Feed temperature
As can be seen in Table 7, the feed temperature has a strong influ-
ence on the distilled flux. According to the Antoine equation, the va-
pour pressure increases exponentially with temperature. Therefore,
the operating temperature has an exponential effect on the permeate
flux [32]. At constant temperature difference between the hot and the
cold fluid, the permeate flux increases when the temperature of the
hot fluid rises, which means the permeate flux is more dependent
of the hot fluid temperature [12]. Qtaishat et al. [103], Gunko et al.
[12], and Chen et al. [107] pointed out that increasing the tempera-
ture gradient between the membrane surfaces will affect the diffusion
coefficient positively, which leads to increased vapour flux. Similarly,
Srisurichan et al. [41] believed that there is a direct relation between
diffusivity and temperature, so that working at high temperature will
increase the mass transfer coefficient across the membrane. More-
over, temperature polarization decreases with increasing feed tem-
perature [50,102]. In terms of coolant temperature, a noticeable
change takes place in the permeate flux when the cold side tempera-
ture decreases [12,15]. In addition, more than double permeate flux
can be achieved compared to a solution, at the same temperature dif-
ference [32]. Banat and Simandl [5] and Matheswaran et al. [120],
however, found that the effect of the cold side temperature on the
permeate flux is neglected at fixed hot side temperature, because of
low variation of vapour pressure at low temperatures.
10.2. The concentration and solution feature
There is a significant fall in the flux product when feed concentra-
tion increases due to decreasing vapour pressure [85] and increasing
Table 7
Effect of temperature on permeate flux.
Ref MD
type
Membrane
type
Pore size
(μm)
Solution Feed velocity
(m/s)
Tf (°C) Permeate
kg/m2 h
[5] AGMD PVDF 0.45 Artificial seawater 5.5 l/min 40–70 ≈1–7
[50] DCMD PVDF 0.22 Pure water 0.1 40–70 ≈3.6–16.2
[113] DCMD PTFE 0.2 NaCl (2 mol/l) 16 cm3/s 17.5–31 ≈2.88–25.2
[44] DCMD PTFE 0.2 Pure water – 40–70 ≈5.8–18.7
[63] DCMD PVDF 0.4 Sugar 0.45 61–81 ≈18–38
[65] DCMD PVDF 0.4 Pure water 0.145 36–66 ≈5.4–36
NaCl (24.6 wt.%) 0.145 43–68 ≈6.1–28.8
[24] VND 3MC 0.51 Pure water – 30–75 ≈0.8–8.8 mol/m2s
[41] DCMD PVDF 0.22 Pure water 0.23 40–70 ≈7–33 l/m2h
[68] SGMD PTFE 0.45 Pure water 0.15 40–70 ≈4.3–16.2
[15] DCMD PVDF 0.11 Orange juice 2.5 kg/min 25–45 30×103–108×103
[14] DCMD PTFE 0.2 NaC l (5%) 3.3 l/min 5–45 1–42
[14] AGMD PTFE 0.2 NaC l (3%) 3.3 l/min 5–45 0.5–6
14 A. Alkhudhiri et al. / Desalination 287 (2012) 2–18
temperature polarization [101]. Likewise, Izquierdo-Gil et al. [108]
concluded that the reduction in product flux is linear with time. Fur-
thermore, Tomaszewska et al. [16,109] studied the influence of acid
concentration on the permeate flux. They found that there is a reduc-
tion in the permeate when the acid concentration increase. Moreover,
Sakia et al. [66] found a noticeable reduction in the water vapour per-
meability when protein concentration of bovine plasma increases. On
the other hand, Banat and Simandl [33], Qtaishat et al. [103] and
Alklaibi and Lior [89] concluded that the permeate flux decreases
slightly with increasing feed concentration. About 12% reduction in
permeate flux happened when the feed (NaCl) increased from 0 to
2 Molar concentration [103]. This decrease in the permeate flux
amount is due to the reduction in the water vapour pressure. Lawson
and Lloyd [10] studied the reasons for decreasing product flux when
the concentration of NaCl increases. They found three reasons for
this reduction; 1) water activity, which is a function of temperature,
decreases when the concentration increases 2) the mass transfer co-
efficient of the boundary layer at the feed side decreases due to in-
creased influence of concentration polarization, and 3) the heat
transfer coefficient decreases as well at the boundary layer, because
of the reduction in the surface membrane temperature. Therefore,
the vapour pressure of the feed declines, which leads to reduced per-
formance of MD. Schofield et al. [63] studied the impact of molecular
weight fraction and viscosity on the flux by preparing sugar (30 wt.%)
and NaCl (25 wt.%) solutions. Under the same conditions, they found
that the sugar solution has less flux reduction than salt solution. They
concluded that the viscosity is an important factor in flux reduction.
The heat transfer coefficient decreases due to the reduced Reynolds
number. The effect of thermal conductivity and heat capacity on the
flux reduction is negligible. Furthermore, the impact of density on
the flux production is important for salt solutions. Three aqueous so-
lutions of methanol, ethanol and isopropanol at different concentra-
tions were studied by Garcia et al [6]. They found that the type of
alcohol is strongly related to the amount of flux. Isopropanol has
the highest vapour pressure, and as a consequence isopropanol solu-
tion has the highest flux, while methanol solution has the lowest.
The influence of high concentration, such as in NaCl solutions, was
reported by Yun [65], who found that there is variation in the perme-
ate flux with time (see Table 8), and that it is difficult to calculate the
permeate flux using existing models.
10.3. Recirculation rate
Table 9 summarizes the effect of recirculation rate. Working at a
high recirculation rate minimizes the boundary layer resistance and
maximizes the heat transfer coefficient. As a result, higher flux can
be achieved [41]. Chen et al. [107] indicated that the increasing volu-
metric flow rate will enhance the permeate flux. The fluid velocity
rises when the volumetric flow rates increases, so that the convective
heat transfer coefficient develops and the thermal boundary layer
thickness decreases. As a result, the temperature polarization effect
reduces. Moreover, Martinez-Diez and Vazques-Gonzalez [101]
found significant change in temperature polarization, when the rate
of recirculation changes. This is because the recirculation rate en-
hances the heat transfer, which leads to rise in the product flux and
temperature polarization. Izquierdo-Gil et al. [108] investigated the
influence of increasing the flow rate on the flux product. The concen-
tration and temperature polarization decreased due to the higher
flow rate. Banat and Simandl [5], and Shojikubota at al. [122] studied
the effect of flow rate on the cold side. Shojikubota at al. They found
that the cold side flow rate has an important effect on the permeate
flux; however, Banat and Simandl [5] found negligible influence on
the permeate flux, when the cold side flow rate was enhanced.
10.4. The air gap
Lawson and Lloyd [10] pointed out that the flux declines linearly
with 1l. Likewise, Izquierdo-Gil et al. [108] found a linear relation be-
tween the distillate flux and the number of gaskets removed. They stud-
ied the effect of opening the upper side of the gap to the atmosphere as
well. A slight reduction in distillate flux happened compared to closing
the gap. Alklaibi and Lior [32] reported that reducing the air gap will
Table 8
Effect of concentration on permeate flux.
Ref MD
type
Membrane
type
Pore
size
(μm)
Solution Concentration Tf Permeate
g/l (°C) kg/m2 h
[6] AGMD PVDF 0.22 Methanol/water ≈30–200 50 ≈ 3.9–4.6
Ethanol/water ≈30–150 ≈3.95–4.9
Isopropanol/water ≈10–95 ≈4.0–5.0
[113] DCMD PTFE 0.2 NaCl 0–116.8 31 ≈32.4–25.2
[63] DCMD PVDF 0.4 NaCl 0–5290 81 ≈44–63
[65] DCMD PVDF 0.22 NaCl 0–24.6 wt.% 68 ≈36–28.8
[120] AGMD PTFE 0.22 HNO3 2–6 M 80 ≈0.9–2.1 l/m2h
[120] VMD PP 0.2 NaCl 100–300 55 10.7–7.0
Table 9
Effect of recirculation rate on permeate flux.
Ref MD
type
Membrane
type
Pore size
(μm)
Solution Tf (°C) Flowrate J (kg/m2h)
m/s
[68,69] SGMD TF200 0.2 NaCl(1 M) 50 0.07–0.21 ≈3.24–3.96
TF450 0.45 ≈5.4–5.76
[61] DCMD PVDF 0.22 NaCl (35 g/l) 60 1.85–2.78 31–38
[5] AGMD PVDF 0.45 Artificial Seawater 60 1–5.7 l/min ≈2.7
[85] DCMD PTFE 0.2 Sucrose (40 wt %) 39 5–16 cm3/s 5.7–9.0
[63] DCMD PVDF 0.4 Sugar (30 wt %) 81 0.45–0.9 ≈38–55
[65] DCMD PVDF 0.22 NaCl (17.7 wt %) 68 0.056–0.33 ≈25.9–29.5
[24] VMD 3MC 0.51 Pure water 74 37–63 cm3/s ≈6.4–8.7 mol/m2s
[41] DCMD PVDF 0.22 Pure water 50 1.8–2.3 ≈18–20 l/m2h
[22] VMD PTFE 0.2 Acetone (5 wt.%) 30 0.1–2.6 l/min 12.6–21.6
[121] VMD PP 0.2 NaCl (300 g/l) 55 0.015–0.03 l/s 7–9.1
15A. Alkhudhiri et al. / Desalination 287 (2012) 2–18
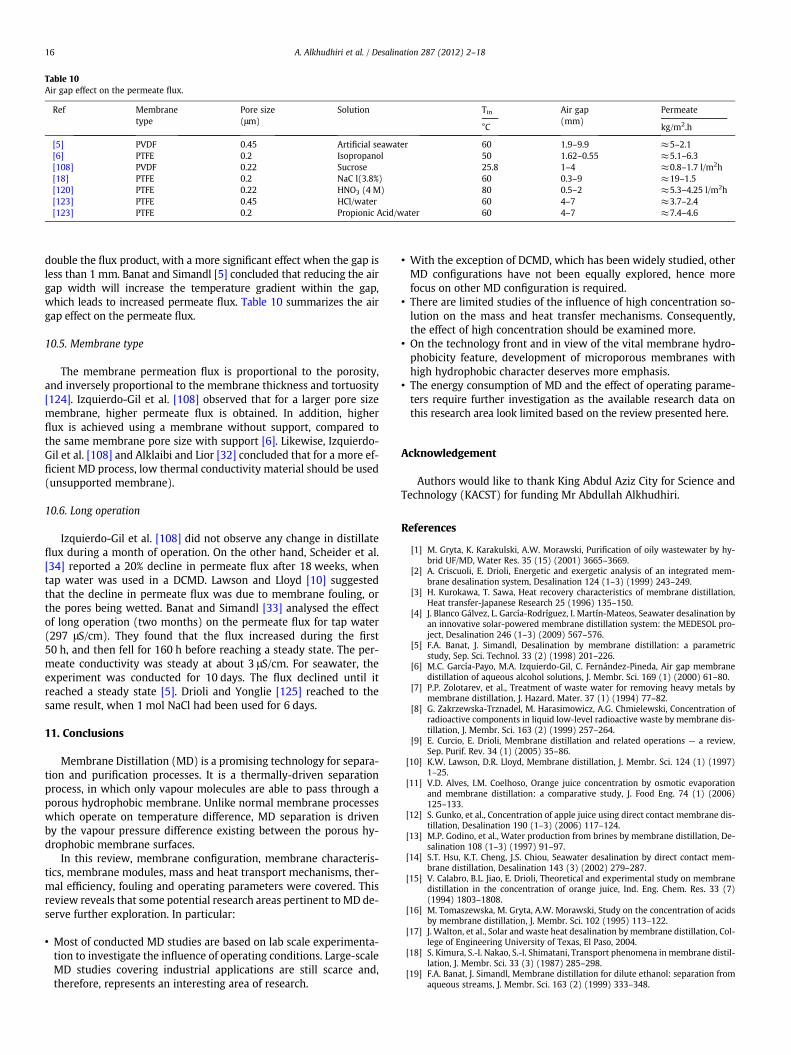
double the flux product, with a more significant effect when the gap is
less than 1 mm. Banat and Simandl [5] concluded that reducing the air
gap width will increase the temperature gradient within the gap,
which leads to increased permeate flux. Table 10 summarizes the air
gap effect on the permeate flux.
10.5. Membrane type
The membrane permeation flux is proportional to the porosity,
and inversely proportional to the membrane thickness and tortuosity
[124]. Izquierdo-Gil et al. [108] observed that for a larger pore size
membrane, higher permeate flux is obtained. In addition, higher
flux is achieved using a membrane without support, compared to
the same membrane pore size with support [6]. Likewise, Izquierdo-
Gil et al. [108] and Alklaibi and Lior [32] concluded that for a more ef-
ficient MD process, low thermal conductivity material should be used
(unsupported membrane).
10.6. Long operation
Izquierdo-Gil et al. [108] did not observe any change in distillate
flux during a month of operation. On the other hand, Scheider et al.
[34] reported a 20% decline in permeate flux after 18 weeks, when
tap water was used in a DCMD. Lawson and Lloyd [10] suggested
that the decline in permeate flux was due to membrane fouling, or
the pores being wetted. Banat and Simandl [33] analysed the effect
of long operation (two months) on the permeate flux for tap water
(297 μS/cm). They found that the flux increased during the first
50 h, and then fell for 160 h before reaching a steady state. The per-
meate conductivity was steady at about 3 μS/cm. For seawater, the
experiment was conducted for 10 days. The flux declined until it
reached a steady state [5]. Drioli and Yonglie [125] reached to the
same result, when 1 mol NaCl had been used for 6 days.
11. Conclusions
Membrane Distillation (MD) is a promising technology for separa-
tion and purification processes. It is a thermally-driven separation
process, in which only vapour molecules are able to pass through a
porous hydrophobic membrane. Unlike normal membrane processes
which operate on temperature difference, MD separation is driven
by the vapour pressure difference existing between the porous hy-
drophobic membrane surfaces.
In this review, membrane configuration, membrane characteris-
tics, membrane modules, mass and heat transport mechanisms, ther-
mal efficiency, fouling and operating parameters were covered. This
review reveals that some potential research areas pertinent to MD de-
serve further exploration. In particular:
• Most of conducted MD studies are based on lab scale experimenta-
tion to investigate the influence of operating conditions. Large-scale
MD studies covering industrial applications are still scarce and,
therefore, represents an interesting area of research.
• With the exception of DCMD, which has been widely studied, other
MD configurations have not been equally explored, hence more
focus on other MD configuration is required.
• There are limited studies of the influence of high concentration so-
lution on the mass and heat transfer mechanisms. Consequently,
the effect of high concentration should be examined more.
• On the technology front and in view of the vital membrane hydro-
phobicity feature, development of microporous membranes with
high hydrophobic character deserves more emphasis.
• The energy consumption of MD and the effect of operating parame-
ters require further investigation as the available research data on
this research area look limited based on the review presented here.
Acknowledgement
Authors would like to thank King Abdul Aziz City for Science and
Technology (KACST) for funding Mr Abdullah Alkhudhiri.
References
[1] M. Gryta, K. Karakulski, A.W. Morawski, Purification of oily wastewater by hy-brid UF/MD, Water Res. 35 (15) (2001) 3665–3669.
[2] A. Criscuoli, E. Drioli, Energetic and exergetic analysis of an integrated mem-brane desalination system, Desalination 124 (1–3) (1999) 243–249.
[3] H. Kurokawa, T. Sawa, Heat recovery characteristics of membrane distillation,Heat transfer-Japanese Research 25 (1996) 135–150.
[4] J. Blanco Gálvez, L. García-Rodríguez, I. Martín-Mateos, Seawater desalination byan innovative solar-powered membrane distillation system: the MEDESOL pro-ject, Desalination 246 (1–3) (2009) 567–576.
[5] F.A. Banat, J. Simandl, Desalination by membrane distillation: a parametricstudy, Sep. Sci. Technol. 33 (2) (1998) 201–226.
[6] M.C. García-Payo, M.A. Izquierdo-Gil, C. Fernández-Pineda, Air gap membranedistillation of aqueous alcohol solutions, J. Membr. Sci. 169 (1) (2000) 61–80.
[7] P.P. Zolotarev, et al., Treatment of waste water for removing heavy metals bymembrane distillation, J. Hazard. Mater. 37 (1) (1994) 77–82.
[8] G. Zakrzewska-Trznadel, M. Harasimowicz, A.G. Chmielewski, Concentration ofradioactive components in liquid low-level radioactive waste by membrane dis-tillation, J. Membr. Sci. 163 (2) (1999) 257–264.
[9] E. Curcio, E. Drioli, Membrane distillation and related operations — a review,Sep. Purif. Rev. 34 (1) (2005) 35–86.
[10] K.W. Lawson, D.R. Lloyd, Membrane distillation, J. Membr. Sci. 124 (1) (1997)1–25.
[11] V.D. Alves, I.M. Coelhoso, Orange juice concentration by osmotic evaporationand membrane distillation: a comparative study, J. Food Eng. 74 (1) (2006)125–133.
[12] S. Gunko, et al., Concentration of apple juice using direct contact membrane dis-tillation, Desalination 190 (1–3) (2006) 117–124.
[13] M.P. Godino, et al., Water production from brines by membrane distillation, De-salination 108 (1–3) (1997) 91–97.
[14] S.T. Hsu, K.T. Cheng, J.S. Chiou, Seawater desalination by direct contact mem-brane distillation, Desalination 143 (3) (2002) 279–287.
[15] V. Calabro, B.L. Jiao, E. Drioli, Theoretical and experimental study on membranedistillation in the concentration of orange juice, Ind. Eng. Chem. Res. 33 (7)(1994) 1803–1808.
[16] M. Tomaszewska, M. Gryta, A.W. Morawski, Study on the concentration of acidsby membrane distillation, J. Membr. Sci. 102 (1995) 113–122.
[17] J. Walton, et al., Solar and waste heat desalination by membrane distillation, Col-lege of Engineering University of Texas, El Paso, 2004.
[18] S. Kimura, S.-I. Nakao, S.-I. Shimatani, Transport phenomena in membrane distil-lation, J. Membr. Sci. 33 (3) (1987) 285–298.
[19] F.A. Banat, J. Simandl, Membrane distillation for dilute ethanol: separation fromaqueous streams, J. Membr. Sci. 163 (2) (1999) 333–348.
Table 10
Air gap effect on the permeate flux.
Ref Membrane
type
Pore size Solution Tin Air gap Permeate
(μm)°C
(mm)kg/m2.h
[5] PVDF 0.45 Artificial seawater 60 1.9–9.9 ≈5–2.1
[6] PTFE 0.2 Isopropanol 50 1.62–0.55 ≈5.1–6.3
[108] PVDF 0.22 Sucrose 25.8 1–4 ≈0.8–1.7 l/m2h
[18] PTFE 0.2 NaC l(3.8%) 60 0.3–9 ≈19–1.5
[120] PTFE 0.22 HNO3 (4 M) 80 0.5–2 ≈5.3–4.25 l/m2h
[123] PTFE 0.45 HCl/water 60 4–7 ≈3.7–2.4
[123] PTFE 0.2 Propionic Acid/water 60 4–7 ≈7.4–4.6
16 A. Alkhudhiri et al. / Desalination 287 (2012) 2–18
[20] M. Khayet, Membranes and theoretical modeling of membrane distillation: A re-view, Adv. Colloid Interface Sci. 164 (1–2) (2011) 56–88.
[21] M.C. García-Payo, et al., Separation of binary mixtures by thermostatic sweepinggas membrane distillation: II. Experimental results with aqueous formic acid so-lutions, J. Membr. Sci. 198 (2) (2002) 197–210.
[22] S. Bandini, G.C. Sarti, Heat and mass transport resistances in vacuum membranedistillation per drop, AIChE Journal 45 (1999) 1422–1433.
[23] S. Bandini, C. Gostoli, G.C. Sarti, Separation efficiency in vacuum membrane dis-tillation, J. Membr. Sci. 73 (2–3) (1992) 217–229.
[24] K.W. Lawson, D.R. Lloyd, Membrane distillation. I. Module design and perfor-mance evaluation using vacuum membrane distillation, J. Membr. Sci. 120 (1)(1996) 111–121.
[25] C. Gostoli, G.C. Sarti, Separation of liquid mixtures by membrane distillation,J. Membr. Sci. 41 (1989) 211–224.
[26] M.C. García-Payo, M.A. Izquierdo-Gil, C. Fernández-Pineda, Wetting study of hy-drophobic membranes via liquid entry pressure measurements with aqueous al-cohol solutions, J. Colloid Interface Sci. 230 (2) (2000) 420–431.
[27] A.C.M. Franken, et al., Wetting criteria for the applicability of membrane distilla-tion, J. Membr. Sci. 33 (3) (1987) 315–328.
[28] M. Tomaszewska, Preparation and properties of flat-sheet membranes frompoly(vinylidene fluoride) for membrane distillation, Desalination 104 (1–2)(1996) 1–11.
[29] S. Khemakhem, R.B. Amar, Grafting of Fluoroalkylsilanes on Microfiltration Tuni-sian Clay Membrane, Ceram. Int. (2011) doi:10.1016/j.ceramin., 2011.04.128.
[30] S. Cerneaux, et al., Comparison of various membrane distillationmethods for desa-lination using hydrophobic ceramic membranes, J. Membr. Sci. 337 (1–2) (2009)55–60.
[31] J. Zhang, et al., Identification of material and physical features of membrane dis-tillation membranes for high performance desalination, J. Membr. Sci. 349 (1–2)(2010) 295–303.
[32] A.M. Alklaibi, N. Lior, Membrane-distillation desalination: status and potential,Desalination 171 (2) (2005) 111–131.
[33] F.A. Banat, J. Simandl, Theoretical and experimental study in membrane distilla-tion, Desalination 95 (1) (1994) 39–52.
[34] K. Schneider, et al., Membranes and modules for transmembrane distillation,J. Membr. Sci. 39 (1) (1988) 25–42.
[35] M. Khayet, K.C. Khulbe, T. Matsuura, Characterization of membranes for mem-brane distillation by atomic force microscopy and estimation of their watervapor transfer coefficients in vacuum membrane distillation process, J. Membr.Sci. 238 (1–2) (2004) 199–211.
[36] M. Khayet, N.N. Li, A.G. Fane, W.S. winston Ho, Membrane Distillation, AdvanceMembrane Technology and Applications, John Wiley, New Jersey, 2008.
[37] M. Mulder, Basic Principles of membrane Technology, seconde ed. Kluwer Aca-demic Publishers, Netherlands, 2003.
[38] F. Laganà, G. Barbieri, E. Drioli, Direct contact membrane distillation: modellingand concentration experiments, J. Membr. Sci. 166 (1) (2000) 1–11.
[39] M. Khayet, T. Matsuura, Preparation and characterization of polyvinylidene fluo-ride membranes for membrane distillation, Ind. Eng. Chem. Res. 40 (24) (2001)5710–5718.
[40] M.S. El-Bourawi, et al., A framework for better understanding membrane distil-lation separation process, J. Membr. Sci. 285 (1–2) (2006) 4–29.
[41] S. Srisurichan, R. Jiraratananon, A.G. Fane, Mass transfer mechanisms and trans-port resistances in direct contact membrane distillation process, J. Membr. Sci.277 (1–2) (2006) 186–194.
[42] A.O. Imdakm, T. Matsuura, Simulation of heat and mass transfer in direct contactmembrane distillation (MD): the effect of membrane physical properties,J. Membr. Sci. 262 (1–2) (2005) 117–128.
[43] M. Khayet, A. Velázquez, J.I. Mengual, Modelling mass transport through a po-rous partition: effect of pore size distribution, J. Non-Equilib. Thermodyn 29(3) (2004) 279–299.
[44] J. Phattaranawik, R. Jiraratananon, A.G. Fane, Effect of pore size distribution andair flux on mass transport in direct contact membrane distillation, J. Membr. Sci.215 (1–2) (2003) 75–85.
[45] L. Martínez, et al., Estimation of vapor transfer coefficient of hydrophobic porousmembranes for applications in membrane distillation, Sep. Purif. Technol. 33 (1)(2003) 45–55.
[46] A.O. Imdakm, T. Matsuura, A Monte Carlo simulation model for membrane dis-tillation processes: direct contact (MD), J. Membr. Sci. 237 (1–2) (2004) 51–59.
[47] M. Khayet, J.I. Mengual, G. Zakrzewska-Trznadel, Direct contact membrane distilla-tion for nuclear desalination. Part I: Review ofmembranes used inmembrane distil-lation and methods for their characterisation Int, Nucl. Des. 1 (4) (2005) 435–449.
[48] M. Khayet, T. Matsuura, Pervaporation and vacuum membrane distillation pro-cesses: Modeling and experiments, Ind. Eng. Chem. Res. 50 (2004) 1697–1712.
[49] J. Kong, K. Li, An improved gas permeation method for characterising and pre-dicting the performance of microporous asymmetric hollow fibre membranesused in gas absorption, J. Membr. Sci. 182 (1–2) (2001) 271–281.
[50] J. Phattaranawik, R. Jiraratananon, A.G. Fane, Heat transport and membrane dis-tillation coefficients in direct contact membrane distillation, J. Membr. Sci. 212(1–2) (2003) 177–193.
[51] C.A. Sperati, E.I. DuPont de Nemours, Polymer Handbook, in: J. Brandrup, E.H.Immergut (Eds.), second ed., John Wiley, USA, 1975.
[52] A.S. Jönsson, R. Wimmerstedt, A.C. Harrysson, Membrane distillation — a theo-retical study of evaporation through microporous membranes, Desalination 56(1985) 237–249.
[53] M. Khayet, et al., Design of novel direct contact membrane distillation mem-branes, Desalination 192 (1–3) (2006) 105–111.
[54] C. Feng, et al., Preparation and properties of microporous membrane from poly(-vinylidene fluoride-co-tetrafluoroethylene) (F2.4) for membrane distillation, J.Membr. Sci. 237 (1–2) (2004) 15–24.
[55] Y. Wu, et al., Surface-modified hydrophilic membranes in membrane distilla-tion, J. Membr. Sci. 72 (2) (1992) 189–196.
[56] N. Hengl, et al., Study of a newmembrane evaporator with a hydrophobic metal-lic membrane, J. Membr. Sci. 289 (1–2) (2007) 169–177.
[57] K.W. Lawson, M.S. Hall, D.R. Lloyd, Compaction of microporous membranes usedin membrane distillation. I. Effect on gas permeability, J. Membr. Sci. 101 (1–2)(1995) 99–108.
[58] A. Kullab, A. Martin, Membrane distillation and applications for water purifi-cation in thermal cogeneration plants, Sep. Purif. Technol. 76 (3) (2011)231–237.
[59] M. Khayet, A. Velázquez, J.I. Mengual, Direct contact membrane distillation ofhumic acid solutions, J. Membr. Sci. 240 (1–2) (2004) 123–128.
[60] S. Srisurichan, R. Jiraratananon, A.G. Fane, Humic acid fouling in the membranedistillation process, Desalination 174 (1) (2005) 63–72.
[61] P. Termpiyakul, R. Jiraratananon, S. Srisurichan, Heat and mass transfer charac-teristics of a direct contact membrane distillation process for desalination, Desa-lination 177 (1–3) (2005) 133–141.
[62] Z. Ding, R. Ma, A.G. Fane, A new model for mass transfer in direct contact mem-brane distillation, Desalination 151 (3) (2003) 217–227.
[63] R.W. Schofield, et al., Factors affecting flux in membrane distillation, Desalina-tion 77 (1990) 279–294.
[64] A. El-Abbassi, et al., Concentration of olive mill wastewater by membrane distil-lation for polyphenols recovery, Desalination 245 (1–3) (2009) 670–674.
[65] Y. Yun, et al., Direct contact membrane distillation mechanism for high concen-tration NaCl solutions, Desalination 188 (1–3) (2006) 251–262.
[66] K. Sakai, et al., Effects of temperature and concentration polarization on watervapour permeability for blood in membrane distillation, Chem. Eng. J. 38 (3)(1988) B33–B39.
[67] H. Kurokawa, et al., Vapor permeate characteristics of membrane distillation,Sep. Sci. Technol. 25 (13) (1990) 1349–1359.
[68] M. Khayet, P. Godino, J.I. Mengual, Nature of flow on sweeping gas membranedistillation, J. Membr. Sci. 170 (2) (2000) 243–255.
[69] M. Khayet, P. Godino, J.I. Mengual, Theory and experiments on sweeping gasmembrane distillation, J. Membr. Sci. 165 (2) (2000) 261–272.
[70] Y. Fujii, et al., Selectivity and characteristics of direct contact membrane distilla-tion type experiment. I. Permeability and selectivity through dried hydrophobicfine porous membranes, J. Membr. Sci. 72 (1) (1992) 53–72.
[71] M. Gryta, Concentration of saline wastewater from the production of heparin,Desalination 129 (1) (2000) 35–44.
[72] M.D. Kennedy, et al., Water treatment by microfiltration and ultrafiltration, in:A. Li, et al., (Eds.), Advance Membrane Technology and Application, JohnWiley, New Jersey, 2008.
[73] E. drioli,, V. Calabro, Y. Wu, Microporous membranes in membrane distillation,Pure Appl. Chem. 58 (12) (1986) 1657–1662.
[74] E. Drioli, Y. Wu, V. Calabro, Membrane distillation in the treatment of aqueoussolutions, J. Membr. Sci. 33 (3) (1987) 277–284.
[75] R.W. Schofield, A.G. Fane, C.J.D. Fell, Heat and mass transfer in membrane distil-lation, J. Membr. Sci. 33 (3) (1987) 299–313.
[76] L. Martínez, J.M. Rodríguez-Maroto, On transport resistances in direct contactmembrane distillation, J. Membr. Sci. 295 (1–2) (2007) 28–39.
[77] P. Godino, L. Peña, J.I. Mengual, Membrane distillation: theory and experiments,J. Membr. Sci. 121 (1) (1996) 83–93.
[78] S. Al-Obaidani, et al., Potential of membrane distillation in seawater desalina-tion: thermal efficiency, sensitivity study and cost estimation, J. Membr. Sci.323 (1) (2008) 85–98.
[79] R.W. Schofield, A.G. Fane, C.J.D. Fell, Gas and vapour transport throughmicroporousmembranes. II. Membrane distillation, J. Membr. Sci. 53 (1–2) (1990) 173–185.
[80] E. Cussler, Diffusion mass transfer in fluid systems, Second ed. Cambridge Uni-versity Press, 1997.
[81] C. Geankoplis, Transport Process and Separation Principles, Fourth ed. PrenticeHall, New Jersey, 2003.
[82] C.M. Guijt, et al., Modelling of a transmembrane evaporation module for desali-nation of seawater, Desalination 126 (1–3) (1999) 119–125.
[83] R.W. Schofield, A.G. Fane, C.J.D. Fell, Gas and vapour transport through micropo-rous membranes. I. Knudsen–Poiseuille transition, J. Membr. Sci. 53 (1–2)(1990) 159–171.
[84] A.G. Fane, R.W. Schofield, C.J.D. Fell, The efficient use of energy in membrane dis-tillation, Desalination 64 (1987) 231–243.
[85] L. Martínez, Comparison of membrane distillation performance using differentfeeds, Desalination 168 (2004) 359–365.
[86] V. Gekas, B. Hallström, Mass transfer in the membrane concentration polariza-tion layer under turbulent cross flow: I. Critical literature review and adaptationof existing Sherwood correlations to membrane operations, J. Membr. Sci. 30 (2)(1987) 153–170.
[87] C.M. Tun, et al., Membrane distillation crystallization of concentrated salts-fluxand crystal formation, J. Membr. Sci. 257 (1–2) (2005) 144–155.
[88] G.L. Liu, et al., Theoretical and experimental studies on air gap membrane distil-lation, Heat and Mass Transfer 34 (4) (1998) 329–335.
[89] A.M. Alklaibi, N. Lior, Transport analysis of air-gap membrane distillation,J. Membr. Sci. 255 (1–2) (2005) 239–253.
[90] M.N. Chernyshov, G.W. Meindersma, A.B. de Haan, Modelling temperature andsalt concentration distribution in membrane distillation feed channel, Desalina-tion 157 (1–3) (2003) 315–324.
17A. Alkhudhiri et al. / Desalination 287 (2012) 2–18
[91] R. Brid, w. Stewart, E. Lightfoot, Transport Phenomena, Second ed. John Wiley,2001.
[92] S. Bouguecha, R. Chouikh, M. Dhahbi, Numerical study of the coupled heat andmass transfer in membrane distillation, Desalination 152 (1–3) (2003) 245–252.
[93] F.A. Banat, et al., Application of Stefan-Maxwell approach to azeotropic separa-tion by membrane distillation, Chem. Eng. J. 73 (1) (1999) 71–75.
[94] F.A. Banat, et al., Theoretical investigation of membrane distillation role inbreaking the formic acid-water azeotropic point: comparison between Fickianand Stefan-Maxwell-based models, Int. Commun. Heat Mass Transf. 26 (6)(1999) 879–888.
[95] S. Bandini, A. Saavedra, G.C. Sarti, Vacuum membrane distillation: Experimentsand modeling, AIChE Journal 43 (1997) 398–408.
[96] J.I. Mengual, M. Khayet, M.P. Godino, Heat and mass transfer in vacuum mem-brane distillation, Int. J. Heat Mass Transf. 47 (4) (2004) 865–875.
[97] L. Martinez-Diez, M.I.V. Gonzalez, Effects of polarization on mass transportthrough hydrophobic porous membranes, Ind. Eng. Chem. Res. 37 (10) (1998)4128–4135.
[98] M. Sudoh, et al., Effects of thermal and concentration boundary layers on vaporpermeation in membrane distillation of aqueous lithium bromide solution,J. Membr. Sci. 131 (1–2) (1997) 1–7.
[99] L. Martínez-Díez, M.I. Vázquez-Gonzàlez, Temperature polarization in masstransport through hydrophobic porous, membranes, AIChE Journal 42 (1996)1844–1852.
[100] L. Martínez, J.M. Rodríguez-Maroto, Effects of membrane and module design im-provements on flux in direct contact membrane distillation, Desalination 205(1–3) (2007) 97–103.
[101] L. Martínez-Díez, M.I. Vázquez-González, Temperature and concentration polar-ization in membrane distillation of aqueous salt solutions, J. Membr. Sci. 156 (2)(1999) 265–273.
[102] J. Phattaranawik, R. Jiraratananon, Direct contact membrane distillation: effectof mass transfer on heat transfer, J. Membr. Sci. 188 (1) (2001) 137–143.
[103] M. Qtaishat, et al., Heat and mass transfer analysis in direct contact membranedistillation, Desalination 219 (1–3) (2008) 272–292.
[104] M. Gryta, M. Tomaszewska, Heat transport in the membrane distillation process,J. Membr. Sci. 144 (1–2) (1998) 211–222.
[105] V. Calabrò, E. Drioli, F. Matera, Membrane distillation in the textile wastewatertreatment, Desalination 83 (1–3) (1991) 209–224.
[106] M. Gryta, M. Tomaszewska, A.W. Morawski, Membrane distillation with laminarflow, Sep. Purif. Technol. 11 (2) (1997) 93–101.
[107] T.-C. Chen, C.-D. Ho, H.-M. Yeh, Theoretical modeling and experimental analysisof direct contact membrane distillation, J. Membr. Sci. 330 (1–2) (2009)279–287.
[108] M.A. Izquierdo-Gil, M.C. García-Payo, C. Fernández-Pineda, Air gap membranedistillation of sucrose aqueous solutions, J. Membr. Sci. 155 (2) (1999) 291–307.
[109] M. Tomaszewska, M. Gryta, A.W. Morawski, A study of separation by the direct-contact membrane distillation process, Sep. Technol. 4 (4) (1994) 244–248.
[110] M.A. Izquierdo-Gil, C. Fernández-Pineda, M.G. Lorenz, Flow rate influence on di-rect contact membrane distillation experiments: different empirical correlationsfor Nusselt number, J. Membr. Sci. 321 (2) (2008) 356–363.
[111] G.C. Sarti, C. Gostoli, S. Matulli, Low energy cost desalination processes using hy-drophobic membranes, Desalination 56 (1985) 277–286.
[112] S. Bandini, C. Gostoli, G.C. Sarti, Role of heat and mass transfer in membrane dis-tillation process, Desalination 81 (1–3) (1991) 91–106.
[113] L. Martínez-Díez, F.J. Florido-Díaz, M.I. Vázquez-González, Study of evaporationefficiency in membrane distillation, Desalination 126 (1–3) (1999) 193–198.
[114] A. Criscuoli, M.C. Carnevale, E. Drioli, Evaluation of energy requirements inmembrane distillation, Chem. Eng. Process. Process Intensif. 47 (7) (2008)1098–1105.
[115] Z. Ding, et al., Analysis of a solar-powered membrane distillation system, Desa-lination 172 (1) (2005) 27–40.
[116] P.A. Hogan, et al., Desalination by solar heated membrane distillation, Desalina-tion 81 (1–3) (1991) 81–90.
[117] S. Shirazi, C.-J. Lin, D. Chen, Inorganic fouling of pressure-driven membrane pro-cesses -A critical review, Desalination 250 (1) (2010) 236–248.
[118] M. Gryta, Long-term performance of membrane distillation process, J. Membr.Sci. 265 (1–2) (2005) 153–159.
[119] M. Gryta, Fouling in direct contact membrane distillation process, J. Membr. Sci.325 (1) (2008) 383–394.
[120] M. Matheswaran, et al., Factors affecting flux and water separation performancein air gap membrane distillation, J. Ind. Eng. Chem. 13 (6) (2007) 965–970.
[121] M. Safavi, T. Mohammadi, High-salinity water desalination using VMD, Chem.Eng. J. 149 (1–3) (2009) 191–195.
[122] S. Kubota, et al., Experiments on seawater desalination by membrane distilla-tion, Desalination 69 (1) (1988) 19–26.
[123] H. Udriot, A. Araque, U. von Stockar, Azeotropic mixtures may be broken bymembrane distillation, Chem. Eng. J. Biochem. Eng. J. 54 (2) (1994) 87–93.
[124] Z. Xiuli, et al., Mathematical model of gas permeation through PTFE porousmembrane and the effect of membrane, Chinese J. Chem. Eng. 11 (4) (2003)383–387.
[125] E. Drioli, Y. Wu, Membrane distillation: an experimental study, Desalination 53(1–3) (1985) 339–346.
18 A. Alkhudhiri et al. / Desalination 287 (2012) 2–18