membership has its privileges – the effect of membership ... · political economy of...
TRANSCRIPT

Membership has its Privileges – The Effect of Membership in International
Organizations on FDI
Axel Drehera
Heiner Mikoschb
Stefan Voigtc
October 2010
Abstract: We argue that membership in International Organizations (IOs) is an important
determinant of FDI inflows. To the extent that membership restricts a country from pursuing
policies that are harmful to investors, it can signal low political risk. Using data over the 1971-
2005 period, we find that membership in IOs does indeed increase inflows of FDI. Controlling
for the endogeneity of membership, we find this effect to be substantively important and robust
to the method of estimation.
Paper to be presented at the 5th Annual Meeting of the International Political Economy Society
at Harvard University, Cambridge MA, November 12-13, 2010.
Key words: Membership in International Organizations, FDI, Investment Climate, Political Risk, Signaling, Separating Equilibrium. JEL classification: F02, F21, H11, K33, P26 Acknowledgements: We thank Martin Gassebner, participants in the 3rd Conference on the Political Economy of International Organizations (Washington, DC, 2010), in particular Dan Nielson and Songying Fang, and the annual meeting of the European Public Choice Society 2010 for their helpful comments and Scott Jobson for excellent research assistance.
a Georg-August University Goettingen, Platz der Goettinger Sieben 3, 37073 Goettingen, Germany, KOF Swiss Economic Institute, Switzerland, IZA and CESifo, Germany, e-mail: mail[at]axel-dreher.de. b KOF Swiss Economic Institute, ETH Zurich, Weinbergstrasse 35, 8092 Zurich, Switzerland, e-mail: mikosch[at]kof.ethz.ch. c Institute of Law & Economics, University of Hamburg, Rothenbaumchaussee 36, 20148 Hamburg, Germany and CESifo, Germany, e-mail: stefan.voigt[at]uni-hamburg.de.

2
1 Introduction
Membership in international organizations is often considered to have beneficial consequences
for their member countries, as well as for the international community at large. The World Trade
Organization (WTO) is supposed to enhance international trade, the International Monetary Fund
(IMF) is supposed to stabilize the international financial system, and the United Nations (UN) is
supposed to increase security and peace, to name but a few possible examples. But what do we
really know about the consequences of being a member in international organizations? There is
evidence that membership in international organizations bares direct benefits: For example,
temporary members of the UN Security Council receive larger loans from the United States, as
well as more programs and projects from the IMF and the World Bank (Kuziemko and Werker
2006, Dreher, Sturm and Vreeland 2009a, 2009b). Countries serving on the Board of Executive
Directors at the World Bank receive substantially larger credits than other countries (Kaja and
Werker 2010). According to Schneider (2010), European Union (EU) governments attempting to
increase their re-election prospects can increase their country’s share in the EU’s budget prior to
an election. Fang and Owen (2009) find that especially non-democracies use IMF status as a
commitment device. In this paper, we ask a related question, namely whether membership in
international organizations (IOs) increases inflows of foreign direct investment (FDI).
Foreign direct investment (FDI) brings about great opportunities but also substantial
risks. Thus, before important investment decisions are made, potential investors regularly look
for information regarding not only production conditions in various locations, but also with
respect to political risks. Many political decisions have direct effects on the profitability of direct
investments. These include not only the abolition of property rights but also the watering down
of these rights such as caps on the transferability of profits, on pricing, being taxed and so on. In
this paper we argue that membership in international organizations can affect such policies.
Consider an international organization or convention that promotes good investment
conditions, such as protection of property rights, and non-discrimination of various kinds. The
extent to which membership or ratification implies that deviation from the IO’s requirements will
result in sanctions or harm the reputation of the government gives a credible promise of investor-
friendly policies. We argue that compliance with the IOs’ requirements is more costly for
countries with ex ante high political risk than for countries with low political risk. This is
because it is generally more difficult for high-risk countries to comply with many of the IOs’

3
policies. In order to qualify for membership or ratification, high-risk countries would need to
either change their actual policies (i.e., comply with the IOs’ policies) or engage in substantial
efforts to fake compliance. Both strategies entail costs. Consequently, we would expect countries
with low risk are more likely to be members of IOs. IO membership is thus a signal of low risk.
Using data over the 1971-2005 period, we find that membership in IOs does indeed increase
inflows of FDI. Controlling for the endogeneity of membership, we find the effect to be
substantively important and robust to the method of estimation. Specifically, an increase in the
level of our indicator of IO membership by 0.1 (on a scale from 0 to 1) increases FDI inflows by
between 4.5 and 6.4 percent. We also find that countries cannot increase FDI inflows by joining
IOs if they have a low level of directly observable political risk. The intuition behind this result
is that such countries do not reveal any new information to foreign investors by attaining
membership in an IO.
We proceed as follows: In Section 2, we motivate the empirical analysis with a simple
signaling model. Section 3 describes the data, while Section 4 reports the results. Section 5
concludes and discusses the policy implications of our analysis.
2 The model
How appealing a country is for foreign investors usually depends on various interrelated factors.
One of these factors is what can be labeled as “country risk” or “political risk.” The term refers
to the likelihood that politically-induced changes in the business environment adversely affect
the profitability of doing business in a country. For instance, financial factors such as currency
controls, devaluation or regulatory changes, institutional factors such as an increase in corruption
or social factors such as mass riots or civil war contribute to a company’s operational risk.
Foreign investors can acquire information about a country‘s political risk by analyzing
the experiences of former investors, or by consulting publically available media information or
professional political risk rankings. However, this kind of information only provides foreign
investors with a noisy or imperfect signal about a country‘s actual political risk. Low-risk
countries will want to provide an additional signal about their investment conditions. In this
paper, we argue that one way countries can signal low political risk is by joining international
organizations, or ratifying conventions which fulfill the following criteria: First, the
organization/convention promotes good investment conditions. Basics for good investment

4
conditions, such as strong protection of property rights, non-discrimination of various kinds etc.
are a prerequisite for membership or ratification. Second, membership/ratification entails a
credible commitment to the sanctioning of countries which deviate from their responsibilities as
members.1
In the following, we illustrate formally how countries can use international
organizations/conventions to provide a signal about their investment conditions. Let us assume
there is a foreign investor who has to choose among different countries. There exist two types of
countries, one with low political risk, another one with high political risk. The fraction of
countries with low political risk is denoted by . If the investor invests in a country with low
(high) political risk, her expected profit is ), where 0. Now, consider the
following multistage game with the investor and one country.
At stage 1 the country is privately aware of its type, while the investor is unable to
observe this. The investor only knows the probability that the country is of low political risk,
, i.e., the investor knows that and 1 .
At stage 2 the country chooses a level of membership in international organizations, ,
between and . Becoming and being member in international organizations entails costs. We
then denote the cost of membership to country of type by , , where , .
Assume that , has the following properties:
• 0, 0,
• ⁄ 0,
• ⁄ 0,
• ⁄ 0,
• ⁄ 0.
The first property is not problematic: Non-membership entails no costs. The second and third
properties are also straight-forward: Costs as well as marginal costs increase with the level of
membership. The fourth property means that marginal costs decrease in . This property is
known as the Spence-Mirrlees condition or single-crossing property. We will come back to it
1 For sake of brevity in the following sections of the paper we will only speak of (membership in) international organizations. The whole argument applies equally to (ratification of) international conventions.

5
later. The fifth property implies that membership costs for countries with low political risk are
lower than for countries with high political risk. This central assumption can be rationalized as
follows. Normally, high-risk countries do not fulfill the organizations’ membership
requirements, or do so to a lesser degree than low-risk countries (In fact, this is exactly the
reason why high-risk countries are considered as high-risk and low-risk countries as low-risk). In
order to qualify for membership, high-risk countries would need to either change their actual
policies (i.e., start complying), or make efforts to fake compliance. Both strategies entail costs. In
contrast, low-risk countries fulfill the membership requirements anyhow, at least more than high-
risk countries do. Hence, compliance is less costly for them.
At stage 3, the investor observes , forms a belief that the country has a low political risk
with probability , and pays a tax 1 . The amount
of is the result of a bargaining process between the investor and the country, and denotes a
mark-up (or mark-down), which is dependent on the country‘s bargaining power. Note that if the
investor could perfectly observe the country‘s type, they would pay if the country
had a low political risk and if the country had a high political risk.2 The higher the
country‘s bargaining power, the higher will be. The bargaining power depends on several
factors, most notably on how suitable alternative countries are for investment. Although the issue
is important from a global perspective, it is not particularly relevant for our model. Furthermore,
note that in the absence of signaling, the investor pays 1 .3
Graph 1 shows the country‘s preference map, both for the case when it has a low political
risk or a high political risk. It depicts the indifference curves between higher (but costly)
membership and higher (and utility increasing) tax revenue. The higher the political risk in a
country, the steeper the indifference curves are. Suppose that at any point in the diagram, the
country increases its level of . As argued above, this action entails higher costs when the
country has a high political risk. Hence, in order for its utility to remain unchanged, i.e., in order
to stay on the same indifference curve, it has to be compensated with a higher tax increase if it
has a high political risk. Note that the fourth property from above assures that any two high- and
low-risk indifference curves only cross once. This is why the property is known as single-
crossing property.
2 In the first case 1, in the latter 0. 3 In this case .

6
What are the equilibria in this game? If we look at perfect Bayesian equilibria, things are
rather messy. First, there is a multiplicity of separating equilibria. These equilibria are shown in
graph 2. All we know is that in any separating equilibrium, the level of membership of a high-
risk country, m θHR , equals zero and the level of membership of a low-risk country, m θLR ,
lies between and . denotes the level of implicitly determined by U m 0, τ
µ θHR U m , τ µ θLR , where UHR . is the utility of a high-risk country.
denotes the level of implicitely determined by U m 0, τ µ θHR U m ,
τ µ θLR , where ULR . is the utility of a low-risk country. In short, any separating
equilibrium satisfies m θHR 0, and m θLR . Second, there is a multiplicity of
pooling equilibria (see graph 3). The only thing we can say is that any m in 0, can be
sustained as a pooling equilibrium. Note that the equilibrium with m 0 pareto-dominates the
other pooling equilibria, as there is no deadweight loss from inefficient membership in
international organizations. This equilibrium is the same as the no-signaling equilibrium.
The multiplicity of equilibria is due to the fact that in the classical Nash or perfect
Bayesian equilibrium concept, the players’ (here the investors’) beliefs are unrestricted off the
equilibrium path. This seems counter-intuitive. If we apply the Cho-Kreps Intuitive Criterion
(see Cho-Kreps, 1987, Fudenberg and Tirole, 1991) to our model, things turn out to be quite
different. Consider, for instance, the pooling equilibrium in graph 4. The high-risk country would
be strictly worse off by choosing , instead of , whatever belief, , the
investor has. Therefore, the Cho-Kreps Intuitive Criterion requires that 1 for
, . Given this, the low-risk country is no longer acting optimally by choosing .
Hence, the pooling equilibrium is destroyed. This rationale applies to all pooling equilibria. In
short, none of the pooling equilibria survive the Cho-Kreps Intuitive Criterion.4 Next, consider
the separating equilibrium in graph 5. is a tax schedule supporting this equilibrium
(Obviously there is a multiplicity of alternative tax schedules supporting the equilibrium). The
high-risk country would be strictly worse off by choosing , , whatever belief,
, the investor has. Therefore, the Cho-Kreps Intuitive Criterion requires that 1 for
, . Given this, the low-risk country is no longer acting optimally by choosing
(This implies the tax schedule is actually not as drawn in graph 5). Hence, the 4 To better understand the Cho-Kreps Intuitive Criterion, consider the following intuition. The low-risk country knocks out every pooling equilibrium by convincing the investor that, by deviating from the equilibrium level, , to another level , , it proofs that it must be a low-risk country, hence, deserves .

7
separating equilibrium is destroyed. This rationale applies to all separating equilibria except one.
Therefore, bar this exception, none of the separating equilibria survive the Cho-Kreps Intuitive
Criterion.
The only equilibrium that survives the Cho-Kreps Intuitive Criterion is displayed in graph
6. It is known as the Spence equilibrium. A high-risk country chooses a zero level of
membership, 0. In contrast, a low-risk country chooses the level of membership
which is sufficiently large enough to remove the incentive for a high-risk country to mimic a
low-risk country, . Thus, if the investor observes the country choosing ,
they receive a credible signal that it must be a low-risk country, whereas if they observe the
country choosing 0, they know it must be a high-risk country. Or, in formal terms,
1 and 0 0. Consequently, the investor can discriminate regarding tax
payments: In equilibrium, the high-risk country receives a tax τ θHR µ θHR, and the low-
risk country receives a tax τ θLR µ θLR. Note that there is a multiplicity of belief and tax
schedules supporting the equilibrium. A special belief schedule is 0 for 0 m
and 1 for m. The corresponding tax schedule is τ m µ θHR for 0 m
and τ m µ θHR for m. An alternative tax schedule is displayed in graph 6.
Importantly, although the Spence equilibrium is the most efficient among all separating
equilibria, it is not necessarily pareto-optimal. Consider for instance, the case displayed in graph
7. A low-risk country is certainly worse off in the Spence equilibrium than in the pooling
equilibrium with 0. Notably, so too is a high-risk country. This case is most likely for high
. A small share of high-risk countries is enough to induce the low-risk countries to incur costs
of membership in international organizations, in order to separate themselves from the high-risk
countries. Welfare could be improved by prohibiting international organizations – at least in the
world of our simple model, where we assumed that membership in international organizations is
of no value, other than for signaling.
To sum up, drawing on a simple signaling model we have shown that there exists only
one stable equilibrium outcome in which countries with low political risk become members of
international organizations, whereas countries with high political risk stay out. The reason for
this outcome is that by becoming a member of international organizations, low-risk countries can
separate themselves from high-risk countries and signal to investors that they are indeed of low
political risk. Because of this, once investors observe that a country is a member, they know,

8
ceteris paribus, that it is a better investment location than a country which is non-member.
Consequently, member countries should possess higher levels of foreign direct investment than
non-member-countries, ceteris paribus. This leads us to the following, empirically testable,
hypotheses:
H1: Countries with a higher level of membership in international organizations receive
higher foreign direct investment than countries with a lower level of membership.
H2: When controlling for publically available information on a country's political risk,
the relationship between membership and foreign direct investment still holds.
An important additional question is whether international delegation via membership in
international organizations can serve as a substitute for good domestic institutions. We can
analyze this question in the context of our study. As stated above, publically available
information, such as media content or professional political risk rankings, contains only a noisy
or imperfect signal about a country’s political risk. However, the degree of imperfection is likely
to vary across countries. For some countries, such as the United States or Sweden for example,
publically available information on political risk constitutes a signal which investors perceive to
be sufficiently precise. The very low country risk in these countries is most probably open and
reliable information. Consequently, membership will not reveal any new information to foreign
investors, thus these countries will not be able to attract more foreign direct investment by
becoming a member in international organizations. (Naturally this does not mean that there are
not other reasons for such countries to become members.) In contrast, in countries such as
Panama or Tunisia, the signal which investors can draw from publically available information on
political risk is less precise. Therefore, once one of these countries becomes a member, foreign
investors will gain an additional and valuable signal that its political risk is actually not as high
as the risk of a comparable country which is not a member. This might persuade foreign
investors to invest in the member country rather than in a comparable country which is not a
member. We can condense this argument into the following hypothesis.

9
H3: The lower a country’s directly observable degree of political risk, the lower is the
marginal effect of membership in international organizations on foreign direct
investment.
Membership in international organizations does not only serve to signal low political risk, but
also to mitigate the problem of time inconsistency. Before an investment is made, any
government has an incentive to promise the complete implementation of property rights. Once
the investment has been made however, government incentives are different: it could be tempted
to reduce, or even ignore, these property rights to benefit itself. Rational investors anticipate this
and do not invest unless the government possesses the ability to turn simple promises into
credible commitments. Given that international organizations can make property rights more
secure and non-compliance is sanctioned, membership in international organizations can serve as
a commitment device which fosters foreign direct investment. Sanctioning can be both formal
(e.g., by the international organizations themselves) and informal (e.g., loss of reputation for a
country’s government).
3 Data and Method
Our model largely follows Tobin and Rose-Ackermann (2010). The dependent variable is (log)
foreign direct investment net inflows in constant 2000 US dollars, taken from the World
Development Indicators (2008).
Rather than testing the impact of membership in single international organizations on
FDI, we are interested in how a country’s level of membership in international organizations
affects its FDI inflows. A general indicator measuring “membership” could consist of counting
the number of inter-governmental IOs that a country is member of (in a particular year), then
comparing them with the membership numbers of other countries. However, this is an overly
crude indicator with definite disadvantages. Some countries appear to be “more integrated”
simply because they are located in areas of the world that have more regional IOs. This indicator
would therefore contain serious bias. Furthermore, no distinction whatsoever is made between
the substantive areas in which IOs are active, i.e., IOs like international financial institutions or
the WTO are counted in the same way as IOs that have nothing to do with property rights, or are
even inimical to their protection. Different degrees of membership, which might indicate

10
different degrees of “earnestness” in membership, are not taken into account in this approach
either; whether a state has ratified additional conventions within the realm of an IO would be
valuable information that is not included in this very simple indicator.
To construct a proxy for the membership level which is in line with our theory, rather
than just taking any international organization into account, we confine the analysis to
organizations which fulfill the following criteria:
• The organization promotes good investment conditions. Basics for good investment
conditions, such as strong protection of property rights, are a prerequisite for membership
or ratification.
• Deviating countries are sanctioned.
• Actors are endowed with standing before international dispute settlement mechanisms.
• The organization is active/accessible globally.
The first criterion ensures that investors care about the organizations. The second and third
criteria ensure that membership involves credible commitments, rather than being mere window-
dressing. As we analyze a worldwide country panel below, the fourth criterion, which allows for
international comparison, is also required.
Dreher and Voigt (2008) collected data on membership in the following
organizations/ratification of the following conventions. Each of these organizations/conventions
matches the above criteria.
• General Agreement on Tariffs and Trade (GATT)/World Trade Organization (WTO)
• International Center for the Settlement of Investment Disputes (ICSID), a sub-
organization of the World Bank: In order to join the ICSID, countries must explicitly
agree to have their behavior monitored by third parties. Membership in the ICSID gives
private investors who believe that a member country did not comply with its contractual
obligations the possibility to file suit against the country. The sanction mechanism is
strengthened by the fact that all member countries are required to enforce any arbitral
award.
• International Finance Corporation (IFC), another sub-organization of the World Bank:
The aim of the IFC is to promote private enterprise by improving the investment climate.

11
• UN International Convention for Civil and Political Rights (ICCPR): The ICCPR
guarantees basic individual rights; some of these rights are preconditions for secure
property rights (freedom from torture and slavery, right to personal freedom and
security), others are important aspects of the rule of law (right to a fair trial, prohibition
of ex post facto laws etc.). The convention is endowed with a supervisory committee
which monitors compliance.
• UN International Convention for Economic, Social and Cultural Rights (ICESCR): The
convention includes standards such as the right to work, the right to social security, the
right to an adequate standard of living and the right to “the highest attainable standard of
physical and mental health.” The ICESCR is also endowed with a supervisory committee
which monitors compliance.
• The UN’s so-called Optional Protocol (OP): By subscribing to the OP, countries promise
to abolish capital punishment. Despite ratification of the protocol not directly being
related to property rights, investors may interpret it as a signal of a country’s earnestness
to comply with the rules it has agreed upon.
• UN Convention on the Recognition and Enforcement of Foreign Arbitral Awards (“New
York Convention”) (NYC): The NYC specifies conditions under which countries promise
to accept and enforce arbitration awards which are issued by international or transnational
courts.
• UN Convention against Torture and Other Cruel, Inhuman or Degrading Treatment or
Punishment (CAT): The CAT guarantees basic human rights. Complying with these rights
is a necessary (albeit not sufficient) condition for the protection of property rights.
Dreher and Voigt (2008) construct binary dummy variables which indicate for every individual
organization/convention whether or not a country is a member. They add the dummy variables
for all organizations, resulting in a country-specific index of membership in international
organizations. Note that such summation implies that every organization gets equal weight. For
the sake of convenience, Dreher and Voigt normalize the indicator to a range from zero to one.
We adopt this index as a proxy for a country’s level of membership in international
organizations.

12
Our regressions are pooled time-series cross-section analyses (panel data), covering the
period 1971-2005. Fixed country and time effects are significant at the one percent level in all
estimated model specifications. We use robust standard errors clustered at the country level.
Since some of the data are not available for all countries or years, the panel data are unbalanced
and the number of observations depends on the choice of explanatory variables. We include a lag
of the dependent variable, which turned out to be highly significant according to most
specifications. The basic equation takes the following form:
, , , , , , (1)
where , represents log of FDI net inflows in country at year , and , is the (lagged)
measure of membership in international organizations. , is the vector of control variables,
and represent country and year fixed effects respectively, while , represents the disturbance.
In choosing our control variables, we follow Tobin and Rose-Ackermann (2010) and
include (log) population, (log) per capita GDP, (log) per capita GDP growth and a country’s
openness to trade (measured as the sum of exports and imports as a percentage of GDP). The
variables are taken from the Penn World Tables (Version 6.2). We also control for (directly
observable) political risk, employing the risk rating from the International Country Risk Guide
(ICRG) of the PRS Group. The index assesses political risk based on 12 indicators, ranging from
zero (high risk) to 100 (low risk).5 This index is available over the 1984-2005 period. Arguably,
a lower degree of political risk is likely to increase FDI inflows. Appendix A shows the exact
definitions of all variables with their sources, while Appendix B reports descriptive statistics.
The next section presents the results.
4 Results
Table 1 shows the results for the basic setup, including fixed country and year effects. Column 1
excludes the indicator of membership in international organizations and our index of institutional
quality. The results are in line with the previous literature. At the one percent level, FDI net
inflows increase with the size of inflows in the previous year. FDI inflows also increase with per
capita GDP and its growth rate, and openness to trade, at least at the ten percent level of
significance. Quantitatively, an increase in the previous year’s inflows by one percent increases 5 Specifically, the index includes indices on Government Stability, Socioeconomic Conditions, Investment Profile, Internal Conflict, External Conflict, Corruption, Military in Politics, Religious Tensions, Law and Order, Ethnic Tensions, Democratic Accountability, and Bureaucracy Quality.

13
FDI by more than 0.5 percent. The elasticity for per capita GDP is slightly lower (0.46), and an
increase in the GDP growth rate by one percentage point increases FDI inflows by 47 percent.
An increase in trade openness (as a percentage of GDP) by one percentage point increases FDI
inflows by 0.5 percent. Population size, on the contrary, does not affect FDI flows at
conventional levels of significance.
In column 2 we include our index of membership in international organizations. While
column 2 focuses on the broadest sample available, column 3 replicates the regression for those
observations where we also have data on political risk. This is to alleviate comparison with
column 4, where the ICRG index for the absence of political risk is included in addition. The
number of observations decreases from more than 3,000 to less than 2,000 due to its inclusion. In
particular, we lose all years prior to 1985, for which this (lagged) index is not available.6 Finally,
in column 6 we interact the ICRG rating with the IO membership index to test whether the
marginal effect of IO membership on FDI decreases or increases with a country’s directly
observable degree of political risk (see hypothesis 3 of section 2).
FDI inflows are positively correlated with membership in international organizations at
the five percent level of significance. Quantitatively, the coefficients of columns 2-4 imply that
an increase in the membership index by 0.1 (on the 0-1 scale) increases FDI inflows by between
4.5 percent and 6.4 percent. Compared to the effects of the other covariates in the model, this
effect is substantial.7 These results render first support for our signaling model from section 2. It
seems that countries can indeed signal a low political risk by joining international organizations,
thereby increasing FDI inflows. According to column 4, FDI inflows also increase with the
absence of political risk at the ten percent level of significance. The coefficient shows that an
increase in the index by 1 point (on the 0-100 scale) increases FDI by almost 1 percent. When we
interact the ICRG index with the membership index, we find a negative and significant effect at
the ten percent level. We illustrate the quantitative impact and the statistical significance across
the range of the political risk index in Figure 1.
6 Note that we test for the robustness of our results using alternative indices below. Some of these indices span a broader period of time. 7 Note that with the inclusion of the IO index, the effect of population becomes significant at the ten percent level. However, while the negative coefficient is surprising, the effect is not robust across the different specifications shown in Table 1.

14
Figure 1: Marginal effect of IO membership corresponding to Table 1, column 5
The figure shows that membership in international organizations and the absence of
directly observable political risk are substitutes rather than complements. According to the 90
percent confidence interval, FDI is no longer significantly affected by membership in
international organizations when the political risk index exceeds a level of about 60. For values
below 60, the marginal effect of IO membership is positive and significant at the ten percent
level, but decreases quantitatively with lower risk. This finding supports hypothesis 3 in section
2 of the paper. In Table 2 we test for the potential endogeneity of membership in international
organizations. We replicate the analysis by employing 2SLS (excluding column 1, where the IO
variable has not been included). Regarding the choice of instrumental variables, Rose (2004a)
suggests measures of democracy, polity, and civil rights as instruments for membership in the
World Trade Organization (WTO). However, he contends that these variables provide a poor fit
in the first stage of his IV regressions. In Rose (2004b), when focusing on the impact of WTO
membership on trade volatility, he uses a country’s score on the Polity index as an instrument for
General Agreement on Tariffs and Trade (GATT)/WTO membership. This is done to tackle
simultaneity bias and measurement error. Arguably, more democratic countries are more likely
-2-1
01
23
Mar
gina
l Effe
ct o
f IO
mem
bers
hip
20 40 60 80 100
ICRG Political Risk Rating (0 = high risk)
Dependent Variable: net FDI inflows
Marginal effect of IO membership on FDI as Political Risk changes

15
to become members of international organizations.8 Therefore, we also use the Polity score here.
In addition, we employ the number of embassies located in a country and a country’s
contribution to United Nations’ Peacekeeping Operations (personnel relative to population size)
as instrumental variables. Both variables have been suggested in Dreher, Gaston and Martens
(2008) as a proxy for political integration and are likely to affect membership in international
organizations also (but are unlikely to affect FDI).9
Testing for the quality of our instrumental variables (in column 2), a first-stage F-test of
13.39 indicates some power in our instruments. The Anderson canonical correlation likelihood
ratio statistic indicates that underidentification is no issue here (p-value 0.00) and the Hansen test
does not reject the overidentification restrictions at conventional levels of significance (p-value
of 0.42). Similarly, in columns 3 and 4 the instruments are also not rejected.
Before turning to the results of the 2SLS estimates, we perform Wooldridge’s (1995)
robust score chi-square and robust regression-based F-tests to check for the endogeneity of
membership in international organizations, employing the instruments just described.10
According to column 1, where we focus on the broadest sample available, the exogeneity of
membership cannot be rejected at conventional levels of significance. However, columns 2-4,
which focus on the smaller sample and include the political risk index and its interaction with IO
membership, show that exogeneity is clearly rejected.
The results show that the coefficient of membership remains significant, at least at the ten
percent level. However, it substantially increases in size. Specifically, according to the estimates
in columns 2 and 3, an increase in the membership index by 0.01 increases FDI inflows by more
than 5 percent. Interestingly, FDI inflows are not significantly affected by the absence of directly
observable political risk once we allow for the endogeneity of IO membership.
Figure 2 reports the marginal effect of IO membership on FDI inflows, based on the
ICRG rating. As can be seen, the marginal effect is again positive and significant at the ten
percent level for index values below about 60, but no longer statistically significant at
8 To qualify as an instrument, democracy has to have no direct effect on FDI. Controlling for the quality of institutions, we see no reason to expect there is one. We will show further below that this conjecture holds true. 9 One might argue that the number of embassies and membership in international organizations are driven by the same underlying variables proxying for “political openness.“ While controlling for fixed country and year effects we doubt this is the case, we can only rely on the usual test statistics on these instruments (that are reported below). 10 These tests replace the usual Durbin and Wu-Hausman tests when 2SLS comes with Eicker-Huber-White standard errors in order to account for heteroskedasticity.

16
conventional levels for better institutional quality. This result confirms hypothesis 3 in section 2
regarding the substitutive relationship between IO membership and political risk.
Figure 2: Marginal effect of IO membership corresponding to Table 2, column 4
While the usual specification tests do not reject the external instruments suggested above,
we acknowledge that some readers might remain skeptical about their validity. We therefore
proceed with employing internal, rather than external, instruments and employ the GMM
estimator as suggested by Arellano and Bond (1991), Arellano and Bover (1995) and Blundell
and Bond (1998). This also addresses a potential Nickell bias due to the inclusion of country
fixed effects and the lagged dependent variable in a short panel (Nickell 1981). Results are based
on the two-step estimator implemented by Roodman (2005) in Stata, including Windmeijer’s
(2005) finite sample correction.
In order to avoid an explosion of the number of instruments, we tried to keep the number
of variables that we take to be endogenous as small as possible. However, the specification tests
do not accept the specifications unless the rate of economic growth is treated as endogenous in
addition to the lag of the dependent variable. Once we collapse the matrix of instruments, as
suggested in Roodman (2006), the number of instruments seems acceptably low, as indicated in
-15
-10
-50
510
15M
argi
nal E
ffect
of I
O m
embe
rshi
p
20 40 60 80 100
ICRG Political Risk Rating (0 = high risk)
Dependent Variable: net FDI inflows
Marginal effect of IO membership on FDI as Political Risk changes

17
Table 3. The Hansen test on the validity of the instruments used (amounting to a test for the
exogeneity of the covariates), and the Arellano-Bond test of second order autocorrelation (which
must be absent from the data in order for the estimator to be consistent), do not reject the full
specification shown in column 1 at conventional levels.
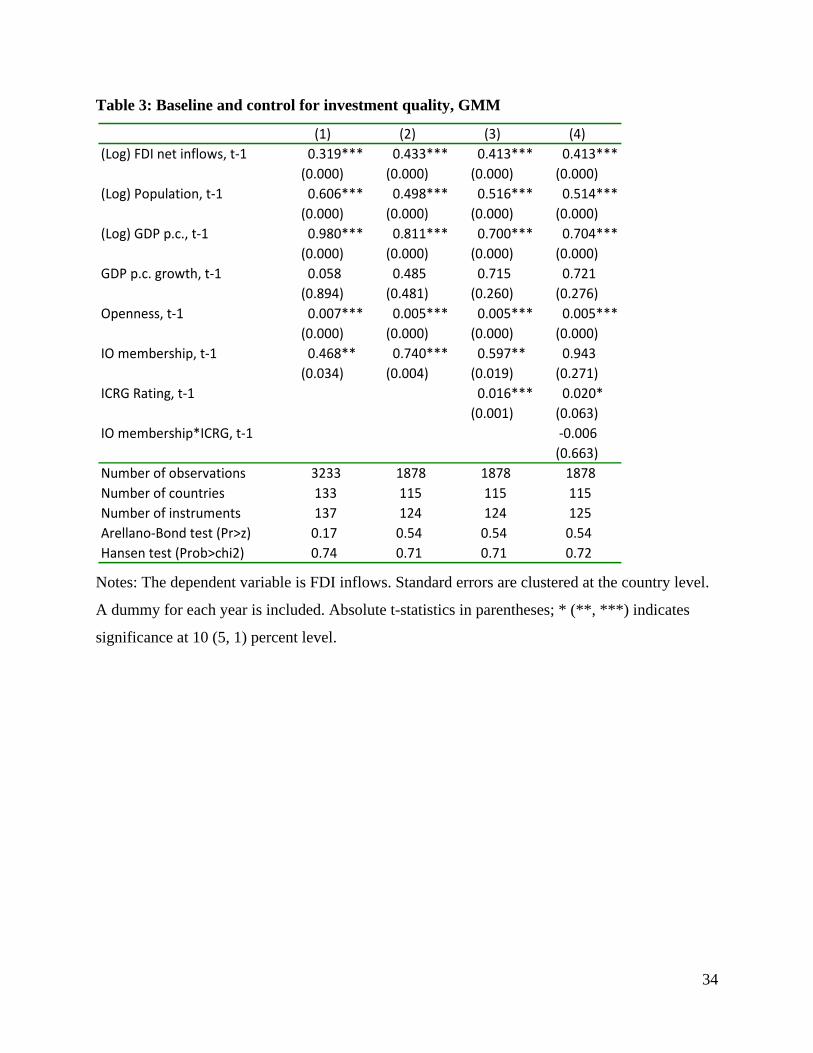
The results in columns 1-3 are very much in line with those reported in Table 1 above,
both qualitatively and quantitatively. Column 4 again includes the interaction between IO
membership and absence of political risk. The marginal effect of IO membership is shown in
figure 3.
Figure 3: Marginal effect of IO membership corresponding to Table 3, column 4
The figure shows a different pattern compared to figures 1 and 2 above. While the slope
is again (slightly) negative, the marginal effect of IO membership is not significant at the ten
percent level for low and high values of observable political risk alike. However, the marginal
effect is positive and significant for a range of about 40-75. Apparently, countries with high risk
do not profit from IO membership. This is intuitive. Given their low level of credibility, investors
might assume that they are not overly concerned about a further loss in reputation following the
disregard of IO policies. In these countries, IO membership can hardly be expected to provide
credibility. The same holds for countries with low political risk. Credibility is sufficiently high,
-2-1
01
23
Mar
gina
l Effe
ct o
f IO
mem
bers
hip
20 40 60 80 100
ICRG Political Risk Rating (0 = high risk)
Dependent Variable: net FDI inflows
Marginal effect of IO membership on FDI as Political Risk changes

18
and property rights sufficiently secure, to the point that IO membership does not provide
additional signals.
In summary, our results are extremely robust to the choice of method. We consistently
find that membership in international organizations increases FDI inflows. According to the OLS
and GMM results, the absence of political risk also increases FDI. This effect is, however, not
significant at conventional levels according to our 2SLS results in Table 2. Regarding the
interaction between directly observable political risk and “buying” credibility by joining
international organizations, we consistently find that the effect of IO membership is not
significant in countries with particularly low levels of political risk. Whether countries with
particularly high political risk can profit from membership in international organizations depends
on the method of estimation.
We proceed with some additional tests. Table 4 runs Granger causality tests as another
route to address the question of causality. Causality as defined in the sense of Granger (1969),
who maintains that a variable is (Granger-)causing a variable if past values of help to
explain , once the past influence of has been accounted for.
If we have N cross-sectional units observed over T time periods, the model is:
, ∑ , ∑ , , , (2)
where i=1,..., N and t=1,..., T. The parameters are denoted and , the maximal lag length is J,
and again represent country and year fixed effects respectively, while , represents the
disturbance. Given that IO membership is likely to be endogenous, we estimate the regressions
with GMM.
Table 4 reports the results. What we find is, when J is set to two, membership explains
FDI inflows at the one percent level of significance. Increasing to a lag length of three, the
coefficients of the membership indices are jointly significant at the ten percent level. At least at
the ten percent level this holds when one or, respectively, two further lags are added. When we
focus on membership in international organizations as the dependent variable (columns 5-8),
there is generally no significant impact of lagged FDI on membership (with one exception,
column 6). There is thus evidence that membership in international organizations Granger-causes
FDI inflows, but no evidence that FDI Granger-causes membership.
In Table 5 we test for the robustness of our results by employing alternative indices of
directly observable political risk. First, we use the country risk ratings produced by Euromoney.

19
Euromoney’s risk ratings are based on the view of experts, heads of syndication and loans, as
well as data from the World Bank, forfaiting houses and credit rating agencies. They are
available as of 1982. To obtain the overall country risk score, Euromoney assigns weights to nine
categories. These are political risk (25% weight), economic performance (25%), debt indicators
(10%), debt in default or rescheduled (10%), credit ratings (10%), access to bank finance (5%),
access to short-term finance (5%), access to capital markets (5%), and discount on forfaiting
(5%). The resulting index ranges between zero and 100, with higher values representing higher
credibility. Our second alternative index is the Economic Freedom Index provided by the Fraser
Institute (Gwartney, Lawson and Norton, 2008). The data are available in five year-intervals over
the 1970-2006 period. It covers five broad categories of market-oriented policies and institutions:
Size of Government, Legal Structure and Security of Property Rights, Access to Sound Money,
Exchange with Foreigners, and Regulation of Credit, Labor and Business. Each index ranges
from 0-10, with 10 indicating the highest value of economic freedom. Finally, we employ
Institutional Investor’s country risk scores.11 The ratings are based on a survey of leading
international banks who are asked to rate each country on a scale from zero to 100 (with higher
values representing a greater creditworthiness). Institutional Investor averages these ratings,
providing higher weights to respondents with greater worldwide exposure and more
sophisticated country analysis systems.
The results in Table 5 show that the significance of the alternative indices depends on the
method of estimation. According to the GMM results of columns 4-6, all indicators are
significant at the ten percent level at least, with a positive coefficient. However, the 2SLS results
reported in columns 1-3 show that only economic freedom increases FDI flows at the one
percent level, while the indices by Euromoney and Institutional Investor are not significant at
conventional levels. Notably, the coefficient of our IO membership index is significant
throughout all regressions, at least at the ten percent level.
In Table 6 we replicate the main regressions excluding OECD countries. OECD countries
are arguably less likely to rely on international organizations to signal quality. In order to make
sure that the results are not driven by these wealthy states, which enjoy low political risk and are
members in many IOs, we rerun the regressions excluding OECD member states. As can be seen,
FDI inflows still increase with membership in international organizations at the ten percent level
11 We thank Carmen Reinhart for providing these data (as used in Reinhart et al., 2003).

20
of significance. The exception is the GMM specification reported in column 5. However, when
the interaction of IO membership with political risk is included, the marginal effect of IO
membership remains significant for high-risk countries (not shown in the table). While the
coefficients of IO membership become significant in the OLS and 2SLS specifications when the
interaction term is included, the interaction itself is completely insignificant. Thus it seems that
our main results are robust to excluding OECD countries but the interaction effect is not. This is
not surprising. Excluding the countries with arguably the lowest risk reduces variation in the risk
rating across the sample, so that the effect of membership becomes relevant throughout.
To summarize, there is strong evidence that membership in international organizations
increases net FDI inflows. Regarding the potential interaction between political risk and IO
membership, our results are less robust. In the overall sample, countries with high levels of
directly observable political risk seem particularly likely to profit from membership in
international organizations. However, this result is not completely robust to the choice of
indicator for political risk. It also does not hold throughout different model specifications.
It is now interesting to ask whether membership in different IOs has differential impacts
on FDI. Table 7 contains the answer to this question. One by one, we add our variables for
membership in the seven individual organizations/conventions to the regressions.12 We used the
same instruments for the individual organizations that have also been used for the overall index
above. However, the overidentification test rejected these instruments in some cases. This is true
for the ICSID, IFC, and the New York Convention. In the regressions reported in the table, we
therefore excluded one instrument for these organizations.13
As can be seen, most of the organizations increase FDI inflows at conventional levels of
significance. The exception is ratification of the ICSID and the New York convention, which
have no significant influence in the 2SLS regressions at conventional levels. However, note that
the Wooldridge test does not reject the exogeneity of ICSID ratification at conventional levels,
so the OLS regression reported in column 3 is more efficient. According to this regression, FDI
inflows increase with the ratification of the ICSID at the ten percent level of significance.
Quantitatively, the effect of membership on FDI ranges between 0.38 percent (ICSID) and 15.1
12 Note that we cannot include the individual organizations and conventions in one regression given the lack of sufficient instruments. 13 For the ICSID, democracy had to be omitted in order for the overidentification test to accept the specification, while the number of embassies had to be excluded in the New York Convention and IFC regressions.

21
percent (IFC). The size of the effect of IFC membership clearly stands out compared to all other
organizations. IFC’s express goal is to improve the investment climate and it seems that it is
rather successful in achieving this. GATT/WTO-membership is also quite conducive to FDI:
Membership increases FDI by almost nine percent. Creating the preconditions for international
trade simultaneously improves the climate for FDI. Compared to the effects of these two
organizations, ratification of conventions concerned with human rights is of limited relevance:
Membership increases FDI by two to three percent depending on the specific convention. The
rather small effect of ICSID on FDI is surprising given the attention that ICSID received in the
aftermath of the Argentine debt crisis. But this might already be the explanation: Our panel ends
in 2005. ICSID has only become better known to many potential investors in light of some of the
decisions made by private investors towards Argentina, but most of these were issued after 2005.
Replication of this study five or ten years down the road might therefore lead to an increase in
the coefficient for ICSID.
5 Summary and Conclusions
Based on a simple signaling model, we have shown that membership in international
organizations can be a valuable signal to potential foreign direct investors. We find this effect to
be of substantial importance and remarkably robust to the method of estimation. Furthermore, we
find a substitutive relationship between membership in IOs and political risk. Countries cannot
increase FDI inflows by joining IOs once they have a low level of directly observable political
risk. The intuition behind this result is that such countries do not reveal any new information to
foreign investors by becoming a member of an IO. In contrast, countries with higher levels of
directly observable political risk do indeed seem to profit from joining IOs. However, it remains
unclear whether this result holds for countries with extremely high levels of directly observable
country risk. The main goal of this paper has been to introduce a framework allowing for
estimation of the extent to which membership in international organizations can signal low
political risk. It is important to keep in mind that this is by no means the only function of IOs. If
one is interested in their effects on internalizing border-crossing externalities, encouraging
cooperation and the like, other approaches are needed.
Other aspects that need to be dealt with in future work include the endogenization of the
delegation decisions: Under what conditions do politicians prefer to delegate competence

22
domestically, and under what conditions do they prefer international delegation? What is the
relationship between the political economy surrounding that decision and its welfare effects?
Some major normative issues also loom large: How much competence should be delegated? Will
too much delegation lead to a hollowing out of democracy? Will it lead to lower degrees of
legitimacy etc.? What policy areas should optimally be delegated to domestic agencies and what
areas to international agencies? These questions certainly deserve a thorough analysis because
they promise to become more and more relevant over time. The ever rising number of
international treaties attests to this. While our analysis does not provide answers to these
questions, we do provide the first real evidence that membership in international organizations
can indeed lead to higher levels of FDI.

23
References
Arellano, M. and S. Bond. 1991. Some tests of specification for panel data: Monte Carlo
evidence and an application to employment equations. The Review of Economic Studies
58: 277-97.
Arellano, M. and O. Bover. 1995. Another look at the instrumental variable estimation of error-
components models. Journal of Econometrics 68: 29-51.
Blundell, R., and S. Bond. 1998. Initial conditions and moment restrictions in dynamic panel
data models. Journal of Econometrics 87: 115-43.
Cho, I.-K. and D. Kreps. 1987. Signaling Games and Stable Equilibria. Quarterly Journal of
Economics 102(2): 179-221.
Dreher, A., N. Gaston and P. Martens. 2008. Measuring Globalization – Gauging its
Consequences. New York: Springer.
Dreher, A. and S. Voigt. 2008. Does Membership in International Organizations Increase
Governments’ Credibility? Testing the Effects of Delegating Powers.CESifo Working
Paper Series 2285, CESifo Group Munich.
Dreher, A., J.-E. Sturm and J.R. Vreeland. 2009a. Global Horse Trading: IMF loans for votes in
the United Nations Security Council. European Economic Review 53: 742-757.
Dreher, A., J.-E. Sturm and J.R. Vreeland. 2009b. Development Aid and International Politics:
Does membership on the UN Security Council influence World Bank decisions? Journal
of Development Economics 88: 1-18.
Euromoney. Various Years. Country Risk Survey. Available at www.euromoney.com.
Fang, S. and E. Owen. 2009. Subtle Signals, Limited Device: International Institutions and
Credible Commitment of Nondemocracies, Rice University, mimeo.
Fudenberg, D. and J. Tirole. 1991. Game Theory. Cambridge, Mass: MIT Press.
Granger, C.W.J. 1969. Testing for causality and feedback. Econometrica 37(3): 424-438.
Institutional Investor. Various Years. Country Credit Ratings. Available at
www.institutionalinvestor.com.
International Country Risk Guide. Various Years. Country Rankings. The PRS Group. Available
at www.prsgroup.com.
24
Gwartney, J. and R. Lawson with S. Norton. 2008. Economic Freedom of the World: 2008
Annual Report. Vancouver, BC: The Fraser Institute. Data retrieved from
www.freetheworld.com.
Kaja, A. and E. Werker . 2010. Corporate Governance at the World Bank and the Dilemma of
Global Governance. World Bank Economic Review. 24(2): 171–198.
Kuziemko, I. and E. Werker . 2006. How Much Is a Seat on the Security Council Worth?
Foreign Aid and Bribery at the United Nations, Journal of Political Economy 114(5):
905–930.
Nickell, S.J. 1981. Biases in Dynamic Models with Fixed Effects. Econometrica 49: 1417-1426.
Reinhart, C.M., K.S. Rogoff and M.A. Savastano .2003. Debt Intolerance. Brookings Papers on
Economic Activity 2003(1): 1-74.
Roodman, D. 2005. xtabond2: Stata Module to Extend xtabond Dynamic Panel Data Estimator.
Center for Global Development, Washington, D.C.
Roodman, D. 2006. How to Do xtabond2: An Introduction to "Difference" and "System" GMM
in Stata. Working Paper 103. Center for Global Development, Washington.
Rose, A.K. 2004a. Do We Really Know that the WTO increases Trade? American Economic
Review 94(1): 98-114.
Rose, A. K. 2004b. Do WTO members have more liberal trade policy? Journal of International
Economics 63(2): 209-235.
Schneider, C.J. 2010. Globalizing Electoral Politics: International Political Budget Cycles in the
European Union, University of California, San Diego, mimeo.
Tobin, J. L. and S. Rose-Ackerman. 2010. When BITs have some bite: The political-economic
environment for bilateral investment treaties. Review of International Organizations,
forthcoming.
Windmeijer, F. 2005. A finite sample correction for the variance of linear efficient two-step
GMM estimators. Journal of Econometrics 126: 25-51.
Wooldridge, J. M. 1995. Score diagnostics for linear models estimated by two stage least
squares. In Advances in Econometrics and Quantitative Economics: Essays in Honor of
Professor C. R. Rao, ed. G. S. Maddala, P. C. B. Phillips, and T. N. Srinivasan. Oxford:
Blackwell: 66-87.

25
Graph 1: Preference map of high-risk country and low-risk country
m
τ Indifference
curves of low‐
risk country, θLR
Increasing
utility
Indifference curves of high‐risk country, θHR

26
Graph 2: Separating equilibria
m
τ θHR
μθLR
μθHR
θLR
[ ]
] [ m̂m~
range of m*(θLR)
m*(θHR)
= 0

27
Graph 3: Pooling equilibria
m
τ θHR
μE[θ]
μθHR
]
] [ m~
[
range of m*

28
Graph 4: A specific pooling equilibrium
m
τ θHR
μE[θ]
μθHR
μθLR θ’HR
θLR
m1 m2m*

29
Graph 5: A specific separating equilibrium
m
τ*(m)
θHR μθLR
μθHR
θLR
m~m*(θHR)
= 0
m*(θLR)
τ

30
Graph 6: Spence equilibrium
m
τ*(m)
θHR μθLR
μθHR
τ
m*(θHR)
= 0
m*(θLR) = m~

31
Graph 7: Case of non-pareto optimal Spence equilibrium
m
τ θHR
μE[θ] ‐‐
μθHR
μθLR
θLR
m*(θHR)
= 0
m*(θLR) = m~

32
Table 1: Baseline and control for investment quality
Notes: The dependent variable is FDI inflows. Standard errors are clustered at the country level.
A dummy for each year is included. Absolute t-statistics in parentheses; * (**, ***) indicates
significance at 10 (5, 1) percent level.
(1) (2) (3) (4) (5)(Log) FDI net inflows, t‐1 0.528*** 0.525*** 0.456*** 0.448*** 0.443*** (0.000) (0.000) (0.000) (0.000) (0.000) (Log) Population, t‐1 ‐0.347 ‐0.530* ‐0.705 ‐0.910 ‐1.450** (0.170) (0.080) (0.273) (0.173) (0.037) (Log) GDP p.c., t‐1 0.463*** 0.396** 0.212 0.121 0.124 (0.000) (0.014) (0.419) (0.654) (0.644) GDP p.c. growth, t‐1 0.469* 0.573 0.961* 0.917* 0.923* (0.084) (0.163) (0.080) (0.090) (0.097) Openness, t‐1 0.005*** 0.005*** 0.003 0.003 0.003 (0.000) (0.002) (0.103) (0.112) (0.134) IO membership, t‐1 0.449** 0.635** 0.610** 2.441** (0.030) (0.018) (0.022) (0.036) ICRG Rating, t‐1 0.009* 0.029** (0.087) (0.036) IO membership*ICRG, t‐1 ‐0.031* (0.089) Number of observations 3896 3233 1878 1878 1878 Number of countries 168 133 115 115 115 R‐squared 0.51 0.51 0.50 0.50 0.51 R‐squared Adj. 0.50 0.51 0.50 0.50 0.50

33
Table 2: Baseline and control for investment quality, 2SLS
Notes: The dependent variable is FDI inflows. Standard errors are clustered at the country level.
A dummy for each year is included. Absolute t-statistics in parentheses; * (**, ***) indicates
significance at 10 (5, 1) percent level.
(1) (2) (3) (4) (Log) FDI net inflows, t‐1 0.518*** 0.395*** 0.393*** 0.399*** (0.000) (0.000) (0.000) (0.000) (Log) Population, t‐1 ‐0.645*** ‐2.452*** ‐2.485*** ‐4.073** (0.003) (0.001) (0.001) (0.011) (Log) GDP p.c., t‐1 0.377*** 0.104 0.055 0.128 (0.001) (0.636) (0.806) (0.558) GDP p.c. growth, t‐1 0.546 1.096* 1.067* 0.999* (0.199) (0.055) (0.059) (0.081) Openness, t‐1 0.004*** 0.002 0.002 0.002 (0.001) (0.281) (0.292) (0.410) IO membership, t‐1 1.196* 5.491*** 5.230*** 11.212** (0.078) (0.002) (0.004) (0.043) ICRG Rating, t‐1 0.005 0.101 (0.252) (0.226) IO membership*ICRG, t‐1 ‐0.140 (0.250) Number of observations 3088 1819 1819 1819 Number of countries R‐squared 0.86 0.85 0.86 0.87 R‐squared Adj. 0.86 0.84 0.85 0.86 Wooldridge test (p‐value) 0.295 0.003 0.006 0.024 Robust regression‐based F (p‐value) 0.309 0.004 0.008 0.028 Overidentifying restrictions (p‐value) 0.816 0.419 0.386 0.210
34
Table 3: Baseline and control for investment quality, GMM
Notes: The dependent variable is FDI inflows. Standard errors are clustered at the country level.
A dummy for each year is included. Absolute t-statistics in parentheses; * (**, ***) indicates
significance at 10 (5, 1) percent level.
(1) (2) (3) (4) (Log) FDI net inflows, t‐1 0.319*** 0.433*** 0.413*** 0.413*** (0.000) (0.000) (0.000) (0.000) (Log) Population, t‐1 0.606*** 0.498*** 0.516*** 0.514*** (0.000) (0.000) (0.000) (0.000) (Log) GDP p.c., t‐1 0.980*** 0.811*** 0.700*** 0.704*** (0.000) (0.000) (0.000) (0.000) GDP p.c. growth, t‐1 0.058 0.485 0.715 0.721 (0.894) (0.481) (0.260) (0.276) Openness, t‐1 0.007*** 0.005*** 0.005*** 0.005*** (0.000) (0.000) (0.000) (0.000) IO membership, t‐1 0.468** 0.740*** 0.597** 0.943 (0.034) (0.004) (0.019) (0.271) ICRG Rating, t‐1 0.016*** 0.020* (0.001) (0.063) IO membership*ICRG, t‐1 ‐0.006 (0.663) Number of observations 3233 1878 1878 1878 Number of countries 133 115 115 115 Number of instruments 137 124 124 125 Arellano‐Bond test (Pr>z) 0.17 0.54 0.54 0.54 Hansen test (Prob>chi2) 0.74 0.71 0.71 0.72

Table 4: Granger Causality Tests, GMM
Notes: The dependent variable is FDI inflows. Standard errors are clustered at the country level. A dummy for each year is included.
Absolute t-statistics in parentheses; * (**, ***) indicates significance at 10 (5, 1) percent level.
(1) (2) (3) (4) (5) (6) (7) (8) (Log) FDI net inflows, t‐1 0.420*** 0.501*** 0.454*** 0.547*** 0.001 0.002 0.001 0.001 (0.000) (0.000) (0.000) (0.000) (0.325) (0.162) (0.276) (0.298) (Log) FDI net inflows, t‐2 0.065** 0.126*** 0.104*** 0.158*** ‐0.000 0.000 ‐0.000 ‐0.001 (0.042) (0.002) (0.001) (0.000) (0.672) (0.951) (0.740) (0.637) (Log) FDI net inflows, t‐3 0.022 0.013 0.041 ‐0.000 0.000 ‐0.000 (0.531) (0.639) (0.153) (0.729) (0.882) (0.933) (Log) FDI net inflows, t‐4 ‐0.033 0.008 0.000 ‐0.000 (0.222) (0.748) (0.861) (0.801) (Log) FDI net inflows, t‐5 0.041 0.000 (0.290) (0.681) IO membership, t‐1 0.405 0.252 0.110 0.323 0.963*** 0.941*** 0.956*** 0.951*** (0.392) (0.565) (0.811) (0.408) (0.000) (0.000) (0.000) (0.000) IO membership, t‐2 1.018** 0.433 0.564 0.036 ‐0.002 0.017 0.016 0.017 (0.018) (0.369) (0.253) (0.939) (0.898) (0.355) (0.295) (0.435) IO membership, t‐3 0.339 0.455 0.627* ‐0.019 ‐0.004 ‐0.013 (0.287) (0.126) (0.078) (0.249) (0.828) (0.534) IO membership, t‐4 0.327 ‐0.575 ‐0.014 0.004 (0.381) (0.215) (0.292) (0.825) IO membership, t‐5 0.256 ‐0.000 (0.535) (1.000) Dependent variable FDI FDI FDI FDI IO membership IO membership IO membership IO membershipNumber of observations 3276 3021 2785 2568 3565 3276 3021 2785 Number of countries 135 135 135 134 135 135 135 135 Number of instruments 83 84 85 86 76 77 78 79 Arellano‐Bond test (Pr>z) 0.75 0.38 0.26 0.22 0.80 0.50 0.83 0.90 Hansen test (Prob>chi2) 0.92 0.76 0.93 0.79 0.07 0.11 0.44 0.19 F‐stat for lagged x‐variables (p‐value) 0.004 0.056 0.052 0.034 0.552 0.058 0.104 0.739

36
Table 5: Control for some further institutional variables
Notes: The dependent variable is FDI inflows. Standard errors are clustered at the country level. A dummy for each year is included.
Absolute t-statistics in parentheses; * (**, ***) indicates significance at 10 (5, 1) percent level.
(1) (2) (3) (4) (5) (6) (Log) FDI net inflows, t‐1 0.355*** 0.464*** 0.484*** 0.334*** 0.420*** 0.347*** (0.000) (0.000) (0.000) (0.000) (0.000) (0.000) (Log) Population, t‐1 ‐1.871*** ‐1.561*** ‐0.367 0.576*** 0.537*** 0.565*** (0.001) (0.000) (0.139) (0.000) (0.000) (0.000) (Log) GDP p.c., t‐1 0.373* 0.791*** 0.377*** 0.774*** 0.796*** 0.851*** (0.083) (0.008) (0.008) (0.000) (0.000) (0.000) GDP p.c. growth, t‐1 ‐0.118 1.336** 0.571 ‐0.004 1.063 0.437 (0.847) (0.042) (0.275) (0.994) (0.159) (0.471) Openness, t‐1 0.002 0.000 0.003** 0.006*** 0.005*** 0.005** (0.252) (0.998) (0.036) (0.000) (0.000) (0.024) IO membership, t‐1 5.672*** 4.365*** 1.614* 0.581** 0.466** 0.608** (0.000) (0.001) (0.084) (0.021) (0.020) (0.040) Euromoney country risk, t‐1 ‐0.003 0.010*** (0.455) (0.001) Institutional Investor country risk, t‐1 0.005 0.007* (0.179) (0.077) Fraser index of economic freedom, t‐1 0.194*** 0.220*** (0.000) (0.009) Method 2SLS 2SLS 2SLS GMM GMM GMMNumber of observations 2134 1718 2514 2213 1757 2590 Number of countries 133 88 114 Wooldridge test (p‐value) 0.000 0.001 0.202 Robust regression‐based F (p‐value) 0.000 0.001 0.213 Overidentifying restrictions (p‐value) 0.954 0.521 0.752 Number of instruments 126 126 138 Arellano‐Bond test (Pr>z) 0.54 0.92 0.20 Hansen test (Prob>chi2) 0.52 1.00 0.95

Table 6: Without OECD countries
Notes: The dependent variable is FDI inflows. Standard errors are clustered at the country level.
A dummy for each year is included. Absolute t-statistics in parentheses; * (**, ***) indicates
significance at 10 (5, 1) percent level.
(1) (2) (3) (4) (5) (6) (Log) FDI net inflows, t-1 0.425*** 0.421*** 0.388*** 0.393*** 0.404*** 0.401*** (0.000) (0.000) (0.000) (0.000) (0.000) (0.000) (Log) Population, t-1 -1.294 -1.652* -1.990** -2.342 0.514*** 0.511*** (0.154) (0.078) (0.012) (0.296) (0.000) (0.000) (Log) GDP p.c., t-1 0.122 0.137 0.045 0.079 0.697*** 0.707*** (0.692) (0.651) (0.850) (0.772) (0.000) (0.000) GDP p.c. growth, t-1 0.881 0.878 1.009* 0.975* 0.742 0.804 (0.115) (0.127) (0.065) (0.094) (0.222) (0.203) Openness, t-1 0.002 0.002 0.001 0.001 0.005*** 0.004*** (0.205) (0.236) (0.624) (0.635) (0.000) (0.000) IO membership, t-1 0.541* 2.325 3.018* 5.000 0.406 1.677 (0.069) (0.106) (0.081) (0.652) (0.188) (0.132) ICRG Rating, t-1 0.009 0.030* 0.006 0.039 0.015** 0.030** (0.156) (0.096) (0.251) (0.838) (0.019) (0.046) IO membership*ICRG, t-1 -0.031 -0.048 -0.023 (0.179) (0.861) (0.206) Method OLS OLS 2SLS 2SLS GMM GMMNumber of observations 1339 1339 1316 1316 1339 1339 Number of countries 85 85 85 85 Wooldridge test (p-value) 0.137 0.336 Robust regression-based F (p-value) 0.155 0.366 Overidentifying restrictions (p-value) 0.919 0.675 Number of instruments 124 125 Arellano-Bond test (Pr>z) 0.85 0.86 Hansen test (Prob>chi2) 1.00 1.00

Table 7: Subcomponents of IO indices, 2SLS
Notes: The dependent variable is FDI inflows. Standard errors are clustered at the country level. A dummy for each year is included.
Absolute t-statistics in parentheses; * (**, ***) indicates significance at 10 (5, 1) percent level.
(1) (2) (3) (4) (5) (6) (7) (8) (9)(Log) FDI net inflows, t-1 0.466*** 0.443*** 0.430*** 0.401*** 0.438*** 0.431*** 0.425*** 0.951 0.416*** (0.000) (0.000) (0.000) (0.000) (0.000) (0.000) (0.000) (0.382) (0.000) (Log) Population, t-1 -7.379* -0.870* -0.916 1.731 -2.025*** -2.532*** -0.790 17.951 -1.070 (0.065) (0.067) (0.138) (0.227) (0.003) (0.002) (0.144) (0.657) (0.100) (Log) GDP p.c., t-1 -1.064 0.063 0.091 0.839* 0.093 -0.023 -0.079 2.300 0.532 (0.193) (0.765) (0.738) (0.068) (0.668) (0.926) (0.722) (0.649) (0.145) GDP p.c. growth, t-1 1.188 1.038** 1.016* 0.843 0.862 0.980 1.125** -3.078 1.074 (0.332) (0.042) (0.094) (0.228) (0.123) (0.117) (0.038) (0.735) (0.120) Openness, t-1 0.007 0.002 0.002 0.002 -0.000 -0.002 0.003 -0.004 0.009** (0.162) (0.225) (0.215) (0.487) (0.870) (0.407) (0.218) (0.822) (0.032) ICRG Rating, t-1 -0.033 0.008** 0.009 0.034* 0.009** 0.017*** 0.001 -0.033 -0.005 (0.209) (0.039) (0.124) (0.085) (0.043) (0.002) (0.895) (0.726) (0.577) Gatt/WTO, t-1 8.948* (0.094) ICSID, t-1 0.020 0.376* (0.983) (0.070) IFC, t-1 15.080* (0.075) ICCPR, t-1 2.168*** (0.006) ICESCR, t-1 3.196*** (0.006) Optional Protocol to ICCPR, t-1 2.494*** (0.001) New York Convention, t-1 -26.631 (0.639) Convention against Torture, t-1 3.388** (0.037) Method 2SLS 2SLS OLS 2SLS 2SLS 2SLS 2SLS 2SLS 2SLSNumber of observations 1819 1819 1819 1819 1819 1819 1819 1819 1819 Number of countries 111 R-squared Adj. 0.36 0.88 0.48 0.66 0.85 0.82 0.83 . 0.76 Wooldridge test (p-value) 0.001 0.700 0.001 0.004 0.001 0.001 0.010 0.017 Robust regression-based F (p-value) 0.001 0.708 0.002 0.004 0.001 0.001 0.016 0.018 Overidentifying restrictions (p-value) 0.724 0.693 0.898 0.277 0.516 0.983 0.559 0.214

Appendix A: Sources and Definitions
Variable Definition Source
IO membership Indicator of membership in selected international organizations and conventions.
Various sources as described in the text
(Log) FDI net inflows Log of foreign direct investment net inflows in constant 2000 US dollars.
World Bank (2008)
(Log) Population Log of population Penn World Tables (Version 6.2)
(Log) GDP p.c. Log of GDP per capita in constant 1996 US dollars Penn World Tables (Version 6.2)
GDP p.c. growth Growth of GDP per capita in constant 1996 US dollars Penn World Tables (Version 6.2)
Openness Sum of exports and imports in percent of GDP. Penn World Tables (Version 6.2)
ICRG risk Political risk rating based on 12 indicators, ranging from zero (high risk) to 100 (low risk): government stability, socioeconomic conditions, investment profile, internal conflict, external conflict, corruption, military in politics, religious tensions, law and order, ethnic tensions, democratic accountability, and bureaucracy quality. ICRG stands for International Country Risk Guide.
PRS Group (various years)
Euromoney risk Country risk rating based on expert views as well as data from the World Bank, forfaiting houses and credit rating agencies. It comprises nine categories, ranging from zero (high risk) to 100 (low risk): political risk (25% weighting), economic performance (25%), debt indicators (10%), debt in default or rescheduled (10%), credit ratings (10%), access to bank finance (5%), access to short-term finance (5%), access to capital markets (5%), and discount on forfaiting (5%).
Euromoney (various years)
Institutional Investor risk Country risk rating based on a survey of leading international banks. Institutional Investors averages the ratings, providing greater weights to respondents with higher worldwide exposure and more sophisticated country analysis systems. The rating ranges from zero (high risk) to 100 (low risk).
Institutional Investor (various years)
Fraser index of economic freedom Index of economic freedom which assesses the strength and impartiality of the legal system as well as the popular observance of the law. It ranges from zero to six, where a higher number indicates a better system of law and order.
Fraser Institute (2008)
Embassies Absolute number of embassies in a country. Dreher, Gaston and Martens (2008)
Participation in U.N. Security Council Missions
Personnel contributed to U.N. Security Council Missions per capita.
Dreher, Gaston and Martens (2008)
Democracy index Polity IV index of democracy, ranging from -10 to +10, with higher values implying more democracy.
Marshall and Jaggers (2004)

40
Appendix B: Descriptive Statistics (estimation sample, Table 1, column 1)
Variable Obs Mean Std. Dev. Min Max
IO membership, t-1 3867 0.52 0.34 0.00 1.00(Log) FDI net inflows 3896 18.86 2.73 4.68 26.50(Log) Population, t-1 3896 8.74 1.94 3.66 14.07(Log) GDP p.c., t-1 3896 8.39 1.09 5.14 10.83GDP p.c. growth, t-1 3896 0.02 0.07 -0.42 1.26Openness, t-1 3896 77.17 48.19 0.85 427.88ICRG risk, t-1 2006 64.45 15.19 11.50 97.00Euromoney risk, t-1 2213 50.87 25.16 2.56 100.00Institutional Investor risk, t-1 1765 47.05 25.48 4.60 98.90Fraser index of economic freedom, t-1 2722 5.86 1.12 2.47 8.92Embassies, t-1 3776 48.22 35.37 0.00 180.00Participation in U.N. Security Council Missions 3860 1.73 8.15 0.00 104.94Democracy index, t-1 3860 2 8 0 105