melissa simulation and modelling study of partial conversion
TRANSCRIPT

MELiSSA SIMULATION AND MODELLING Study of partial conversion
- The stoichiometric assumptions: origin and effects - The main consequences of the partial conversion of components
TECHNICAL NOTE 17.2
L. Poughon
Laboratoire de Genie Chimique Biologique 63177 AUBIERE Cedex, FRANCE
June 1994
CONTENTS
INTRODUCTION.. . . . . . . . . . . . . . . . . . . . . . . . . . . . . . . . . . . . . . . . . . . . . . . . . . . . . . . . . . . . . . . . . . . . . . . . . . . . . .2
l- THE STOICHIOMETRIC ASSUMPTIONS . . . . . . . . . . . . . . . . . . . . . . . . . . . . . . . . . . . . . . . .3
1. l- The consumer compartment ......................................................... l.l.l- Early description of the compartment ................................... 4
1.1.2- Updated description of the consumer compartment .................. .5
1.2- The phototroph compartment ....................................................... 7
2- STUDY OF NON IDEALITY ,.......,.........,................................
2.1- Origin . . . . . . . . . . . . . . . . . . . . . . . . . . . . . . . . . . . . . . . . . . . . . . . . . . . . . . . . . . . . . . . . . . . . . . . . . .
2.2- Consequences of the non perfect behaviour of a compartment on the following one.. . . . . . . . . . . . . . . . . . . . . . . . . . . . . . . . . . . . . . . . . . . . . . . . . . . . . . . . . . . . . . . . . . . . . .
2.3- Consequences of non perfect behaviour on the compartments models building . . . . . . . . . . . . . . . . . . . . . . . . . . . . . . . . . . . . . . . . . . . . . . . . . . . . . . . . . . . . . . . . . . . . . . . . . . . . . .
2.4- Consequences on the flowsheet design.. . . . . . . . . . . . . . . . . . . . . . . . . . . . . . . . . . .
. . . . . 9
. . . . . 9
. . . 10
. . . 11
. . . 12
CONCLUSION . . . . . . . . . . . . . . . . . . . . . . . . . . . . . . . . . . . . . . . . . . . . . . . . . . . . . . . . . . . . . . . . . . . . . . . . . . . . . . . . 15
REFERENCES ............................................................................
APPENDIX ................................................................................
. . . . 16
. . . . 17
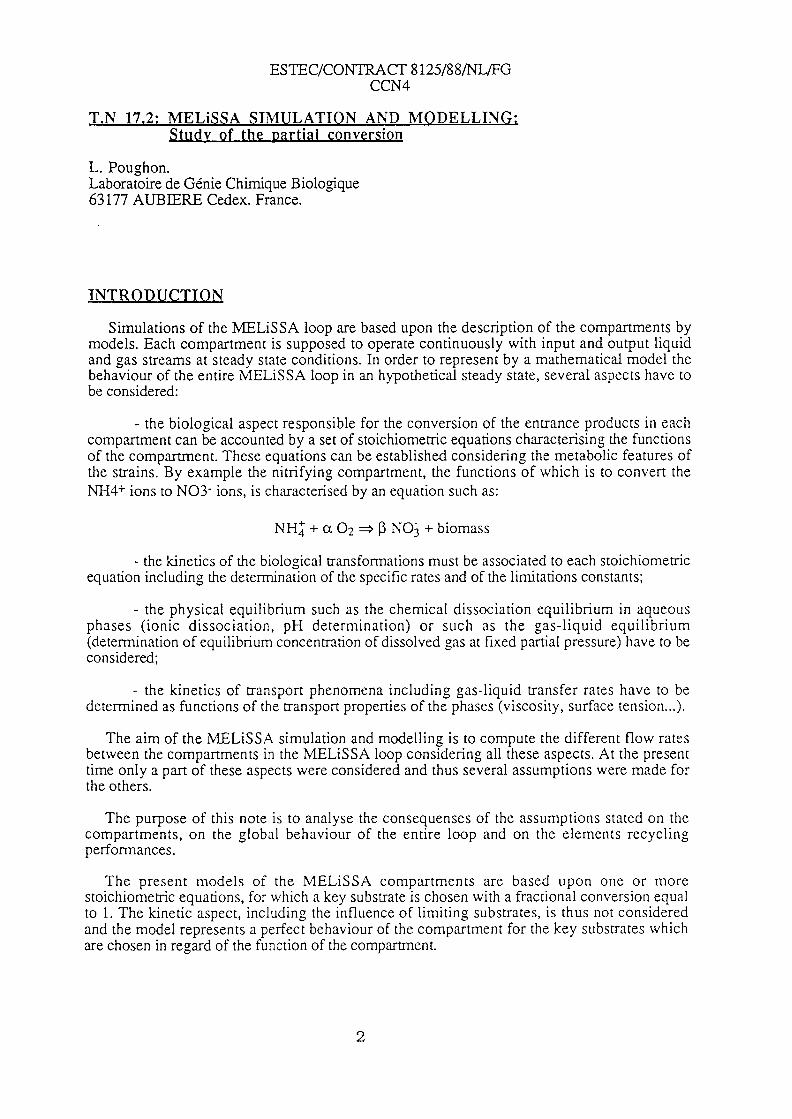
T,N 17.2: MELiSSA SIMULATION AND MODELLING; Studv of the martial conversion
L. Poughon. Laboratoire de Genie Chimique Biologique 63 177 AUBIERE Cedex. France.
TNTRODUCTIOF(
Simulations of the MELiSSA loop are based upon the description of the compartments by models. Each compartment is supposed to operate continuously with input and output liquid and gas streams at steady state conditions. In order to represent by a mathematical model the behaviour of the entire MELiSSA loop in an hypothetical steady state, several aspects have to be considered:
- the biological aspect responsible for the conversion of the entrance products in each compartment can be accounted by a set of stoichiometric equations characterising the functions of the compartment. These equations can be established considering the metabolic features of the strains. By example the nitrifying compartment, the functions of which is to convert the NH4+ ions to N03- ions, is characterised by an equation such as:
NH,f + cx 02 3 p NOj + biomass
- the kinetics of the biological transformations must be associated to each stoichiomenic equation including the determination of the specific rates and of the limitations constants;
- the physical equilibrium such as the chemical dissociation equilibrium in aqueous phases (ionic dissociation, pH determination) or such as the gas-liquid equilibrium (determination of equilibrium concentration of dissolved gas at fixed partial pressure) have to be considered;
- the kinetics of transport phenomena includin, 0 u oas-liquid transfer rates have to be determined as functions of the transport properties of the phases (viscosity, surface tension...).
The aim of the MELiSSA simulation and modelling is to compute the different flow rates between the compartments in the MELiSSA loop considering all these aspects. At the present time only a part of these aspects were considered and thus several assumptions were made for the others.
The purpose of this note is to analyse the consequenses of the assumptions stated on the compartments, on the global behaviour of the entire loop and on the elements recycling performances.
The present models of the MELiSSA compartments are based upon one or more stoichiometric equations, for which a key substrate is chosen with a fractional conversion equal to 1. The kinetic aspect, includin g the influence of limiting substrates, is thus not considered and the model represents a perfect behaviour of the compartment for the key substrates which are chosen in regard of the function of the compartment.
2
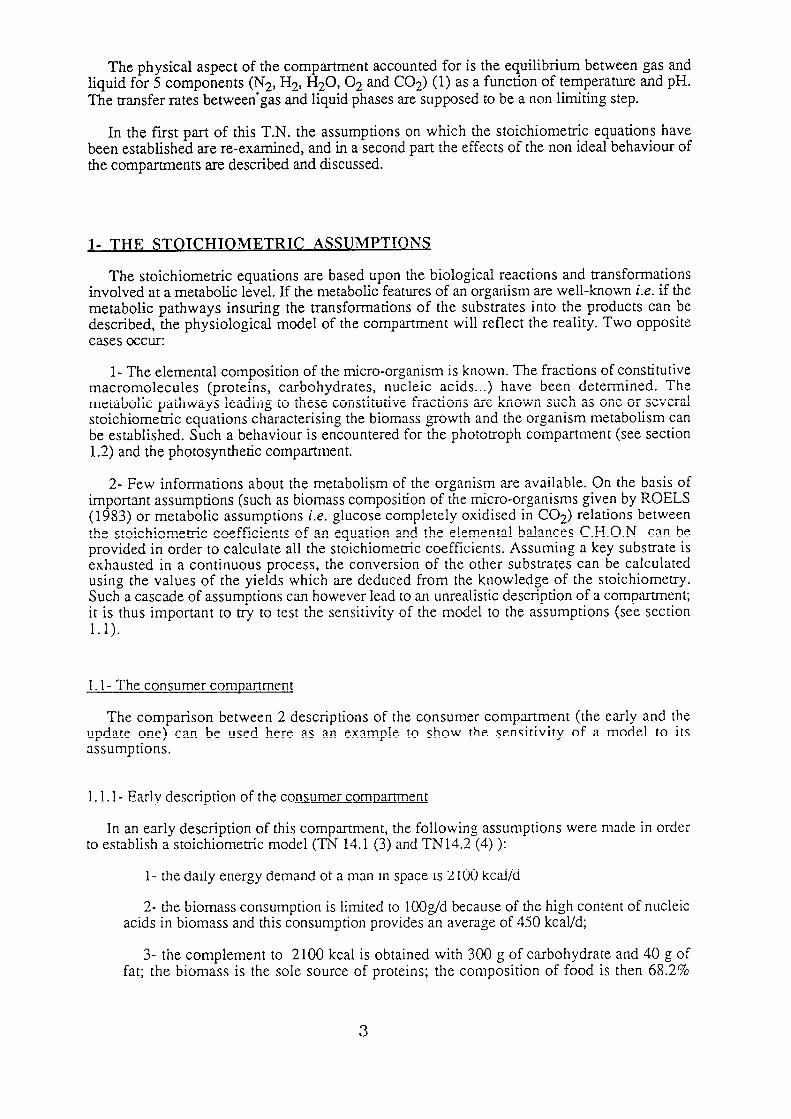
The physical aspect of the compartment accounted for is the equilibrium between gas and liquid for 5 components (Nz, Hz, HzO,Oz and CO*) (1) as a function of temperature and pH. The transfer rates between’gas and liquid phases are supposed to be a non limiting step.
In the first part of this T.N. the assumptions on which the stoichiometric equations have been established are re-examined, and in a second part the effects of the non ideal behaviour of the compartments are described and discussed.
l- THE STOTCHTOMETRTC ASSUMPTTONS
The stoichiometric equations are based upon the biological reactions and transformations involved at a metabolic level. If the metabolic features of an organism are well-known i.e. if the metabolic pathways insuring the transformations of the substrates into the products can be described, the physiological model of the compartment will reflect the reality. Two opposite cases occur:
l- The elemental composition of the micro-organism is known. The fractions of constitutive macromolecules (proteins, carbohydrates, nucleic acids...) have been determined. The metabolic pathways leading to these constitutive fractions are known such as one or several stoichiometric equations characterising the biomass growth and the organism metabolism can be established. Such a behaviour is encountered for the phototroph compartment (see section 1.2) and the photosynthetic compartment.
2- Few informations about the metabolism of the organism are available. On the basis of important assumptions (such as biomass composition of the micro-organisms given by ROELS (1983) or metabolic assumptions i.e. glucose completely oxidised in CO$ relations between the stoichiometric coefficients of an equation and the elemental balances C.H.0.N can be provided in order to calculate all the stoichiometric coefficients. Assuming a key substrate is exhausted in a continuous process, the conversion of the other substrates can be calculated using the values of the yields which are deduced from the knowledge of the stoichiometry. Such a cascade of assumptions can however lead to an unrealistic description of a compartment; it is thus important to try to test the sensitivity of the model to the assumptions (see section 1.1).
1. l- The consumer compartment
The comparison between 2 descriptions of the consumer compartment (the early and the update one) can be used here as an example to show the sensitivity of a model to its assumptions.
1. 1. l- Earlv descriDtion of the consumer comnarnnent
In an early description of this compartment, the following assumptions were made in order to establish a stoichiometric model (TN 14.1 (3) and TN14.2 (4) ):
l- the daily energy demand of a man in space is 2 100 kcal/d
2- the biomass consumption is limited to lOOg/d because of the high content of nucleic acids in biomass and this consumption provides an avera,ae of 450 kcal/d;
3- the complement to 2100 kcal is obtained with 300 g of carbohydrate and 40 g of fat; the biomass is the sole source of proteins; the composition of food is then 68.270
3
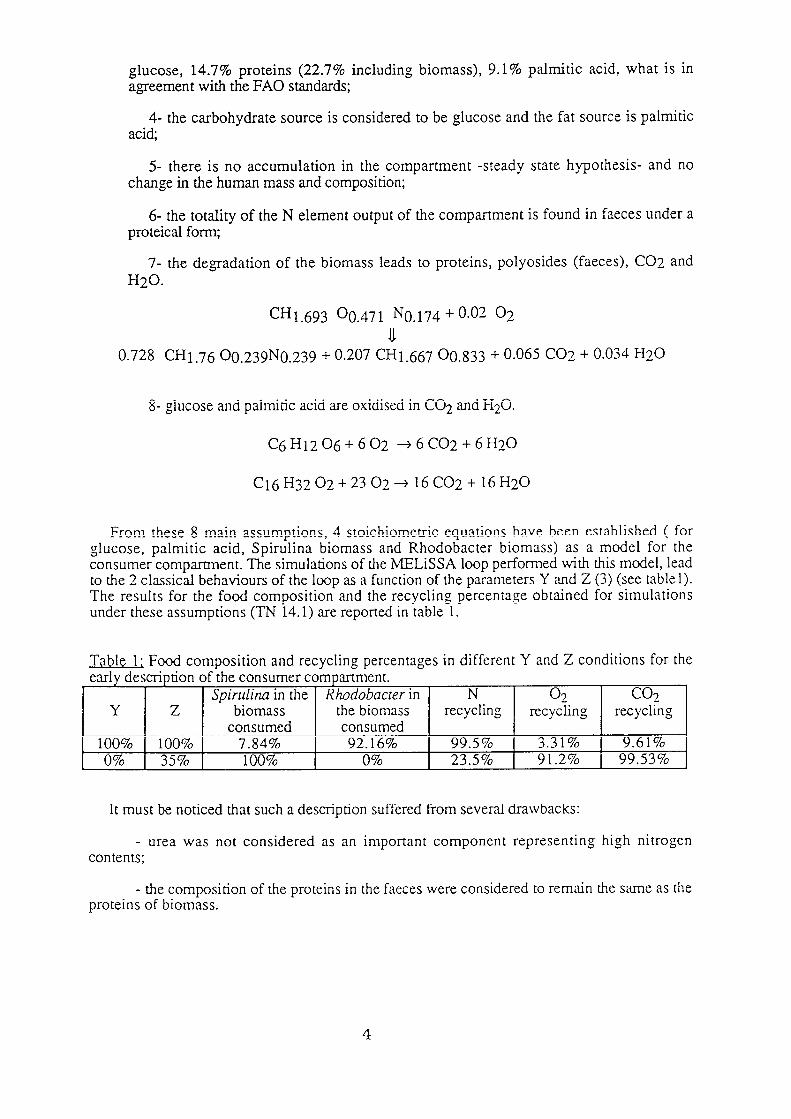
glucose, 14.7% proteins (22.7% including biomass), 9.1% palmitic acid, what is in agreement with the FA0 standards;
4- the carbohydrate source is considered to be glucose and the fat source is palmitic acid;
5 there is no accumulation in the compartment -steady state hypothesis- and no change in the human mass and composition;
6- the totality of the N element output of the compartment is found in faeces under a proteical form;
7- the degradation of the biomass leads to proteins, polyosides (faeces), CO2 and H20.
CH1.693 00.47 1 NO.174 + 0.02 02
u 0.728 CH1.76 00.23gN0.23g + 0.207 CHl.667 00.833 + 0.065 CO2 + 0.034 H20
8- glucose and palmitic acid are oxidised in CO2 and H20.
C6Hl206+602 +6CO2+6H2O
Cl6 H32 02 + 23 02 --+ 16 CO2 + 16 H20
From these 8 main assumptions, 4 stoichiometric equations have been established ( for glucose, palmitic acid, Spirulina biomass and Rhodobacter biomass) as a model for the consumer compartment. The simulations of the MELLSSA loop performed with this model, lead to the 2 classical behaviours of the loop as a function of the parameters Y and 2 (3) (see tablel). The results for the food composition and the recycling percentage obtained for simulations under these assumptions (TN 14.1) are reported in table 1.
Table 1; Food composition and recycling percentages in different Y and Z conditions for the early description of the consumer compartment.
Spirulina in the Rhodobacter in N 02 co2 Y Z biomass the biomass recycling recycling recycling
consumed consumed 100% 100% 7.84% 92.16% 99.5% 3.31% 9.61% 0% 35% 100% 0% 23.5% 91.2% 99.53%
It must be noticed that such a description suffered from several drawbacks:
- urea was not considered as an important component representing high nitrogen contents;
- the composition of the proteins in the faeces were considered to remain the same as the proteins of biomass.
4
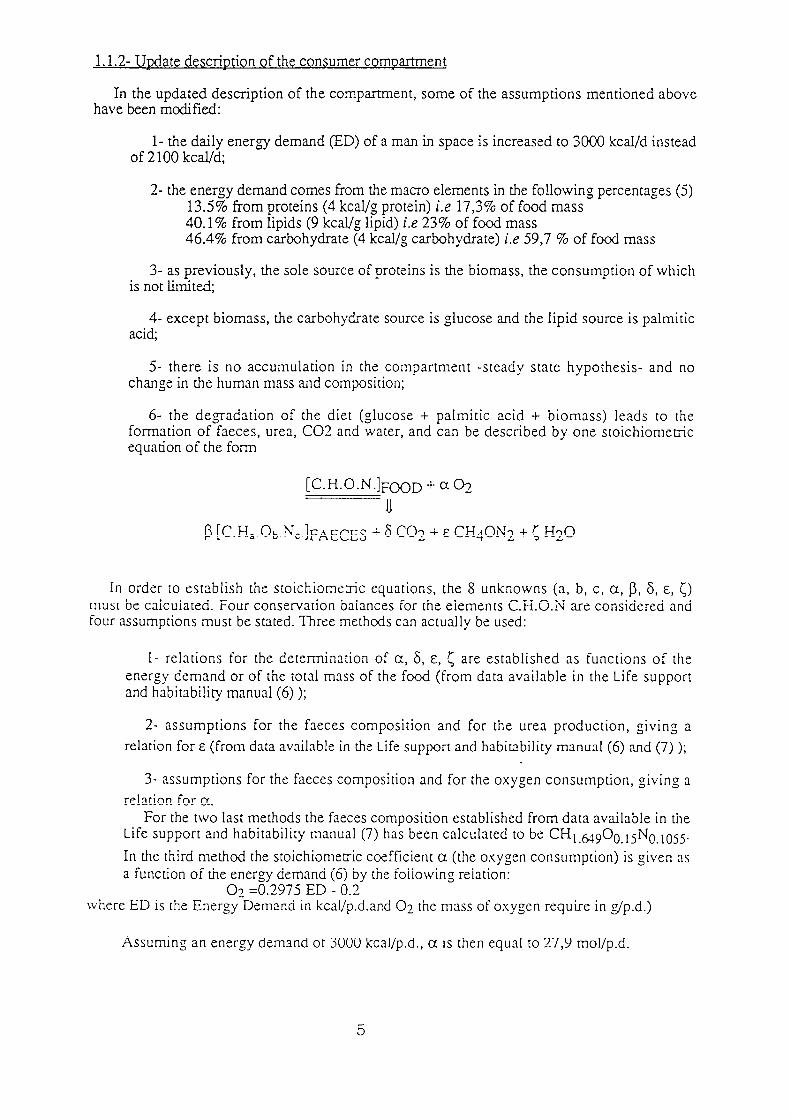
I. I.2- &date descriotion of the consumer comnartmen t
In the updated description of the compartment, some of the assumptions mentioned above have been modified:
l- the daily energ demand (ED) of a man in space is increased to 3000 kca.I/d instead of 2 100 kcal/d;
2- the energy demand comes from the macro elements in the following percentages (5) 13.5% from proteins (4 k&/g protein) i.e 17,3% of food mass 40.1% from lipids (9 kcal/g lipid) i.e 23% of food mass 46.4% from carbohydrate (4 kcal/g carbohydrate) i.e 59,7 % of food mass
3- as previously, the sole source of proteins is the biomass, the consumption of which is not limited;
4- except biomass, the carbohydrate source is glucose and the lipid source is palmitic acid;
5- there is no accumulation in the compartment -steady state hypothesis- and no change in the human mass and composition;
6- the degradation of formation of faeces, urea, equation of the form
the diet (,olucose + palmitic acid + biomass) leads to the CO2 and water, and can be described by one stoichiomeuic
[C.H.O.N.]FC.CD + a @_
Jl
In order to establish the stoichiometric equations, the 8 unknowns (a, b, c, a, p, 6, E, [) must be calculated. Four conservation balances for the elements C.H.0.N are considered and four assumptions must be stated. Three methods can actually be used:
I- relations for the determination of a, 6, E, < are established as functions of the energy demand or of the total mass of the food (from data available in the Life support and habitability manual (6) );
2- assumptions for the faeces composition and for the urea production, givin,o a
relation for E (from data available in the Life support and habitability manual (6) and (7) );
3- assumptions for the faeces composition and for the oxygen consumption, giving a
relation for a. For the two last methods the faeces composition established from data available in the
Life support and habitability manual (7) has been calculated to be CHt.ag00 tjNO,t0j5.
In the third method the stoichiometic coefficient a (the oxygen consumption) is given as a function of the ener,g demand (6) by the followin,o relation:
02 =0.2975 ED - 0.2 where ED is the Energy Demand in kcal/p.d.and 02 the mass of oxygen require in gp.d.)
Assuming an energy demand of 3000 kcal/p.d., a is then equal to 27,9 mol/p.d.
5
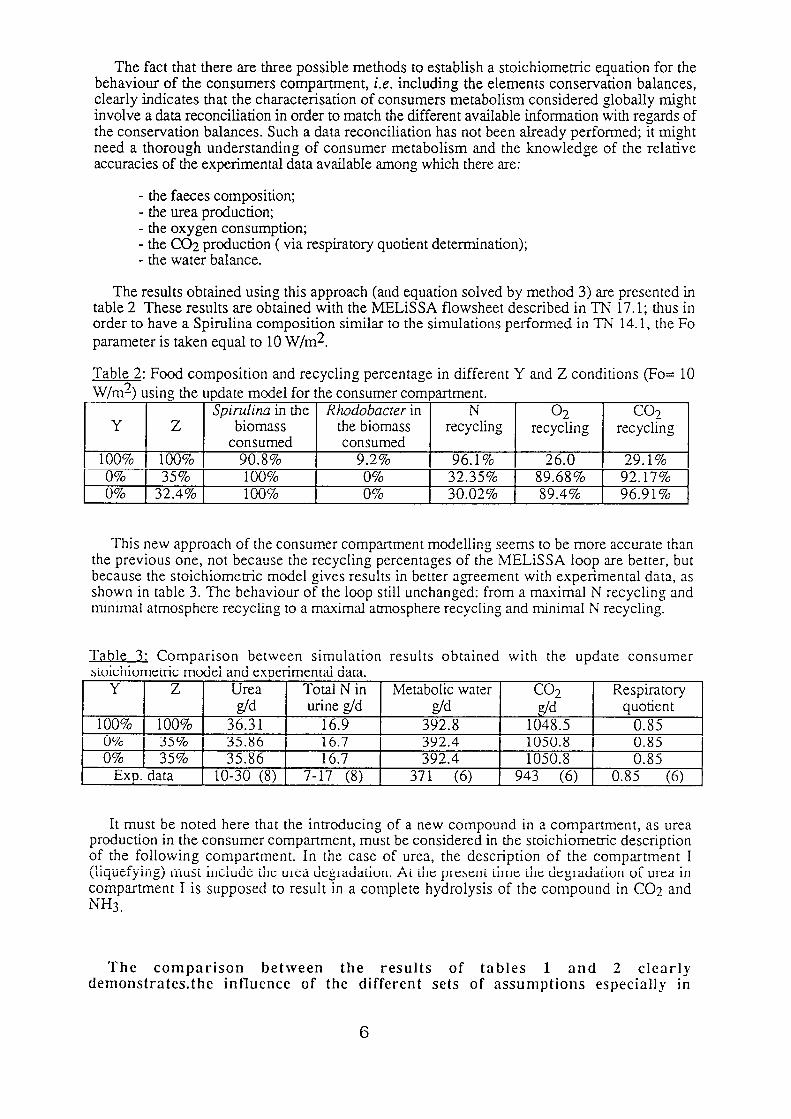
The fact that there are three possible methods to establish a stoichiometric equation for the behaviour of the consumers compartment, i.e. including the elements conservation balances, clearly indicates that the characterisation of consumers metabolism considered globally might involve a data reconciliation in order to match the different available information with regards of the conservation balances. Such a data reconciliation has not been already performed; it might need a thorough understanding of consumer metabolism and the knowledge of the relative accuracies of the experimental data available among which there are:
- the faeces composition; - the urea production; - the oxygen consumption; - the CO;! production ( via respiratory quotient determination); - the water balance.
The results obtained using this approach (and equation solved by method 3) are presented in table 2 These results are obtained with the MELiSSA flowsheet described in TN 17.1; thus in order to have a Spirulina composition similar to the simulations performed in TN 14.1, the Fo parameter is taken equal to 10 W/m2.
Table 2: Food composition and recycling percentage in different Y and Z conditions (Fo= l( W/m2) using the update model for the consumer comzartment.
Spirulina in the Rhodobacter in N 02 co2 Y Z biomass the biomass recycling recycling
consumed consumed recycling
100% 100% 90.8% 9.2% 96.1% 26.0 29.1% 0% 35% 100% 0% 32.35% 89.68% 92.17% 0% 32.4% 100% 0% 30.02% 89.4% 96.91%
This new approach of the consumer compartment modelling seems to be more accurate than the previous one, not because the recycling percentages of the MELiSSA loop are better, but because the stoichiometric model gives results in better agreement with experimental data, as shown in table 3. The behaviour of the loop still unchanged: from a maximal N recycling and minimal atmosphere recycling to a maximal atmosphere recycling and minimal N recycling.
Table 3; Comparison between simulation results obtained with the update consumer
It must be noted here that the innoducing of a new compound in a compartment, as urea production in the consumer compartment, must be considered in the stoichiometric description of the following compartment. In the case of urea, the description of the compartment I (liquefying) must include the urea degradation. At the present time the degradation of urea in compartment I is supposed to result in a complete hydrolysis of the compound in CO;! and NH3.
The comparison between the results of tables 1 and 2 clearly demonstrates.the influence of the different sets of assumptions especially in
6

the case of total recycling biomass (Y=Z=lOO%). This confirms the interest of studying the global balances upon the consumers compartment.
The assumptions on which the stoichiometric equation are built can affect the MELiSSA loop at different levels (food composition, recycling percentage), as the changes in the consumer description show it. The general behaviour of the loop (atmosphere regeneration V.S. nitrogen element recycling performance) and the influence of the operating variables Y and 2 are however qualitatively unchanged.
1.2- The nhototronh comnartment
The approach to model this compartment is very different from the previous one, because of two reasons:
-the compartment is colonised by a micro-organism, and it is easier to describe a micro-organism metabolism than a human one;
- the Rhodobacteracae species is rather well described in the literature.
It is considered that the sole function of the phototroph compartment is the assimilation of volatile fatty acids (VFA) (photoheterotrophic function), and of Hz and CO2 (photoautotrophic function). This assumption determines the building of the stoichiometric model, leading to the biosynthesis of Rs. rubrum and Rh. capsulata.
The two micro-organisms have a very close metabolism, although some differences can be noticed (Rh. capsrtlata can not use ethanol (9), glycogen is not a storage component for Rs. rubrrtm or Rh. capsufata does not have the Hatch Slack pathway enzymes (11) ); thus, it was supposed that except their carbon substrates (VFA, CO2) and their electron donor in photoreactions (succinate, Hz), the two micro-organisms biosynthesis can be described by the same stoichiometric model.
The biosynthesis of Rhodobacter is based upon its composition (amino-acid, carbohydrate, DNA, RNA, lipids) and its metabolic pathways. In order to build the stoichiometric equation of this biosynthesis, several assumptions are made, the mains of which are the following (the complete description of the building will be the purpose of a further T.N.):
- the biomass composition (mass percentages) of Rhodobacter is 65% proteins 4.9% RNA 1% DNA 12.2% lipids 16.9% carbohydrates
- the proteic composition of Rhodobacter is known (12) (see appendix I);
- the polyphosphobutyrate (PHB) and the glycogen, as stored forms are not considered;
- the metabolic pathways for lipids, RNA, DNA and amino-acids are the same than these of E. coli;
- the carbohydrates are supposed to be equivalent to a polymer of glucose;
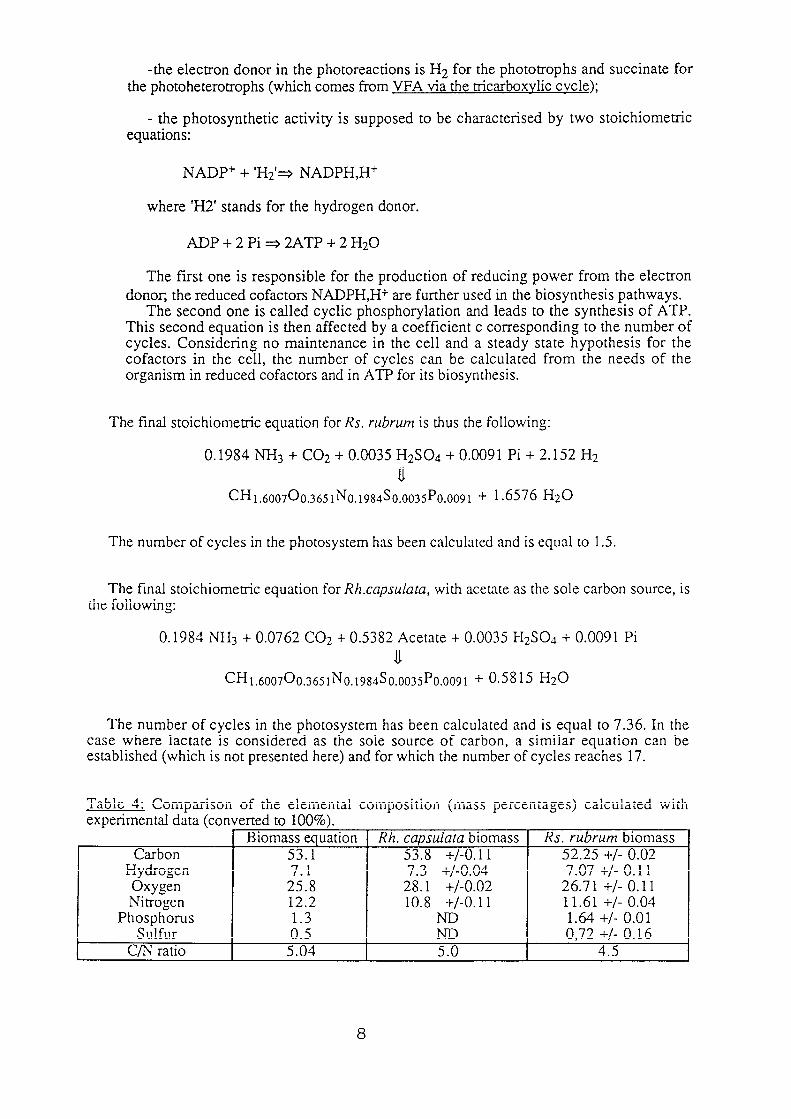
-the electron donor in the photoreactions is H2 for the phototrophs and succinate for the photoheterotrophs (which comes from VFA via the tricarboxylic cvcle);
- the photosynthetic activity is supposed to be characterised by two stoichiometric equations:
NADP+ + ‘H2’a NADPH,H+
where ‘H2’ stands for the hydrogen donor.
The first one is responsible for the production of reducing power from the electron donor, the reduced cofactors NADPH,H+ are further used in the biosynthesis pathways.
The second one is called cyclic phosphorylation and leads to the synthesis of ATP. This second equation is then affected by a coefficient c corresponding to the number of cycles. Consider-in g no maintenance in the cell and a steady state hypothesis for the cofactors in the cell, the number of cycles can be calculated from the needs of the organism in reduced cofactors and in ATP for its biosynthesis.
The final stoichiometric equation for Rs. rubrum is thus the following:
0.1984 NH3 + CO2 + 0.0035 H2SO4 + 0.0091 Pi + 2.152 H2
v
CH1.6007C0.3651~0.1984S0.0035P0.0091 + 1.6576 H20
The number of cycles in the photosystem has been calculated and is equal to 1.5.
The final stoichiomeuic equation for Rh.capsufara, with acetate as the sole carbon source, is the following:
0.1984 NH3 + 0.0762 CO;! + 0.5382 Acetate + 0.0035 H2SO4 + 0.0091 Pi
v
CH~.6oo~~o.~6~~~0.1~8~So.oo~~~o.oo~~ + 0.5815 H20
The number of cycles in the photosystem has been calculated and is equal to 7.36. In the case where lactate is considered as the sole source of carbon, a similar equation can be established (which is not presented here) and for which the number of cycles reaches 17.
Table 4: Comparison of the elemental composition (mass percentages) calculated with experimental data (converted to 100%).
Biomass equation Rh. capsulata biomass Rs. rubrum biomass Carbon 53.1 53.8 +/-0.1 1 52.25 +/- 0.02
Hydrogen 7.3 +/-0.04 7.07 +/- 0.11 Oxygen
275;
12:2 25.1 +/-0.02 26.71 +/- 0.11
Nitrogen 10.8 -t/-O. 11 11.61 +/- 0.04 Phosphorus 1.3 ND 1.64 +/- 0.01
Sulfur 0.5 ND 0,72 +/- 0.16 C/N ratio 5.04 5.0 4.5
8
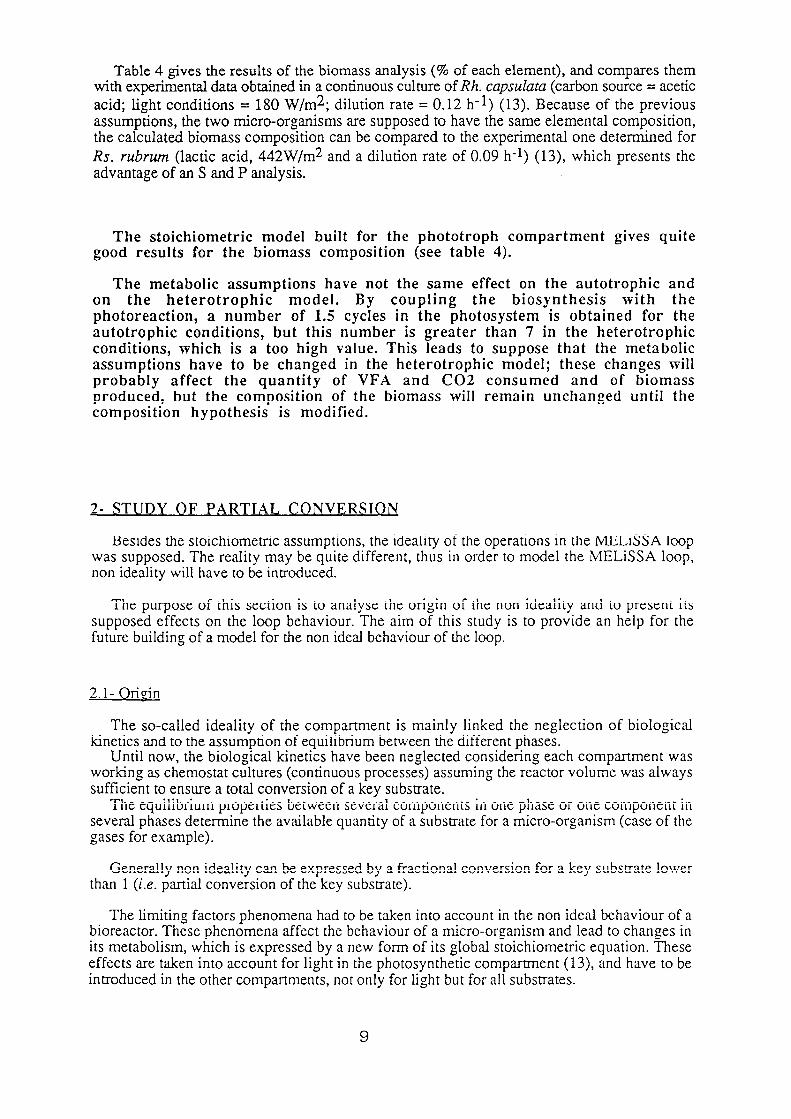
Table 4 gives the results of the biomass analysis (% of each element), and compares them with experimental data obtained in a continuous culture of Rh. capsulara (carbon source = acetic acid; light conditions = 180 W/m2; dilution rate = 0.12 h-l) (13). Because of the previous assumptions, the two micro-organisms are supposed to have the same elemental composition, the calculated biomass composition can be compared to the experimental one determined for Rs. rubrum (lactic acid, 442W/m2 and a dilution rate of 0.09 h-l) (13), which presents the advantage of an S and P analysis.
The stoichiometric model built for the phototroph compartment gives quite good results for the biomass composition (see table 4).
The metabolic assumptions have not the same effect on the autotrophic and on the heterotrophic model. By coupling the biosynthesis with the photoreaction, a number of 1.5 cycles in the photosystem is obtained for the autotrophic conditions, but this number is greater than 7 in the heterotrophic conditions, which is a too high value. This leads to suppose that the metabolic assumptions have to be changed in the heterotrophic model; these changes will probably affect the quantity of VFA and CO2 consumed and of biomass produced, but the composition of the biomass will remain unchanged until the composition hypothesis is modified.
2- STUDY OF PARTTAI, CONVERSTO~
Besides the stoichiometric assumptions, the ideality of the operations in the MELiSSA loop was supposed. The reality may be quite different, thus in order to model the MELISSA loop, non ideality will have to be introduced.
The purpose of this section is to analyse the origin of the non ideality and to present its supposed effects on the loop behaviour. The aim of this study is to provide an help for the future building of a model for the non ideal behaviour of the loop.
Origin 2.1-
The so-called ideality of the compartment is mainly linked the neglection of biological kinetics and to the assumption of equilibrium between the different phases.
Until now, the biological kinetics have been neglected considering each compartment was worldng as chemostat cultures (continuous processes) assuming the reactor volume was always sufficient to ensure a total conversion of a key substrate.
The equilibrium properties between several components in one phase or one component in several phases determine the available quantity of a substrate for a micro-organism (case of the gases for example).
Generally non ideality can be expressed by a fractional conversion for a key substrate lower than 1 (i.e. partial conversion of the key substrate).
The limiting factors phenomena had to be taken into account in the non ideal behaviour of a bioreactor. These phenomena affect the behaviour of a micro-organism and lead to changes in its metabolism, which is expressed by a new form of its global stoichiometric equation. These effects are taken into account for light in the photosynthetic compartment (13), and have to be introduced in the other compartments, not only for light but for all substrates.
9
The non ideal behaviour of the compartments has 2 main consequences:
_ the key components are not completely assimilated in the different compartments;
_ the stoichiometric equations may be functions of the limiting components or factors in the compartments.
2.2- Conseauences of the non ideal behaviour of a comuartment on the following one
The non ideal functioning of a compartment leads to an output (gas and liquid) which contains remaining substrates and products and of course biomass.
The output of remaining substrates and products is an input for the following compartment; thus through its output, a compartment acts upon the behaviour of the following one.
Before building a model for this compartment, it is necessary to investigate the composition of its inputs and their effects on its behaviour (i.e. on the micro-organisms which colonise it). For these investigations, 2 questions have to be answered:
- which components can assimilate the micro-organisms colonising the compartment (table 5), and how do they use it ?
- is there limiting effects (by toxicity or not) of the effluent of a compartment to the following ?
Table 5: components used by organisms colonising the different compartments considering ideal and non ideal behaviour of the loop
Compartment Components Possible components involved in non ideal involved presently behaviour
I Faeces Faeces Urea Urea
[possible production of CIQ] II VFA, CO2 VFA, CO29 H2, NH
H2, NH3 Remaining Urea an di other products of compartment I
III NH3 NH3, CO2
W2 Remaining Urea, VFA IV mo3 HNO3, CO;!
Co2 Remaining Urea, NH3, VFA
In the case of the phototroph compartment, the investigation between the two subcompartments (heterotrophic/autotrophic) (figure 1) leads to the following conclusions.
In the output stream of the liquefyin, 0 compartment the main components are Hz, COT, water, urea, VFA and N-organic compounds (13). The photoheterotrophic compartment is supposed to assimilate VFA, while the photoautotrophic one eliminates Hz. Because of the non ideal behaviour and of the defined flowsheet design, the same components (Hz, CO2, water, urea, VFA and N-organic compounds), but in different ratios, are involved in the 2 subcompartments.
10
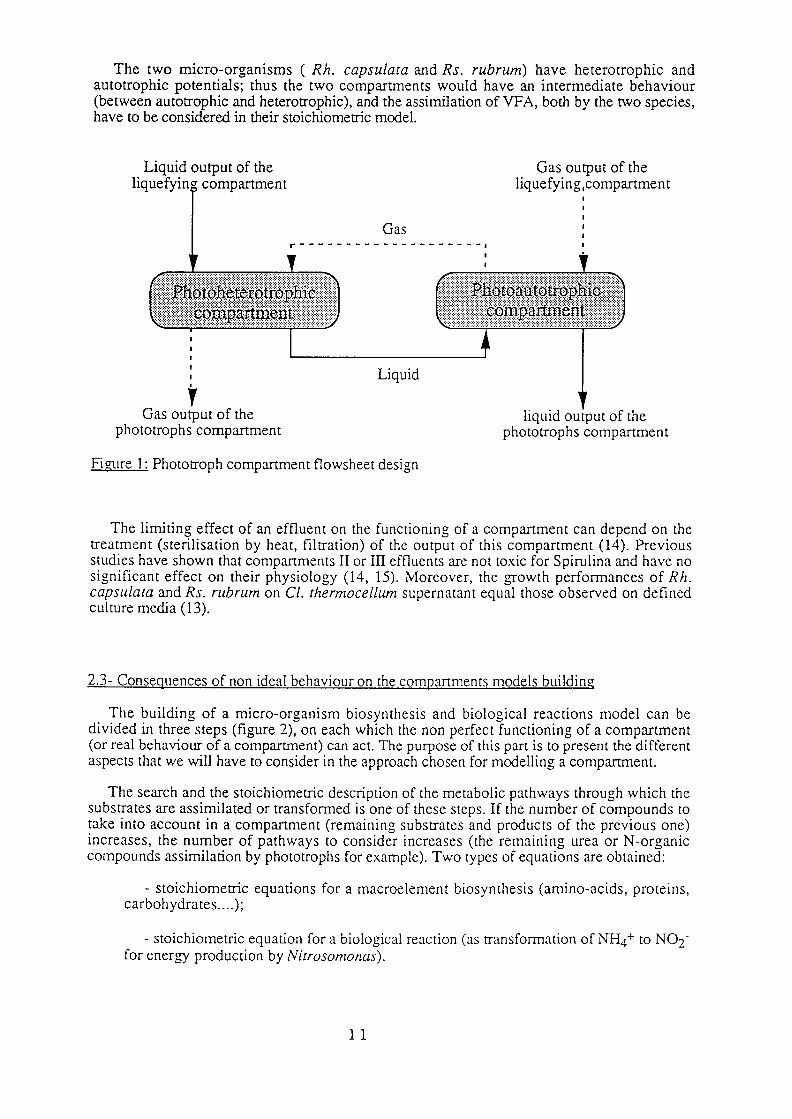
The two micro-organisms ( Rh. capsulata and Rs. rubrum) have heterotrophic and autotrophic potentials; thus the two compartments would have an intermediate behaviour (between autotrophic and heterotrophic), and the assimilation of VFA, both by the two species, have to be considered in their stoichiometric model.
Liquid output of the
-_
Gas output of the liquefying,compartment
Gas -----------a I
Liquid
i Gas output of the
phototrophs compartment liquid output of the
phototrophs compartment
Fizure 1: Phototroph compartment flowsheet design
The limiting effect of an effluent on the functioning of a compartment can depend on the treatment (sterilisation by heat, filnation) of the output of this compartment (14). Previous studies have shown that compartments II or III effluents are not toxic for Spirulina and have no significant effect on their physiology (14, 15). Moreover, the growth performances of Rh. capsrtlata and Rs. rubrum on Cl. rherrr~ocellrm supernatant equal those observed on defined culture media (13).
2.3- Consequences of non ideal behaviour on the comnartments models building
The building of a micro-organism biosynthesis and biological reactions model can be divided in three steps (figure 2) on each which the non perfect functioning of a compartment (or real behaviour of a compartment) can act. The purpose of this part is to present the different aspects that we will have to consider in the approach chosen for modelling a compartment.
The search and the stoichiomenic description of the metabolic pathways through which the substrates are assimilated or transformed is one of these steps. If the number of compounds to take into account in a compartment (remaining substrates and products of the previous one) increases, the number of pathways to consider increases (the remaining urea or N-organic compounds assimilation by phototrophs for example). Two types of equanons are obtained:
- stoichiometric equations for a macroelement biosynthesis (amino-acids, proteins, carbohydrates....);
- stoichiometric equation for a biological reaction (as transformation of NH4+ to N02- for energy production by Nitrosomonas).
11
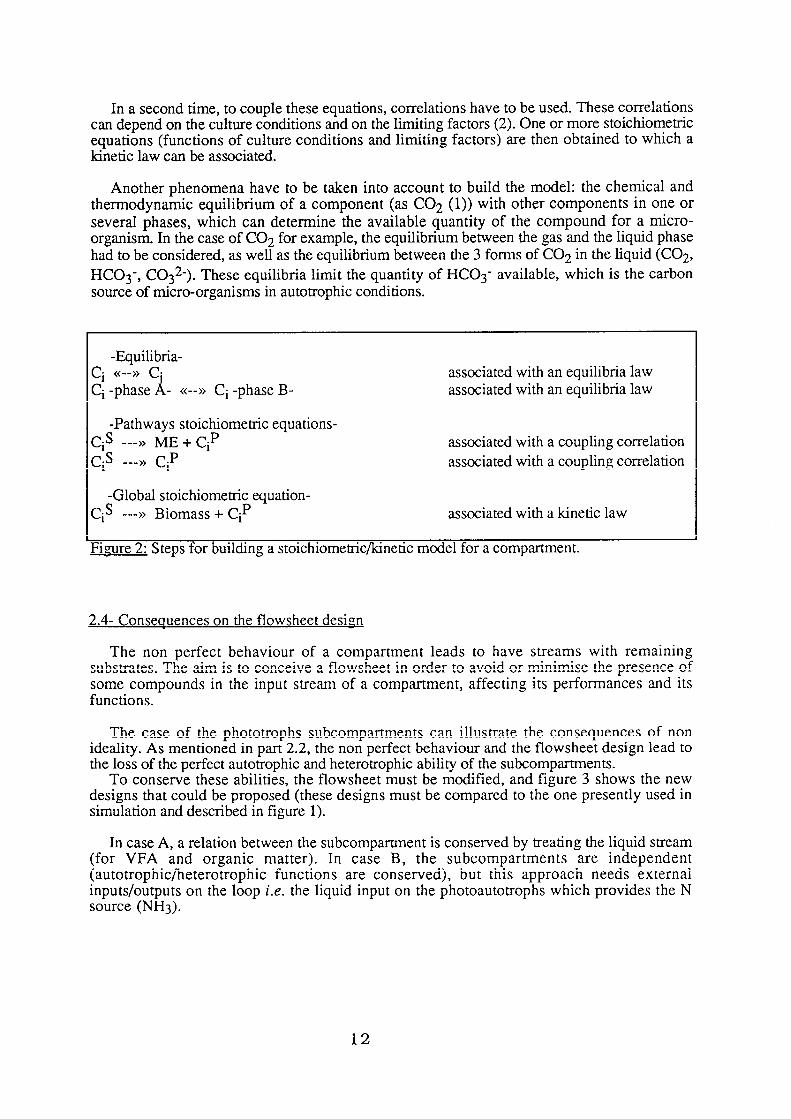
In a second time, to couple these equations, correlations have to be used. These correlations can depend on the culture conditions and on the limiting factors (2). One or more stoichiometric equations (functions of culture conditions and limiting factors) are then obtained to which a kinetic law can be associated.
Another phenomena have to be taken into account to build the model: the chemical and thermodynamic equilibrium of a component (as CO2 (1)) with other components in one or several phases, which can determine the available quantity of the compound for a micro- organism. In the case of CO2 for example, the equilibrium between the gas and the liquid phase had to be considered, as well as the equilibrium between the 3 forms of CO2 in the liquid (COz,
HC03-, C032-). Th ese equilibria limit the quantity of HC03- available, which is the carbon source of micro-organisms in autotrophic conditions.
-Equilibria- Ci <<-->> C’ Ci -phase A - <<--D Ci -phase B-
-Pathways stoichiometric equations- Cis ---)) ME + Cip
Cis --->> Cip
-Global stoichiometric equation- Cis --->) Biomass + Cip
associated with an equilibria law associated with an equilibria law
associated with a coupling correlation associated with a coupling correlation
associated with a kinetic law
Figure 2: Steps for building a stoichiometric/kinetic model for a compartment.
2.4- Conseauences on the flowsheet design
The non perfect behaviour of a compartment leads to have streams with remaining substrates. The aim is to conceive a flowsheet in order to avoid or minimise the presence of some compounds in the input stream of a compartment, affecting its performances and its functions.
The case of the phototrophs subcompartments can illustrate the consequences of non ideality. As mentioned in part 2.2, the non perfect behaviour and the flowsheet design lead to the loss of the perfect autotrophic and heterotrophic ability of the subcompartments.
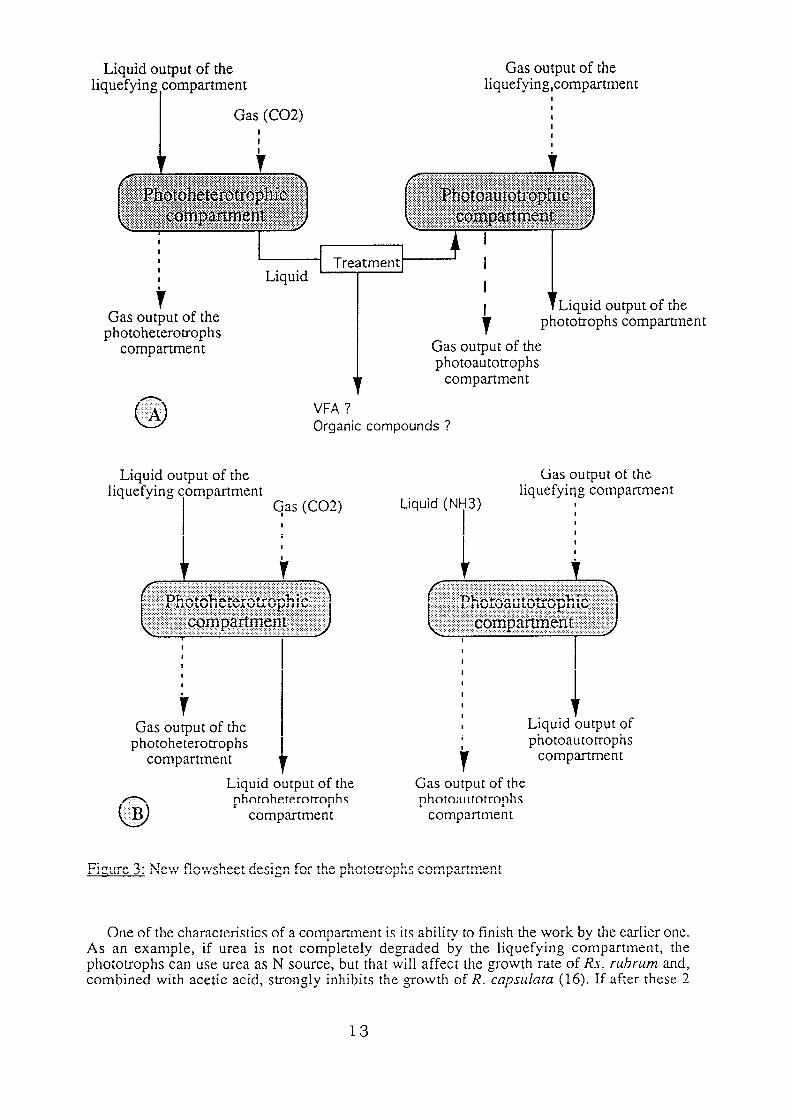
To conserve these abilities, the flowsheet must be modified, and figure 3 shows the new designs that could be proposed (these designs must be compared to the one presently used in simulation and described in figure 1).
In case A, a relation between the subcompartment is conserved by treating the liquid stream (for VFA and organic matter). In case B, the subcompartments are independent (autotrophic/heterotrophic functions are conserved), but this approach needs external inputs/outputs on the loop i.e. the liquid input on the photoautotrophs which provides the N source (NH3).
12
Liquid output of the liquefying compartment
Gas (C02) I I I
Gas output of the liquefying,compartment
I I I I I I
photoheterotrophs compartment
phototrophs compartment
Gas output of the photoautotrophs
compartment
0 :-‘A WA ?
Organic compounds ?
Liquid output of the liquefying compartment
Gas (CO2) I I I
Gas output of the photoheterotrophs
compartment
Gas oumut of the
Liquid (NH3) liquefying compartment
I
I I I
Liquid output of photoautotrophs
compartment
::.. 0 :‘B
Liquid output of the Gas output of the photoheterotrophs photoautotrophs
compartment compartment
Fi:ure 3: New flowsheet design for the phototrophs compartment
One of the characteristics of a compartment is its ability to finish the work by the earlier one. As an example, if urea is not completely degraded by the liquefying compartment, the phototrophs can use urea as N source, but that will affect the growth rate of Rs. rubrum and, combined with acetic acid, stron,oly inhibits the growth of R. capsdata (16). If after these 2
13
compartment the urea still too high, a separator process must be added in order to limit the accumulation of urea in the following compartment and in the loop.
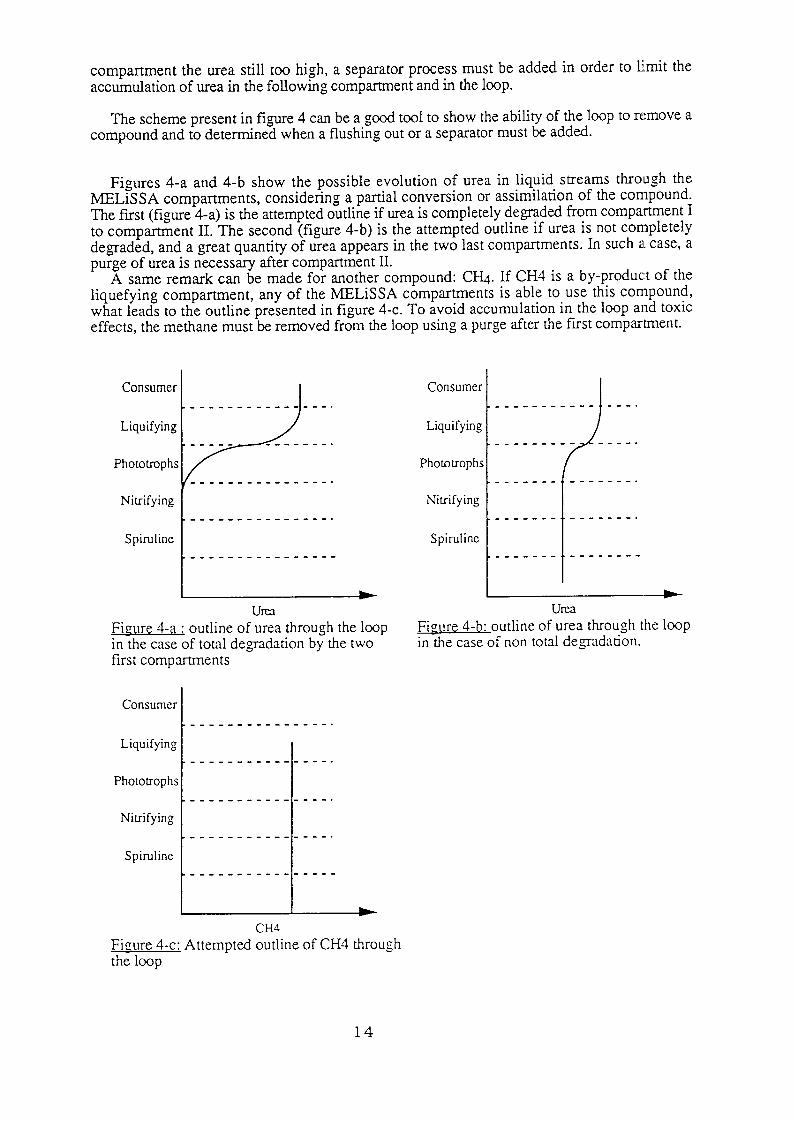
The scheme present in figure 4 can be a good tool to show the ability of the loop to remove a compound and to determined when a flushing out or a separator must be added.
Figures 4-a and 4-b show the possible evolution of urea in liquid streams through the MELiSSA compartments, considering a partial conversion or assimilation of the compound. The first (figure 4-a) is the attempted outline if urea is completely degraded from compartment I to compartment II. The second (figure 4-b) is the attempted outline if urea is not completely degraded, and a great quantity of urea appears in the two last compartments. In such a case, a purge of urea is necessary after compartment II.
A same remark can be made for another compound: CH+ If CH4 is a by-produc:t of the liquefying compartment, any of the MELiSSA compartments is able to use this compound, what leads to the outline presented in figure 4-c. To avoid accumulation in the loop and toxic effects, the methane must be removed from the loop using a purge after the first compartment.
Consumer
Liquifying
Phototroph:
Niuifying
Spiruline
.____ __ _____ e-m-.
Consumer
i i ___________ ---.
Liquifying I
Photarophs[ --:~-:;
Nitrifying I
Spirulinc
I I
______w ___-----
URX Figure 4-a : outline of urea through the loop in the case of total degradation by the two first compartments
UE3
Fiaure 4-b: outline of urea through the loop in the case of non total degadation.
Consumer
Liquifying
Phototrophs
Nitrifying
Spiruline
._________- -mm--.
.____ _ _____ _--me.
,___________-mm-.
I I c CH4
Figure 4-c: Attempted outline of CH4 through the loop
14
Modifications (filter-separator modules, inputs/outputs on the loop:) must appear in the flowsheet design in order to conserve the abilities and performances of the compartments. It is difficult at the present time to estimate the importance of theses modifications and their consequences on the loop behaviour.
CONCLUSION
The non perfect behaviour (i.e. real behaviour) of the compartments have the following main consequences:
- a fractional conversion for the key substrates of a compartment lower than 1 and which mainly depends on time factors (as dilution rate of the bioreactor), physical factors (equilibrium, transfer limitations) and compounds factors (i.e. a compound which can be better assimilated by the organism than the key substrate);
- changes in the micro-organism metabolism, due to remaining substrates of the other compartment and of limitin g factors (as light), and which needs a variable stoichiometric description of a compartment.
The behaviour of all compartments are interdependent, thus the changes in a compartment behaviour affect the others, and by the way the global behaviour of the entire loop. To limit these changes some modifications in the present AMELiSSA loop design (1) will probably have to be taken into account, as the designs proposed in figure 3 to maintained a photoautotrophic behaviour in compartment II.
It is difficult at the present time to estimate the changes in the loop design and in compartment behaviour, and their consequences on the loop behaviour. It seems reasonable to consider that the opposite behaviours (atmosphere regeneration/N element recycling performance) of the loop will be conserved, but in different and presently unknown working conditions.
The only predictable effect of the non ideal behaviour of compartments on the loop is the probably decrease of the actual recycling performances in the same conditions of simulation (Y, 2 and Fo parameters).
15
REFERENCES
1 POUGHON L. “MELiSSA modelling and simulation - Gas streams.” Technical note 17.1. ESTEC Contract 8124/88/NL/FG CCN4.1994
2 POUGHON L. “MELiSSA modelling and simulation - Spirulina modelling.” Technical note 17.3. ESTEC Contract 8124/88/NL/FG CCN4. 1994
3- DUSSAP C.G., GROS J.B. “Simulation des flux de matiere dans l’ecosysteme MELiSSA.” Technical note 14.1. ESTEC Contract 8 125/88/NL/FG WF’ 14. 199 1.
4- DUSSAP C.G., GROS J.B. “Simulation des flux de matiere dans l’ecosysteme MELiSSA - Etude des contraintes d’anatrobiose et d’aerobiose dans les compartiments.” Technical note 14.2. ESTEC Contract 8125/88/NL/FG WP 14. 1991.
5-m E., DEVIDTS G., MILAN H., DECARLI B., ADINE A.M., CAMBRAY MC., V. POLYAKOV and AGUREEV. A. “Nutritional behaviour of people during a two month duration isolation and confinement simulation”. SAE TECHNICAL PAPER SERIES 932067. 1993.
6- Life support and habitability manual. Vol. 1, Chap. 1. ESA PSS 03-406. 1991.
7- HUTTENBACH R. C. and BINOT. R. A. “ESA PSS 03406: Life support and habitability manual”. Proceedings of the 4th European Symposium on space environmental and control systems, Florence, Italy. 199 1.
8- Biotechnology vol 8 - Microbial degradation -. H.J. REHM and G. REED ed., W. SCHONBORN vol. ed. ~28. 1986.
9- Bergey’s manual of systematic bacteriology. 9th edition. ~013. pp 1658-1673. 1989.
lo- CLAYTON R. and SISTRONS. W. The photosynthetic bacteria. Plenum Press, - New York. 1978.
1 I- BUCHANAN B. B., EVANS M. C. Wand ARNON. D. I. “Ferredoxin-dependent carbon assimilation in Rs. Rubrurn. Archiv. fur Mibobiologie, 59, l-3,32-40. 1967.
12- KOBAYASHI M. & KURATA S. “The mass culture and cell utilisation of photosynthetic bacteria” Process Biochemistry , 13,27-30. 1978
13-Technical note 7-2. ” The growth of pure cultures of Rh. capsulara and Rs. rttbrum on the supernatant of the liquefaction compartment. ” ESTEC/CONTRACT 8 125/88/NL/FG -CCNl-.
14- Technical note 7-4. ” Toxicity tests of Nitrosomonas-Nitrobacter effluents on Spirulina”. ESTEC/CONTRACT 8125/88/NL/FG-CCNl-.
15- Technical note 8-l. ” Toxicity tests of Rhodobacter effluents on Spirulina”. ESTEC/CONTRACT 8 125/88/NL/FG-CCN I-.
16- Albiol J., Gicqueau B. and Lasseur C. “Preliminary studies on the performance and behaviour of the MELiSSA photoheterouophic compartment”. SAE TECHNICAL PAPER SERIES 941410. 24th ICES. 1994.
16

APPENDIX
17

APPENDIX I
Amino acid composition of proteins of Rhodopseudomonas capsulata (12)
Amino acid Formula Mole/lOOg dry weigth
Isoleucine Leucine Lysine Methionine Phenyalanine Tyrosine Threonine Tryptophane Valine Arginine Histidine Alanine Aspartate Glutamate Glycine Proline Serine Aspargine Glutamine
C6H1302N C6H1302N W1502N Wh102NS W-h 102N Q% 103N C4fW2N CllH1202N2 CsHll02N
E$i:g$
C3H702N WW4N WW4N C2&02N C5H802N C3H703N aH604N2 WW4N2
0.0177 0.0302 0.0173 0.0095 0.0142 0.0086 0.0197 0.0049 0.0260 0.0173 0.0072 0.0435 0.0304 0.0326 0.0259 0.0212 0.0137 0.01455 0.01455
18