melinda eichhorn - exploring the use of a screening tool to investigate students mathematical...
TRANSCRIPT

Investigating mathematical thinking in children in India 262
© 2016 Dyslexia Association of Singapore www.das.org.sg
Asia Pacific Journal of Developmental Differences Vol. 3 No. 2 July 2016
How can 5 + 6 = 7? Exploring the use of a screening tool to investigate students’ mathematical thinking in class two in Kolkata, India Melinda Eichhorn1* 1 Gordon College (USA)
Abstract Difficulties in math can begin very early in children’s development, as some students come to school with a limited amount of number sense. By assessing number sense in the initial stages of elementary education, teachers can identify students experiencing difficulties in mathematics and begin early intervention. In this mixed‐methods pilot study in Kolkata, India, second grade students (n = 185) completed a researcher‐constructed mathematical screening tool. Using the theoretical framework of constructivism and the Response to Intervention (RtI) model, the findings of the mathematics screening are presented, viewing students’ errors as an opportunity for teachers to learn and understand students’ misconceptions with the goal of intervention in mind, as opposed to waiting for students to fail before addressing their difficulties. Keywords: Early math intervention, screening tool, number sense, math learning disabilities, error analysis, India
Asia Pacific Journal of Developmental Differences Vol. 3, No. 2, July 2016, pp 262—294 DOI: 10.3850/S2345734116000302
* Correspondence to: Melinda (Mindy) Eichhorn, Gordon College, USA. Email: [email protected]

263 M. Eichhorn
© 2016 Dyslexia Association of Singapore www.das.org.sg
Asia Pacific Journal of Developmental Differences Vol. 3 No. 2 July 2016
Introduction
You enter your classroom and face 40 second grade students. You open your math textbook and turn around to write the math problems on the board. You know some students in your class are behind, but you must con nue to move ahead, or else you won’t cover all of the content in the textbook by the end of the year. Your only tools are the white board and markers in the classroom. Your school has a math lab, but all of the materials must stay in that room. Plus, it is difficult to maintain order if the students are playing with all of those blocks. They should be wri ng all of the problems on the board in their notebook. A er all, this is the way you were taught math, and you have been able to understand. The students who are behind will have to just try harder.
Elementary teachers in India have students with various levels of math abilities in one classroom. Difficulties in math can begin very early in a child’s development, as some students come to school with an intuitive knowledge of numbers and their magnitude (Kaufmann, 2008). Students that do not enter school with this sense of numbers exhibit atypical number development (Ansari, Holloway, Price, & van Eimeren, 2008). Students may be “dysfluent” in calculation due to foundational weakness in number sense (difficulty with number relationships and combinations) (Jordan, Glutting, & Ramineni, 2008, p. 46). Students with atypical number sense may be later diagnosed as having math learning disabilities, and these students tend to
use developmentally immature and inefficient strategies to retrieve facts and solve problems, as compared to their peers (Ostad, 2008). As students progress through elementary education and enter secondary and post-secondary education, students with strong math skills have greater college and career options, as well as higher future incomes (National Mathematics Advisory Panel, 2008; Jordon, Glutting, & Ramineni, 2008). Dowker (2005) indicates that the impact of poor arithmetical skills is greater than the influence of poor reading skills on employment prospects (Grégoire & Desoete, 2009; Siegler, 2007). Poor achievement in mathematics can have severe educational and employment implications for students (Jordan, Glutting, & Ramineni, 2008). Early childhood and elementary teachers are instrumental in determining which students have difficulty in math and ensuring they can access the grade-level math curriculum. However, they need tools to accomplish the task. Researchers have been developing early childhood screening tools to predict math difficulties in the early grades (Krasa & Shunkwiler, 2009). In fact, all students can be screened in kindergarten for difficulties in mathematics, including some tasks which are powerful predictors of math learning disabilities (MLD) (Desoete et al., 2009; Griffin & Case, 1997). Recently, a range of screening tests have been developed for children with reading difficulties/dyslexia in India (Fawcett & Nicolson, 2012; National Brain Research Centre, 2015). However, no such tools are being used in elementary schools in India for mathematics. What would happen if the teacher in the opening vignette had

Investigating mathematical thinking in children in India 264
© 2016 Dyslexia Association of Singapore www.das.org.sg
Asia Pacific Journal of Developmental Differences Vol. 3 No. 2 July 2016
more understanding of the various mathematical abilities of their students, especially in regards to the most basic building block of math understanding, number sense? This study investigates the use of a screening tool to examine primary students’ mathematical thinking in Kolkata, India. The screening tool for students in 2nd standard (grade) was piloted in June and July 2015. Screening assessments are designed to be administered to all students, test grade-level skills, and are brief in length. The screener was designed to identify students who are on target, in need of some support, and in need of intensive support in mathematics so teachers can better detect students who need remediation and intervention in mathematics at an early stage in the learning process (Winterman & Rosas, 2014). A screening tool can help teachers pinpoint specific difficulties that research has linked to math learning disabilities (MLD), but not diagnose MLD, in early elementary school so remediation can begin as soon as possible to avoid future conceptual difficulties. A screening tool empowers teachers when they are trained in interpreting common misconcept ions and er rors in mathematical understanding, and helps teachers identify students who need help or intervention earlier than waiting for a diagnosis of learning disability (Karande, Sholarpurwala, & Kulkarni, 2011). The screener will reveal qualitative differences between students and their math abilities, which may help teachers understand the heterogeneity of students’ math abilities. The study focused on the following
research questions:
What information can be gathered by teachers to ascertain Indian students’ grade-level math skills and number sense using a screening tool?
What error patterns emerge
among 2nd standard students who are in need of intensive intervention in mathematics?
How can teachers use a
screening tool to change their instruction and intervention techniques to support student learning?
This study builds upon previous work in India which examined the lack of uniformity for learning disability diagnosis and attempted to create alternative, simplified procedures (Mogasale et al., 2012; Ramaa & Gowramma, 2002). Additionally, multiple studies have recommended increased training for primary school teachers, early screening tools, and more remedial education and special educators in primary and s e conda r y s c hoo l s ( Ka rande , Sholapurwala, & Kulkarni, 2011; Karande, Doshi, Thadhani & Sholapurwala, 2013; Unni, 2012). Although some research studies in India have suggested that early screening tools need to be developed, teachers’ use of these screening tools to adjust their instruction has been largely unexamined. Therefore, the study contributes valuable information to the field of learning disabilities and math difficulties in India. Currently, there is an extreme lack of

265 M. Eichhorn
© 2016 Dyslexia Association of Singapore www.das.org.sg
Asia Pacific Journal of Developmental Differences Vol. 3 No. 2 July 2016
awareness of learning disabilities among Indian teachers (Unni, 2012; Al-Yagon et al., 2013). Screening tools will be beneficial to teachers and students’ families, since they can gather important information about a child’s math skills without spending time and money on formal educational and psychological assessments. The purpose of these screeners is to be able to look into the way students make sense of mathematics, connected to Math Practice Standard 1: Make sense of problems and persevere in solving them (Common Core State Standards Initiative, 2014b). Although a child may need formal testing in the long run, informal screening can help identify students as being at-risk for mathematical difficulties or MLD and begin targeted remediation and intervention much earlier. If these early math deficits, or differences, are remediated immediately, then students may not fall further behind their peers in math skills (Desoete, et al., 2009). Addressing mathematical errors usually requires several simultaneous types of remedial and instructional interventions (Geary, Hoard, Nugent, & Bailey, 2012). Interventions may be particularly effective if they are early (Dowker, 2005; Nelson & Sheridan, 2011). Early identification is critical, so students can learn strategies and skills as soon as possible (McGrady, Lerner, & Boscardin, 2001). Background Difficulties in mathematics and math learning disabilities Students with learning disabilities have average to above average intelligence, yet exhibit differences in cognitive
abilities, which may lead to deficiencies in academic performance (Lewis, 2011). Students and adults with learning disabilities are individuals who, at an academic level, perform substantially below their peers, and whose poor performance cannot be explained by any deficit in vision, speech, hearing or intelligence. It is, in a sense, “unexpected underachievement” (Fletcher, Lyon, Fuchs, & Barnes, 2007, p. 27; American Psychiatric Association, 2013a, 2013b). Compared to research on reading learning disabilities, the research on MLD is in the infancy stages (Chinn, 2004; Desoete, Ceulemans, De Weerdt, & Pieters, 2012). Learning disabilities can occur in the areas of reading, mathematics and/or written expression (Fletcher, Lyon, Fuchs, & Barnes, 2007). Mathematical Learning D i s a b i l i t y ( M L D ) i s b e i n g reconceptualized so the identification of difficulties is not solely centered on fluency and accuracy. Instead, researchers are now taking a closer look at the atypical and alternative understandings of students with MLD (Lewis, 2014). There are variations within the complex construct of MLD (Mazzocco & Devlin, 2008). Instead of using the term, “Dyscalculia,” which places extra emphasis on calculation speed, accuracy, and automaticity, this article will focus on students’ conceptual understanding of math topics and representations (Lewis, 2014). However, it is acknowledged that the term “dyscalculia” is used widely in India. Research suggests that conceptual and representational issues are the reasons for mathematical errors for students with

Investigating mathematical thinking in children in India 266
© 2016 Dyslexia Association of Singapore www.das.org.sg
Asia Pacific Journal of Developmental Differences Vol. 3 No. 2 July 2016
Mathematical Learning Disabilities (MLD), as opposed to difficulty with mathematical calculation (Lewis, 2014; Hecht & Vagi, 2010; Mazzocco & Devlin, 2008). Studies have revealed that students with MLD have weak rational number sense and struggle with conceptual ideas of mathematics. These students also have persistent understandings, inaccurate beliefs, and misconceptions about math concepts which have been formed throughout elementary school (Mazzocco & Devlin, 2008; Lewis, 2014). Unfortunately, there is no consensus regarding which of the early predictors could be used as screeners to identity children with math difficulties. Counting ability, conceptual counting knowledge (counting principles such as stable order, one-to-one correspondence, and cardinality), number sense and magnitude comparison, early arithmetic skills, and IQ may be promising early predictors for MLD (Stock, Desoete, & Roeyers, 2010). Typically, schools begin identifying students as having learning disabilities around third grade (Fuchs et al., 2013). Yet, preventative screening and intervention can begin as early as kindergarten (Krasa & Shunkwiler, 2009; Jordan et al., 2007). In India, due to various policies concerning students with learning disabilities and low awareness among teachers and parents, many students in India are not diagnosed with MLD or other learning disabilities, and if they are, it is usually in 8th standard or later (Karande & Gogtay, 2010). By this time, it is difficult to remediate the many misconceptions which students have
formed about mathematical ideas. The former Director of NCERT recognized the current lack of awareness and training for math learning disabilities and early intervention in mathematics by saying: “We need to better understand how to identify math difficulties at an early level and what should be done for these children” (P. Sinclair, personal communication, July 5, 2013). Indian mathematics curriculum In India, education is a responsibility of both the national and state governments. The national government performs an advisory role, but allows states the freedom to adapt or adopt policy and curricula, since the context varies considerably from state to state (M. Jain & K. Sharma, personal communication, July 5, 2013). The National Council for Educational Research and Training (NCERT) has developed a syllabus for mathematics for grades 1-5, which should inform textbook creators. According to the Syllabus for Classes at the Elementary Level (NCERT, 2006a), students should know and be able to do the following math skills within the topic of “Numbers” by the end of 1st standard: According to the NCERT (2006b) textbook, Math Magic, Class 1 students are asked to identify both unknown addends when the sum is given (e.g. ☐ + ☐ = 7) (p. 60). This is comparable to the 1st grade C o m m o n C o r e s t a n d a r d , CCSS.MATH.CONTENT.1.OA.D.8,
Determine the unknown whole number in an addi on or subtrac on equa on rela ng three whole numbers. For example, determine the unknown

267 M. Eichhorn
© 2016 Dyslexia Association of Singapore www.das.org.sg
Asia Pacific Journal of Developmental Differences Vol. 3 No. 2 July 2016
Table 1. Syllabus for Classes at the Elementary Level (NCERT, 2006a) The skills in bold were present on the researcher‐constructed screener.
NUMBERS: 1st STANDARD
DEVELOPING A SENSE OF NUMBERNESS, COUNTING AND OPERATIONS OF NUMBERS 1 - 9 AND ZERO
Observes objects and makes collections of objects. Arranges the collection of objects in order by
Matching and One to one correspondence
Counts the number of objects in a collection. Makes collection of objects corresponding to a specific number. Recognizes and speaks numbers from 1 to 9. Uses numbers from 1 to 9 in counting and comparison. (Real objects and
repeated events like clapping to be used for counting) Reads and writes numerals from 1 to 9. Adds and subtracts using real objects and pictures. Adds and subtracts the numbers using symbols ‘+’ and ‘-’. Approaches zero through the subtraction pattern
(such as 3 – 1 = 2, 3 – 2 = 1, 3 – 3 = 0). NUMBERS FROM (10 - 20)
Forms Number sequence from 10 to 20. Counts objects using these numbers. Groups objects into a group of 10s and single objects. Develops the vocabulary of group of ‘tens’ and ‘ones’. Shows the group of tens and ones by drawing. Counts the number of tens and ones in a given number. Writes the numerals for eleven to nineteen. Writes numerals for ten and twenty. Compares numbers up to 20.
ADDITION AND SUBTRACTION (UP TO 20)
Adds and subtracts numbers up to 20. NUMBERS FROM 21 - 99
Writes numerals for Twenty-one to Ninety nine. Groups objects into tens and ones. Draws representation for groups of ten and ones. Groups a number orally into tens and ones
MENTAL ARITHMETIC Add two single digit numbers mentally

Investigating mathematical thinking in children in India 268
© 2016 Dyslexia Association of Singapore www.das.org.sg
Asia Pacific Journal of Developmental Differences Vol. 3 No. 2 July 2016
number that makes the equa on true in each of the equa ons: 8 + □ = 11, 5 = □ – 3, 6 + 6 = □
(Common Core State Standards Ini a ve, 2014). This is also similar to a “take apart situation,” in which a total quantity is taken apart to form two addends, or c = a + b (National Research Council, 2009, p. 32; Massachusetts Department of Elementary and Secondary Education, 2011). This problem situation is also mentioned in the 1st grade Common Core standard, CCSS.MATH.CONTENT.1.OA.A.1,
Use addi on and subtrac on within 20 to solve word problems involving situa ons of adding to, taking from, pu ng together, taking apart, and comparing, with unknowns in all posi ons, e.g., by using objects, drawings, and equa ons with a symbol for the unknown number to represent the problem.
(Common Core State Standards Ini a ve, 2014).
Although NCERT has made significant progress in redefining the curriculum and syllabi for elementary math in the past decade, more can be done to create clear and measureable learning objectives for students. Therefore, the Common Core State Standards from the United States are referenced to provide further explanation about specific criteria regarding what students are expected to know and be able to do to show mastery of addition and subtraction up to 20. Common misconceptions and error analysis To minimize learning challenges, teachers can anticipate common misconceptions
and eliminate misunderstandings in their instruction (Fuchs et al., 2013). If students develop misconceptions, then it impacts their ability to comprehend new concepts (Booth, 2011). As students continue in their misunderstandings, they will pervasively use faulty reasoning to solve specific problems, and error patterns will form. A screener can be one tool or method for collecting information on s t u d e n t s ’ u n d e r s t a n d i n g o r misunderstanding of math concepts. Teachers can assess students through a screener and then follow up with a diagnostic interview to probe for student reasoning, understanding, and progress. Once teachers are well aware of possible student approaches, interpretations, and strategies – both correct and incorrect – they can adjust their instruction (Ryan & Williams, 2007). For example, teachers can provide well-designed incorrect examples, or non-examples, for the students to explain why a common incorrect strategy is wrong (Booth, 2011; Siegler, 2002). Teachers can anticipate common misconceptions by using resources, such as the Minnesota STEM Teacher Center and Kansas Flipbooks (SciMath MN, 2015; Kansas Association of Teachers of Mathematics (KATM), 2014). Teachers must not to jump to conclusions about student’s errors solely from assessments; it is important to engage in discussion with the student regarding their reasoning for a complete error analysis (Ryan & Williams, 2007). Also, it is imperative for the teacher to see if the student has made a “slip” or if they really believe their faulty reasoning will lead to a correct answer – and they do not self-correct (Olivier, 1989; Ketterlin-Geller & Yovanoff, 2009; Herholdt & Sapire, 2014)
269 M. Eichhorn
© 2016 Dyslexia Association of Singapore www.das.org.sg
Asia Pacific Journal of Developmental Differences Vol. 3 No. 2 July 2016
For example, in the problem, ☐ + ☐ = 7, in which both addends are unknown, there are many possible misconceptions students might have developed. One possible misconception is the meaning of the equal sign. The equal sign means “is the same as,” or both sides of the equation are balanced. However, elementary students may believe the equal sign tells you “and the answer is” to the right of the equal sign. This misconception is over-generalized by only seeing examples of number sentences with an operation to the left of the equal sign and the answer on the right. First and second graders need to see equations written multiple ways, such as 4 + 3 = 7 and 7 = 4 + 3 (Kansas Association of Teachers of Mathematics (KATM), 2014). In other words, students may think “the only correct format for a problem is a + b = c or a - b = c, not recognizing it can also be c = a + b or c = a – b” (SciMathMN, 2015). Teachers can begin to predict and anticipate misconceptions and ways students typically respond to a problem, while also researching and anticipating the way they can clear up and resolve the misunderstanding(s) in their instruction. Math anxiety In earlier research, Indian students with math learning disabilities at the secondary level revealed that they did not understand key math concepts and mentioned being scared of math (Eichhorn, 2014). A post-secondary lecturer also mentioned that students have “a phobia, or a mental block about math. They have a preconceived notion
that math is difficult” (M. Sen1, personal communication, February 6, 2013). These students may be exhibiting characteristics of mathematics anxiety, or a “negative and potentially impairing emotional reaction” to academic settings, as well as daily tasks, involving math (Moore, McAuley, Allred, & Ashcraft, 2015, p. 329). Therefore, this study focused on exploring the teaching and learning of mathematics at the foundational level. Second standard is a key turning point in the transition of mathematical learning in India. The focus changes from number identification and counting to more rote processes of calculat ion and understanding place value. According to Moore, McAuley, Allred & Ashcraft (2015), math anxiety can exist even in children in the 1st grade. Math anxiety may also be a learned reaction in early elementary school, due to the proportion of female teachers who also report high levels of math anxiety (Moore, McAuley, Allred, & Ashcraft, 2015). Teachers and administrators at Lotus2 English-medium school in Kolkata remarked that students had strong conceptual understanding of numbers in first grade. Yet, as students progressed through primary school, students were not showing strong ability in math in 5th grade (personal communication, July 27, 2015). Therefore, this research is an attempt to begin to examine when students’ difficulties in math become apparent. Frameworks The overarching theoretical framework for the study is rooted is constructivism and the importance of misconceptions (Piaget, 1. Pseudonym
2. All School names are pseudonyms

Investigating mathematical thinking in children in India 270
© 2016 Dyslexia Association of Singapore www.das.org.sg
Asia Pacific Journal of Developmental Differences Vol. 3 No. 2 July 2016
1970; Olivier, 1989). According to constructivism, a student learns because of an interaction between existing ideas and new ideas, as well as experiences. Students organize and structure knowledge based on units of interrelated ideas and concepts, called schemas. Misconceptions are important in constructivism because they influence a student’s conceptual schemas which will interact with new concepts, and affect new learning, usually negatively, because misconceptions generate errors (Olivier, 1989). Also, as Olivier (1989) posits, from the constructivist perspective, students’ mistakes are not silly or stupid, but “rational and meaningful efforts to cope with mathematics”. Errors are seen as opportunities to learn. The study was also guided by the Response to Intervention (RtI) framework, which is centered on early identification and prevention of serious academic difficulties through intervention and remediation (Watson & Gabel, 2012). The RtI framework moves away from the wait-to-fail approach of the predominant method of identifying learning disabilities (waiting until there is a severe discrepancy between intelligence and achievement as measured by formal tests) (Watson & Gabel, 2012). Instead, students are screened periodically through universal screenings to define an academic baseline and determine which students may be at risk for math difficulties (National Center for Learning Disabilities, 2015). By using the Response to Intervention (RtI) model to guide and inform this study, the screening tool will be used to detect students for early identification, with the intention of early intervention to prevent more severe math
difficulties. With RtI, it is acknowledged there are students who have difficulty with learning and understanding mathematics which may not qualify for a learning disability, but still need help (Krasa & Shunkwiler, 2009). Significance of the study to the fields of international mathematics and special education Research in the area of students with math difficulties in international contexts is very necessary. Research in math learning disability (MLD) is less well developed than research on reading learning disabilities around the world (Mazzocco & Myers, 2003; Bryant, 2009). Further research will help us better understand the difficulties which Indian students experience in the primary mathematics classroom. The national government of India does not yet recognize learning disabilities as a category of disability; however, educational boards in the states of Maharashtra, Karnataka, Tamil Nadu, Kerala, Gujarat and Goa do recognize learning disabilities and provide accommodations to students (Al-Yagon, et al., 2013). The state of West Bengal (site of the study) does not currently recognize LD; however, schools associated with the Indian Certificate of Secondary Education (ICSE) and Central Board of Secondary Education (CBSE) educational boards in Kolkata do acknowledge LD. At this time, there is lack of consensus within India regarding the methods for diagnosis of all learning disabilities (Unni, 2012; Mogasale, et al., 2012; Ramaa & Gowramma, 2002). Only screening tools for dyslexia have been

271 M. Eichhorn
© 2016 Dyslexia Association of Singapore www.das.org.sg
Asia Pacific Journal of Developmental Differences Vol. 3 No. 2 July 2016
developed thus far (see The Dyslexia Screening Test- Junior India (Fawcett & Nicolson, 2012) and the Dyslexia Assessment for Languages of India (DALI) (National Brain Research Centre, 2015). Because learning disabilities have not been recognized by the Government of India, government funds cannot be utilized to hire remedial teachers in regular schools, to train regular education teachers, or to develop psycho-educational tests in other Indian languages (Karande, Sholapurwala, & Kulkarni, 2011). There is also a dearth of special educators in the country. According to the Rehabilitation Council of India (RCI), there are 19 special educators registered in the entire state of West Bengal (RCI, 2014). By training regular education teachers to administer a screening tool and to interpret its findings, these teachers can better meet the needs of students by adjusting their instruction when there are no special educators available. Methodology Setting and participants The study took place in Kolkata, the third largest urban area in India (following Mumbai and Delhi). Kolkata (formerly Calcutta) has a population of more than 14 million and is located in the state of West Bengal (Indian Population Census, 2011). Breaking Through Dyslexia (BTD), a non-profit educational organization in Kolkata, recruited 185 second standard students in private primary schools. Testing was completed in schools which granted access. Any students currently in
the BTD network, currently receiving remedial services in the 2nd standard, was also asked to participate. School teachers of second standard students were asked to identify students who were high-performing in mathematics, as well as average and low-performing students. Although information was handed out to equal numbers of males and females in each school, more males participated in the study (males = 102, females = 83), with the exception of St. Mary’s School3, an all-girls school. This sample was above 40 students, which should show a normal distribution of scores. The average age of the participants is 7 years, 0 months. All schools in the sample were affiliated with the ICSE board, except for Lotus School which follows the CBSE board. These schools were chosen and asked to participate because they are receptive to the idea of introducing new methodologies to improving learning, and they had awareness programs conducted by BTD in their school over the past few years. One school, Adarsh School, is an “integrated school,” in which students with special needs (20-25% of the total class) learn alongside typically achieving students (school website). All of the schools, as well as BTD, are located in South Kolkata. A summary of the participants is located in Table 2. In Kolkata, the academic year runs from June to April. Students take exams to finish up the academic year in the month of last week of February and early March. Then, teachers begin to teach the material in the next standard during the first week April (after a break of 10 days). Summer vacation (40 days) occurs
3. Pseudonym

Investigating mathematical thinking in children in India 272
© 2016 Dyslexia Association of Singapore www.das.org.sg
Asia Pacific Journal of Developmental Differences Vol. 3 No. 2 July 2016
Table
2.
Partic
ipatin
g p
rivate
sch
ools
in K
olka
ta
*Tw
o m
ale
s p
ar
cip
ate
d f
rom
th
e B
TD n
etw
ork
th
at
aen
d o
ther
En
glis
h m
ediu
m p
riva
te s
cho
ols
in K
olk
ata
Scho
ol n
am
e (p
seud
onym
)
Lang
uage
of
inst
ruct
ion
Board
affi
liatio
n
Tota
l nu
mber
of
stud
ents
Num
ber
of
male
s in
se
cond
gra
de
in
the
sam
ple
Num
ber
of
fem
ale
s in
se
cond
gra
de
in
the
sam
ple
Ave
rage
age
of
partic
ipant
s
Mon
thly
tu
ition
fe
es in
ru
pee
s (IN
R)
Ave
rage
class
siz
e fo
r se
cond
gra
de
Vidya
mand
ir En
glis
h IC
SE
2,09
0 15
11
7.
5 3,
000
30
Balk
rishn
a
Englis
h IC
SE
3,38
0 11
8
7 2,
000
50
St.M
ary
’s
Englis
h IC
SE
1,50
0 0
7 8
2,00
0 45
Adars
h En
glis
h IC
SE
445
12
17
7 2,
500
20
Sunr
ise
Englis
h IC
SE
1,46
5 43
27
7.
5 5,
000
30
Lotu
s En
glis
h C
BSE
1,87
8 19
13
7
3,50
0 35
Oth
er*
Englis
h C
BSE/
ISC
E N
/A
2 0
N
/A
N/A

273 M. Eichhorn
© 2016 Dyslexia Association of Singapore www.das.org.sg
Asia Pacific Journal of Developmental Differences Vol. 3 No. 2 July 2016
between mid-May and mid-June, when schools re-open. A test/assessment is given on opening day to ensure all students return after the holidays. Therefore, students in this sample, would have been exposed to second standard materials since the beginning of April, but with a break of 40 days, when the screener was administered between mid-June to the end of July 2015. It was important to be aware of the history effect, or recognizing that having the students take the screener at different times could impact the results – the students who take the screener last will have learned more math and been back in the academic environment longer. Therefore, the students were all given the screener within a one-month period. The sample is only made up of students from private schools; no students from government or vernacular-medium (Bengali, Hindi, etc.) schools participated. Typically, students from private schools score between 10 and 25 percent higher on standardized tests, as compared to public school students (Rao, Pearson, Cheng, & Taplin, 2013). All schools were in the urban environment of metropolitan Kolkata. Procedures Compulsory elementary education in India begins at the age of 6, as enacted by the Right to Free & Compulsory Education Act 2009 (Ministry of Human Resource Development Department of School Education and Literacy, 2015). Some students in India do not attend pre-school or kindergarten, so the screener was administered after one full year of compulsory education – at the beginning of second grade. However, all of the
schools in our sample offer kindergarten classes. A mixed methods approach was used to gain in-depth knowledge of student mathematical thinking. Quantitative data about students’ correct or incorrect answers was collected through various assessments, but qualitative data was also collected to determine the nature of their responses and their strategies used to find the answers. Both procedural fluency and conceptual understanding of number sense were assessed. The study was intended as a one group post-test only design. We wanted to measure how much math students know as they start 2nd standard. The study and screening tool were developed as a starting point, not to develop a standardized instrument. First and foremost, we wanted to begin to understand students’ mathematical thinking and to help teachers realize the heterogeneity of students’ math abilities. A possible outcome of this screening tool is for teachers to group or classify students into small groups for instruction at the beginning of the school year. Therefore, the focus was not on test-retest reliability (giving the students the same test two weeks later) or inter-rater reliability (two examiners scoring the test). After securing parental consent and student assent, students in English-medium schools completed the Woodcock Johnson IV Test of Achievement Calculation and Math Fluency subtests as a standardized measure (and as a warm-up for the screener). The Calculation composite score is based on both the Calculation (untimed) and Math Fluency (three minutes) measures (Hecht & Vagi,

Investigating mathematical thinking in children in India 274
© 2016 Dyslexia Association of Singapore www.das.org.sg
Asia Pacific Journal of Developmental Differences Vol. 3 No. 2 July 2016
2010). These scores were used to group s tudents according to typical performance: typically achieving students normally score above the 25th percentile on the Woodcock Johnson, while low achieving students score between the 11th and 25th percentile, and students with MLD usually score below 10th percentile (Mazzocco, Myers, Lewis, Hanich, & Murphy, 2013). While the WISC IQ test has an Indian adaptation test, there are no standardized Indian measures for academic achievement. Organizations which provide testing to determine the eligibility for learning disabilities use the academic achievement battery standardized on the U.S. and U.K. but place emphasis on “error analysis and give a qualitative report with ra t iona les fo r d iagnos i s and accommodations” (M. Khan, personal communication, March 6, 2014). All students then completed the exploratory math screener at the second standard level. The screener was constructed by the researcher, based on the NCERT (2006a) Syllabus for Classes at the Elementary Level. The questions were also adapted from several sources (see Appendix at the end of the article for the sources for individual questions). Overall, the screener measured the following skills, focused on number sense:
Number magnitude and fluidity and flexibility with numbers: number lines which don’t start at 0 (Krasa & Shunkwiler, 2009; Geary, Hoard, & Bailey, 2011)
Estimation tasks which do not
involve number lines, but other numerical estimation tasks, such as estimating and labeling the
number of items in a set (Barth & Paladino, 2011)
Number relationships: part-part-
whole, composition/decomposition of numbers
Comparison of quantities Number lines were included on the screener because they can represent “conceptual underpinnings” of various components of number sense, including number comparison and number transformation, and also provide students with a schematic image (Krasa & Shunkwiler, 2009, p. 28). All assessments were untimed, with the exception of the Math Fluency subtest. Most of the assessments in this study are untimed, since findings on math performance are stronger on untimed items than on timed items (Mazzocco, Myers, Lewis, Hanich, & Murphy, 2013). The second standard students took an average of 16.5 minutes to complete the math screener. They were given unlimited time. Students took as little as 6.5 minutes, to as long as 30 minutes, to complete the screener. Depending on the space available at the school, students completed the assessments in small groups of 6-10 students at a time, during school hours. Results of students’ assessments were compared with the teachers’ rating of performance (high, average, low-performing). Students’ performance on the screeners were analyzed for common misconceptions in order to create a guide to help regular education teachers interpret students’ errors and adjust their teaching or consider different teaching

275 M. Eichhorn
© 2016 Dyslexia Association of Singapore www.das.org.sg
Asia Pacific Journal of Developmental Differences Vol. 3 No. 2 July 2016
strategies. Because of the qualitative differences in strategy use between students with and without MLD, the screener administers paid close attention to students’ strategy use to better understand the processes students followed which contribute to their scores on standardized achievement tests (Ostad, 2008). Although fact retrieval is not the core of mathematics, efficiency with number facts does contribute to mathematical thinking and learning, and was therefore measured (Dowker, 2008). Parents of participating students completed a survey (available in English) for descriptive statistics of the sample. Teachers were asked to rate each student’s math ability as are on target, in need of some support, or in need of intensive support in mathematics. Since this study was conducted in private schools, the policy documents of the educational boards were analyzed, since private schools are independent of state and national policy because they do not accept any government funding. Results The informa on teachers can gather from the screening tool to learn more about their students’ grade‐level math skills and number sense The screener scores can be one piece of data used to group students according to typical performance. Since typically achieving students normally score above the 25th percentile on the Woodcock Johnson, while low achieving students
score between the 11th and 25th percentile, and students with MLD usually score below 10th percentile, similar criteria were used with the screener scores (Mazzocco, Myers, Lewis, Hanich, & Murphy, 2013). This study was focused on students who scored at the 10th percentile or below, as a score in this category could be one piece of information used to identify students who may be in need of intensive intervention. Table 3 shows the screener scores (out of a total of 27 points), based on percentile rank for this sample. Average percentile rankings are between 75 and 25. Table 3. Screener scores4 according to percentile rank
Overall results for the 2nd standard screener suggest, for this sample, screener scores may be interpreted as:
On target: Score of 23-27 Potentially in need of some support: Score of 18 – 22 = continue to
Percentile Score on screener
(out of 27)
75 24
50 22
25 18
10 16
4. There is a near normal distribu on in screener scores (skewness is ‐0.360). Since the skewness is less than ‐0.5, the scores are approximately symmetric overall, yet slightly nega vely skewed (greater number of larger values). The Kolmogorov‐Smirnov test (K‐S) and Shapiro‐Wilk (S‐W) test also indicated normality (both not significant).

Investigating mathematical thinking in children in India 276
© 2016 Dyslexia Association of Singapore www.das.org.sg
Asia Pacific Journal of Developmental Differences Vol. 3 No. 2 July 2016
monitor through additional data collection; investigate language difficulties In need of intensive support:
Score of 17 and below = likely in need of remediation and intervention; investigate language difficulties and conduct a diagnostic interview; continue to monitor
Please note that students at Balkrishna School needed translation for more screener items (Hindi & Bengali) than students in other schools. Out of the 185 participants, 20 students scored at the 10th percentile (16 or below) on the screener. Ten of these students were from Sunrise school (which had the greatest number of students in the sample), while the other schools had 1-3 students in this sample score at the
10th percentile. Table 4 lists the number and percentage of students by school who scored in the 10th percentile on the screener (a score of 16 or below). Table 5 shows the scores obtained by the participants in this sample which fell in the 10th percentile. For the Woodcock Johnson IV, the math fact fluency age-equivalent estimate for age 7.0 (7 years, 0 months) is a score of 26 for the population normed in the United States. The Indian students in the 10th percentile in this sample scored, on average, below the age-equivalent on the three minute-long subtest. For the calculation subtest, the age-equivalent estimate for age 7.0 is a score of 15 for the U.S-normed population. Students scoring in the 10th percentile in this sample still had relatively high math calculation scores on average, as compared to a U.S. sample of children aged 7.0. The math calculation
School name (pseudonym)
Number of students in the 10th
percentile on the screener
Total number of students in sample
Percentage of sample in the 10th
percentile
Vidyamandir 2 26 7.69%
Balkrishna 3 19 15.8%
St.Mary’s 2 7 28.57%
Adarsh 2 29 6.9%
Sunrise 10 70 14%
Lotus 1 32 3.125%
Table 4. Students scoring in the 10th percentile on the screener, by school

277 M. Eichhorn
© 2016 Dyslexia Association of Singapore www.das.org.sg
Asia Pacific Journal of Developmental Differences Vol. 3 No. 2 July 2016
School name (pseudonym)
Screener score at 10th percentile
WJ-4 math fluency score at 10th percentile
WJ-4 calculation score at 10th percentile
Vidyamandir 16.7 14.4 12.7
Balkrishna 15 11 15
St.Mary’s 14 7 14
Adarsh 17 17 16
Sunrise 16 11.1 14
Lotus 17.3 18.1 18.3
All participants combined
16 12.6 14
Table 5. Scores at the 10th percentile by school
Vidya-mandir
Balkrishna St. Mary’s Adarsh Sunrise5 Lotus All
combined
1: high achieving
26.9% (n= 7)
10.5% (n = 2)
14.3% (n = 1)
20.7% (n = 6)
45.7% (n = 32)
21.9% (n = 7)
29.7% (n = 55)
2: average 57.7%
(n = 15) 84.2%
(n = 16) 71.4% (n = 5)
65.5% (n = 19)
38.6% (n = 27)
53.1% (n = 17)
53.5% (n = 99)
3: needs support
15.4% (n = 4)
5.3% (n = 1)
14.3% (n = 1)
13.8% (n = 4)
14.3% (n = 10)
25% (n = 8)
15.1% (n = 28)
5. One response missing from Sunrise school
Table 6. Teacher rating by school

Investigating mathematical thinking in children in India 278
© 2016 Dyslexia Association of Singapore www.das.org.sg
Asia Pacific Journal of Developmental Differences Vol. 3 No. 2 July 2016
test is not timed. In addition to the screener scores, we also collected a teacher rating on each student (high achieving, average, or needs support). Table 6 outlines the number of students who received each rating by school. An analysis of variance (ANOVA) was used to test differences between groups (teacher rating). An overall difference was detected before doing any pairwise comparison. There are significant differences (p < .01) in screener score means between students who received a teacher rating of high achieving (1), average (2), and needing support (3). To control for inherent difference among schools, adjustments were made for school difference. The results are presented in Table 7. Table 7. Screener scores according to teacher rating
The screener score means for each of the three teaching rating categories line up with the three categories based on percentile ranks. For instance, students who scored above the 50th percentile
were categorized as being on target, with a screener score of 23 and above. This corresponds with a teaching rating of high achieving. Students potentially in need of some support fell between the 25th and 50th percentile and scored between 18 – 22 points on the screener. Students in the middle category would be considered average by teachers. Students below the 25th percentile scored below 18 points and were categorized as potentially needing intensive support. Teachers could use the screening tool as one measure and method of collecting data to determine students’ abilities when they enter second standard. Teachers can supplement the screening tool with other measures, such as assessing spoken and written English, as well as other mathematical assessments. Common error patterns which emerged among 2nd standard students Based on qualitative data and error analysis of students’ answers on the screener questions for this sample, most of the errors occurred when students were asked to compose or decompose a number (☐ + ☐ = 7, 18 = ☐ + ☐, 8 = ☐ + ☐) and estimate a set, given a comparison set. Students misinterpreted composing and decomposing for ascending and descending numbers, while disregarding the “+” and “=” signs. Examples of students’ most common misconceptions are shown in Figure 1 and Figure 2. More students had difficulty decomposing 18, a double digit number, than the single digit number 7. In the final word problem, which involved the decomposition of 8, the most frequent
Teacher
Rating
Screener Score Mean
(Standard Error)
1 23.55 (0.5)
2 20.80 (0.3)
3 19.55 (0.6)

279 M. Eichhorn
© 2016 Dyslexia Association of Singapore www.das.org.sg
Asia Pacific Journal of Developmental Differences Vol. 3 No. 2 July 2016
Figure 1. Most Common Misconcep on in Composing the Number Seven
Thirty-four students in the sample wrote ascending numbers (5 and 6) instead of composing the number seven.
Figure 2. Most Common Misconcep on in Decomposing the Number Eighteen
Fifty-five students wrote ascending numbers instead of decomposing the number 18.
Four students wrote the number eight for both addends when trying to decompose eight in the following word problem: You have 8 chocolates. How many can you put in your red bowl, and how many in your blue bowl? Show all of the possible answers.
Figure 3. Misconcep on for Word Problem Involving the Decomposi on of the Number Eight

Investigating mathematical thinking in children in India 280
© 2016 Dyslexia Association of Singapore www.das.org.sg
Asia Pacific Journal of Developmental Differences Vol. 3 No. 2 July 2016
Figure 4. Fair Share Method in Word Problem Involving the Decomposi on of the Number Eight
Ninety-six students in this sample used the fair share methods to solve the word problem involving decomposition.
Figure 5. Evidence of Mul ple Combina ons in the Decomposi on of the Number Eight Some students were able to show multiple combinations of addends to decompose the number eight. Additionally, some began to show understanding of the commutative property of addition (3 + 5 and 5 + 3; 2 + 6 and 6 + 2; 1 + 7 and 7 + 1).

281 M. Eichhorn
© 2016 Dyslexia Association of Singapore www.das.org.sg
Asia Pacific Journal of Developmental Differences Vol. 3 No. 2 July 2016
incorrect response was no attempt (n = 16). Even though the problem was read aloud, these sixteen students did not attempt to write anything on their paper. Four students solved the problem incorrectly by including 8 as both addends, as seen in Figure 3. Half of the students (n = 96) answered the question correctly by using the fair share method (4 in the red bowl and 4 in the blue bowl, as shown in Figure 4). However, only 29% of the students (n = 54) were able identify at least one additional combination. The next most common combination was 5 and 3 (n = 30 students). Some students exemplified strong number sense by showing multiple combinations to decompose the number eight (Figure 5). The most frequent incorrect response in the estimation problem was 30, which could have been a result of students actually attempting to count the erasers in the jar, as observed by the researchers, instead of using the comparison set or benchmark of 24 to predict the number of erasers in the jar. Discussion Teachers can gather informa on from the screening tool to learn more about their students’ grade‐level math skills and number sense Caution should be used when interpreting screener results, since a brief screening tool is a one-time snapshot of a child’s performance. The screener alone may
not be sufficiently accurate to determine if a child needs intervention in mathematics (Fuchs & Vaughn, 2012). Therefore, additional data sources (teacher and parent surveys) and multiple progress monitoring tools should be used over time before placing students in remedial math courses. A second stage of screening and additional data sources will ensure students are not misidentified, and schools or parents will not have to spend money on costly interventions unless it is absolutely necessary (Fuchs & Vaughn, 2012). If the screening tool is used, the s tudents ’ language ski l l s and comprehension abilities should also be considered. Additionally, the teacher can conduct a diagnostic interview to determine if the errors are related to misconceptions. Teachers could use the screening tool as a first step in collecting baseline information regarding their students’ math abilities when they enter 2nd standard, as well as begin to understand the variability of number sense in their students. However, the screening tool should not be the sole measure used. While teachers are administering the screener, they can observe students and their strategies as they work through the problems to collect more qualitative data. Teachers could look for any signs of frustration or anxiety, especially on the composing and decomposing problems, in which there is more than one possible correct answer. Common error pa erns which emerged among 2nd standard students Based on common error patterns on the screener and through diagnostic interview procedures, teachers can begin to understand students’ misconceptions.
Investigating mathematical thinking in children in India 282
© 2016 Dyslexia Association of Singapore www.das.org.sg
Asia Pacific Journal of Developmental Differences Vol. 3 No. 2 July 2016
Teachers can use information from the screener and incorporate it in their teaching in future classes, in hopes of preventing students from making the same errors. Teachers of the students in this sample could begin to pose questions which involve equations written multiple ways, such as 4 + 3 = 7 and 7 = 4 + 3, and include various formats, such as c = a + b or c = a – b. Also, teachers can provide well-designed incorrect examples, or non-examples, for the students to explain why a common incorrect strategy is wrong. In this case, teachers could ask students if they agree or disagree with the statement 5 + 6 = 7, and justify their reasoning. In the estimation task, teachers could incorporate estimation into daily mathematical conversation and compare strategies of estimation. For example, counting individual items is not an estimation strategy. Teachers can use a screening tool to change their instruc on and interven on techniques to support student learning Based on students’ performance on the screener, teachers can use the most common errors in their teaching, using non-examples (Van de Walle, Karp, & Bay-Williams, 2016). For example, as teachers facilitate mathematical discussion on decomposing numbers, such as 7, they can include non-examples such as 5 and 6 and ask students to explain why they think the non-example is wrong. Teachers can acknowledge errors and reinforce why the correct answer is indeed right. Following the screener of 2nd standard students at each school, the data collection team presented the results to
teachers and administrators. Teachers became defensive at times, as if they were being accused of students’ errors. In some cases, the teachers critiqued the screener questions involving composition and decomposition of numbers, objecting that students had not been exposed to those types of questions, and these teachers had not taught them those types of problems. Many of these teachers were surprised when we showed them the NCERT textbook which lists an entire page of problems involving decomposition. The screener is not necessarily assessing students on what they have been taught in school about numbers. Students should not need to study for the screener. The screener can be one tool to measure number sense, and students will come to elementary classrooms with various degrees of number sense (and this cannot be controlled by the teacher). Data on students’ performance, perhaps collected through a screening tool, can be used as evidence to stimulate discussion and provide an opportunity for teachers to hone their craft of teaching. The screener may be perceived as a naming and blaming tool to be used against them and their teaching. The teachers’ reactions in Kolkata are similar to teachers’ reactions in a study of South African teachers (Shalem, Sapire, & Sorto, 2014). The screener should not be used as a teacher evaluation tool. In order for teachers to look at students’ responses and learn from their errors, they need safe spaces to acknowledge their inadequacies. Applying the findings of error analysis can be difficult, if teachers feel threatened by the students’ results, and if they are unsure how to address the error patterns. However, school climate and on-going professional development

283 M. Eichhorn
© 2016 Dyslexia Association of Singapore www.das.org.sg
Asia Pacific Journal of Developmental Differences Vol. 3 No. 2 July 2016
can normalize misconceptions and errors to a certain extent. Through the constructivist lens, we can view errors as students’ attempt to construct their math knowledge. Misconceptions will never be entirely avoided. However, when teachers establish a classroom environment where errors are seen as an opportunity to learn and grow in our understanding of math, students may respond more positively to math and have less anxiety while engaging with mathematical content (Olivier, 1989). They can also begin to adopt a growth mindset and view mistakes as opportunities for your brain to grow (Dweck, 2006; Boaler, 2015). By using the screener, or other screening tools, a teacher can use students’ errors to change his/her instruction, rather than attributing student performance solely to their teaching. When we shared concrete teaching strategies, using manipulatives, teachers at some of the schools in this sample mentioned that they have similar items in Montessori classrooms in their school (5th standard teacher, personal communicat ion, July 14, 2015; Kindergarten teacher, personal communication, July 27, 2015). Teachers remarked that these materials were used in pre-school and kindergarten, but the use of concrete materials was not a hallmark of instruction in the primary classes. Students move to abstract mathematics, the class sizes are larger, the pace of instruction is faster, and the syllabus is longer. Conclusion and recommendations The screener is designed to assess large
numbers of students. Based on individual results on the screener and other progress monitoring tools, students may be referred for a diagnostic interview, intensive intervention, and/or further assessment for learning disabilities (Cohen & Spenciner, 2011). Once a student is identified as being in need of support and remediation, there are relatively few evidence-based intervention programs for mathematics (Ansari, 2015). However, teachers can use several research-based strategies to help students overcome their errors: manipulatives, self-monitoring, estimation, and non-examples. Manipulatives The Concrete-Representational-Abstract (CRA) approach (sometimes referred to as the Concrete-Semi-Concrete, Abstract approach) has been an effective teaching strategy for students with disabilities (Van de Walle, Karp, & Bay-Williams, 2016). CRA is a multi-sensory approach to mathematics to build conceptual understanding, in which physical manipulatives are used at the concrete level (counters, blocks, algebra tiles, and geoboards); drawings, pictures, and virtual manipulatives are tools used at the semi-concrete or representational stage; and at the abstract level, students use mathematical notation (numbers, symbols, and variables). (Witzel, 2005; Witzel, Mercer, & Miller, 2003; Strickland & Maccini, 2010). Teachers can promote conceptual understanding by using objects or manipulatives (Maccini & Gagnon, 2000; 2006; Bryant et al., 2006). Manipulatives help students understand concepts at a concrete level and internalize their understanding through multi-sensory learning. Concrete
Investigating mathematical thinking in children in India 284
© 2016 Dyslexia Association of Singapore www.das.org.sg
Asia Pacific Journal of Developmental Differences Vol. 3 No. 2 July 2016
manipulatives should be accompanied with verbal explanation, and later transitioned to a representational drawing (Maccini & Gagnon, 2000). Strategy instruction must involve mathematical discussion. Teachers can act as facilitators. Breaking larger classes into small groups would be one way to make this possible. Although some schools in the sample have math labs, teaching students with math lab materials and manipulatives should be done in the classroom, as well as in the lab. Teachers can reference math lab experiences in their classroom teaching – it should not be removed or disjointed. Also, teachers can develop a classroom environment in which errors are normalized and seen as growth and learning opportunities. Self-monitoring Just as students use fix-up strategies in reading comprehension, they can employ self-monitoring strategies in mathematics (Hedin & Conderman, 2010). Students need strategies in order to figure out how to persevere and proceed with a problem, when they are unsure how to solve it. Teachers can use self-monitoring checklists to help prompt students to remember necessary steps to take when they get stuck (Van de Walle, Karp, & Bay-Williams, 2016). Self-monitoring is sometimes included in the process of self-regulation, which includes strategies to tell yourself what to do, ask yourself questions as you solve, and check yourself (Montague, 2006). Estimation Estimation helps students think flexibly
about numbers and understand if their answer makes sense or determine if they have made an error. There are different types of estimation (measurement, quantity, and computational), as well as different estimation strategies (front end, rounding, and compatible numbers). Students can begin computational estimation as early as grade 2. Estimation is not guessing, but involves reasoning. Teachers can ask students to estimate using words and phrases such as “about how much/many” and can encourage students to share their estimation strategies in class discussions (Van de Walle, Karp, & Bay-Williams, 2016). Misconceptions and non-examples The constructivist view of misconceptions can be included in pre-service teacher training. Teacher candidates can be trained to anticipate the common misconceptions, as well as anticipating their own response when students show misunderstanding. Teacher candidates can have practice conducting diagnostic interviews and asking probing questions to students, which is a much more difficult skill than just telling a student to do it in a particular way. Additionally, teacher candidates can approach students’ misconceptions as opportunities to learn, since students are making mistakes in an attempt to construct knowledge, not because they aren’t trying. Actually, students’ errors and a diagnostic interview are a window into students’ mathematical thinking and understanding. Once teacher candidates and teachers are familiar with common misconceptions, they can use those errors in their teaching, as they contrast examples with

285 M. Eichhorn
© 2016 Dyslexia Association of Singapore www.das.org.sg
Asia Pacific Journal of Developmental Differences Vol. 3 No. 2 July 2016
non-examples by using multiple models and differentiation. The use of non-examples is especially valuable for students with disabilities (Van de Walle, Karp, & Bay-Williams, 2016). When students can identify examples and non-examples, teachers are able to assess which students have obtained conceptual understanding. In essence, students make causal connections in explaining worked examples and non-examples. They are explaining why and how the procedure works, which exemplifies conceptual understanding, while justifying their conclusions (Siegler, 2002). Now, imagine a different scenario:
You enter your classroom and face 40 second grade students. You open your math textbook and turn around to write the math problems on the board. You pause and remember the misconcep ons you saw students performing on the math screening tool. You put your textbook down and turn back to the students. You pick up some unifix cubes and demonstrate the ways you can decompose the number 7. A er showing students the concept with concrete tools, you pick up your white board marker and show them how to decompose 7 using bar model representa onal drawings on the board. You ask the students to name other ways in which 7 could be decomposed. You write their responses on the board and begin to show the abstract method of wri ng the decomposi on of 7 in an equa on, both as + = 7 and 7 = + . You write the non‐example of 5 + 6 = 7 on the board and ask the students why the non‐example is incorrect. You go back to the list of
the correct decomposi ons, discuss strategies for determining the answer, and reiterate the idea of the commuta ve property. You give students a new number, 11, and ask them to determine ways they can decompose this number as well. You walk around the room and feel a sense of accomplishment as you no ce struggling students hard at work in their decomposi on task, using concrete tools from the math lab and their representa onal drawings. Perhaps they can succeed in math a er all!
Implications Based on the results of this study, there are implications for pre-service teacher education and professional development for current teachers. Teacher candidates and current teachers can benefit from training and mentoring in using screeners, conducting diagnostic interviews, utilizing screener results and misconceptions to inform their teaching, and incorporating teaching techniques to develop number sense and conceptual understanding of mathematics. Some of these techniques include cultivating a growth mindset in their classroom and normalizing errors as an opportunity to grow and learn from mistakes, using manipulatives and the CRA approach, and encouraging students to use self-monitoring and estimation fix-up strategies when they get stuck. Limitations This study was conducted with a relatively small sample size (n = 185) and the population was made up of students from private schools; no students from government or vernacular-medium

Investigating mathematical thinking in children in India 286
© 2016 Dyslexia Association of Singapore www.das.org.sg
Asia Pacific Journal of Developmental Differences Vol. 3 No. 2 July 2016
(Bengali, Hindi, etc.) schools participated. The sample was taken from a middle-class and upper-middle class section of urban Kolkata. More research can be done to determine students’ number sense in marginalized populations in urban areas of India, as well as in rural areas. Also, this was an exploratory study and the screening tool is not normed. The screener is not yet ready for use as a diagnostic instrument because it is not normed. Nevertheless, to enable further tests of its utility, the screener, along with a scoring rubric, and a list of potential misconceptions for each item can be provided upon request. When using the research-constructed screener, it is recommended to include a warm-up question when not giving the WJ-4 subtests (Mazzocco & Devlin, 2008). Perhaps the warm-up question could be a precursor which leads to the number line. The author is interested in further feedback from this pilot in order to make adjustments to the screener. Acknowledgements The author wishes to thank Breaking Through Dyslexia for their support of the project, especially Mrs. Diyva Jalan and Mrs. Aruna Bhaskar. Special thanks to the BTD staff for their efforts in data collection.
References Al-Yagon, M., Cavendish, W., Cornoldi, C.,
Fawcett, A., Grunke, M., Hung, L. H. … Vio, C. (2013). The proposed changes for DSM-5 for SLD and ADHD: international perspectives — Australia, Germany, Greece, India, Israel, Italy, Spain, Taiwan, United Kingdom, and United States. Journal of Learning Disabilities, 46 (1), 58–72. doi: 10.1177/0022219412464353
American Psychiatric Association. (2013a). Diagnostic and statistical manual of mental disorders, 5th ed. Washington, D.C. : American Psychological Association.
American Psychiatric Association. (2013b). Specific learning disorder. Retrieved from http://www.dsm5.org/Documents/Specif ic%20Learning%20Disorder%20Fact%20Sheet.pdf
Ansari, D. (2015, April 1). Numeracy community of practice webinar: What scaffolds the early development of numer ical and mathemat ical competences? Retrieved from https://collaboration.worldbank.org/docs/DOC-13158
Ansari, D., Holloway, I. D., Praice, G. R., & van Eimeren, L. (2008). Toward a developmental cognitive neuroscience approach to the study of typical and atypical number development. In A. Dowker (Ed.), Mathematical difficulties: Psychology and intervention (pp. 13-43). San Diego, CA: Academic Press.
Barth, H. C., & Paladino, A. M. (2011). The development of numerical estimation: Evidence against a representational shift. Developmental Science, 14 (1), 125–135. doi: 10.1111/j.14677687. 2010.00962.x
Boaler, J. (2015). Mathematical mindsets: Unleashing students’ potential through creative math, inspiring messages and innovative teaching. San Francisco, CA: Jossey-Bass.
Booth, J. L. (2011). Why can’t students get the

287 M. Eichhorn
© 2016 Dyslexia Association of Singapore www.das.org.sg
Asia Pacific Journal of Developmental Differences Vol. 3 No. 2 July 2016
concept of math? Perspectives on Language and Literacy, 37 (2), 31 – 35.
Bryant, D. P. (2009). Math disability in children: An overview. Retrieved from http://www.greatschools.org/print-view/special-education/LD-ADHD/526-ma t h - d i s a b i l i t y - i n - c h i l d r e n - a n -overview.gs
Bryant, D. P., Kim, S. A., Hartman, P., & Bryant, B. R. (2006). Standards-based mathematics instruction and teaching middle school students with mathematical disabilities. In M. Montague, & A. K. Jitendra, (Eds.). Teaching mathematics to middle school students with learning difficulties, (pp. 7–28). New York, NY: The Guildford Press.
Chinn, S. (2004). The Trouble with Maths: A practical guide to helping learners with numeracy difficulties. London: Routledge Falmer.
Cohen, L. B., & Spenciner, L. J. (2011). Assessment of children and youth with special needs (5th ed.). Boston: Pearson.
Common Core State Standards Initiative. (2014). Grade 1: Operations & algebraic thinking. Retrieved from http://www.corestandards.org/Math/Content/1/OA/
Common Core State Standards Initiative. (2014b). Standards for mathematical practice. Retrieved from http://www . co re s tanda rd s . o rg /Ma th /Practice/
Desoete, A., Ceulemans, A., De Weerdt, F., & Pieters, S. (2012). Can we predict mathematical learning disabilities from symbolic and non-symbolic comparison tasks in kindergarten? Findings from a longitudinal study. British Journal of Educational Psychology, 82(1), 64–81. doi: 10.1348/2044- 8279.002002
Desoete, A., Stock, P., Schepens, A., Baeyens, D., & Roeyers, H. (2009). Classification, seriation, and counting in grades 1, 2, and 3 as two-year longitudinal predictors for low achieving in numerical facility and arithmetical
a c h i e v e m e n t ? J o u r n a l o f Psychoeducational Assessment, 27 (3), 252–264. doi: 10.1177/0734282 908330588
Dowker, A. (2005). Individual differences in arithmetic: Implications for psychology, neuroscience and education. New York: Psychology Press.
Dweck, C. S. (2006). Mindset: The new psychology of success. New York: Random House.
Eichhorn, M. S. (2014). A critical examination of policy and practice in the transition experience for students with math learning disabilities in Mumbai, India (Doctoral dissertation). Retrieved from h t tp : / / scho la rworks .umass .edu/dissertations_2/182
Fawcett, A. J. & Nicolson, R. I. (2012). The Dyslexia Screening Test- Junior India. The Psychological Corporation, India.
Fletcher, J. M., Lyon, G. R., Fuchs, L., & Barnes, M. (2007). Learning disabilities: From identification to intervention. New York: Guilford Press.
Fuchs, L. S., Fuchs, D., Schumacher, R. F., & Seethaler, P. M. (2013). Instructional intervention for students with mathematics learning disabilities. In H. L. Swanson, K. Harris, & S. Graham (Eds.), Handbook of Learning Disabilities (2nd ed) (pp. 388–404). New York: Guilford Press.
Fuchs, L. S., & Vaughn, S. (2012). Responsiveness-to-intervention: A decade later. Journal of Learning Disabilities, 45 (3), 195–203. doi: 10.1177/0022219412442150
Geary, D. C., Hoard, M. K., & Bailey, D. H. (2011). Fact retrieval deficits in low achieving children and children with mathematical learning disability. Journal of Learning Disabilities, 20 (10), 1–17. doi: 10.1177/00222 19410392046
Geary, D. C., Hoard, M. K., Nugent, L., & Bailey, D. H. (2012). Mathematical cognition deficits in children with learning disabilities and persistent low achievement: A five-year prospective

Investigating mathematical thinking in children in India 288
© 2016 Dyslexia Association of Singapore www.das.org.sg
Asia Pacific Journal of Developmental Differences Vol. 3 No. 2 July 2016
study. Journal of Educational Psychology, 104 (1), 206 – 223. doi: 10.1037/a0025398
Grégoire, J. & Desoete, A. (2009). Mathemat i ca l d i sab i l i t i e s—An underestimated topic? Journal of Psychoeducational Assessment, 27 (3), 171–174. doi: 10.1177/07342829 08330577
Griffin, S., & Case, R. (1997). Re-thinking the primary school math curriculum: An approach based on cognitive science. Issues in Education, 3 (1), 1 – 49.
Hecht, S. A., & Vagi, K. J. (2010). Sources of group and individual differences in emerging fraction skills. Journal of Educational Psychology, 102 (4), 843 – 859. doi: 10.1037/a0019824
Hedin, L. R. & Conderman, G. (2010). Teaching students to comprehend informational text through rereading. The Reading Teacher, 63 (7), 556–565. doi: 10.1598/RT.63.7.3
Herholdt, R. & Sapire, I. (2014). An error analysis in the early grades mathematics – A learning opportunity? South African Journal of Childhood Education 4 (1), 42-60. doi: http://dx.doi.org/10.4102/sajce.v4i1.46
Indian Population Census. (2011). Kolkata city census 2011 data. Retrieved from http://www.census2011.co.in/census/city/215-kolkata.html
Jordan, N. C. & Glutting, J. (2012). Number Sense Screener (NSS) Set, K–1, Research Edition. Baltimore, MD: Brookes Publishing Co.
Jordan, N. C., Glutting, J. & Ramineni, C. (2008). A number sense assessment tool for identifying children at risk for mathematical difficulties. In A. Dowker (Ed.), Mathematical difficulties: Psychology and intervention (pp. 45-58). San Diego, CA: Academic Press.
Jordan, N., Kaplan, D., Locuniak, M. N., & Ramineni, C. (2007). Predicting first-grade math achievement from developmental number sense trajectories. Learning Disabilities Research and Practice, 22 (1), 36 – 46.
doi: 10.1111/j.1540-5826.2007.00229.x Kaufmann, L. (2008). Neural correlates of
number processing and calculation: Developmental trajectories and educational implications. In A. Dowker (Ed.), Mathematical difficulties: Psychology and intervention (pp. 1-12). San Diego, CA: Academic Press.
Kansas Association of Teachers of Mathematics (KATM). (2014). Kansas college career ready standards for mathematics flip book for grade 1. R e t r i e v e d f r o m h t t p : / /community.ksde.org/LinkClick.aspx?f i l e t i c k e t = c T d G j t K 9 m k A %3d&tabid=5646&mid=13290
Karande, S., Doshi, B., Thadhani, A., & Sholapurwala, R. (2013). Profile of children with poor school performance in Mumbai. Indian Pediatrics, 50 (4), 427. doi: 10.1007/s13312-013-0118-9
Karande, S. & Gogtay, N. J. (2010). Specific learning disability and the Right to Education 2009 Act: Call for action. Journal of Postgraduate Medicine, 56(3), 171 – 172.
Karande, S., Sholapurwala, R., & Kulkarni, M. (2011). Managing specific learning disability in schools in India. Indian Pediatrics, 48 (7), 515-520. doi: 10.1007/s13312-011-0090-1
Ketterlin-Geller, L. R. & Yovanoff, P. (2009). Diagnostic assessments in mathematics to support instructional decision making. Retrieved from http://pareonline.net/getvn.asp?v=14&n=16
Krasa, N. & Shunkwiler, S. (2009). Number sense and number nonsense: Understanding the challenges of learning math. Baltimore, MD: Paul H. Brookes Publishing Co., Inc.
Lewis, K. E. (2014). Difference not deficit: Reconceptualizing mathematical learning disabilities. Journal for Research in Mathematics Education, 45(3) , 351–396. doi : 10.5951/jresematheduc.45.3.0351
Lewis, K. E. (2011). Toward a reconceptualization of mathematical

289 M. Eichhorn
© 2016 Dyslexia Association of Singapore www.das.org.sg
Asia Pacific Journal of Developmental Differences Vol. 3 No. 2 July 2016
learning disabilities: A focus on difference rather than deficit. (Doctoral dissertation). University of California, Berkeley.
Maccini, P., & Gagnon, J. C. (2006). Mathematics instructional practices and assessment accommodations by secondary special and general educators. Exceptional Children, 72 (2) : 217–234. doi : 10.1177/ 001440290607200206
Maccini, P., & Gagnon, J. C. (2000). Best practices for teaching mathematics to secondary students with special needs. Focus on Exceptional Children, 32 (5), 1– 22.
Massachusetts Department of Elementary and Secondary Education. (2011). Massachusetts curriculum framework for mathematics: Grades pre-Kindergarten to 12. Retrieved from http://www.doe.mass.edu/frameworks/math/0311.pdf
Mazzocco, M. M. M., & Devlin, K. T. (2008). Parts and “holes”: Gaps in rational number sense among children with vs. without mathematical learning disabilities. Developmental Science, 11(5), 681–691. doi: 10.1111/j.1467-7687.2008.00717.x
Mazzocco, M. M. M., & Myers, G. F. (2003). Complexities in identifying and defining mathematics learning disability in the primary school-age years. Annals of Dyslexia, 53 (1), 218 – 253. doi: 10.1007/s11881-003-0011-7
Mazzocco, M. M., Myers, G. F., Lewis, K. E., Hanich, L. B., & Murphy M. M. (2013). Limited knowledge offract ion representations differentiates middle school students with mathematics learning disability (dyscalculia) versus low mathematics achievement. Journal of Experimental Child Psychology, 115(2), 371 – 387. doi: 10.1016/j.jecp.2013.01.005
McGrady, H., Lerner, J., & Boscardin, M. L. (2001). The educational lives of students with learning disabilities. In Rodis, P., Garrod, A. and Boscardin,
M.L. (Eds.), Learning Disabilities & Life Stories (pp. 177-193). Boston: Allyn and Bacon.
Ministry of Human Resource Development Department of School Education and Literacy. (2015). Elementary education overview. Retrieved from http://mhrd.gov.in/overview-ee
Mogasale, V. V., Patil, V. D., Patil, N. M., & Mogasale, V. (2012). Prevalence of specific learning disabilities among primary school children in a south Indian city. Indian Journal of Pediatrics, 79 (3), 342 – 347. doi: 10.1007/s12098-011-0553-3
Montague, M. (2006). Self-regulation strategies for better math performance in middle school. In M. Montague & A. K. Jitendra, (Eds.). Teaching mathematics to middle school students with learning difficulties, (pp. 89–107). New York, NY: The Guildford Press.
Moore, A. M., McAuley, A. J., Allred, G. A., & Ashcraft, M. H. (2015). Mathematics anxiety, working memory, and mathematical performance: The triple-task effect and the affective drop in performance. In Chinn, S. (Ed.) The Routledge international handbook of dyscalculia and mathematical learning difficulties (pp.326–336). New York: Routledge.
National Brain Research Centre. (2015). DALI (Dyslexia Assessment for Languages of India). Retrieved April 25, 2016 from http://www.nbrc.ac.in/download/post_release_writeup.pdf
National Center for Learning Disabilities. (2015). What is RTI? Retrieved from http://www.rtinetwork.org/learn/what/whatisrti
National Council of Education Research and Training (NCERT). (2006a). Syllabus for classes at the elementary level. Retrieved from http://www.ncert.nic.in/rightside/links/syllabus.html
National Council of Education Research and Training (NCERT). (2006b). Math magic: Textbook in mathematics for class 1. New Delhi: NCERT.

Investigating mathematical thinking in children in India 290
© 2016 Dyslexia Association of Singapore www.das.org.sg
Asia Pacific Journal of Developmental Differences Vol. 3 No. 2 July 2016
National Mathematics Advisory Panel (2008). Foundations for success: The final report of the National Mathematics Advisory Panel. Washington, D.C.: U.S. Department of Education. Retrieved from http://www2.ed.gov/about/bdscomm/list/mathpanel/report/final-report.pdf
National Research Council. (2009). Mathematics learning in early childhood: Paths toward excellence and equity. Washington, D.C.: The National Academies Press.
Nelson, C. A., & Sheridan, M. A. (2011). Lessons from neuroscience research for understanding causal links between f a m i l y a n d n e i g h b o r h o o d characteristics and educational outcomes. In G. J. Duncan & R. J. Murnane (Eds.), Whither opportunity? Rising inequality, schools, and children’s life chances, (pp. 27–46). New York, NY: Russell Sage Foundation.
Olivier, A. (1989). Handling pupils’ misconceptions. Pythagoras, 21: 9 – 19.
Ostad, S. A. (2008). Children with and without mathematics difficulties: Aspects of learning characteristics in a developmental perspective. In A. Dowker (Ed.). Mathematical difficulties: psychology and intervention (pp. 143–153). San Diego, CA: Academic Press.
Piaget, J. (1970). Genetic epistemology. Chicago. University of Chicago Press.
Ramaa, S., & Gowramma, I. P. (2002). A Systematic procedure for identifying and classifying children with dyscalculia among primary school children in India. Dyslexia, 8 (2), 67-85. doi: 10.1002/dys.214
Rao, N., Pearson, E., Cheng, K., & Taplin, M. (2013). Teaching in primary schools in China and India: Contexts of learning. New York, NY: Routledge.
Rehabilitation Council of India. (RCI). (2014). Registration details of registered professionals. Retrieved from http://www.rehabcouncil.nic.in/forms/Sublink 1.aspx?lid=814
Ryan, J. & Williams, J. (2007). Children’s mathematics 4-15: Learning from errors and misconceptions. Berkshire: England: Open University Press.
SciMathMN. (2015). 2.1.2A Addition & subtraction: Misconceptions. Retrieved from http://www.scimathmn.org/stemtc/frameworks/212a-addition-subtraction
Siegler, R. S. (2002). Microgenetic studies of self-explanations. In N. Granott & J. Parziale (Eds.), Microdevelopment: Transition processes in development and learning (pp. 31–58). New York: Cambridge University.
Siegler, R. S. (2007). Foreword: The birth of a new discipline. In D. Berch & M. Mazzocco, (Eds.). Why Is Math So Hard for Some Children? The nature and origins of mathematical learning difficulties and disabilities, (pp. xvii-xxvi). Baltimore, MD: Paul H. Brookes Publishing Co., Inc.
Shalem, Y., Sapire, I., & Sorto, M. A. (2014). Teachers’ explanations of learners’ errors in standardised mathematics assessments. Pythagoras, 35 (1), 1 – 11. doi: http://dx.doi.org/10.4102/ pythagoras.v35i1.254
Stock, P., Desoete, A., & Roeyers, H. (2010). Detecting children with arithmetic disabilities from kindergarten: Evidence from a 3-year longitudinal study on the role of preparatory arithmetic abilities. Journal of Learning Disabilities, 43 (3), 250 – 268. doi: 10.1177/0022219409 345011
Strickland, T. K., & Maccini, P. (2010). Strategies for teaching algebra to students with learning disabilities: Making research to practice connections. Intervention in School and Clinic, 46 (1), 38–45. doi: 10.1177/1053451210369519
Tobey, C. R. & Fagan, E. R. (2013). Uncovering student thinking about mathematics in the Common Core, Grades K–2: 20 formative assessment probes. Thousand Oaks, CA: Corwin Press.
Tobey, C. R., & Minton, L. (2011). Uncovering
291 M. Eichhorn
© 2016 Dyslexia Association of Singapore www.das.org.sg
Asia Pacific Journal of Developmental Differences Vol. 3 No. 2 July 2016
student thinking in mathematics, grades K-5: 25 formative assessment probes for the elementary classroom. Thousand Oaks, CA: Corwin Press.
Unni, J. C. (2012). Specific learning disability and the amended "Persons with Disability Act." Indian Pediatrics, 49 (6), 445-447. doi: 10.1007/s13312-012-0068-7
Van de Walle, J. A., Karp, K, S. & Bay-Williams, J. M. (2016). Elementary and middle school mathematics: Teaching developmentally (9th ed.). Boston: Pearson.
Wadlington, E. & Wadlington, P. L. (2008). Helping students with mathematical disabilities succeed. Preventing School Failure, 53 (1), 2–7. doi: 10.3200/PSFL.53.1.2-7
Watson, S. M. R., & Gabel, R. A. (2012). Unraveling the complex nature of mathematics learning disability: Implications for research and practice. Learning Disability Quarterly, 36 (3), 178–187. doi: 10.1177/073194871246 1489
Winterman K. G., & Rosas, C. E. (2014). The IEP checklist: Your guide to creating meaningful and compliant IEPs. Baltimore: Brookes Publishing.
Witzel, B. (2005). Using CRA to teach algebra to students with math difficulties in inclusive settings. Learning Disabilities: A Contemporary Journal, 3 (2): 49–60.
Witzel, B., Mercer, C. D., & Miller, M. D. (2003). Teaching algebra to students with learning difficulties: An investigation of an explicit instruction model. Learning Disabilities Research and Practice, 18(2): 121 – 131. doi: 10.1111/1540-5826.00068

Investigating mathematical thinking in children in India 292
© 2016 Dyslexia Association of Singapore www.das.org.sg
Asia Pacific Journal of Developmental Differences Vol. 3 No. 2 July 2016
APPENDIX
2nd standard screener: Guiding questions for teachers, misconceptions, and potential errors
1. Label the number line: 9, 10, __ (Tobey & Fagan, 2013)
Does the student use the information provided by labeled hash marks on the
number line? Does the student understand equal intervals on the number line? Does the student count by ones? Does the student count on? Does the student match a number name to its numeral? Does the student have difficulty transitioning to the “teens” decade? Does the student say or write “ten-one;” “ten?”
2. Label the number line: 36, 37, 38, 39, __
(Tobey & Fagan, 2013)
Does the student have difficulty transitioning to a new “decade”? Does the student match a number name to its numeral? Does the student have difficulty writing numerals? Does the student write or say “thirty-ten?”
3. This jar has 24 rubbers (erasers). About how many rubbers (erasers) are in the
other jar? (Barth & Paladino, 2011; Jordan, Glu ng & Ramineni, 2008; Jordan & Glu ng, 2012)
Does the student count all of the visible erasers/rubbers? Does the student use a benchmark line to compare the two amounts?
4. Write the missing numerals: __ + __ = 7
(NCERT, 2006b) Does the student use their fingers to count? Does the student count all or count on? Does the student understand the meaning of the equal sign? Can the student determine the unknown whole numbers in an addition
equation and determine which numbers make the equation true?

293 M. Eichhorn
© 2016 Dyslexia Association of Singapore www.das.org.sg
Asia Pacific Journal of Developmental Differences Vol. 3 No. 2 July 2016
5. This is a chunk/piece of a hundreds chart. Fill in the empty boxes with the correct numbers
(Tobey & Minton, 2011) Does the student recognize the pattern of 10 and generalize it? Did the student try to make sense of creating a pattern, but fail to use the
structure of the hundreds chart? Does the student understand that the two digits of a two-digit number
represent amounts of tens and ones? Does the student write: 31; 51; 65 (adding or subtracting / counting forwards
or backwards, based on box placement)?
6. If 63 is a large number, write a smaller number. (Jordan, Glu ng & Ramineni, 2008; Jordan & Glu ng, 2010; Van de Walle et al., 2016)
Does the student understand the relationship between numbers and
quantities; connect counting to cardinality? Does the student understand that each successive number name refers to a
quantity that is one larger? Does the student choose a number that is less than, but not significantly
smaller, than 63 (e.g. 62)?
7. Which is bigger? 5 or 8 (Jordan, Glu ng & Ramineni, 2008; Jordan & Glu ng, 2010; Tobey & Fagan, 2013)
Does the student compare two numbers between 1 and 10 presented as
written numerals? Does the student understand written magnitude comparison Does the student circle the five because it is the first number listed?
8. Write the missing numerals: 18 = __ + __
(NCERT, 2006b; Tobey & Fagan, 2013) Can the student decompose two-digit numbers? Can the student add and subtract within 20, using mental strategies? Does the student understand the meaning of the equal sign? Can the student determine the unknown whole numbers in an addition
equation and determine which numbers make the equation true? Does the student write: 1 + 8; or 18 in the first box and nothing in second box?
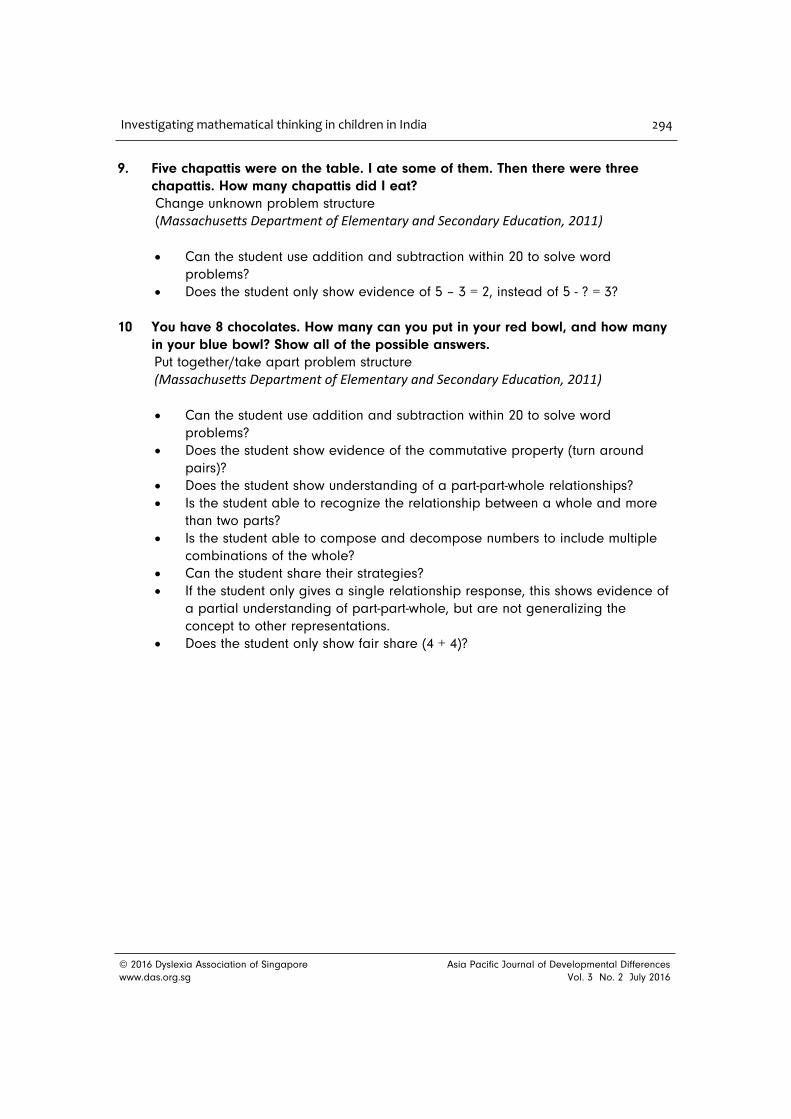
Investigating mathematical thinking in children in India 294
© 2016 Dyslexia Association of Singapore www.das.org.sg
Asia Pacific Journal of Developmental Differences Vol. 3 No. 2 July 2016
9. Five chapattis were on the table. I ate some of them. Then there were three chapattis. How many chapattis did I eat? Change unknown problem structure (Massachuse s Department of Elementary and Secondary Educa on, 2011) Can the student use addition and subtraction within 20 to solve word
problems? Does the student only show evidence of 5 – 3 = 2, instead of 5 - ? = 3?
10 You have 8 chocolates. How many can you put in your red bowl, and how many
in your blue bowl? Show all of the possible answers. Put together/take apart problem structure (Massachuse s Department of Elementary and Secondary Educa on, 2011) Can the student use addition and subtraction within 20 to solve word
problems? Does the student show evidence of the commutative property (turn around
pairs)? Does the student show understanding of a part-part-whole relationships? Is the student able to recognize the relationship between a whole and more
than two parts? Is the student able to compose and decompose numbers to include multiple
combinations of the whole? Can the student share their strategies? If the student only gives a single relationship response, this shows evidence of
a partial understanding of part-part-whole, but are not generalizing the concept to other representations.
Does the student only show fair share (4 + 4)?