mekelle university - core · mekelle university college of business and economics department of...
TRANSCRIPT

MEKELLE UNIVERSITY
College of Business and Economics
Department of Economics
The Impact of Small-Scale Irrigation on Rural household Food Security
(The case of Emba Alaje woreda)
By:
Muez Haileleul Aregawi
ID No: CBE/PS 021/03
A thesis
Submitted in partial Fulfillment of the Requirements for the
Master of Science Degree
In
Economics (Development policy analysis)
Advisor: Kidanemariam Gebregziabher (PhD)
Co-Advisor: Menasbo Gebru (Ass.Pro.)
June, 2014
Mekelle, Ethiopia

i
Declaration
I, Muez Haileleul Aregawi, hereby declare that this thesis work entitled “ The impact of
small-scale irrigation on rural household food security in southern Tigray Zone: (Evidence from
Emba Alaje Woerd Woreda)”Submitted by me in partial fulfillment of the requirements for the
award of the degree of Master of Science in Economics( Development policy analysis) to the
College of Business and Economics, Mekelle University, through the Department of Economics,
is original work carried out by himself. The matter embodied in this thesis work has not been
submitted earlier for award of any degree or diploma to the best of my knowledge and belief.
Where other sources of information have been used, they have been duly acknowledged.
Name of the student: Muez Haileleul Aregawi
Signature_______________________

ii
Certification
This is to certify that this Thesis work entitled “The impact of small-scale irrigation on rural
household food security (Emba Alaje Woreda, Tigray, Ethiopia)” Submitted in partial fulfillment
of the requirement for the award of the degree of Master of Science in Economics(Development
Policy Analysis) to the College of Business and Economics, Mekelle University, through the
Department of Economics (Development Policy Analysis) to the college of Business and
Economics, Mekelle University, through the Department of Economics, done by Muez Haileleul
I.D No CBE/Ps/021/03 is an original work carried out by himself. The matter embodied in this
Thesis work has not been submitted earlier for award of any degree or diploma to the best of my
knowledge and belief. Where other sources of information have been used, they have been duly
acknowledged.
Advisor: Kidanemariam Gebregziabher (PhD) Signature date________ __
Co-advisor: Menasbo Gebru (Ass.Pro) Signature date_______

iii
ACKNOWLEDGEMENT
First of all I would like to thank to the immense God for providing me the opportunity for what I
have achieved. I am highly grateful to my research advisors Kidanemariam Gebregziabher (PhD)
and Menasbo Gebru (Ass.Pro) for their constant instruction, guidance, intellectual feedback,
and very useful suggestions in both proposal development and thesis writing.
I would also like to thank staff members of Office of Agriculture and Rural Development, and
Plan and Finance office Woreda Emba Alaje for their assistance in providing me all the required
information and data. The cooperation of the sampled farmers and respective Development
Agents (DAs) in replying all questions patiently and active participation in the discussion made
was highly commendable.
I would like to make special mentioned of my best friends Yibrah M., Mehari G., Degen A.,
Teare and Ataklti M. for their materials support and encouragement throughout my study.
Finally, I am extremely grateful to my family for their devoted partnership in the success of my life

iv
DEDICATION
I dedicated this thesis document to my Mother, brothers and sisters for tending me with love
and for their wholehearted partnership in the success of my life.

v
TABLE OF CONTENTS
DECLARATION……………………………………………………………………… i
CERTIFICATION……………………………………………………………………… Ii
ACKNOWLEGEMENT……………………………………………………………… iii
DEDICATION……….………………………………………………………………. iv
TABLE OF CONTENTS………………………………………….............................. v
LIST OF TABLES…………………………………………………………………….. Viii
LIST OF FIGURES…………………………………………………………………….. ix
LIST OF ANNEXSES…………………………………………................................. x
LIST OF ABBREVATIONS………………………………………………………… Xi
ABSTRACT ………………………………………………………………………… Xii
Chapter one: Introduction………………………………. 1
1.1Background of the study-------------------------------------------------------------- 1
1.2 Statement of the problem………………………………………………………. 3
1.3 Objectives of the study………………………………………………………….. 6
1.4 Research questions…………………………………………………………………………………………. 6
1.5 Hypotheses………………………………………………………..……………… 6
1.6 Significance of the Study. . …………………………………………………. 7
1.7 Scope and limitations of the Study……………………………………………… 7
1.8 Organization of the Thesis……………………………………………………… 7
Chapter Two: Review of Literature……………………... 8
2.1 Definition and Concept of Food Security………………………………………. 8
2.2 Household food security and measurement……………………………………… 9
2.3 Definitions and Concepts of Irrigation………………………………………….. 10
2.3.1 Definition and Concept of small-scale irrigation……………………………… 11
2.3.2 Small-scale Irrigation and Food Security……………………………………… 11
2.3.3 Irrigation Development in Ethiopia……………………………………………. 12
2.3.4 An Overview of Ethiopia‟s Food Security Situation and Irrigation…………… 13
2.4 Empirical Studies in Irrigation and Food Security………………………………. 14
2.4.1 Determinants of Household irrigation participation Food…………………….. 14

vi
2.5 Irrigation techniques/ methods………………………………………………….. 15
2.5.1 Surface irrigation…………………………………………………………….. 15
2.5.1.1 Basin irrigation……………………………………………………………….. 16
2.5.1.2 Furrow irrigation………………………………………………………………. 16
2.5.1.3 Border irrigation…………………………………………………. 16
2.5.1.4 Flood irrigation………………………………………………….. 17
2.5.1.5 Drip irrigation……………………………………………………………… 17
2.5.2 Sprinkler irrigation……………………………………………………………. 17
Chapter Three: Materials and Methods 18
3.1 Description of the study area………………………………………. 18
3.1.1 Location……………………………………………………………………….. 18
3.1.2 Selection of the study area……………………………………………………. 19
3.1.3 Agro-ecological Condition…………………………………………………… 19
3.1.4 Socioeconomic Condition, and Physical and Natural Resources……………. 19
3.2 Types of Small-scale irrigation in the study area…………………………........ 20
3.2.1 Concrete canal river diversion………………………………………………… 20
3.2.2 Traditional river diversion……………………………………………………. 20
3.2.3 Hand pump…………………………………………………………………… 21
3.2.4 Motorized pump……………………………………………………………… 22
3.3 Research methods……………………………………………………………… 22
3.3.1 Sources and Methods of data collection……………………………………… 22
3.3.2 Sampling techniques…………………………………………………………. 23
3.3.3 Methods of data analysis……………………………………………………… 24
3.4 The Foster, Greer and Thorbecke (FGT) poverty indices………………………… 30
3.5 Model of specification…………………………………………………………. 31
3.5.1 Impact Analysis……………………………………………………………… 33
Chapter Four: Result and discussion………………………… 35
4.1 Descriptive Analysis………………………………………………. 35
4.2 Problems encountered in small-scale irrigation development…………………… 42

vii
4.3 Foster Greer Thorbecke (FGT) poverty indices result………………………….. 43
4.4 Econometric Result…………………………………………………………….. 44
4.4.1 Determinants of small-scale irrigation participation………………………… 44
4.4.1.1 Robustness check………………………………………………………….. 44
4.4.1.2 Heckman selection model…………………………………………………… 46
4.4.2 Heckman Outcome model…………………………………………. 50
4.4.2.1 Determinants of household food consumption expenditure……………….. 50
Chapter 5: CONCLUSIONS AND RECOMMENDATIONS………………… 56
5.1 Conclusions……………………………………………………………………... 56
5.2 Recommendations…………………………………………………………….. 57
References …………………………………………………………………………. 59
Annexes…………………………………………………………………………….. 67

viii
LIST OF TABLES
Table 3.1 Summary of independent variables and hypothesized signs 29
Table 4.1 Summery of descriptive statistics result of the dummy variables by access to irrigation 36
Table 4.2 summery of descriptive statistics continuous variable..........................................……. 38
Table 4.3 Main constraints of irrigation agriculture by irrigation participant‟s survey…………. 43
Table 4.4 FGT Poverty indices……………………………………………………...................... 44
Table4.5 Estimation of the Binary Probit model and it‟s Marginal Effect (participation equation) 47
Table4.6 Estimation Result of the Heckman Outcome Equation (Food expenditure equation)… 52
Table 4.7 Mean difference of food expenditure per adult equivalent per annum………………… 55

ix
LIST OF FIGURES
Figure 3.1map of Alaje Woreda 18
Figure3.2. Modern river diversion……………………………………………………………….
20
Figure 3.3 Traditional river diversions…………………………………………………………...
21
Fig 3.4 Hand pump ………………………………………………………………………………
21
Figure 3.5 Motorized pump………………………………………………………………………
22
x
LIST ANNEXES
Annex 1.Conversion factor for Adult equivalent…………………………………… 67
Annex 2 Conversion factor for Tropical Livestock Unit (TLU)…………………….. 67
Annex 3 Variance Inflation Factors (VIF) of Continuous variables………………… 68
Annex 4 Contingency Coefficients for Discrete Explanatory Variables……………. 68
Annex 5 Research questionnaires…………………………………………………… 69
Annex 6 Econometrics regression results…………………………………………………. 70
Annex 7 Research Questionnaire……………………………………………………………. 71

xi
LIST OF ABBREVATIONS
ADLI Agricultural Development Led Industrialization
PA per adult equivalent
BOARD Bureau of Agriculture and rural development
CSA Central Statistics Agency
DAs Development Agents
ETB Ethiopian Birr
FAO Food and Agricultural Organization
GDP Gross Domestic Product
HHs Household Heads
IWRM International Water Resource Management
IFAD International Fund for Agricultural Development
IWMI International Water Management Institute
Km Kilometer
LDC Less developed countries
LR Likelihood Ratio
MOARD Ministry of Agriculture and Rural Development
MOFED Ministry of Finance and Economic Development
MOWE Ministry of Water and Energy
NGOs Non- Governmental Organizations
NMTIP National Medium-Term Investment Program
OLS Ordinary Least Squares
PSNP Productive Safety Net Program
SNNPR South Nation, Nationalities and Peoples Region States
TLU Total livestock unit
UNDP United Nation Development Program
VIF Variance Inflation Factor
WOBAD Woreda Bureau of Agricultural and Development
WFED Woreda Finance and Economic Development
WFP World Food Program
WWME Woreda Water and Mineral Energy

xii
ABSTRACT
In Ethiopia, agriculture is the primary determinant of economic growth and reducing level of
poverty because it has the largest component of the economy. Farming irrigation also has both
direct and indirect impact on food security and it is one of the most important rural development
strategies. Food security becomes as a result of economic growth. The purpose of this research is
to assess the impact of small-scale irrigation in ensuring rural households food security based on
data collected from 150 farmers in Emba Alaje Woreda Tigray Regional state; Ethiopia.
Descriptive statistics and Heckman‟s two-stage estimation were used to estimate determinants of
small-scale irrigation participation and household food consumption expenditure. The study
findings indicate that sex, education level, cultivated land, distance to FTC, access to extension
services, access to credit and water availability were the determinant households‟ participation in
small-scale irrigation where as household size, cultivated land, soil fertility, total livestock
household consumption. The Foster Greer Thorbecke (FGT) explains that irrigation participants
are better-off than non-participant. That is poverty indices was lower among irrigation
participants compared to non-participants, with 35.5% of non-participants classified as poor
compared to 26.3% of irrigation participants. In the same way the main findings of the research
indicates that irrigation access enabled the sample households to grow crops more than once a
year; to insure increased stable production, income and consumption. The study concludes that
small-scale irrigation is one of the viable solutions to secure household food needs in the study
area but it did not remove the food insecurity problem and recommends that investments in
small-scale irrigation continue for poverty reduction.
Key words: - Food security, FGT, Heckman two stage model, Emba Alaje.
1
Chapter one: Introduction
1.1Background of the study
Ethiopia is one of the poorest countries in the world, where about 29.2% of its population is
living below poverty line (CIA world Fact book, 2013). Even if poverty is common for both
urban and rural areas, it is mostly familiar with in the rural part of the country. For example,
in 2009, Ethiopia was ranked 171th
out of 182 countries on the UNDP Human Development
Index result (Demese et al., 2009).
In Ethiopian, most of the population lives in rural areas where about 95% of the agricultural
product is produced by smallholder farmers (MoARD, 2010). Agriculture is the backbone of
the Ethiopian economy as it accounts for about 80% of the population directly or indirectly
involved in it. This implies that it is the dominant sector for GDP contribution. For example
in 2011, agriculture contributed to national GDP (40%), employment (80%), supply of raw
materials (70%), government tax revenue (28%) and export earnings (85%). However,
because of small and fragmented landholding, dependence on natural factors of production,
environmental degradation, population growth, low access to new agricultural technologies,
traditional methods of cultivation, and low institutional support services, it is largely based
on subsistence farming (MoFED, 2012).
To address subsistence farming problem, the economic performers designed a national
strategic plan in 1991, Agricultural Development Led Industrialization (ADLI) that gives
focus on irrigation, cooperative societies and agricultural technologies to answer the food
demand and bring socioeconomic development in the country. Small scale irrigation
development is one of the policies within this strategy. The success full history of Asian
countries for instance China in the 1960s and 1970s in accommodating the growing
population, achieving rapid economic growth and increasing employment through
irrigated agriculture and eager the Ethiopian government to give more weight to the
development of irrigation scheme (Bacha et al. 2011). Based on this, the federal and the
regional governments associated with other international and local NGOs have
significantly supported to rural farmers to participate and use irrigation farming. As a

2
result, the irrigated farmland, irrigation production and the number of irrigation farmers
in the country have notably increased, up to 80%, between 1990 and 2010 (CSA, 2012).
Irrigation is one of the agricultural technologies defined as the man made application of
water to guarantee double cropping as well as steady supply of water in areas where rainfall
is unreliable (Mutsvangwa et al, 2006).The development of small-scale irrigation is also
one of the major intervention to increase agricultural production in the rural parts of a
country. This helps farmers to overcome rainfall constraint by providing a sustainable supply
of water for cultivation and livestock production (FAO, 2003). Irrigation development is
being suggested as a key strategy to improve agricultural productivity and to encourage
economic development (Bhattarai et al., 2002). Irrigation in Ethiopia contributes to increase
farmers‟ income, household resilience and buffering livelihoods against shocks and stresses
by producing higher value crops for sale at market and to harvest more than once per year. In
turn, this provided them to build up their assets, buy more food and non-food household
items, educate their children, and reinvest in further increasing their production by buying
farm inputs or livestock. However, the benefits are very unevenly distributed among
households (Eshetu et al, 2010).
Large-scale irrigation program and other related technologies are quite well known in
Ethiopia and the governments of the country actively advanced these schemes. However,
many irrigated state farms were abandoned and investment in large-scale and medium scale
schemes not developed. At the same time, there was a corresponding expansion of small-
scale irrigation program like government canal, private tanks, wells and other streams in
order to increase agricultural production. In the same way, in recent years, because of small-
scale irrigation systems are financially viable, investment cost recovery operation,
maintenance costs, and the ability to replicate investments the program of irrigation in
Ethiopia has shifted from large-scale irrigation to small-scale irrigation (Awulachew,et al
,2005). Large scale irrigation schemes comparatively are more profitable and have
socioeconomic advantages than small ones (Kadzombe et al, 1973). However, in terms of
empowering the local communal people, small scale schemes are suitable as they occupy
small land readily available in the rural areas (Chenje et al, 1998).
3
Since irrigation development has been identified as an important tool to stimulate
economic growth and rural development, the regional state of Tigray have led to
concentrated efforts to expand irrigation development since 2005 (Hagos et al. 2009).
Following the new policy of ADLI, the Tigray regional state including the study area, have
introduced small-scale irrigation schemes to achieve food security at household level. For
instance in 2007 about 952,000 households have built small water harvesting ponds to
promote irrigation at farmer level (MoARD, 2007). A study conducted by Gebremedhin and
Pender (2002) in the highlands of Tigray region, showed that irrigation contributed to
increase the intensity of input use, especially labor, oxen, improved seeds and fertilizer.
Use of compost on irrigated plots was about 50% more likely than on rain-fed plots,
controlling other factors. Irrigation contributed to increase crop production by increasing
such inputs. The impact of irrigation was 18% increase in crop production relative to
rain-fed field plots.
1.2Statement of the problem
Irrigation contributes to agricultural production through increasing crop yields, and enabling
farmers to increase cropping intensity and switch to high-value crops (Zhou et al., 2008). In
the same way, According to Lipton et al. (2004) cited by Haile (2008) irrigated agriculture
can reduce poverty through increasing production and income, and reduction of food prices,
that helps very poor households meet the basic needs by improving overall economic
welfare, protecting against risks of crop loss due to insufficient rain water supplies,
promoting greater use of yield enhancing farm inputs and creation of additional employment,
which together enables people to move out of the poverty trap.
The irrigation development, particularly small-scale irrigation is one of the major programs
to improve agricultural production in the rural households of a country. It helps poor
households to overcome shortage of rainfall by giving optimal water for irrigation agriculture
and livestock, strengthen the base for sustainable agriculture, provide increased food security
to poor communities through irrigated agriculture and contribute to the improvement of
human nutrition (FAO, 2003). According to MoARD(2011), the importance of irrigation
development, particularly at smallholders‟ level need main concern to raise production and
achieve food self-sufficiency and ensure food security at household in particular and national

4
levels at large. Even if Ethiopia has a huge potential in terms of surface and ground water
availability and land which are in most cases suitable for irrigation development is in its
infant stage and the country is not benefiting from the sub-sector. The major constraints that
slow down the development of the sub- sector among others are predominantly primitive
nature of the overall existing production system, shortage of agricultural inputs and low level
of users‟ participation in the development and management of irrigated agriculture, limited
trained manpower and inadequate extension services. The same finding traditional farm
tools, unimproved seeds and fertilizers and poor animal breeds are the major constraints to
agricultural development in Ethiopia. The country‟s ability to support agriculture through
development of irrigation has been week (Mengistu, 2000).
The study area is Tigray region, one of the most drought prone regions in the country.
Because of that the government of Tigray region is implementing different agricultural
development program in order to achieve food security in rural households. Among these
programs, irrigation development is primarily taken by the government. Since 2003, small-
scale irrigation was used to promote irrigation in 0.5 million food insecure households. In
this program, government organizations, international and local NGOs, micro-finance
institutions, private sectors and farmers are involved at different levels with different tasks.
But such interventions are encountering various social and technical problems that have
challenged the strategy and implementation approaches (BoARD, 2006).
Alaje woreda is also one of the woredas in Tigray Region of Ethiopia with an irrigation
potential area which is implementing the program with 4548 hectares irrigated land (WBAD,
2012). Hence, the government of Tigray Region gives emphasis on irrigation in this Woreda
like the other parts of the region in order to improve the standard living of the society. As a
result, because of the availability of ground water as well as river water in some selected
Tabias of the Woreda, the government of Tigray and the administrative of the Woreda gave
special attention on irrigation in these Tabbies to increase agricultural production of the rural
households. However small-scale irrigation policy is a new and recently introduced and lacks
in-depth studies on its factors that influence on irrigation participation in policy approaches.
This program is not well supported by complete research which is able to examine the impact

5
of small- irrigation on household food security and the determinants of irrigation
participation.
A study conducted by Asayehegn et al.(2011), on the effect of small-scale irrigation on
the income of farm households in Laelay Maichew,Tigray focus on technical aspects of
irrigation schemes and very little is known for the socio-economic factors that have
implications on irrigation participation. In the same way Berhane(2009) found that the main
factors affects in decision making of any intervention including irrigation that affects their
livelihoods were Top-down approaches lack flexibility and do not recognize farmers as the
key actors in decision making in Kilte Awlaelo woreda, Tigray regional state, Ethiopia. Most
of the previous studies including the above studies on the impact irrigation have been
descriptive in nature and have not included any systematic quantitative evaluations. Although
these evaluations are relevant measurements of poverty impacts of smallholder irrigation
they are not complete, as they do not evaluate direct irrigation impact on household income
and food security.
The study area has high water potential; farmers in the areas have long history of traditional
practices and by now there is a better irrigation activity that gives opportunity to government
in developing modern small-scale irrigation schemes. Irrigation is assumed to improve
agricultural production and food security. However, it is not well known to what extent the
households using irrigation are better off than those who depend on rainfall in the study area.
The knowledge regarding the contribution of irrigation to household income and food
security is insufficient in the study area. More importantly, in Woreda Alaje, where this
study was conducted, an in-depth comparative analysis studies are scarce on factors that
determine rural households‟ participation in small-scale irrigation and the impact of small-
scale irrigation on household food security. Therefore, this study will initiate to choose the
study area, and to reveal the seriousness of the problem and to fill the gaps by analyzing the
determinant of rural household‟s participation in small-scale irrigation and the impact of
small-scale irrigation on rural household food security.
6
1.3 Objectives of the study
The general objective of this study is to examine the impact of small-scale irrigation on rural
household food security in the study area.
The specific objectives of the study are:
1. To identify the main economic factors that influence farmers to participate in small-scale
irrigation and food consumption expenditure.
2. To examine the economic impact of small-scale irrigation on household farm income and
food security.
3. To apply the study findings to make recommendation.
1.4 Research questions
This research tries to answer the following three basic and major questions.
1. What are the main factors that determine households‟ participation in small-scale irrigation
and food consumption expenditure?
2. What is the situation of irrigation participants in terms of farm income and food security
when compared with their non-irrigation counterparts?
1.5 Hypotheses
The hypotheses of this study are:
1. Participation in small scale irrigation schemes positively and significantly increases the farm
income and consumption expenditure of the rural households.
2. Household head sex. education level of the head, access to financial institutions (e.g.
Credit), household size per adult, cultivated land, distance to market and FTC and irrigation
water availability are statistically significant in influencing the farmers‟ participation in
irrigation schemes.
7
1.6 Significance of the Study
The achievement of the objectives discussed above is important tool for agricultural
development. The study is significant for it increases households‟ understanding regarding
the factors that influence participation in small-scale irrigation and its effect on food security.
This is because determining the contribution of small-scale irrigation to household income
and their food security status is very important for policy implementation. The study gives a
clue for policy makers and planners towards major blockage of farm households‟
participation in small-scale irrigation and its effect on income in the study area.
Generally the significance of the study is that it attempts to provide realistic information on
the overall issues of small-scale irrigation development in the study area and for formulating
future strategies on smallholder irrigation investment.
1.7 Scope and limitations of the Study
This study was scoped to one administration woreda, two Tabias and 150 respondents. The
data of the study were based on a cross sectional survey. The objective of this study was to
estimate the impact of small-scale irrigation on rural household food security. The study is
thus subject to some limitations. For example, many data were highly dependent on the
memory of the respondents because of the underdeveloped recording system in the country.
Accordingly, some data particular in the quantitative data might be short of accuracies. Some
respondents were also unwilling to give the correct response for some sensitive variables. In
this case, the study is less confidence to conclude that the data were accurate. Some
secondary data at the woreda level are not clear and well documented. However, the study
used the different data collection method, random sampling and the respondent consents in
order to minimize the limitation, and ensure the reliability of the data and produce valid
results.
1.8 Organization of the Thesis
This thesis is organized into five chapters. Chapter one deals the explanation and objective of
the study while chapter two deals with the conceptual and theoretical literatures. The third
chapter presents the study area. Chapter four presents overall research design of the study.
The fifth chapter focuses on the descriptive and econometric results of the study. Finally,
chapter six summarizes the conclusion and recommendation.
8
Chapter Two: Review of Literature
This chapter focuses on review of literature on irrigation and food security. In order to clarify
the idea of the study it is important to define the key concepts associated with the empirical
studies of the food security and irrigated agriculture. The chapter also reviews different
impact assessment methods that are used in investigating the impact of irrigation schemes on
household food security.
2.1 Definition and Concept of Food Security
The four determinants for plant growth are water, soil, air and sunshine. Therefore, water is
essential to plant-growth and crop-production (Widtose, 2001). Water is important for
agriculture, household consumption, industry, hydropower, navigation, fisheries, recreation,
and ecosystems. Without water there is no food production. The production of food is needed
to guarantee food security. In another way, the availability of water during cropping time is a
very important condition for the best production yields (Mollinga, 2000). “Ethiopian
agriculture is dominated by cereals, which form the country‟s staple crop production. Cereals
account for about 7o% of agricultural GDP. Over the past decade, cereal production has more
than doubled to nearly 15 million tons, mainly as the result of the expansion of cultivation to
more marginal lands. Livestock production accounts for about 15 percent of GDP and
draught animals are critical for all farming systems (IFAD, 2008)”.
Food security is defined in different ways by different organizations around the world. For
example in 1996, the definition of food security was agreed and accepted at the World Food
Summit in Rome and it was defined food security as a physical and economic access by all
people at all times to sufficient, safe and nutritious food to meet their dietary needs and
food preference for an active and healthy life (Todaro and Smith, 2011). This definition
contains different features, such as food availability, accessibility, utilization and stability.
Food availability refers to the existence of food from own production or on the markets. It is
a combination of domestic foods production, marketable imports and food aid. It also

9
refers to food supplies available at both the household level and at a national level. However,
it is applied most commonly in reference to food supplies at the regional or national level.
But food access concerns about having sufficient resources to obtain appropriate foods for a
nutritious diet through a combination of home production, stocks, purchase, and gifts,
borrowing or food aid. Food access is guaranteed when households and all individuals within
them have adequate resources, such as own production, stocks, purchases, gifts, borrowing or
aid. Households‟ wealth is an important determinant for food access when regular livelihood
strategies are compromised by poor agro-climatic conditions, high prices, loss of
employment, or illness.
Food utilization has a socio-economic and a biological aspect. It refers to nutritional and
safety aspects of food security to meet adequate diet, clean water, sanitation and health
care to search a state of nutritional well being. It also refers to the household‟s
knowledge of nutrition and childcare techniques. Food Stability complements the previous
factors by stressing that food must be available, accessible, affordable and properly utilized
on a continuous, long-term basis .It refers to the level of resilience to shocks and other
crises. The world had about 800 million food insecure and malnutrition people in 2011
(FAO, 2011). Similarly, Ethiopia had about 3 million (200 thousand in Tigray) food insecure
and malnourished people (MoFED, 2012).
2.2 Household food security and measurement
Food security is a broad concept and the meaning and the measurement is not obvious as it
may seem. Food security is multidimensional in nature. Accurate measurement and policy
targeting, therefore remains a challenge due to many dimensions involved (Hart et al., 2009).
According Jacobs (2009, p.411), “A food security target depends heavily on indicators and the
measurement of food (in) security. Three categories of food security indicators exist with
their respective strengths and limitations: food availability indicators focus on national food
supply, yet pay scant attention to individual nutritional status; food expenditure and access
indicators measure the monetary value of food as a proxy for food consumption, but often
exclude individual nutritional status (or other anthropometric measurements); composite
indexes incorporate all the available dimensions of food security into a single index,

10
but the weights attached to components of the index might misrepresent their values in
practice.”
Food security can be measured by using supply-side approach or demand-side approach. The
food supply approach deals with food availability issues,(e.g food production index, per
capita output, food aid delivery, livestock index, crop index and etc.). The food demand
equation, on the other hand, deals with accessibility mainly focusing on income,
consumption expenditure, nutrition index, and diet diversity score, calorie intake index,
hunger index and others (Norton et al., 2010). Depending upon the objective of the
studies, some scholars preferred food supply while other scholars preferred the food
distribution. Supply approach shows food availability while demand approach indicates food
access so that the demand-side approach is the most preferable (G/egziabher, 2008). Hence,
the food demand approach was employed to evaluate the impact of small-scale irrigation on
rural household food security.
2.3 Definitions and Concepts of Irrigation
Water is a basic need for human beings and animals. It is essential for their metabolic
processes. It is used to build healthy Workforce, Ensuring Food Security, Provision of Clean
energy for Agriculture, Industry & Service Maintenance of Healthy Ecosystem, Recreation
(Aesthetic Value), Transportation, Hedge against climate change and variability catalyst
(MOWE, 2013).The most essential use of water in agriculture is for irrigation to produce
enough food. Agriculture is the largest user of water in all regions of the world except
Europe and North America (FAO, 2002b). About 90% of water withdrawn is taken by
irrigation in some developing countries and significant proportions in more economically
developed countries WBCSD (2010). But about one fifth of the world (about 1.2 billion
people) live in areas of water scarcity, which is not enough water available to meet their
daily, needs (World Development Report, 2010).
According FAO(1996a), irrigated agriculture can be defined as the supply of water increased
by artificial means, involving the use of water controls technology and including drainage to
arrange excess water. Irrigation has been practiced in Egypt, China, India and other parts of
Asia for a long period of time. Ethiopia also has a long history of traditional irrigation system

11
(mainly diversion schemes).It enables farmers to increase crop production and achieve higher
yields, food availability and affordability for non irrigators and reduces the risk of crop
failure if rain fails (Hussein and Hanjra, 2004). India and Far East have grown rice using
irrigation nearly for 5000 years (Zewdie et al., 2007). Analysis in Asia indicates that
irrigation contributes to increase yields per area, for most crops by between 100%–400%.
This has contributed to a reduction in food prices. Irrigation contributes to agricultural
productivity through solving the rainfall shortage, motivates farmers to use more of modern
inputs and harvest throughout the year and creates employment to members of the
households especially to wife and children (FAO, 2011).
According to Fuad (2002) irrigation in Ethiopia can be classified in to three:
1. Small-scale irrigation which are often community based and traditional methods
covering less than 200hectares.
2. Medium scale irrigation which is community based or publicly sponsored, covering 200
to 3000 hectares.
3. Large scale irrigation covering more than 3000 hectares, which is typically commercially
or publicly sponsored.
2.3.1 Definition and Concept of small-scale irrigation
Small-scale irrigations are type of irrigations that defined as schemes that are controlled and
managed by the users. Small-scale schemes developed, operated and maintained by
individuals, families, communities, or local rules and landowners, independently of
government W. Bart (1996). In the same way, Small-scale irrigation is a type of irrigation
defined as irrigation, on small plots, in which farmers have the controlling influence and
must be involved in the design process and decisions about boundaries (Tafesse, 2007).
2.3.2 Small-scale Irrigation and Food Security
This study reviewed the economic contribution of small scale irrigation on rural household
food security. Irrigation investment in India enabled farmers to increase diversification
of crops, and use of more chemical inputs like pesticides, fertilizers or improved seed
varieties (Bhattarai et al., 2007) and switched from low-value subsistence production to
12
high-value market-oriented production in China (Huang et al., 2006). Farmers in rural areas
suffered from persistent poverty and food insecurity due to climatic changes and dependant
on variable rainfall. This leads to low agricultural productivity. As a result, the low
productivity areas characterized by persistent rural poverty and increasing population
pressure have often resulted in a vicious circle of poverty and environmental degradation
(Von Braun, 2008). As many of the low productivity areas did not use water resources,
irrigation development is recognized as a backbone of agricultural productivity, enhancing
food security, earning higher incomes and increasing crop diversification (Smith, 2004). In
many developing countries, small scale irrigation schemes were consider as a means to
increase production, reduce the risk of unpredictable rainfall and provide food security and
employment to poor farmers (Burrow, 1987).
Small-scale irrigation is a policy priority in Ethiopia for rural poverty alleviation, food
security and growth. It enables households to generate more income, increase their resilience,
and in some cases transform their livelihoods (MOFED, 2006). Small-scale irrigation in
Ethiopia had a significant role in diversification of production to new types of marketable
crops like fruits, cash crops and vegetables(Eshetu , 2010).
According to G/egziabher (2008), farm production in irrigation and rainfall-based areas of
Tigray has big difference in their productivity. He found that the farm production produced
based on irrigation was high due to post harvest storage facilities, and doubling or
tripling effects of irrigation while the rain-fed areas produced subsistence crops and
encountered a chronic food deficit. A study conducted by Hagos et al. (2009) also
indicated that irrigation in Ethiopia increased yields per hectare, income, consumption and
food security.
2.3.3 Irrigation Development in Ethiopia
Irrigation is a very ancient agricultural practice which was extensively used by a number of
early civilizations such as the ancient Egyptians and Ethiopians Grove (1989) as cited by
(Chazovachii, 2012). Evidence also shows irrigation has been practiced in Egypt, China,
India and other parts of Asia for a long period of time. Irrigation is the foundation of
13
civilization in many regions. For instance, Egyptians have depended on Nile‟s flooding for
irrigation continuously for a long period of time on a large scale (Zewdie et al., 2007).
Irrigated agriculture is not an entirely new phenomenon in Ethiopia. As some literatures
indicated, Small-scale traditional irrigation has been practiced for decades throughout
the highlands where small farmers could be diverted seasonally for limited dry season
cropping (FAO, 1994). According MoWE (2012) modern irrigation has documented in the
1960s where the government designed large irrigation projects in the Awash Valley to
produce food crops for domestic consumption and industrial crops for exports and it was
strongly believed that rain fed agriculture should be supplemented by irrigation in order
to achieve national food self-sufficiency and ensure household food security. The total
irrigation potential in Ethiopia is 3,798,782 hectare but currently irrigation schemes have
covered only 368,160 hectare, 10% of the potential( MoFED, 2012).
According MoWE (2012), Tigray region has 300,000 hectares irrigation potential which is
4% of its surface are. The region has been used only 2% of its irrigation potential.
Accordingly, it has vast unused potential of irrigation resources. According (Awulachew et
al. 2007), the reasons for the poor development of irrigation in the region (country) are
fragmented and small farmland, political instability, lack of technologies, government -
owned land policy, lack of financial resources, and weak institutional set up in the region
(country).
2.3.4 An Overview of Ethiopia‟s Food Security Situation and Irrigation
According Seleshi et al, (2005), agricultural production in Ethiopia has affected by increasing
population, deforestation and land distribution. This reflected in a decrease in household
production, grazing land. Hence, it has become a common phenomenon to ask for emergency
food assistance for acutely food insecure people in Ethiopia.
According WFP (2010), in Ethiopia, due to the situations of people who do not have the
capacity to produce or buy enough to meet their annual food needs even under normal
weather and market conditions a total of 5.23 million people would need emergency food
assistance from January to June 2010. The Productive Safety Net Program (PSNP) reach to
14
support over 7.23 million people in 300 Woredas for seven regions (Tigray, Amhara,
Oromiya, SNNPR, Afar, Harar and Dire Dawa) who are facing chronic food insecurity
situation starting 2006. Hence, the expansion of small-scale irrigation schemes was taken as
the main development strategy in order to reduce crop failure due to drought and erratic
rain fall conditions in Ethiopia by preparing a National Medium-Term Investment Program
(NMTIP) for Water Sector Development Program (WSDP) for 15 years (2002-2016) ..
In Tigray region, farmers produce insufficient amount because of inconsistent rain fall, and
then the government of the region has given great attention to small-scale irrigation as a
means to ensure food security and poverty reduction (Awulachew, 2007).The adoption of
new technology (e.g. irrigation) is the major powerful for agricultural growth and
poverty reduction (Norton et al., 2010).This indicates that investment in irrigation can
increase farmer‟s independence on rainfall, it increases irrigated farmland, it generates
employment, it promotes farmers to produce two or three times in a year and use more of
chemical inputs. Small scale irrigation in developing countries was considered as a means of
increasing production, reducing the dependence on rainfall and provides jobs to the poor
(Chazovachii, 2012). Small scale irrigation increases land productivity, crop yields,
adoption of mineral fertilizers and enables to diversify into non-conventional and market-
oriented products (Eshetu, 2010). It improves farm households‟ diet, incomes, health and
food security (Torell and Ward, 2010). Hence irrigated agriculture is accepted as essential in
increasing land productivity, enhancing food security, earning higher and more stable
incomes and increasing for multiple cropping and crop diversification (Smith, 2004).
2.4 Empirical Studies in Irrigation and Food Security
2.4.1 Determinants of Household irrigation participation Food Security
Different studies were conducted to identify determinants of irrigation participation and food
security in different countries including Ethiopia. For example, a study conducted by Dillon
(2011) found that household head education level, gender of the head, age of household
head, landholding, livestock units, access to credit from financial institutions, farmland
size, distance to the roads, distance to markets, distance to rivers, household sizes, access
to market information, type of peasant associations and training are important factors
15
influenced to participate in irrigation farming. Similar studies found that rural associations,
information access are vital instruments to bring attitudinal change and motivate respondents
to adopt new technologies through informal education, panel discussion, public meetings and
other demonstrations (Nugusse, 2013). According Asayehegn et al. (2011), farmers who are
members of the formal and informal institutions (water user association, peasant associations
and local leadership), education are factors influenced to participate in irrigation farming. A
study conducted by Mati (2008) also found that the investment cost is the most determinant
factor for irrigated farming decision (Mati, 2008).
According to Epherm (2008) household food security in the north eastern part of Ethiopia
were strongly associated with various socio-economic and bio-physical factors that influence
the food security status of households were age of household head, dependency ratio, size
of cultivated land, total number of livestock owned, manure application, land quality and
farmer‟s knowledge on the effect of land degradation on food security. Similar study by
Shiferaw et al (2004) found that the analysis of household food security determinants in
Southern Ethiopia that adoption of improved technology; having larger farm size and having
better land quality were found an important role in ensuring household food security in the
study area.
2.5 Irrigation techniques/ methods
Irrigation methods are the system how to obtain water for irrigation purposes from its
sources is. It depends on water resources, water rules, rain water, topography, plants
cultivated and growing seasons Dupriez and De Leener (2002). There are only two general
methods of applying irrigation water.1 surface irrigation 2. Sub-surface irrigation
2.5.1 Surface irrigation
Surface irrigations are the oldest methods of irrigation, which convey water from the survey
to the fields in lined or unlined channels. Surface irrigation is the introduction and
distribution of water in a field by the gravity flow of water over the soil surface. The primary
methods of applying water are Basins irrigation, Boarders irrigation, Flood irrigation and
Furrows irrigation Widtose(2001). One can choose these irrigation methods depending on the

16
nature of the soil, the form of the land, the head of the water stream, the quantity of water
available and the nature of the crop.
2.5.1.1 Basin irrigation
Basin irrigation is the most common form of surface irrigation, particularly in regions with
layouts of small fields. A basin is a piece of land, small or large, surrounded by earth bunds
in which water is pounded. The field to be irrigated is divided in two units surrounded by
levels or dams. Gated outlets, siphon tubes, spiels, and hydrants conduct water from delivery
channels in to each basin. This type of irrigation is suitable for all types of soil and efficient
use of water but it needs high initial cost for leveling land.
2.5.1.2 Furrow irrigation
Furrow irrigation is accomplished by running water in small channels that are constructed
with or across the slope of a field. Furrow irrigation avoids flooding the entire field surface
by channeling the flow along the primary direction of the field using 'furrows,' 'creases,' or
'corrugations. Water infiltrates through the wetted perimeter and spreads vertically and
horizontally to refill the soil reservoir. Water is diverted in to furrows from open ditches or
pipes. Theadvantage of this type of irrigation are Uniform application of water, less
evaporation loses, less intercultural operations but it needs high cost for preparing furrows.
Because it requires more and require more labor
2.5.1.3 Border irrigation
Border irrigation is an open-field method viewed as an extension of basin irrigation to
sloping, long rectangular or contoured field shapes, with free draining conditions at the lower
end. Here a field is divided into sloping borders. Water is applied to individual borders from
small hand-dug checks from the field head ditch. Soils can be efficiently irrigated which
have moderately low to moderately high intake rates but, as with basins, should not form
dense crusts unless provisions are made to furrow or construct raised borders for the crops.
The benefits of this type of irrigation are uniform application of water, uniform application of
17
water, efficient use of water but it requires repairing of ridges and supervision during
irrigation and land needs to be graded uniformly
2.5.1.4 Flood irrigation
Flood irrigation is an ancient method of irrigating crops. It was likely the first form of
irrigation used by humans as they began cultivating crops and is still one of the most
commonly used methods of irrigation used today. Water is delivered to the field by ditch,
pipe, or some other means and simply flows over the ground through the crop. This type of
irrigation is least cost method and does not require any skill but it is inefficient method, result in
uniform stand of crops and low yield, and more wastage water due to run off, deep seepage and
evaporation.
2.5 .1.5 Drip irrigation
This method is one of the more advanced techniques being used today because, for certain
crops, it is much more efficient than flood irrigation, where a larger portion of the water is
lost to evaporation. Drip irrigation is practiced in dry, arid regions where water is scarce and
must be used sparingly. Water is run through pipes (with holes in them) either buried or lying
slightly above the ground next to the crops. Water slowly drips onto the crop roots and stems.
The advantage of this type of irrigation are very economic, surface evaporation is reduced,
sweated to arid regions and can be used for applying fertilizers, increases yield by 50-60%.
But it needs high initial cost and maintenance.
2.5.2 Sprinkler irrigation
In this method of irrigation, water is sprayed into the air and allowed to fall on the ground
surface somewhat resembling rainfall. According to Dupriez and De Leener (2002),
Sprinkler irrigation imitates rainfall. It is also called overhead irrigation. The spray is
developed by the flow of water under pressure through small orifices or nozzles. The
pressure is usually obtained by pumping. In contrast to surface irrigation, sprinkler systems
are designed to deliver water to the field without depending on the soil surface for water
conveyance or distribution. This type of irrigation is beneficial for uniform distribution of
water and highly efficient use of water, water application at controlled rate and used for
cooling crops during high temperatures and frost control during freezing temperatures. But it
needs high initial costs and more maintenance, and there is high evaporation lose

18
Chapter Three: Materials and Methods
This chapter explains the research strategy that guided the study and the different methods
used for data collection and analysis. Furthermore, it discusses the strengths and limitations
of these methods based on practical experiences of the research work.
3.1 Description of the study area
3.1.1 Location
This study once is Alaje Worda located in the Southern Zone of Tigray region. It is about
85Km far from the capital city of Tigray Regional State, Mekelle. It has 20 rural and 1urban
Tabias. It is a part of the Debubawi Zone and bordered on the south by Endamehoni, on the
southwest by the Amhara Region, on the north by Debub Misraqawi Zone, and on the
southeast by Raya Azebo. The administrative center of this woreda is Adi Shehu.
Figure 3.1 Map of Alaje Woreda.
19
3.1.2 Selection of the study area
The study was in two Tabias of Emba alaje woreda:- Atsela and Ayba. The Tabias have
relatively high water potential, farmers in the areas have long history of traditional practices,
the Tabias have better irrigation activities that give opportunity to government in developing
modern small-scale irrigation schemes and the Tabias accessible in terms of roads, market
etc. Therefore because of the above reasons, the researcher chose the woreda as well as the
Tabias to study the impact of small-scale irrigation on rural household food security.
3.1.3 Agro-ecological Condition
The study area has three agro-climatic zones such as Highland (dega), Mid Highland (woina
dega) and Low land (kola) dominated by Highland (dega). The annual temperature ranges
between30°c and45°c with an average of 37.5°c. The main rainy season extends from late
June to early September. The distribution of the rainfall is, however, with large variability,
untimely and irregular in nature. The elevation significantly affects the climatic condition,
vegetation coverage, resource distribution, human settlement and agricultural practice.
3.1.4 Socioeconomic Condition, and Physical and Natural Resources
The woreda contains a total population of 107,972 of whom 52,844 are men and 55,128 are
women and 7,568 are urban population. The Woreda contains total 24,784 households and
total cultivate land 22457 hectares. For the land under cultivation in this Woreda, 65.39%
was planted in cereals, 24.94% in pulses, and 51 hectares in oilseeds; the area planted in
vegetables is missing. The area planted in fruit trees was 57 hectares, while 32 were planted
in Gesho. 65.36% of the farmers both raised crops and livestock, while 33.63% only grew
crops and 1.0% only raised livestock. Land tenure in this Woreda is distributed amongst
86.43% owning their land, and 10.73% renting; the number held in other forms of tenure is
missing The total households of the woreda are 24,784 and the majority of the population
practiced Ethiopian Orthodox Christianity. The two largest ethnic groups in this Woreda are
the Tigrayan(98.18%), and the Agaw Kamyr (1.4%) and other ethnic groups made up 0.42%
of the population. Tigrinya is spoken as a first language by 98.78%, and Kamyr by 0.96% of
20
the population; the remaining 0.26% spoke all other primary. About education, 10.46% of the
population were considered as literate, 13.46% of children aged 7-12 were in primary school;
0.96% of the children aged 13-14were in junior secondary school; 0.55% of the inhabitants
aged 15-18 were in senior secondary school. Concerning sanitary conditions, about 23% of
the urban houses and 13% of all houses had access to safe drinking water at the time of the
census; about 14% of the urban and 4% of the total had toilet facilities CSA (2007).
3.2 Types of Small-scale irrigation in the study area
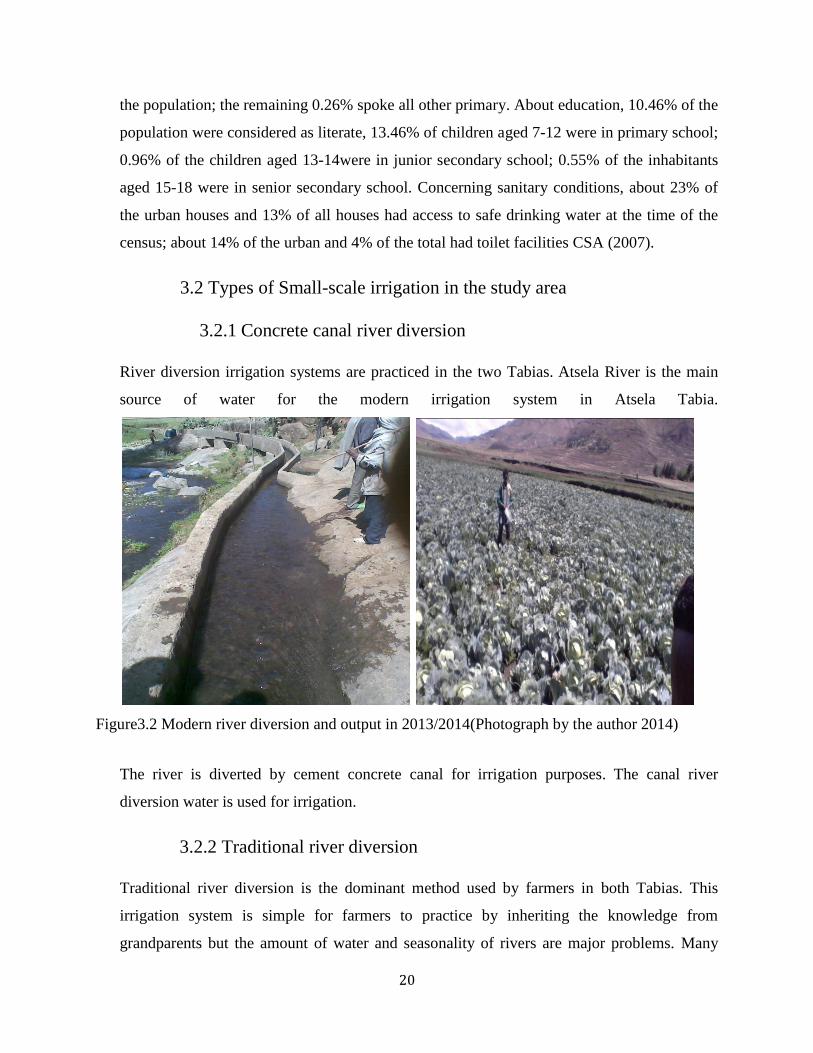
3.2.1 Concrete canal river diversion
River diversion irrigation systems are practiced in the two Tabias. Atsela River is the main
source of water for the modern irrigation system in Atsela Tabia.
Figure3.2 Modern river diversion and output in 2013/2014(Photograph by the author 2014)
The river is diverted by cement concrete canal for irrigation purposes. The canal river
diversion water is used for irrigation.
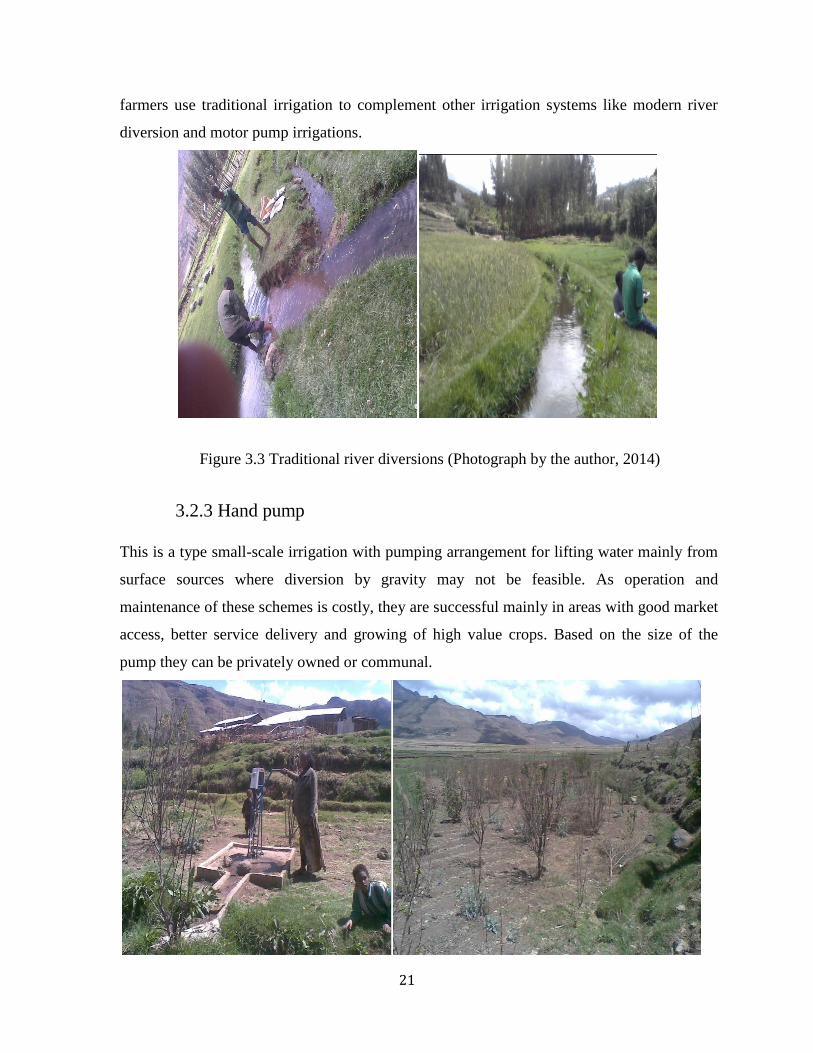
3.2.2 Traditional river diversion
Traditional river diversion is the dominant method used by farmers in both Tabias. This
irrigation system is simple for farmers to practice by inheriting the knowledge from
grandparents but the amount of water and seasonality of rivers are major problems. Many
21
farmers use traditional irrigation to complement other irrigation systems like modern river
diversion and motor pump irrigations.
Figure 3.3 Traditional river diversions (Photograph by the author, 2014)
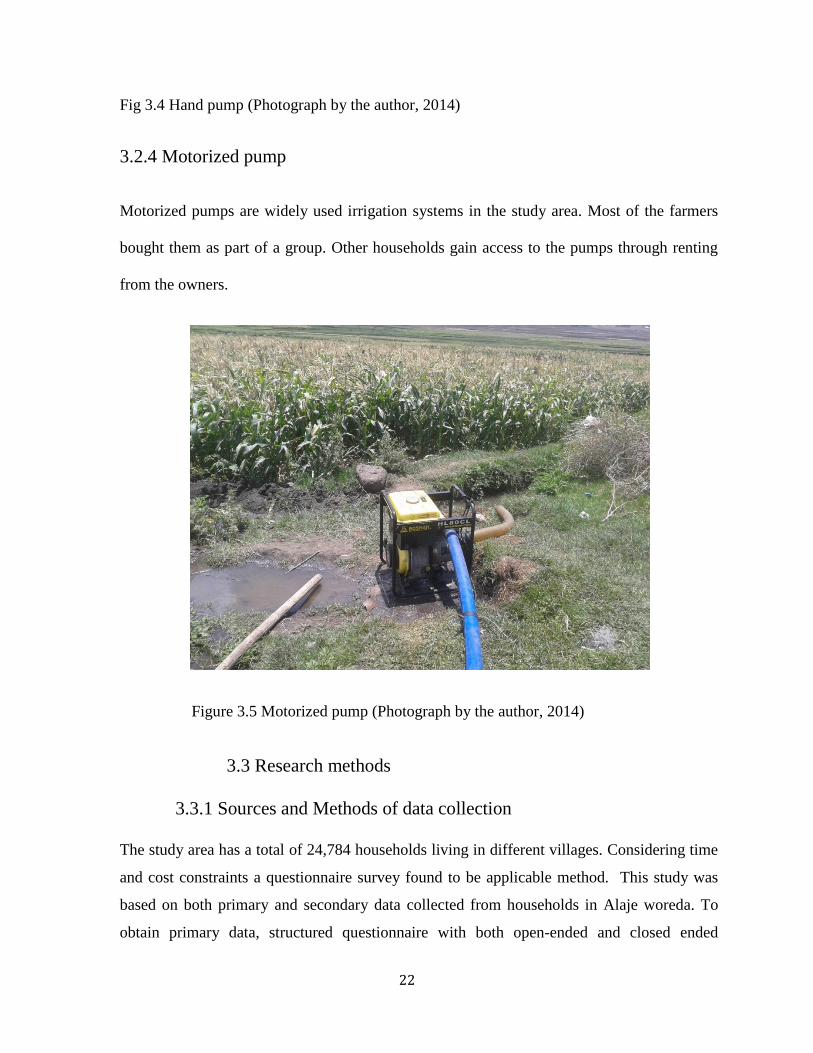
3.2.3 Hand pump
This is a type small-scale irrigation with pumping arrangement for lifting water mainly from
surface sources where diversion by gravity may not be feasible. As operation and
maintenance of these schemes is costly, they are successful mainly in areas with good market
access, better service delivery and growing of high value crops. Based on the size of the
pump they can be privately owned or communal.
22
Fig 3.4 Hand pump (Photograph by the author, 2014)
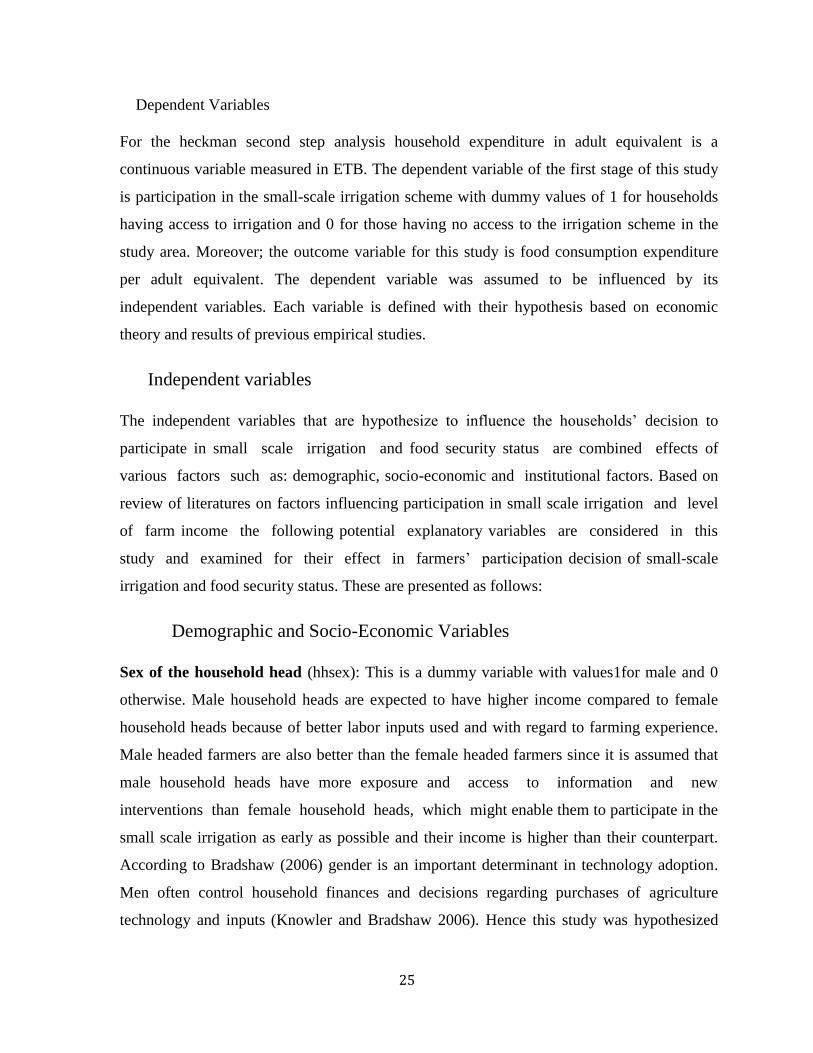
3.2.4 Motorized pump
Motorized pumps are widely used irrigation systems in the study area. Most of the farmers
bought them as part of a group. Other households gain access to the pumps through renting
from the owners.
Figure 3.5 Motorized pump (Photograph by the author, 2014)
3.3 Research methods
3.3.1 Sources and Methods of data collection
The study area has a total of 24,784 households living in different villages. Considering time
and cost constraints a questionnaire survey found to be applicable method. This study was
based on both primary and secondary data collected from households in Alaje woreda. To
obtain primary data, structured questionnaire with both open-ended and closed ended

23
questions were used to collect demographic information of household heads, like age, sex,
educational level, household size in adult equivalent, cultivated land, farm experience, access
to extension service, access to credit, irrigation access, livestock holding, market access,
household income and expenditure of the household heads. However; secondary data were
also collected from the Plan and Finance of Woreda Emba Alaje(WOFED, 2011), Office of
Agricultural and Rural development Woreda Emba Alaje( WBAD, 2011) and Office of
Water and Mineral Energy of Woreda Emba Alaje(WWME, 2011). The information is used
to evaluate the existing works and compare this study with the previous studies.
Data collection from households were carried out by two enumerators (12 grades complete)
and the researcher by applying face to face interview. The selection of enumerators was done
depending on the knowledge of the study area, their local language, the educational level and
personal willingness to take part in the survey. After the selection process completed, one
day orientation and discussion about the objectives of the survey, discussions on each
questions was also undertaken. This helped in creating a common understanding by avoiding
misconception and increasing clarity. Finally, a pre-test survey was conducted with three
volunteer farmers. A support letter written by the Woreda administration to each Tabia center
was handed over to the enumerators. This helped to complete the survey smoothly. Finally,
the collected data completed, coded, and entered for further analysis using STATA
statistics software. Descriptive statistics and econometric model were used to analyze the
data.
3.3.2 Sampling techniques
This study was used a three-stage sampling technique to select sample respondents. Firstly,
Alaje Woreda is purposely selected mainly because of the area is relatively better small-scale
irrigation activities that gives opportunity to develop modern small-scale irrigation schemes.
As a result, the researcher initiated to select the woreda for this study. Then finally, out of
total 21 Tabias found within the woreda two Tabias; namely Ayba and Atsela were purposely
selected mainly because of availability of irrigation schemes. Secondly, the sampling frame
obtained from the Tabias office was stratified into two groups of irrigation participants and
non-participants. For this study, participants are those households, in the two Tabias, who
used irrigation (River diversion or well).While the non-participants are those households, in

24
the same Tabias, with no irrigation access from the scheme. Finally, 150 farm households
consisting of 60 irrigation users and 90 non –users were selected from the identified list using
simple random sampling technique taking into account). Time and financial constraints are
among the factors that forced the researcher to limit the number households covered in the
study.
3.3.3 Methods of data analysis
To achieve the objectives, this study was used both descriptive statistics (mean, mean
difference, percentage, standard error and standard deviation) and Heckman‟s two stage
estimation (Binary Probit model at the first stage and OLS model at the second stage)
were used to analyze the collected data. The Foster Greer Thorbecke (FGT) poverty indices
were also used to give a summary of the incidence, depth and severity of poverty in the study
area. The statistical significance of the variables in the descriptive part was tested for
both dummy and continuous variables using chi-square and t-test, respectively.
In this study, to estimate the impact of small-scale irrigation on rural household food
security, an assessment of selected socioeconomic characteristics, demographic
characteristics and institutional factors such as age, sex, family size in adult equivalent,
education level, cultivated land size, soil fertility, farm experience, access to credit, access to
extension service, water irrigation availability, distance to market to, distance to farmers
training center and total livestock holding of the sample household heads are very important.
Households that are irrigation users and non-users were used as the concern groups and
annual food expenditure per adult equivalent was used to examine the impact of small-scale
irrigation on rural household food security status.
Definition of Variables and Working Hypotheses
Different variables are expected to affect rural households‟ decision participation in small-
scale irrigation schemes and level of income from small scale irrigation in the study area. The
variables hypothesized to influence participation decision in small-scale irrigation and food
security status are explained in this section.
25
Dependent Variables
For the heckman second step analysis household expenditure in adult equivalent is a
continuous variable measured in ETB. The dependent variable of the first stage of this study
is participation in the small-scale irrigation scheme with dummy values of 1 for households
having access to irrigation and 0 for those having no access to the irrigation scheme in the
study area. Moreover; the outcome variable for this study is food consumption expenditure
per adult equivalent. The dependent variable was assumed to be influenced by its
independent variables. Each variable is defined with their hypothesis based on economic
theory and results of previous empirical studies.
Independent variables
The independent variables that are hypothesize to influence the households‟ decision to
participate in small scale irrigation and food security status are combined effects of
various factors such as: demographic, socio-economic and institutional factors. Based on
review of literatures on factors influencing participation in small scale irrigation and level
of farm income the following potential explanatory variables are considered in this
study and examined for their effect in farmers‟ participation decision of small-scale
irrigation and food security status. These are presented as follows:
Demographic and Socio-Economic Variables
Sex of the household head (hhsex): This is a dummy variable with values1for male and 0
otherwise. Male household heads are expected to have higher income compared to female
household heads because of better labor inputs used and with regard to farming experience.
Male headed farmers are also better than the female headed farmers since it is assumed that
male household heads have more exposure and access to information and new
interventions than female household heads, which might enable them to participate in the
small scale irrigation as early as possible and their income is higher than their counterpart.
According to Bradshaw (2006) gender is an important determinant in technology adoption.
Men often control household finances and decisions regarding purchases of agriculture
technology and inputs (Knowler and Bradshaw 2006). Hence this study was hypothesized
26
male headed households were more likely to participate in the small-scale irrigation scheme
in the study area.
Age of a household head (hhage): Age is a continuous variable measured in years. It is one
of the factors that determine decision making of a person. Previous studies found a two way
relationship between age and decision to participate in irrigation scheme and other
agricultural technologies. Younger farmers are more innovative and open to technological
advances and be more willing to adopt a new technology (Diederen et al. 2003). Therefore,
this study hypothesized negative relationship between age of the household head and
participation in irrigation scheme. At younger ages the probability of participating in small-
scale irrigation increases.
Education level of a household head (hheduc): This is a continuous variable measured in
formal schooling years completed by the household head. That is the number of years of
schooling attained by the sampled households‟ heads up to the time of the survey. Previous
studies indicated that the possibility to adopt new methods of farming increased along with
education level. That is educated farmers would more readily to adopt irrigation technology,
may be easier to train through extension support and have a positive impact on irrigation
participation. On the other hand, as the educational level of farmers is increased, their
interest to work in non-agricultural activities may be increased that leads to the declining
of the willingness to participate in contract farming program. According Feder et al. (1985)
farmers with more education have been shown to adopt modern agricultural technologies
sooner. Therefore, the variable was hypothesized to influence the participation decision on
contract farming and gross margin earnings of the farmers in both negative and/or positive
directions.
Farming experience (farmexp): This is a continuous variable refers to the total number of
years that the sampled household has spent in farming. A farmer with longer experience in
farming, a wider knowledge and experiences are gained on the operation and conduct of the
agricultural activities and methods of production. Thus, this variable was hypothesized to
have a positive relationship with participation in the small-scale irrigation scheme. That is

27
more likely that farmers with longer farming experience are ready to accept changes and
adopt new ideas and techniques.
Family size (hhsizepa): This is continuous variable measured in total number of the
household members living under the same roof adjusted to adult equivalent. Family size in
adult equivalent of a household is calculated by using the conversion factor and multiplying
each household member with respective conversion factor and then summing (Annex 2).
Previous studies found a two way relationship between family size and decision to participate
in irrigation scheme and other agricultural technologies. Therefore, this variable was
hypothesized positive effect household heads decision to small-scale irrigation participation.
A household with large labor force can participate in small-scale irrigation more than a
household with small- number of labor force (Shimelis, 2009).
Cultivated land holding (cultland): This is a continuous variable measured in Tsimad and it
refers to the total cultivated land size of the household heads. In many previous studies, it has
been noted that enough size of land holding is the basic requirement for adoption of
agricultural technologies. It is thus hypothesized that the larger the farm size the farmer has,
the higher the probability to adopt small-scale irrigation technology. Total cultivated land
should have a positive relationship with income of a household (Kamara et al. 2001).
Soil fertility(soilfertiity): this is a dummy variable taking value 1 if the soil is fertile
and 0 is infertile. It is one of the factors affecting crop production. Fertility of land has direct
relationship with productivity. The analysis between soil fertility and state of food security
indicates that they are systematically associated. The quality of land can also influence the
decision whether or not to adopt an agricultural technology(Zhou 2008) Hence, it is
hypothesized that farmers who have soil fertile are more likely to be food secure than those
who don‟t have the same.
Total Livestock Holdings (tlu): This is a continuous variable refers to the total number of
herd in TLU. A household livestock size in TLU is calculated by multiplying the number of
each type of animal by their conversion factors and then summing. Livestock is important
source of income, food and draught power for crop cultivation in Ethiopian agriculture.
More livestock holding is expected to increase the probability of participation in small

28
scale irrigation. Livestock may also serve as an alternative for oxen ownership, which is
important for farm activity. Therefore, in this study it is hypothesized that higher TLU will
have positive relationship with household heads decision to participate in small -scale
irrigation and food security status. The owner of more oxen lead to an ability of ploughing
more land on time, thereby achieving crop yields and earning higher income leading to food
secure.
Distance to market (dismkt): This is a continuous variable measured in kilometer. It refers
to the distance between the households‟ home and the nearest market. This shows access to
the market to buy input and to sell output. As the farmer is nearer to a market, the higher will
be the chance of participating in small-scale irrigation and selling farm income.
Characteristics of different localities can affect the adoption decisions (Knowler and
Bradshaw 2006). It is, therefore, expected that households nearer to market center have better
chance to participate in small-scale irrigation and improve household food security status.
Distance farmers training center (disftc): This is a continuous variable measured in
kilometer. Moll (2004) argued that information is a source of knowledge, awareness and
change. The necessary information can be gained from training, demonstration or workshop,
and through mobile, TV and radio. The farmer training center is a source of information for
the tabia resident. There are development agents in the tabias who teach the local
communities about the application of the new technologies. The longer the distance
from home to the farmer training centers and/or development agent offices, the lower
is the probability to start and use irrigation.
Institutional Factors
Access to extension service (accexten): This is a dummy variable with values of 1 if the
household head has access to extension service and 0 otherwise. This indicates that whether
the household head gets extension service from development agents (DAs) or not.
Extension service provides the necessary information to acquire new skills and
knowledge to farmers to improve agricultural production. Bacha et al.(2011) found
significant difference between irrigators and non-irrigators in access to extension. The
higher is the probability for the farmers to access and use irrigated agriculture. It is, therefore,
29
this variable was hypothesized to positively influence participation in the small-scale
irrigation scheme.
Access to credit (credit): is a dummy variable that takes the value 1 when the household
takes loan and 0 otherwise. Access to credit is an important source of investment. Those
households who have access to credit have a better possibility of getting farm inputs( Norton
et al.1970).Therefore, it is hypothesized that access to credit determines farmers‟ decision
to participate in small scale irrigation and food security status positively. This more
implies that the formal and informal credit facilities that advantage for rural farmers are a
very important asset in rural livelihoods to finance agricultural inputs activities.
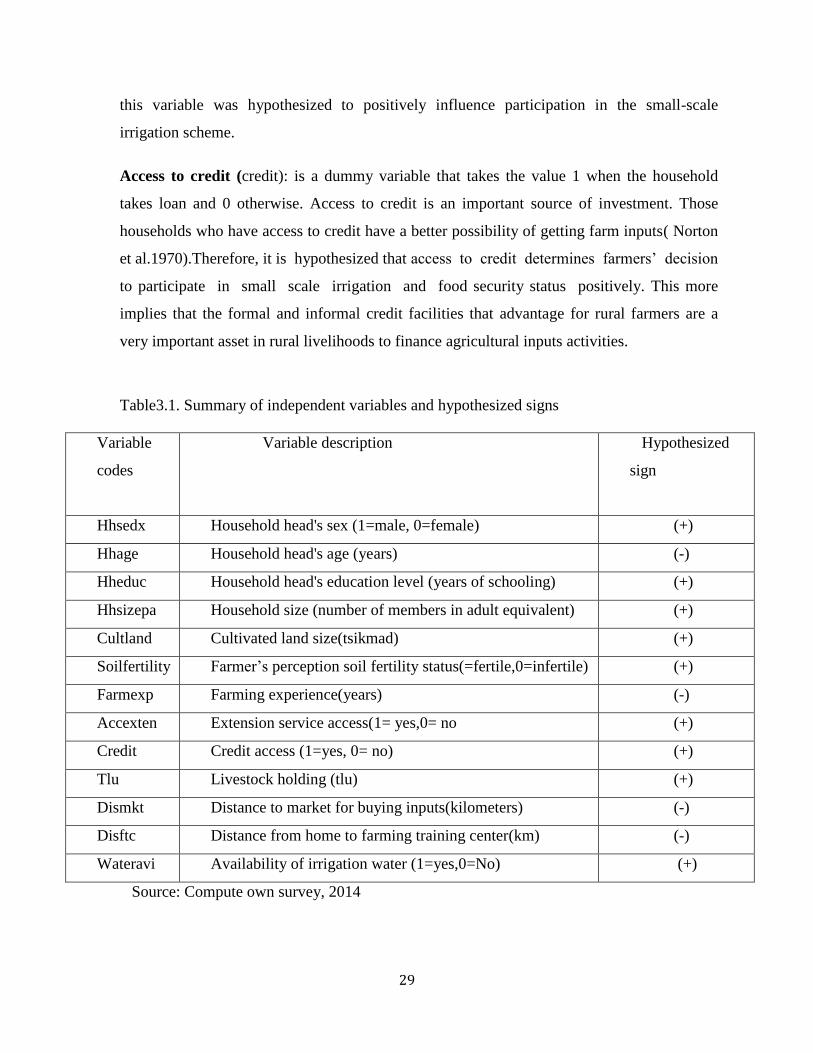
Table3.1. Summary of independent variables and hypothesized signs
Variable
codes
Variable description Hypothesized
sign
Hhsedx Household head's sex (1=male, 0=female) (+)
Hhage Household head's age (years) (-)
Hheduc Household head's education level (years of schooling) (+)
Hhsizepa Household size (number of members in adult equivalent) (+)
Cultland Cultivated land size(tsikmad) (+)
Soilfertility Farmer‟s perception soil fertility status(=fertile,0=infertile) (+)
Farmexp Farming experience(years) (-)
Accexten Extension service access(1= yes,0= no (+)
Credit Credit access (1=yes, 0= no) (+)
Tlu Livestock holding (tlu) (+)
Dismkt Distance to market for buying inputs(kilometers) (-)
Disftc Distance from home to farming training center(km) (-)
Wateravi Availability of irrigation water (1=yes,0=No) (+)
Source: Compute own survey, 2014
30
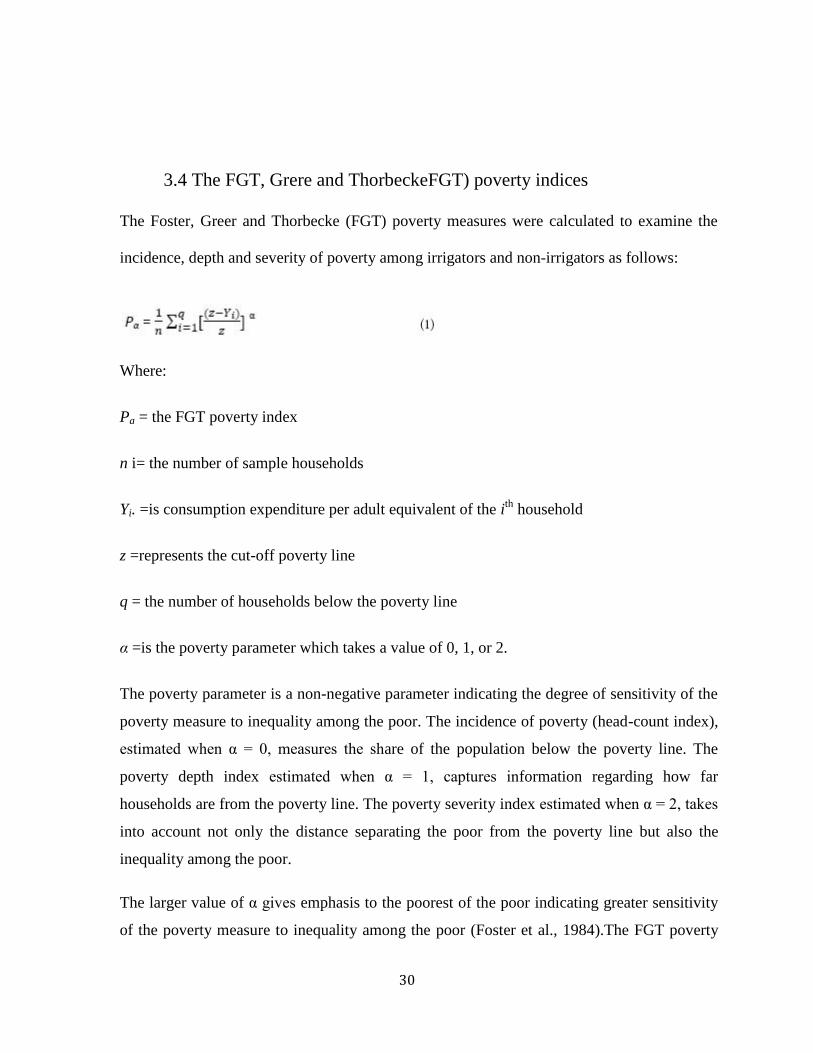
3.4 The FGT, Grere and ThorbeckeFGT) poverty indices
The Foster, Greer and Thorbecke (FGT) poverty measures were calculated to examine the
incidence, depth and severity of poverty among irrigators and non-irrigators as follows:
Where:
Pa = the FGT poverty index
n i= the number of sample households
Yi. =is consumption expenditure per adult equivalent of the ith
household
z =represents the cut-off poverty line
q = the number of households below the poverty line
α =is the poverty parameter which takes a value of 0, 1, or 2.
The poverty parameter is a non-negative parameter indicating the degree of sensitivity of the
poverty measure to inequality among the poor. The incidence of poverty (head-count index),
estimated when α = 0, measures the share of the population below the poverty line. The
poverty depth index estimated when α = 1, captures information regarding how far
households are from the poverty line. The poverty severity index estimated when α = 2, takes
into account not only the distance separating the poor from the poverty line but also the
inequality among the poor.
The larger value of α gives emphasis to the poorest of the poor indicating greater sensitivity
of the poverty measure to inequality among the poor (Foster et al., 1984).The FGT poverty

31
measures were calculated using Distributive Analysis Stata Package (DASP) based on the
minimum per capita adult-equivalent caloric intake which was taken as 2200 kcal per adult
equivalent per day. The nutritional requirements often used are the international
standards set by the World Health Organization (WHO) and the Food and Agricultural
Organization (FAO). This cut-off value is estimated to be Birr 1985 per adult equivalent per
annum for 2010/2011.
3.5 Model of specification
Determining the impact of small- scale irrigation on rural household food security is one of
the objectives of this study. Therefore, participation to irrigation is the dependent variable
which is determined by the independent variables such as household characteristics, asset
holdings and access to services. In this study, participation to small-scale irrigation status is a
dichotomous variable (1= irrigation participant and 0 = non-participant).
Since the dependent variable is taking a value of 0 or 1, representing irrigation participant or
non-participant status which is unobserved and the resulting model is non linear, it cannot be
estimated using OLS. Hence, Probit model guarantee that the estimated probabilities lie in
the range 0 to 1(Pindyck and Rubinfeld, 1981). So in this study probit model method was
employed. Depending on Gujarati (1995) and Aldrich and Nelson (1984), Hosmer and
Lemeshow (1989) the functional form of probit model is specified as follows;
Π(x) =E(y=1|x) =[ 1/ (1+ ] . . …………………………………… (1)
For simplicity, we write (1) as
Π(x) =1/ (1+ ) …………………………………………………………. (2)
Where π(x) =is a probability of being irrigation users ranges from greater or equal to 0 nd
less or equal to 1.
Zi = is a function of n-explanatory variables (x) which is also expressed as
Zi = βo + β1X1 + β2 X2 + . . . +βnXn .
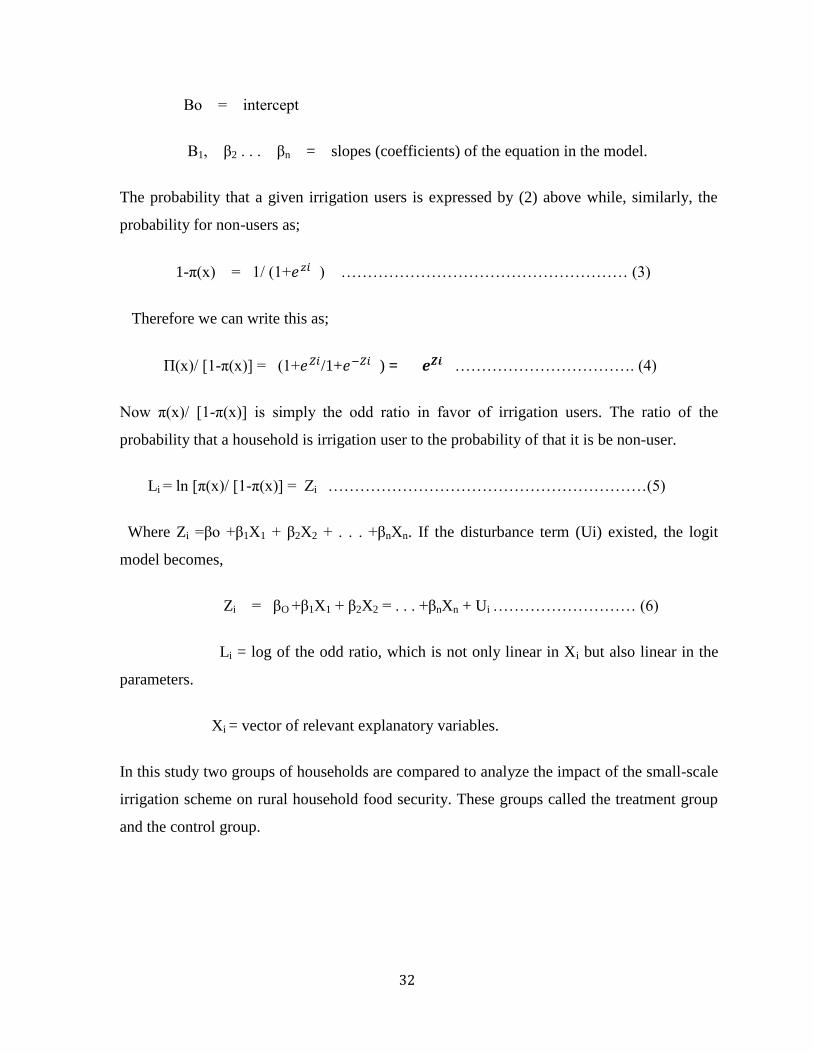
32
Βo = intercept
Β1, β2 . . . βn = slopes (coefficients) of the equation in the model.
The probability that a given irrigation users is expressed by (2) above while, similarly, the
probability for non-users as;
1-π(x) = 1/ (1+ ) ……………………………………………… (3)
Therefore we can write this as;
Π(x)/ [1-π(x)] = (1+ /1+ ) = ……………………………. (4)
Now π(x)/ [1-π(x)] is simply the odd ratio in favor of irrigation users. The ratio of the
probability that a household is irrigation user to the probability of that it is be non-user.
Li = ln [π(x)/ [1-π(x)] = Zi ……………………………………………………(5)
Where Zi =βo +β1X1 + β2X2 + . . . +βnXn. If the disturbance term (Ui) existed, the logit
model becomes,
Zi = βO +β1X1 + β2X2 = . . . +βnXn + Ui ……………………… (6)
Li = log of the odd ratio, which is not only linear in Xi but also linear in the
parameters.
Xi = vector of relevant explanatory variables.
In this study two groups of households are compared to analyze the impact of the small-scale
irrigation scheme on rural household food security. These groups called the treatment group
and the control group.

33
3.5.1 Impact Analysis
Heckman two-stage Procedure
According Zaman(2001), evaluating the impact of a program on an outcome variable using
regression analysis can lead to biased estimate if the underlying process which governs
selection into a program is not incorporated in the empirical framework. This is because the
effect of the program may be over (under) estimated if program participants are more (less)
able due to certain unobservable characteristics, to derive these benefits compared to eligible
non-participants. That is if household food expenditure of the irrigation participants is
significantly higher than that of non participants, we can not necessarily point this
difference to the influence of the small-scale irrigation program because of the self
selectivity component that should be taken care. Therefore, to evaluate the impact of a
program, a model employed can be expressed as:
Y = βX +αD +u …………………………………………. (1)
Where Y is the outcome/impact, X is a vector of personal exogenous characteristics and D is
a dummy variable (D=1, if the individual participates in the program and 0 otherwise). From
this model, the effect of the program is measured by the estimate of α. However, the dummy
variable “D” cannot be treated as exogenous if the likelihood of an individual to participate
or not to participate in the program is based on an unobserved selection process (Maddala,
1983).
Heckman two-step procedures are considered as an appropriate tool to test and control for
sample selection biases (Wooldrige, 2002). It involves two equations. The first equation (i.e.,
the participation equation) attempts to capture the factors governing participation in a
program. This equation is used to find a selectivity term known as the „Mills ratio‟ which is
included as independent variable to the second equation known as outcome equation. If the
coefficient of the „selectivity‟ term is significant then the participation equation is governed
by an unobserved selectivity bias is confirmed. Furthermore, with the addition of extra term,
the coefficient in the second stage „selectivity corrected‟ equation is unbiased (Zaman, 2001).

34
Therefore, to evaluate the impact of small scale irrigation on household food security, the
Heckman two-step procedure is employed.
Let Z be be a group of K variables which represent the characteristics of a household i which
influences the probability of participation in irrigation agriculture measured by a latent
variable Di and γk are the coefficients which reflect the effect of these variables on the
probability of being an irrigation farmer, and is X is a group of variables which represent the
characteristics of household i which determine household‟s food security ( Ci) and βs are the
coefficients which reflect the effect of these variables on household food security. Thus, the
Heckman two-step procedure takes the following form:
D*
I = ∑Ziγk + ui (k=1up to k)………………………………………………………… (2)
Ci=∑βs+Xis+εi(s=1 up to s) Observed only if Di >0 ……………………………… (3)
Where the disturbances ui and εi follow a bivariate normal distribution with a zero mean,
variance Ϭu and Ϭε respectively, and covariance Ϭεu. Therefore, we define a dichotomous
variable Di which takes a value 1when a household is an irrigator and 0 otherwise. The
estimator is based on the conditional expectation of the observed variable, household food
security (Ci):
E (Ci /Di>0) = xβ+ Ϭεu + Ϭελ (-γk) ……………………………………………….(4).
Where λ is the inverse Mills ratio defined as [λ( -γz)= ϕ(- γz)]/[1- φ( -γz)]; β and γ are he
vectors of parameters which measure the effect of variables X and Z, ϕ and φ are the
functions of density and distribution of a normal, respectively. The expression of conditional
expectation shows that Ci equals β x only when the errors ui and εi are none correlated, i.e.,
Ϭεu=0; otherwise, the expectation of Ci is affected by the variable of equation 2. Thus, from
expression 4 we find that:
Ci/Di>0 = E(Ci/D*>0) +Vi = xβ+ ϬεuϬελ(-γz)+Vi ……………………………………(5)
Where Vi is the distributed error term, N [0,Ϭε(1-Ϭεu(λ(λ- γz)))]

35
Chapter Four: Result and discussion
In this chapter the measurement procedure of the impact of small-scale irrigation on food
security status of the household and findings from descriptive and econometric analyses are
presented and discussed. The variables included in the model are defined in each of the
following tables. The dependent variable for the first stage of the Heckman two-step is
participation in small-scale irrigation. This variable is a dummy variable (1= yes, 0=no) and
for the second stage of the model household food security status is a continuous variable
measured by the annual food expenditure per adult equivalent. Before discussing the
econometric results, some descriptive statistics are presented.
4.1 Descriptive Analysis
The descriptive analyses tools used are mean, percentage mean, mean difference and
standard deviation. The descriptive statistics was run to observe the distribution of the
independent variables. The socio-economic and institutional characteristics of the
respondents such as age, sex, level of education, farm experience, household size in adult
equivalent, cultivated land holding, soil fertility, livestock holding, access to extension
service, access to credit, distance to market, distance to farmer training center, and uses of
household heads are analyzed. Of the total sample respondents 60 were participants and 90
were non-adopters. These were 40 and 60 percents of the total sample, respectively. T-
statistics and chi-square (χ 2) tests were used whether they are statistically significant or not
using t-statistics and chi-square (χ 2) tests. The t-test is used to test the significance of the
mean value of continuous variables of the two groups of users and non-users and chi-square
(χ 2) is used to test the significance of the mean value of the potential discrete (dummy)
explanatory variables.
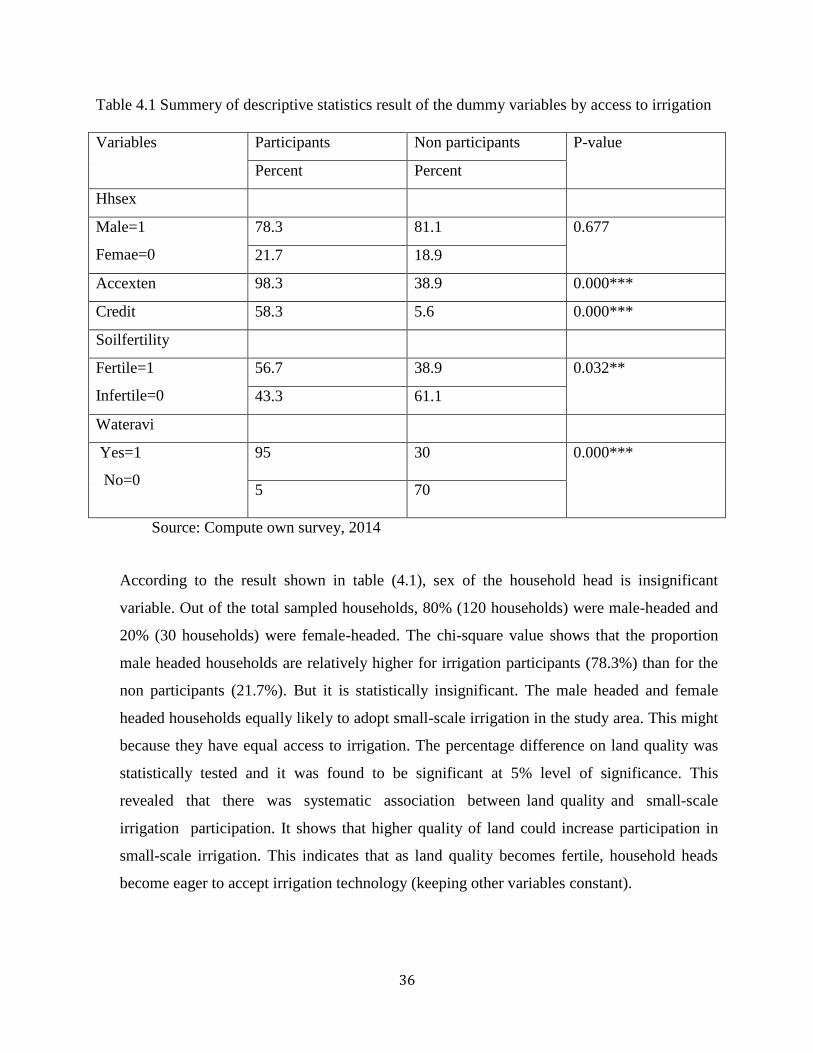
36
Table 4.1 Summery of descriptive statistics result of the dummy variables by access to irrigation
Variables Participants Non participants P-value
Percent Percent
Hhsex
Male=1
Femae=0
78.3 81.1 0.677
21.7 18.9
Accexten 98.3 38.9 0.000***
Credit 58.3 5.6 0.000***
Soilfertility
Fertile=1
Infertile=0
56.7 38.9 0.032**
43.3 61.1
Wateravi
Yes=1
No=0
95 30 0.000***
5 70
Source: Compute own survey, 2014
According to the result shown in table (4.1), sex of the household head is insignificant
variable. Out of the total sampled households, 80% (120 households) were male-headed and
20% (30 households) were female-headed. The chi-square value shows that the proportion
male headed households are relatively higher for irrigation participants (78.3%) than for the
non participants (21.7%). But it is statistically insignificant. The male headed and female
headed households equally likely to adopt small-scale irrigation in the study area. This might
because they have equal access to irrigation. The percentage difference on land quality was
statistically tested and it was found to be significant at 5% level of significance. This
revealed that there was systematic association between land quality and small-scale
irrigation participation. It shows that higher quality of land could increase participation in
small-scale irrigation. This indicates that as land quality becomes fertile, household heads
become eager to accept irrigation technology (keeping other variables constant).
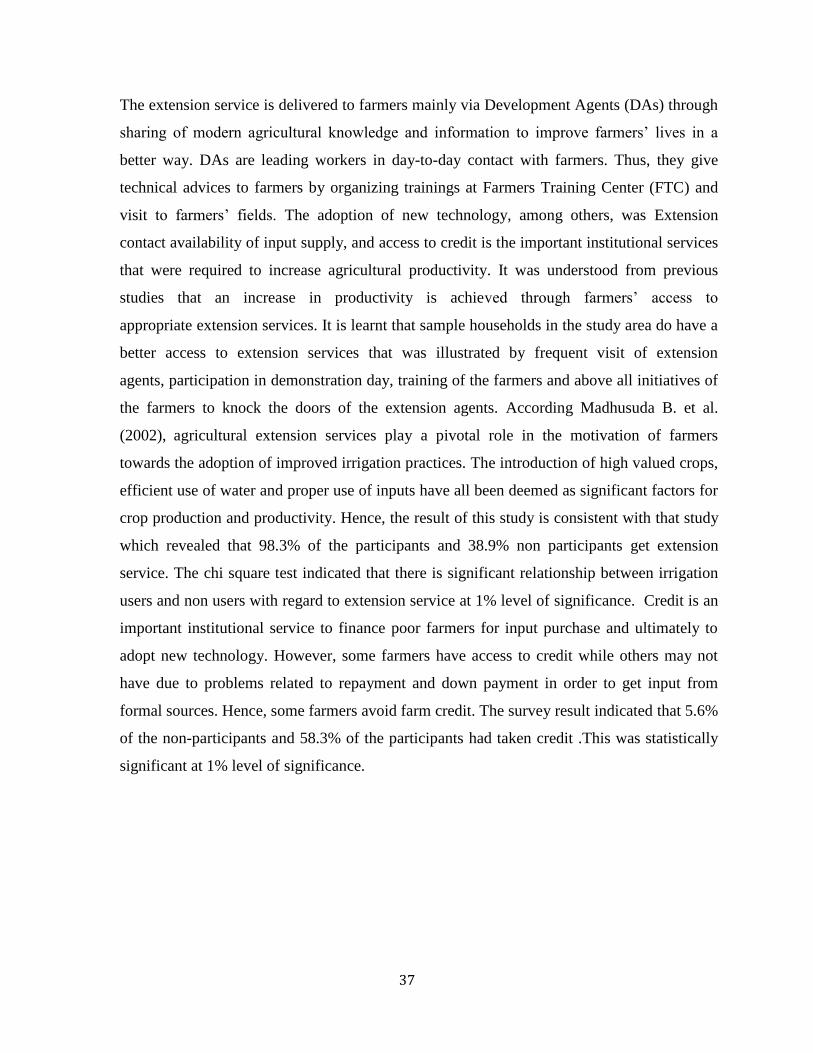
37
The extension service is delivered to farmers mainly via Development Agents (DAs) through
sharing of modern agricultural knowledge and information to improve farmers‟ lives in a
better way. DAs are leading workers in day-to-day contact with farmers. Thus, they give
technical advices to farmers by organizing trainings at Farmers Training Center (FTC) and
visit to farmers‟ fields. The adoption of new technology, among others, was Extension
contact availability of input supply, and access to credit is the important institutional services
that were required to increase agricultural productivity. It was understood from previous
studies that an increase in productivity is achieved through farmers‟ access to
appropriate extension services. It is learnt that sample households in the study area do have a
better access to extension services that was illustrated by frequent visit of extension
agents, participation in demonstration day, training of the farmers and above all initiatives of
the farmers to knock the doors of the extension agents. According Madhusuda B. et al.
(2002), agricultural extension services play a pivotal role in the motivation of farmers
towards the adoption of improved irrigation practices. The introduction of high valued crops,
efficient use of water and proper use of inputs have all been deemed as significant factors for
crop production and productivity. Hence, the result of this study is consistent with that study
which revealed that 98.3% of the participants and 38.9% non participants get extension
service. The chi square test indicated that there is significant relationship between irrigation
users and non users with regard to extension service at 1% level of significance. Credit is an
important institutional service to finance poor farmers for input purchase and ultimately to
adopt new technology. However, some farmers have access to credit while others may not
have due to problems related to repayment and down payment in order to get input from
formal sources. Hence, some farmers avoid farm credit. The survey result indicated that 5.6%
of the non-participants and 58.3% of the participants had taken credit .This was statistically
significant at 1% level of significance.
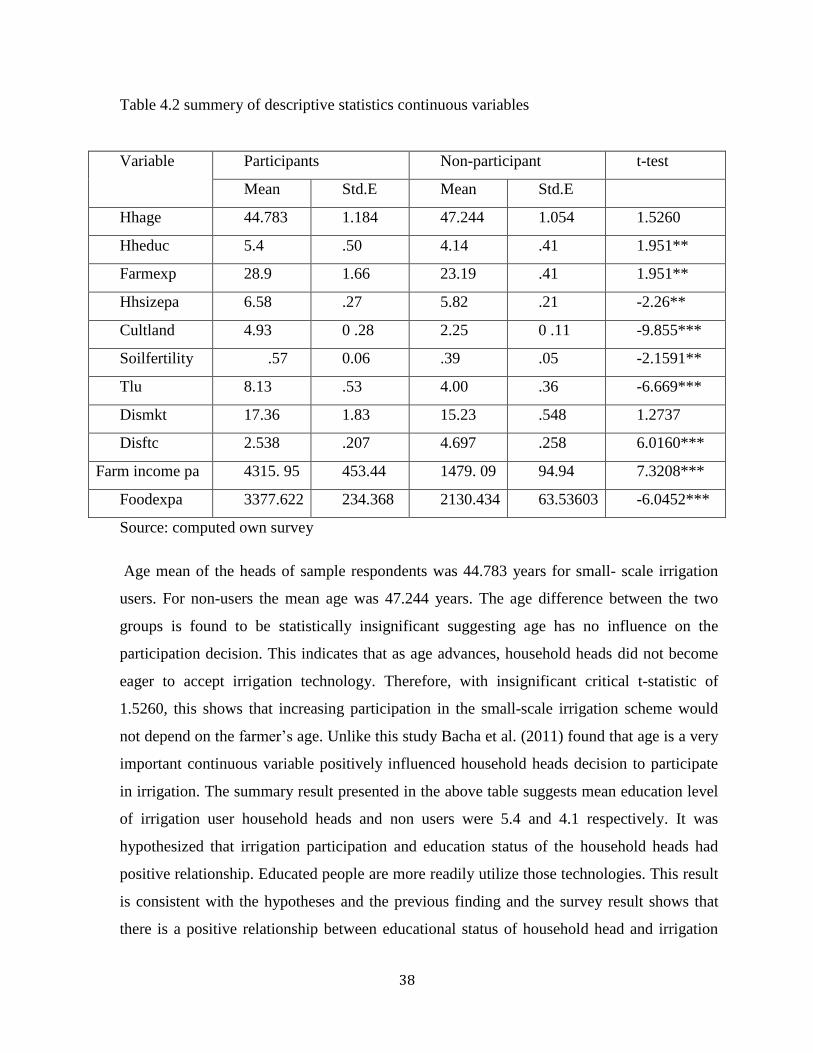
38
Table 4.2 summery of descriptive statistics continuous variables
Variable Participants Non-participant t-test
Mean Std.E Mean Std.E
Hhage 44.783 1.184 47.244 1.054 1.5260
Hheduc 5.4 .50 4.14 .41 1.951**
Farmexp 28.9 1.66 23.19 .41 1.951**
Hhsizepa 6.58 .27 5.82 .21 -2.26**
Cultland 4.93 0 .28 2.25 0 .11 -9.855***
Soilfertility .57 0.06 .39 .05 -2.1591**
Tlu 8.13 .53 4.00 .36 -6.669***
Dismkt 17.36 1.83 15.23 .548 1.2737
Disftc 2.538 .207 4.697 .258 6.0160***
Farm income pa 4315. 95 453.44 1479. 09 94.94 7.3208***
Foodexpa 3377.622 234.368 2130.434 63.53603 -6.0452***
Source: computed own survey
Age mean of the heads of sample respondents was 44.783 years for small- scale irrigation
users. For non-users the mean age was 47.244 years. The age difference between the two
groups is found to be statistically insignificant suggesting age has no influence on the
participation decision. This indicates that as age advances, household heads did not become
eager to accept irrigation technology. Therefore, with insignificant critical t-statistic of
1.5260, this shows that increasing participation in the small-scale irrigation scheme would
not depend on the farmer‟s age. Unlike this study Bacha et al. (2011) found that age is a very
important continuous variable positively influenced household heads decision to participate
in irrigation. The summary result presented in the above table suggests mean education level
of irrigation user household heads and non users were 5.4 and 4.1 respectively. It was
hypothesized that irrigation participation and education status of the household heads had
positive relationship. Educated people are more readily utilize those technologies. This result
is consistent with the hypotheses and the previous finding and the survey result shows that
there is a positive relationship between educational status of household head and irrigation
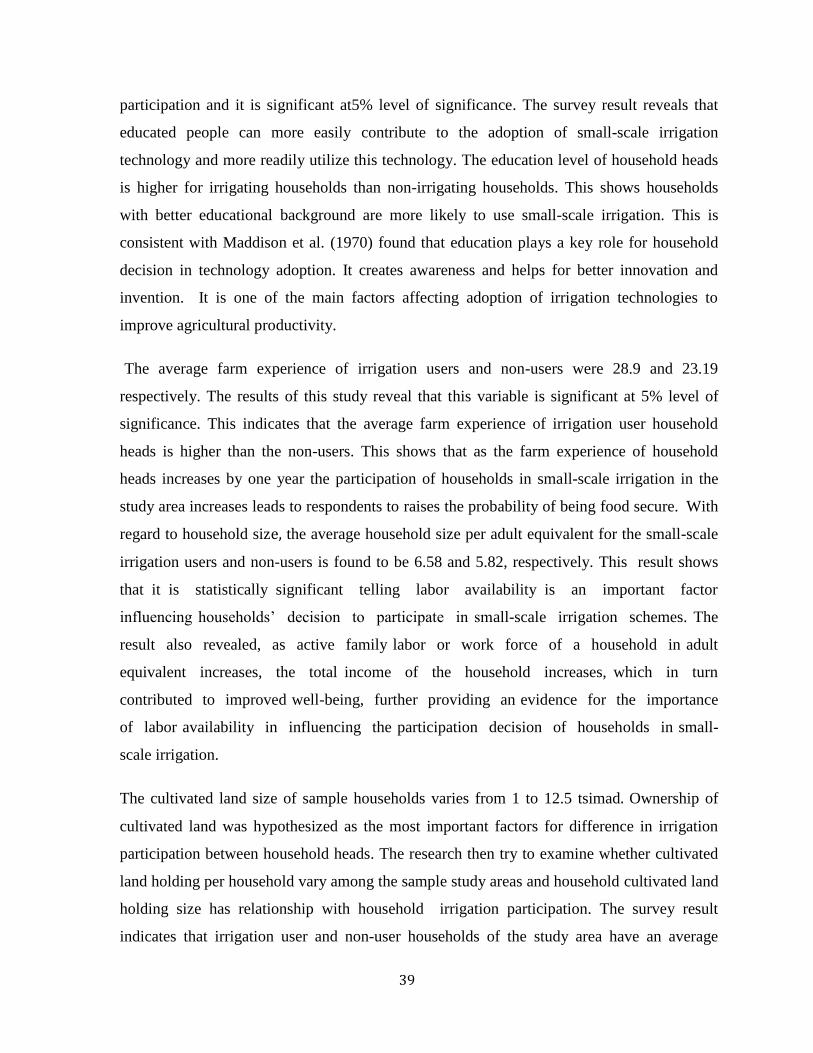
39
participation and it is significant at5% level of significance. The survey result reveals that
educated people can more easily contribute to the adoption of small-scale irrigation
technology and more readily utilize this technology. The education level of household heads
is higher for irrigating households than non-irrigating households. This shows households
with better educational background are more likely to use small-scale irrigation. This is
consistent with Maddison et al. (1970) found that education plays a key role for household
decision in technology adoption. It creates awareness and helps for better innovation and
invention. It is one of the main factors affecting adoption of irrigation technologies to
improve agricultural productivity.
The average farm experience of irrigation users and non-users were 28.9 and 23.19
respectively. The results of this study reveal that this variable is significant at 5% level of
significance. This indicates that the average farm experience of irrigation user household
heads is higher than the non-users. This shows that as the farm experience of household
heads increases by one year the participation of households in small-scale irrigation in the
study area increases leads to respondents to raises the probability of being food secure. With
regard to household size, the average household size per adult equivalent for the small-scale
irrigation users and non-users is found to be 6.58 and 5.82, respectively. This result shows
that it is statistically significant telling labor availability is an important factor
influencing households‟ decision to participate in small-scale irrigation schemes. The
result also revealed, as active family labor or work force of a household in adult
equivalent increases, the total income of the household increases, which in turn
contributed to improved well-being, further providing an evidence for the importance
of labor availability in influencing the participation decision of households in small-
scale irrigation.
The cultivated land size of sample households varies from 1 to 12.5 tsimad. Ownership of
cultivated land was hypothesized as the most important factors for difference in irrigation
participation between household heads. The research then try to examine whether cultivated
land holding per household vary among the sample study areas and household cultivated land
holding size has relationship with household irrigation participation. The survey result
indicates that irrigation user and non-user households of the study area have an average

40
cultivated land size of 4.93 and 2.25 (tsimad). This shows that land holding has an effect on
the participation decision-making behavior of farm households. This difference is statistically
significant at 1%. That is, irrigation users possess more land on average than non users.
Irrigation may generate income and allow accumulation of other productive assets by
irrigating households, which facilitate cultivation of additional land through share in and rent
in from non-irrigating households.
Livestock holding have an important role in rural economy. They are source of draught
power food, such as, milk and meat, cash, animal dung for organic fertilizer and fuel and
means of transport. Farm animals in the study area also serve as a measure of wealth in rural
area. The kinds of animals found in the study area were cattle, sheep, goats, donkeys,
honeybees and chicken. As described in (table 4.2), the survey result shows that, the average
numbers of livestock holding between the two groups of sample farmers differ. In
order to make comparison of the animal size between the farmer groups, the herd size was
converted into livestock units (TLU) based on Storck et al. (1991).The number of livestock
owned by a household in TLU is calculated by conversion factor for Tropical Livestock Unit
(TLU) indicated in the annex . The size of livestock in TLU owned by a household is
calculated by multiplying the number of each type of animal by an appropriate conversion
factor and then sum up. Farmland and animal resources are important in rural areas. They
are basis for technology adoption, household resource endowment and developmental
program intervention (Kuwornu et al. 2011). In the study area, the average livestock holding,
for irrigation users and non users were 8.13 and 4.00 respectively. The survey revealed that
there is a significant difference in livestock holding between irrigators and non-irrigators at a
(1%) significance level. This shows it is consistent with the above finding which is livestock
holding have positive effect on irrigation participation which leads households with higher
livestock holding will lead to higher probability of getting excess livestock for selling and
hence generating additional income, particularly the owner of more oxen lead to an ability of
ploughing more land on time, thereby achieving crop yields and earning higher income.
Farm animals have an important role in rural economy. They are source of draught power
food, such as, milk and meat, cash, animal dung for organic fertilizer and fuel and means of
transport.

41
Area with farmers training center access expected the greatest potential for agricultural
development. Therefore, distance to FTC is hypothesized to affect land agricultural
development negatively. The average distance of irrigation participants and non-participants
from their residence to FTC is 2.5and 4.7respectively. This variable is statistically significant
at 1% level of significance level. The mean difference between the two groups with regard to
distance from the farmers training center is statistically significant at 1% level of
significance. This shows the longer the distance from home to the farmer training
centers and/or development agent offices, the lower is the probability to use irrigation.
According to the result shown in table (4.2) the average annual farm income, both from cop
production and livestock rearing was significantly higher for users of the irrigation scheme in
the study area. The average farm income per adult equivalent of the irrigators and non
irrigators are ETB 4316 and 1479 respectively. This is the sum of average income from farm
production only.. This indicted that small -scale irrigation has statistically significant effect
on annual income. But this will be more appropriately tested using econometric analysis.
Irrigation is considered as one of the best technologies for ensuring household food security
and for sustainable rural development. Irrigation schemes can play a significant role in
improving household food security. The household food and total expenditure per adult
equivalent was discussed bellow.
The aim of this study was to examine the magnitude of change which had occurred in the
annual consumption expenditure by estimating the difference between irrigation participants
and non-participants. The result obtained from the survey indicates that the mean annual
consumption expenditure of irrigation users, ETB 3377, was significantly higher than the
non-users, ETB 2130. This revealed that small scale irrigation has statistically significant
effect on consumption expenditure. This significant difference in food consumption
expenditure generated by the two groups of households is mainly due to high income of
irrigators from increased agricultural production. This revealed that a household above the
minimum food consumption expenditure per adult equivalent is considered to be food secure
whereas a household below minimum food consumption expenditure per adult equivalent is
considered as food insecure which was calculated based on the estimated cost of acquiring
the recommended daily calorie allowance, which was taken as 2200 kcal per adult equivalent

42
per day. The nutritional requirements often used are the international standards set by
the World Health Organization (WHO) and the Food and Agricultural Organization (FAO).
This cut-off value is estimated to be Birr 1985 per adult equivalent per annum for 2010/2011.
Therefore, households having food consumption expenditure per adult equivalent of less than
Birr 1985 are considered as food insecure, while those more than Birr 1985 are considered to
be food secure. Based on this, the descriptive analysis indicates irrigators are better off in
terms of food security status (table 4.2). But it is difficult to conclude this difference is due to
access to irrigation because other observable and unobservable variables might have
contributed to food security status difference between irrigators and non-irrigators.
Therefore, Heckman two stage regressions were employed to determine the impact of small-
scale irrigation on rural household food security (holding other observable and unobservable
confounding factors constant).
4.2 Problems encountered in small-scale irrigation development
The significance of irrigated agriculture in the study area has increased. It has become a
major means food security. The survey result found that small-scale irrigation has a great
potential to improve the incomes of poor rural households accompanied with many problems.
The major problems associated with small-scale irrigation in the study area are problems
related to cost, lack of sufficient irrigation water, lack of effective marketing system, lack of
input supply and irrigation facilities, and presence of pests and diseases. The importance of
irrigated agriculture in the woreda has significantly increased. This study identified several
irrigation constraints using the small-scale irrigation participants in the study area.
Table(2) shows that shortage of financial for farm inputs is a major problem for 30% of the
irrigation user respondents while, incidence of pest and diseases, lack of sufficient irrigation
water, and lack effective market price system, of the treatment respondents were
20%,13.33%,13.33% and 23.23 respectively (table 4. 3).

43
Table 4.3 Main constraints of irrigation agriculture by irrigation participant‟s survey
Major problems of irrigation sector Irrigation participants
Obs. Percent
shortage of financial for farm inputs 18 30
incidence of pest, diseases, etc 12 20
lack of sufficient irrigation water 8 13.33
lack effective market price system 8 13.33
lack awareness about irrigation 14 23.23
Total 60 100
Source: Survey output 2014
4.3 Foster Greer Thorbecke (FGT) poverty indices result
The Foster Greer Thorbecke (FGT) poverty indices show that the small-scale irrigation
participants are better-off than non-participants. Using the poverty line of ETB 1985 in table
(4.4) indicates that poverty incidence was lower among irrigation participants compared to
non participants, with35.5% of non-participants in the study area classified as poor compared
to26.3% of irrigation participants.
The study area practices 31.6% levels of poverty as shown in (table 4.4) poverty incidence.
The depth and severity of poverty was higher among the non-irrigators than among irrigators.
The poverty gap index is 8.2% for non-irrigators and 3.1% for irrigators. This implies that the
current food consumption level of poor irrigation users and non-users would have to increase
by an average of 8.2 % and 3.1%, respectively, to lift them out of poverty. The squared
poverty gap index show that inequality among the poor is higher for non-irrigators than it is
for irrigators. The FGT poverty indices also indicate that although poverty is common for
both groups it is more marked among non-irrigators. The next section provides econometric
models that were used to examine the extent to which irrigation increases household
consumption, holding other factors constant.
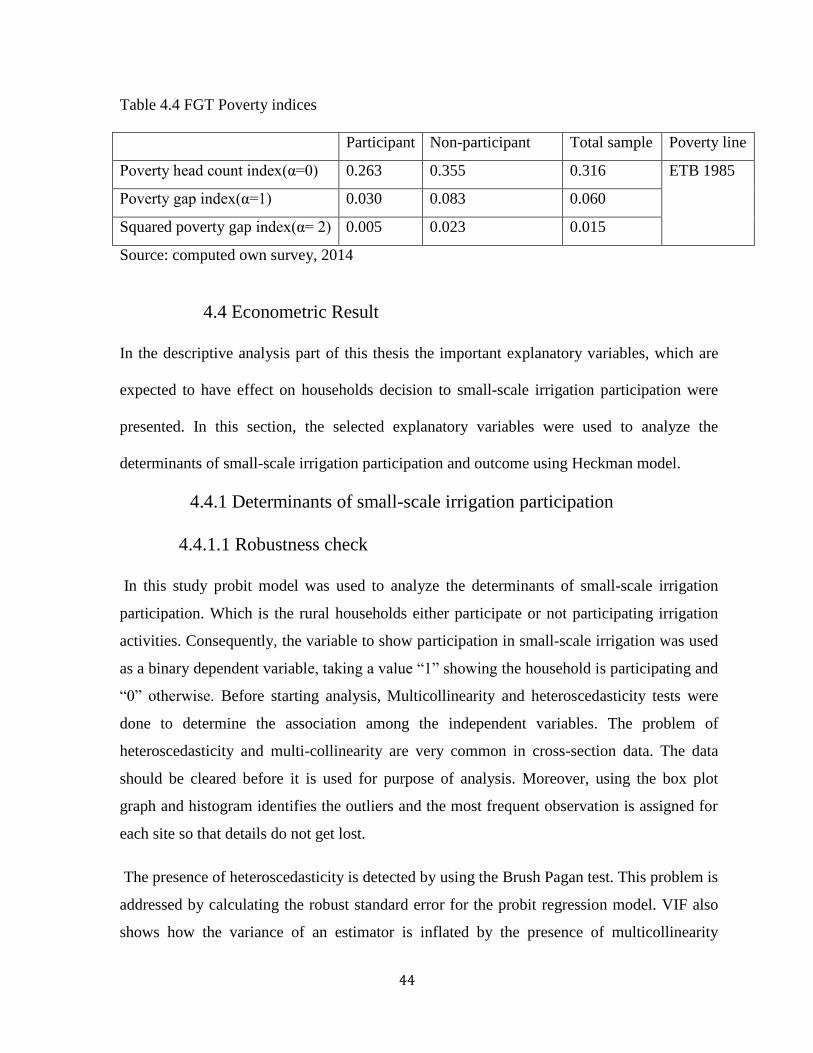
44
Table 4.4 FGT Poverty indices
Participant Non-participant Total sample Poverty line
Poverty head count index(α=0) 0.263 0.355 0.316 ETB 1985
Poverty gap index(α=1) 0.030 0.083 0.060
Squared poverty gap index(α= 2) 0.005 0.023 0.015
Source: computed own survey, 2014
4.4 Econometric Result
In the descriptive analysis part of this thesis the important explanatory variables, which are
expected to have effect on households decision to small-scale irrigation participation were
presented. In this section, the selected explanatory variables were used to analyze the
determinants of small-scale irrigation participation and outcome using Heckman model.
4.4.1 Determinants of small-scale irrigation participation
4.4.1.1 Robustness check
In this study probit model was used to analyze the determinants of small-scale irrigation
participation. Which is the rural households either participate or not participating irrigation
activities. Consequently, the variable to show participation in small-scale irrigation was used
as a binary dependent variable, taking a value “1” showing the household is participating and
“0” otherwise. Before starting analysis, Multicollinearity and heteroscedasticity tests were
done to determine the association among the independent variables. The problem of
heteroscedasticity and multi-collinearity are very common in cross-section data. The data
should be cleared before it is used for purpose of analysis. Moreover, using the box plot
graph and histogram identifies the outliers and the most frequent observation is assigned for
each site so that details do not get lost.
The presence of heteroscedasticity is detected by using the Brush Pagan test. This problem is
addressed by calculating the robust standard error for the probit regression model. VIF also
shows how the variance of an estimator is inflated by the presence of multicollinearity
45
(Gujarati, 2003). There are two types of measurement employed to test the existence of
multicollinearity. These are: Variance Inflation Factor (VIF) which shows how the variance
of an estimator is inflated by the presence of multicollinearity and contingency coefficients
for dummy variables. This indicates that how multicollinearity inflated the variance of an
estimator (Gujarati, 2003). As a rule of thumb, if the VIF of a variable exceeds 10, there is
multicollinearity. To avoid serious problems of multicollinearity, it is quite essential to omit
the variable with value 10 and greater than 10 from the model specification. Therefore, the
variance inflation factor (VIF) was employed to test the degree of multicollinearity among
the continuous variables. As shown in the annexed( 5 ), the values of the VIF for the
continuous variables were found to be small (i.e. VIF values less than 10), indicating the
data have no serious problem of multicollinearity. Similarly, the contingency coefficient,
which measures the association between various categorical variables based on the Chi
square, were computed in order to check the degree of association or the existence of
multicollinearity problem among the categorical explanatory variables. The decision rule
for contingency coefficients states that when its value approaches 1, there is a problem of
association between the dummy variables, i.e., the values of contingency coefficients
ranges between 0 and 1, with zero indicating no association between the variables and
values close to 1, indicating a high degree of association.
Based on the above conditions, the result of the multicolinearity for both participation
equation and outcome equation shows that the values of the VIF for the continuous variables
were found to be small (i.e. VIF values less than 10), indicating the data have no serious
problem of multicollinearity. Similarly, there was no problem of association among the
dummy variables. Therefore, after checking of it, model analysis was conducted.
Because of the various encouragements from the government, the number of farmers in the
study area who are participating in small-scale irrigation has increased. However, still there
are several farmers who don‟t participate in irrigation. For example, some farmers who
have irrigated land don‟t participate in irrigation where as some farmers with no irrigated
land participate in irrigation in the study area. This implies that irrigation decision is not an
easy and is made within a wider context. In this sub section, we treat results concerning food
consumption expenditure at household level as well as the socio economic, demographic and
46
other factors that affect the food expenditure behavior of households‟ .This study identified
the potential factors that motivate farmers to practice irrigation farming using the
participation probit model.
4.4.1.2 Heckman selection model
The first stage of the Heckman model (Heckman selection model) predicts the probability of
the irrigation participation of a household. The results from the estimation presented in the
table below show that the observable hypothesized variables, such as household head sex,
household head education level, cultivated land, distance to farmers training center(FTC),
access to extension service, access to credit and water availability are significantly influenced
the probability of participating in small-scale irrigation. Except distance to FTC, the positive
sign of the coefficients indicate that the explanatory variables estimated influence the
dependent variable positively. However, distance to FTC influences the dependent variable
negatively. The level of significance varies from one independent variable to the other. In
testing of the hypothesis H0: b=0 against the alternative H1: b is different from zero; sex,
education level and credit are significant at 10% significant level. Cultivated land, distance to
FTC and access to extension services are significant at 5% level of significant level and sex,
education and credit are significant at 10% significance level. But irrigation water
availability of the household head is significant at 1% significant level. In what follows, the
effect of the explanatory variables on small-scale irrigation participation of the household in
the study area is discussed below. The results from the estimation of the factors affecting
adoption of small-scale irrigation are presented in (table 4.5). Many of the explanatory
variables have the expected sign all statistically significant variables show the expected sign
for impact on irrigation adoption. The result in table 3 indicates that, jointly, all estimated
coefficients are statistically significant since the LR statistic has a p-value less than 1%. The
pseudo R2 value is 81.7%, which is high for cross-sectional data.
Another measure of goodness of fit of the model is based on a scheme that classifies
the predicted value of events as one of the estimated probability of an event is equal or
greater than 0.5 and 0 otherwise. From all sample farmers, 95 were correctly predicted in to
irrigation participants and non-participants categories by the model. The correctly predicted
participants (sensitivity) and correctly predicted non-participants (specificity) of the

47
model were 93.3%nd 96.7% respectively. Thus, the model predicts both groups accurately.
The link test command performs a model specification link test for single-equation models
was also conducted to check if a regression is properly specified. Hence, _ hatsq is
insignificant this is to say the model is correctly specified (table 4.5).
Table4.5 Estimation result of the Binary Probit model and it‟s Marginal Effect (participation
equation)
Variable Coefficient Z P>|Z| Marginal effect
Constant -6.918** -2.18 0.030 -6.918*
Hhsex 1.344* 1.72 0.085 .415*
Hhage -.046 -0.93 0.353 -.014
Hheduc .181* 1.65 0.099 .056*
Hhsizepa .093 0.56 0.577 .029
Farmexp .043 0.90 0.368 .013
Cultland .688** 2.28 0.023 .213**
Soilfertilitiy .052 0.09 0.927 .016
Tlu -.016 -0.23 0.816 -.005
Dismkt .047 1.07 0.286 .014
Disftc -.291** -2.02 0.043 -.090**
Accexten 2.027** 2.06 0.039 .493**
Credit 1.567* 1.68 0.093 .539*
Wateravai 1.867*** 2.90 0.004 .503**
Dependent variable Irrigation participation
Weighting variable One
Number of Observations 150
Likelihood function 164.98
Degree of freedom 13
Significance level(Prob > chi2) 0.0000
Pseudo R2 .817
Correctly predicted participant 93.33%
Correctly predicted non-participant 96.67%

48
Over all cases correctly predicted 95.33%
_hatsq 0.447
Level of significance Sign
At 10 percent *
At 5 percent **
At 1 percent ***
Source: Model output, 2014
Household head sex: among the demographic variables, household head sex appeared to be
significant in determining household‟s participation in small-scale irrigation schemes in the
study area. This variable is significant at 10% significance level and positively associated
with the adoption of small-scale irrigation. It is interesting to note that within the sample,
holding all other factors constant, male headed households are found more likely to adopt
small-scale irrigation than their female counterparts. This result is consistent with the
hypothesis that small-scale irrigation is attractive to male headed households. This shows that
those farmers with male are more likely to participate in irrigation technology (controlling
other variables table (4.5). Like this study the study by Dillon (2011) found that gender of the
head is a variable that statistically and significantly explaining the participation in irrigated
agriculture.
Household head education level: This variable is significant at 10% level of significance
level and it has positive association with irrigation participation. The relationship between
household head education level and participation in small-scale irrigation program shows that
1 extra year of education raises the probability of being in small-scale irrigation participation
by 5.6 percentage points (holding other influencing variables constant) .This variable as
hypothesized affects the household‟s participation decision in irrigation in such a way those
households who educated better chance to adopt small-scale irrigation. The same result the
study by Asayehegn et al. (2011) found that education plays a key role in household decision
for technology adoption.
49
Cultivated land size: This variable is significant at 5% level significance and has a positive
relationship with irrigation participation. The result shows as the size of cultivated area
increases by one tsimad, the probability of being an irrigator increases. That is cultivated land
size motivates households to adopt irrigation. The implication is that the probabilities of
being irrigator increases with farm size (controlling other variables constant).
Distance to farmers training center: The model result shows that the coefficient of this
variable has positive relationship with irrigation participation and it is statistically significant
at 1% significance level. This indicates that households nearer to the farmers training center
are more likely to participate in small-scale irrigation in the study area. This is consistent
with Moll (2004, found that the farmer training center is a source of information for the tabia
resident. There are development agents in the tabias who teach the local communities
about the application of the new technologies. The longer the distance from home to
the farmer training centers and/or development agent offices, the lower is the
probability to start and use irrigation.
Access to extension service: The model result reveals that this variable has a significant (at
5% level) and positive influence on the small-scale irrigation in the study area. The possible
explanation is that those farmers who have access to extension service are more likely to
adopt small-scale irrigation than who have not access to extension services (holding other
variables constant). This may due to irrigation participants who get technical advice and
training or those are well aware of the advantage of agricultural technologies and adopt new
technologies. This result is consistent with findings by Gebregziabher et al. (2009).
Access to credit: As indicated in the table there is systematic association between irrigation
participation and credit access. This variable is significant at 10% level of significance
and positively associated with the adoption of small-scale irrigation. The positive
relationship could be because those households who have access to credit have a better
possibility of getting farm inputs. Credit helps farmers purchase inputs such as seeds,
fertilizers. Therefore the probability of participation in small-scale irrigation increases. The
regression results shows that in the study area household decision to participate in small-
scale irrigation is more significantly affected by the volume of credit received. Respondents
50
who have credit access are more likely to adopt small-scale irrigation technology than
respondents who have not the access (holding other influencing variables constant Variables
constant).
Water availability: The model measures the relation between this variable and small-scale
irrigation participation. This variable positively influenced the irrigation participation of the
households. The results suggest that having an irrigation water supply on the household
farm improves the irrigation participation at 1% level of significance level. This can be
justified by the fact that getting irrigation water supply, farmers will improve irrigation
participation of the rural households in the study area. Especially, smallholders can enable to
grow food crops a minimum of twice a year, hence increased consumable food source of the
household. So, it overcomes insufficiency of food availability mainly in drought or food
shortage circumstance at large. Source: Compute own survey, 2014
4.2.2 Heckman Outcome model
4.4.2.1 Determinants of household food consumption expenditure
To examine the impact of small-scale irrigation on rural household food security further
analysis was done using heckman two step model. The second stage of Heckman's
procedure also referred to as the outcome equation uses Ordinary Least Square (OLS)
for analyzing the determinants of households‟ food consumption expenditure. The likelihood
function of the Heckman model two-step was significant indicating a strong explanatory
power and the coefficient of the Inverse Mills Ratio (IMR) was insignificant providing
indication of the absence of self-selection leading to use the Heckman‟s two-step procedure.
In practice both income and expenditure are used to measure the impact of small-scale
irrigation on household food security. However, in developing countries the use of
expenditure is considered more appropriate than using income due to the fact that households
are more likely to under report their income than their consumption (Ravalion,
1998).Therefore, food consumption expenditure data was used to determine the impact of
small-scale irrigation on rural household food security.

51
Depending on economic theories and data availability, the variables believed to influence the
food consumption expenditure of the farming households have been included. To avoid
identification problem that could arise during estimation, the variable distance from the
households‟ residence to the farmers training center and irrigation water availability have
been excluded from the outcome equation and used only in the selection equation. An
assumption required to guarantee reliable estimates of the outcome equation is the existence
of at least one additional explanatory variable with a non-zero coefficient in the selection
equation which has no direct effect on the outcome (Heckman and Vytlacil, 2005). Including
the same number of variables in the selection and outcome equations would lead to the
multicollinearity problem in the outcome equation which results in very imprecise estimates
(Sartori, 2003). Therefore, participation equation included two variables more than the food
consumption expenditure equation for model identification purposes.
The correlation of this variable with other variables in the income equation is tested and the
test result revealed that this variable doesn‟t have correlation with any one variable in the
income equation. However, it doesn't mean that the variables included are exhaustive.
Hence, out of the 12 explanatory variables 8 variables are found to be significant. These
determinant factors of food consumption expenditure are household size per adult equivalent,
cultivated land size holding, soil fertility, livestock holding, distance to market, access to
credit, and access to extension service.

52
Table4.6 Estimation Result of the Heckman Outcome Equation (food expenditure equation)
Variable Coefficient T P-value
Constant 862.428 1.09 0.276
Hhsex 190.448 1.06 0.292
Hhage -6.416 -0.65 0.518
Hheduc 65.613 1.63 0.106
Farmexp -3.891 -0.46 0.649
Hsizepa -206.584*** -4.48 0.000
Cltland 225.737** 2.47 0.015
Soilfertil~y 259.925* 1.93 0.056
Tlu1 154.197*** 5.17 0.000
Credit 372.415 1.40 0.164
Dismkt 52.685*** 2.65 0.009
Ecexten 396.236* 1.94 0.055
Invmills -97.756 -0.26 0.792
Dependent variable Food expenditure per adult equivalent per annum
Selection rule is Participant=1
Number of observation 150
F( 12, 137) 17.34
Prob > F 0.0000
R-squared 0.7120
Root MSE 853.33
Source: model output 2014
Level of significance Sign
At 10 percent *
At 5 prcent **
At 1 percent ***
Source: Model output, 2014
According to the summarized model results shown in the above table possible explanation
for each significant independent variable is given as follows. As indicated in the above table
R2
value of 0.714 points to the fact that at least 71.4% of the variation in outcome is
explained by the variation of the independent variables. Thus, approximately 71.4% of the
changes experienced in food expenditure are explained by the variation of the household size
per adult equivalent, cultivated land size, soil fertility, livestock holding (tlu), distance to
market, access to extension services and access to credit of each household head involved in
this study. The closer Adjusted R2is to 1, the better is the fit of the estimated regression line.

53
In testing the hypothesis that H0: b1, b2,b3,b4,b5,b6 …=0, against the alternate hypothesis
H1: b1, b2, b3, b4, b5, b6 is different from zero, the F statistics was employed. The
F value obtained from the model result is significantly different from the critical value of
F at 12 and 137 degrees of freedom respectively, at significance 1% level. This can, thus,
entail that the explanatory variables included in the model jointly influenced
household food security. The model output revealed that the null hypothesis is rejected.
Inverse Mills ratio (lambda): As indicated in the above model output table, the inverse
Mills ratio term is insignificant indicating the absence of selectivity bias. The negative sign
shows that the error terms in the participation and outcome equations are negatively
correlated. This suggests that those unobserved factors that make the household participate in
small-scale irrigation are likely to be negatively associated with household food consumption
expenditure.
Family size of the household: The Heckman output result for the variable household size
per adult equivalent shows that food expenditure per adult equivalent have negative
relationship with household size per adult equivalent and significant at 1% level of test. The
coefficient of the variable indicates that as the household size increases by one adult
equivalent the food consumption expenditure of the household decreases by ETB 206.6
(other things remaining constant). It is probably due to an increase in household size decrease
cultivated land per capita and in return decreases the availability of enough food for a
household. This result is consistent with the finding of Yilma (2005).
Cultivated land size: In this study it was expected that a larger size of cultivated land will
have more chance of being food secure at household level. The regression result also
shows that as the cultivated land size increases, a household is able to increase and diversify
the quantity and type of crop produced, which may in turn lead to increased consumption and
household food security. The coefficient of the land size variable is significant at 5% level of
significant and positively influenced the food consumption expenditure per adult. The result
shows that as the household get one more tsimad of land, food consumption expenditure per
adult per annum increases by ETB 225.7 (keeping other variables constant). This result is
consistent with findings Abebaw (2003).
54
Soil fertility (soilfertility): The quality of land owned by a farmer in this study indicates that
it has a positive relationship with food security status. That is households with fertile land are
food secure than households with infertile land. Soil fertility variable has a positive influence
on food security at 10% significance level. The result of the analysis shows that as the land
quality of the farmers becomes fertile the consumption expenditure per adult equivalent
increases by ETB 259.9 (holding other variables constant).
Livestock holding (tlu): Livestock holding is among the most important factors of
production and as it was expected it determine household food security status of the study
area. It is the fact that an ox is the only input of draft power for land preparation in their crop
farming system. Hence, it has significant contribution in supplying of food grain for the
household members. The regression result shows this variable is significant at 1%
significance level. The positive effect of livestock holding indicates that in the study area,
those who have more livestock thereby improving the food consumption expenditure leads
households food secure. The study result revealed that, a unit TLU increase in livestock
holding would increase on average the total food expenditure of a household by 154.2, while
keeping all other variables constant at their mean value. This means that as the ownership of
livestock of respondents increases by one unit the food consumption expenditure per adult
equivalent increases by ETB 154.2. That is the more the number of livestock available to
households the larger is the probability of being food secure. The positive sign of this
variable indicates that the contribution of livestock ownership towards ensuring food security
(holding other variables constant). This is consistent with Kebede(2011).
Distance to market (dismkt): This variable also found that it is statistically significant at 1%
significance level and positively influence to food consumption expenditure. This implies
that as the distance of the market increases by (1 km), the food consumption expenditure per
adult equivalent increases by Birr 52.8. The positive effect of distance to market may indicate
that in the study area, those households far from the market provide them to consume more
food than put on the market and thereby improving their food security (keeping all other
variables constant at their mean value).
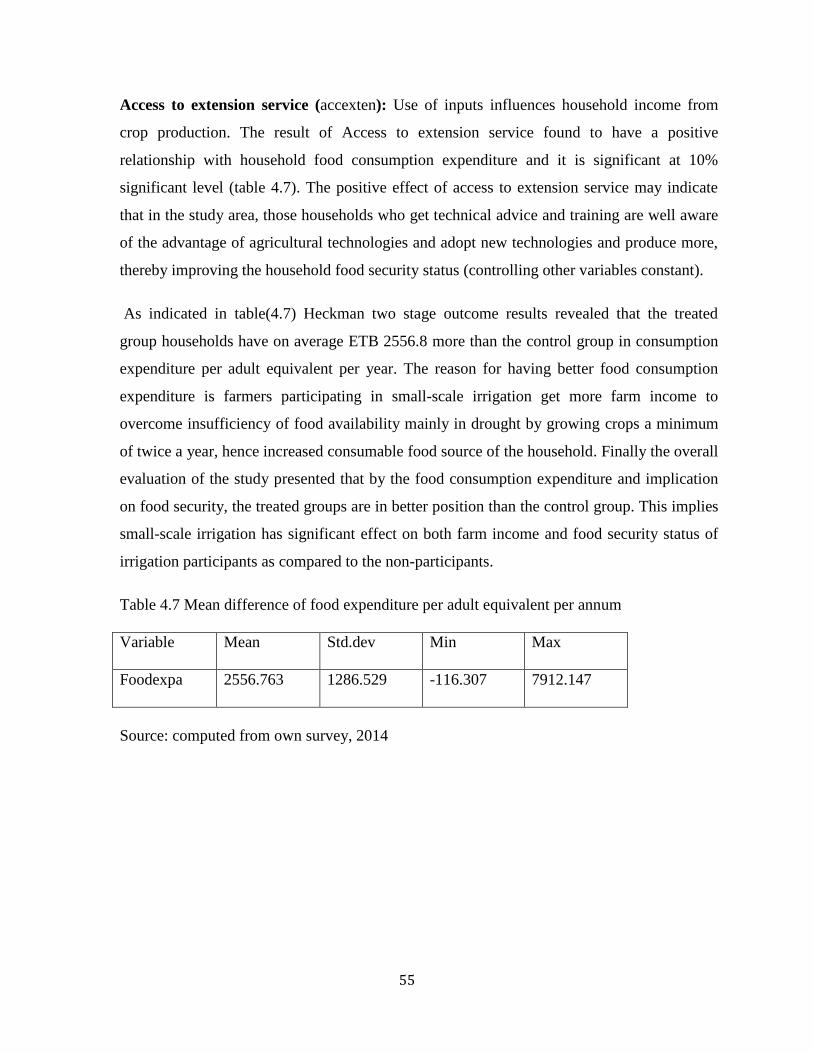
55
Access to extension service (accexten): Use of inputs influences household income from
crop production. The result of Access to extension service found to have a positive
relationship with household food consumption expenditure and it is significant at 10%
significant level (table 4.7). The positive effect of access to extension service may indicate
that in the study area, those households who get technical advice and training are well aware
of the advantage of agricultural technologies and adopt new technologies and produce more,
thereby improving the household food security status (controlling other variables constant).
As indicated in table(4.7) Heckman two stage outcome results revealed that the treated
group households have on average ETB 2556.8 more than the control group in consumption
expenditure per adult equivalent per year. The reason for having better food consumption
expenditure is farmers participating in small-scale irrigation get more farm income to
overcome insufficiency of food availability mainly in drought by growing crops a minimum
of twice a year, hence increased consumable food source of the household. Finally the overall
evaluation of the study presented that by the food consumption expenditure and implication
on food security, the treated groups are in better position than the control group. This implies
small-scale irrigation has significant effect on both farm income and food security status of
irrigation participants as compared to the non-participants.
Table 4.7 Mean difference of food expenditure per adult equivalent per annum
Variable Mean Std.dev Min Max
Foodexpa 2556.763 1286.529 -116.307 7912.147
Source: computed from own survey, 2014
56
Chapter 5: CONCLUSIONS AND RECOMMENDATIONS
The objective of this study was to assess the impact of small-scale irrigation on rural
household food security. The study was conducted in Emba Alaje Woreda of Southern Zone
of Tigray regional state, Ethiopia, focusing on small-scale irrigation.
5.1 Conclusions
The hypothesis of this study was small-scale irrigation scheme has a positive impact on
households‟ farm income and household food security using consumption expenditure as a
proxy. Hence, this study investigates that the main factors that explains rural households to
participate in small-scale irrigation using participation probit model. The finding of the study
describes sex, education level, cultivated land holding, access to credit, access to extension
service, distance to farmers training center and irrigation water availability of the household
heads are the major factors that significantly influence the probability of rural households to
participate in small-scale irrigation. These all variables were positively influenced the
irrigation participation of the household heads in the study area. For instance, the positive
relationship access to credit and access to extension service with small-scale irrigation
participation explained by the fact that the institutional credits and extension services gives
an opportunity to households to participate in small-scale irrigation. The mean cultivated
land size of small-scale irrigation users and non-users was 4.93 and 2.25 (tsimad)
respectively. This indicates that more access of cultivated land to irrigation user households
enables them to participate in small-scale irrigation and generate more farm income than
non-user. In the same way the average education level irrigation users and non-users was 5.4
and 4.14(years) respectively. This show that one extra year of schooling to irrigation
participants allows them to participate in small-scale irrigation schemes than non-
participants.
The study also estimated the impact of the small scale irrigation on rural household annual
income and food security status. The result of descriptive statistics shows that the annual
farm income and food consumption expenditure per adult equivalent of the irrigation
participants in 2012/2013 were respectively 48.9% and 36.4% higher than that of the non-

57
participants. The FGT result indicates that the poverty incidence was higher among irrigation
participants compared to non participants, with35.5% of non-participants in the study area
classified as poor compared to26.3% of irrigation participants. The study area practices
31.6% levels of poverty as shown in (table 4.4) poverty incidence. The depth and severity of
poverty was higher among the non-irrigators than among irrigators. The poverty gap index is
8.2% for non-irrigators and 3.1% for irrigators. This implies that the current food
consumption level of poor irrigation users and non-users would have to increase by an
average of 8.2 % and 3.1%, respectively, to lift them out of poverty. The squared poverty gap
index show that inequality among the poor is higher for non-irrigators than it is for irrigators.
The FGT poverty indices also indicate that although poverty is common for both groups it is
more marked among non-irrigators. The next section provides econometric models that were
used to examine the extent to which irrigation increases household consumption, holding
other factors constant
According to the Heckman two steps, household size per adult equivalent, cultivated land
holding, soil fertility, livestock holding, and distance to market, access and access to
extension service are the determinants of food consumption expenditure status of the
household heads.
Finally the result of this study indicates that small-scale irrigation development has a positive
impact on food security status of rural households. The food security analysis indicates that a
much higher proportion of those who are poor are non-irrigating rather than irrigating
households. Thus, the food insecurity occurrence in non-irrigating households is greater than
in irrigating households. This suggests that small-scale irrigation has an important influence
on rural household food security. This analysis shows that use of small-scale irrigation
reduces the probability of a household being poor, controlling other factors.
5.2 Recommendations
In the study area still there are many rural households which are not participating in small-
scale irrigation. This is because of lack of irrigation water availability, lack of education, lack
credit access, lack of extension services and other awareness enhancing systems. Based on
the findings of this study the following general recommendations are given:
58
Organize capacity-building activities to advance the farmers‟ participation in
small-scale irrigation to upgrade their existing indigenous way of management
system.
Expanding the capacity of small-scale irrigation agriculture and creating
additional access through integrated water investment is important to increase
agricultural product and hence leads to increase household‟s food security.
Traditional river diversion should convert in two modern river diversions in
order to reduce water loss in the earth canals and hence increasing irrigation
participants in the study area.
Credit systems in rural areas should be in place for input supplies and low cost
technologies acquirement, which are directly applied to the farm. It is necessary
to provide farmers with inputs for the first season, so that they can build a cash
flow base and start producing their own seed.
Training in water management, marketing and general crop production is
important for new and old irrigation schemes.
Encouraging female headed households to participate in small-scale irrigation
using special trainings, credit access and extension services. Because in this
result found that male headed households are more likely to participate in small-
scale irrigation than female headed households.
Expansion and promotion of family planning programs since household size
affect negatively their food security situation.
59
REFERENCES
Abadie, A., 2003.Semi-parametric instrumental variable estimation of treatment response
models. Journal of Econometrics, 113:231-263.
Abebaw, Shimeles. 2003. Dimensions and determinants of food security among rural
households in Dire Dawa, Eastern Ethiopia. An MSc Thesis Presented to the School of
Graduate Studies of Alemaya University. 152p.
Aldrich, J.,and F.D. Nelson1984. Linear Probability, Logit and Probit Models: Quantitative
applications in the Social Science: Sera Miller McCun Sage pub Inc., University
of Minnesota & Iowa.
Aliber,M. & Hart, T.G.B., 2009. Should subsistence agriculture be supported as a strategy to
address rural food insecurity?Agrekon Vol. 48:4.
Altman,T. G. B., & Jacobs P. T.2009.Household food security status in South Africa. Agrekon
Vol. 48:4
Asayehegn, K., Yirga, C. and Rajan, S. (2011). Effect of Small-Scale Irrigation on the Income
of Rural Farm Households: The Case of Laelay Maichew District, Central Tigray,
Ethiopia Journal of Stored Products and Postharvest.
Assefa Admassie and Franz Heidhues.(1996).Estimation of Technical Efficiency of Smallholder
Farmers in the Central Highlands of Ethiopia. Ethiopian J.of Agr. Econ., 1(1), 18-37
Awulachew, S., Yilma, A., Loulseged, M., Loiskandl, W., Ayana, M. and Alamirew, T.
(2007).Water Resources and Irrigation Development in Ethiopia. International Water
Management Institute, Working Paper 123, Ethiopia.
Awulachew, S. B.; Yilma, A. D.; Loulseged, M.; Loiskandl, W.; Ayana, M.; Alamirew, T.
2007b. Water Resources and Irrigation Development in Ethiopia.Colombo, Sri Lanka:
International Water Management Institute. 66p. IWM (2004).In M. Shiferaw, K. Feleke,
L. Richard, H. Christina, & Gladwin, Determinants of Food Security in Southern
Ethiopia at household level. Florida: Food and Resource Economics Department, Institute
of Food and Agricultural Sciences, University of Florida.
Awulachew, Seleshi Bekele; Lambisso, R.; Asfaw, G.; Yilma, A. D.; Moges, S. A.
2010.Characterizing, assessment of performance and causes of underperformance of
irrigation in Ethiopia. Ethiopian Journal of Development Research, (In press)
Awulachew,B. 2005. Experiences and opportunities for promoting small scale micro irrigation
and rain water harvesting for food security in Ethiopia. Working paper 98.IWMI
(International Water Management) Adiis Ababa, Ethiopia.
60
Bacha, D., Namara, R.,Bogale, A. and Tesfaye, A. (2011). Impact of Small-Scale Irrigation on
Household Poverty: Empirical Evidence from the Ambo District in Ethiopia, Journal of
Irrigation and Drainage, Vol. 60, PP. 1-10.
Bacha, D., Namara, R.,Bogale, A. and Tesfaye, A. (2011). Impact of Small-Scale Irrigation on
Household Poverty: Empirical Evidence from the Ambo District in Ethiopia, Journal of
Irrigation and Drainage, Vol. 60, PP. 1-10
Becker, O.S. & Ichino, A. (2002).Estimation of average treatment effects based on propensity
scores. The Stata Journal, 2(4), 358-377.
Belay Kassa, 1998, "Structural problem of Peasant Agriculture in Ethiopia": Research Report,
Alemaya University, Ethiopia.
Berhane, H. The case of household level irrigation development in two communities of Kilte
Awlaelo woreda, Tigray regional state, Ethiopia.
Bhattarai M, Sakthivadivel R, Hussein I (2002). Irrigation impacts on income inequality and
poverty alleviation: Policy issues and options for improved management of irrigation
systems. Colombo, Sri Lanka: International Water Management Institute (IWMI)
Working Paper No.39.
Bhattarai, M., Barker, R. and Narayanamoorthy, N. (2007).Who Benefits from Irrigation
Development in India Implication of Irrigation Multipliers for Irrigation Financing.
Irrigation and Drainage, Vol. 56, PP. 207-225.
BoARD(2006).Strategic plan for 2007-2010.Unpublished Document. Mekelle..
Bowers, D.1991. Statistics for economics and Business. ELBS with Macmillan. Hong Kong.
Cotula, L.et al.,009. Land Grab or Development Opportunity Agricultural Investment and
International Land deals in Africa
Burrow, C. (1987) Water Resources and Agricultural Development In The Topics: New York,
John Wiley And Sons
Chazovachii, B. (2012). The Impact of Small Scale Irrigation Schemes on Rural
Livelihoods: The Case of Panganai Irrigation Scheme Bikita District Zimbabwe. Journal
of Sustainable Development in Africa, Vol. 14 (4), PP. 217-231
Chenje, M., Solar, C., Manzungu, E(1998) The State of the Environment in Zimbabwe, Harare,
MMET. Kadzombe, E.D. and Manzungu, E.(1973) Land and Peoples of Central
Africa.Harlow. Longman.
CIA World Fact book (2013).
http://www.photius.com/rankings/economy/population_below_poverty_line_2013_0.html
61
CSA (2012).Agricultural Sample Survey for Strategic Planning: Annual Report Federal
Democratic Republic of Ethiopia Central Statistical Authority of Ethiopia: Annual
Report, Addis Ababa, Ethiopia. http://www.csa.gov.et
CSA (Central Statistics Agency). 2007. Summery and statistical report of 2007 population and
housing census of Ethiopia: Population size by age and sex [Internet][Cited 2011 Jan 18].
Available from: http://www.csa.gov.et.
CSA(Central Statistical Authority), 2001, Annual Report, Addis Ababa.
Degefa, T.(2006). Combining household qualitative data and quantitative data in food security
research Working paper on population and land use in central Ethiopia, no-5, 17p.
Demese, C. Getinet, G., Goshu, M., & Yaddesa, D.(2009).Comprehensive Africa Agriculture
Development Program Ethiopia Study. Addis Ababa.
Diederen, Paul, Hans van Meijl, Arjan Wolters, and Katarzyna Bijak. 2003. Innovation adoption
in agriculture: Innovators, early adopters and laggards. Cahiers
d‟Economie et Sociologie Rurales 67: 30-50.
Dillon, A. (2011). The Effect of Irrigation on Poverty Reduction, Asset Accumulation, and
Informal Insurance: Evidence from Northern Mali. World Development, Vol. 39 (12),
PP.2165–2175
Dillon. A.(2008). Access to Irrigation and the Escape from Poverty Evidence from
Northern Mali, IFPRI Discussion Paper 00782, United States of America.
Dupriez H, De Leener. 2002. Land use and life: Ways of water, Run off, irrigation and drainage;
Tropical Handbook. Publisher: CTA and TERRES ET VTE, Netherlands; ISBN: 2-
87105-011-2.
Epherm, F.(2008). The link between food security and land degradation: Analysis of
determinants in drought prone area of north east Ethiopia: A case of Sekota Woreda. A
master thesis presented to the school of graduate studies of AUA.
Eshetu, S., Belete, B., Goshu, D., Kassa, B., Tamiru, D., Worku, E., Lema, Z., Delelegn,A.,
Tucker, J. and Abebe, Z. (2010). Income Diversification through Improved
Irrigation in Ethiopia: Impacts, Constraints and rospects for Poverty Reduction.
Evidence from East Harerghe Zone, Oromia Region, Ethiopia. Overseas Development
Institute, Research Inspired Policy and Practice Learning in Ethiopia and the Nile Region
(Ripple), Working Paper 14, Ethiopia.
FAO (1996a) Agriculture and Food Security World Food Summit, November, 1996, Rome.
FAO (Food and Agricultural Organization), 2003.Irrigation in Africa South of the Sahara.FAO
Investment Center Technical Paper 5.FAO: Rome.

62
FAO (Food and Agriculture Organization of the United Nations) (2011).The State of Food
Insecurity in the World: How Does International Price Volatility Affect Domestic
Economies a Food Security? ISBN 978-92-5-106927-1, FAO, Rome. http://www.fao.org.
FAO/WFP (2010) Special report: Crop and Food Supply assessment mission to Ethiopia. Rome.
Feder, G.,Just, R.E. and Zilberman,O.1985. "Adoption of Agricultural Innovations in
Developing Countries: A Survey." Economic Development and Cultural Change,32(2),
255-98.
Feder, Gershon, Richard E. Just, and David Zilberman. 1985. Adoption of agricultural
innovations in developingcountries: A survey. Economic Development and Cultural
Change 33 (2): 255-98.
Foster J, General J and Thorbecke E (1984) A class of decomposable poverty measures.
Econometrical 52(3) 761-766.
Fuad, A. (2002). Small Scale Irrigation and Food Security: A case study for central Ethiopia.
Discussion papers no 4, Forum for Social Studies, Addis Ababa,55p.
G/Egziabher G.(2008) Risk and Irrigation Management in a Semi-Arid Economy. PhD Thesis,
Department of Economics and Resource Management –Norwegian University of
Life Sciences, Norway.
Gebregziabher G, Namara RE and Holden (2009) Poverty reduction with irrigation investment:
An empirical case study from Tigray, Ethiopia. Agric. Water Manage. 961837-1843
Gujarati, D.(2003).Essential of Econometrics, Second Edition. New york: McGraw Hill Inc.
Hasnip, J., Walmsely, N., & Smith, L. (2001). Contribution of Irrigation to Sustaining
Rural Livelihoods: Literature Review.UK: DFID.
Gujarati, D.N. 1988.Basic Econometrics. 2nd
Ed.McGraw Hill,Inc., New York.
Gujarati, D.N. 1995.Basic Econometrics. 3rd
Ed. McGraw-Hill Inc, New York
Hagos, F., Makombe, G., Namara, R. and Awulachew, S. (2009). Importance of Irrigated
Agriculture to the Ethiopian Economy: Capturing the Direct Net Benefits of
Irrigation, IWMI, Working Paper 128, ISSN 1026-0 Hagos, F., Makombe, G., Namara,
R. and Awulachew, S. (2009). Importance of Irrigated Agriculture to the Ethiopian
Economy: Capturing the Direct Net Benefits of Irrigation, IWMI, Working Paper
128, ISSN 1026-0862, Addis, Ethiopia.862, Addis, Ethiopia.
Haile T. 2008.Impact of irrigation development on poverty reduction in Northern Ethiopia
(dissertation), National University of Ireland, Cork.
HECKMAN JJ and VYTLACIL E (2005) Structural equations, treatment effects, and
econometric policy evaluation.Econometrical 73(3) 669-738

63
Heckman,J. J. (1998).The economic evaluation of social programs. In Heckman, J. & Leamer,
E., (eds.) Handbook of Econometrics, Vol. 5.
Hosmer, D.W., and Lemeshow, S. 1989. Applied Logistic Regression.A Wiley-Inter science
Publication, New York.
Huang, Q., Rozelle, S., Lohmar, B., Huang, J. and Wang, J. (2006). Irrigation, Agricultural
Performance and Poverty Reduction in China. Food Policy, Vol. 31, PP. 30–52
Hussain I, Hanjra MA. 2004. Irrigation and poverty alleviation: Review of the empirical
evidence, IWMI, Irrig. And Drain. 53: 1–15.
IFAD(International Fund for Agricultural Development).2005.Special country program phase II
(SCP II) interim evaluation report number 1643-ET. Ethiopia.
IFAD,2010.Rural
vertyReport2011.Overview.[online]Available:http://www.ifad.org/rpr2011/report/e/overv
iew.pdf [accessed 28 April 2011] UN, 2010. Sustainable Development Innovation.
[online]. Briefs issue-8, updated January 2010. Foreign land purchases for agriculture:
what impact on sustainable developmen[accessed 12 March 2011]
IFAD. Federal Democratic Republic of Ethiopia - Country strategic opportunities programme.”
International Fund for Agricultural Development (IFAD), 15-17 December, Rome, 2008.
Jacobs,P.(2009).Identifying targets of Food Insecurity in South Africa. Center for
Poverty,Employemnt and Growth, 1-45.
Kamara A, Van Koopen B, Magin L.,(2001). Economic viability of small-scale irrigation
systems in the context of state withdrawal: the Arabie Scheme in the Northern Province
of South Africa. 2nd
WARSFA/Water Net Symposium: Integrated Water Resources
Management: Theory, Practice, Cases; Cape Town, 30 – 31 October 2001. International
Water Management Institute (IWMI), Pretoria, South Africa.
Kebede, Getnet.2011. Linking small-scale irrigation and food security in North Wollo
Zone,ETHIOPIA. An MSc Thesis Presented to the School of Graduate Studies of Addis
Ababa University.100p.
Kraybill,David and Simeon DiGennaro, 2010. Livelihood impacts of the prosperity through
innovation project. MEDA report.
Kuwornu, J. and Owusu, E. (2012). Irrigation Access and Per Capita Consumption
Expenditure in Farm Households: Evidence from Ghana. Journal of Development
and Agricultural Economics, Vol. 4(3), PP. 78-92 Lio, T.F. 1994.Interpreting Probability
Models: logit, Probit and Other Generalized Models. Sage University Paper Series on
Qualitative Applications in the Social Sciences, 07-101. Thousand Oaks, CA: Sage,
California.
64
Maddala G.S, 1992.Introduction to Econometrics, 2 nd
ed., Prentice-Hall, Inc., New Jersey.
Mengistu Hulluka, 2000. Ethiopia: Agricultural sector development and the role of the
National Agricultural Extension Program; Centre for Applied Studies in
International Negotiation, The food chain in Sub-Saharan Africa, Geneva
Merry D.J., 1997.Expanding the Frontiers of Irrigation Management Research: Result of
Research and Development at the International Irrigation Management Institute, 1984 to
1995. Colombo, Sri Lanka.
MoARD(2007). Report on irrigation potential and existing irrigation schemes by region.Addis
Ababa Unpublished document.
MoARD(2011). Small-Scale irrigation situation analysis and capacity needs assessment. Addis
Ababa, Ethiopia
MoARD. Madhusudan Bhattarai, M., Sakthivadivel, R., and Hussain, I., (2002). Irrigation
Impacts on Income Inequality and Poverty Alleviation: Policy Issues and Options
for Improvement.
MoFED (Ministry of Finance and Economic Development) (2012). Performance and
Challenges on the Five Year Strategic Plan of Growth and Transformation: Annual
Report of MoFED, Addis Ababa, Ethiopia. http://www.mofed.gov.et.
MoFED(Ministry of Finance and Economic Development) (2012). Performance and
Challenges on the Five Year Strategic Plan of Growth and Transformation: Annual
Report of MoFED, Addis Ababa, Ethiopia. http://www.mofed.gov.et.
MoFED(Ministry of Finance and Economic Development) (2006) Ethiopia: Building on
Progress. A Plan for Accelerated and Sustained Development to End Poverty 2005/6 –
009/10. September 2006
MoFED(Ministry of Finance and Economic Development).2006.A Plan for Accelerated and
Sustained Development to End Povert (PASDEP).(2005/06-2009/10). Ethiopia.
MOFED.2010. Trends and prospects for meeting MDGs by 2015, millennium Development goal
report. [Internet].[Cited 2011 July 4]. Addis Ababa, Ethiopia. Available from:
http//www.dagethiopia.org.
Mollinga, P. (2000) Water for Food and Rural Development: Approaches and Initiatives in
South Asia. New Delhi: Sage Publications
MoWE (Ministry of Water and Energy) (2012). Water Resources Management and
Irrigation Policy: Annual Report of MOWE, Addis, Ethiopia. http://www.mowr.gov.e.
MoWE (Ministry of Water and Energy) (2013). Water Resources Management and Irrigation
Policy: Annual Report of MOWE, Addis, Ethiopia. http://www.mowr.gov.e.
65
Mutsvangwa T and Doranalli, K (2006) Agriculture and Sustainable Development, Netherlands,
The Hague University Press.
Norton, G., Alwang, J. and Masters, W. (2010). Economics of Agricultural Development
World Food Systems and Resource Use, 2ndEdition, ISBN 0-203-85275-3, 270
Madison Avenue, New York, NY 10016 Master E-Book ISBN
Nugusse,W. Huylenbroeck, G., and Buysse, J. (2013) Household Food Security through
Cooperatives in Northern Norton, G., Alwang, J. and Masters, W. (2010).
Economics of Agricultural Development World Food systems and Resource Use,
2ndEdition, ISBN 0-203-85275-3, 270 Madison Avenue, New York, NY 10016 Master
E-Book ISBN Ethiopia. International Journal of Cooperative Studies, Vol. 2(1), PP. 34-
44
Pindyck,Robert S.and Rubinfeld, Daniel L. 1981.Econometric Models and Economic
Forecasts.2 n d
Ed McGraw-Hill Book Co.New York.
Rosenbaum,P.R. & Rubin, D.B. (1983).The central role of propensity scores in observational
studies for causal effects. Biometrika, 70(1), 41-55.
SARTORI A (2003) An estimator for some binary-outcome selection models without exclusion
restrictions. Polit. Anal. 11 111-138.
Shimeles M., 2009. Impacts of productive safety netprogram on households assets protection.
The case of Habru and Ambasel districts in Amhara Region, Ethiopia. MSc
presented to the School of Graduate Studies (SGS) at Haramaya University,
Ethiopia.
Selesh, B., Merrey, A., Kamara, B., Koppen, F., P, d., & Boelee, E. (2005).Experiences and
Opportunities for promoting small scale/micro irrigation and rainwater harvesting for
food security in Ethiopia. Addis Ababa: IWRM.
Smith LED (2004). Assessment of the Contribution of Irrigation to Poverty Reduction and
Sustainable Livelihoods. Int. J. Water Resourc. Dev. 20(2):243-257.
Swaminathan,M.S.(1994) Population, Environment and Food Security Issues in Agriculture,
No.7. Consultative Group for International Agricultural Research: Washington, D.C
Tafesse. (2007). Socio-economic and Institutional Determinants of Small Scale Irrigation hemes
utilization in Bale Zone,Oromiya National Regional State. A Master Thesis, Alemaya
University
Todaro, M., andSmith, S. (2011). Economic Development 11 (Ed),Addison-Wesley, Pearson,
ISBN 10: 0-13-801388-8. WBCSD Water Facts & Trends" Retrieved 2010-07-25
66
Torell, G. andWard, F.(2010).Improved Water Institutions for Food Security and Rural
Livelihoods in Afghanistan‟s Balkh River Basin. Water Resources Development, Vol. 26
(4), PP. 613–637
Von Braun J, Fan S, Meinzen-Dick R, Rosegrant MW, Pratt AN (2008). International
agricultural research for food security, poverty reduction,and the environment. In:
Stansbury, C. (ed.). What to expect fromscaling up CGIAR investments and “Best-
Bet” Programs. International Food Policy Research Institute (IFPRI), Washington, DC.,
USA. pp. 35-36
W. Bart, S. (1996). Irrigation Water management Training manual. In Irrigation Scheme
Maintenance and peration no-10(p. 55p). Rome: FAO.
Widtose, JA. 2001. Irrigation Practices. Publisher: Updesh Purhohit for Agrobios; India,
Jodhpur. ISBN NO: 81-7754-110-2.
Wooldridge, J.M. 2003.Introductory Econometrics: A Modern Approach.2nd
Ed South-Western.
Wooldridge,M. 2002.Econometric Analysis of Cross Section and Panel Data. pp. 551-565.
Massachusetts Institute of Technology. London, England.
World Bank (2010) World Development Report 2010: Development and Climate Change.
Washington D.C: The World Bank.
Wozniak, Gregory. 1987. Human capital, information, and the early adoption of ne wtechnology.
Journal of Human Resources 22 (1): 101-12.est Research, Vol. 2(10), PP. 208-215.king
Paper 123oved Management of Irrigation Systems, Working Paper 39, International
water management Institutes.
Yilma Muluken. 2005. Measuring rural household food security status and its determinants in the
Benishangul Gumuze Region: The case of Asosa Woreda. An MSc Thesis Presented to
the School of Graduate Studies of Alemaya University. pp. 134.
Zaman, H. 2001. Assessing the poverty and vulnerability impact of micro credit in Bangladesh.
pp. 34-36. A case study of BRAC.Office of the chief economist and senior vice president
(DECVP). The World Bank.
Zewdie M, Moti J,Ascimelis G.2007.Assessment of Wendo Wesha irrigation scheme in Awassa
Zuria. Proceddings of research project completion workshop; 2007 Feb 1-2; Addis
Abaaba, Ethiopia.
Zhou, S. D. 2008. Factors affecting Chinese farmers' decisions to adopt a water-saving
technology. Canadian Journal of Agricultural Economics 56 (1): 51-61.
Zhou Y, Zhang Y, Abbaspour CK, Yang H, Mosler JH. 2009. Economic impacts on farm
households due to water reallocation in China‟s Chaobai Watershed [Internet]. [Cited
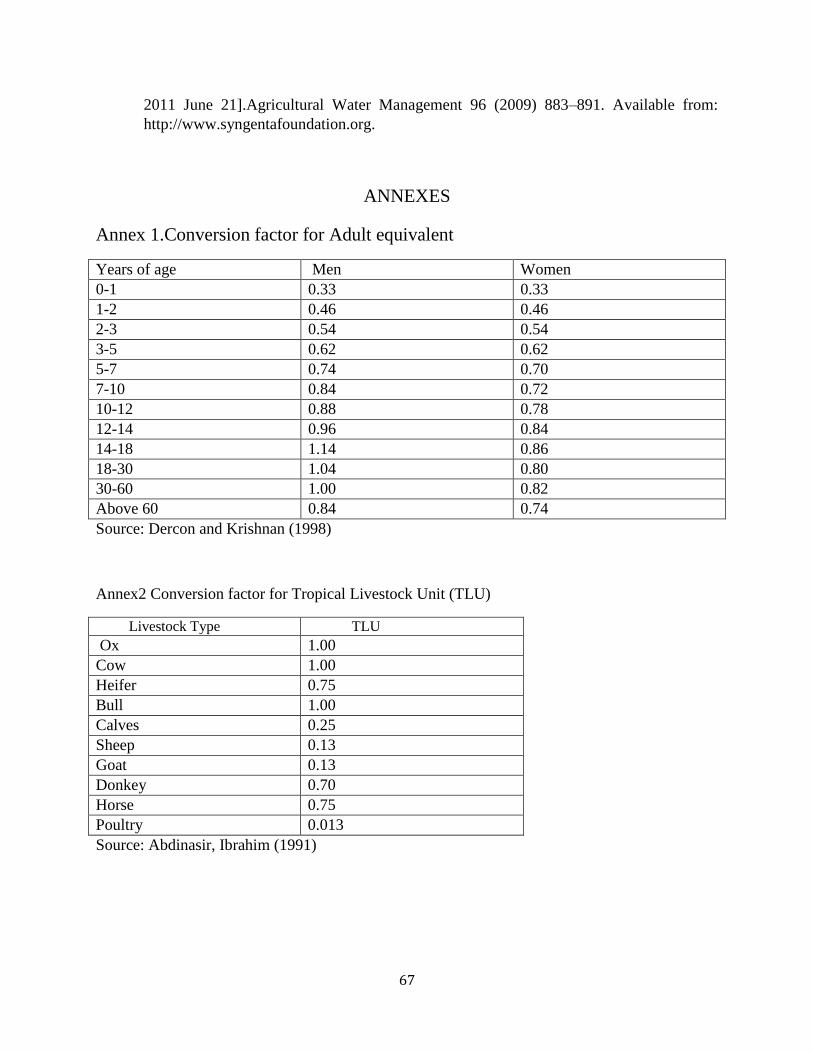
67
2011 June 21].Agricultural Water Management 96 (2009) 883–891. Available from:
http://www.syngentafoundation.org.
ANNEXES
Annex 1.Conversion factor for Adult equivalent
Years of age Men Women
0-1 0.33 0.33
1-2 0.46 0.46
2-3 0.54 0.54
3-5 0.62 0.62
5-7 0.74 0.70
7-10 0.84 0.72
10-12 0.88 0.78
12-14 0.96 0.84
14-18 1.14 0.86
18-30 1.04 0.80
30-60 1.00 0.82
Above 60 0.84 0.74
Source: Dercon and Krishnan (1998)
Annex2 Conversion factor for Tropical Livestock Unit (TLU)
Livestock Type TLU
Ox 1.00
Cow 1.00
Heifer 0.75
Bull 1.00
Calves 0.25
Sheep 0.13
Goat 0.13
Donkey 0.70
Horse 0.75
Poultry 0.013
Source: Abdinasir, Ibrahim (1991)

68
Annex3 Variance Inflation Factors (VIF) of Continuous variables
Variable VIF Tolerance
farmexp 2.88 0.346797
hhage 2.31 0.433074
tlu1 2.12 0.471296
cultland 1.90 0.525160
hheduc1 1.67 0.597775
Avaiwater 1.58 0.634269
accexten 1.56 0.641913
Credit 1.55 0.645216
Disftc 1.37 0.729669
hhsizepa 1.37 0.731203
hhsex 1.14 0.875642
soilfertil~y 1.11 0.897724
Dismkt 1.06 0.940619
Mean VIF 1.66
Source: Model output
Annex 4 Contingency Coefficients for Discrete Explanatory Variables
pwcorr hhsex soilfertility accexten credit avaiwater
| hhsex soilfe~y accexten credit avaiwa~r
-------------+---------------------------------------------
hhsex | 1.0000
soilfertil~y | -0.0268 1.0000
accexten | -0.0965 0.1593 1.0000
credit | -0.0000 0.0484 0.3408 1.0000
avaiwater | -0.0269 0.0905 0.3710 0.4738 1.0000

69
Annex 5 Estimation result of the heckman selection model (participation
equation)
------------------------------------------------------------------------------
irrigpartici | Coef. Std. Err. z P>|z| [95% Conf. Interval]
-------------+----------------------------------------------------------------
hhsex | 1.343726 .7794752 1.72 0.085 -.1840176 2.871469
hhage | -.0463098 .0498425 -0.93 0.353 -.1439992 .0513796
hheduc1 | .1816642 .1102065 1.65 0.099 -.0343365 .3976649
hhsizepa | .0934452 .1673315 0.56 0.577 -.2345186 .4214089
farmexp | .0427301 .0475128 0.90 0.368 -.0503931 .1358534
cultland | .6884752 .3018797 2.28 0.023 .0968017 1.280149
soilfertil~y | .0516902 .5609348 0.09 0.927 -1.047722 1.151102
tlu1 | -.0162518 .0697889 -0.23 0.816 -.1530355 .120532
dismkt | .0465767 .0436746 1.07 0.286 -.0390239 .1321773
disftc | -.29147 .1440059 -2.02 0.043 -.5737164 -.0092236
accexten | 2.026919 .9832187 2.06 0.039 .0998453 3.953992
credit | 1.56704 .9319742 1.68 0.093 -.2595961 3.393675
avaiwater | 1.866669 .6427907 2.90 0.004 .6068219 3.126515
_cons | -6.918011 3.178648 -2.18 0.030 -13.14805 -.6879748
--------------------------------------------------------------------------
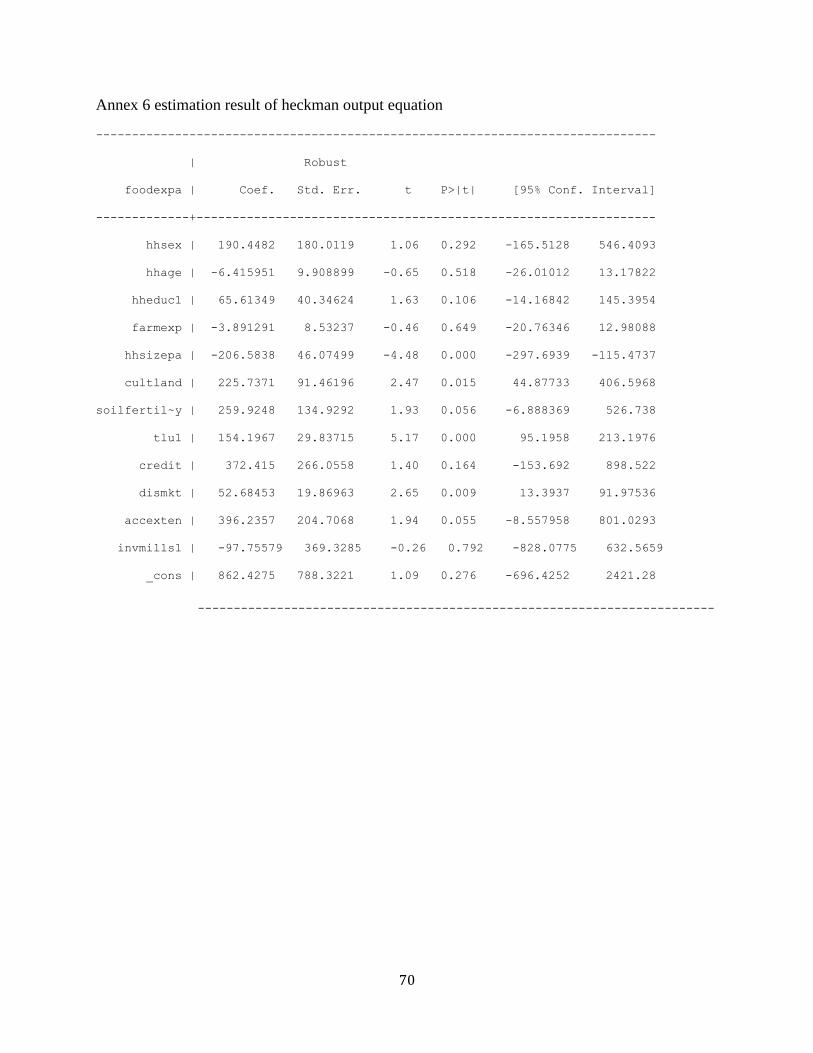
70
Annex 6 estimation result of heckman output equation
------------------------------------------------------------------------------
| Robust
foodexpa | Coef. Std. Err. t P>|t| [95% Conf. Interval]
-------------+----------------------------------------------------------------
hhsex | 190.4482 180.0119 1.06 0.292 -165.5128 546.4093
hhage | -6.415951 9.908899 -0.65 0.518 -26.01012 13.17822
hheduc1 | 65.61349 40.34624 1.63 0.106 -14.16842 145.3954
farmexp | -3.891291 8.53237 -0.46 0.649 -20.76346 12.98088
hhsizepa | -206.5838 46.07499 -4.48 0.000 -297.6939 -115.4737
cultland | 225.7371 91.46196 2.47 0.015 44.87733 406.5968
soilfertil~y | 259.9248 134.9292 1.93 0.056 -6.888369 526.738
tlu1 | 154.1967 29.83715 5.17 0.000 95.1958 213.1976
credit | 372.415 266.0558 1.40 0.164 -153.692 898.522
dismkt | 52.68453 19.86963 2.65 0.009 13.3937 91.97536
accexten | 396.2357 204.7068 1.94 0.055 -8.557958 801.0293
invmills1 | -97.75579 369.3285 -0.26 0.792 -828.0775 632.5659
_cons | 862.4275 788.3221 1.09 0.276 -696.4252 2421.28
------------------------------------------------------------------------
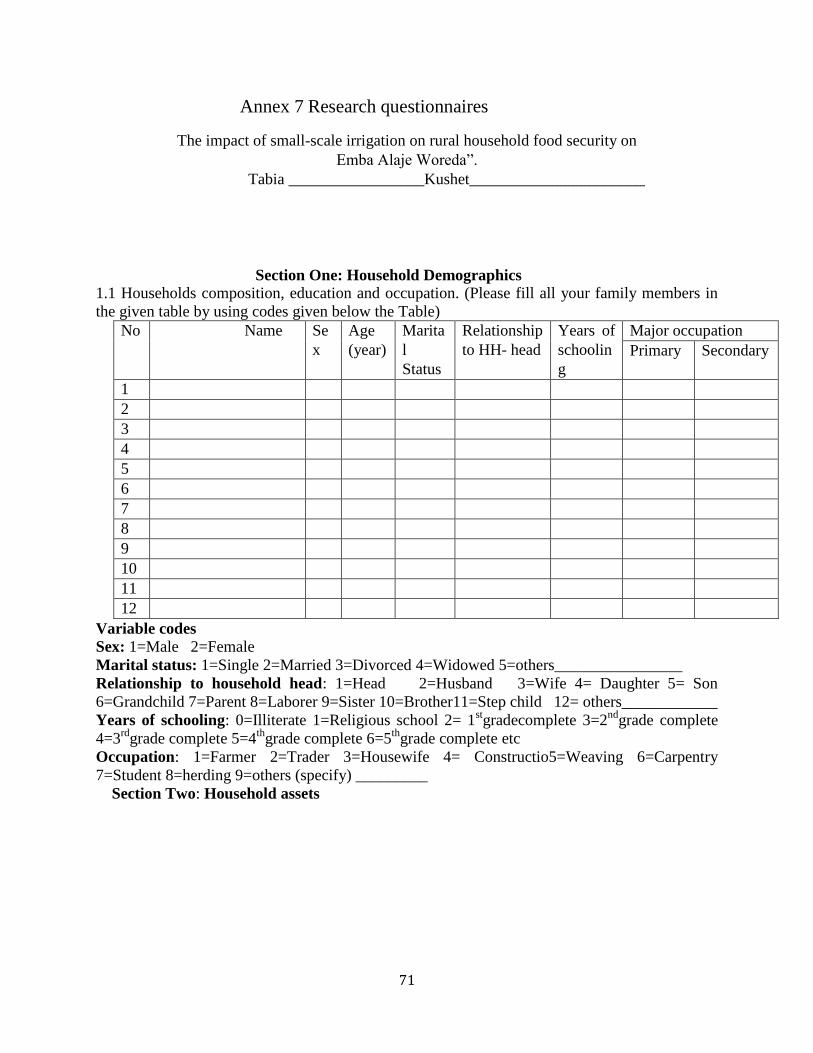
71
Annex 7 Research questionnaires
The impact of small-scale irrigation on rural household food security on
Emba Alaje Woreda”.
Tabia _________________Kushet______________________
Section One: Household Demographics 1.1 Households composition, education and occupation. (Please fill all your family members in
the given table by using codes given below the Table)
No Name Se
x
Age
(year)
Marita
l
Status
Relationship
to HH- head
Years of
schoolin
g
Major occupation
Primary Secondary
1
2
3
4
5
6
7
8
9
10
11
12
Variable codes
Sex: 1=Male 2=Female
Marital status: 1=Single 2=Married 3=Divorced 4=Widowed 5=others________________
Relationship to household head: 1=Head 2=Husband 3=Wife 4= Daughter 5= Son
6=Grandchild 7=Parent 8=Laborer 9=Sister 10=Brother11=Step child 12= others____________
Years of schooling: 0=Illiterate 1=Religious school 2= 1stgradecomplete 3=2
ndgrade complete
4=3rd
grade complete 5=4th
grade complete 6=5th
grade complete etc
Occupation: 1=Farmer 2=Trader 3=Housewife 4= Constructio5=Weaving 6=Carpentry
7=Student 8=herding 9=others (specify) _________
Section Two: Household assets
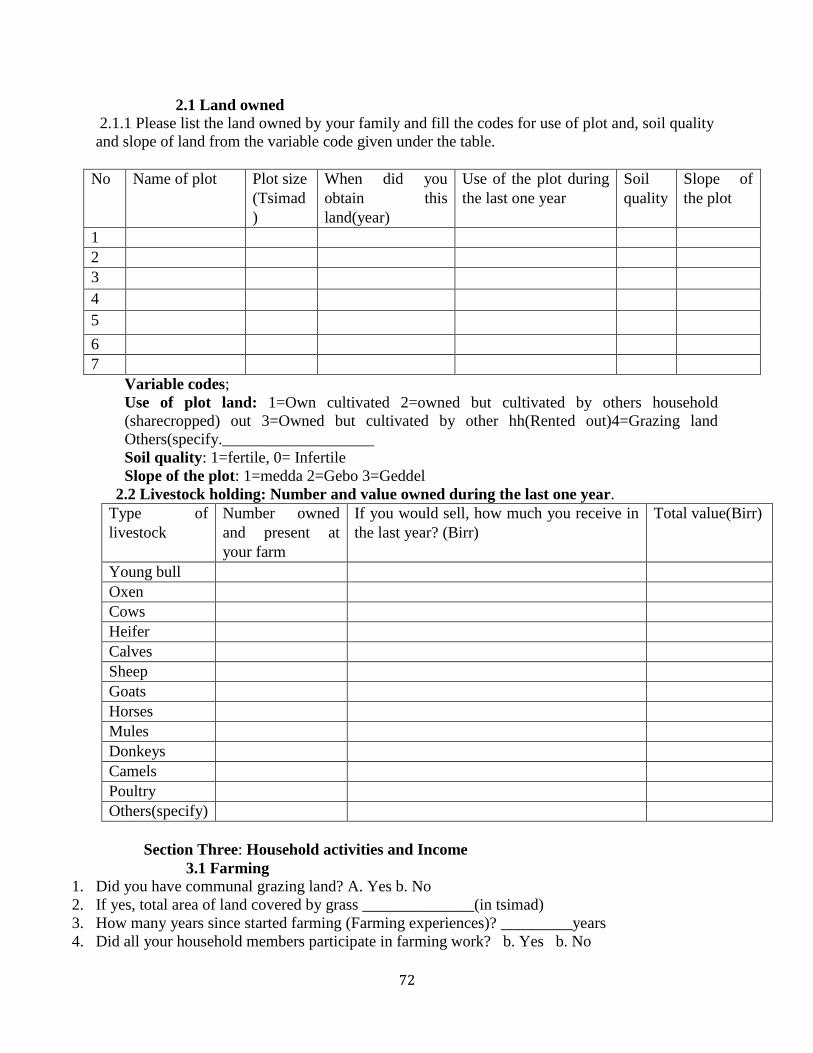
72
2.1 Land owned
2.1.1 Please list the land owned by your family and fill the codes for use of plot and, soil quality
and slope of land from the variable code given under the table.
No Name of plot Plot size
(Tsimad
)
When did you
obtain this
land(year)
Use of the plot during
the last one year
Soil
quality
Slope of
the plot
1
2
3
4
5
6
7
Variable codes;
Use of plot land: 1=Own cultivated 2=owned but cultivated by others household
(sharecropped) out 3=Owned but cultivated by other hh(Rented out)4=Grazing land
Others(specify.___________________
Soil quality: 1=fertile, 0= Infertile
Slope of the plot: 1=medda 2=Gebo 3=Geddel
2.2 Livestock holding: Number and value owned during the last one year.
Type of
livestock
Number owned
and present at
your farm
If you would sell, how much you receive in
the last year? (Birr)
Total value(Birr)
Young bull
Oxen
Cows
Heifer
Calves
Sheep
Goats
Horses
Mules
Donkeys
Camels
Poultry
Others(specify)
Section Three: Household activities and Income
3.1 Farming 1. Did you have communal grazing land? A. Yes b. No
2. If yes, total area of land covered by grass ______________(in tsimad)
3. How many years since started farming (Farming experiences)? _________years
4. Did all your household members participate in farming work? b. Yes b. No

73
5. If no, how many of them participated? ______________(in number)
6. Did you face labor shortage? a. Yes b. No
7. If yes, how did you solve the problem of labor shortage? a. Hiring b. Labor exchange c.
Other_________
8. Total area of land cultivated during the last one year (2005 E.C) _________________ (in
tsimad).
3.1.1 Inputs
1. Please fill the activity you did in the last one year in the table given bellow
Activity Ploughi
ng
Value(Birr
)
Weedin
g
Value(Birr
)
Harvesting Value(Birr
)
Total
value(Birr)
How many
day did you
do this
activity(labor
cost)
Oxen days
9. Total area of land cultivated during last year on which fertilizer was used_______(in tsimad)
10. Total area of land covered by improved seeds during the last one yea___________ (in tsimad).
2. Please indicate the activity given in the table below.
No Activity Ye
s=
1
No
=0
Amoun
t
Unit Sourc
e
Value
(Birr)
1 Did you use any manure from your herd on your
field?
2 Did you purchase any fertilizer for use on your
field?
3 Did you purchase improved seeds for use on your
field?
4 Total

74
3.1.2 Crop output and sales during rain fed agriculture
Variable codes:
White Teff=1 Peas=2 Beans=3 Red Teff =4 Barley=5 Wheat=6 Maize=7 Sorghum= 8
Oats= 9 Groundnuts=10 Sesame =11 Line seed=12 Pulses =13 Vegetables=14 Coffee
=15 Chat=16 Bananas =17 Geshu=18 Papaya =19 Avocado =20 Orange =21 Lemon=22
Guava =23 Potatoes =24 Onion=25 Grass =26 Ananias=27 other =28(specify)
__________________
1. Please indicate the amount of food production you got from rain fed agriculture only in the last
one year in the table given below by using the above codes.
Plot name Crop
type
Yiel
d
(kg)
Value
s(Birr
)
For own
consumpt
ion(kg)
Value
s(Birr
)
For
sale(kg)
Value
(Birr)
To others as
payment for rent
or gift(kg)
Value
s(Birr
0
Total
value(bi
rr)
Section Four: Irrigation capacity
1. Does any household members has irrigable land? a. Yes b. No
2. If yes, what is the size of the irrigable land__________________ (in tsimad)?
3. When did you own this irrigable land? a. Before1year b. Before 2 years c. Before 3 years d.
Other__________
4. How many times do you produce per year using irrigation? _____________
5. What is the source of water for your irrigation? a. Rivers b. springs c. Ponds d. Wells e.
Other______________
6. What is the approximate distance of main water source from centre of plot? ___________ (in
km).
7. Please fill the activities you did in the last one year in the following two tables given bellow.
7.1
Activity Plot
Name
Plot
size(tsimad
)
Irriga
ting
Valu
e(Bir
r)
Ploughi
ng
Valu
e(Bir
r)
Weed
ing
Valu
e(Bir
r)
Harve
sting
Valu
e(Bir
r)
Total
Value(Birrr
)
Labor input
Oxen days
Total

75
7.2
No Activity Yes
=1
No=0 Amoun
t
Uni
t
Source Values
(Birr)
1 Did you use any manure from your herd
on your field?
2 Did you purchase any fertilizer for use on
your field?
3 Did you use chemicals to kill pests if you
had a problem?
4 Did you purchase improved seeds for use
on your field?
5 Total
4.2 Crop output and sales out of irrigation agriculture 8.1Please indicate agricultural product you got from irrigable land only in the last one year.
Crop
type( see
codes on
page 3)
Yiel
d
(kg)
Value
(Birr)
For own
consumptio
n
(kg)
Value(Birr) For
sale(kg)
Valu
e(Bir
r)
To others as
payment for
rent or gift(kg)
Value
(Birr)
Total
value(Birr
)
4.3 Other sources of Income 8. Do you or your household members under take some additional income generating activities of
off farm in the last one year? a. Yes b. No
9. If yes, indicate the income earned from other activities in the table below.
Source Value(Birr)
Non-farm employment
Farm work
Hiring out oxen
Renting/sharecropping out land
Sale of firewood/charcoal
Sale of beverages
Petty trade (net profit)
Handcrafts

76
Livestock and livestock output trade
Sale of local drinks
Weaving
Food aid
Sale of livestock output (eg. fluid milk, Butter, Cheese, Chicken, Egg, Honey,
Bees wax, etc.)
Others(specify
Section Five: Agricultural Extension, Credit, Marketing and other institutional Support
services
5.1: Agricultural Extension 10. Is there farmers training center (FTC) in your Tabia? a. Yes b. No
11. How far is the FTC from your home _______________ in Km?
12. How long do you take from your home to FTC_____________ in minutes?
13. Did you have some social position in the community? a. Yes b. No
14. If yes, what is your position? _________________________________________
15. Did you have some Social Networks in the community? a. Yes b. No
16. If yes, what is your Social Network? A. Edir b. Equib c. Unions d, cooperatives e.
Other__________________
17. Is there an Agricultural Development Agent in your Tabia? a. Yes b. No
18. If yes, had you get an extension support during the last one year? a. Yes b. No
19. If yes, have you participated in the training program organized last year? a. Yes b. No
20. If yes, in which topics you had been trained from the lists mentioned in the table below (see
codes listed under the table).
Training topics How many rounds you
have been trained
(numbers)
For how long you
have taken (days)
1=livestock production 2= fruits and vegetables 3=crop diversification 4=marketing
5=irrigation 6=post harvest processing 7= storage of farm produce 8=farm management 9= credit
10= household food security ……15=others
5.2: Market information
21. Did you get market information about prices and conditions of agricultural inputs and out puts?
a. Yes b. No
22. If yes, what is the source information? a. Radio b. Television c. Newspaper d. Mobile e.
Others_______________
23. Where did you sell your product? a. At village market b. At district market c. At regional market
d. At national market e. Others (specify) ____________________________
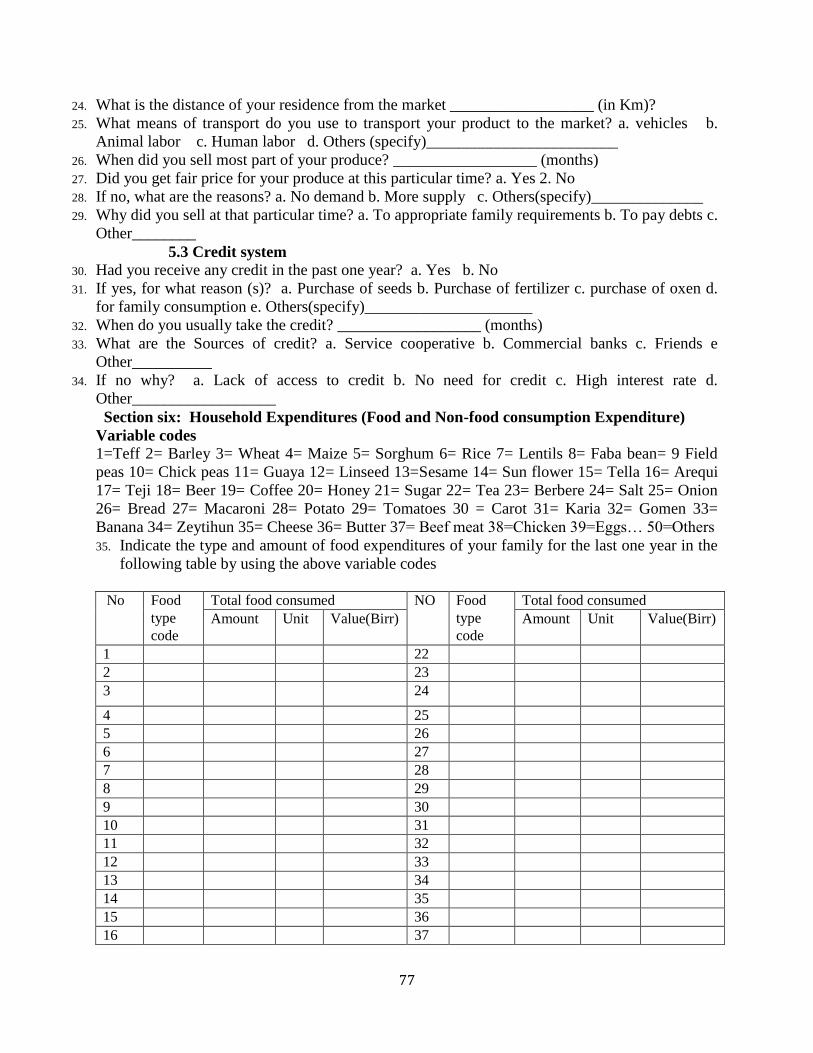
77
24. What is the distance of your residence from the market __________________ (in Km)?
25. What means of transport do you use to transport your product to the market? a. vehicles b.
Animal labor c. Human labor d. Others (specify)________________________
26. When did you sell most part of your produce? __________________ (months)
27. Did you get fair price for your produce at this particular time? a. Yes 2. No
28. If no, what are the reasons? a. No demand b. More supply c. Others(specify)______________
29. Why did you sell at that particular time? a. To appropriate family requirements b. To pay debts c.
Other________
5.3 Credit system 30. Had you receive any credit in the past one year? a. Yes b. No
31. If yes, for what reason (s)? a. Purchase of seeds b. Purchase of fertilizer c. purchase of oxen d.
for family consumption e. Others(specify)_____________________
32. When do you usually take the credit? __________________ (months)
33. What are the Sources of credit? a. Service cooperative b. Commercial banks c. Friends e
Other__________
34. If no why? a. Lack of access to credit b. No need for credit c. High interest rate d.
Other__________________
Section six: Household Expenditures (Food and Non-food consumption Expenditure)
Variable codes
1=Teff 2= Barley 3= Wheat 4= Maize 5= Sorghum 6= Rice 7= Lentils 8= Faba bean= 9 Field
peas 10= Chick peas 11= Guaya 12= Linseed 13=Sesame 14= Sun flower 15= Tella 16= Arequi
17= Teji 18= Beer 19= Coffee 20= Honey 21= Sugar 22= Tea 23= Berbere 24= Salt 25= Onion
26= Bread 27= Macaroni 28= Potato 29= Tomatoes 30 = Carot 31= Karia 32= Gomen 33=
Banana 34= Zeytihun 35= Cheese 36= Butter 37= Beef meat 38=Chicken 39=Eggs… 50=Others
35. Indicate the type and amount of food expenditures of your family for the last one year in the
following table by using the above variable codes
No Food
type
code
Total food consumed NO Food
type
code
Total food consumed
Amount Unit Value(Birr) Amount Unit Value(Birr)
1 22
2 23
3 24
4 25
5 26
6 27
7 28
8 29
9 30
10 31
11 32
12 33
13 34
14 35
15 36
16 37
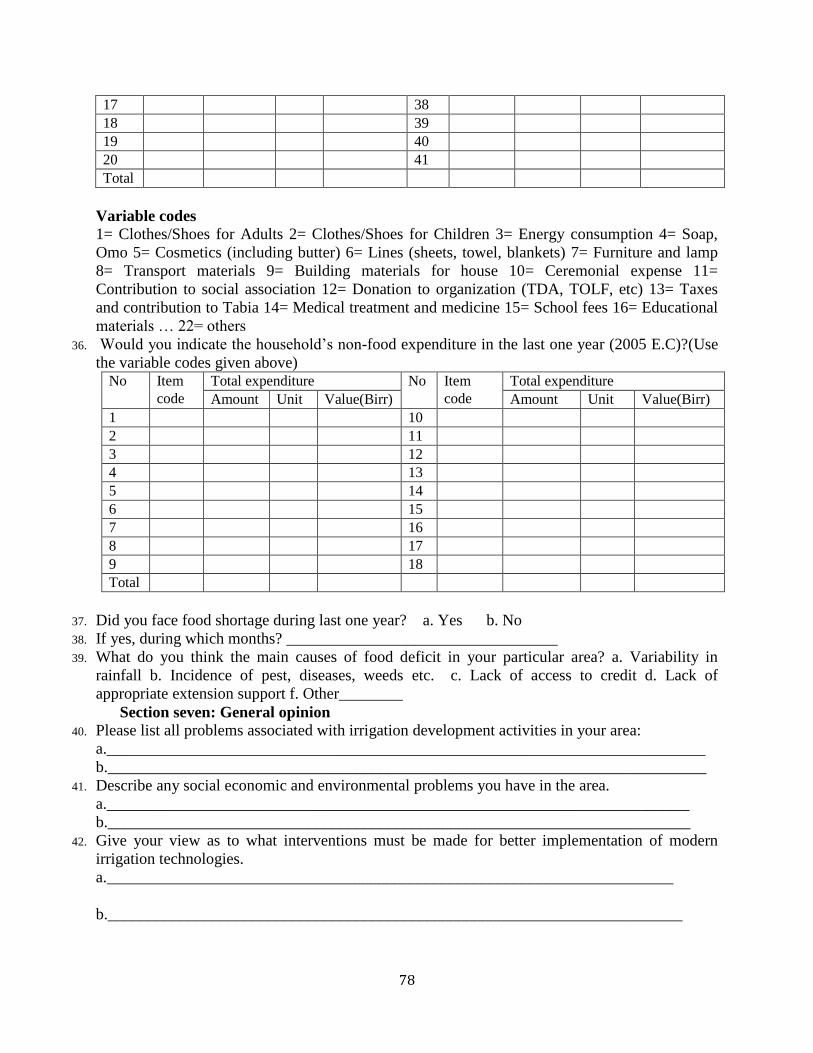
78
17 38
18 39
19 40
20 41
Total
Variable codes
1= Clothes/Shoes for Adults 2= Clothes/Shoes for Children 3= Energy consumption 4= Soap,
Omo 5= Cosmetics (including butter) 6= Lines (sheets, towel, blankets) 7= Furniture and lamp
8= Transport materials 9= Building materials for house 10= Ceremonial expense 11=
Contribution to social association 12= Donation to organization (TDA, TOLF, etc) 13= Taxes
and contribution to Tabia 14= Medical treatment and medicine 15= School fees 16= Educational
materials … 22= others
36. Would you indicate the household‟s non-food expenditure in the last one year (2005 E.C)?(Use
the variable codes given above) No Item
code
Total expenditure No Item
code
Total expenditure
Amount Unit Value(Birr) Amount Unit Value(Birr)
1 10
2 11
3 12
4 13
5 14
6 15
7 16
8 17
9 18
Total
37. Did you face food shortage during last one year? a. Yes b. No
38. If yes, during which months? __________________________________
39. What do you think the main causes of food deficit in your particular area? a. Variability in
rainfall b. Incidence of pest, diseases, weeds etc. c. Lack of access to credit d. Lack of
appropriate extension support f. Other________
Section seven: General opinion 40. Please list all problems associated with irrigation development activities in your area:
a.___________________________________________________________________________
b.___________________________________________________________________________
41. Describe any social economic and environmental problems you have in the area.
a._________________________________________________________________________
b._________________________________________________________________________
42. Give your view as to what interventions must be made for better implementation of modern
irrigation technologies.
a._______________________________________________________________________
b.________________________________________________________________________