meghmani organics ltd.idbidirect.cmlinks.in/admin/pdf/1228723397_megh-cr...meghmani organics ltd....
TRANSCRIPT
COMPANY
REPORT
Summary
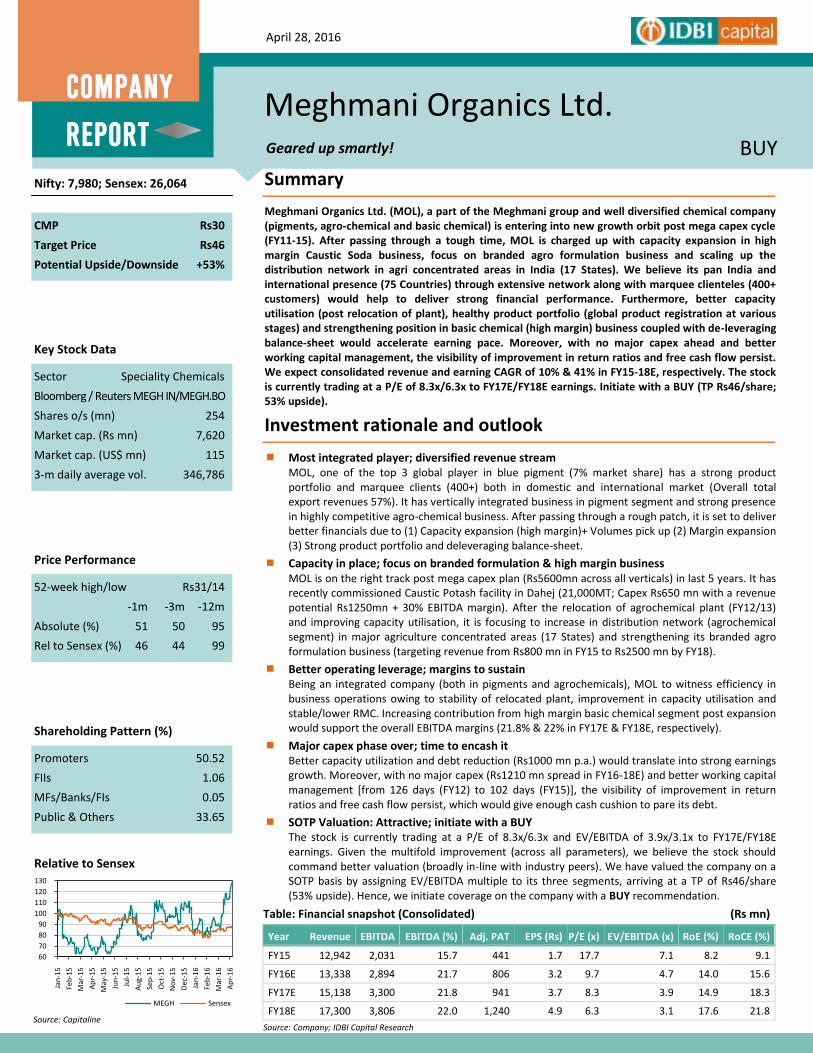
Meghmani Organics Ltd. (MOL), a part of the Meghmani group and well diversified chemical company (pigments, agro-chemical and basic chemical) is entering into new growth orbit post mega capex cycle (FY11-15). After passing through a tough time, MOL is charged up with capacity expansion in high margin Caustic Soda business, focus on branded agro formulation business and scaling up the distribution network in agri concentrated areas in India (17 States). We believe its pan India and international presence (75 Countries) through extensive network along with marquee clienteles (400+ customers) would help to deliver strong financial performance. Furthermore, better capacity utilisation (post relocation of plant), healthy product portfolio (global product registration at various stages) and strengthening position in basic chemical (high margin) business coupled with de-leveraging balance-sheet would accelerate earning pace. Moreover, with no major capex ahead and better working capital management, the visibility of improvement in return ratios and free cash flow persist. We expect consolidated revenue and earning CAGR of 10% & 41% in FY15-18E, respectively. The stock is currently trading at a P/E of 8.3x/6.3x to FY17E/FY18E earnings. Initiate with a BUY (TP Rs46/share; 53% upside).
Investment rationale and outlook
Most integrated player; diversified revenue stream MOL, one of the top 3 global player in blue pigment (7% market share) has a strong product portfolio and marquee clients (400+) both in domestic and international market (Overall total export revenues 57%). It has vertically integrated business in pigment segment and strong presence in highly competitive agro-chemical business. After passing through a rough patch, it is set to deliver better financials due to (1) Capacity expansion (high margin)+ Volumes pick up (2) Margin expansion (3) Strong product portfolio and deleveraging balance-sheet.
Capacity in place; focus on branded formulation & high margin business MOL is on the right track post mega capex plan (Rs5600mn across all verticals) in last 5 years. It has recently commissioned Caustic Potash facility in Dahej (21,000MT; Capex Rs650 mn with a revenue potential Rs1250mn + 30% EBITDA margin). After the relocation of agrochemical plant (FY12/13) and improving capacity utilisation, it is focusing to increase in distribution network (agrochemical segment) in major agriculture concentrated areas (17 States) and strengthening its branded agro formulation business (targeting revenue from Rs800 mn in FY15 to Rs2500 mn by FY18).
Better operating leverage; margins to sustain Being an integrated company (both in pigments and agrochemicals), MOL to witness efficiency in business operations owing to stability of relocated plant, improvement in capacity utilisation and stable/lower RMC. Increasing contribution from high margin basic chemical segment post expansion would support the overall EBITDA margins (21.8% & 22% in FY17E & FY18E, respectively).
Major capex phase over; time to encash it Better capacity utilization and debt reduction (Rs1000 mn p.a.) would translate into strong earnings growth. Moreover, with no major capex (Rs1210 mn spread in FY16-18E) and better working capital management [from 126 days (FY12) to 102 days (FY15)], the visibility of improvement in return ratios and free cash flow persist, which would give enough cash cushion to pare its debt.
SOTP Valuation: Attractive; initiate with a BUY The stock is currently trading at a P/E of 8.3x/6.3x and EV/EBITDA of 3.9x/3.1x to FY17E/FY18E earnings. Given the multifold improvement (across all parameters), we believe the stock should command better valuation (broadly in-line with industry peers). We have valued the company on a SOTP basis by assigning EV/EBITDA multiple to its three segments, arriving at a TP of Rs46/share (53% upside). Hence, we initiate coverage on the company with a BUY recommendation.
April 28, 2016
Meghmani Organics Ltd.
Geared up smartly!
CMP Rs30
Target Price Rs46
Potential Upside/Downside +53%
Relative to Sensex
Source: Capitaline
BUY
Nifty: 7,980; Sensex: 26,064
Sector Speciality Chemicals
Bloomberg / Reuters MEGH IN/MEGH.BO
Shares o/s (mn) 254
Market cap. (Rs mn) 7,620
Market cap. (US$ mn) 115
3-m daily average vol. 346,786
Key Stock Data
52-week high/low Rs31/14
-1m -3m -12m
Absolute (%) 51 50 95
Rel to Sensex (%) 46 44 99
Price Performance
Promoters 50.52
FIIs 1.06
MFs/Banks/FIs 0.05
Public & Others 33.65
Shareholding Pattern (%)
COMPANY
REPORT
Table: Financial snapshot (Consolidated) (Rs mn)
Year Revenue EBITDA EBITDA (%) Adj. PAT EPS (Rs) P/E (x) EV/EBITDA (x) RoE (%) RoCE (%)
FY15 12,942 2,031 15.7 441 1.7 17.7 7.1 8.2 9.1
FY16E 13,338 2,894 21.7 806 3.2 9.7 4.7 14.0 15.6
FY17E 15,138 3,300 21.8 941 3.7 8.3 3.9 14.9 18.3
FY18E 17,300 3,806 22.0 1,240 4.9 6.3 3.1 17.6 21.8
Source: Company; IDBI Capital Research
60
70
80
90
100
110
120
130
Jan
-15
Feb
-15
Mar
-15
Ap
r-15
May
-15
Jun
-15
Jul-
15
Au
g-15
Sep
-15
Oct
-15
No
v-15
Dec
-15
Jan
-16
Feb
-16
Mar
-16
Ap
r-16
MEGH Sensex
2
Company Report – Meghmani Organics Ltd.
Investment Rationale
Diversified business model; Geared up smartly post Capex
Meghmani Organics limited has a well diversified revenue stream, operating in three different segments in
India. It has wide geographic reach, strong product portfolio, healthy supply-chain and marquee clients across
domestic and international market. Despite of vertically integrated business in pigment segment and strong
presence in highly competitive agro-chemical business, it has passed through tough time in recent years
attributed to (1) Major Capex cycle (spent Rs5,600 mn in last 5 years) (2) Lower capacity utilization (3)
Relocation of plant in FY12/FY13 (4) Higher debt burden. However, the company’s effort to bring the business
operations on track through various initiatives (improving utilisation across verticals, capacity expansion,
widening distribution channels and deleveraging the balance-sheet) would start bearing fruits in the coming
years. It has now geared up smartly to showcase better financial performance.
Table : Business Segments
Particulars (FY15) Pigment Agro-chemicals Basic chemicals
Incorporation 1986 1995 2009
Market share (%) 7% - -
Capacity (MT) 31,140 19,200 1,54,100
Utilisation rate (%) 51% 60% 93%
End users Ink, Paint, Plastic
mfr.
Pesticides manufacturer,
formulators, Institutional clients,
farmers
Pulp, Paper, Soap &
detergents, Textile, Paint,
Coating
Revenue Mix (%) 33% 35% 28%
EBITDA margin (%) 10% 13% 31%
Domestic revenue (%) 20% 30% 100%
Export revenue (%) 80% 70% -
Key competitors Sudarshan Chemical,
Asahi Songwon Danuka, PI Ind, Rallis India, UPL
Gujarat Alkalies,
DCM Shriram
Revenue CAGR (FY12-
15) 9% 3% 12%
Sufficient capacity in place; Riding on strong recovery path
MOL is set to deliver better financial performance on the back of (1) Capacity expansion high margin business +
improving capacity utilisation (2) Debt repayment (3) Sustainable margin profile and (4) Strong product folio
(400 new product registrations in pipeline in the next 1-3 years). Under the Agrochemical segment, it is
targeting to increase the distribution network across major agriculture concentrated areas (17 states) to
strengthen branded formulation business while it has set up the new facility of Caustic Potash plant at Dahej
(under Basic Chemical segment) by spending Rs650 mn, which has started operating from April 2016. With no
major capex needs (Rs1,210 mn in FY16E-18E v/s Rs3550 mn in FY12-15) and focus on debt repayment (Rs1,000
mn+ p.a.), MOL is well poised to ride on the strong recovery path in the coming years. We expect revenue and
earning CAGR of 10% and 41% in FY15-18E, respectively.
Company Report – Meghmani Organics Ltd.
3
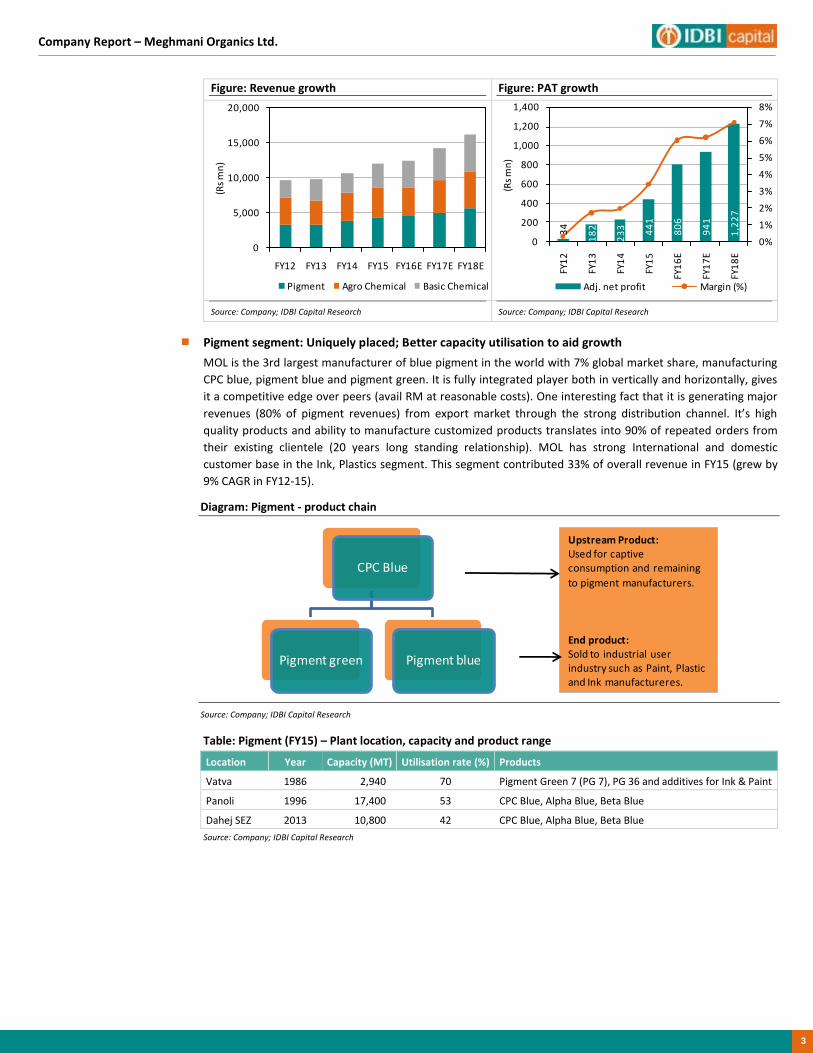
Figure: Revenue growth Figure: PAT growth
Source: Company; IDBI Capital Research Source: Company; IDBI Capital Research
Pigment segment: Uniquely placed; Better capacity utilisation to aid growth
MOL is the 3rd largest manufacturer of blue pigment in the world with 7% global market share, manufacturing
CPC blue, pigment blue and pigment green. It is fully integrated player both in vertically and horizontally, gives
it a competitive edge over peers (avail RM at reasonable costs). One interesting fact that it is generating major
revenues (80% of pigment revenues) from export market through the strong distribution channel. It’s high
quality products and ability to manufacture customized products translates into 90% of repeated orders from
their existing clientele (20 years long standing relationship). MOL has strong International and domestic
customer base in the Ink, Plastics segment. This segment contributed 33% of overall revenue in FY15 (grew by
9% CAGR in FY12-15).
Diagram: Pigment - product chain
Source: Company; IDBI Capital Research
Table: Pigment (FY15) – Plant location, capacity and product range
Location Year Capacity (MT) Utilisation rate (%) Products
Vatva 1986 2,940 70 Pigment Green 7 (PG 7), PG 36 and additives for Ink & Paint
Panoli 1996 17,400 53 CPC Blue, Alpha Blue, Beta Blue
Dahej SEZ 2013 10,800 42 CPC Blue, Alpha Blue, Beta Blue
Source: Company; IDBI Capital Research
0
5,000
10,000
15,000
20,000
FY12 FY13 FY14 FY15 FY16E FY17E FY18E
(Rs
mn
)
Pigment Agro Chemical Basic Chemical
34
18
2
23
3 44
1
80
6
94
1
1,2
27
0%
1%
2%
3%
4%
5%
6%
7%
8%
0
200
400
600
800
1,000
1,200
1,400
FY1
2
FY1
3
FY1
4
FY1
5
FY1
6E
FY1
7E
FY1
8E
(Rs
mn
)
Adj. net profit Margin (%)
CPC Blue
Pigment green Pigment blue
Upstream Product: Used for captive consumption and remaining
to pigment manufacturers.
End product: Sold to industrial user industry such as Paint, Plastic and Ink manufactureres.
4
Company Report – Meghmani Organics Ltd.
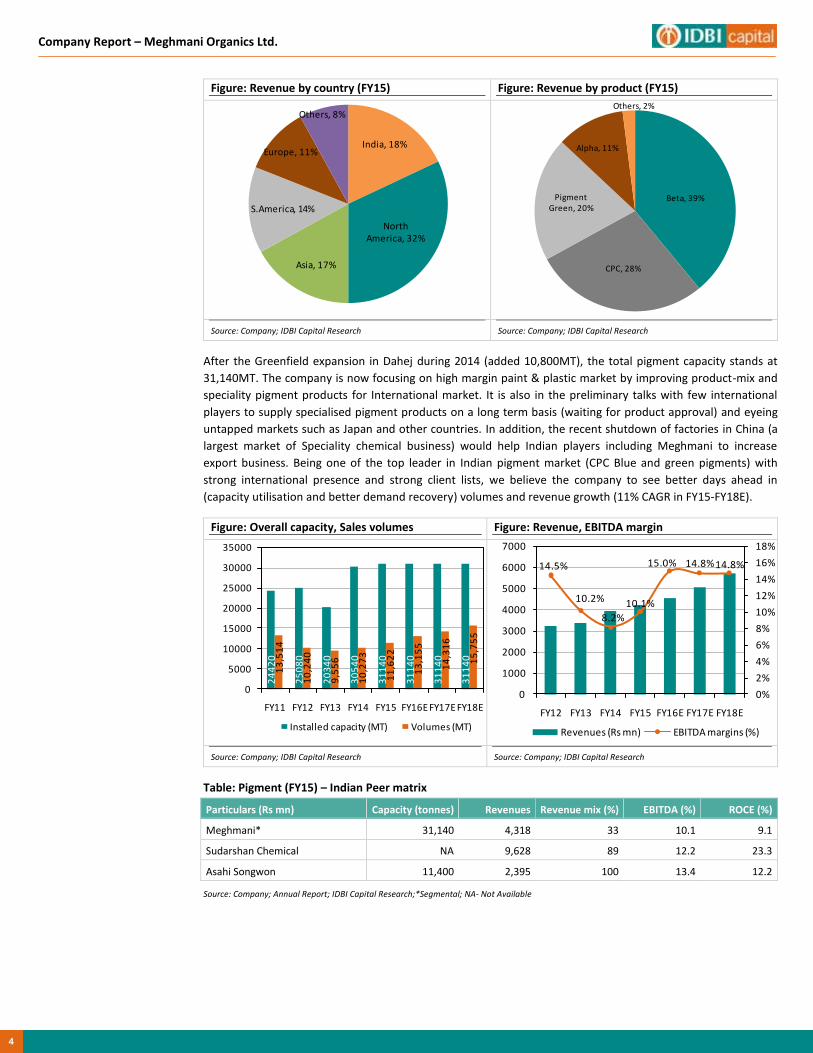
Figure: Revenue by country (FY15) Figure: Revenue by product (FY15)
Source: Company; IDBI Capital Research Source: Company; IDBI Capital Research
After the Greenfield expansion in Dahej during 2014 (added 10,800MT), the total pigment capacity stands at
31,140MT. The company is now focusing on high margin paint & plastic market by improving product-mix and
speciality pigment products for International market. It is also in the preliminary talks with few international
players to supply specialised pigment products on a long term basis (waiting for product approval) and eyeing
untapped markets such as Japan and other countries. In addition, the recent shutdown of factories in China (a
largest market of Speciality chemical business) would help Indian players including Meghmani to increase
export business. Being one of the top leader in Indian pigment market (CPC Blue and green pigments) with
strong international presence and strong client lists, we believe the company to see better days ahead in
(capacity utilisation and better demand recovery) volumes and revenue growth (11% CAGR in FY15-FY18E).
Figure: Overall capacity, Sales volumes Figure: Revenue, EBITDA margin
Source: Company; IDBI Capital Research Source: Company; IDBI Capital Research
Table: Pigment (FY15) – Indian Peer matrix
Particulars (Rs mn) Capacity (tonnes) Revenues Revenue mix (%) EBITDA (%) ROCE (%)
Meghmani* 31,140 4,318 33 10.1 9.1
Sudarshan Chemical NA 9,628 89 12.2 23.3
Asahi Songwon 11,400 2,395 100 13.4 12.2
Source: Company; Annual Report; IDBI Capital Research;*Segmental; NA- Not Available
India, 18%
North America, 32%
Asia, 17%
S.America, 14%
Europe, 11%
Others, 8%
Beta, 39%
CPC, 28%
Pigment Green, 20%
Alpha, 11%
Others, 2%
24
42
0
25
08
0
20
34
0
30
54
0
31
14
0
31
14
0
31
14
0
31
14
0
13
,51
4
10
,24
0
9,5
56
10
,27
3
11
,62
2
13
,15
5
14
,31
6
15
,75
5
0
5000
10000
15000
20000
25000
30000
35000
FY11 FY12 FY13 FY14 FY15 FY16EFY17E FY18E
Installed capacity (MT) Volumes (MT)
14.5%
10.2%
8.2%
10.1%
15.0% 14.8%14.8%
0%
2%
4%
6%
8%
10%
12%
14%
16%
18%
0
1000
2000
3000
4000
5000
6000
7000
FY12 FY13 FY14 FY15 FY16E FY17E FY18E
Revenues (Rs mn) EBITDA margins (%)

Company Report – Meghmani Organics Ltd.
5
Pigment Industry
Global pigment industry (Organic, Inorganic, Speciality) is likely to grow by 4.5% (FY13-18E) to US$14.7 bn with an
estimated volumes of 4.4 mn tonnes while Asia-pacific market, which is growing fastest, would reach US$6.4 bn by
2018 (contributes 45% of world market). The rising demand for speciality pigments, the growing market for coatings
and paints, and the growth of the construction materials market would drive the pigment demand. Pigments play a
vital role in the global colorants market.
Table: Type of pigments and categories
Types Categories
Organic pigments Quinacridone, Phthalocyanine, and Azo
Inorganic pigments Chromium oxide, Carbon black, Cadmium pigments, Iron oxide pigments, and Titanium dioxide
Specialty pigments Thermochromic pigments, fluorescent pigments, metallic pigments, and light interference pigments
Source: Company; IDBI Capital Research
Diagram: Segmental information and usages
Source: Company; Industry Report, TMR; IDBI Capital Research
Most manufacturers in the global pigments market are focusing more towards developing eco-friendly and safe
chemicals. Some of the trends witnessed in dyes and pigments market are shifting of the manufacturing facilities
from U.S. and Europe to India, China.
Asia-Pacific accounts for almost half of global consumption of pigments already and is expected to increase its share
of the market even further. This region will continue to be the growth motor of the pigments industry, as China and
India in particular are substantially increasing demand for pigments. Eastern Europe, the Middle East and South
America will see demand rise by more than 3% p.a. each as well and thus contribute to the positive development of
the pigment industry. The rather saturated markets in Western Europe and North America will slowly return onto a
growth path after they suffered losses in the past couple of years.
The major driving factors of colorants market are growth in end user industries, rising demand for high performance
pigments (HPP), and rising preference towards environment-friendly products. Pigments have a large number of
applications ranging from paints & coatings, textile, construction, printing inks, and plastics. The paints & coatings
industry is recording significant growth due to growing infrastructure while the demand for printing ink is driven by
various factors such as technological developments and increasing demand for digital inks.
• Heat stability and light fastness are good
• Used in Printing Inks, Coatings, Plastics, Textiles, Leather PasteOrganic
• Less fastness properties & heat stability is less around 200 degree C.
• Used in Paints & Plastic IndustryInorganic
• Coating segment (Automotive paints) - Light fastness are superior
• Fibre grade plastic application where the heat stability and dispersionproperties should be superior then normal pigments.
Speciality

6
Company Report – Meghmani Organics Ltd.
India
The Indian pigments industry has transformed from being import dependent to an export driven industry.
Developed countries are now focusing on sourcing pigments from cost-effective Asian markets, owing to stringent
measures taken on environmental issues. Exports have grown in double digit over the last few years. Indian pigment
industry is growing at a healthy rate. The printing Inks, plastic and paint industry consumes over 90% of pigments.
The Indian paints & coating industry (a major pigment user) is expected to grow by 5.1% in FY13-18E while printing
Ink market has seen a 7.5% CAGR in the last decade. In India, it is the organics which are growing the fastest and,
traditionally, India has dominated in the green and blue colour space or the copper pthalocynines. India is clearly
the dominant player in the organic green pigments and a serious player in the blue pigments.
Figure: Indian – dyes & pigment industry at a glance
Source: Company; MOF; IDBI Capital Research
Table: Product-wise split of capacity between organized & unorganized market (MT)
Types of Pigments manufactured in India* Organised Unorganised Total
Phthalos
Blue 15 17,000 8,800 25,800
Green 7 8,000 4,700 12,700
CPC Blue 28,000 9,000 37,000
Azos 9,000 6,000 15,000
Pigments Violet 23 1,000 - 1,000
Source: Industry; IDBI Capital Research,*Approx. figures from various sources
Inorganic pigments segment is different story. In spite of having one of the world’s largest and high quality reserves
of limonite (from which one gets titanium dioxide pigment) in the coastal area of Kerala, Andhra and Orissa, the
country has failed to take the advantage. India has a reasonable capacity of the carbon black. The country still
produces chrome and lead based pigments, which are globally in the sunset phase for ecological reasons.
Specialty pigments market is expected to have fastest growth potential among the global pigments market.
Availability of large variety of products and ability to encompass high and unique visual effects is primarily fueling
the growth of the specialty pigments market. Specialty pigments are expected to be the most promising product
segment, and are estimated to grow at a CAGR of 6.6% (in Asia pacific v/s 4.7% globally) from 2013 to 2018. Under
growing regulatory pressure, specialty and organic pigments are being increasingly investigated for substitution
potential over their inorganic counterparts.
End user Industry and demand drivers: The main end users of pigments in India are printing inks, plastics, rubber,
paints and coatings. High performance pigments (HPP) and special effect pigments, such as metallic and
pearlescent, are used as automotive coatings and are currently a nascent market in India.
77% 80%
70%63% 64%
57% 56%62%
0%
20%
40%
60%
80%
100%
0
100
200
300
400
500
2007 2008 2009 2010 2011 2012 2013 2014
(000
tonn
es)
Capacity Production Imports Exports Utilisation (%)
Company Report – Meghmani Organics Ltd.
7
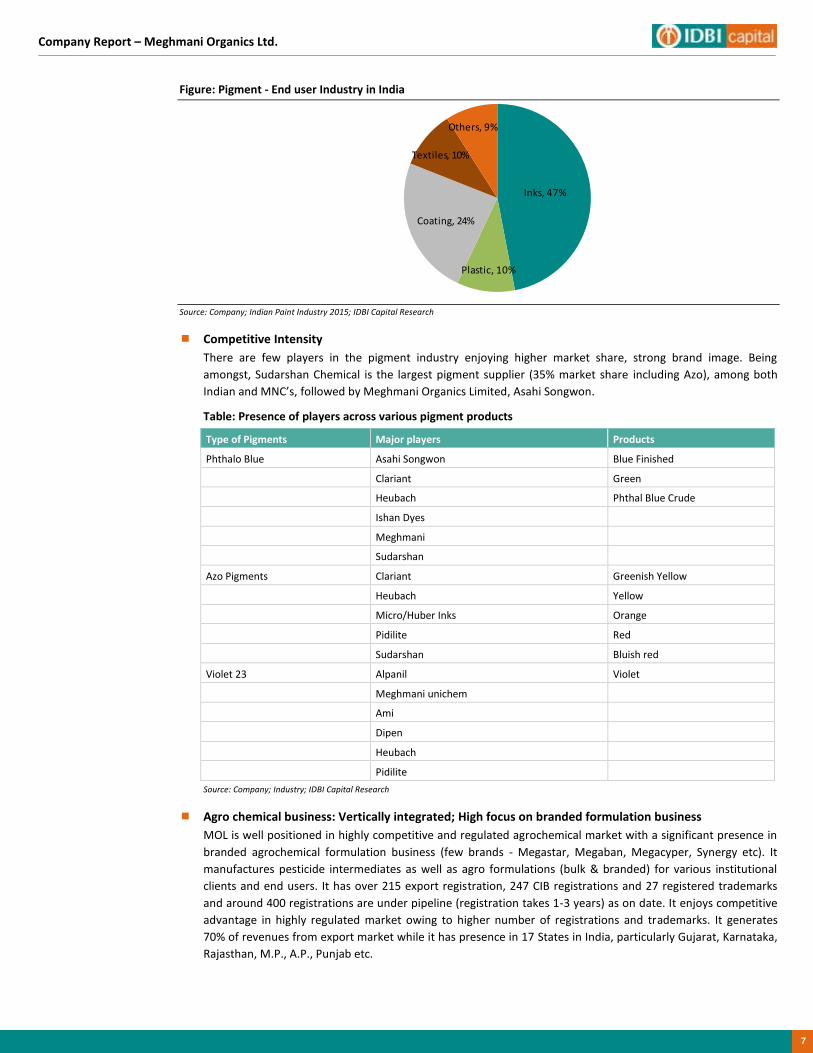
Figure: Pigment - End user Industry in India
Source: Company; Indian Paint Industry 2015; IDBI Capital Research
Competitive Intensity
There are few players in the pigment industry enjoying higher market share, strong brand image. Being
amongst, Sudarshan Chemical is the largest pigment supplier (35% market share including Azo), among both
Indian and MNC’s, followed by Meghmani Organics Limited, Asahi Songwon.
Table: Presence of players across various pigment products
Type of Pigments Major players Products
Phthalo Blue Asahi Songwon Blue Finished
Clariant Green
Heubach Phthal Blue Crude
Ishan Dyes
Meghmani
Sudarshan
Azo Pigments Clariant Greenish Yellow
Heubach Yellow
Micro/Huber Inks Orange
Pidilite Red
Sudarshan Bluish red
Violet 23 Alpanil Violet
Meghmani unichem
Ami
Dipen
Heubach
Pidilite
Source: Company; Industry; IDBI Capital Research
Agro chemical business: Vertically integrated; High focus on branded formulation business
MOL is well positioned in highly competitive and regulated agrochemical market with a significant presence in
branded agrochemical formulation business (few brands - Megastar, Megaban, Megacyper, Synergy etc). It
manufactures pesticide intermediates as well as agro formulations (bulk & branded) for various institutional
clients and end users. It has over 215 export registration, 247 CIB registrations and 27 registered trademarks
and around 400 registrations are under pipeline (registration takes 1-3 years) as on date. It enjoys competitive
advantage in highly regulated market owing to higher number of registrations and trademarks. It generates
70% of revenues from export market while it has presence in 17 States in India, particularly Gujarat, Karnataka,
Rajasthan, M.P., A.P., Punjab etc.
Inks, 47%
Plastic, 10%
Coating, 24%
Textiles, 10%
Others, 9%

8
Company Report – Meghmani Organics Ltd.
Table: Product categories & end users
Categories End users
Pesticide intermediates Technical grade pesticides manufacturers
Technical grade Pesticides formulators
Pesticide formulations Institutional customers , Retailers, Dealers, Farmers
Source: Company; IDBI Capital Research
Table: Plant location, Capacity and Product range
Location Year Capacity (MT) Utilisation rate (%) Products
Ankaleshwar 2003 6,660 61 Chlorpriphos and intermediates
Dahej 2010 8,940 58 Cypermethrin, MPB, Profenophos,2-4D
Panoli 2009 3,600 65 Agro formulations
Source: Company; IDBI Capital Research
In recent years, the performance was muted due to relocation of Chharodi plant to Dahej in FY12/FY13 (due to
intervention of Pollution Control Board) and lower capacity utilisation resulted in to 3% revenue CAGR in FY12-
15). However, post stabilization of new plant, pick up in capacity utilization resulted into double-digit revenue
growth in FY14 & FY15. At the same time, EBITDA margin improved from 9.2% (FY12) to 12.8% in FY15.
Figure: Revenue by country (FY15) Figure: Revenue by product (FY15)
Source: Company; IDBI Capital Research Source: Company; IDBI Capital Research
Being a vertically integrated player, it is now focusing to increase the exports and opportunities under CRAMS
segment. Under its formulation business, it has established significant presence through 1,000 stockiest and
strong distribution network and further aims to add 2,500 dealers’ network in branded formulation segment to
achieve revenue of Rs2,500 mn in the next 2-3 years (Current revenue Rs800 mn; EBITDA margin over 15%).
Improving capacity utilisation, healthy product-mix and the anticipation of better monsoon arrival (after two
consecutive droughts), we believe volumes to pick up at a faster rate (8% CAGR in FY15-18E v/s negative 7% in
FY12-15), which would drive revenue growth.
India, 30%
Europe, 7%
Africa, 6%
S.America, 6%
Others, 51%
Agro branded, 27%
Cypermethrin,20%
2,4 - D, 8%
Agro Bulk, 8%
Others, 37%

Company Report – Meghmani Organics Ltd.
9
Plant relocated
Figure: Overall capacity, Sales volumes Figure: Revenue, EBITDA margin
Source: Company; IDBI Capital Research Source: Company; IDBI Capital Research
Agro-chemical Industry: India is the 4th largest producer globally, generating 50% of revenue from export
revenue. The Indian crop protection industry is expected to grow at a 12% CAGR to US$7.5 bn by 2019 while
the export contribution is likely to increase over 60% over the same period (at a CAGR growth of 16%). Despite
the higher agriculture concentrated areas, the per capital consumption of pesticides is just 0.75 kg/ha in India
as against UK (5kg/ha), USA (7k/ha), Taiwan (17kg/ha) and China (13k/ha).
Figure: Low pesticides penetration in India Figure: Pesticides (Tech.) (in 000’ tonnes)
Source: Company; IDBI Capital Research Source: Company; IDBI Capital Research
Table: Peers group comparison
Name Capacity (MT) Utilisation
rate (FY15) Distributors Dealers
Domestic
revenue (%)
Export
revenue (%)
Meghmani Organics* 20,520 60% - 2,500 30% 70%
Dhanuka Around 57,000
(KL+Tonne) 70% 8,600 80,000 100 -
PI Industries NA NA 8,000 35,000 40 60
Rallis NA NA NA NA 72 28
Insecticides
17,450 KL
80% 5,000 60,000 100 -
75,600 MT
granules
13,800 MT
Bulk
16,980 MT
powder
Source: Company; Annual Report; Industry; IDBI Capital Research;*Segmental
27
,69
6
27
,69
6
26
,37
6
19
,20
0
20
,52
0
20
,52
0
20
,52
0
13
88
0
97
59
10
25
6
11
04
4
11
74
5
12
87
2
14
03
6
0
5,000
10,000
15,000
20,000
25,000
30,000
FY12 FY13 FY14 FY15 FY16E FY17E FY18E
Installed capacity (MT) Volumes (MT)
39
9
34
3
39
7
43
8
41
0
46
3
52
0
9.3%
5.5%
11.8%12.8%
15.0% 15.5% 15.8%
0%
2%
4%
6%
8%
10%
12%
14%
16%
18%
0
100
200
300
400
500
600
FY1
2
FY1
3
FY1
4
FY1
5
FY1
6E
FY1
7E
FY1
8E
Revenues (Rs mn) EBITDA margins (%)
0.75
5 5
7 7
1213
17
0
2
4
6
8
10
12
14
16
18
Ind
ia UK
Fran
ce
Ko
rea
USA
Jap
an
Ch
ina
Taiw
an
(kg/
ha)
76%81% 82%
73%
62% 63%56%
62%
0%
20%
40%
60%
80%
100%
0
100
200
300
400
20072008200920102011201220132014
(00
0' t
on
ne
s)
Capacity ProductionImports ExportsUtilisation (%)
10
Company Report – Meghmani Organics Ltd.
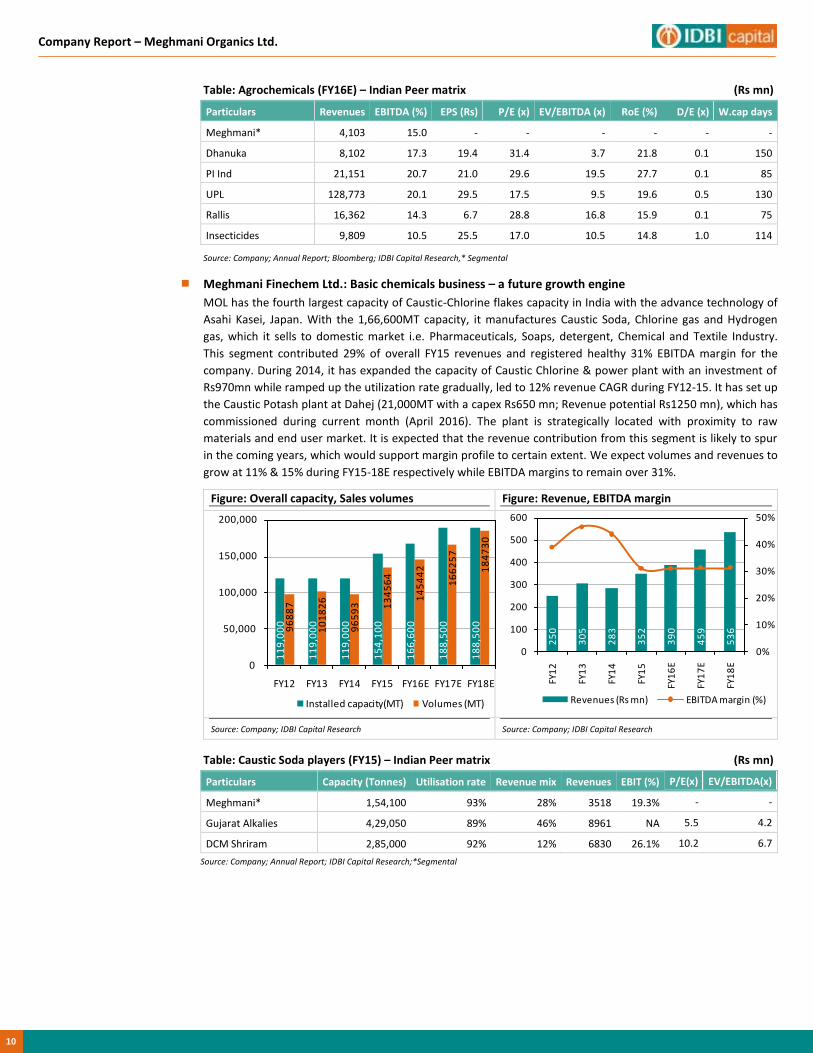
Table: Agrochemicals (FY16E) – Indian Peer matrix (Rs mn)
Particulars Revenues EBITDA (%) EPS (Rs) P/E (x) EV/EBITDA (x) RoE (%) D/E (x) W.cap days
Meghmani* 4,103 15.0 - - - - - -
Dhanuka 8,102 17.3 19.4 31.4 3.7 21.8 0.1 150
PI Ind 21,151 20.7 21.0 29.6 19.5 27.7 0.1 85
UPL 128,773 20.1 29.5 17.5 9.5 19.6 0.5 130
Rallis 16,362 14.3 6.7 28.8 16.8 15.9 0.1 75
Insecticides 9,809 10.5 25.5 17.0 10.5 14.8 1.0 114
Source: Company; Annual Report; Bloomberg; IDBI Capital Research,* Segmental
Meghmani Finechem Ltd.: Basic chemicals business – a future growth engine
MOL has the fourth largest capacity of Caustic-Chlorine flakes capacity in India with the advance technology of
Asahi Kasei, Japan. With the 1,66,600MT capacity, it manufactures Caustic Soda, Chlorine gas and Hydrogen
gas, which it sells to domestic market i.e. Pharmaceuticals, Soaps, detergent, Chemical and Textile Industry.
This segment contributed 29% of overall FY15 revenues and registered healthy 31% EBITDA margin for the
company. During 2014, it has expanded the capacity of Caustic Chlorine & power plant with an investment of
Rs970mn while ramped up the utilization rate gradually, led to 12% revenue CAGR during FY12-15. It has set up
the Caustic Potash plant at Dahej (21,000MT with a capex Rs650 mn; Revenue potential Rs1250 mn), which has
commissioned during current month (April 2016). The plant is strategically located with proximity to raw
materials and end user market. It is expected that the revenue contribution from this segment is likely to spur
in the coming years, which would support margin profile to certain extent. We expect volumes and revenues to
grow at 11% & 15% during FY15-18E respectively while EBITDA margins to remain over 31%.
Figure: Overall capacity, Sales volumes Figure: Revenue, EBITDA margin
Source: Company; IDBI Capital Research Source: Company; IDBI Capital Research
Table: Caustic Soda players (FY15) – Indian Peer matrix (Rs mn)
Particulars Capacity (Tonnes) Utilisation rate Revenue mix Revenues EBIT (%) P/E(x) EV/EBITDA(x)
Meghmani* 1,54,100 93% 28% 3518 19.3% - -
Gujarat Alkalies 4,29,050 89% 46% 8961 NA 5.5 4.2
DCM Shriram 2,85,000 92% 12% 6830 26.1% 10.2 6.7
Source: Company; Annual Report; IDBI Capital Research;*Segmental
11
9,0
00
11
9,0
00
11
9,0
00
15
4,1
00
16
6,6
00
18
8,5
00
18
8,5
00 96
88
7
10
18
26
96
59
3 13
45
64
14
54
42
16
62
57
18
47
30
0
50,000
100,000
150,000
200,000
FY12 FY13 FY14 FY15 FY16E FY17E FY18E
Installed capacity(MT) Volumes (MT)
25
0
30
5
28
3
35
2
39
0
45
9
53
6
0%
10%
20%
30%
40%
50%
0
100
200
300
400
500
600
FY1
2
FY1
3
FY1
4
FY1
5
FY1
6E
FY1
7E
FY1
8E
Revenues (Rs mn) EBITDA margin (%)

Company Report – Meghmani Organics Ltd.
11
Indian basic chemical Industry
Global Chlor-Alkali industry is expected to grow by 6% CAGR in FY2014-19 (volumes to grow from 193 mn MT to
224mn MT). Asia-Pacific is the largest world market in which China is the leading consumer. Though India is growing
at a faster pace with the capacity utilisation rate of 78%, it is still behind China with just 4% of world Caustic Soda
capacity and 6% of Soda Ash capacity (v/s China of 35% & 40% respectively). Indian market is highly influenced by
Caustic Soda against International market of Chlorine based chemicals. Indian alkali based chemical (Soda Ash+
Caustic Soda+ Chlorine) Industry is expected to grow by 7% CAGR in FY2014-19E.
Gujarat is the largest manufacturer of Caustic soda (35% of total capacity). As per the data, India has a nearly
3.43mn tonnes of installed capacity with over 80% utilisation rate (almost fully operated). As the consumption
exceeds production limit, 10-12% of required Caustic soda has been imported currently. The largest user industries
are Pulp & Paper, Pharma, Alumina, Soaps, detergents and chemical industry.
Figure: Alkali based chemical - matrix Figure: Production mix trend (FY14)
Source: Company; MOF; IDBI Capital Research Source: Company; MOF; IDBI Capital Research
Figure: Crude Oil vs Indian Caustic Soda Index
Source: Company; Bloomberg; IDBI Capital Research
Strong internal competencies; healthy product pipeline: MOL is actively engaged in the development of new process technologies for its well equipped state-of-the-art R&D facilities. The focus is on to expand range of specialty products and move towards higher value-added products in the agrochemical by establishing strong supply chain to widen the reach. Moreover, the healthy product folios (400 registrations in pipeline in agrochemical) and continuous product innovation would remain the Key focus area going forward.
Deleveraging B/S + Margin expansion = Strong earnings visibility
In recent years, MOL has pass through a rough patch due to (1) Major capex cycle (total capex of Rs3,550 mn in
FY12-15) (2) Stressed balance-sheet (3) Lower capacity utilisation. Though MOL was under major capex cycle in
recent years, it managed to reduce the debt level (from 1.6x to 1.2x in FY15) and improved the working capital
cycle. Going forward, better capacity utilization, low raw material costs and margin expansion along with the
further debt reduction (targeting to repay Rs1000mn every year) would lead to a healthy earnings growth
(CAGR of 41% in FY15-18E).
409499 511
868
630 658
995874
0
200
400
600
800
1,000
1,200
0
2,000
4,000
6,000
8,000
10,000
20072008200920102011201220132014
(00
0' t
on
ne
s)
Capacity ProductionExports Utilisation (%)Imports
Soda Ash2,392 (38%)
Caustic Soda2,277 (36%)
Chlorine1,596 (26%)
160
165
170
175
180
185
190
195
200
0
20
40
60
80
100
120
Ap
r-1
3
May
-13
Jun
-13
Jul-
13
Au
g-1
3
Sep
-13
Oct
-13
No
v-1
3
De
c-1
3
Jan
-14
Feb
-14
Mar
-14
Ap
r-1
4
May
-14
Jun
-14
Jul-
14
Au
g-1
4
Sep
-14
Oct
-14
No
v-1
4
De
c-1
4
Jan
-15
Feb
-15
Mar
-15
Ap
r-1
5
May
-15
Jun
-15
Jul-
15
Au
g-1
5
Sep
-15
Oct
-15
No
v-1
5
De
c-1
5
Jan
-16
Feb
-16
Mar
-16
(US$
/b)
Crude oil (LHS) Indian Wholesale Price Index (Caustic Soda)

12
Company Report – Meghmani Organics Ltd.
Figure: D/E and Interest coverage ratio trend Figure: Adjusted PAT and margin trend
Source: Company; IDBI Capital Research Source: Company; IDBI Capital Research
Major capex overdone; time to encash it
We see significant uptick in the return ratios (18% RoE in FY18E; nearly 2x jump) from 8.2% (FY15) while with no
major capex (Rs1,210 mn), margin expansion and healthy earnings, the FCF is likely to improve substantially
(nearly Rs3,500 mn) in FY16E-18E. These would not only enable the company to pare its debt level but also
provide a significant cash cushion (improvement in financial health) in the coming years.
Figure: Capex v/s FCF Figure: Return ratios
Source: Company; IDBI Capital Research Source: Company; IDBI Capital Research
1.61.5 1.5
1.2
1.0
0.80.6
1.7 1.7 1.7
3.2
4.0
5.2 5.2
0
1
2
3
4
5
6
0.0
0.2
0.4
0.6
0.8
1.0
1.2
1.4
1.6
1.8
FY12 FY13 FY14 FY15 FY16E FY17E FY18E
D/E Interest coverage ratio
34
18
2
23
3 44
1
80
6
94
1
1,2
27
0%
1%
2%
3%
4%
5%
6%
7%
8%
0
200
400
600
800
1,000
1,200
1,400
FY1
2
FY1
3
FY1
4
FY1
5
FY1
6E
FY1
7E
FY1
8E
(Rs
mn
)
Adj. net profit Margin (%)
1,0
88
1,0
86
78
0
60
0
40
0
37
8
43
3
1,3
05
2,0
53
1,3
62
2,5
21
1,5
92
1,3
78
1,7
43
78
1
1,1
23
87
5
1,9
13
1,1
92
1,0
00
1,3
11
0
500
1,000
1,500
2,000
2,500
3,000
FY12 FY13 FY14 FY15 FY16E FY17E FY18E
Capex (Rs mn) OCF (Rs mn) FCF (Rs mn)
1% 4%5%
8%
14% 15%
18%
6%
8% 8% 9%
16%
18%
22%
0%
5%
10%
15%
20%
25%
FY12 FY13 FY14 FY15 FY16E FY17E FY18E
ROE ROCE
Company Report – Meghmani Organics Ltd.
13
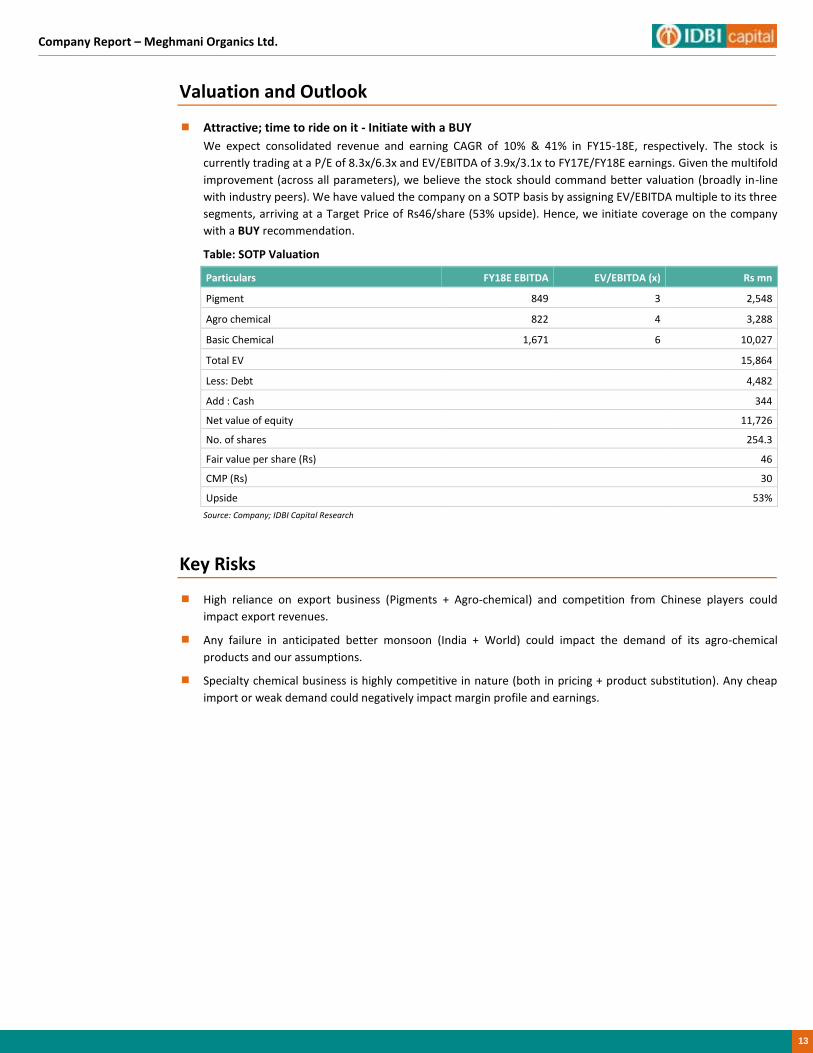
Valuation and Outlook
Attractive; time to ride on it - Initiate with a BUY
We expect consolidated revenue and earning CAGR of 10% & 41% in FY15-18E, respectively. The stock is
currently trading at a P/E of 8.3x/6.3x and EV/EBITDA of 3.9x/3.1x to FY17E/FY18E earnings. Given the multifold
improvement (across all parameters), we believe the stock should command better valuation (broadly in-line
with industry peers). We have valued the company on a SOTP basis by assigning EV/EBITDA multiple to its three
segments, arriving at a Target Price of Rs46/share (53% upside). Hence, we initiate coverage on the company
with a BUY recommendation.
Table: SOTP Valuation
Particulars FY18E EBITDA EV/EBITDA (x) Rs mn
Pigment 849 3 2,548
Agro chemical 822 4 3,288
Basic Chemical 1,671 6 10,027
Total EV 15,864
Less: Debt
4,482
Add : Cash
344
Net value of equity
11,726
No. of shares 254.3
Fair value per share (Rs) 46
CMP (Rs)
30
Upside 53%
Source: Company; IDBI Capital Research
Key Risks
High reliance on export business (Pigments + Agro-chemical) and competition from Chinese players could
impact export revenues.
Any failure in anticipated better monsoon (India + World) could impact the demand of its agro-chemical
products and our assumptions.
Specialty chemical business is highly competitive in nature (both in pricing + product substitution). Any cheap
import or weak demand could negatively impact margin profile and earnings.

14
Company Report – Meghmani Organics Ltd.
About the Company
Meghmani Organics Ltd. (MOL), a part of the Meghmani group, is a well diversified chemical company manufacturing
pigments, agro-chemical and basic chemical products. It has pan India presence through stockiest, distributors and
international market (presence over 75 countries) through extensive network of 70 overseas distributors. It serves to
400+ customers through subsidiaries in the US, Europe, Indonesia and Dubai. Export constitutes approximately 57%
of overall revenues.
Company at glance
Diagram: History so far…
Source: Company; IDBI Capital Research
Figure: Revenue mix (FY15)
Segment-wise Region-wise
Source: Company; IDBI Capital Research
1986
1995
1996 -1999
2004-2008
2009
2014
2015
Incorporationof the company.
Started business operations
Converted into Public Ltd. Co.
Set up 1st Agro plant
1996 : New pigment plant, Panoli
1997: PE investment in MOL.1999: Started
blue pigment production
2004: Acquisition of Agro-chem
business from Rallis2007: Established
MFL with IFC
Started production facility of
Agro business andSet up 2 new plants at
Panoli, Dahej
Greenfield plant at Dahej SEZ
for pigments.Expansion of Caustic-Chlorine
facility
Venturedinto Caustic Potash
business by setting up plan at Dahej with a capex
of Rs650 mn
Pigments, 33%
Agrochemicals, 35%
Basic Chemicals,
28%
Others, 4%
Domestic, 43%Export, 57%
Company Report – Meghmani Organics Ltd.
15
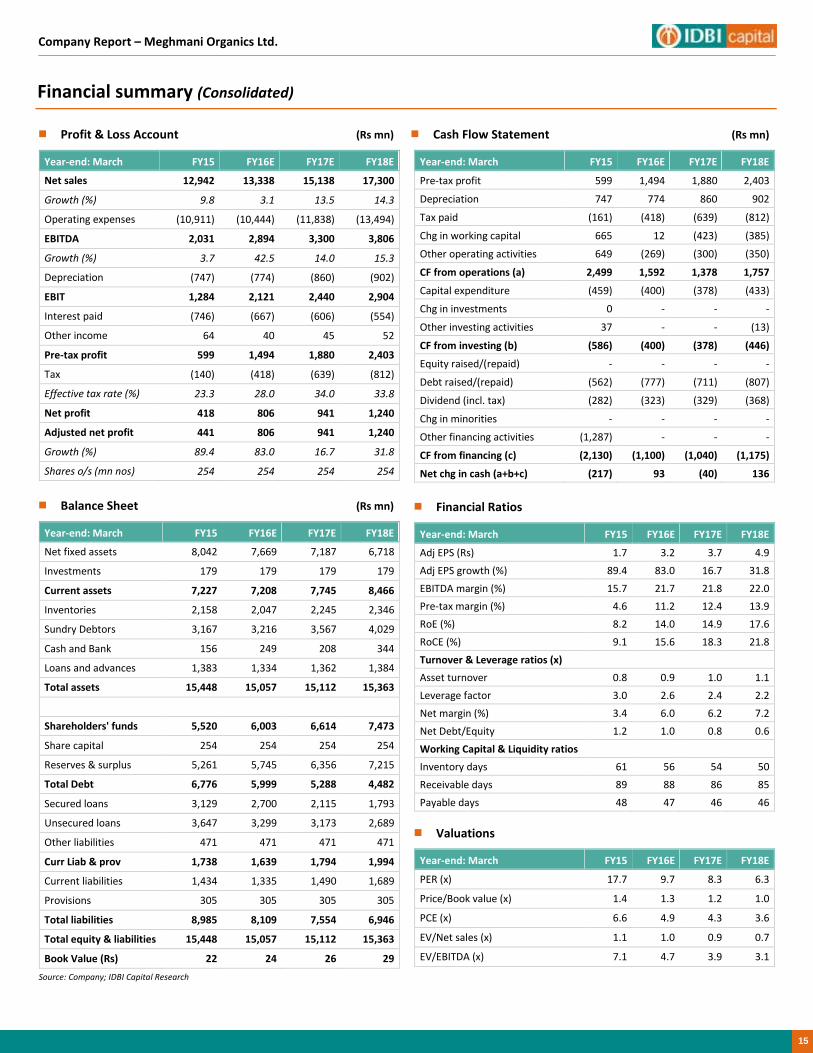
Financial summary (Consolidated)
Profit & Loss Account (Rs mn)
Year-end: March FY15 FY16E FY17E FY18E
Net sales 12,942 13,338 15,138 17,300
Growth (%) 9.8 3.1 13.5 14.3
Operating expenses (10,911) (10,444) (11,838) (13,494)
EBITDA 2,031 2,894 3,300 3,806
Growth (%) 3.7 42.5 14.0 15.3
Depreciation (747) (774) (860) (902)
EBIT 1,284 2,121 2,440 2,904
Interest paid (746) (667) (606) (554)
Other income 64 40 45 52
Pre-tax profit 599 1,494 1,880 2,403
Tax (140) (418) (639) (812)
Effective tax rate (%) 23.3 28.0 34.0 33.8
Net profit 418 806 941 1,240
Adjusted net profit 441 806 941 1,240
Growth (%) 89.4 83.0 16.7 31.8
Shares o/s (mn nos) 254 254 254 254
Balance Sheet (Rs mn)
Year-end: March FY15 FY16E FY17E FY18E
Net fixed assets 8,042 7,669 7,187 6,718
Investments 179 179 179 179
Current assets 7,227 7,208 7,745 8,466
Inventories 2,158 2,047 2,245 2,346
Sundry Debtors 3,167 3,216 3,567 4,029
Cash and Bank 156 249 208 344
Loans and advances 1,383 1,334 1,362 1,384
Total assets 15,448 15,057 15,112 15,363
Shareholders' funds 5,520 6,003 6,614 7,473
Share capital 254 254 254 254
Reserves & surplus 5,261 5,745 6,356 7,215
Total Debt 6,776 5,999 5,288 4,482
Secured loans 3,129 2,700 2,115 1,793
Unsecured loans 3,647 3,299 3,173 2,689
Other liabilities 471 471 471 471
Curr Liab & prov 1,738 1,639 1,794 1,994
Current liabilities 1,434 1,335 1,490 1,689
Provisions 305 305 305 305
Total liabilities 8,985 8,109 7,554 6,946
Total equity & liabilities 15,448 15,057 15,112 15,363
Book Value (Rs) 22 24 26 29
Source: Company; IDBI Capital Research
Cash Flow Statement (Rs mn)
Year-end: March FY15 FY16E FY17E FY18E
Pre-tax profit 599 1,494 1,880 2,403
Depreciation 747 774 860 902
Tax paid (161) (418) (639) (812)
Chg in working capital 665 12 (423) (385)
Other operating activities 649 (269) (300) (350)
CF from operations (a) 2,499 1,592 1,378 1,757
Capital expenditure (459) (400) (378) (433)
Chg in investments 0 - - -
Other investing activities 37 - - (13)
CF from investing (b) (586) (400) (378) (446)
Equity raised/(repaid) - - - -
Debt raised/(repaid) (562) (777) (711) (807)
Dividend (incl. tax) (282) (323) (329) (368)
Chg in minorities - - - -
Other financing activities (1,287) - - -
CF from financing (c) (2,130) (1,100) (1,040) (1,175)
Net chg in cash (a+b+c) (217) 93 (40) 136
Financial Ratios
Year-end: March FY15 FY16E FY17E FY18E
Adj EPS (Rs) 1.7 3.2 3.7 4.9
Adj EPS growth (%) 89.4 83.0 16.7 31.8
EBITDA margin (%) 15.7 21.7 21.8 22.0
Pre-tax margin (%) 4.6 11.2 12.4 13.9
RoE (%) 8.2 14.0 14.9 17.6
RoCE (%) 9.1 15.6 18.3 21.8
Turnover & Leverage ratios (x)
Asset turnover 0.8 0.9 1.0 1.1
Leverage factor 3.0 2.6 2.4 2.2
Net margin (%) 3.4 6.0 6.2 7.2
Net Debt/Equity 1.2 1.0 0.8 0.6
Working Capital & Liquidity ratios
Inventory days 61 56 54 50
Receivable days 89 88 86 85
Payable days 48 47 46 46
Valuations
Year-end: March FY15 FY16E FY17E FY18E
PER (x) 17.7 9.7 8.3 6.3
Price/Book value (x) 1.4 1.3 1.2 1.0
PCE (x) 6.6 4.9 4.3 3.6
EV/Net sales (x) 1.1 1.0 0.9 0.7
EV/EBITDA (x) 7.1 4.7 3.9 3.1

16
Company Report – Meghmani Organics Ltd.
Notes
Dealing (91-22) 6637 1150 [email protected]
Key to Ratings
Stocks:
BUY: Absolute return of 15% and above; ACCUMULATE: 5% to 15%; HOLD: Upto ±5%; REDUCE: -5% to -15%; SELL: -15% and below.
IDBI Capital Market Services Ltd. (A wholly owned subsidiary of IDBI Bank Ltd.) Equity Research Desk
3rd Floor, Mafatlal Centre, Nariman Point, Mumbai – 400 021. Phones: (91-22) 4322 1212; Fax: (91-22) 2285 0785; Email: [email protected]
SEBI Registration: BSE & NSE (Cash & FO) – INZ000007237, NSDL – IN-DP-NSDL-12-96, Research – INH000002459, CIN – U65990MH1993GOI075578
Compliance Officer: Christina D’souza; Email: [email protected]; Telephone: (91-22) 4322 1212 Disclaimer This document has been prepared by IDBI Capital Market Services Ltd (IDBI Capital) and is meant for the recipient only for use as intended and not for circulation. This document should not be
reproduced or copied or made available to others. No person associated with IDBI Capital is obligated to call or initiate contact with you for the purposes of elaborating or following up on the
information contained in this document.
Recipients may not receive this report at the same time as other recipients. IDBI Capital will not treat recipients as customers by virtue of their receiving this report.
The information contained herein is from the public domain or sources believed to be reliable. While reasonable care has been taken to ensure that information given is at the time believed to be
fair and correct and opinions based thereupon are reasonable, due to the very nature of research it cannot be warranted or represented that it is accurate or complete and it should not be relied
upon as such. In so far as this report includes current or historical information, it is believed to be reliable, although its accuracy and completeness cannot be guaranteed.
Opinions expressed are current opinions as of the date appearing on this material only. While we endeavor to update on a reasonable basis, the information discussed in this material, IDBI Capital,
its directors, employees are under no obligation to update or keep the information current. Further there may be regulatory, compliance, or other reasons that prevent us from doing so.
Prospective investors and others are cautioned that any forward-looking statements are not predictions and may be subject to change without notice.
IDBI Capital, its directors and employees and any person connected with it, will not in any way be responsible for the contents of this report or for any losses, costs, expenses, charges, including
notional losses/lost opportunities incurred by a recipient as a result of acting or non acting on any information/material contained in the report.
This is not an offer to sell or a solicitation to buy any securities or an attempt to influence the opinion or behaviour of investors or recipients or provide any investment/tax advice.
This report is for information only and has not been prepared based on specific investment objectives. The securities discussed in this report may not be suitable for all investors. Investors must
make their own investment decision based on their own investment objectives, goals and financial position and based on their own analysis.
Trading in stocks, stock derivatives, and other securities is inherently risky and the recipient agrees to assume complete and full responsibility for the outcomes of all trading decisions that the
recipient makes, including but not limited to loss of capital.
Opinions, projections and estimates in this report solely constitute the current judgment of the author of this report as of the date of this report and do not in any way reflect the views of IDBI
Capital, its directors, officers, or employees.
This report is not directed or intended for distribution to, or use by, any person or entity who is a citizen or resident of or located in any locality, state, country or other jurisdiction, where such
distribution, publication, availability or use would be contrary to law, regulation or which would subject IDBI Capital and affiliates to any registration or licensing requirement within such
jurisdiction. The securities described herein may or may not be eligible for sale in all jurisdictions or to certain category of investors. Persons in whose possession this document may come are
required to inform themselves of and to observe such restriction.
IDBI Capital, its directors or employees or affiliates, may from time to time, have positions in, or options on, and buy and sell securities referred to herein. IDBI Capital or its affiliates, during the
normal course of business, from time to time, may solicit from or perform investment banking or other services for any company mentioned in this document or their connected persons or be
engaged in any other transaction involving such securities and earn brokerage or other compensation or act as a market maker in the financial instruments of the company(ies) discussed herein or
their affiliate companies or act as advisor or lender / borrower to such company(ies)/affiliate companies or have other potential conflict of interest.
This report may provide hyperlinks to other websites. Except to the extent to which the report refers to the website of IDBI Capital, IDBI Capital states that it has not reviewed the linked site and
takes no responsibility for the content contained in such other websites. Accessing such websites shall be at recipient's own risk.
E-mail is not a secure method of communication. IDBI Capital Market Services Limited cannot accept responsibility for the accuracy or completeness of any e-mail message or any attachment(s).
This transmission could contain viruses, be corrupted, destroyed, incomplete, intercepted, lost or arrive late. IDBI Capital, its directors or employees or affiliates accept no liability for any damage
caused, directly or indirectly, by this email.

Company Report – Meghmani Organics Ltd.
17
Disclosures
I, Umesh Patel, certify that (1) the views expressed in this report accurately reflect my personal views about all of the subject companies and securities and (2) no part of my compensation was, is
or will be directly or indirectly related to the specific recommendations or views expressed in this report
IDBI Capital Market Services Limited (“IDBI Capital”) and its associates (IDBI Capital is a wholly owned subsidiary of IDBI Bank Ltd. IDBI Asset Management Ltd., IDBI MF Trustee Company Ltd. and
IDBI Intech Ltd.) are a full-service, banking, integrated investment banking, investment management, brokerage and financing group. We along with our affiliates are leading underwriter of
securities and participants in virtually all securities trading markets in India. We and our affiliates have investment banking and other business relationships with a significant percentage of the
companies covered by our Research Department. Investors should assume that IDBI Capital and/or its affiliates are seeking or will seek investment banking or other business from the company or
companies that are the subject of this material. IDBI Capital generally prohibits its analysts, persons reporting to analysts, and their dependant family members having a financial conflict of
interest in the securities or derivatives of any companies that the analysts cover. Additionally, IDBI Capital Market Services Limited generally prohibits its analysts and persons reporting to analysts
from serving as an officer, director, or advisory board member of any companies that the analysts cover. Our salespeople, traders, and other professionals may provide oral or written market
commentary or trading strategies to our clients that reflect opinions that are contrary to the opinions expressed herein, and our proprietary trading and investing businesses may make investment
decisions that are inconsistent with the recommendations expressed herein. In reviewing these materials, you should be aware that any or all of the foregoing, among other things, may give rise
to real or potential conflicts of interest. Additionally, other important information regarding our relationships with the company or companies that are the subject of this material is provided
herein.
This material should not be construed as an offer to sell or the solicitation of an offer to buy any security in any jurisdiction where such an offer or solicitation would be illegal. We are not soliciting
any action based on this material. It is for the general information of clients of IDBI Capital. It does not constitute a personal recommendation or take into account the particular investment
objectives, financial situations, or needs of individual clients. Before acting on any advice or recommendation in this material, clients should consider whether it is suitable for their particular
circumstances and, if necessary, seek professional advice. The price and value of the investments referred to in this materia l and the income from them may go down as well as up, and investors
may realize losses on any investments. Past performance is not a guide for future performance, future returns are not guaranteed and a loss of original capital may occur.
We and our affiliates, officers, directors, and employees, including persons involved in the preparation or issuance of this material, may from time to time have “long” or “short” positions in, act as
principal in, and buy or sell the securities or derivatives thereof of companies mentioned herein. For the purpose of calculating whether IDBI Capital Market Services Limited and its affiliates holds
beneficially owns or controls, including the right to vote for directors, 1% of more of the equity shares of the subject issuer of a research report, the holdings does not include accounts managed
by IDBI Asset Management Company/ IDBI Mutual Fund.
IDBI Capital Market Services Limited established in 1993, is a wholly owned subsidiary of IDBI Bank Limited. IDBI Capital Market Services Limited is one of India’s leading brokerage and distribution
house.
IDBI Capital Market Services Limited is a corporate trading and clearing member of Bombay Stock Exchange Limited (BSE), National Stock Exchange of India Limited (NSE), and a dealer of the OTC
Exchange of India (OTCEI) and is also a SEBI registered Merchant Banker and Portfolio Manager. Our businesses include stock broking, services rendered in connection with distribution of primary
market issues and financial products like merchant banking, depository services and Portfolio Management.
IDBI Capital Market Services Limited is also a depository participant with National Securities Depository Limited (NSDL) and is also a Mutual Fund Advisor registered with Association of Mutual
Funds in India (AMFI)
We hereby declare that our activities were neither suspended nor we have materially defaulted with any stock exchange authority with whom we are registered in last five years. However SEBI,
Exchanges and Depositories have conducted the routine inspection and based on their observations have issued advise letters or levied minor penalty on IDBI Capital for certain operational
deviations. We have not been debarred from doing business by any Stock Exchange / SEBI or any other authorities; nor has our certificate of registration been cancelled by SEBI at any point of
time.
We offer our research services to primarily institutional investors and their employees, directors , fund managers, advisors who are registered with us.
The Research Analyst has not served as an officer, director or employee of Subject Company.
We or our associates may have received compensation from the subject company in the past 12 months. We or our associates may have managed or co-managed public offering of securities for
the subject company in the past 12 months. We or our associates may have received compensation for investment banking or merchant banking or brokerage services from the subject company
in the past 12 months. We or our associates may have received any compensation for products or services other than investment banking or merchant banking or brokerage services from the
subject company in the past 12 months. We or our associates may have received any compensation or other benefits from the Subject Company or third party in connection with the research
report.
Research Analyst or his/her relative’s may have financial interest in the subject company. IDBI Capital Market Services Limited or its associates may have financial interest in the subject company.
Research Analyst or his/her relatives does not have actual/beneficial ownership of 1% or more securities of the subject company at the end of the month immediately preceding the date of
publication of Research Report : IDBI Capital Market Services Limited or its associates may have actual/beneficial ownership of 1% or more securities of the subject company at the end of the
month immediately preceding the date of publication of Research Report. The Subject Company may have been a client during twelve months preceding the date of distribution of the research
report.
Price history of the daily closing price of the securities covered in this note is available at nseindia.com and economictimes.indiatimes.com/markets/stocks/stock-quotes.