megatrends - cipd the professional body for … #megatrends 4 turnover, as a measure of employees...
TRANSCRIPT

WORKFORCEWORK WORKPLACE
WORKFORCEWORK WORKPLACE
WORKFORCE
WORK
WORKPLACE
Has job turnover slowed down?
The trends shaping work and working lives
MEGATRENDS

Championing better work and working lives
The CIPD’s purpose is to champion better work and working lives by improving practices in people and organisation development, for the benefit of individuals, businesses, economies and society. Our research work plays a critical role – providing the content and credibility for us to drive practice, raise standards and offer advice, guidance and practical support to the profession. Our research also informs our advocacy and engagement with policy-makers and other opinion-formers on behalf of the profession we represent.
To increase our impact, in service of our purpose, we’re focusing our research agenda on three core themes: the future of work, the diverse and changing nature of the workforce, and the culture and organisation of the workplace.
About us
The CIPD is the professional body for HR and people development. We have over 130,000 members internationally – working in HR, learning and development, people management and consulting across private businesses and organisations in the public and voluntary sectors. We are an independent and not-for-profit organisation, guided in our work by the evidence and the front-line experience of our members.
WORKOur focus on work includes what work is and where, when and how work takes place, as well as trends and changes in skills and job needs, changing career patterns, global mobility, technological developments and new ways of working.
WORKPLACEOur focus on the workplace includes how organisations are evolving and adapting, understanding of culture, trust and engagement, and how people are best organised, developed, managed, motivated and rewarded to perform at their best.
WORKFORCEOur focus on the workforce includes demographics, generational shifts, attitudes and expectations, the
changing skills base and trends in learning and education.
cipd.co.uk/megatrends
#megatrends
1MEGATRENDS The trends shaping work and working lives
In our recent Megatrends publication, we set out some of the big economic and social trends that have helped to shape work and working life in recent decades, such as de-industrialisation and demographic change. While the future is uncertain, it seems likely that many of these trends will continue to have an impact for years or even decades to come. Equally, past trends can stop having an impact – or even go into reverse – and new trends will emerge.
In this turbulent and changing environment, organisations need to be agile – to spot changing trends affecting them, work out how to respond to them and by doing so make them work to their benefit and thus maintain an advantage over the competition.
In Megatrends, we identified four potential emerging trends – issues where the data suggest there might have been a shift in practice, attitudes or outcomes that would have a significant impact on work and working lives. However, precisely because these are relatively new developments, it is still unclear whether these really are new trends or whether they are short-term disturbances to established patterns due to factors such as the economic difficulties that the UK and many other countries have faced in recent years.
In this series of publications, we take each of these four potential emerging trends and review the relevant evidence, discuss the competing explanations and explore the implications for work and working lives – including for business, for HR practice and for policy-makers. The aim is to draw the attention of our stakeholders to these issues, present the relevant facts and provide a platform for further discussion.
Our first publication considers the bread-and-butter issue of staff turnover, an important metric for all organisations. For a long time we have seen predictions of the end of the ’job for life’ – to the extent this ever
existed in the UK. Working lives have been expected to involve more frequent changes of employer, industry, occupation, possibly even employment status (with changes between working as an employee and as a freelance or contractor, for example). This would happen because of changes in the nature of work (such as technological change meaning that skills became outmoded more quickly), the workforce (more women in the workforce meaning more diverse career patterns) and the workplace (a retreat of trade union power giving more organisations freedom to restructure their workforce).
The evidence reviewed in this publication, however, suggests a degree of stability in the UK jobs market. While self-employment has increased in the last 30 years, some four-fifths of people working in the UK are still permanent employees. In addition, the average period of time people spend with an employer did not shift greatly between the mid-1970s and the mid-2000s, albeit with some changes within the overall average.
Furthermore, our evidence suggests that job turnover in the UK has been falling over the past decade – meaning that fewer people change employers each year. Is this a new feature of the labour market or is it due to economic conditions? Are there other factors at work? And what are the implications for business, HR practice and policy-makers? In this publication, we provide more evidence on these issues as the basis for a strategic conversation. We encourage every reader to say what you think.
Has job turnover slowed down?
Chief Executive, CIPD
MEGATRENDSForeword

2cipd.co.uk/megatrends #megatrends
Summary of key findings
• InthethreemonthsfromOctobertoDecember2012, according to the Labour Force Survey, 2.6% of employees left their job. This consisted of 1% leaving their job involuntarily (through redundancy or dismissal) and 1.6% leaving their job voluntarily (through resignation, retirement or for other reasons).
• Onthismeasure,turnoverpeakedin1998at4.5%anddeclinedgraduallyovertheperiod1998to2007beforefallingsharplyin2008and2009andlevellingoff subsequently. This trend is almost entirely due to falling voluntary turnover. Employer-based measures also show a decline in turnover since the mid-2000s.
• Anumberofstudiessuggestthattheaverageamountof time people spend with an employer – average job tenure – did not shift greatly between the mid-1970s and the mid-2000s. Average job tenure appears to have increased slightly in recent years – consistent with falling job turnover.
• AveragejobtenureintheUKisamongthelowestinthe OECD.
• Economicconditionsarelikelytobethemainreasonwhyturnoverhasfallensince2008–moreemployees‘sit tight’ in their jobs because finding a suitable new job might prove difficult. However, this does not explain why job turnover was falling pre-recession.
• Theevidencesuggeststhatchangeswithintheworkplaceoverthelast10to15yearsmayalsoexplain falling job turnover. These include changes to occupational pension arrangements increasing the cost of job exit for some employees and increases in overall job satisfaction and employee engagement – as dissatisfied and disengaged employees are most likely to say they are looking for another job. Employmentlegislationintroducedsince1998–suchas the National Minimum Wage – may have played a supporting role.
• Wewouldexpectimprovinglabourmarketconditions– such as a significant increase in job vacancies – to lead to an increase in job turnover compared to current levels.
• Populationageingislikelytohaveanegativeimpacton turnover for the remainder of this decade – so it is quite possible that turnover will remain at historically low levels.
• Greaterworkforcestabilitywillbeseenbymanyorganisations as a potential benefit – more experienced staff with greater knowledge increases the potential return on investment in people.
• However,lessemployeeturnovermeansfewerpeopleseeking new employment and there may be challenges for organisations in maintaining their talent pipelines.
• Organisationswillalsofacechallengesinhowtheyensure long(er)-serving employees remain engaged and up to date with business practice – and how they can access sufficient new thinking to drive forward innovation.
3MEGATRENDS The trends shaping work and working lives
What does the evidence say?
When discussing the evidence on ‘job turnover’, there is an important caveat we have to bear in mind. Virtually all of the available data on job separations, job tenure and job turnover refer to spells of time spent with a single employer and do not differentiate between different jobs performed by the individual for a single employer. Someone employed in a large company could have numerouschangesofrole(even,forexample,a40-yearcareer running from sales assistant to sales manager to operations director to CEO) but most data would record that as a single employment spell or a single ‘job’. One UK study that attempts to capture job changes within a single employmentspellovertheperiod1975to2010foundthatabout85%ofindividuals’spellswithaparticularemployer did not involve an internal job move with, in contrast, about 3% of such spells involving three or more jobs with the same employer.1
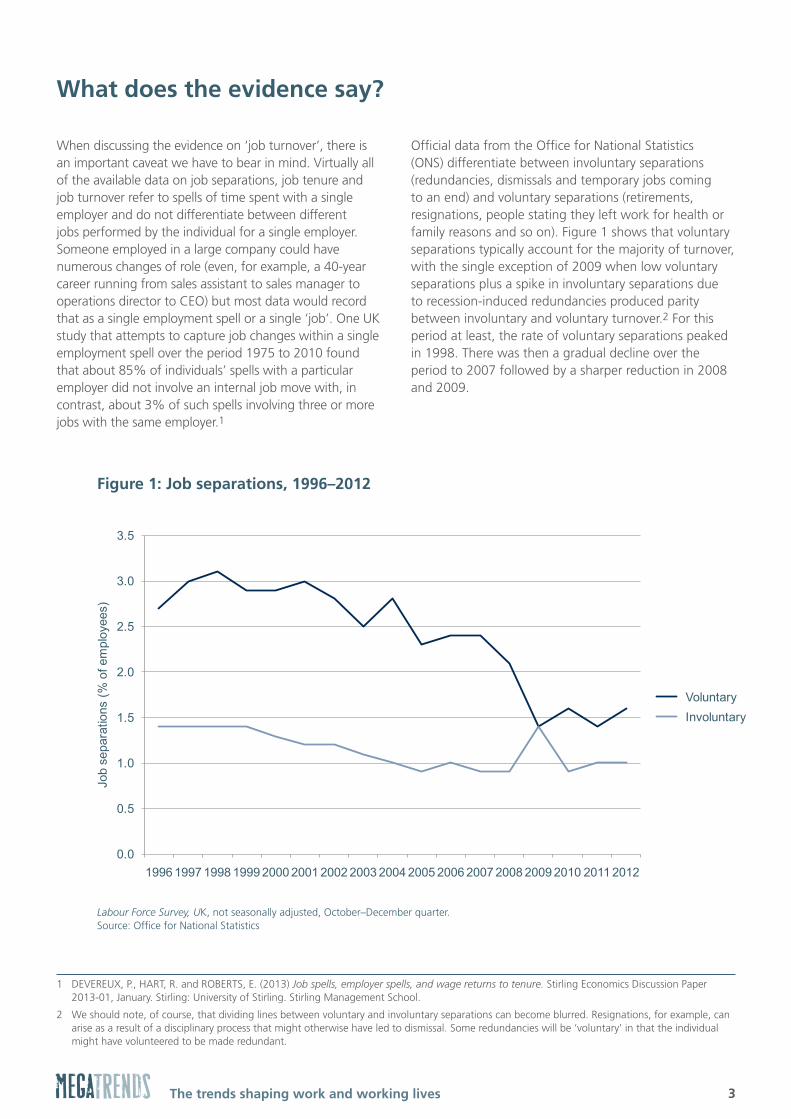
Official data from the Office for National Statistics (ONS) differentiate between involuntary separations (redundancies, dismissals and temporary jobs coming to an end) and voluntary separations (retirements, resignations, people stating they left work for health or family reasons and so on). Figure 1 shows that voluntary separations typically account for the majority of turnover, with the single exception of 2009 when low voluntary separations plus a spike in involuntary separations due to recession-induced redundancies produced parity between involuntary and voluntary turnover.2 For this period at least, the rate of voluntary separations peaked in1998.Therewasthenagradualdeclineovertheperiodto2007followedbyasharperreductionin2008and 2009.
Figure 1: Job separations, 1996-2012
0.0
0.5
1.0
1.5
2.0
2.5
3.0
3.5
1996 1997 1998 1999 2000 2001 2002 2003 2004 2005 2006 2007 2008 2009 2010 2011 2012
Job
sepa
ratio
ns (%
of e
mpl
oyee
s)
VoluntaryInvoluntary
Labour Force Survey, UK, not seasonally adjusted, October-December quarter.Source: Office for National Statistics
Figure 1: Job separations, 1996–2012
Labour Force Survey, UK, not seasonally adjusted, October–December quarter.Source: Office for National Statistics
1 DEVEREUX, P., HART, R. and ROBERTS, E. (2013) Job spells, employer spells, and wage returns to tenure. Stirling Economics Discussion Paper 2013-01, January. Stirling: University of Stirling. Stirling Management School.
2 We should note, of course, that dividing lines between voluntary and involuntary separations can become blurred. Resignations, for example, can arise as a result of a disciplinary process that might otherwise have led to dismissal. Some redundancies will be ‘voluntary’ in that the individual might have volunteered to be made redundant.

4cipd.co.uk/megatrends #megatrends
Turnover, as a measure of employees changing jobs, is therefore an indicator of the stability – as well as the instability – of employment. ONS data show that most employees are in relatively stable jobs, in terms of the length of time they have been with their current employer. Figure 2 shows the breakdown of employment by length of tenure for men and women.
Over three-quarters (76%) of men and over seven-tenths (71%) of women had been with their current employer for at least two years, with a majority having been with their current employer for five or more years.
This picture of relative stability and longevity in duration of employment can also be seen in estimates of average job tenure. This is closely related to job turnover as high turnover typically implies short periods of time in a job.
Since the 1970s, average job tenure in the UK has been relatively stable.3 To an extent, this masked different trends for men and women. Average job tenure was falling for men – possibly in part due to earlier exit from the labour market – whereas it increased quite significantly for women. Improved maternity rights led to more women remaining with their employer after giving birth to a child and fewer women either leaving the labour market altogether or changing employers to find a job that suited their new circumstances.
Figure 2: Employment by length of job tenure with current employer, October–
December 2012Men
4% 4%6%
10%
21%
22%
18%
15%
Less than 3 months 3–6 months6–12 months 1–2 years2–5 years 5 –10 years10 –20 years 20+ years
Women
4% 5%7%
10%
22%22%
19%
11%
Less than 3 months 3–6 months6–12 months 1–2 years2–5 years 5–10 years10–20 years 20+ years
Labour Force Survey, UK, not seasonally adjusted.Source: Office for National Statistics
Figure 2: Employment by length of job tenure with current employer, October–December 2012
Labour Force Survey, UK, not seasonally adjusted.
3 BURGESS,S.andREES,H.(1998)AdisaggregateanalysisoftheevolutionofjobtenureinBritain,1975–1993. British Journal of Industrial Relations.Vol36,No4,December.pp629–655.
5MEGATRENDS The trends shaping work and working lives
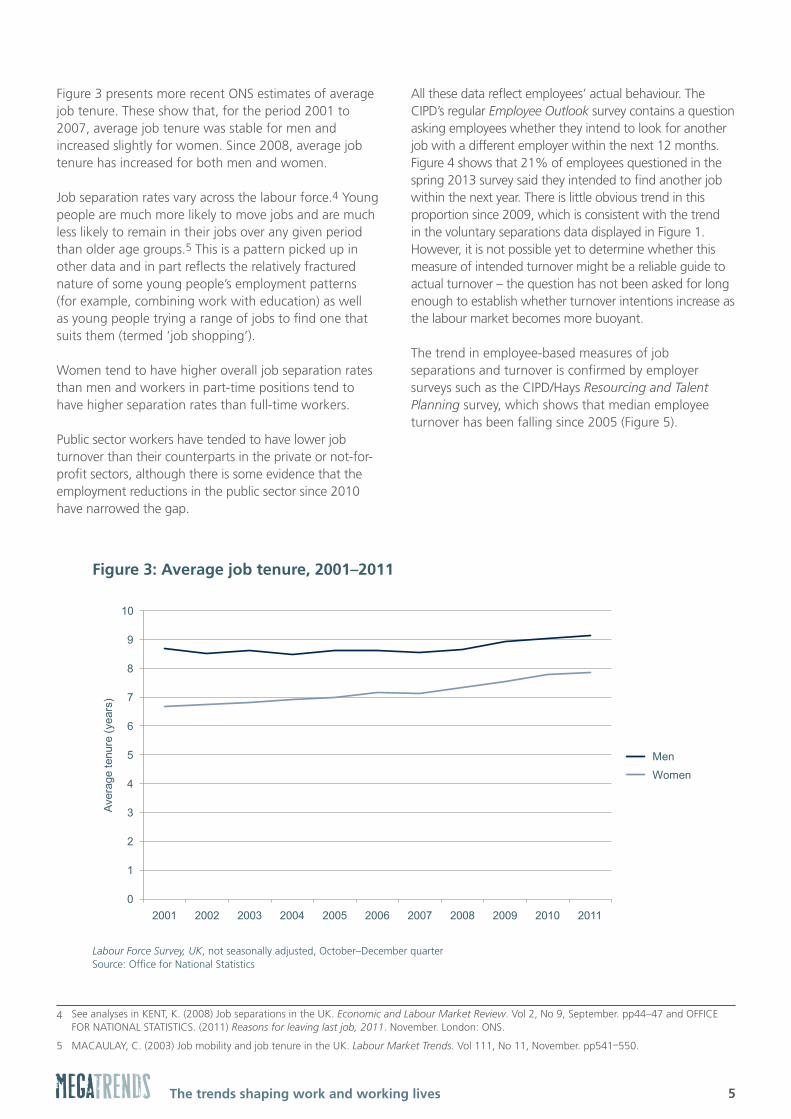
Figure 3 presents more recent ONS estimates of average job tenure. These show that, for the period 2001 to 2007, average job tenure was stable for men and increasedslightlyforwomen.Since2008,averagejobtenure has increased for both men and women. Job separation rates vary across the labour force.4 Young people are much more likely to move jobs and are much less likely to remain in their jobs over any given period than older age groups.5 This is a pattern picked up in other data and in part reflects the relatively fractured nature of some young people’s employment patterns (for example, combining work with education) as well as young people trying a range of jobs to find one that suits them (termed ’job shopping’).
Women tend to have higher overall job separation rates than men and workers in part-time positions tend to have higher separation rates than full-time workers.
Public sector workers have tended to have lower job turnover than their counterparts in the private or not-for-profit sectors, although there is some evidence that the employment reductions in the public sector since 2010 have narrowed the gap.
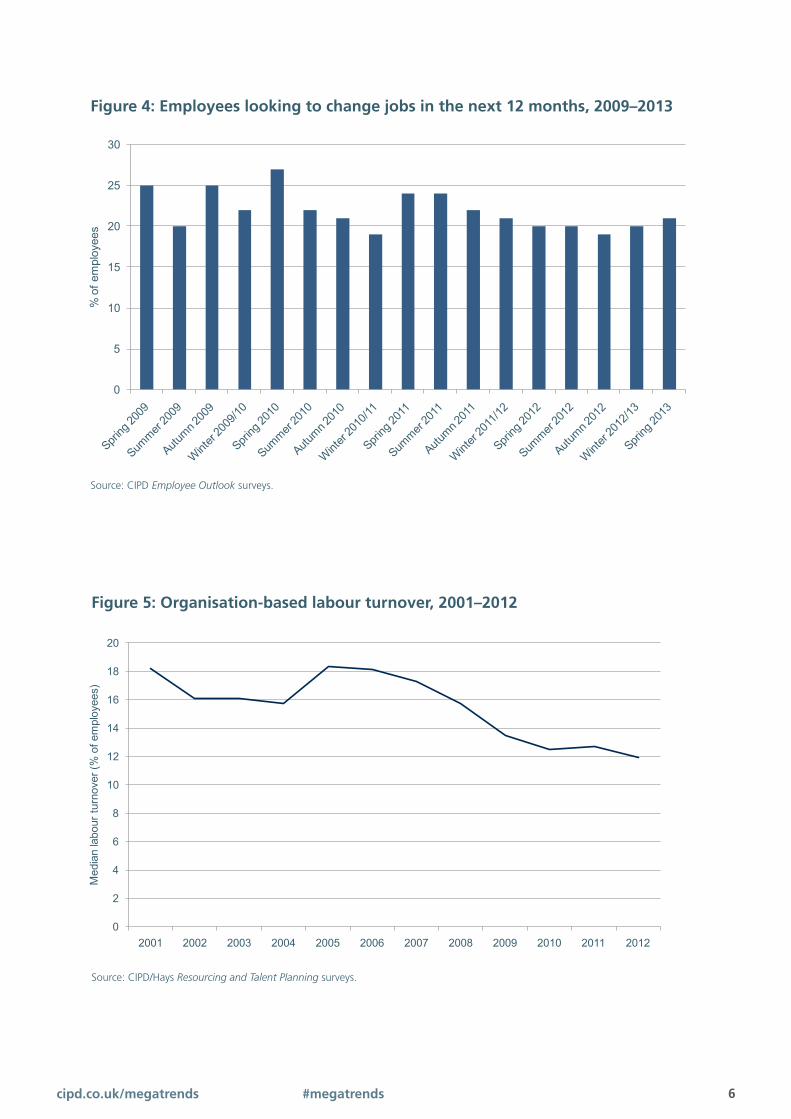
All these data reflect employees’ actual behaviour. The CIPD’s regular Employee Outlook survey contains a question asking employees whether they intend to look for another job with a different employer within the next 12 months. Figure4showsthat21%ofemployeesquestionedinthespring 2013 survey said they intended to find another job within the next year. There is little obvious trend in this proportion since 2009, which is consistent with the trend in the voluntary separations data displayed in Figure 1. However, it is not possible yet to determine whether this measure of intended turnover might be a reliable guide to actual turnover – the question has not been asked for long enough to establish whether turnover intentions increase as the labour market becomes more buoyant. The trend in employee-based measures of job separations and turnover is confirmed by employer surveys such as the CIPD/Hays Resourcing and Talent Planning survey, which shows that median employee turnoverhasbeenfallingsince2005(Figure5).
Figure 3: Average job tenure, 2001-2011
0
1
2
3
4
5
6
7
8
9
10
2001 2002 2003 2004 2005 2006 2007 2008 2009 2010 2011
Aver
age
tenu
re (y
ears
)
MenWomen
Labour Force Survey, UK, not seasonally adjusted, October–December quarterSource: Office for National Statistics
Figure 3: Average job tenure, 2001–2011
Labour Force Survey, UK, not seasonally adjusted, October–December quarterSource: Office for National Statistics
4 SeeanalysesinKENT,K.(2008)JobseparationsintheUK.Economic and Labour Market Review.Vol2,No9,September.pp44–47andOFFICEFOR NATIONAL STATISTICS. (2011) Reasons for leaving last job, 2011. November. London: ONS.
5 MACAULAY, C. (2003) Job mobility and job tenure in the UK. Labour Market Trends.Vol111,No11,November.pp541–550.
6cipd.co.uk/megatrends #megatrends
Figure 4: Employees looking to change jobs in the next 12 months, 2009–2013
0
5
10
15
20
25
30
% o
f em
ploy
ees
Source: CIPD Employee Outlook surveys.
Figure 5: Organisation-based labour turnover, 2001–2012
0
2
4
6
8
10
12
14
16
18
20
2001 2002 2003 2004 2005 2006 2007 2008 2009 2010 2011 2012
Med
ian
labo
ur tu
rnov
er (%
of e
mpl
oyee
s)
Source: CIPD Recruitment and Talent Planning surveys.
Figure 4: Employees looking to change jobs in the next 12 months, 2009–2013
Figure 5: Organisation-based labour turnover, 2001–2012
Source: CIPD Employee Outlook surveys.
Source: CIPD/Hays Resourcing and Talent Planning surveys.

7MEGATRENDS The trends shaping work and working lives
What about other countries?The UK is one of the countries with the shortest average job tenure in the OECD, which is consistent with other data pointing to the relative dynamism of its labour market (such as flows into and out of unemployment). Figure 6 shows that the UK is not alone in seeing average job tenure increase in recent years. A number of other countries, such as Spain, Ireland and Norway, have seen even greater increases in average tenure. However, some countries, including the Netherlands and Sweden, have seen modest reductions in job tenure over this period, so there is no universal trend.
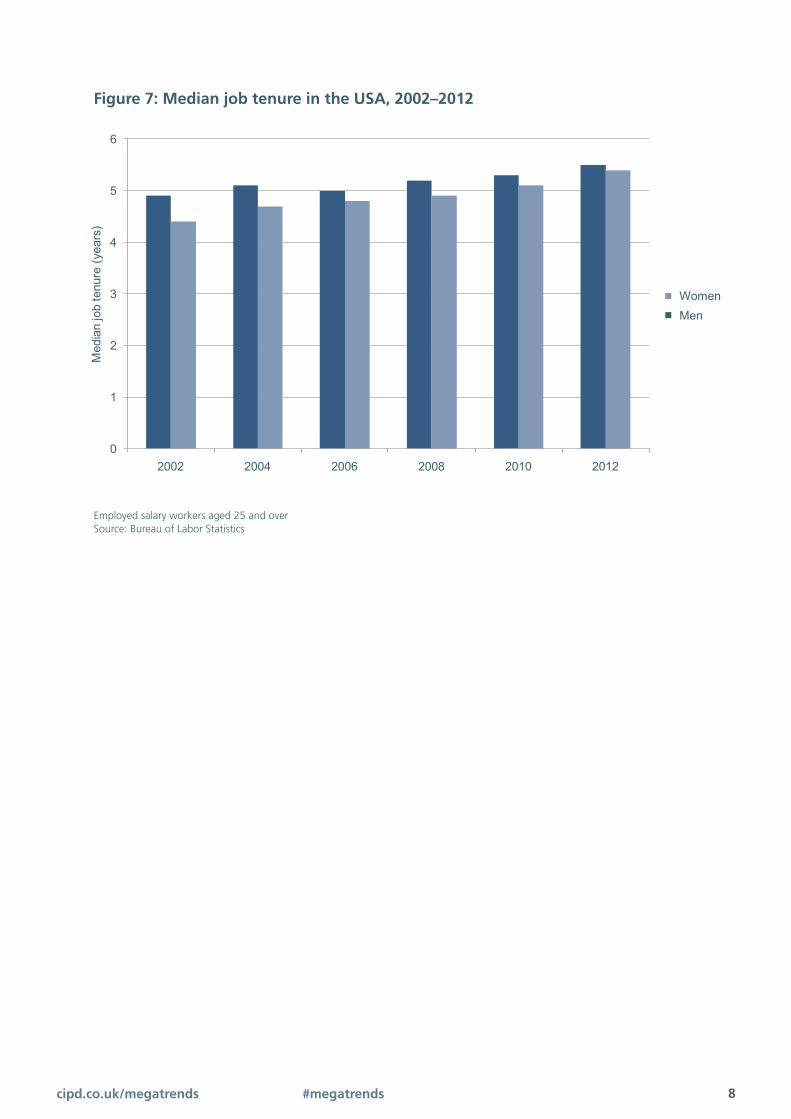
The USA has relatively low average job tenure (see Figure 7). Again, though, average job tenure has been increasing during the past decade for men and women. Thisfollowsaperiodduringthe1980sand1990swhenmedian job tenure fell for adult men but increased for adult women.6
US data on quits and layoffs show a similar pattern to the UK job separations data, with quits (voluntary separations) starting to fall in 2006 and then dropping sharplybetween2008and2010beforelevellingoff.7
Figure 6: Average job tenure in selected OECD countries, 2006–2011
0
2
4
6
8
10
12
14
Aver
age
job
tenu
re (y
ears
)
20062011
Source: OECD
Figure 6: Average job tenure in selected OECD countries, 2006–2011
Source: OECD
6 COPELAND,C.(2010)Employeetenuretrendslines,1983–2010.EBRI Notes. Vol 31, No 12, December.
7 BRUYERE,C.,PODGORNIK,G.andSPLETZERJ.(2011)Employmentdynamicsoverthelastdecade.Monthly Labor Review. August. pp16–29.
8cipd.co.uk/megatrends #megatrends
Figure 7: Median job tenure in the USA, 2002–2012
0
1
2
3
4
5
6
2002 2004 2006 2008 2010 2012
Med
ian
job
tenu
re (y
ears
)
Men
Employed salary workers aged 25 and overSource: Bureau of Labor Statistics.
Women
Figure 7: Median job tenure in the USA, 2002–2012
Employedsalaryworkersaged25andoverSource: Bureau of Labor Statistics
9MEGATRENDS The trends shaping work and working lives
What are the potential explanations?
The evidence reviewed in the previous section suggests that the rate of job turnover – especially voluntary job separations arising out of resignations, retirements and other quits – has fallen over the last decade or so, at first gradually, and then in a more pronounced manner since the2008recession.Inthissectionweidentifyfourpotentialexplanations for this trend and consider their validity.
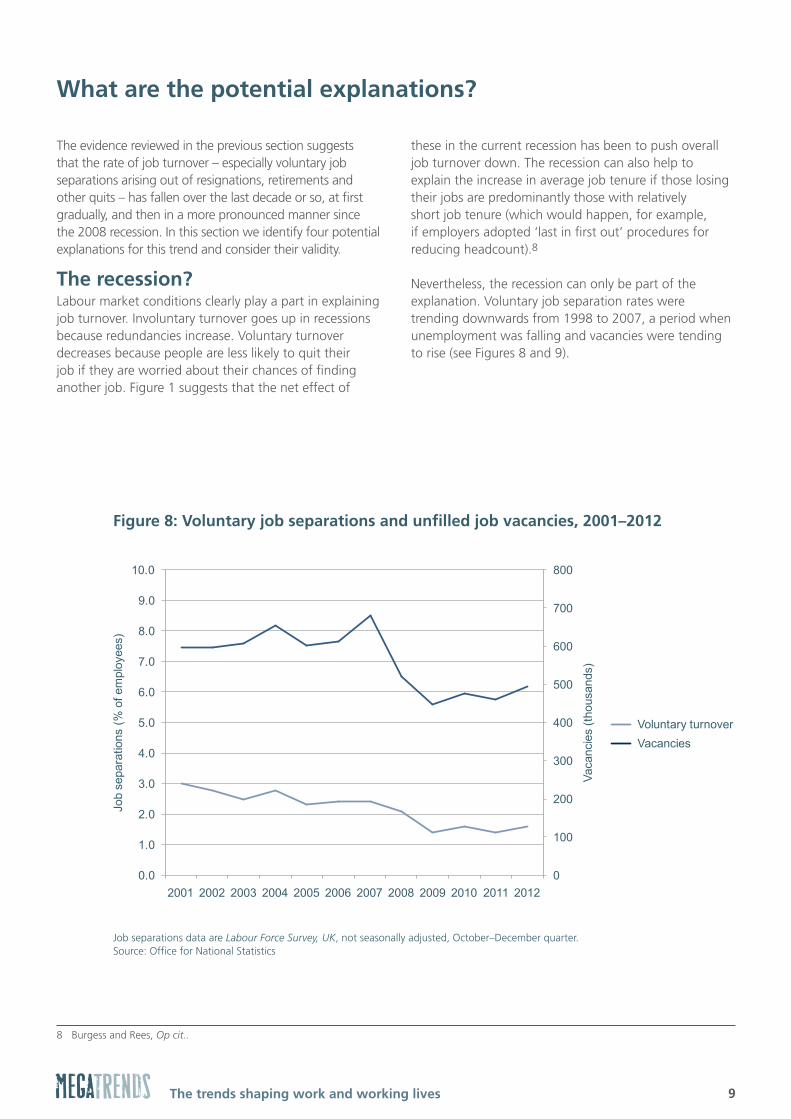
The recession?Labour market conditions clearly play a part in explaining job turnover. Involuntary turnover goes up in recessions because redundancies increase. Voluntary turnover decreases because people are less likely to quit their job if they are worried about their chances of finding another job. Figure 1 suggests that the net effect of
these in the current recession has been to push overall job turnover down. The recession can also help to explain the increase in average job tenure if those losing their jobs are predominantly those with relatively short job tenure (which would happen, for example, if employers adopted ‘last in first out’ procedures for reducing headcount).8
Nevertheless, the recession can only be part of the explanation. Voluntary job separation rates were trendingdownwardsfrom1998to2007,aperiodwhenunemployment was falling and vacancies were tending torise(seeFigures8and9).
Figure 8: Voluntary job separations and unfilled job vacancies, 2001–2012
0
100
200
300
400
500
600
700
800
0.0
1.0
2.0
3.0
4.0
5.0
6.0
7.0
8.0
9.0
10.0
2001 2002 2003 2004 2005 2006 2007 2008 2009 2010 2011 2012
Vaca
ncie
s (th
ousa
nds)
Job
sepa
ratio
ns (%
of e
mpl
oyee
s)
Voluntary turnoverVacancies
Job separations data are Labour Force Survey, UK, not seasonally adjusted, October–December quarter.Source: Office for National Statistics
Figure 8: Voluntary job separations and unfilled job vacancies, 2001–2012
Job separations data are Labour Force Survey, UK, not seasonally adjusted, October–December quarter.Source: Office for National Statistics
8 Burgess and Rees, Op cit..

10cipd.co.uk/megatrends #megatrends
Changes in workforce structure?As noted in the previous section, job separation rates vary for different groups in the labour market. In particular, young people have much more rapid job turnover than older age groups, with smaller differences between women and men, part-time and full-time workers and private and public sector workers. If the composition of the workforce changes over time (for example more women workers), this might cause the overall job turnover rate to change even if the underpinning job turnover rates by age, sex and so on remained unchanged.
Women now form a greater proportion of employment than they did ten or twenty years ago, but women tend to have higher overall job separation rates than men. Similarly, part-time work as a share of employment has increased gradually over past decades but, again, workers in part-time positions have tended to have higher rates of job turnover than workers in full-time positions. So these trends would – all things being equal – have been expected to increase the overall job turnover rate, not decrease it.
The public sector grew from 20.2% of total employment in 1999 to 21.9% of total employment in 2009, before fallingto19.5%by2012.Asturnoverislowerinthepublic sector on average, this in principle could have contributed to the fall in job turnover in the years preceding the recession. However, any such effect would be very small.
Givenpopulationageing,onemightexpectsomeofthe decline in aggregate job turnover to be due to there being fewer young people – who change jobs most frequently. However, during the pre-recession periodbetween1998and2008,whenjobturnoverwas falling, the proportion of those in employment whowereaged16–24remainedbroadlyconstant.Thenumberof25–34-year-olds,whohavethenexthighestturnover rate, did fall in absolute and relative terms over this period.
Changes in workforce composition do not appear a strong candidate for explaining the fall in job turnover.
Figure 9: Voluntary job separations and unemployment, 1996–2012
0
1
2
3
4
5
6
7
8
9
10%
Voluntary turnoverUnemployment
Labour Force Survey, UK, not seasonally adjusted, October–December quarter.Source: Office for National Statistics
Figure 9: Voluntary job separations and unemployment, 1996–2012
Labour Force Survey, UK, not seasonally adjusted, October–December quarter.Source: Office for National Statistics
11MEGATRENDS The trends shaping work and working lives
The impact of employment regulation?Economic theory suggests that employment protection legislation should reduce job turnover and increase job tenure by protecting employees from arbitrary, unfair and (in some cases) economically motivated dismissals – thus reducing involuntary turnover. Regulation can also reduce the rate of voluntary job turnover. For example, measures that make it easier for men and women to combine work with raising a family should reduce the number of working parents who feel forced to change employer. 9
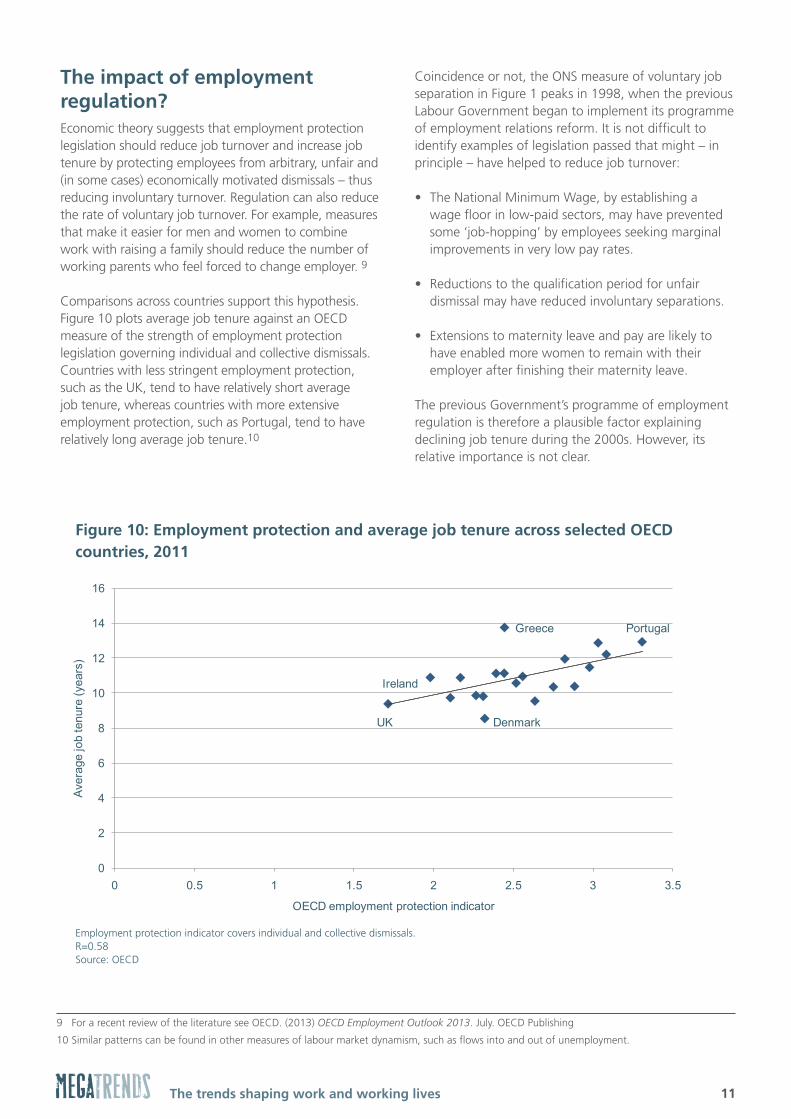
Comparisons across countries support this hypothesis. Figure 10 plots average job tenure against an OECD measure of the strength of employment protection legislation governing individual and collective dismissals. Countries with less stringent employment protection, such as the UK, tend to have relatively short average job tenure, whereas countries with more extensive employment protection, such as Portugal, tend to have relatively long average job tenure.10
Coincidence or not, the ONS measure of voluntary job separationinFigure1peaksin1998,whenthepreviousLabourGovernmentbegantoimplementitsprogrammeof employment relations reform. It is not difficult to identify examples of legislation passed that might – in principle – have helped to reduce job turnover:
• TheNationalMinimumWage,byestablishingawage floor in low-paid sectors, may have prevented some ‘job-hopping’ by employees seeking marginal improvements in very low pay rates.
• Reductionstothequalificationperiodforunfairdismissal may have reduced involuntary separations.
• Extensionstomaternityleaveandpayarelikelytohave enabled more women to remain with their employer after finishing their maternity leave.
ThepreviousGovernment’sprogrammeofemploymentregulation is therefore a plausible factor explaining declining job tenure during the 2000s. However, its relative importance is not clear.
Figure 10: Employment protection and average job tenure across selected OECD
countries, 2011
0
2
4
6
8
10
12
14
16
0 0.5 1 1.5 2 2.5 3 3.5
Aver
age
job
tenu
re (y
ears
)
OECD employment protection indicator
UK
Greece
Ireland
Denmark
Portugal
Employment protection indicator covers individual and collective dismissals.R = 0.58Source: OECD
Figure 10: Employment protection and average job tenure across selected OECD countries, 2011
Employment protection indicator covers individual and collective dismissals.R=0.58Source: OECD
9 For a recent review of the literature see OECD. (2013) OECD Employment Outlook 2013. July. OECD Publishing
10 Similar patterns can be found in other measures of labour market dynamism, such as flows into and out of unemployment.
12cipd.co.uk/megatrends #megatrends
Change within the workplace?Another possibility is that changes taking place within the workplace may be leading to less job turnover.
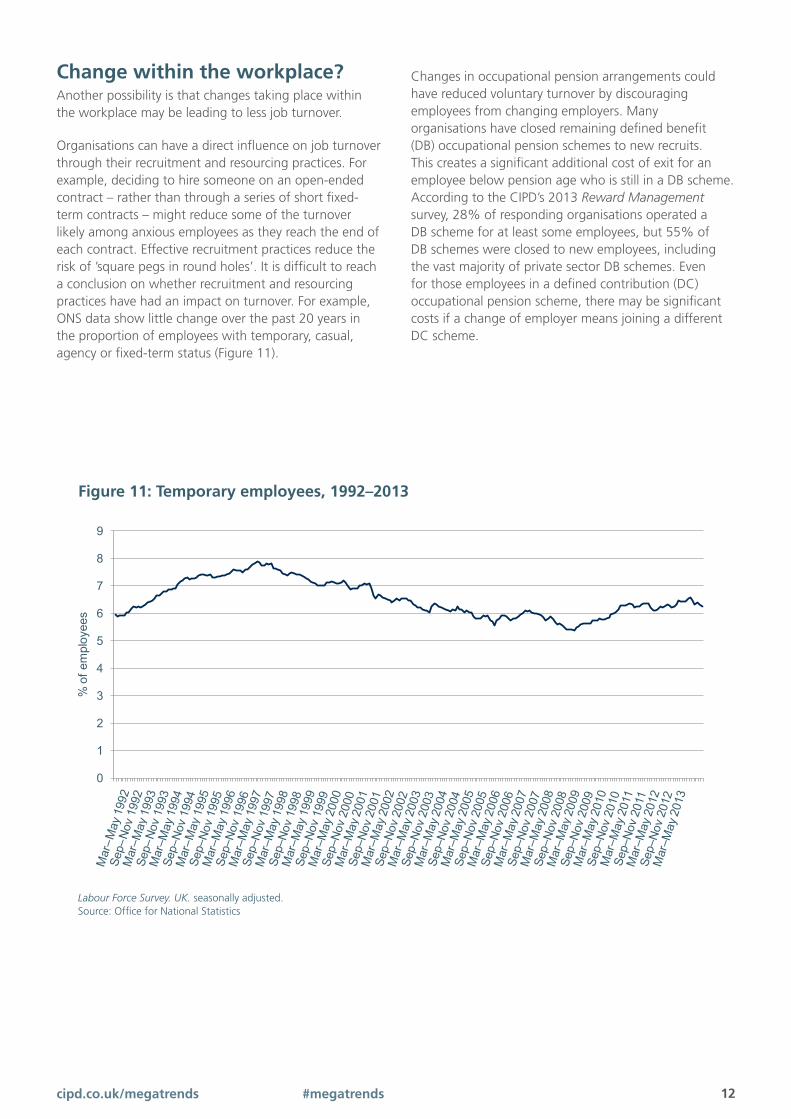
Organisations can have a direct influence on job turnover through their recruitment and resourcing practices. For example, deciding to hire someone on an open-ended contract – rather than through a series of short fixed-term contracts – might reduce some of the turnover likely among anxious employees as they reach the end of each contract. Effective recruitment practices reduce the risk of ’square pegs in round holes’. It is difficult to reach a conclusion on whether recruitment and resourcing practices have had an impact on turnover. For example, ONS data show little change over the past 20 years in the proportion of employees with temporary, casual, agency or fixed-term status (Figure 11).
Changes in occupational pension arrangements could have reduced voluntary turnover by discouraging employees from changing employers. Many organisations have closed remaining defined benefit (DB) occupational pension schemes to new recruits. This creates a significant additional cost of exit for an employee below pension age who is still in a DB scheme. According to the CIPD’s 2013 Reward Management survey,28%ofrespondingorganisationsoperatedaDBschemeforatleastsomeemployees,but55%ofDB schemes were closed to new employees, including the vast majority of private sector DB schemes. Even for those employees in a defined contribution (DC) occupational pension scheme, there may be significant costs if a change of employer means joining a different DC scheme.
Figure 11: Temporary employees, 1992–2013
0
1
2
3
4
5
6
7
8
9
Mar
– May
199
2Se
p– N
ov 1
992
Mar
– May
199
3Se
p– N
ov 1
993
Mar
–May
199
4Se
p–No
v 19
94M
ar–M
ay 1
995
Sep–
Nov
1995
Mar
–May
199
6Se
p–No
v 19
96M
ar–M
ay 1
997
Sep–
Nov
1997
Mar
–May
199
8Se
p–No
v 19
98M
ar–M
ay 1
999
Sep–
Nov
1999
Mar
–May
200
0Se
p–No
v 20
00M
ar–M
ay 2
001
Sep–
Nov
2001
Mar
–May
200
2Se
p–No
v 20
02M
ar–M
ay 2
003
Sep–
Nov
2003
Mar
–May
200
4Se
p–No
v 20
04M
ar–M
ay 2
005
Sep–
Nov
2005
Mar
–May
200
6Se
p–No
v 20
06M
ar–M
ay 2
007
Sep–
Nov
2007
Mar
–May
200
8Se
p–No
v 20
08M
ar–M
ay 2
009
Sep–
Nov
2009
Mar
–May
201
0Se
p–No
v 20
10M
ar–M
ay 2
011
Sep–
Nov
2011
Mar
–May
201
2Se
p–No
v 20
12M
ar–M
ay 2
013
% o
f em
ploy
ees
Labour Force Survey, UK, seasonally adjusted.Source: Office for National Statistics
…
Figure 11: Temporary employees, 1992–2013
Labour Force Survey. UK. seasonally adjusted.Source: Office for National Statistics

13MEGATRENDS The trends shaping work and working lives
Job quits – along with absenteeism – have been interpreted as indicators of employee discontent, especially when voice mechanisms are absent or considered ineffective.11 Whereas variations in the proportion of employees saying they intend to look for another job are relatively small across most factors that differentiate the workforce –
including gender, part-time/full-time status, industry and occupation of employment – people who are unhappy with their job appear to vote with their feet. More than half of those who state they are dissatisfied with their job, or disengaged from it, intend to look for another job within the next 12 months (Figure 12).
0 10 20 30 40 50 60
All employees
MenWomen
Full-timePart-time
18–2425–3435–4445–54
55+
<6 months’ service6–12 months’ service
1–2 years’ service2–5 years’ service
5–10 years’ service10–15 years’ service15–20 years’ service
20+ years’ service
Private sectorPublic sector
Voluntary sector
Satisfied with jobNeutral
Dissatisfied with job
EngagedNeutral
Disengaged
Likely to lose job Neutral
Unlikely to lose job
Easy to get new job
Difficult to get new job Neutral
Difficult to get
% of employees
Figure 12: Employees looking to change their job within the next 12 months, spring 2013
Source: CIPD Employee Outlook survey.
11 FREEMAN,R.andMEDOFF,J.(1984)What do unions do? New York: Basic Books.

14cipd.co.uk/megatrends #megatrends
The implication is that an improvement to average job satisfaction or employee engagement could mean fewer people quitting their employers – and hence a reduction in overall job turnover. The Workplace Employment Relations Study (WERS) suggests a modest but consistent improvementinemployeejobsatisfactionbetween2004and 2011 and a noticeable improvement in employee commitment.12 The CIPD’s Employee Outlook survey suggests that, in recent quarters, net job satisfaction has been at higher levels than when the survey series started in 2009.
These results may well in turn reflect perceived improvements in workplace relationships and management and leadership. WERS shows that managers used more methods for engaging employeesin2011thantheydidin2004–matchedby a slight increase in positive employee perceptions of their role in decision-making.
ConclusionsClearly, labour market conditions account for much (if notall)ofthedropinjobturnoverfrom2008onwards.However, the fact this was preceded by a sustained period of falling turnover suggests other explanations have a part to play. The analysis suggests this is more likely to have been due to changes within the workplace than through changes in the composition of the workforce alone.
These changes within the workplace include recruitment and resourcing strategies and changes to occupational pension arrangements – as well as other changes to management and personnel practices that have increased employee engagement and job satisfaction and reduced some of the ‘push’ factors, such as problems in securing flexible working after a period of maternity leave. Employment legislation may have played an additional supporting role.
12 WANROOY, B. van, BEWLEY, H. and BRYSON, A. (2013) The 2011 Workplace Employment Relations Study: first findings. January. London: Department for Business, Innovation and Skills.
15MEGATRENDS The trends shaping work and working lives
What are the implications?
The evidence presented in this paper suggests that employee turnover and job tenure in the UK have been relatively stable over recent decades and that we even appear to be seeing a shift, on average, towards less employee turnover and longer-lasting employment relationships. The ties binding organisations and people together would appear to remain strong in many cases.
If labour market conditions improve – with significant rises in job vacancies or sharp falls in unemployment – we should expect to see increased employee turnover. Involuntary job turnover might fall further, but redundancies are already at historically low rates. It is highly likely any such effect would be outweighed by an increase in voluntary job turnover as individuals who have been ‘sitting tight’ in a difficult labour market take active steps to seek new opportunities.
While our analysis of past trends suggested that changes in workforce composition were unlikely to be a powerful explanation of past falls in job turnover, there are good reasons to believe that population ageing could further reduce job turnover in the period to 2020. First, the number of young people is projected to fall more quickly than seen in the previous decade, with a fall of 7% in thenumberof15–19-year-oldsbetween2012and2020andafallof9%inthenumberof20–24-year-olds.Second, among the older age groups, greater numbers in the age cohorts combined with increased labour force participationandlaterretirementmeanthattheover-50swill account for a greater share of employment – and they are currently the group in the workforce with the lowest rate of turnover.
Allowing for variation over the economic cycle, what might the implications of a lower rate of employee turnover be for organisations?
A more stable workforce is likely to be welcomed by many organisations. It increases the direct returns to investment in human and organisational capital (as the average pay-off period increases). It may also increase the returns to investment in other forms of physical and knowledge capital if these complement the increased tacit knowledge (’know-how’) possessed by a more experienced workforce. Put simply, there is the prospect of a higher rate of return from investment in people.
However, fewer people leaving their jobs also means fewer people seeking employment. Organisations looking to recruit may regard this as a mixed blessing. At a practical level, organisations may need to rethink the ’received wisdom’ on the ’normal’ or ‘acceptable’ rate of turnover for their organisation or sector. Informal or formal benchmarks may need to be refreshed. In addition, though, organisations might face problems in maintaining the quantity and/or quality of new recruits and hence their long-term talent pipeline.
Innovation requires new thinking and challenge to existing ways of doing things, which may be a problem if low turnover means less new blood. This lies alongside the challenge of keeping long(er)-serving employees refreshed, motivated and up to date with business thinking. Part of the response might be permanent or temporary job movement between roles, so that turnover within organisations is kept up even if external turnover is lower than in the past. Continuous learning and development will have a role to play, as will practices designed to encourage knowledge transfer between new and longer-serving employees, such as mixed teams or mentoring arrangements.
There will not be uniform answers that apply across all types of organisations. Much will depend on prevailing innovation models across industries and the organisational culture. We encourage further discussion and debate on this topic.

MEGATRENDSIssued: August 2013 Reference: 6306 © Chartered Institute of Personnel and Development 2013
Chartered Institute of Personnel and Development151TheBroadwayLondonSW191JQUKTel:+44(0)2086126200Fax:+44(0)2086126201Email: [email protected] Website: cipd.co.uk
Incorporated by Royal Charter Registered charity no.1079797