megan williams associate economist, oklahoma city branch...associate economist, oklahoma city branch...
TRANSCRIPT

Megan Williams
Associate Economist, Oklahoma City Branch
Federal Reserve Bank of Kansas City
www.kansascityfed.org/oklahomacity

• The “Fed” consists of three main entities:
• Board of Governors: 7 members appointed by U.S. President
• Federal Reserve Banks: 12 total; semi-independent by design
• Federal Open Market Committee: 19 members; 12 voting
• As with most central banks, the Fed’s primary
responsibilities fall within four general areas:
• Lender of last resort – provide liquidity in times of crisis
• Monetary policy – promote full employment and low inflation
• Bank regulation – ensure safety and soundness of banks
• Financial services – bank for banks, bank for federal govt.
Overview of the
Federal Reserve System

Federal Reserve Districts
and Office Locations
• History, staff, and functions
• Branch office opened in 1920; currently have about 35 staff
• Functions include economic research, bank examinations, public outreach
• 2011 branch board of directors
• Steve Agee (chairman), Dean, Oklahoma City Univ. Business School, OKC
• Jim Dunn, Chairman, Mill Creek Lumber and Supply Co., Tulsa
• Jacque Fiegel, Senior EVP and COO, Coppermark Bank, OKC
• Rose Washington Rentie, Executive Director, TEDC Creative Capital, Tulsa
• Doug Tippens, President and CEO, Bank of Commerce, Yukon
• K. Vasudevan, Chairman, Service and Technology Corp., Bartlesville
The Oklahoma City Branch of the
Federal Reserve Bank of Kansas City

The U.S.
Economy

-10
-8
-6
-4
-2
0
2
4
6
2006 Q3 2007 Q3 2008 Q3 2009 Q3 2010 Q3 2011 Q3
Real GDP growth picked up somewhat
in Q3, but still remains moderate
U.S. Real Gross Domestic Product
Percent change from the previous period, SAAR
Source: U.S. Bureau of Economic Analysis, FOMC

1.3 0.7
4.2
10.3
3.6
-0.9
1.8 1.7 1.3
15.7
4.7
-0.1
-2
0
2
4
6
8
10
12
14
16
18
Total GDP Consumer spending
Residential investment
Business investment
Exports Government spending
2011 Q2
2011 Q3
Growth in Components of Real GDP
Percent change from the previous period, SAAR
Source: U.S. Bureau of Economic Analysis
Business investment was strong, exports
grew further, and consumers spent more

25
30
35
40
45
50
55
60
65
-1000
-800
-600
-400
-200
0
200
400
600
Dec-06 Dec-07 Dec-08 Dec-09 Dec-10 Dec-11
Private Employment (left axis)
ISM Manufacturing Index (right axis)
ISM Non-Manufacturing Index (right axis)
Change from previous month, thousands
Source: Institute for Supply Management, Bureau of Labor Statistics
U.S. Private Payroll Employment and Business Indexes
Recent U.S. data have improved slightly
overall, but growth still remains moderate
Index

The unemployment rate eased further in
December, but joblessness remains high
U.S. Unemployment Rate and Employment-to-Population
Source: U.S. Bureau of Labor Statistics
Percent
58
59
60
61
62
63
64
0
2
4
6
8
10
12
Dec-01 Dec-02 Dec-03 Dec-04 Dec-05 Dec-06 Dec-07 Dec-08 Dec-09 Dec-10 Dec-11
Unemployment Rate
(left axis)
Employment-to-
Population (right axis)

-8
-6
-4
-2
0
2
4
6
8
-8
-6
-4
-2
0
2
4
6
8
Nov-01 Nov-02 Nov-03 Nov-04 Nov-05 Nov-06 Nov-07 Nov-08 Nov-09 Nov-10 Nov-11
Overall CPI
Core CPI
Overall inflation eased considerably in late
2011, and core prices also edged lower
U.S. CPI Index
Source: U.S. Bureau of Labor Statistics
Percent change, six-months annualized

Financial stress continues to rise
in Europe, and also beyond
3-month EURIBOR & LIBOR Spreads (to OIS)
Source: Bloomberg
Percentage points
0.0
0.5
1.0
1.5
2.0
2.5
3.0
3.5
4.0
0.0
0.5
1.0
1.5
2.0
2.5
3.0
3.5
4.0
Jan-07 Jan-08 Jan-09 Jan-10 Jan-11 Jan-12
LIBOR
EURIBOR

December 11, 2011 FOMC Statement
“To support a stronger economic recovery and to help ensure that
inflation, over time, is at levels consistent with the dual mandate,
the Committee decided today to continue its program to
extend the average maturity of its holdings of securities as
announced in September…
“The Committee is maintaining its existing policies of reinvesting
principal payments from its holdings of agency debt and
agency mortgage-backed securities in agency mortgage-
backed securities and of rolling over maturing Treasury
securities at auction… The Committee also decided to keep
the target range for the federal funds rate at 0 to 1/4 percent
and currently anticipates that economic conditions--including low
rates of resource utilization and a subdued outlook for inflation over
the medium run--are likely to warrant exceptionally low levels for
the federal funds rate at least through mid-2013…
“Voting against the action was Charles L. Evans, who supported
additional policy accommodation at this time.”

The Oklahoma
Economy

Source: U.S. Bureau of Labor Statistics
Employment Growth, Year-over-Year (percent) November 2011
There is considerable variation in
economic strength across the nation

92
94
96
98
100
102
92
94
96
98
100
102
Jan-08 Jan-09 Jan-10 Jan-11
Index: Jan-08=100
Source: U.S. Bureau of Labor Statistics
Level of Payroll Employment
OK employment remains below pre-recession
levels, but much less so than in the U.S.
OK
U.S.

Percent change year-over-year
Source: Bureau of Labor Statistics
Employment Growth November 2011
Most Oklahoma sectors have grown solidly
in 2011, led by energy and manufacturing
-4
-2
0
2
4
6
8
10
12
14
Total Energy Mfg Const Leis & Hosp
Prof & Bus Svcs
Educ & Health
Trade, Transp.
& Utilities
Finance State & Local Govt
Info
U.S.
OK

0.5 0.6
-0.2
0.7
1.2
3.1
2.5 2.7
-1
-1
0
1
1
2
2
3
3
4
U.S. OKC Metro
Tulsa Metro
Rest of State
Nov-10
Nov-11
Percent
Source: U.S. Bureau of Labor Statistics
Employment Growth Year-over-year
Recent job growth has been especially
strong in OKC and solid in other areas

Unemployment Rate Seasonally Adjusted
Percent
Source: Bureau of Labor Statistics
Yet unemployment in the state has risen, as
discouraged workers resume job hunting
0
2
4
6
8
10
12
0
2
4
6
8
10
12
Nov-06 Nov-07 Nov-08 Nov-09 Nov-10 Nov-11
OK
U.S.
May: 5.3%
November: 6.1%
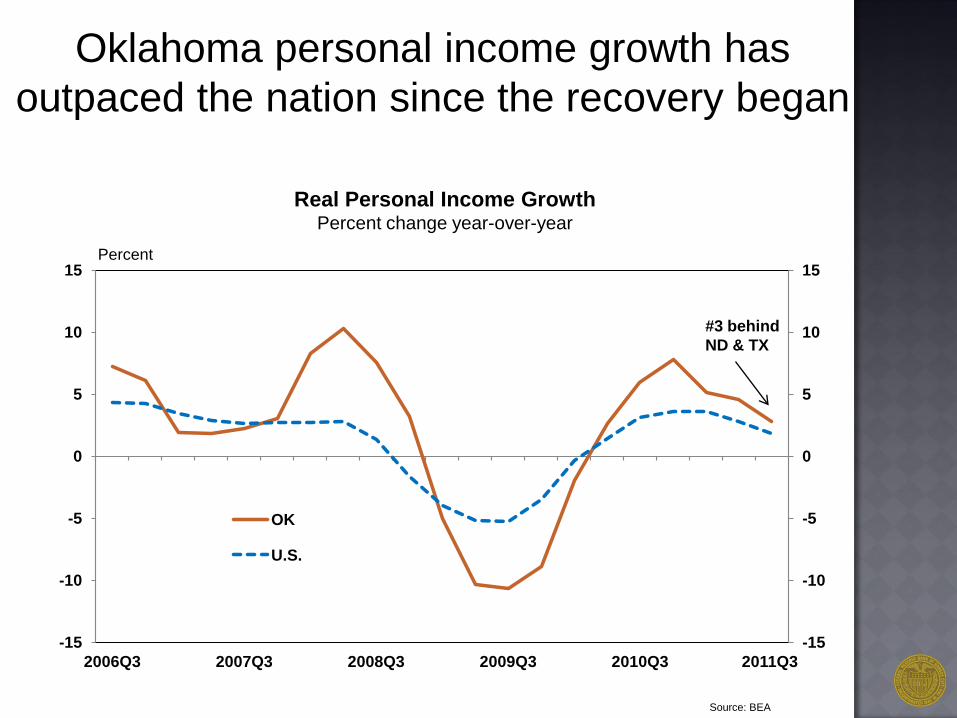
Percent
Source: BEA
Real Personal Income Growth Percent change year-over-year
Oklahoma personal income growth has
outpaced the nation since the recovery began
-15
-10
-5
0
5
10
15
-15
-10
-5
0
5
10
15
2006Q3 2007Q3 2008Q3 2009Q3 2010Q3 2011Q3
OK
U.S.
#3 behind
ND & TX
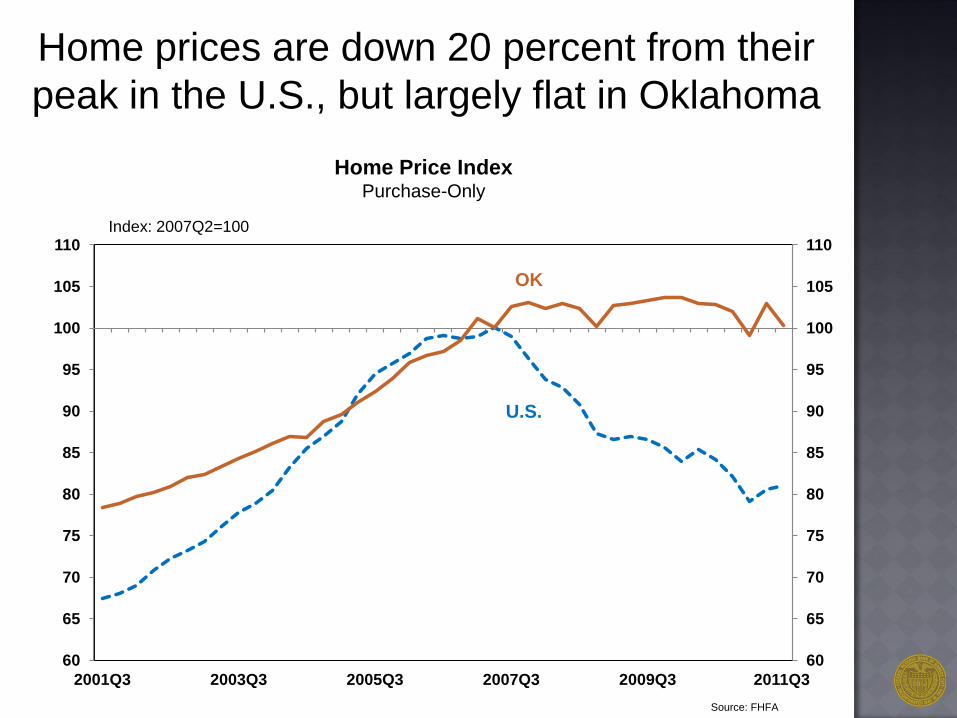
Index: 2007Q2=100
Source: FHFA
Home Price Index
Purchase-Only
Home prices are down 20 percent from their
peak in the U.S., but largely flat in Oklahoma
60
65
70
75
80
85
90
95
100
105
110
60
65
70
75
80
85
90
95
100
105
110
2001Q3 2003Q3 2005Q3 2007Q3 2009Q3 2011Q3
OK
U.S.

Dollars
Source: NAR
Median Home Prices in U.S. and Large Tenth District Cities
Home prices in large metros now compare
more favorably to the U.S. and region
75000
100000
125000
150000
175000
200000
225000
250000
275000
75000
100000
125000
150000
175000
200000
225000
250000
275000
2001:Q3 2003:Q3 2005:Q3 2007:Q3 2009:Q3 2011:Q3
Denver
U.S.
Kansas City
Omaha
Tulsa
OKC

Index
Source: KCFRB Manufacturing Survey
Manufacturing Composite Indexes
Regional manufacturing growth fell slightly
in December while national conditions rose
Index
Note –Tenth District calculated on an ISM basis; Above 50 indicates expansion
30
35
40
45
50
55
60
65
30
35
40
45
50
55
60
65
Dec-06 Dec-07 Dec-08 Dec-09 Dec-10 Dec-11
KC Fed
ISM
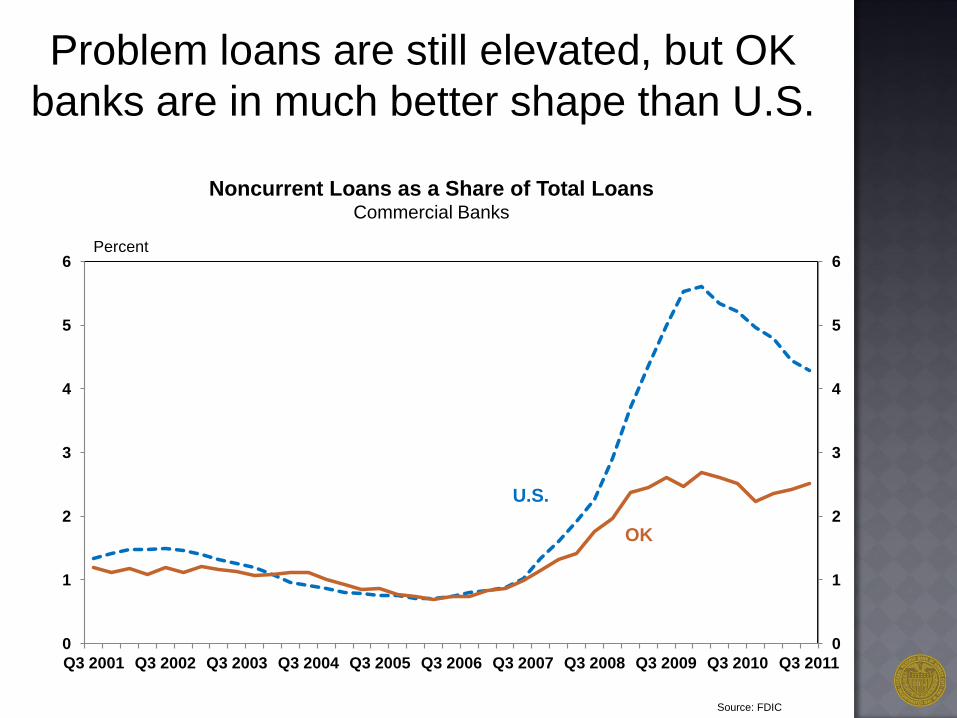
Percent
Source: FDIC
Noncurrent Loans as a Share of Total Loans Commercial Banks
Problem loans are still elevated, but OK
banks are in much better shape than U.S.
0
1
2
3
4
5
6
0
1
2
3
4
5
6
Q3 2001 Q3 2002 Q3 2003 Q3 2004 Q3 2005 Q3 2006 Q3 2007 Q3 2008 Q3 2009 Q3 2010 Q3 2011
U.S.
OK

0
5
10
15
20
25
30
35
40
0
5
10
15
20
25
30
35
40
District NE KS MO Mtn States (CO, NM,
WY)
OK
Q1 2011
Q2 2011
Q3 2011
Source: FRBKC Agricultural Credit Survey
Tenth District Non-Irrigated Cropland Values Percent Change, Year-over-year
Surging farmland prices pose a risk
in some parts of the region
Percent

0
30
60
90
120
150
0
3
6
9
12
15
Dec-06 Dec-07 Dec-08 Dec-09 Dec-10 Dec-11 Dec-12 Dec-13
Crude Oil &
Futures (WTI)
Natural Gas & Futures
(Henry Hub)
$/MMBTU $ per Barrel
Source: Bloomberg
Energy Prices
Energy prices are always a big risk, but
oil prices are expected to remain high
Moody’s
Forecast

The U.S. economy is growing moderately
but facing headwinds after only modest
expansion throughout 2011
Oklahoma’s growth has been more solid
in 2011, and fundamentals remain better
in the state than the nation
Summary