meeting the employment transportation needs of … · meeting the employment transportation needs...
TRANSCRIPT

Meeting the Employment TransportationNeeds of People with Disabilitiesin New Jersey
Final Report
prepared by:Alan M. Voorhees Transportation CenterEdward J. Bloustein School of Planning and Public PolicyRutgers, The State University of New Jersey
prepared for:New Jersey Department of Human ServicesDivision of Disability Services
January 2005

Meeting the Employment Transportation Needs of People with Disabilities in New Jersey
i
Meeting the Employment Transportation Needs of People with Disabilities in New Jersey
Final Report
January 2005
Prepared by: Alan M. Voorhees Transportation Center
Edward J. Bloustein School of Planning and Public Policy Rutgers, The State University of New Jersey
33 Livingston Avenue – 5th Floor New Brunswick, New Jersey 08901
Prepared for: New Jersey Department of Human Services
Division of Disability Services P.O. Box 700
Trenton, New Jersey 08625

Meeting the Employment Transportation Needs of People with Disabilities in New Jersey
ii

Meeting the Employment Transportation Needs of People with Disabilities in New Jersey
iii
This publication was made possible by funding from the Centers for Medicare and Medicaid Services (CMS)
Medicaid Infrastructure Grant Number CODA 93.779
Legal Notice and Disclaimer
CMS (including its employees and agents) assumes no responsibility for consequences resulting from the use of the information herein, (or from use of the information obtained at linked Internet addresses,) or in any respect for the content of such information including (but not limited to) error or omissions, the accuracy or reasonableness of factual or scientific assumptions, studies or conclusions, the defamatory nature of statements, ownership of copyright or other intellectual property rights, and the violation of property, privacy, or personal rights of others. CMS is not responsible for, and expressly disclaims all liability for, damages of any kind arising out of use reference to, or reliance on such information. No guarantees or warranties, including (but not limited to) any express or implied warranties of merchantability or fitness for a particular use or purpose, are made by CMS with respect to such information.

Meeting the Employment Transportation Needs of People with Disabilities in New Jersey
iv
ABOUT THE RESEARCH TEAM The Alan M. Voorhees Transportation Center was established in the Edward J. Bloustein School of Planning and Public Policy at Rutgers, the State University of New Jersey in 1998. Since that time, the center has become a national leader in the research and development of innovative transportation policy. VTC is one of 13 research centers within the Bloustein School, and includes the National Transit Institute, which was created by Congress in 1992 to design and deliver training and education programs for the nation’s transit industry. The center’s primary activities include a blend of applied and academic research, education and training and service to the state and region on a variety of transportation planning and policy topics. The research team assembled to conduct this study included the following researchers: Jon A. Carnegie, AICP/PP is assistant director of the Voorhees Transportation Center. He served as the principal investigator for this study with responsibility for overall research design and project management. Mr. Carnegie has 15 years of experience in the fields of land use and transportation planning and policy at the municipal, county and regional level. He is the principal investigator for a variety of research and planning projects involving a range of transportation policy topics. His experience includes managing research projects involving transit-oriented development, the relationship between land use and transportation, long-range vision planning, watershed planning, transportation capital finance, transportation equity, driver’s licensing, workforce transportation options for low-income individuals and persons with disabilities, and senior mobility. Dr. Richard Brail is a research professor in the Urban Planning and Policy Development program at the Edward J. Bloustein School of Planning and Public Policy at Rutgers, The State University of New Jersey. His teaching and research interests focus on urban transportation planning and the use of computer and information technology, particularly geographic information systems, urban databases, and spatial models. He has authored and co-authored numerous books and articles on these subjects. His publications include: Planning Support Systems: Integrating Geographic Information Systems, Models and Visualization Tools, Using GIS in Urban Planning Analysis and Assessment of Public Transportation Opportunities for WorkFirst New Jersey Participants. Dr. Brail received his B.A. from Rutgers University and M.C.R.P. and Ph.D. from the University of North Carolina. Andrea Lubin joined the Voorhees Transportation Center in 2001 and has served as a project manager and contributing researcher on a number of transportation planning and policy studies. In addition to this study, Ms. Lubin’s recent efforts have involved working on several studies investigating transportation equity issues, including transportation options for older New Jersey residents and two studies for the NJ Motor Vehicle Commission examining the impacts of driver’s license suspension and the effects of plea bargaining on highway safety. Ms. Lubin received a Bachelor of Arts degree in political science from Tufts University in 1997 and a Master of Science degree in public policy from Rutgers University in 1999. Pippa Woods is a project development specialist at the Voorhees Transportation Center. She has over 23 years of transportation program development and management experience. Ms. Woods has held senior positions in transit agencies in the United States and Canada and was Assistant Commissioner of Transportation for Planning, Research and Local Government Services in the State of New Jersey from 1997 to 2002. She has developed, directed and managed a variety of research, funding and operations management programs involving multi-modal transportation, freight and ports development, human services and welfare reform, senior and disabled transportation, local aid, highway research and mass transit system development. Ms. Woods holds a Bachelor of Arts in Sociology and a Diploma of Public Sector Management from the University of Victoria in British Colombia. Graduate and Research Assistants: Jianye Chen, Aaron Cardon, Jeffrey Perlman, Richard Rabinowitz and Ginna Smith.

Meeting the Employment Transportation Needs of People with Disabilities in New Jersey
v
TABLE OF CONTENTS
Executive Summary ix CHAPTER 1: Introduction 1
1.1. Background 1 1.2. Report overview 1 1.3. Definitions 2 1.4. Broad Policy Context 4 1.5. Comparable statewide planning studies 6
CHAPTER 2: Geography of Disability and Employment in New Jersey 11
2.1. Introduction 11 2.2. Census Overview 11 2.3. Population and employment characteristics: Statewide and county patterns 12
Density patterns 12 Disability patterns by type of disability 15 Employment patterns 19
2.4. Sub-county patterns 23 Cumberland County 23 Essex County 26 Middlesex County 30
2.5. Summary of key findings 34 CHAPTER 3: Transportation Options of People with Disabilities in New Jersey 37
3.1. Introduction 37 3.2. Types of accessible transportation 37 3.3. Transportation inventory and survey 38 3.4. Transportation services in New Jersey 42
Public transit bus and rail services 42 NJ TRANSIT Access Link 43 County Community Transportation Services 46 Nongovernmental services 54 Private Medical Access Vehicle services 58
3.5. Summary of key findings 61 CHAPTER 4: Transportation Needs Analysis 67
4.1. Introduction 67 4.2. Focus group findings 67 4.3. Consumer survey findings 81 4.4. Access and work opportunity analysis 92 4.5. Summary of key findings 104
CHAPTER 5: Institutional Barriers, Best Practices and Model Programs 109
5.1. Introduction 109 5.2. Coordinating human services transportation 109 5.3. Best practices and model programs 113 5.4. Summary of key findings 118
CHAPTER 6: Recommendations 121 CHAPTER 7: References 129

Meeting the Employment Transportation Needs of People with Disabilities in New Jersey
vi
LIST OF TABLES Table 2.1: Population density by county ................................................................................................................. 13 Table 2.2: Disability Patterns by County – Working Age Population age 16-64 (2000)........................................ 16 Table 2.3: Rates of Employment – General Population (2000) .............................................................................. 20 Table 2.4: Rates of Employment – People with NO Disability (2000)................................................................... 21 Table 2.5: Rates of Employment – People with Disabilities (2000)....................................................................... 22 Table 2.6: Disability Patterns by Municipality – Cumberland County (2000) ....................................................... 24 Table 2.7: Rates of Employment – Cumberland County (2000) ............................................................................ 24 Table 2.8: Disability Patterns by Municipality – Essex County (2000).................................................................. 27 Table 2.9: Rates of Employment by Municipality – Essex County (2000) ............................................................ 28 Table 2.10: Disability Patterns by Municipality – Middlesex County (2000) ........................................................ 31 Table 2.11: Rates of Employment by Municipality – Middlesex County (2000)................................................... 32 Table 3.1: Service provider attributes..................................................................................................................... 42 Table 3.2: Percentage of total county paratransit funding from SCDRTAP (2002) ............................................... 47 Table 3.3: Types of service offered in each county – All county-operated services .............................................. 48 Table 3.4: Fleet size characteristics – All county-operated services ...................................................................... 50 Table 3.5: Fleet Mix – County paratransit providers .............................................................................................. 50 Table: 3.8: Number of NGO providers surveyed by county................................................................................... 54 Table 3.9: “Main” sources of transportation funding received by NGOs............................................................... 55 Table 3.10: Types of service offered – NGO service providers ............................................................................. 55 Table 3.11: Hours of operation – NGO service providers ...................................................................................... 56 Table 3.12: Fleet size and mix operated by private NGO providers in each county............................................... 56 Table 3.13: Fleet size and mix operated by private MAV providers in each county.............................................. 59 Table 4.1: Consumer survey response rates............................................................................................................ 83 Table 4.2: Age of Respondents............................................................................................................................... 83 Table 4.3: Educational Attainment ......................................................................................................................... 83 Table 4.4: Employment rates of working age respondents ..................................................................................... 84 Table 4.5: Employment rates by age group ............................................................................................................ 84 Table 4.6: Last year of education: Employed working age respondents ................................................................ 84 Table 4.7: Reasons for not seeking employment .................................................................................................... 85 Table 4.7: Vehicle ownership and accessibility requirements ................................................................................ 86 Table 4.8: Travel from home to places other than work......................................................................................... 86 Table 4.9: Travel from home to work..................................................................................................................... 87 Table 4.10: Perceptions of service quality – Traditional bus or train service ......................................................... 88 Table 4.11: Perceptions of service quality – Access Link ...................................................................................... 89 Table 4.12: Perceptions of service quality – County paratransit ............................................................................ 89 Table 4.13: Perceptions of service quality – Taxi................................................................................................... 90 Table 4.14: Means of communication for receiving information on transportation options................................... 91 Table 4.15: Characteristics of bus, rail and Access Link coverage ......................................................................... 93 Table 4.16: Characteristics of county paratransit services...................................................................................... 96 Table 4.17: Proportion of working age go outside the home disabled living proximate to existing
bus routes, rail stations and Access Link ........................................................................................... 98 Table 4.18: Land area covered by Access Link compared to go outside the home disabled
covered by Access Link ..................................................................................................................... 99 Table 4.19: Job proximity to bus routes, rail stations and Access Link – ALL jobs ............................................ 100 Table 4.20: Job proximity to bus routes, rail stations and Access Link – Jobs with large employers
(100 + employees)............................................................................................................................ 101 Table 4.21: Job proximity to bus routes, rail stations and Access Link – Jobs with employers
from key industries........................................................................................................................... 102 Table 4.22: Comparison of access and work opportunity factors and employment rates..................................... 103 Table 6.1: Implementation Matrix ........................................................................................................................ 128

Meeting the Employment Transportation Needs of People with Disabilities in New Jersey
vii
LIST OF FIGURES Figure 2.1: Density of disabled population ages 16-64 by census tract (2000) ...................................................... 14 Figure 2.2: Percent of disabled population ages 16-64 by census tract (2000)....................................................... 17 Figure 2.3: Percent of “go-outside-the-home” disabled ages 16-64 by census tract (2000) ................................... 18 Figure 2.4: Percent of population with go outside the home disability – Cumberland County, NJ (2000).................25 Figure 2.5: Percent of population with go outside the home disability – Essex County, NJ (2000)....................... 29 Figure 2.5: Percent of population with go outside the home disability – Essex County, NJ (2000)....................... 33 Figure 3.1: Access Link “shadow” buffer – Source: Paladino 2004...................................................................... 43 Figure 3.2: Pick-up / drop-off window – Source: Paladino 2004 .......................................................................... 43 Figure 3.3: Access Link Service Regions............................................................................................................... 45 Figure 3.4: County paratransit services – Hours of operation ................................................................................ 49 Figure 3.6: “Main” customers served – All county-operated services..................................................................... 51 Figure 3.7: “Main” trip purposes – All county-operated services ........................................................................... 52 Figure 4.1: Geographic distribution of survey respondents .................................................................................... 82 Figure 4.2: NJ TRANSIT bus routes with ¼ mile buffer ....................................................................................... 94 Figure 4.3: NJ TRANSIT bus routes with ¾ mile Access Link service boundary ................................................. 95
LIST OF APPENDICES The appendices for this report are compiled in separate volumes as follows:
Appendices - Volume 1 Appendix A – Phase 1 Report Appendix B – Literature and best practice review Appendix C – Transportation Inventory and Survey Appendix D – Follow up Focus Group Report Appendix E – Survey questionnaires
Appendices - Volume 2 Appendix F – Map Atlas

Meeting the Employment Transportation Needs of People with Disabilities in New Jersey
viii

Meeting the Employment Transportation Needs of People with Disabilities in New Jersey
ix
EXECUTIVE SUMMARY Background Getting and keeping a job can be a challenge for anyone, regardless of disability status. For people with disabilities in New Jersey, the challenge can be even greater. Although the state has a large and extensive public transportation network, many suburban and rural areas have little or no public transportation. In addition, in areas where transportation options are available, they are not always accessible and affordable. In an effort to address transportation and other barriers to work for people with disabilities wishing to work in a competitive work environment, in 2000, the New Jersey Department of Human Services, Division of Disability Services (DDS) applied for and was awarded a Ticket to Work and Work Incentives Improvement Act of 1999 Medicaid Infrastructure Grant from the federal Health Care Financing Administration. The goal of the project, is to design and implement services that support individuals with disabilities as they secure and sustain competitive employment in an integrated setting. As part of the project, DDS contracted with the Alan M. Voorhees Transportation Center at Rutgers, The State University of New Jersey (VTC) to develop a five-year transportation plan intended to identify and document transportation barriers to work for people with disabilities and make recommendations related to addressing the identified barriers and providing enhanced transportation services in a variety of settings throughout the state. The following report is the culmination of that work. The Geography of Disability and Employment in New Jersey Critical to addressing transportation barriers to work for people with disabilities in New Jersey is identifying where the state’s disabled residents live. In order to understand better the geographic relationship between transportation services and where the disabled population resides, an analysis of census data was conducted. Chapter 2 presents the results of this analysis at the state and county level and presents a more detailed analysis for Essex, Middlesex and Cumberland counties to illustrate the extent to which there is municipal variation. The following is a summary of key findings from the analysis:
According to the 2000 Census, Essex County has the highest number of residents (140,551) reporting a disability. Hunterdon County has the lowest (12,130). Densities of people with disabilities range from a low of twenty six persons per square mile in Salem County to a high of 2,292 in Hudson County.
Statewide, almost one in five residents (17 percent) report having a disability. Hudson
County has the greatest proportion of disabled residents. Nearly one in four or 24 percent report being disabled. At nine percent, Hunterdon County has the lowest rate of disability. Morris, Sussex, and Somerset Counties have disability rates at least 5 percentage points lower than the statewide average. Essex and Passaic Counties have rates 5 or more percentage points higher than the average. The four counties with the

Meeting the Employment Transportation Needs of People with Disabilities in New Jersey
x
lowest rates of disability (Hunterdon, Morris, Sussex and Somerset) are either rural or suburban in character, while the three counties with the highest rates of disability (Hudson, Essex and Passaic) are more urbanized.
Similarly, patterns of disability by type vary across the state. In some cases however the
variation is more pronounced. For example, two in five working age disabled New Jersey residents (39%) report having a condition that makes it difficult to go outside the home. At the county level, five counties (Burlington, Cape May, Gloucester, Hunterdon, and Sussex) have go outside the home disability rates ten or more percentage points lower than the statewide average. At the same time, Hudson and Passaic Counties have rates more than ten percentage points higher than average. Once again, the counties with lower rates of disability are rural and suburban in character, while those with higher rates are more urbanized.
In the case of employment disability, more than two-thirds or 68 percent of the state’s
working age disabled population reported having a condition that makes it difficult to work at a job or business. Bergen County has the highest rate of employment disability (73 percent). Hunterdon County has the lowest (61 percent).
In New Jersey, rates of employment for working age people with no disability average 74
percent and range from a high of 80 percent in Hunterdon County to a low of 67 percent in Essex and Hudson Counties. Nearly 3 out of every 4 working age adults are employed.
For working age people with disabilities in New Jersey, the statistics are dramatically
different. Statewide, the percent of working age people with disabilities employed is approximately 58 percent, 15 percentage points lower than the statewide average for those without a disability. Variation between counties is also more pronounced than was evident among those with no disability. The county with the lowest proportion of employed residents with a disability is Cumberland County, where only 50 percent are employed. The county with the highest proportion of employed disabled residents is Hunterdon, where two thirds (67 percent) of disabled working age adults are employed.
Just as patterns of disability and employment at the county level vary widely throughout
the state, so do patterns at the sub-county level. As such, it is important to examine municipal level data when considering interventions to improve transportation options and services for people with disabilities.
Transportation options for people with disabilities in New Jersey The National Council on Disability reports that “[f]or many Americans with disabilities who cannot drive or who, if they could drive, do not have the resources for the adaptive driving controls, lifts, telescopic systems, or other assistive technology that may be necessary, accessible transportation represents one of the chief barriers to participation in economic and community life” (2002). A important component of this study was to inventory the range of transportation

Meeting the Employment Transportation Needs of People with Disabilities in New Jersey
xi
options available to people with disabilities in each of New Jersey’s twenty one counties and to document the service characteristics of available travel options. Chapter 3 briefly reviews different types of accessible transportation; describes the range of mobility options offered in New Jersey by public, nongovernmental and private sector transportation providers; and highlights a variety of service characteristics, including coverage area, hours of operation, available vehicles and seats, as well as fare and funding policies for many of the services inventoried. The following is a summary of key findings from the transportation inventory and survey:
NJ TRANSIT bus and rail service and Access Link A range of accessible transportation services are available in New Jersey, including:
traditional bus and rail services; Access Link, NJ TRANSIT’s ADA paratransit service; community transportation services operated by counties, nongovernmental organizations and municipal government; as well as medical transport vehicles, taxis and livery services.
NJ TRANSIT currently operates approximately 150 bus routes and contracts with private
companies to operate an additional 24 public bus routes. These routes are divided into two major types – local and commuter. According to NJ TRANSIT’s Guide to Accessible Services, 99 percent of all its local bus routes are accessible to passengers with mobility limitations. Commuter routes, which travel to New York, Philadelphia or Newark, require advance reservations for an accessible vehicle to be provided (NJ TRANSIT 2004).
NJ TRANSIT also operates a regional rail system consisting of eight commuter routes, two light rail systems and the Newark City subway. The combined system has 161 rail stations. According to NJ TRANSIT’s Guide to Accessible Services, 60 of its passenger rail stations are accessible to individuals with disabilities. In addition, its Hudson-Bergen Light Rail line and the Riverline light rail operating in Mercer, Burlington and Camden counties are fully accessible (NJ TRANSIT 2004).
Compliant with requirements of the Americans with Disabilities Act, NJ TRANSIT operates Access Link, a statewide paratransit service that “shadows” its fixed-route bus system within a ¾ mile buffer of existing bus routes. The system operates on a paid basis, with routes, hours of operation, and fares comparable to the standard bus network. Eligibility for Access Link is restricted and requires an in-person interview at a designated “Assessment Agency” office. To be eligible passengers must have a disability of a nature that precludes use of the public bus network (Palladino 2004).
Although information provided by NJ TRANSIT indicates compliance with ADA requirements, numerous consumer focus group and survey participants reported that that stop announcements are frequently not made or are inaudible; equipment such as wheelchair lifts, bridge plates and elevators are not always operable; and accessible station facilities are not well marked.

Meeting the Employment Transportation Needs of People with Disabilities in New Jersey
xii
Access Link operates on an appointment basis, with reservations required at least one day in advance. Vehicles may arrive at a pick-up point as much as twenty minutes before or after the desired pick-up time, creating a forty-minute window within which the vehicle might arrive (see Figure 3.2). There is no restriction or prioritization on the types of trips that can be made as long as they are within a ¾ mile radius of regular bus routes. Passengers are charged fares based on the standard local bus fare and number of fare zones traveled. Access Link services are organized into 5 service regions and all services are performed by third-party contractors (Palladino 2004).
County-operated community transportation services Each county in New Jersey operates its own community transportation system providing
a variety of transit and/or paratransit services to passengers with disabilities. In some counties transportation services are provided by one office or agency, in others, multiple offices, departments or agencies operate transport services. The extent and nature of service varies widely across counties in terms of the agency operating services, area covered, hours of service, types of service offered and reservation requirements.
Much of the county-to-county variation in community transportation service relates to the
type and amount of funding counties receive. Counties use a variety of funding methods.
- The most common source of funding is casino revenue also known as the Senior Citizen & Disabled Transportation Assistance Program (SCDRTAP). The second most common source of funding used by county agencies to support community transportation services is county funds.
- In 2005, the state administered Casino Revenue Fund is expected to receive $384 million dollars from casino taxes. Over $25 million dollars of that is set aside to fund transportation services for seniors and the disabled. Eighty-five percent of the funds are allocated to the counties. Ten percent of the remaining funds are used by NJ TRANSIT to administer the SCDRTAP program and the balance is set aside for NJ TRANSIT accessibility projects (Koska 2004).
- County transportation spending levels vary widely. While most rely significantly on SCDRTP funds, many also use other sources of funding, including Federal grants, Title III, XIX and XX funds, Medicaid, Job Access Reverse Commute funds, Veterans funding, county funds, contributions from municipalities, foundation support, donations and fares.
Demand-response services are available in all 21 counties. Most of these services require advance reservations, and trip purposes may be limited. All have pick-up and drop-off “windows” for when the transit vehicle may arrive and some do not allow and/or encourage scheduled work trips. Subscription service is available in all but two counties. Seven county paratransit providers and an additional five other county agencies offer fixed and/or flex-route services. Group services are available in ten counties.

Meeting the Employment Transportation Needs of People with Disabilities in New Jersey
xiii
One of the major limitations of many community transportation services is the generally limited times in which they operate. County-based services operate an average of 80 hours per week.
Every county paratransit provider operates during weekday business hours. Only a few provide service in the early evening, late at night or on weekends. Twenty one of the county agencies surveyed stated that, in general, they only provide service within their own county. All but two county paratransit providers (Somerset and Cape May) limit operations to the county of origin. This makes using county paratransit to travel to and from a work location in neighboring counties difficult.
The average fleet size for all county providers surveyed was 36 vehicles. County paratransit providers maintain slightly larger fleets with an average size of 46 vehicles. Typical fleets are composed of a mix of vehicles including sedans, small vans, mini-buses and buses. Somerset county has the largest fleet with more than 100 vehicles. Burlington has the smallest with less than 20 vehicles. Agencies reported that slightly less than half of the county paratransit vehicles are wheelchair accessible and about two-thirds of the overall 1,200 vehicles operated by county agencies surveyed are accessible.
A total of 25 county agencies reported serving the disabled as a “main” customer group. These included all of the 21 county paratransit providers who also identified seniors as their “main” customers.
More than half of the county agencies surveyed reported that the “main” purpose for their customers’ trips if for employment. This included 18 of the county paratransit providers. Although all of the county paratransit providers that receive SCDRTAP funding are required to provide employment transportation when requested, Burlington, Hudson and Ocean Counties did not identify employment as a “main” trip purpose for their customers. In addition, it should be noted that consumer focus group participants reported that employment trips are often considered lower priority than trips for medical and other purposes when making advance reservations.
Only 25 county agencies surveyed reported having eligibility criteria for people with disabilities wishing to use their services. Of those, 14 permitted self-evaluation of need, 11 require medical documentation (e.g., certification from a doctor) of a qualifying disability.
Twenty one agencies surveyed provide training for drivers on how to operate assistive devices such as wheelchair tie-downs and lifts. Only seven agencies provide training related to handling emergency situation and first aid, and sixteen agencies provide sensitivity training related to serving the disabled population.
Community transportation services provided by NGOs A significant component of the transportation provider network is nongovernmental
organizations (NGO) that provide a variety of social services including in places transportation for a variety of clients.

Meeting the Employment Transportation Needs of People with Disabilities in New Jersey
xiv
One third of the NGOs surveyed reported the state as a “main” source of funding. Twenty seven percent reported receiving funding from private foundations and 20 percent receive funding from county government. Other less significant sources include: fares and program fees, federal grants, Medicaid funding, and support from municipal government.
About half (56 percent) of the NGO providers surveyed operate demand response services. Somewhat fewer (42 percent) offer subscription services. Only 14 organizations offer fixed route or group services.
Service hours and areas reported by NGO providers were very similar to those reported by county providers. As was the case with county providers, the vast majority of NGO service providers operate during the morning commute (6-10 am), midday (10-3 pm) and evening commute (3-7 pm) periods. Only about 1 in ten provides early morning, late night or weekend service. Eight NGOs reported providing service seven days a week, 24 hours per day. On average, NGO providers operate about 45 hours per week.
In terms of area served, 47 NGOs or 48 percent reported serving only one county. This is a pattern similar to that reported by county providers. Another 28 NGO providers reported serving a multi-county service area. Twelve reported serving customers in a defined local (less than county) service area; and only 5 reported having no designated service boundary.
The average fleet size for NGO providers is small, only 8 vehicles. Most (86 percent) have fewer than 20 vehicles. The average fleet includes a mix of sedans, vans, and mini-buses. None of the NGO providers operate ambulances and only a few of the larger fleets include buses. Surprisingly, less than one quarter (187) of the total 854 vehicles operated by the NGOs surveyed was identified as being wheelchair accessible. This appears to be largely due in part to the reliance of some NGOs on sedans and small vans, which are generally not considered wheelchair accessible.
The overwhelming majority of NGO providers surveyed reported that their “main” customers were seniors and people with disabilities. Sixty one NGOs (77 percent) reported serving a single group as their “main” customers. Of these, 21 (34 percent) identified the disabled as the customer group they served. An additional 24 NGOs identified the disabled as one of the main customer groups served.
Only twenty two of the 98 NGO providers surveyed identified employment trips as a “main” trip purpose for their clients. Almost 60 percent of the NGO providers surveyed reported non-emergency medical trips as the “main” purpose.
Forty five NGO service providers indicated that they have some type of eligibility criteria for service. Sixteen organizations reported allowing disabled customers to self identify need for service, 24 require some form of medical documentation, and five require an interview or other agency evaluation for eligibility determination.
Fifty two NGO’s (53 percent) surveyed report requiring drivers to undergo training related to assisting passengers with mobility impairments. Thirty six require their drivers

Meeting the Employment Transportation Needs of People with Disabilities in New Jersey
xv
to be trained to deal with emergency situations and/or to administer first aid, and 39 stated that their drivers receive sensitivity training.
Private Medical Access Vehicle (MAV) services There are 189 private medical access vehicle (MAV) service providers registered to operate
in New Jersey. A review of business addresses indicates that MAV providers are more likely to be located in urban and suburban counties than in rural counties. This could be partially a reflection of the market-driven nature of MAV providers. They operate in densely populated areas where the need and demand for services is greater and the cost per mile of operation is lower.
Medicaid funds provide the large majority (66%) of the financial support for MAV providers.
The vast majority (92 percent) of the MAV agencies surveyed provide demand-response services. In addition, 39 agencies (64 percent) offer subscription services to their clients. Very few provide fixed-route or group services. Twenty-five of the providers surveyed offer only one type of transportation service. Of these, 20 (80 percent) provide only demand-response service, four offer subscription services and one agency operates a fixed-route service.
MAV providers have much more extensive hours of service than either the county-based or NGO operated services. Twenty-five providers or 41 percent operate 24 hours per day, seven days a week. The average MAV provider operates 121 hours per week. The minimum schedule of service is Monday through Friday, 8 am to 5 pm. However, all but one agency operates more than 45 hours per week. Fifty MAV agencies (83 percent) operate on Saturdays, and 28 (46%) operate on Sundays.
In general, MAV providers have a larger service area than either county or NGO service providers; however, MAV providers are not located in every county. More than half (62%) of the MAV agencies surveyed will transport clients within an area greater than one county. Nine agencies have no designated service area and will travel anywhere requested. Twelve operate within a single county, one is restricted to a defined set of municipalities and one agency operates within a single municipality.
The average fleet size for MAV providers is 16 vehicles, which include a mix of sedans, vans mini-buses and ambulances. As might be expected, most of the MAV providers surveyed operate ambulances.
More than half, 34 of the 61 providers surveyed, serve only one type of customer. Of this group, 24 agencies (71 percent) provide services exclusively to Medicaid recipients. Those agencies that provide service to more than one customer group most commonly transport Medicaid recipients and disabled clients. Twenty-six of the 61 MAV agencies (43 percent) interviewed serve the disabled population, and 17 of them (28 percent) provide transportation for the elderly.

Meeting the Employment Transportation Needs of People with Disabilities in New Jersey
xvi
Forty-eight agencies or 79 percent of those surveyed provide only trips for medical purposes. Thirteen agencies provide trips for more than one trip purpose. Only five agencies reported offering transportation for either employment or educational purposes, two stated that they will transport for recreation and one for shopping. As stated above, medical trips make up the vast majority of all trips provided by MAV agencies.
The MAV providers that make trips for a more diverse set of purposes, appear to be the
smaller operators that build a close relationship with their clients over a period of time. Although it may not be part of their policy or business plan, some smaller providers reported transporting regular medical trip clients to other purposes on occasion.
Of the 52 (85 percent) MAV agencies that reported never providing work trips, 46 of them offered an explanation. Thirty-four claimed that it was a result of the rules of their funding. This is a function of the high numbers of agencies heavily supported by Medicaid funds which can only be used to pay for medical trips. In addition, four agencies stated that it was due to the rules of their operation, two said they did not have the demand for employment trip service, and six agencies would not offer an explanation.
Twenty MAV agencies surveyed require medical documentation, reflecting the large number of agencies that transport Medicaid recipients. Two agencies only require that the passengers self-report their disability. Four MAV operators require either medical documentation, or a self-report, depending upon how the fare will be paid (e.g. Medicaid reimbursement or out-of-pocket payment). None of the MAV providers included in this survey conduct their own evaluation to determine eligibility. All 61 agencies surveyed operate their own vehicles.
All but one of the agencies surveyed stated that they require their drivers to be certified in
First Aid. In addition, 59 reported that their drivers are trained to assist passengers with mobility impairments, and 54 stated that their drivers receive sensitivity training. These high numbers of trained drivers may be due to the fact that many of the MAV agencies operate ambulances as well as other types of vehicles.
Transportation Needs Analysis Personal mobility is an important component of quality of life for everyone. For the general population, personal mobility is largely defined by the ability to drive and access to a private automobile. While public transportation is a consideration for some, the vast majority of all trips made in the United States are made by car. For people with disabilities, the concept of personal mobility is more complex, especially for those who are sight impaired or who have mobility impairment(s) that require the use of a wheelchair or other assistive device. National statistics indicate that more than half of non-working adults with disabilities studied encountered difficulties looking for work. Twenty-nine percent cited lack of transportation as a reason why they were discouraged from seeking work. Nineteen percent reported needing an accommodation in the form of accessible parking or an accessible transit stop nearby to take and keep a job (Loprest 2001).

Meeting the Employment Transportation Needs of People with Disabilities in New Jersey
xvii
In order to document and understand better the transportation barriers to work faced by people with disabilities in New Jersey, the research team convened and facilitated a series of focus groups, designed and administered a consumer survey and conducted an access and work “opportunity” analysis exploring the relationship between consumer residence data, data on available transportation services and employment data. Chapter 4 documents the focus group and consumer survey findings as well as the results of the spatial data analyses used to identify patterns of access and work “opportunity” for people with disabilities living in the state. The following is a summary of key findings from the focus groups, consumer survey and access and work opportunity analysis:
Focus Groups The mode of transportation most frequently cited by participants as their means to get
to/from work was driving. Other frequent responses included Access Link, taxi/car service, county paratransit and traditional bus and rail transit services. Participants reported that a variety of factors, including their disability, affect their choice of transportation mode to/from work. For those not driving, factors considered included service schedules, cost, reliability, ease of access and prescribed wait times, as well as personal safety (both during a trip and at trip locations).
Residential location and accessibility to different transportation options can greatly
influence individual decisions to seek employment. Furthermore, the often overwhelming task of trip planning within the current system and the uncertainty and irregularity of service can affect an individual’s work experience as well as their decision to remain employed.
Many people with disabilities and their service providers believe that the fragmented
nature of the current transportation system makes it challenging to find an appropriate means of getting to/from work. Furthermore, the availability and quality of transportation services often varies depending on geographic location and transportation needs often vary depending on client disability.
From a consumer’s perspective, there are a number of problems with county paratransit services, including: advance reservation requirements, changing schedules and varied routing, various service restrictions (e.g. age requirements for travel) and unwillingness of most county-operated services to cross county lines, making demand response services not conducive to daily commute trips. This conflicts with the expectations of consumers who don’t understand how the system works.
There is no central source for transportation information and/or trip planning assistance. Issues related to trip planning, scheduling and personal safety often hinders employment options. There was strong support for the idea of developing a website for disabled persons which includes information related to transportation options.
There are differing and often conflicting expectations related to the level of service offered and possible from county paratransit systems. This creates problems for clients, drivers and managers. For example, drivers explained that many disabled clients want services similar to a door-to-door taxi service, whereas existing paratransit services are

Meeting the Employment Transportation Needs of People with Disabilities in New Jersey
xviii
required by law or regulation to operate curb-to curb service. As such, some clients expect drivers to provide assistance in getting to and boarding the vehicle. However, due to liability issues, drivers are not permitted to provide such assistance.
Travel behavior of persons with disabilities is highly dependant on the nature and extent of their disability as well as the transportation environment. Both of these factors may influence whether or not a disabled person is working or able to retain employment.
Specific characteristics of the transportation environment that pose challenges to disabled persons include: eligibility requirements; multiple pick-ups and long routes; lack of advance notice or communication regarding schedule delays and arrival times; policies regarding boarding and alighting assistance; driver rudeness, impatience, insensitivity; policies related to scheduling, including advance reservation requirements and cancellation consequences; Access Link’s 3/4 mile service area; pick-up/drop-off window (e.g., 20 minutes before and 20 minutes after scheduled time); lack of transportation options/alternatives in some areas; vehicle safety issues; and difficulty with making linked trips.
Consumer survey Most working age unemployed survey respondents (74 percent) reported that they were
not actively looking for work. Fourteen percent indicated that lack of transportation was a barrier to seeking employment. Regarding transportation as a barrier to work, respondents provided the following reasons:
- 26 percent reported that service was not available at the right times; - 17 percent reported that they need assistance to get to a train or bus stop; - 15 percent reported that their disability prevented them from traveling; - 13 percent indicated that it was difficult to obtain transportation; - 11 percent reported that there were no accessible transportation options available
in their area; - 7 percent indicated that transportation was not accessible based on their disability
type; and - 11 percent indicated that transportation was a barrier for other reasons.
Ten percent of all employed working age survey respondents reported owning a private
car or van they used regularly for transportation. Interestingly, a slightly larger percentage (16 percent) of unemployed working age respondents own a vehicle. Less than one quarter of employed working age respondents (18 percent) reported needing a wheelchair accessible or specially equipped vehicle to travel. In contrast, almost two in five unemployed working age respondents or 38 percent reported needing an accessible vehicle.
More than one-third of survey respondents (35 percent) reported using Access Link most
often for non-work travel. Traveling as a passenger in a private automobile was the second most frequent means of travel for non-work purposes. Interestingly, only seven

Meeting the Employment Transportation Needs of People with Disabilities in New Jersey
xix
percent of survey respondents reported using county paratransit “most often” for non-work travel.
Among employed survey respondents, Access Link was the most frequently reported
means of traveling from home to work. More than two-thirds (69 percent) indicated they use Access Link at least once per week for commuting purposes. Very few respondents traveled by taxi, worked from home, walked or biked to work.
Approximately 23 percent of employed survey respondents reported that their job
required travel during the business work day. Of those, almost half (43 percent) indicated they most often use Access Link for business travel during the day.
Most (approximately 80 percent) of the survey respondents have some experience using
Access Link. The same is not true for the other modes. Personal experience with other modes drops to approximately 65 percent for traditional bus and train, 62 percent for county paratransit and 37 percent for taxis. These rates of experience generally reflect perceptions of service availability as reported by survey respondents. For example, when asked if different types of transportation service were “available in their area,” 84 percent reported that Access Link was available, while far fewer reported that bus and train service (36 percent), county paratransit (35 percent) or taxi service (38 percent) was available.
Only half (53 percent) of those expressing an opinion agreed that bus and train services
were “convenient.” Less than half (46 percent) felt bus and train service was “easily accessible” for someone with their disability. Similarly, less than half (47 percent) felt that it was “flexible.” Approximately two thirds felt that services were “safe” (64 percent) and “reliable” (66 percent). More than three quarters felt that the cost of service was “reasonable” (83 percent), that drivers were “friendly and helpful” (77 percent) and that vehicles were “clean and well maintained” (80 percent).
Most survey respondents expressed a favorable opinion of Access Link service in every
category. Approximately nine out of ten respondents reported that Access Link services were “convenient” (85 percent); priced reasonably (88 percent); “easily accessible” for someone with their disability (89 percent); and “safe” (94 percent). Similarly, the vast majority of respondents felt that Access Link vehicles were “clean and well maintained” (94 percent) and that drivers were “friendly and helpful” (91 percent). Somewhat less felt that Access Link services were “reliable” (75 percent) and “flexible” (69 percent).
Only one third of survey respondents indicated having any experience using county-
operated community transportation options. Of those expressing an opinion related to the quality of county paratransit, the vast majority expressed favorable opinions in most categories.
About two in five (38 percent) survey respondents reported that taxi services were
“available in their area.” Of those with personal experience using taxi services, about half felt that taxis were “convenient” (54 percent) and “easily accessible” (55 percent) for

Meeting the Employment Transportation Needs of People with Disabilities in New Jersey
xx
someone with their disability. Somewhat more felt that taxis were “reliable” (57 percent) and vehicles were “clean and well maintained (58 percent). Approximately two-thirds of those expressing an opinion felt that taxis were “flexible” (65 percent) and “safe” (64 percent). About three quarters felt that drivers were “friendly and helpful” (74 percent). Only 17 percent of survey respondents expressing an opinion felt that the cost of using a taxi was “reasonable.”
Fifty-eight percent of survey respondents felt they received “adequate information”
regarding available transportation options. Most (52 percent) reported currently receiving information via direct mail. Twenty eight percent receive information through the newspaper or some other form of general media and 25 percent receive information from employment counselors or other social service providers. Less than one quarter (16 percent) receive information on transportation options by word-of-mouth and very few reported currently receiving information via the Internet (7 percent) or by telephone (4 percent).
In terms of the future, both men and women are interested in receiving more information
via the Internet (31 percent) and direct mail (85 percent). Both men and women would like to continue to receive information from employment counselors and other social service providers (40 percent and 23 percent respectively) and from newspapers or other media sources (37 percent and 36 percent respectively). Finally, survey respondents regardless of gender expressed the desire to depend less on friends, family and word-of-mouth to receive information on transportation options.
Access and work opportunity analysis
Transit coverage varies dramatically by county. Essex and Hudson Counties have the most route miles of bus services and the greatest land area within one quarter mile of bus routes and rail stations. More than two thirds of the counties’ land area falls within a quarter mile of fixed route transit service. On the other end of the spectrum, five counties, Cumberland, Hunterdon, Salem, Somerset, Sussex and Warren, have very few route miles of bus service available; and less than 10 percent of each county’s land area is located proximate to fixed route transit.
Similar patterns can be seen when considering land area within Access Link’s three
quarter mile service area of fixed route bus lines. Once again, Essex and Hudson have the greatest proportion of total land area located within a three quarter mile buffer of existing bus routes. Ninety one percent of Essex County’s land area and 79 percent of Hudson County’s land area fall within the Access Link service boundary. Somerset, Sussex and Warren counties have the least coverage. Only eight percent of Somerset County is served by Access Link; and Sussex and Warren counties have virtually no land area within the Access Link service boundary.
Bergen, Essex, Hudson, Mercer, Morris, Salem and Somerset counties all operate county
paratransit services an average of 12 or more hours per day each work day. Bergen,

Meeting the Employment Transportation Needs of People with Disabilities in New Jersey
xxi
Ocean, and Somerset Counties operate the largest paratransit fleets in the state, both in terms of total vehicles and estimated available seats. The smallest systems are operated by Burlington and Essex Counties. Each have fleets with 25 or less vehicles and have an estimated 300 or fewer available seats. Salem and Somerset Counties have the highest ratios of available seats to residents, while Essex, Burlington, Hudson, and Union have the lowest ratios.
Transit services are far more accessible to disabled residents living in the state’s
urbanized counties, than for those living in rural counties. For example, more than 90 percent of go outside the home disabled residents live within the Access Link service boundary in Bergen, Camden, Essex, Hudson, Passaic and Union Counties, while less than 50 percent of go outside the home disabled residents in Hunterdon, Salem, Somerset, Sussex, and Warren Counties are served by Access Link. Each of these counties can be characterized as mostly rural or low density suburban.
When comparing proportion of land area within the Access Link service boundary with
the proportion of go outside the home disabled living within the service boundary, the ratios are very different. In most counties a far greater proportion of disabled residents are served by Access Link than might otherwise be estimated if considering only the proportion of land area covered.
The vast majority of jobs in most counties are located within the Access Link service
area. The most notable exceptions are Hunterdon County, where only 27 percent of jobs are served by Access Link; Somerset County, where 49 percent of jobs are served; Sussex County, where only 14 percent of jobs are served; and Warren County, where 51 percent of jobs are located within the Access Link service boundary. With very few exceptions, patterns of job accessibility are very similar when considering jobs associated with large employers and key industry sectors.
A comparison of the three key measures of access and work opportunity appears to
indicate that the counties with the lowest levels of access to traditional public transit and Access Link, by necessity, have compensated by operating strong county paratransit systems. For example, Hunterdon, Salem, Somerset, and Warren counties have among the lowest rates of transit and Access Link coverage. At the same time, they have the highest ratios of available paratransit seats per 1,000 residents. Similarly, the counties with the highest rates of transit and Access Link coverage (Camden, Essex, Hudson, Passaic, and Union) are those with weaker paratransit systems in terms of available seats per 1,000 residents. The remaining counties, which are mostly suburban in nature have less access to traditional transit and Access Link services and because the capacity of existing paratransit systems are generally lower, there is greater competition for available paratransit seats.
Institutional Barriers, Best Practices and Model Programs Chapter 5 considered institutional barriers to transportation reform and specifically the challenge of coordinating human services transportation. It also examines the prospects for better

Meeting the Employment Transportation Needs of People with Disabilities in New Jersey
xxii
coordination in New Jersey. Finally, it describes a series of best practices and model programs for expanding transportation options and enhancing transportation services. The following is a summary of key findings related to coordinating better human services transportation in New Jersey and best practices and model programs for expanding transportation options and enhancing transportation services:
Coordinating transportation services better for transportation disadvantaged persons has been on the public policy agenda for decades (GAO 2003). Transportation coordination, as defined by the Federal Transit Administration, involves providing specialized transportation through “…a process by which representatives of different agencies and client groups work together to achieve any one or all of the following goals: more cost-effective service delivery; increased capacity to serve unmet needs; improved quality of service; and services which are easily understood and accessed by riders” (FTA, 2004).
According to the United States General Accounting Office, barriers to coordination include:
- Unwillingness or inability to share vehicles due to the different needs and characteristics of client populations;
- Perception of the high costs of coordination from the provider perspective;
- Lack of feasibility for coordination in areas lacking a range of transportation services or options;
- Inconsistency among programs with regard to rider eligibility, funding sources, reporting requirements, safety standards and programmatic goals and missions;
- Lack of guidance from federal level officials on implementation strategies; and
- Lack of leadership or commitment on the state level to guide coordination.
According to the National Governor’s Association, coordination among transportation providers and agencies can increase transportation availability and access to jobs, enhance service quality, eliminate duplicative efforts, and improve the cost effectiveness of transportation dollars (NGA, 2000).
The most recent federal initiative designed to promote coordination of human services
transportation is “United We Ride,” an interagency collaboration designed to support states and local governments to deliver coordinated human services transportation. United We Ride grew out of Executive Order 13330 signed by President Bush in February 2004. The Executive Order established the Interagency Transportation Coordinating Council on Access and Mobility (CCAM), chaired by the Secretary of Transportation. The council includes representation from eleven Federal departments, including the Departments of Transportation, Health and Human Services, Labor, Education, Housing and Urban Affairs, Agriculture, Justice, Interior, the Veterans Administration, the Social Security Administration, and the National Council on Disabilities. According to the executive order, “the purpose of the council is to

Meeting the Employment Transportation Needs of People with Disabilities in New Jersey
xxiii
coordinate 62 different Federal programs across 9 Federal departments that provide funding to be used in support of human services transportation” (EO 13330 2004).
The most recent evolution of New Jersey’s interest and on-going effort to coordinate
human services transportation was catalyzed by the federal United We Ride effort. New Jersey has formed a state level Coordinating Council on Access and Mobility (NJCCAM) that mirrors the membership of the federal body. The council has been meeting monthly since 2004 and has sponsored a series of statewide forums as well as an effort to inventory the range and amount of funding used to provide and support human services transportation in the state.
There are many examples of best practices and model programs from around the country
related to coordinating human services transportation and providing accessible transportation services. These include but are not limited to:
- Coordinating paratransit and fixed route transit;
- Using taxi coupon and voucher programs to expand transportation options;
- Providing travel training for people with disabilities;
- One-stop transportation centers;
- Using Job Access Reverse Commute funds to support employment transportation for people with disabilities;
- Providing emergency ride home programs for people with disabilities commuting to work by transit or paratransit;
- Using a brokerage model to coordinate human services transportation; and
- Using flex-route services to enhance mobility and paratransit system efficiency
Recommendations The continuing debate over how to best provide superior transport service to transportation disadvantaged persons points to the conclusion that the transportation system needs to provide a diverse set of accessible service options, tailored to a specific region. New Jersey’s past experience and the best practices and model programs highlighted in Chapter 5 show that unique and successful types of service result from creative thinking and a willingness to take the risk to try something new. This study suggests two broad based recommendations. First, mandated coordination between the public and private sector could enhance service and make use of available but underutilized or untapped resources. And second, a mechanism for implementing a variety of types and levels of service throughout the varied regions in the state would further the goal of improved employment transportation for the disabled population. This study highlights the complexity of the problems facing human services agencies dealing with the provision of transportation services for people with disabilities. Even when users can use paratransit to travel to work, there are issues that limit the use and effectiveness of the systems. The variety of locations that can be reached is often constrained, and systems often stop at county boundaries. This causes critical physical and information disconnects in the overall system from a users’ perspective. Often there is no single place users can go to get

Meeting the Employment Transportation Needs of People with Disabilities in New Jersey
xxiv
information about all available transportation options. Unfortunately some service limitations are characteristics of the type of paratransit being offered. For example, any demand-responsive system requires a time window for pick up, and it is inevitable that sometimes the vehicle will not arrive in the given window. However, other issues affecting demand-responsive services are solvable. Problems such as the fear of being left stranded in case of a family emergency, or being unable to travel with children, can be mitigated by means of a guaranteed ride home program or changing the eligibility requirements.
For any system, there are choices to be made from a menu of types of service options, such as fixed route, door-to-door, etc., as well as days and hours of operation, service areas, and integration levels with other providers. There are a variety of user needs in terms of mobility limitations, trip purposes and destinations, and times of travel. Early paratransit systems often were ad hoc, created in isolation with corollary inefficiencies. Today increased coordination among systems is essential. Beyond coordination there is also the need to focus on more traditional transportation planning endeavors, such as revising transit routes and scheduling and assessing vehicle needs. Finally, the central focus must be on the consumers of transportation services, providing the highest level of care possible.
There are a variety of actions or policy initiatives that can be explored to better assist people with disabilities in meeting their mobility needs. Some actions or initiatives will involve coordination across agencies and entities that currently operate independently, some will involve changes in current practices in the delivery of existing services, and some will involve sensitizing the public and service providers to the mobility needs and expectations of the disabled population. Other actions or initiatives will involve educating the disabled population on their mobility options, how to effectively advocate for change, and creating a forum to encourage communication and sharing of ideas, opinions and feelings among the disabled and other interested parties.
Personal mobility is a sensitive and powerful issue for persons with disabilities. The absence or presence of mobility affects perceptions of esteem, worthiness, capability, freedom, comfort, independence and significance and can impact employment options and healthcare choices.
The following are a series of recommendations intended to help meet the employment transportation needs and improve/enhance overall mobility for people with disabilities living in New Jersey:
Foster awareness and understanding regarding the employment transportation needs of people with disabilities in New Jersey, the range of transportation options currently available and the benefits of coordinating transportation services at the state and local level, especially among elected officials, business leaders, and transportation providers.
- The Division of Disability Services (DDS) should convene a statewide conference to provide consumers, employers, elected officials, employment counselors, social service providers and transportation providers with a venue to discuss consumer needs and expectations related to transportation, service delivery limitations and paratransit resource needs as well as opportunities for coordinating existing services. The conference should highlight best practices and model programs for enhanced coordination and service delivery.
- DDS, working with NJ TRANSIT and county paratransit providers, should develop informational materials and training programs for consumers on the range of

Meeting the Employment Transportation Needs of People with Disabilities in New Jersey
xxv
transportation options currently available throughout the State and how to access and use those services.
- DDS, working with the Department of Labor and other partners, should develop and disseminate informational materials for employment counselors, vocational rehabilitation specialists and employers regarding the range of transportation options available, the unique transportation needs of people with disabilities and how those needs can be accommodated to support employment in a competitive work environment.
Participate fully in the United we Ride initiative, which is designed to improve and enhance the coordination of human services transportation at the Federal, State and local level.
- State agencies should continue to advance coordination efforts related to human services transportation in New Jersey. Currently, the most effective means to do this appears to be the New Jersey Coordinating Council on Access and Mobility (NJCCAM) formed in 2004. NJCCAM’s success thus far in advancing a coordination agenda has been hampered by what appears to be too little commitment and interagency support at the cabinet level. Agency staff engaged in the NJCCAM process and disability advocates should strongly urge the Governor to sign a draft Executive Order prepared by NJCCAM. The Executive Order would require cabinet level commitment and participation in the coordination process.
- NJ TRANSIT and the NJ Department of Human Services, through the NJCCAM process, should undertake a statewide human services transportation planning process designed to update the county community transportation plans developed in 1999-2000 as part of the Workfirst New Jersey initiative. These plans provide a solid foundation on which to build a more comprehensive inventory of services and action agenda to address gaps in available transportation services for people with disabilities. It is anticipated that such plans will be required for New Jersey to be eligible to receive New Freedom Initiative grant funds from the Federal Transit Administration beginning in Federal fiscal year 2006. The data collected as part of this study should be a valuable contribution to the planning process.
Expand the resources available to improve and enhance transportation services for people with disabilities.
- The State should reexamine the current formula used to allocate funds distributed as part of the Senior Citizen & Disabled Transportation Assistance Program (SCDRTAP) administered by NJ TRANSIT. Revenue from the SCDRTAP is the most common source of funding used by county paratransit providers. Currently the funding distribution formula is based on the percentage of county population over the age of sixty. This formula generally favors urban counties and does not fully account for the population of people with disabilities. In addition, it does not consider access to traditional public transit services which are generally more available in urban counties. Modifications to the funding allocation formula should be considered to

Meeting the Employment Transportation Needs of People with Disabilities in New Jersey
xxvi
account for these additional factors and to ensure that funds are being allocated based on the needs of the consumers intended to be served by the program.
- County paratransit providers and other transportation operators should consider making greater use of fares. Currently, very few collect fare revenue. Fare policies should be based on a riders ability to pay and fare collection could be facilitated through the use of smart card technology. The collection of additional fare revenue could support the expansion of services.
- As additional resources become available, county paratransit and other service providers should expand their hours of operation to accommodate work-related commutation and shift employment.
Work cooperatively to create a more seamless community transportation system and consistently work toward improving and expanding travel options available to people with disabilities.
- NJ TRANSIT and county paratransit providers should expand the use of flex-route transit services where feasible and appropriate. Carefully planned and implemented flex-route services have the potential to increase the efficiency of existing paratransit operations and offer expanded service options to people with disabilities.
- County paratransit providers and NGO service providers should explore partnership opportunities and examine ways to link better their services with existing fixed route transit operated by NJ TRANSIT and others. By making better connections and providing coordinated transfers, paratransit systems can “feed” riders to accessible fixed route services that are less expensive to operate, serve multiple jurisdictions, and operate on regular schedules with reasonable frequencies.
- County paratransit providers should develop ways to facilitate and or provide service to and from origins and destinations that cross county boundaries. This could be accomplished by changing policies that restrict operation to in-county locations, entering into inter-local agreements with neighboring counties and through other appropriate means.
- Transportation providers should employ technology, such as real-time and/or centralized dispatching, to better meet consumer needs and service expectations, especially with regard to advance scheduling, wait time “windows,” general service reliability and timeliness.
- To the maximum extent feasible, NJ TRANSIT, county paratransit providers, and other service providers should work toward creating more uniform policies and procedures concerning eligibility determination, passenger assistance practices, scheduling and fare/payment policies. Surveys, interviews and focus groups conducted for this study confirm that there is wide variation regarding the policies and procedures followed by different services providers. This variation causes confusion among consumers and contributes to a significant expectation gap between what consumers expect from the transportation system and what the transportation system can and does provide throughout the state. Further, inconsistent policies and procedures complicate and discourage service coordination.

Meeting the Employment Transportation Needs of People with Disabilities in New Jersey
xxvii
- Transportation management associations (TMAs) that offer emergency ride home (ERH) programs serving commuters traveling by carpool, vanpool and public transportation should ensure that those services can accommodate people with disabilities traveling to and from work by similar means. The NJ Department of Transportation, which provides support funding to TMAs, should work with them to establish fully accessible ERH programs in every county.
Increase the number of accessible vehicles and facilities available from all public, private and NGO service providers.
- Ensure that NJ TRANSIT is complying with the requirements of the Americans with Disabilities Act. Although information provided by NJ TRANSIT indicates compliance with the law, numerous consumer reports received as part of this study’s focus groups and surveys indicate that stop announcements are frequently not made or are inaudible; equipment such as wheel chair lifts, bridge plates and elevators are not always operable; and station facilities are not well marked. NJ TRANSIT should strive toward a goal of universal accessibility for all of its services.
- Reform the State’s taxi and livery license laws to require that a minimum portion of each operator’s fleet is wheelchair accessible. The State should provide incentives to encourage compliance and facilitate the retrofitting of existing fleets over time.
- Establish minimum accessibility requirements for county paratransit fleets and NGO providers receiving State and Federal funds. Information collected for this study indicates that less than half of the county paratransit fleet statewide is wheelchair accessible. Less than one quarter of the NGO fleet inventoried for the study was wheelchair accessible.
Develop a concierge/brokerage service demonstration project that would offer coordinated, seamless trip planning and scheduling assistance to disabled individuals throughout the state.
- DDS should work with NJ TRANSIT to create a Regional Travel Concierge service as a three year demonstration project designed to address transportation barriers to work for people with disabilities and other transportation disadvantaged populations. The demonstration project should build on the significant body of research already conducted for this study regarding the transportation needs of people with disabilities in New Jersey and the transportation services available in each of state’s twenty-one counties. The project should be implemented in two phases. The first phase which should focus on planning activities would occur over the first year of the three year demonstration period. Significant components of phase one should include but not be limited to:
a) Developing a request for proposals and managing the procurement process for selecting a local implementation partner (e.g., county government, transportation management association or other nongovernmental organization);

Meeting the Employment Transportation Needs of People with Disabilities in New Jersey
xxviii
b) Supplementing existing databases as needed to ensure an accurate and up to date inventory of transportation services, providers and eligibility requirements in the demonstration region;
c) Developing model policies and procedures to guide implementation of the regional concierge services and monitor and evaluate its success;
d) Negotiating memoranda of agreement with various transportation and social service providers to ensure cooperation relative to brokering their services; and
e) Developing public relations and marketing strategies to get the word out about the service.
Phase two should focus on implementation, monitoring and evaluation over the remaining two years of the demonstration period.
Create an Internet-based one-stop for information on available transportation options and services for disabled persons.
- DDS should seek out partners to create a one-stop Internet “web portal” to improve access to information on transportation options for people with disabilities. The web portal should contain information related to: the types of services available in each of New Jersey’s 21 counties, contact information for existing service providers, use and eligibility requirements for existing services, hours of operation, reservation procedures, fare policies, and other relevant information with an emphasis on those service characteristics relevant to employment travel needs. To the extent feasible and appropriate, the “web portal” should incorporate Internet mapping technology to communicate service information and to facilitate trip planning. This effort should build upon the extensive database of transportation service information collected as part of this study. In addition, DDS should explore making the one-stop information available via an 800 telephone number.
Increase driver education and training on a variety of topics, including the use of wheelchair tie-downs and lifts, bridge plate operation; emergency preparedness and first aid as well as driver sensitivity.
- NJ TRANSIT and county paratransit providers should expand the availability of driver training programs and require drivers to participate in skill enhancement training on a regular basis. Only half of the 40 county providers surveyed for this study require training related to operating wheelchair tie-downs and lifts. Fewer than one quarter required emergency training and less than half required sensitivity training related to serving disabled consumers.
Expand the quality and availability of travel training programs for people with disabilities and the employment/social service counselors that serve them.

Meeting the Employment Transportation Needs of People with Disabilities in New Jersey
xxix
- DDS should work with NJ TRANSIT, county paratransit providers, and other related agencies to develop travel training curricula for people with disabilities. The travel training programs should include modules on what services are available and how to use them. The training should be available as a component of workforce development services. In addition, employment counselors and vocational rehabilitation specialist should be required to complete the training program so they can more effectively advise their clients.
Ensure transportation service planning at all levels incorporates and addresses the transportation needs of people with disabilities.
- All agencies and organizations involved in the transportation planning process should ensure that the needs of people with disabilities are considered as part of all planning activities. Input from the disabled community should be solicited on an on-going and regular basis. Planning efforts should recognize the diverse mobility needs of persons with disabilities which can vary significantly based on disability type, severity and employment status. Agencies should seek to create non-traditional opportunities for input and take extraordinary steps to include consumers in the planning and policymaking process so that service changes and enhancements best meet their needs.
Implementation Implementing the above recommendations will require the participation and sustained commitment of many organizations, agencies and individuals. The recommendations represent an aggressive but achievable action agenda of legislative, regulatory, programmatic and policy changes necessary to ensure improved mobility options for people with disabilities living in New Jersey, with a special emphasis on those working in or seeking employment in a competitive work environment. Potential implementation partners include members of the New Jersey Legislature; state agencies, including: New Jersey Department of Transportation (NJDOT), NJ TRANSIT, New Jersey Department of Human Services (NJDHS); the NJDHS Division of Disability Services; counties; and a variety of nonprofit service and advocacy organizations. In addition, for its part, the Alan M. Voorhees Transportation Center is committed to focusing attention on transportation equity and the mobility needs of transportation disadvantaged populations as critical public policy issues facing New Jersey. Toward that end, we will continue to work with the Division of Disability Services and its partners to facilitate and monitor implementation of the recommendations. Table 6.1 provides a framework for implementation by identifying which potential partners could take a leadership and/or supporting role in advancing specific recommendations.

Meeting the Employment Transportation Needs of People with Disabilities in New Jersey
xxx
Table 6.1: Implementation Matrix
Potential Leadership/Supporting Partners
Recommendation NJD
HS
- DD
S
NJD
HS
NJ
TRA
NSI
T
NJD
OT
Cou
ntie
s
NJ
Legi
slat
ure
Other
1. Foster Awareness and understanding regarding the employment transportation needs of people with disabilities in New Jersey, the range of transportation options available and the benefits of coordinating services.
NJ Dept. of Labor
2. Participate fully in United We Ride initiative, which is designed to improve and enhance the coordination of human service transportation.
Other state agencies
providing transportation
services
3. Expand the resources available to improve and enhance transportation services for people with disabilities.
4. Create a more seamless community transportation system and consistently work toward improving and expanding travel options for people with disabilities.
NGO
transportation providers
5. Increase the number of accessible vehicles and facilities available from public, private and NGO service providers
NGO service providers, private
taxi and livery companies
6. Develop a concierge/brokerage service demonstration project
NGO transportation
providers, TMAs
7. Create and Internet-based one-stop for transportation information.
8. Increase driver education and training. NGO Service providers
9. Expand the quality and availability of travel training for people with disabilities. NJ Dept. of
Labor, TMAs
10. Ensure transportation service planning at all levels incorporates and addresses the transportation needs of people with disabilities
NOTE: = potential leadership partner = potential supporting partner

Meeting the Employment Transportation Needs of People with Disabilities in New Jersey
1
CHAPTER 1: INTRODUCTION
1.1 Background Getting and keeping a job can be a challenge for anyone, regardless of disability status. For people with disabilities in New Jersey, the challenge can be even greater. Although the state has a large and extensive public transportation network, many suburban and rural areas have little or no public transportation. In addition, in areas where transportation options are available, they are not always accessible and affordable. In an effort to address transportation and other barriers to work for people with disabilities wishing to work in a competitive work environment, in 2000, the New Jersey Department of Human Services, Division of Disability Services (DDS) applied for and was awarded a Ticket to Work and Work Incentives Improvement Act of 1999 Medicaid Infrastructure Grant from the federal Health Care Financing Administration. The goal of the project, is to design and implement services that support individuals with disabilities as they secure and sustain competitive employment in an integrated setting. As part of the project, DDS contracted with the Alan M. Voorhees Transportation Center at Rutgers, The State University of New Jersey (VTC) to develop a five-year transportation plan intended to identify and document transportation barriers to work for people with disabilities and make recommendations related to addressing the identified barriers and providing enhanced transportation services in a variety of settings throughout the state. The following report is the culmination of that work.
1.2 Report overview This report is organized into a series of chapters. Chapter one provides an overview of the broad policy context in which this planning study was undertaken. It also provides a section on disability and transportation-related definitions and highlights several comparable planning studies undertaken in New Jersey and elsewhere. Chapter two describes the “geography” of disability in New Jersey. It presents data and maps to facilitate a basic understanding of statewide and county patterns related to population and disability. Finally, Chapter two presents a more detailed analysis of patterns in Cumberland, Essex and Middlesex counties to illustrate the degree to which patterns vary at the sub-county level. Chapter three presents an inventory and assessment of transportation services in New Jersey. It begins with a general overview of the types of accessible transportation service generally available to meet the travel needs of transportation disadvantaged populations, describes the range of transportation services available in New Jersey, and concludes with a discussion of the results from a transportation provider survey conducted by the research team. Chapter four documents the transportation needs of people with disabilities in New Jersey. It describes the results of a series of focus groups conducted with consumers, county paratransit

Meeting the Employment Transportation Needs of People with Disabilities in New Jersey
2
providers, and vocational rehabilitation counselors and summarizes the findings of a consumer survey conducted as part of the study. Finally, it provides the results of an access and work opportunity analysis that utilized population, employment and transportation data to understand better the spatial relationships between residential location, job availability and access to transportation. Chapter five considers institutional barriers to transportation reform. It discusses the challenge of coordinating human services transportation and examines the prospects for better coordination in New Jersey. Finally, it describes a series of best practices and model programs for expanding transportation options and enhancing transportation services. The final chapter in the report, Chapter six, presents a series of recommendations aimed at addressing the transportation barriers to work for people with disabilities in New Jersey seeking a job and working in a competitive work environment.
1.3 Definitions A wide range of specialized terms and definitions characterize the literature on both disability and transportation policy. Definitions of disability vary throughout the literature and across federal laws and programs. In fact, one study notes that more than twenty definitions of disability are used “…for the purposes of entitlement to public or private income transfers, government services, or statistical analysis” (Burkhauser et al. 2001). Brukhauser et al. suggest that disability definitions should be considered within a broader conceptualization of disability. They argue that the Nagi model provides the best framework for understanding a range of disability definitions:
In the Nagi model, disability is a dynamic process in which an individual’s pathology interacts with the socioeconomic environment. The dynamic nature of the disability process is represented by the movement through three stages: pathology, impairment, and disability. The first stage, pathology, is ‘the presence of a physical or mental condition that interrupts the physical or mental process of the human body.’ An example is deafness. This leads to the second stage, impairment, which Nagi defines as a physiological, anatomical, or mental loss or abnormality that limits a person’s capacity to function. For example, deafness limits the ability to interpret sound. The final stage, disability, is an inability to perform or a limitation in performing roles and tasks that are socially expected. For example, a person with deafness is unable to use the telephone (Burkhauser et al. 2001).
The model provides a basis for understanding the often subjective definition of disability which may change over time and/or depending on one’s perspective. For example, two individuals may have a similar physical or mental condition that could lead to impairment and/or disability; however, because each individual is affected by different life circumstances and exists in a different environmental context, the outcome of this condition may be different. The condition may or may not limit a person’s ability to function and although it may limit their ability to function, it may or may not limit their ability to perform a “socially expected” role such as working. Similarly, a person’s condition, circumstances and environment may change over time, resulting in a different outcome. Understanding the subjective nature of disability definitions is especially important when considering disability data, which is very often self-reported. For

Meeting the Employment Transportation Needs of People with Disabilities in New Jersey
3
example, one person’s condition and impairment may lead them to report a disability, while another individual with a substantially similar condition or impairment may not report being disabled. The Americans with Disability Act (ADA) defines disability as “a physical or mental impairment that limits substantially one or more major life activities, a record of such an impairment, or being regarded as having such an impairment” (42 U.S.C 12101; Burkhauser et al. 2001). For the purposes of this paper, we will adopt the ADA definition within the larger conceptual context of the Nagi model described above. In terms of the literature on transportation, people with disabilities are often included in a larger group of individuals described as being “transportation disadvantaged.” According to the United States General Accounting Office, the transportation disadvantaged population includes “…some elderly, people with disabilities, and low-income persons that lack the ability to provide their own transportation or have difficulty accessing conventional transportation” (GAO 2004). The term most commonly used to describe transportation services designed to meet the mobility needs of the transportation disadvantaged and more specifically, people with disabilities, is paratransit. However, the uses of this term vary widely, making it difficult to summarize the literature. Robert Cervero, a leading researcher in the area of transportation policy in the United States, uses a broadly inclusive definition. According to Cervero,
…[paratransit] describe[s] the full spectrum of transportation options that fall between the private automobile and the conventional bus. Like automobiles, many paratransit services are flexible and ubiquitous, connecting multiple places within a region, but at a price far lower than a taxi. And like bus transit, paratransit is an efficient user of road space and energy resources because of its high average loads (Cervero 1997).
Paratransit is defined in the ADA as: “comparable transportation service for individuals with disabilities who are unable to use fixed-route transportation systems” (Easter Seals Project ACTION 2004). For the purpose of this literature review we will use the ADA definition. In addition, we will use “accessible transportation” as an umbrella term to include any type of transportation that provides additional accommodation for those who are mobility impaired, for example, traditional public transit, paratransit (as defined above) and accessible taxis. Finally, we will use the federal government definition for “transportation handicapped” to describe the population of people with disabilities most likely to utilize paratransit or accessible transportation. Transportation handicapped individuals are those “who, by reason of illness, injury, age, congenital malfunction, or other permanent or temporary incapacity or disability are unable without special facilities or special planning or design to utilize mass transportation facilities and services as effectively as persons who are not so affected” (Pfeiffer 1991).

Meeting the Employment Transportation Needs of People with Disabilities in New Jersey
4
1.4 Broad Policy Context Federal disability policy has its roots in the civil rights movement of the 1960s. The Civil Rights Acts of 1964 and 1968 and the Fair Housing Act of 1968, which did not provide explicit protections for people with disabilities, established the statutory foundation on which later laws would be created. For example, the 1964 Civil Rights Act paved the way for Section 504 of the Rehabilitation Act of 1973, which prohibited discrimination against disabled persons by recipients of federal funds (US Dept of Ed. 2003). Another law passed in 1968, the Architectural Barriers Act (ABA), provided further protection for disabled persons. This act required that buildings constructed or altered by or on behalf of the United States, or financed by federal grants or loans, be designed and constructed to be accessible to persons with disabilities (US Dept of Ed. 2003). Two decades later, in 1988, the Fair Housing Act was amended to specifically protect people with disabilities and families with children (US Dept of Ed. 2003). The Americans with Disabilities Act of 1990 was landmark legislation intended to eliminate discrimination against individuals with disabilities (HSSC 2003). The law covers approximately 54 million Americans with physical or mental impairments that substantially limit their daily activities (DOJ 2000). The law prohibits discrimination in four major areas including, employment, public services, public accommodations, and telecommunications (US Dept of Ed. 2003). It also addresses the relationship of ADA to other federal and state laws and regulations and guidelines established by a variety of government agencies, including the U.S. Department of Justice (DOJ), the Equal Employment Opportunity Commission (EEOC), the U.S. Department of Transportation (DOT), the Federal Communications Commission (FCC), and the Architectural and Transportation Barriers Compliance Board, known as the Access Board (JAN 2003). With regard to employment, the ADA prohibits discrimination against people with disabilities. Unless imposing hardship to the employer, this provision requires employers to make reasonable accommodations to the known physical or mental limitations of a qualified applicant or employee (US Dept of Ed. 2003). Reasonable accommodations include actions such as providing accessible worksites, modifying existing equipment, providing new devices, modifying work schedules, restructuring jobs, and providing readers or interpreters. With regard to public services, including public transportation, the ADA requires that the services and programs of local and state governments, as well as other non-federal government agencies, shall operate their programs so that when viewed in their entirety are readily accessible to and usable by individuals with disabilities (US Dept of Ed. 2003). This provision also seeks to ensure that existing public transportation services are accessible to people with disabilities. For example, all new public transit vehicles must be accessible and transit authorities must provide supplementary para-transit services or other special transportation services for individuals with disabilities who cannot use fixed-route bus services. Implementation of ADA has been criticized by a variety of independent government agencies and citizen advocacy groups. For example, a National Council on Disability (NCD) report released in 2000 concluded that the overall impact of the ADA has been weakened due to a lack

Meeting the Employment Transportation Needs of People with Disabilities in New Jersey
5
of sufficient leadership across the various federal agencies, too little enforcement, under-staffing of responsible agencies, undue caution, and the absence of a coherent strategy (NCD 2000). Researcher Steven Kaye observes:
For more than a decade, one of the principal goals of U.S. Disability policy has been to improve employment opportunities for working-age adults with disabilities. Of the four national policy goals proclaimed in the Americans with Disabilities Act, three – equality of opportunity, full participation, and self-sufficiency – directly hinge on removing barriers to employment for people with disabilities, on enabling more of those who are able to work to find or retain mainstream jobs that provide a decent living. (Kaye 2001)
Unfortunately, there is significant debate in the literature as to whether the ADA has had a positive or negative impact with regard to the employment outcomes for people with disabilities. Some researchers note that there is “scarce and unconvincing evidence” of progress and conclude that people with disabilities have actually lost ground in terms of employment when compared to those without disabilities (McNeil 1997, 2000, Burkhauser et al. 2001). However, Kaye (2001) argues that these researchers, who rely on rates of total employment as the measure of employment outcomes, fail to account for those people with disabilities who are unlikely to participate in the labor force because they “….are not oriented toward participation in the labor force, either because they consider themselves unable to work or because they are engaged in other activities. In his research, he found that when controlled for potential labor force participation (e.g., eliminating those self-reporting an inability to work from the calculation), employment rates for people with disability actually improved in the 1990’s. According to the U.S. Census Bureau, in 2000, there were more than 178 million working age people between the ages of 16 and 64 in the United States. Of those, 33 million or 19 percent reported having a disability. Almost 10 million working age people reported an employment disability that limited their ability to work (US Census Bureau 2005). These statistics have serious policy implications. For example, researchers from the Disability Statistics Rehabilitation Research and Training Center at the University of California report that the number of individuals receiving either Social Security Disability Insurance (SSDI) and/or Supplemental Security Income (SSI) checks “…has increased more than 50 percent since 1982” (LaPlante et al. 1996). They suggest that:
The increased use of public disability programs has already strained budgets, and future prospects are still more worrisome. Given the tendency of people who receive Social Security benefits to remain on the rolls permanently – each year, fewer than ½ of 1 percent of working age social security recipients leave the rolls to take a job – the likelihood is that outlays for these programs will continue to increase dramatically, barring changes in public policy.
In part to respond to these trends, in 1998, Congress passed the Workforce Investment Act which was designed to “…remove barriers to employment for people benefiting from SSDI and SSI payments…by simplifying federal labor market and employment programs and creating one-stop centers…to provide easy access to relevant public services from one central location.” In addition, “the law requires the one-stop system to be fully accessible and available to all, including people with disabilities, with the expectation that the new system would establish a cooperative working relationship with the vocational rehabilitation system” (Quigley 2002).

Meeting the Employment Transportation Needs of People with Disabilities in New Jersey
6
A year later, Congress passed the Ticket to Work and Work Incentives Improvement Act of 1999 (TWWIIA). Among other things, TWWIIA authorized the creation of a national Medicaid Buy-in program, which “allows individuals to maintain his/her Medicare or Medicaid while working.” In 2001, Congress created the Office of Disability Employment Policy (ODEP) within the Department of Labor. The new office is charged with providing a “permanent long-term focus to increase employment of persons with disabilities” (Easter Seals Project ACTION 2002). According to researchers charged with monitoring and evaluating implementation of the program:
The national Medicaid Buy-in program is part of an emerging system of initiatives designed to promote employment and economic self-sufficiency for individuals with disabilities. Under TWWIIA, states can amend their Medicaid programs to enable individuals with disabilities to obtain coverage for basic medical care and for special services, such as personal assistance, that can help them engage in productive work. By making health insurance more available and affordable, policy makers hope to 1) give an incentive for individuals with disabilities to seek employment, 2) make it easier for workers with disabilities to maintain their employment, and 3) help individuals who now receive public assistance to move successfully into employment. These policy goals are shared by other federal and state initiatives that interact with the Buy-in program, including the Social Security Administration’s (SSA) Ticket to Work and Benefit Outreach and Assistance Programs, the Department of Labor’s efforts to enhance the capacity of their One-stop centers to serve individuals with disabilities, and other components of the Administration’s New Freedom initiative.” (Ireys et al. 2003)
Even with these supportive laws and policies, many varied and complex barriers to employment for people with disabilities still exist.
1.5 Comparable statewide planning studies As part of the literature review conducted for this study, the research team made a concerted effort to identify planning studies similar to that envisioned for the development of the Division of Disability Services Five-year Transportation Plan. Several studies were identified and are summarized below.
Workfirst New Jersey Community Transportation Planning Process and Plans In the spring of 1997, the New Jersey Department of Human Services (DHS) contracted with Rutgers University to conduct research examining the transportation opportunities for former welfare recipients. Dr. Richard Brail was principal investigator for this project. The fundamental research question was: Could former welfare clients utilize the state’s existing transportation network to get to work. To answer this question, approximately 100,000 WFNJ client addresses, 200,000 job locations, as well as licensed childcare centers, job training centers, and the state’s bus routes were mapped and analyzed. The study found that while nearly 90 percent of clients and 90 percent of employers were within ½ mile of a bus route, the odds of having a client within walking distance of the bus, and having a job, and a training center, and childcare within that same distance was substantially lower. In Ocean County, for example, the study found this

Meeting the Employment Transportation Needs of People with Disabilities in New Jersey
7
conditional probability to be about 50 percent. The analysis was intended to be the starting point for further planning efforts.
In July 1997, the New Jersey Departments of Transportation and Human Services and NJ TRANSIT hosted a Transportation Summit at Rutgers University to kick-off a statewide county and community transportation planning process. The goal of this process was to develop plans for more coordinated and integrated local and regional transportation services in each county. Multisystems, Inc., a nationally known and respected transportation planning firm, was hired to facilitate the development of plans in each of New Jersey’s twenty-one counties. Over the course of eighteen months, steering committees in each county were convened, research was conducted, and plans were prepared. The county planning process concluded in the fall of 1998.
The county community transportation plans generally contain the same information, in roughly the same format. Section 1 of the plan describes the planning process, presents transportation goals and objectives, and briefly summarizes the findings and plan recommendations. Section 2 presents basic demographic data for the county, drawn from the 1990 Census of Population and Housing and provides additional detail regarding WFNJ participants; the number of seniors, persons with mobility limitations, low-income households, and households without an automobile.
Taken together, these five groups are used as a surrogate for the “transit dependent population” in the county. With the exception of data related to WFNJ participants, information on other target populations is presented in aggregate form, based primarily on census geography. Section 2 presents a “composite measure of transit need,” for each census block group in the county and includes a density map(s) depicting the number of transit dependent persons per square mile. These maps are used to illustrate where the need for transit service is greatest. The analysis provides an excellent snapshot of conditions; however, its usefulness for target populations other than WFNJ participants is somewhat limited.
In addition to a profile of transit dependent populations, major employers and activity centers are mapped and an inventory of available transportation services, including interstate, regional, and local bus and rail services, Access Link, county-provided services, municipal services, private demand-response services, and ridesharing services (where applicable) is presented. Only services operated by NJ TRANSIT are mapped. In all of the reports, major employers in the county are identified, located, and evaluated for their proximity to fixed-route transit. According to the plan narratives, particular attention was given to employment sectors where WFNJ counselors felt clients could most easily find a job.
Section 3 of the county plans identifies transportation gaps and service deficiencies. Findings in this area are inconsistent across plans; however, in most of the plans, a significant effort was made to look beyond the fixed-route service provided by NJ TRANSIT. Some plans note the schedule of transportation services in relation to the job times in the county. For example, the Atlantic County Plan notes that casinos are the primary employers in the county. The casinos operate 24-hours a day, but transportation in the county does not. Some plans examined the capacity of other service providers to meet gaps both in routes and in scheduling.
The fourth section of the county plans set forth detailed recommendations and proposes service strategies for addressing identified gaps. Again, there is significant variability between county plans. Some are particularly vague, “Develop flexible and demand responsive services to accommodate welfare-related and community-based transportation needs” (Atlantic). Others are

Meeting the Employment Transportation Needs of People with Disabilities in New Jersey
8
very precise, such as create a “Newark Night Owl Feeder Service” (Essex). Demand projections, cost estimates, and funding sources and implementation issues are presented for each recommended action. In most plans, a very short 5th section prioritizes recommendations and establishes a timetable for implementation.
The Workfirst New Jersey coordinated county transportation planning effort was one of seven examples highlighted as “best practices” in human services transportation coordination by the National Governors Association in a report published in 2000.
North Carolina Community Transportation Services Alternatives Analysis In 1997 the Institute for Transportation Research and Education (ITRE) published a statewide study conducted in North Carolina. The goal of the study was to identify strategies for improving the employment transportation network in North Carolina. Although this report does not exclusively address those with mobility impairments, it does focus on employment trips for people with limited access to private auto transport. As a result, the study methodology and many of its recommendations are relevant to addressing the employment travel needs of the transportation handicapped. The ITRE study employed a quasi-experimental case study approach, selecting twelve study sites throughout the state to serve as a representative sample. These sites were selected for their diversity in demographics, economic conditions, and land use/transportation context (e.g. urban or suburban). An inventory was compiled for each of the study sites that included available public transportation and paratransit services in each area. Based on this information and meetings with stakeholders in each community, site-specific transportation gaps and needs were identified. The report provides a comprehensive discussion of alternate transportation options that could be implemented to address some of the identified needs. Specific recommendations are targeted toward transportation system providers, statewide policy makers and the Department of Human Resources and Department of Social Services. Finally, an implementation plan for these recommendations is provided. The following are a sampling of study recommendations:
Investigate provision of/addition of demand-responsive transportation at employment shift change times;
Encourage employers to adopt flexible work hours;
Investigate the feasibility of contracting with one or more other transportation providers in areas where there is capable private transportation;
Use underutilized vehicles to provide additional demand-responsive services;
Coordinate better inter-county/regional trips; and
Provide same-day acceptance of service requests (ITRE 1997). Although many of the most difficult employment transportation issues in North Carolina result from its rural landscape, the recommendations are often applicable to suburban and urban areas.

Meeting the Employment Transportation Needs of People with Disabilities in New Jersey
9
At the Crossroads: Disability and Transportation in New Mexico In December 2002, the ATR Institute at the University of New Mexico published a report documenting the findings and recommendations of a study conducted to answer a number of questions:
Does lack of transportation limit activities and opportunities for adults with disabilities?
What kinds of transportation assistance would help them the most?
Would additional transportation options improve their quality of life?
What innovative solutions should the state explore to address the transportation needs of adults with disabilities? (ATR 2002)
The report provides a comprehensive overview of the laws, regulations and court reviews that relate to transportation service provision for the disabled population. Of particular interest and relevance is President George Bush’s Executive Order establishing the New Freedom Initiative (NFI), announced in February 2001 (ATR, 2002). The Executive Order mandated that federal agencies work together to “tear down barriers” to community living for people with disabilities.1 The ATR study included a spatial analysis, using geographic information systems (GIS) to map clustered groups of clients, support-service providers, employment centers and recreational areas. In addition, quantitative information was gathered through a written survey of 644 residents with disabilities. Each survey respondent was categorized into one of four types of disability. The results from the survey confirmed the hypothesis that a lack of transportation options negatively impacts the lives of people with mobility impairments in a variety of ways (ATR 2002). The study explores potential solutions and presents a range of options that could be implemented to meet identified needs. Innovative programs from throughout the United States were examined, providing examples of how particular needs can be met. For example, a significant concern identified through the survey process was lack of consumer control. As a potential solution, ATR considers the Traveler’s Cheque (TC) Program currently funded through the U.S. Department of Education, Rehabilitation Services Administration and The Special Projects Division. The TC program provides clients with vouchers that they can use as payment to providers, who then are reimbursed through the sponsoring agency. This allows the client to select the type of service that best fits their need (ATR 2002). Many of the transportation issues faced in New Mexico result from its rural context. Although like the North Carolina example, many components of the study and its recommendations are relevant in non-rural areas. Sample recommendations from the study include:
Pilot a client-compatibility study in one community, and use the coordinated transportation model to increase mobility for transportation-disadvantaged people;
1 Initially a heavy emphasis was placed on transportation barriers, but more recently the Bush administration focused funding on in-home care, Medicaid for spouses of the disabled and presumptive Medicaid eligibility policies (New Freedom 2004 Proposed Budget for HHS).

Meeting the Employment Transportation Needs of People with Disabilities in New Jersey
10
Require all vans and buses purchased with state funds, except for school buses, used to transport students to and from school on a regular basis, to be available for joint use by health and human services agencies at the local community level; and
Provide financial incentives to communities that help agencies and programs coordinate transportation services (ATR 2002).
It is clear from the literature and a review of past planning studies that a great deal of research has already been done throughout the country to address many facets of meeting the transportation needs and addressing barriers to work for people with disabilities. This study will build on this body of knowledge and experience in an effort to advance the planning and policy agenda here in New Jersey.

Meeting the Employment Transportation Needs of People with Disabilities in New Jersey
11
CHAPTER 2: THE GEOGRAPHY OF DISABILITY AND EMPLOYMENT IN NEW JERSEY
2.1 Introduction Critical to addressing transportation barriers to work for people with disabilities in New Jersey is identifying where the state’s disabled residents live. As described in Chapter 1, previous planning initiatives intended to meet the needs of transportation disadvantaged populations, most notably Workfirst New Jersey clients, utilized an address database to locate the targeted population and analyzed transportation services relative to detailed residence location data. No comprehensive address database of people with disabilities exists. In order to understand better the geographic relationship between transportation services and where the disabled population resides, an analysis of census data was conducted. This chapter presents the results of this analysis at the state and county level and presents a more detailed analysis for Essex, Middlesex and Cumberland counties to illustrate the extent to which there is municipal variation.
2.2 Census Overview The 2000 Census was conducted on April 1, 2000. Each household in the country was asked seven questions regarding household relationship, sex, age, Hispanic or Latino origin, race, tenure (rental or home ownership) and vacancy. These questions make up what is referred to as “the short form.” Data from the short form provides information for the entire population of the United States. Seventeen percent of the total households received “the long form.” This form asked detailed questions regarding social characteristics (e.g. marital status, citizenship, educational attainment and disability status), economic characteristics (e.g. income, employment status) and housing characteristics (e.g. units in structure, year built, value of home or monthly rent). The data gathered from the long form provides sample characteristics for the entire population. In other words, it is used to make estimates about the population on a percentage basis. Census data can be analyzed based on two different types of geographic areas: Legal/Administrative entities and Statistical entities. The Legal/Administrative entities are those that are used by the federal, state and local governments for governing purposes. These divisions include congressional districts, counties, incorporated places (cites, towns, etc.), minor civil division (non-county administrative entity), states and voting districts. The Statistical entities have been developed for the purposes of census data collection and analysis. These include census blocks, block groups, census tracts, metropolitan areas, and a number of other categories that are used to address specific issues in unique geographical areas. The census block level is the smallest entity that data is available for, and the block group is the smallest entity that sample data is available for. The 2000 Census long form contained two questions pertaining to disabilities. The data on disability status were derived from answers to long-form questionnaire items 16 and 17.
Meeting the Employment Transportation Needs of People with Disabilities in New Jersey
12
Item 16 was a two-part question that asked about the existence of the following long-lasting conditions: (a) blindness, deafness, or a severe vision or hearing impairment (sensory disability) and (b) a condition that substantially limits one or more basic physical activities, such as walking, climbing stairs, reaching, lifting, or carrying (physical disability). Item 16 was asked of a sample of the population 5 years old and over.
Item 17 was a four-part question that asked if the individual had a physical, mental, or
emotional condition lasting 6 months or more that made it difficult to perform certain activities. The four activity categories were: (a) learning, remembering, or concentrating (mental disability); (b) dressing, bathing, or getting around inside the home (self-care disability); (c) going outside the home alone to shop or visit a doctor’s office (going outside the home disability); and (d) working at a job or business (employment disability). Categories 17a and 17b were asked of a sample of the population 5 years old and over; 17c and 17d were asked of a sample of the population 16 years old and over.
For data products that use the items individually, the following terms are used: sensory disability for 16a, physical disability for 16b, mental disability for 17a, self-care disability for 17b, going outside the home disability for 17c, and employment disability for 17d. For data products that use a disability status indicator, individuals were classified as having a disability if any of the following three conditions were true: (1) they were 5 years old and over and had a response of ‘‘yes’’ to a sensory, physical, mental or self-care disability; (2) they were 16 years old and over and had a response of ‘‘yes’’ to going outside the home disability; or (3) they were 16 to 64 years old and had a response of ‘‘yes’’ to employment disability.
2.3 Population and Employment Characteristics: Statewide and County Patterns
Density Patterns New Jersey is often reported to have the highest population density of any state in the nation. Despite this distinction, population and density patterns vary widely across the state. According to the 2000 Census, the county with the highest population is Bergen County which has 884,118 residents. With 102,326 residents, Cape May County has the lowest population in the state. As shown in Table 2.1, densities range from a low of 188 persons per square mile in Salem County to a high of 12,981 persons per square mile in Hudson County. Similar patterns can be seen when examining population density for people with disabilities. According to the 2000 Census, Essex County has the highest number of residents (140,551) reporting a disability. Hunterdon County has the lowest (12,130). Densities of people with disabilities range from a low of twenty six persons per square mile in Salem County to a high of 2,292 in Hudson County. Figure 2.1 depicts a map of New Jersey showing the density of disabled working age residents by census tract. As might be expected, density patterns for the disabled population reflect the state’s pattern of urbanization, with more people with disabilities living in the more densely populated areas of the state.

Meeting the Employment Transportation Needs of People with Disabilities in New Jersey
13
Table 2.1: Population density by county
Total population People with disabilities
Area
(sq. miles) Number Density
(persons/sq. mile) Number Density
(persons/sq. mile)
New Jersey 7,509 8,414,350 1,121 1,203,138 160 New Jersey Counties
Atlantic 565.383 252,552 447 38,974 69 Bergen 239.134 884,118 3,697 112,405 470 Burlington 810.374 423,394 522 50,867 63 Camden 224.303 508,932 2,269 72,514 323 Cape May 258.983 102,326 395 14,792 57 Cumberland 494.923 146,438 296 22,503 45 Essex 127.713 793,633 6,214 140,551 1,101 Gloucester 327.644 254,673 777 33,779 103 Hudson 46.913 608,975 12,981 107,503 2,292 Hunterdon 435.817 121,989 280 12,130 28 Mercer 227.088 350,761 1,545 55,948 246 Middlesex 313.302 750,162 2,394 97,139 310 Monmouth 474.764 615,301 1,296 84,230 177 Morris 480.309 470,212 979 54,213 113 Ocean 640.844 510,916 797 83,233 130 Passaic 196.732 489,049 2,486 70,974 361 Salem 341.344 64,285 188 8,981 26 Somerset 304.834 297,490 976 33,957 111 Sussex 534.994 144,166 269 16,431 31 Union 103.746 522,541 5,037 79,457 766 Warren 360.279 102,437 284 12,557 35
Source: U.S. Census Bureau, 2000 Census

Meeting the Employment Transportation Needs of People with Disabilities in New Jersey
14
Figure 2.1: Density of disabled population ages 16-64 by census tract (2000)

Meeting the Employment Transportation Needs of People with Disabilities in New Jersey
15
Disability patterns by type of disability Disability patterns by county can also be examined based on type of disability. As described in Section 2.2, in 2000, the U.S. Census Bureau collected data on disability from a sample portion of the general population. Census 2000 defines a range of potential disability types. These include:
Sensory – Persons reporting a long-lasting condition such as blindness, deafness, or a severe vision or hearing impairment;
Physical – Persons reporting a long-lasting condition that substantially limits one or more basic physical activities such as walking, climbing stairs, reaching, lifting, or carrying;
Mental – Persons reporting a condition lasting 6 months or more that makes it difficult to learn, remember, or concentrate;
Self-care – Persons reporting a condition lasting 6 months or more that makes it difficult to dress, bath, or get around inside the home;
Go outside the home – Persons reporting a condition lasting 6 months or more that makes it difficult to go outside the home alone (e.g., to shop or visit the doctor’s office); and
Employment – Persons reporting a condition lasting 6 months or more that makes it difficult to work at a job or business.
As shown in Table 2.2, statewide almost one in five residents (17 percent) report having a disability. Hudson County has the greatest proportion of disabled residents. Nearly one in four or 24 percent report being disabled. At nine percent, Hunterdon County has the lowest rate of disability. Morris, Sussex, and Somerset Counties have disability rates at least 5 percentage points lower than the statewide average. Essex and Passaic Counties have rates 5 or more percentage points higher than the average. It is interesting to note that the four counties with the lowest rates of disability (Hunterdon, Morris, Sussex and Somerset) are either rural or suburban in character, while the three counties with the highest rates of disability (Hudson, Essex and Passaic) are more urbanized. Patterns of disability by type similarly vary across the state; however, in some cases the variation is more pronounced. For example, two in five working age disabled New Jersey residents (39%) report having a condition that makes it difficult to go outside the home. At the county level, five counties (Burlington, Cape May, Gloucester, Hunterdon, and Sussex) have go outside the home disability rates ten or more percentage points lower than the statewide average. At the same time, Hudson and Passaic Counties have rates more than ten percentage points higher than average. Once again, the counties with lower rates of disability are rural and suburban in character, while those with higher rates are more urbanized. In the case of employment disability, more than two-thirds or 68 percent of the state’s disabled working age population reported having a condition that makes it difficult to work at a job or business. Bergen County has the highest rate of employment disability (73 percent). Hunterdon County has the lowest (61 percent).

Meeting the Employment Transportation Needs of People with Disabilities in New Jersey
16
Figures 2.2 and 2.3 depict maps of New Jersey showing the percent of the state’s working age population reporting a disability by census tract and percent of the disabled working age population reporting a go outside the home disability by census tract. Table 2.2: Disability Patterns by County – Working Age Population age 16-64 (2000)
Percent of working age disabled population by type of disability
Percent of Total
Population Reporting a Disability Sensory Physical Mental Self-care
Go outside the home Employment
New Jersey 17% 10% 28% 17% 9% 39% 68% New Jersey Counties
Atlantic 21% 9% 30% 18% 9% 37% 69% Bergen 14% 8% 23% 14% 8% 38% 73% Burlington 14% 12% 34% 21% 10% 29% 64% Camden 18% 12% 33% 21% 11% 35% 65% Cape May 18% 10% 35% 19% 9% 24% 68% Cumberland 20% 13% 36% 26% 13% 34% 66% Essex 22% 9% 25% 15% 9% 44% 68% Gloucester 15% 12% 38% 19% 11% 28% 65% Hudson 24% 8% 22% 13% 9% 50% 69% Hunterdon 9% 15% 30% 25% 8% 25% 61% Mercer 16% 10% 31% 19% 11% 36% 66% Middlesex 15% 10% 27% 18% 9% 42% 68% Monmouth 14% 10% 32% 19% 9% 30% 68% Morris 12% 11% 25% 17% 7% 33% 69% Ocean 17% 11% 35% 19% 9% 31% 66% Passaic 22% 8% 23% 14% 8% 50% 71% Salem 18% 12% 37% 22% 10% 31% 63% Somerset 11% 10% 27% 18% 8% 34% 68% Sussex 12% 14% 38% 23% 10% 26% 64% Union 17% 9% 25% 14% 8% 41% 71% Warren 15% 12% 35% 23% 11% 33% 64%
Source: U.S. Census Bureau, 2000 Census

Meeting the Employment Transportation Needs of People with Disabilities in New Jersey
17
Figure 2.2: Percent of disabled population ages 16-64 by census tract (2000)

Meeting the Employment Transportation Needs of People with Disabilities in New Jersey
18
Figure 2.3: Percent of “go-outside-the-home” disabled ages 16-64 by census tract (2000)

Meeting the Employment Transportation Needs of People with Disabilities in New Jersey
19
Employment Patterns As is true nationally, patterns of employment in New Jersey can vary significantly depending on location. In addition, employment rates for the general population and people with disabilities differ dramatically. General population employment statistics for the United States, New Jersey and the state’s twenty one counties are shown in Table 2.3. In 2000, when controlled for labor force participation, the national and state unemployment rates for the general population were the same (5.8 percent). Unemployment rates in New Jersey counties varied from a low of 2.5 percent in Hunterdon County to a high of 9.9 percent in Cumberland County. As indicated in Chapter 1, calculating unemployment rates for the disabled population is complicated. There are no reliable statistics regarding labor force participation among people with disabilities available. As such, for comparative purposes, data on employment rates for working age people with disabilities and for working age people with no disability were compiled. As shown in Tables 2.4 and 2.5, the percent of each population unemployed are dramatically different. In New Jersey, rates of employment for working age people with no disability average 74 percent and range from a high of 80 percent in Hunterdon County to a low of 67 percent in Essex and Hudson Counties. Nearly 3 out of every 4 working age adults are employed. For working age people with disabilities in New Jersey, the statistics are dramatically different. Statewide, the percent of working age people with disabilities employed is approximately 58 percent, 15 percentage points lower than the statewide average. Variation between counties is also more pronounced than was evident among those with no disability. The county with the lowest percentage of employed residents with a disability is Cumberland County, where only 50 percent are employed. The county with the highest percentage of employed disabled residents is Hunterdon, where two thirds (67 percent) of disabled working age adults are employed.
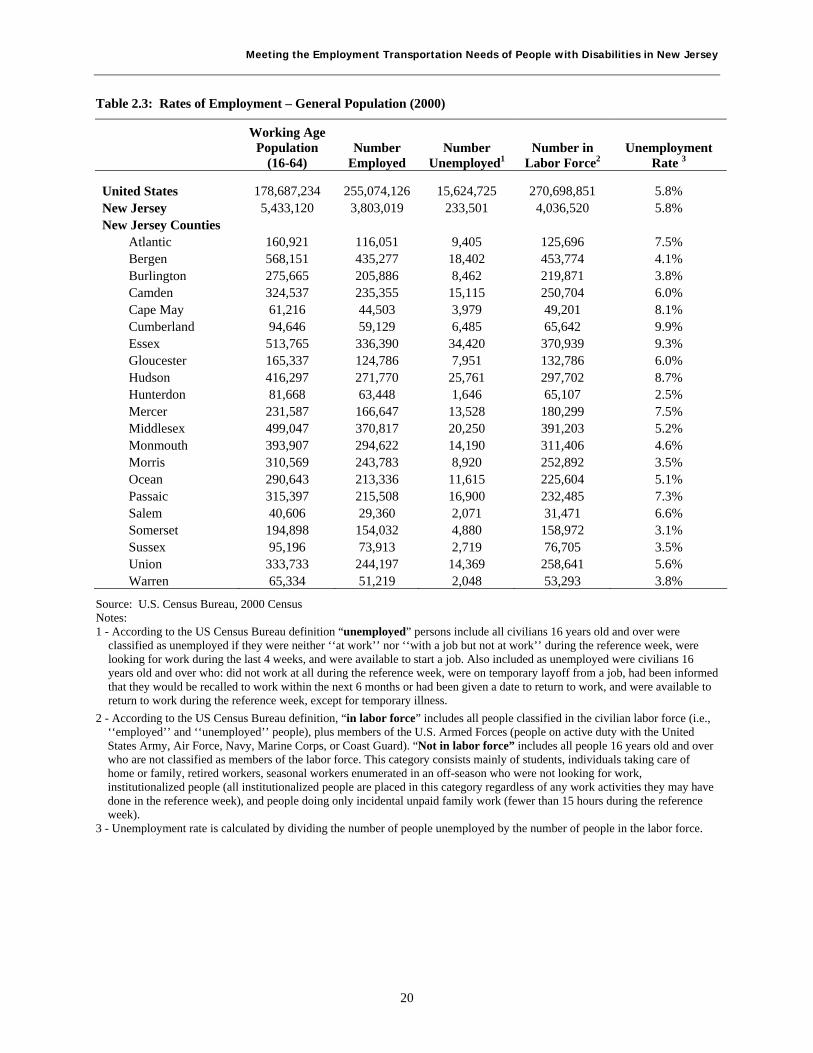
Meeting the Employment Transportation Needs of People with Disabilities in New Jersey
20
Table 2.3: Rates of Employment – General Population (2000)
Working Age Population
(16-64) Number
Employed Number
Unemployed1 Number in
Labor Force2 Unemployment
Rate 3
United States 178,687,234 255,074,126 15,624,725 270,698,851 5.8% New Jersey 5,433,120 3,803,019 233,501 4,036,520 5.8% New Jersey Counties
Atlantic 160,921 116,051 9,405 125,696 7.5% Bergen 568,151 435,277 18,402 453,774 4.1% Burlington 275,665 205,886 8,462 219,871 3.8% Camden 324,537 235,355 15,115 250,704 6.0% Cape May 61,216 44,503 3,979 49,201 8.1% Cumberland 94,646 59,129 6,485 65,642 9.9% Essex 513,765 336,390 34,420 370,939 9.3% Gloucester 165,337 124,786 7,951 132,786 6.0% Hudson 416,297 271,770 25,761 297,702 8.7% Hunterdon 81,668 63,448 1,646 65,107 2.5% Mercer 231,587 166,647 13,528 180,299 7.5% Middlesex 499,047 370,817 20,250 391,203 5.2% Monmouth 393,907 294,622 14,190 311,406 4.6% Morris 310,569 243,783 8,920 252,892 3.5% Ocean 290,643 213,336 11,615 225,604 5.1% Passaic 315,397 215,508 16,900 232,485 7.3% Salem 40,606 29,360 2,071 31,471 6.6% Somerset 194,898 154,032 4,880 158,972 3.1% Sussex 95,196 73,913 2,719 76,705 3.5% Union 333,733 244,197 14,369 258,641 5.6% Warren 65,334 51,219 2,048 53,293 3.8%
Source: U.S. Census Bureau, 2000 Census Notes: 1 - According to the US Census Bureau definition “unemployed” persons include all civilians 16 years old and over were
classified as unemployed if they were neither ‘‘at work’’ nor ‘‘with a job but not at work’’ during the reference week, were looking for work during the last 4 weeks, and were available to start a job. Also included as unemployed were civilians 16 years old and over who: did not work at all during the reference week, were on temporary layoff from a job, had been informed that they would be recalled to work within the next 6 months or had been given a date to return to work, and were available to return to work during the reference week, except for temporary illness.
2 - According to the US Census Bureau definition, “in labor force” includes all people classified in the civilian labor force (i.e., ‘‘employed’’ and ‘‘unemployed’’ people), plus members of the U.S. Armed Forces (people on active duty with the United States Army, Air Force, Navy, Marine Corps, or Coast Guard). “Not in labor force” includes all people 16 years old and over who are not classified as members of the labor force. This category consists mainly of students, individuals taking care of home or family, retired workers, seasonal workers enumerated in an off-season who were not looking for work, institutionalized people (all institutionalized people are placed in this category regardless of any work activities they may have done in the reference week), and people doing only incidental unpaid family work (fewer than 15 hours during the reference week).
3 - Unemployment rate is calculated by dividing the number of people unemployed by the number of people in the labor force.

Meeting the Employment Transportation Needs of People with Disabilities in New Jersey
21
Table 2.4: Rates of Employment – People with NO Disability (2000)
Total Working Age
Population (16-64) No Disability
Employed Working Age
(16-64) No Disability
Unemployed Working Age
(16-64) No Disability
Percent Employed
United States 145,534,023 106,826,752 38,707,271 73% New Jersey 4,450,351 3,271,612 1,178,739 74% New Jersey Counties
Atlantic 126,021 91,088 34,933 72% Bergen 487,545 361,976 125,569 74% Burlington 223,492 174,389 49,103 78% Camden 261,078 194,219 66,859 74% Cape May 48,509 35,181 13,328 73% Cumberland 66,132 47,266 18,866 71% Essex 392,569 262,278 130,291 67% Gloucester 139,806 106,215 33,591 76% Hudson 314,571 211,980 102,591 67% Hunterdon 71,055 56,571 14,484 80% Mercer 190,621 139,333 51,288 73% Middlesex 421,584 315,815 105,769 75% Monmouth 336,449 251,593 84,856 75% Morris 270,156 209,386 60,770 78% Ocean 239,313 175,823 63,490 73% Passaic 243,486 171,114 72,372 70% Salem 32,774 24,144 8,630 74% Somerset 172,267 134,639 37,628 78% Sussex 82,883 64,557 18,326 78% Union 274,493 200,495 73,998 73% Warren 55,547 43,550 11,997 78%
Source: U.S. Census Bureau, 2000 Census

Meeting the Employment Transportation Needs of People with Disabilities in New Jersey
22
Table 2.5: Rates of Employment – People with Disabilities (2000)
Total Working Age
Population (16-64) w/ Disability
Employed Working Age
(16-64) w/ Disability
Unemployed Working Age
(16-64) w/ Disability
Percent Employed
United States 33,153,211 19,137,363 14,627,349 58% New Jersey 911,891 531,407 380,484 58% New Jersey Counties
Atlantic 33,454 19,768 13,686 59% Bergen 79,528 51,600 27,928 65% Burlington 37,782 23,721 14,061 63% Camden 58,409 32,315 26,094 55% Cape May 11,205 6,760 4,445 60% Cumberland 19,186 9,530 9,656 50% Essex 113,609 59,970 53,639 53% Gloucester 24,973 15,207 9,766 61% Hudson 98,359 51,987 46,372 53% Hunterdon 7,252 4,839 2,413 67% Mercer 35,922 21,475 14,447 60% Middlesex 73,072 44,036 29,036 60% Monmouth 53,292 32,083 21,209 60% Morris 38,702 25,588 13,114 66% Ocean 49,629 29,125 20,504 59% Passaic 69,679 36,993 32,686 53% Salem 7,498 4,177 3,321 56% Somerset 21,993 14,492 7,501 66% Sussex 11,865 7,579 4,286 64% Union 56,922 34,153 22,769 60% Warren 9,560 6,009 3,551 63%
Source: U.S. Census Bureau, 2000 Census

Meeting the Employment Transportation Needs of People with Disabilities in New Jersey
23
2.4 Sub-county patterns As demonstrated in Section 2.3 above, statewide data can mask varying patterns of disability and employment at the county level. The same is true at the sub-county level. As such, it is important to examine municipal level data when considering interventions to improve transportation options and services for people with disabilities. To illustrate how patterns may vary at the sub-county level, three counties were selected for municipal level analysis. These counties were selected to be generally representative of New Jersey’s diverse geography.
Cumberland County Cumberland County is located in the southern part of the state along the Delaware Bay. It is generally characterized by rural low-density development patterns. As noted above, it is one of the least dense counties in the state, with less than 300 persons per square mile. Although it has among the lowest densities of people with disabilities (45 persons/sq. mile) in the state, according to the 2000 census, the proportion of county residents reporting a disability was 20 percent, which is slightly higher than the statewide average of 17 percent. Patterns of disability by type vary across the county (see Table 2.6). Approximately 34 percent of the county’s working age residents with a disability report having a condition that makes it difficult to go outside the home. At the municipal level, three municipalities (Commercial, Maurice River, and Shiloh) have go outside the home disability rates ten or more percentage points lower than the county average. At the same time, Deerfield, Greenwich and Lawrence all have rates more than 15 percentage points higher than average. It is important to note however that given the low density of the county, the number of people with disabilities living in any given municipality may be very low. For example, according to the 2000 census, less that 50 people with disabilities live in the town of Shiloh. Figure 2.4 depicts a map of the county showing the proportion of working age residents with a go outside the home disability by census tract. As noted earlier in this chapter, rates of employment for working age New Jersey residents with no disability average 73 percent and range from a high of 80 percent in Hunterdon County to a low of 67 percent in Essex and Hudson Counties. The employment rate of working age Cumberland County residents with no disability is 71 percent, only slightly lower than the statewide average. The employment rate of working age people with disabilities in New Jersey is approximately 58 percent, 15 percentage points lower than that for residents without a disability. In Cumberland County only half of the county’s disabled population is employed. The employment rate for people with disabilities is 50 percent, 8 percentage points lower than the statewide rate. Further, employment rates for people with disabilities vary throughout the county, ranging from 82 percent in Hopewell to 34 percent in Greenwich (see Table 2.7). It is interesting to note that although less than 50 disabled residents live in the town of Shiloh, it has the highest rate of employment disability (79 percent) and one of the highest rates of employment (72 percent) for people with disabilities in the county. Conversely, the town of Greenwich which only has 68 disabled residents has the lowest rate of employment disability (54 percent) and the lowest rate of employment (34 percent).

Meeting the Employment Transportation Needs of People with Disabilities in New Jersey
24
Table 2.6: Disability Patterns by Municipality – Cumberland County (2000)
Percent of work age disabled population by type of disability
Percent of Total
Population Reporting a Disability Sensory Physical Mental Self-care
Go outside the home Employment
New Jersey 17% 10% 28% 17% 9% 39% 68% Cumberland County 20% 13% 36% 26% 13% 34% 66%
Bridgeton 18% 15% 43% 22% 15% 37% 61% Commercial 15% 21% 40% 35% 13% 24% 62% Deerfield 17% 12% 38% 34% 9% 54% 70% Downe 14% 30% 55% 30% 18% 33% 57% Fairfield 15% 12% 46% 30% 17% 36% 57% Greenwich 14% 18% 38% 44% 21% 50% 54% Hopewell 11% 5% 17% 14% 5% 25% 70% Lawrence 17% 9% 37% 16% 10% 56% 74% Maurice River 6% 17% 40% 24% 13% 20% 62% Millville 13% 13% 38% 27% 12% 32% 64% Shiloh 4% 0% 28% 0% 0% 19% 79% Stow Creek 14% 25% 27% 26% 5% 26% 63% Upper Deerfield 16% 12% 51% 22% 10% 28% 65% Vineland 17% 11% 30% 27% 13% 34% 69%
Table 2.7: Rates of Employment – Cumberland County (2000)
Total Working Age Population
w/ Disability
Employed Working Age
(16-64) w/ Disability
Unemployed Working Age w/ Disability
Employment Rate
New Jersey 911,891 531,407 380,484 58% Cumberland County 19,186 9,530 9,656 50%
Bridgeton 2,772 1,198 1,574 43% Commercial 690 323 367 47% Deerfield 386 214 172 55% Downe 240 117 123 49% Fairfield 660 255 405 39% Greenwich 68 23 45 34% Hopewell 440 359 81 82% Lawrence 462 200 262 43% Maurice River 413 235 178 57% Millville 3,238 1,634 1,604 50% Shiloh 47 34 13 72% Stow Creek 125 78 47 62% Upper Deerfield 732 327 405 45% Vineland 8,913 4,533 4,380 51%

Meeting the Employment Transportation Needs of People with Disabilities in New Jersey
25
Figure 2.4: Percent of population with go outside the home disability – Cumberland County, NJ (2000)

Meeting the Employment Transportation Needs of People with Disabilities in New Jersey
26
Essex County Essex County is one of New Jersey’s more urbanized counties. It his home to a number of urban centers including the state’s largest city, Newark. The county is characterized by a mix of urban and suburban densities, with the more urbanized communities concentrated in the eastern portion of the county. As shown in Table 2.1, it is the second most dense county in the state, with approximately 6,214 persons per square mile. It also has the second highest density of residents with disabilities (1,101 persons/sq. mile) in the state. According to the 2000 census, the proportion of county residents reporting a disability was 22 percent, five percentage points higher than the statewide average of 17 percent. As was the case in Cumberland County, patterns of disability by type vary across Essex County. In some cases, the intra-county variation is much more pronounced than in Cumberland (see Table 2.8). For example, approximately 44 percent of the county’s working age disabled residents report having a condition that makes it difficult to go outside the home. At the municipal level, four municipalities (Caldwell, Glen Ridge, Roseland, and West Caldwell) have go outside the home disability rates significantly less (more than 20 percent) than the county average (see Table 2.8). Roseland has the lowest rate, with only seven percent of its working age disabled residents reporting a go outside the home disability. Newark and Cedar Grove have go outside the home disability rates higher than the county average. In both communities half the working age disabled residents report having a condition that makes it difficult for them to go outside the home to shop or go to the doctor’s office, etc. Figure 2.5 depicts a map of the county showing the proportion of working age residents with a go outside the home disability by census tract. As can be seen in the map, the communities with the greatest proportion of go outside the home disabled population are concentrated in the eastern portion of the county. It is interesting to note that as previously mentioned, the county’s more urbanized communities are located in its eastern portion. Again, it is important to also consider the overall population of people with disabilities living in each of the county’s 22 towns to fully understand the nature of conditions in different communities. Some towns have far fewer residents than others. For instance, Newark and Cedar Grove report similar rates of go outside the home disability (50 percent); however, in Cedar Grove that rate translates to slightly less than 400 residents with this type of disability, while in Newark, it equates to more than 27,000 residents. The employment rate of working age Essex County residents with no disability is 67 percent, seven percentage points lower than the statewide average of 74 percent. The employment rate of working age people with disabilities in the county is 53 percent, 14 percentage points lower than that for residents without a disability. Only slightly more than half of the county’s disabled population is employed. Employment rates for people with disabilities vary throughout the county, ranging from 74 percent in West Caldwell to 46 percent in Newark (see Table 2.9).

Meeting the Employment Transportation Needs of People with Disabilities in New Jersey
27
Table 2.8: Disability Patterns by Municipality – Essex County (2000)
Percent of work age disabled population by type of disability
Municipality
Percent of Total
Population Reporting a Disability Sensory Physical Mental Self-care
Go outside the home Employment
New Jersey 17% 10% 28% 17% 9% 39% 68% Essex County 22% 9% 25% 15% 9% 44% 68%
Belleville 16% 7% 22% 11% 8% 39% 72% Bloomfield 15% 11% 23% 14% 6% 38% 73% Caldwell 18% 5% 21% 17% 9% 23% 78% Cedar Grove 14% 5% 28% 17% 7% 50% 76% City of Orange 22% 8% 21% 15% 9% 44% 69% East Orange 21% 10% 28% 17% 9% 38% 66% Essex Fells 11% 10% 24% 29% 11% 45% 61% Fairfield 14% 16% 17% 8% 4% 34% 71% Glen Ridge 10% 10% 17% 26% 5% 14% 69% Irvington 20% 8% 23% 11% 9% 44% 70% Livingston 13% 12% 27% 21% 6% 32% 64% Maplewood 14% 7% 24% 18% 10% 36% 67% Millburn 9% 19% 28% 18% 7% 36% 70% Montclair 14% 9% 27% 22% 8% 33% 67% Newark 21% 8% 25% 15% 10% 50% 67% North Caldwell 10% 9% 39% 8% 6% 42% 59% Nutley 13% 9% 30% 14% 7% 31% 71% Roseland 14% 9% 29% 19% 6% 7% 58% South Orange 14% 8% 22% 20% 5% 34% 72% Verona 14% 14% 30% 24% 15% 44% 63% West Caldwell 10% 10% 24% 17% 4% 21% 74% West Orange 16% 9% 20% 16% 7% 37% 66%

Meeting the Employment Transportation Needs of People with Disabilities in New Jersey
28
Table 2.9: Rates of Employment by Municipality – Essex County (2000)
Municipality
Total Working Age Population
w/ Disability
Employed Working Age
(16-64) w/ Disability
Unemployed Working Age w/ Disability
Employment Rate
New Jersey 911,891 531,407 380,484 58% Essex County 113,609 59,970 53,639 53%
Belleville 5,527 3,341 2,186 60% Bloomfield 5,657 3,791 1,866 67% Caldwell 529 335 194 63% Cedar Grove 791 505 286 64% City of Orange 5,806 3,327 2,479 57% East Orange 11,736 5,670 6,066 48% Essex Fells 62 33 29 53% Fairfield 527 364 163 69% Glen Ridge 383 283 100 74% Irvington 10,640 6,045 4,595 57% Livingston 1,487 926 561 62% Maplewood 1,919 1,253 666 65% Millburn 569 269 300 47% Montclair 3,052 2,007 1,045 66% Newark 55,160 25,237 29,923 46% North Caldwell 183 102 81 56% Nutley 2,545 1,725 820 68% Roseland 248 181 67 73% South Orange 1,734 1,163 571 67% Verona 600 335 265 56% West Caldwell 627 462 165 74% West Orange 3,827 2,616 1,211 68%

Meeting the Employment Transportation Needs of People with Disabilities in New Jersey
29
Figure 2.5: Percent of population with go outside the home disability – Essex County, NJ (2000)

Meeting the Employment Transportation Needs of People with Disabilities in New Jersey
30
Middlesex County Middlesex County is generally representative of New Jersey’s suburban counties. As shown in Table 2.1, it is characterized by moderate density. The county’s overall density is approximately 2,400 persons per square mile and it has approximately 310 disabled residents per square mile. According to the 2000 census, the proportion of county residents reporting a disability was 15 percent, two percentage points lower than the statewide average of 17 percent. Once again, patterns of disability by type vary across the county (see Table 2.8). For example, approximately 42 percent of the county’s working age disabled residents report having a go outside the home disability. At the municipal level, five municipalities (Cranbury, Metuchen, Milltown, South Amboy and South Brunswick) have go outside the home disability rates at least 10 percentage points below the county average of 42 percent (see Table 2.10). At 21 percent, Metuchen has the lowest rate. Four municipalities (Jamesburg, New Brunswick, Perth Amboy and Piscataway) have go outside the home disability rates at least five percentage points higher than the county average. In each of these communities half or nearly half of working age disabled residents report having a condition that makes it difficult for them to go outside the home to shop or go to the doctor’s office, etc. Figure 2.6 depicts a map of the county showing the proportion of working age residents with a go outside the home disability by census tract. As can be seen in the map, the communities with the greatest proportion of go outside the home disabled are located in the central and northern parts of the county. These areas are typically more dense and urbanized. As was the case in the other two counties, when considering disability and employment rates at the municipal level, it is important to also consider the overall population of people with disabilities living in each community. Once again, the size of each community in terms of total population and population with disabilities varies by town. The employment rate of working age residents with no disability living in Middlesex County (75 percent) is consistent with the statewide average of 74 percent. The employment rate of working age people with disabilities in the county is 60 percent, 15 percentage points lower than that for residents without a disability. Employment rates for people with disabilities by municipality range from a high of 69 percent in South Plainfield to a low of 50 percent in Perth Amboy (see Table 2.9).

Meeting the Employment Transportation Needs of People with Disabilities in New Jersey
31
Table 2.10: Disability Patterns by Municipality – Middlesex County (2000)
Percent of work age disabled population by type of disability
Municipality
Percent of Total
Population Reporting a Disability Sensory Physical Mental Self-care
Go outside the home Employment
New Jersey 17% 10% 28% 17% 9% 39% 68% Middlesex County 15% 10% 27% 18% 9% 42% 68%
Carteret 17% 11% 32% 18% 11% 36% 65% Cranbury 10% 12% 23% 23% 3% 26% 80% Dunellen 15% 14% 40% 36% 21% 44% 66% East Brunswick 10% 9% 30% 18% 10% 43% 68% Edison 12% 8% 24% 14% 8% 43% 69% Helmetta 10% 19% 45% 24% 13% 37% 66% Highland Park 12% 10% 30% 27% 17% 43% 57% Jamesburg 13% 10% 26% 24% 5% 47% 54% Metuchen 13% 8% 24% 25% 14% 27% 66% Middlesex 13% 16% 32% 24% 8% 32% 68% Milltown 14% 29% 34% 12% 13% 21% 52% Monroe 17% 13% 31% 24% 7% 42% 68% New Brunswick 16% 10% 17% 16% 6% 47% 69% North Brunswick 14% 10% 30% 17% 8% 41% 67% Old Bridge 12% 8% 28% 14% 8% 35% 69% Perth Amboy 17% 11% 24% 17% 9% 51% 71% Piscataway 12% 7% 24% 17% 8% 50% 69% Plainsboro 7% 11% 26% 21% 8% 37% 66% Sayreville 14% 11% 28% 14% 9% 41% 68% South Amboy 18% 9% 34% 24% 8% 32% 68% South Brunswick 11% 14% 25% 16% 7% 31% 66% South Plainfield 11% 16% 25% 22% 10% 39% 62% South River 13% 10% 29% 13% 7% 35% 69% Spotswood 16% 12% 46% 31% 17% 44% 74% Woodbridge 13% 11% 33% 20% 13% 43% 70%

Meeting the Employment Transportation Needs of People with Disabilities in New Jersey
32
Table 2.11: Rates of Employment by Municipality – Middlesex County (2000)
Municipality
Total Working Age Population
w/ Disability
Employed Working Age
(16-64) w/ Disability
Unemployed Working Age w/ Disability
Employment Rate
New Jersey 911,891 531,407 380,484 58% Middlesex County 73,072 44,036 29,036 60%
Carteret 2,410 1,355 1,055 56% Cranbury 121 66 55 55% Dunellen 717 395 322 55% East Brunswick 3,201 2,066 1,135 65% Edison 8,722 5,558 3,164 64% Helmetta 135 77 58 57% Highland Park 1,247 709 538 57% Jamesburg 732 428 304 58% Metuchen 1,072 596 476 56% Middlesex 1,198 807 391 67% Milltown 345 206 139 60% Monroe 1,678 873 805 52% New Brunswick 6,604 3,805 2,799 58% North Brunswick 3,379 2,085 1,294 62% Old Bridge 6,242 3,946 2,296 63% Perth Amboy 7,899 3,935 3,964 50% Piscataway 4,852 3,054 1,798 63% Plainsboro 1,008 704 304 70% Sayreville 4,012 2,472 1,540 62% South Amboy 1,013 575 438 57% South Brunswick 2,640 1,859 781 70% South Plainfield 1,727 1,189 538 69% South River 1,609 982 627 61% Spotswood 625 319 306 51% Woodbridge 9,884 5,975 3,909 60%

Meeting the Employment Transportation Needs of People with Disabilities in New Jersey
33
Figure 2.5: Percent of population with go outside the home disability – Essex County, NJ (2000)

Meeting the Employment Transportation Needs of People with Disabilities in New Jersey
34
2.5 Summary of key findings: Chapter 2 presents a detailed analysis of census data to document the degree to which disability and employment patterns vary throughout the state at the county and sub-county level. The following is a summary of key findings from the analysis:
According to the 2000 Census, Essex County has the highest number of residents (140,551) reporting a disability. Hunterdon County has the lowest (12,130). Densities of people with disabilities range from a low of twenty six persons per square mile in Salem County to a high of 2,292 in Hudson County.
Statewide almost one in five residents (17 percent) report having a disability. Hudson
County has the greatest proportion of disabled residents. Nearly one in four or 24 percent report being disabled. At nine percent, Hunterdon County has the lowest rate of disability. Morris, Sussex, and Somerset Counties have disability rates at least 5 percentage points lower than the statewide average. Essex and Passaic Counties have rates 5 or more percentage points higher than the average. The four counties with the lowest rates of disability (Hunterdon, Morris, Sussex and Somerset) are either rural or suburban in character, while the three counties with the highest rates of disability (Hudson, Essex and Passaic) are more urbanized.
Patterns of disability by type similarly vary across the state. In some cases however the
variation is more pronounced. For example, two in five working age disabled New Jersey residents (39%) report having a condition that makes it difficult to go outside the home. At the county level, five counties (Burlington, Cape May, Gloucester, Hunterdon, and Sussex) have go outside the home disability rates ten or more percentage points lower than the statewide average. At the same time, Hudson and Passaic Counties have rates more than ten percentage points higher than average. Once again, the counties with lower rates of disability are rural and suburban and character, while those with higher rates are more urbanized.
In the case of employment disability, more than two-thirds or 68 percent of the state’s
working age disabled population reported having a condition that makes it difficult to work at a job or business. Bergen County has the highest rate of employment disability (73 percent). Hunterdon County has the lowest (61 percent).
In New Jersey, rates of employment for working age people with no disability average 74
percent and range from a high of 80 percent in Hunterdon County to a low of 67 percent in Essex and Hudson Counties. Nearly 3 out of every 4 working age adults are employed.
For working age people with disabilities in New Jersey, the statistics are dramatically
different. Statewide, the percent of working age people with disabilities employed is approximately 58 percent, 15 percentage points lower than the statewide average for those without a disability. Variation between counties is also more pronounced than was evident among those with no disability. The county with the lowest proportion of employed residents with a disability is Cumberland County, where only 50 percent are

Meeting the Employment Transportation Needs of People with Disabilities in New Jersey
35
employed. The county with the highest proportion of employed disabled residents is Hunterdon, where two thirds (67 percent) of disabled working age adults are employed.
Just as patterns of disability and employment at the county level vary widely throughout
the state, so do patterns at the sub-county level. As such, it is important to examine municipal level data when considering interventions to improve transportation options and services for people with disabilities.

Meeting the Employment Transportation Needs of People with Disabilities in New Jersey
36

Meeting the Employment Transportation Needs of People with Disabilities in New Jersey
37
CHAPTER 3: TRANSPORTATION OPTIONS FOR PEOPLE WITH DISABILITIES IN NEW JERSEY
3.1 Introduction The National Council on Disability reports that “[f]or many Americans with disabilities who cannot drive or who, if they could drive, do not have the resources for the adaptive driving controls, lifts, telescopic systems, or other assistive technology that may be necessary, accessible transportation represents one of the chief barriers to participation in economic and community life” (2002). An important component of this study was to inventory the range of transportation options available to people with disabilities in each of New Jersey’s twenty one counties and to document the service characteristics of available services. This chapter briefly reviews different types of accessible transportation; describes the range of mobility options offered in New Jersey by public, nongovernmental and private sector transportation providers; and highlights a variety of service characteristics, including coverage area, hours of operation, available vehicles and seats, as well as fare and funding policies for many of the services inventoried.
3.2 Types of Accessible Transportation There are many types of accessible transportation services and operational models. The Transit Cooperative Research Program (TCRP) Report 9: Transit Operations for Individuals with Disabilities (1995) published by the National Academies of Sciences Transportation Research Board provides a comprehensive inventory of the types of accessible transportation services that are offered throughout the United States. Although variations exist throughout the country, the inventory provides a basic structure for understanding the range of services available. Listed below are the categories and definitions of accessible transportation services identified in TCRP Report 9:
Service Routes and Community Bus Fixed routes are designed to reduce the distances that elderly persons and persons with disabilities must travel to get to and from bus stops. Typically, smaller vehicles are used, and vehicles travel on neighborhood streets or to mall or hospital doorways to reduce walking distances. Although routes are designed to better meet the needs of persons with disabilities and elderly persons, they are open to the public. Services can be planned as feeders to other fixed-route services and can include a ‘route deviation’ option.
On-Call, Accessible, Fixed-Route Bus Service On-call, accessible fixed-route bus service (also known as call-a-lift bus service) allows individuals who need to use accessible fixed-route vehicles to call in advance and request that an accessible bus be placed on a particular route at the time that they wish to travel.
Route Deviation Service In a route deviation service, a vehicle operates along a fixed route, making scheduled stops along the way. Vehicles will deviate from the route, however, to pick up and drop off passengers upon request. The vehicle then returns to the fixed route at the point at which it departed to accommodate the request. Several variations are possible, including client-specific route deviation and site-specific route deviation.

Meeting the Employment Transportation Needs of People with Disabilities in New Jersey
38
Flex-Route or Point Deviation Service In a point deviation service system, a vehicle operates on a fixed schedule with specific stops but without a fixed route. Vehicles will accommodate requests for pick up and drop off at locations other than specified stops or ‘points’ as long as they can be accommodated within the fixed schedule.
Feeder Service Feeder Service transports people with disabilities on paratransit vehicles to and from a fixed-route bus stop or train station. The service may also occur in the reverse order, with individuals traveling on a bus or train to a point where they may transfer to a paratransit vehicle.
General Public Dial-Ride (DAR) General Public DAR is a demand-responsive, door-to-door or curb-to-curb service provided to the general public, as well as to persons with disabilities.
Subscription Bus Service Subscription bus service is a pre-arranged service designed to meet specific group or individual needs. Typically, this service is provided as part of a paratransit program; however, it can also be provided as part of a system’s fixed-route service using accessible buses that are available off-peak or by using accessible spare fixed-route buses.
Flag-Stop and Request-A-Stop Service Flag-stop service allows patrons to request a bus by waving it down anywhere along a route. Request-a-stop service allows a person on a bus to request to get off at any location along a route.
3.3 Transportation services available in New Jersey A range of accessible transportation services are available in New Jersey. These include traditional bus and rail services, Access Link, community transportation services operated by counties, nongovernmental organizations and municipal government, as well as medical transport vehicles, taxis and livery services. In order to document the nature and characteristics of services available throughout the state, the research team conducted an inventory and survey in 2004 of transportation services available for individuals with disabilities in New Jersey. The approach and methodology for developing the transportation services inventory included the following tasks:
Develop transportation provider database; Design and pre-test survey instrument; Conduct telephone survey of transportation providers; and Compile and analyze survey data.
The inventory built upon past studies to create a database of available services in each county. The database includes information related to county, inter-county, regional, and statewide transportation services provided by the public, private and nonprofit sectors. The inventory also documents the service delivery systems used by various providers.

Meeting the Employment Transportation Needs of People with Disabilities in New Jersey
39
The following types of services were inventoried and documented:
NJ Transit services – Existing data on NJ TRANSIT operated rail and bus services were collected and compiled into a reference database for later mapping. The database includes information on routes, rail stations and bus stop locations.
County services – A database of county transportation services was compiled using data from the NJ Transit 1999 Annual Report: Senior Citizen and Disabled Resident Transportation Assistance Program. To the extent information was available, the database was updated and supplemented as needed to ensure it included all county-operated transport services, not just those funded by the NJ TRANSIT Senior Citizen and Disabled Resident Transportation Program (SCDRTP).
Nongovernmental organization (NGO) services – Past surveys conducted as part of the 1998 State-wide Community Transportation Planning initiative were reviewed and supplemented with new telephone surveys to develop a better understanding of how NGO-operated transport services are currently utilized by the target population and how these services could be used in the future to meet the work-related travel needs of the disabled population.
Private transport services – To the extent feasible, data related to private transportation services such as taxi and private medical transportation operators was compiled and analyzed to determine whether these services could be used in the future to meet the work-related travel needs of people with disabilities.
As previously stated, a variety of past studies and plans were reviewed to determine the extent to which transportation services had already been inventoried. Documents reviewed by the research team included:
Guide to Accessible Services, New Jersey Transit (2003)
A New Jersey Foundation for Aging Report: Medical Transportation Needs for the Elderly in Mercer and Middlesex Counties in New Jersey (2002)
NJ Transit 1999 Annual Report: Senior Citizen and Disabled Resident Transportation Assistance Program
New Jersey Coordinated Community Transportation Planning Project, Multisystems (1999)
Coordinating Specialized Transportation Services in New Jersey: A Governor’s Task Force Report on Transportation Services for Elderly and Handicapped Persons (January, 1980)
Lists of past grantees from NJ TRANSIT administered programs, including: Job Access Reverse Commute and the federal 5310 and 5311 programs.
No comprehensive statewide database of transportation service providers was available. As such, information from the above-referenced documents was used to create a database of transportation service providers in New Jersey. The database was then supplemented with information compiled from county websites and other websites found via a comprehensive on-line search for transportation (both public and private) and other social service providers in New Jersey. Finally, the research team obtained a database of Mobility Access Vehicle (MAV)

Meeting the Employment Transportation Needs of People with Disabilities in New Jersey
40
operators2 from the Office of Emergency Medical Services within the Department of Health and Senior Services. For data management purposes, the MAV database was kept separate from the service provider database (hereinafter non-MAV database).
The universe of transportation services considered in this review was intentionally broad so as to capture as many service providers as possible without regard for client base, funding source, or purpose of services offered. In an effort to generate a “rough” inventory of transportation capacity (e.g., number of available vehicles and seats throughout the state) that could potentially serve the disabled community, whether currently used for this purpose or not, the project team developed a brief telephone survey. The survey instrument was designed to help populate the transportation services database with baseline data on the services offered by both MAV and non-MAV service providers. The information included:
Types of customers served; Purposes of trips provided; Types of service provided (e.g. demand response, fixed-route, etc); Number and types of vehicles; Funding sources; Hours of service; and Area of service.
Before the formal survey process began, the survey instrument was pre-tested on a random sample of the MAV provider group, municipalities, non-profits and private organizations. The pre-test prompted a number of language and content changes and adjustments to question order. In addition, during the pretest process, it became evident that identifying a willing and knowledgeable survey respondent from taxi companies and municipal providers was difficult. As a result, the research team decided to eliminate these two provider categories from the telephone survey3. After eliminating taxi companies and municipal providers, approximately 260 organizations remained in the non-MAV contact database. The MAV contact database included 189 organizations. A protocol was then established for conducting the interviews. In some instances, a contact name was provided for a service provider, but in others, only the organization’s contact information was available. In the latter circumstance, the phone call began with a very brief introduction of the project by the interviewer and a request to be connected with an individual who could answer questions about the transportation services the organization provided. Once connected with the appropriate person, the project was described in greater detail before the formal survey questions were asked. As the interview proceeded, responses were noted for future data entry. 2 The Office of Emergency Medical Services in the Department of Health and Senior Services provided a database of organizations that provide mobility access vehicle (MAV) service throughout the state. This comprehensive list included contact information and was used to survey this group of organizations. 3 Although municipal providers were eliminated from the telephone survey, an effort was made to help identify which of New Jersey’s 566 municipal governments currently provide transportation services for their residents. A postcard was mailed to the municipal clerks in each municipality asking them to indicate if the municipality provides transportation service and if so, who to contact. A total of 334 responses were received. One hundred fifty five municipalities confirmed providing transportation, while 179 do not.

Meeting the Employment Transportation Needs of People with Disabilities in New Jersey
41
If the appropriate person was not available at the time of the first call, the interviewer left a message requesting a return call. Each call was logged. Each organization was contacted multiple times until the survey was completed. If an appropriate representative of the organization was not available after multiple attempts, no further effort was made to contact the agency or organization. All of the organizations included in the non-MAV database were contacted, with the following results:
One hundred thirty eight (138) non-MAV transportation providers were successfully surveyed;
Fifty-two of the organizations contacted either no longer provided transportation services and/or contracted with others to provide transportation. For instance, many of those not providing transportation were social service agencies that refer their clients to transportation providers which were otherwise surveyed.
Twelve organizations were found to be no longer in business at the time the survey was conducted.
An additional fifty-five transportation providers were unavailable to complete the survey after repeated attempts and were therefore not included in the database.
A representative sample of providers listed in the MAV database was contacted. A sampling approach was determined appropriate given the very similar nature of the services offered by these providers and the commonalities observed in survey responses. In developing the sample, care was taken to ensure that the sample pool appropriately reflected the overall database in terms of firm size (i.e., number of vehicles) and geographic distribution of providers. Sixty-one MAV organizations were successfully surveyed. A total of 199 interviews were completed: 40 county agencies, 98 NGO organizations and 61 MAV services. Table 3.1 provides a general overview of the basic survey findings on the aggregate level. This data represents the number (and percentage) of providers surveyed that reported each customer type, main trip purpose, and service provided. Many agencies fell into more than one category within each attribute type. The aggregate data provides a general picture of the transportation service options available throughout the state. Although the disabled population is the largest single customer group, only half of the transportation providers interviewed claimed this group as a main customer type. In terms of main trip purpose, the data reflects the high demand for medical transportation services throughout the state. Finally, as might be expected, demand-response service is offered by approximately three-quarters of the agencies surveyed.

Meeting the Employment Transportation Needs of People with Disabilities in New Jersey
42
Table 3.1: Service provider attributes
Attribute Number Percent
Main Customer
Disabled 96 48% Elderly 83 42%
Medicaid Recipients 60 30% General Public 18 9%
Children 16 8% Non-Medicaid medical 14 7%
Welfare Recipients 6 3% Main Trip Purpose
Medical 147 74% Employment 48 24%
Recreation 46 23% Shopping 38 19%
To/from a agency/center 27 14% Education 24 12% Religious 5 3%
Service Type Demand-Response 142 72%
Subscription 105 53% Fixed-Route 28 14%
Group 28 14%
3.4 Transportation services in New Jersey
NJ TRANSIT bus and regional rail services New Jersey Transit is the nation’s only statewide transit provider. Created by the New Jersey State Legislature in 1979 to “acquire, operate and contract for transportation service in the public interest,” the public corporation began operation in 1980 with the acquisition of Transport of New Jersey, the state’s largest private bus operator. NJ TRANSIT currently operates approximately 150 bus routes. Private companies operate an additional 24 public bus routes. These routes are divided into two major types – local and commuter. NJ TRANSIT has been operating passenger rail service since 1983. The rail system consists of eight commuter routes with 151 stations.
According to NJ TRANSIT’s Guide to Accessible Services, virtually all local buses operated by NJ TRANSIT are accessible to passengers with mobility limitations. Commuter routes, which travel to New York, Philadelphia or Newark, require advance reservations for an accessible vehicle to be provided. Approximately one third of the passenger rail stations are accessible to individuals with disabilities. In addition, NJ TRANSIT’s Hudson-Bergen Light Rail line and the Riverline operating in Mercer, Burlington and Camden counties are fully accessible (NJ TRANSIT 2004). It should be noted however that numerous consumer focus group and survey participants reported that that stop announcements are frequently not made or are inaudible; equipment such as wheelchair lifts, bridge plates and elevators are not always operable; and accessible station facilities are not well marked.

Meeting the Employment Transportation Needs of People with Disabilities in New Jersey
43
NJ TRANSIT Access Link New Jersey Transit, like most transportation providers across the nation, has made significant progress in complying with the Americans with Disabilities Act of 1990 (ADA). This task was accomplished largely through the purchase of more accessible buses equipped with wheelchair lifts and kneeling devices, modifications to station facilities, as well as, improved training for employees with an increased emphasis on equipment usage, public address announcements, and sensitivity toward the mobility needs of New Jersey’s disabled citizens (Palladino 2004).
ADA requires public transportation systems to provide comparable paratransit service for passengers who cannot use traditional transit vehicles. To meet this requirement, NJ TRANSIT created Access Link, a statewide paratransit service that operates as a “shadow” service to NJ TRANSIT’s fixed-route buses. Access Link serves origins and destinations located within a ¾ mile buffer of existing bus routes (see Figure 3.1). The system operates on a paid basis, with routes, hours of operation, and fares comparable to the standard bus network (Palladino 2004).
Eligibility for Access Link is restricted and requires an in-person interview at a designated “Assessment Agency” office. To be eligible passengers must have
a disability of a nature that precludes use of the public bus network. Certification is based on the following factors:
Impact of a disability on the passenger’s ability to navigate the bus system independently;
Availability of appropriate accessible features on the existing bus system; and
Impact of the passenger’s disability combined with the environment that prevents the passenger from getting to and from a bus stop (Palladino 2004).
Assessment also includes completion of a medical verification form. NJ TRANSIT must make a decision as to eligibility within 21 days of receipt of this information or a person is “presumed eligible.” Visitors to the state who are ADA eligible must apply for a temporary 21-day Access Link pass to be able to use the system. Also eligible are personal assistants of certified passengers, who ride at no charge (Palladino 2004).
Access Link operates on an appointment basis, with reservations required at least one day in advance. Vehicles may arrive at a pick-up point as much as twenty minutes before or after the desired pick-up time, creating a forty-minute window within which the
Figure 3.1: Access Link “shadow” buffer Source: Paladino 2004
Figure 3.2: Pick-up / drop-off window Source: Paladino 2004

Meeting the Employment Transportation Needs of People with Disabilities in New Jersey
44
vehicle might arrive (see Figure 3.2). There is no restriction or prioritization on the types of trips that can be made as long as they are within a ¾ mile radius of regular bus routes. Since the system is based on traditional bus routes, transfers between vehicles may be required. Passengers must make reservations in both directions and the pick-up time for return trip must be at least 90 minutes after initial pick-up time. Standing orders – requests made once for trips that will be repeated at least once a week, but not more that once daily – are allowed. Passengers are charged fares based on the standard local bus fare and number of fare zones traveled. Access Link services are organized into 5 service regions (see Figure 3.3) and all services are performed by third-party contractors (Palladino 2004).
According to the latest data available from NJ TRANSIT, in Fiscal Year 2004, Access Link accommodated approximately 471,000 passenger trips, averaging more than 1,400 passenger trips on a typical weekday. Ridership on weekends averages 557 trips on a typical Saturday and 391 trips on a typical Sunday. The Access Link vehicle fleet includes 183 vehicles – 125 minibuses and 58 sedans (Paladino 2004). Combined the fleet travels 5.6 million vehicle revenue miles per year. Approximately 3.2 million of those miles are traveled transporting passengers.

Meeting the Employment Transportation Needs of People with Disabilities in New Jersey
45
Figure 3.3: Access Link Service Regions
Note: Service Regions 1 and 4 were recently combined. The combined service region now includes Mercer, Middlesex, Monmouth and parts of Ocean County.

Meeting the Employment Transportation Needs of People with Disabilities in New Jersey
46
County Community Transportation Services Each county in New Jersey operates its own community transportation system providing a variety of transit and/or paratransit services to passengers with disabilities. In some counties transportation services are provided by one office or agency; in others, multiple offices, departments or agencies operate transport services. The extent and nature of service varies widely across counties in terms of agency operating services, area covered, hours of service, types of service offered and reservation requirements. A total of 40 county-based providers, including the 21 casino revenue-funded county paratransit service providers (hereinafter county paratransit providers) were identified and surveyed for this study. The following sections describe generally the characteristics of services and service providers in each county.
Funding Sources Much of the county-to-county variation in community transportation service relates to the type and amount of funding counties receive. Counties use a variety of funding methods, and these monies often come with conditions as to how they can be spent. The most common source of funding is casino revenue also known as the Senior Citizen & Disabled Transportation Assistance Program (SCDRTAP).
The SCDRTAP is funded by an 8 percent tax on the gross revenue generated by casino operations. In 2005, the state administered Casino Revenue Fund is expected to receive $384 million dollars from casino taxes. Seven and one half percent of casino revenue funds are earmarked for transportation programs for the elderly and disabled. Currently this totals over $25 million dollars a year, of which 85 percent of the funds are allocated to the counties. Up to 10 percent of the remaining funds are used by NJ TRANSIT to administer the program and the balance is set aside for NJ TRANSIT accessibility projects (Koska 2004).
The set-aside funds are allocated to counties using a county allocation formula which is based on the percentage of the county’s population over the age of sixty. The formula provides a minimum allocation for the smallest counties and a cap on funds allocated to any one county. The cap dictates that no county may receive more than 10 percent of the total funds available. While these funds must be spent to provide transportation services to seniors and the disabled, there are few other restrictions on how the funds can be used.
County transportation spending levels vary widely. While most rely significantly on SCDRTP funds, many also use other sources of funding, including Federal grants, Title III, XIX and XX funds, Job Access Reverse Commute funds, Veterans funding, county funds, contributions from municipalities, foundation support, donations and fares. Table 3.2 shows the percentage of community transportation funding in each county coming from SCDRTP. Essex County is the most reliant on SCDRTP funding, which accounts for more than 80 percent of is annual community transportation expenditures. Somerset County is the least reliant on SCDRTP funds. Only 9 percent of the county’s annual expenditures are funded through the program.

Meeting the Employment Transportation Needs of People with Disabilities in New Jersey
47
Table 3.2: Percentage of total county paratransit funding from SCDRTAP (2002)
County
Total paratransit expenditures from all
funding sources
SCDRTAP
Funds
Percent
SCDRTAP
Atlantic $1,621,243 $648,674 40% Bergen $3,357,017 $1,842,405 55% Burlington $1,482,913 $891,628 60% Camden $2,279,734 $1,253,516 55% Cape May $2,160,038 $417,607 19% Cumberland $1,729,339 $413,178 24% Essex $1,836,585 $1,510,885 82% Gloucester $1,939,865 $516,734 27% Hudson $1,866,215 $1,443,712 77% Hunterdon $2,236,897 $407,545 18% Mercer $1,574,828 $775,949 49% Middlesex $3,022,514 $1,692,125 56% Monmouth $3,679,731 $1,438,328 39% Morris $1,931,025 $833,985 60% Ocean $4,255,124 $1,826,165 43% Passaic $3,120,932 $1,222,861 39% Salem $564,319 $459,224 81% Somerset $6,627,072 $627,942 9% Sussex $1,229,011 $397,814 32% Union $2,336,971 $1,377,313 57% Warren $1,595,263 $425,849 27%
Source: NJ TRANSIT
The second most common source of funding used by county agencies to support community transportation services is county funds. Seventeen county paratransit providers and two other agencies surveyed identified county funds as a “main source of funding.” Ten county paratransit providers also identified federal grants as a “main source of funding.” It should also be noted that many county social service providers use Medicaid transportation funds to contract out for transport services provided by outside vendors. These agencies were not included in the survey.
Types of service provided Demand-response services are available in all 21 counties. Most of these services require advance reservations, and trip purposes may be limited. All have pick-up and drop-off “windows” for when the transit vehicle may arrive and some do not allow and/or encourage scheduled work trips. Subscription service is available in all but two counties. Seven county paratransit providers and an additional five other county agencies offer fixed and/or flex-route services. Group services are available in ten counties. Table 3.3 shows the types of services available in each county.

Meeting the Employment Transportation Needs of People with Disabilities in New Jersey
48
Table 3.3: Types of service offered in each county – All county-operated services
County
Demand Response
Subscription
Fixed Route
Flex-route
Group/Other
Atlantic Bergen Burlington Camden Cape May Cumberland Essex Gloucester Hudson Hunterdon Mercer Middlesex Monmouth Morris Ocean Passaic Salem Somerset Sussex Union Warren
Source: County provider survey
Service availability and coverage area One of the major limitations of many community transportation services is the generally limited times in which they operate. County-based services operate an average of 80 hours per week. The median number of hours per week of operation is 60. Five agencies operate 24 hours per day, seven days per week. Twelve agencies operate on Saturday, and six operate on Sunday. All of the agencies provide service during regular business hours Monday through Friday. All but one operates through the middle part of the day (10 am to 3 pm). Thirteen providers operate after 7 pm, and 13 begin operating at 5:30 am or earlier. As shown in Figure 3.4, every county paratransit provider operates during weekday business hours. Only a few provide service in the early evening, late at night or on weekends. Twenty one of the county agencies surveyed stated that, in general, they only provide service within their own county. However, a few of them indicated that in certain cases (e.g. for medical appointments) they will take clients to places outside of the county boundary. Fifteen agencies reported traveling to other specific counties, and four stated that they have no designated service area and will travel anywhere they are asked to go (within reason). All but two of the county paratransit providers (Somerset and Cape May) limit operations to the county of origin, making travel to and from a work location in neighboring counties difficult.

Meeting the Employment Transportation Needs of People with Disabilities in New Jersey
49
Figure 3.4: County paratransit services – Hours of operation
County
Early Morning (12-6am)
Morning Commute (6-10am)
Midday
(10-3pm)
Evening Commute (3-7pm)
Late Night
(7-12pm)
Saturday
Sunday
Atlantic Bergen Burlington Camden Cape May Cumberland Essex Gloucester Hudson Hunterdon Mercer Middlesex Monmouth Morris Ocean Passaic Salem Somerset Sussex Union Warren
Source: NJ TRANSIT SCDRTAP Annual Report, County provider survey
Fleet Characteristics The agencies surveyed were asked to provide information on fleet size and vehicle characteristics, including how many of the vehicles in their fleet were wheelchair accessible. Thirty six of the agencies surveyed were able to provide data. The average fleet size for those providing data is 36 vehicles. County paratransit providers maintain slightly larger fleets with an average size of 46 vehicles (see Table 3.4). Typical fleets are composed of a mix of vehicles including sedans, small vans, mini-buses and buses. Table 3.5 presents the vehicle mix within county paratransit fleets. Somerset county has the largest fleet with more than 100 vehicles. Burlington has the smallest with less than 20 vehicles. Agencies reported that slightly less than half of the county paratransit vehicles are wheelchair accessible and about two-thirds of the overall county inventory of vehicles are accessible.

Meeting the Employment Transportation Needs of People with Disabilities in New Jersey
50
Table 3.4: Fleet size characteristics – All county-operated services
Number of vehicles in fleet
County paratransit providers
All county
agencies
Average fleet size 47 36 Less than 20 1 16 20-30 5 5 31-40 4 6 41-50 3 4 more than 50 7 9
Average number of wheelchair accessible vehicles 20 25
Source: County provider survey
Table 3.5: Fleet Mix – County paratransit providers
County Sedan Van Mini-bus Bus Total
Vehicles Estimate of Total Seats 1
Atlantic 4 25 17 4 50 848 Bergen 0 64 10 1 75 1,040 Burlington 0 19 0 0 19 228 Camden 13 23 7 0 43 483 Cape May N/A N/A N/A N/A N/A N/A Cumberland 0 37 0 0 37 444 Essex 0 25 0 0 25 300 Gloucester 6 18 0 12 36 618 Hudson 8 35 0 0 43 444 Hunterdon 1 2 26 0 29 651 Mercer 0 10 17 0 27 528 Middlesex 6 58 4 0 68 810 Monmouth 0 31 22 0 53 900 Morris 32 7 23 0 62 732 Ocean 9 40 21 0 70 1,011 Passaic 10 32 12 8 62 958 Salem 0 0 28 0 28 672 Somerset 20 10 42 37 109 2,372 Sussex 1 0 14 8 23 595 Union 10 17 13 0 40 546 Warren 9 8 16 3 36 603 Total 129 461 272 73 935 2 14,783 Average 6 23 14 4 47 739
Source: County provider survey
Notes: 1 - An estimate of total seats was derived using the following multipliers: Sedan = 3 seats, Van = 12 seats, Mini-bus = 24 seats, Bus = 32 seats. 2 – In addition to the 935 vehicles operated by county paratransit providers, other county agencies surveyed operate approximately 300 additional vehicles.

Meeting the Employment Transportation Needs of People with Disabilities in New Jersey
51
Customers Served Eight categories of customers were identified for the purpose of the survey. These included: seniors, disabled, Medicaid patients, general public, children, and welfare recipients. The agencies interviewed were asked to identify the “main” customer groups they served. Respondents were permitted to include more than one group.
Figure 3.6: “Main” customers served – All county-operated services
County
Seniors
Disabled
Medicaid Patient
Public
Children
Welfare Recipients
Other
Atlantic Bergen Burlington Camden Cape May Cumberland Essex Gloucester Hudson Hunterdon Mercer Middlesex Monmouth Morris Ocean Passaic Salem Somerset Sussex Union Warren
Source: County provider survey
A total of 25 county agencies reported serving the disabled as a “main” customer group. These included all of the 21 county paratransit providers who also identified seniors as their “main” customers. Cape May and Sussex also identified Medicaid patients and the general public as frequently served customers. Sixteen of the 40 agencies surveyed provide services to only one client group, including the disabled, Medicaid patients, children, welfare recipients or the general public. Only four single-client county providers reported serving only the disabled. Based on the information collected as part of the survey, the broadest range of customers is served in Cape May, Cumberland and Middlesex Counties. Table 3.6 provides a summary of the customers served in each county.
Trip purposes Each agency surveyed was asked to identify the types of trips most often made by their customers. Trip purposes included employment, medical, recreational, shopping, religious, educational, and other. Each agency was allowed to indicate as many trip purposes as they
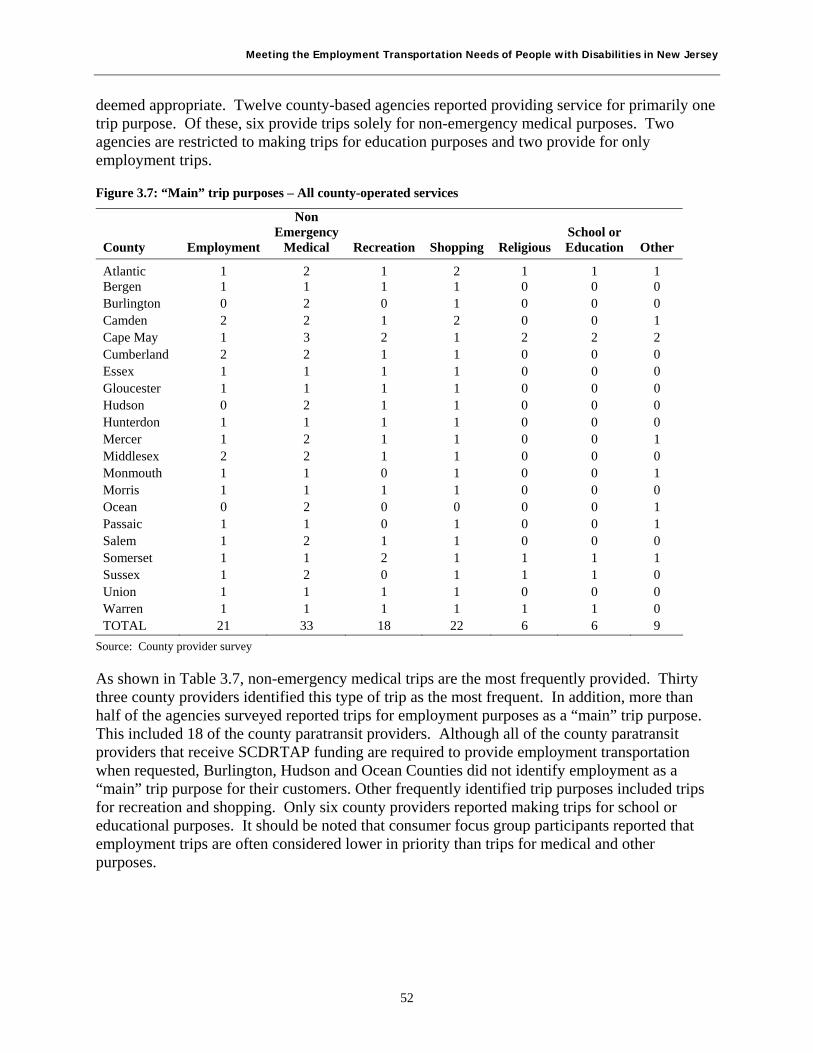
Meeting the Employment Transportation Needs of People with Disabilities in New Jersey
52
deemed appropriate. Twelve county-based agencies reported providing service for primarily one trip purpose. Of these, six provide trips solely for non-emergency medical purposes. Two agencies are restricted to making trips for education purposes and two provide for only employment trips.
Figure 3.7: “Main” trip purposes – All county-operated services
County
Employment
Non Emergency
Medical
Recreation
Shopping
Religious
School or Education
Other
Atlantic 1 2 1 2 1 1 1 Bergen 1 1 1 1 0 0 0 Burlington 0 2 0 1 0 0 0 Camden 2 2 1 2 0 0 1 Cape May 1 3 2 1 2 2 2 Cumberland 2 2 1 1 0 0 0 Essex 1 1 1 1 0 0 0 Gloucester 1 1 1 1 0 0 0 Hudson 0 2 1 1 0 0 0 Hunterdon 1 1 1 1 0 0 0 Mercer 1 2 1 1 0 0 1 Middlesex 2 2 1 1 0 0 0 Monmouth 1 1 0 1 0 0 1 Morris 1 1 1 1 0 0 0 Ocean 0 2 0 0 0 0 1 Passaic 1 1 0 1 0 0 1 Salem 1 2 1 1 0 0 0 Somerset 1 1 2 1 1 1 1 Sussex 1 2 0 1 1 1 0 Union 1 1 1 1 0 0 0 Warren 1 1 1 1 1 1 0 TOTAL 21 33 18 22 6 6 9
Source: County provider survey
As shown in Table 3.7, non-emergency medical trips are the most frequently provided. Thirty three county providers identified this type of trip as the most frequent. In addition, more than half of the agencies surveyed reported trips for employment purposes as a “main” trip purpose. This included 18 of the county paratransit providers. Although all of the county paratransit providers that receive SCDRTAP funding are required to provide employment transportation when requested, Burlington, Hudson and Ocean Counties did not identify employment as a “main” trip purpose for their customers. Other frequently identified trip purposes included trips for recreation and shopping. Only six county providers reported making trips for school or educational purposes. It should be noted that consumer focus group participants reported that employment trips are often considered lower in priority than trips for medical and other purposes.

Meeting the Employment Transportation Needs of People with Disabilities in New Jersey
53
Eligibility requirements Only 25 county agencies surveyed reported having eligibility criteria for people with disabilities wishing to use their services. Of those, 14 permitted self-evaluation of need. Only 11 agencies reported that they require medical documentation (e.g., certification from a doctor) of a qualifying disability. Some agencies required documentation of temporary disabilities as much as every six months. Most often, clients with a permanent disability only need documentation once. In a few cases, eligibility is based on receipt of public assistance (e.g., Medicaid, permanent disability, social security). To receive transportation service they must provide proof of receipt of this assistance.
Driver training Finally, agencies were asked if they provide training for drivers. Twenty one agencies surveyed provide training for drivers on how to operate assistive devices such as wheelchair tie-downs and lifts. Only seven agencies surveyed provide training related to handling emergency situations and first aid. Sixteen agencies provide sensitivity training related to serving the disabled population.

Meeting the Employment Transportation Needs of People with Disabilities in New Jersey
54
Nongovernmental Services A significant component of the transportation provider network is nongovernmental organizations (NGO) that provide a variety of social services including in places transportation for a variety of clients. As previously stated, 98 NGO transportation providers were surveyed as part of this study. Although the depth and breath of NGO activity varies by county, NGOs providing transportation service operate in each of the state’s 21 counties. As shown in Table 3.8, at least one NGO provider in each county participated in the survey. Table: 3.8: Number of NGO providers surveyed by county
County
Number of NGO providers
surveyed Percent of Total Atlantic 6 6% Bergen 5 5% Burlington 6 6% Camden 7 7% Cape May 5 5% Cumberland 1 1% Essex 5 5% Gloucester 4 4% Hudson 4 4% Hunterdon 1 1% Mercer 8 8% Middlesex 6 6% Monmouth 9 9% Morris 5 5% Ocean 2 2% Passaic 5 5% Salem 1 1% Somerset 6 6% Sussex 3 3% Union 5 5% Warren 4 4% Total 98 100%
Funding Sources Information on funding sources was provided by all 98 NGOs surveyed. As shown in Table 3.9, one third of the NGOs surveyed reported the state as a “main” source of funding. Twenty seven percent reported receiving funding from private foundations and 20 percent receive funding from county government. Other less significant sources include: fares and program fees, federal grants, Medicaid funding, and support from municipal government.

Meeting the Employment Transportation Needs of People with Disabilities in New Jersey
55
Table 3.9: “Main” sources of transportation funding received by NGOs
Funding source
Number of NGO reporting “main” source of funding
Percent of total
County 20 20% State 35 36% Private foundations 26 27% Fares/program fees 4 4% Medicaid 8 8% Federal grants 9 9% Municipal government 8 8% Other 3 3%
Source: NGO provider survey
Types of service provided As shown in Table 3.10, about half (56 percent) of the NGO providers surveyed operate demand response services. Somewhat fewer (42 percent) offer subscription services. Only 14 organizations offer fixed route or group services. Sixty six organizations provide only one type of transportation. Of those, 33 provide only demand response service, 20 provide only subscription service, and nine provide just group services Table 3.10: Types of service offered – NGO service providers
Type of service
Number of NGO offering service
Percent of total
Demand response 55 56% Subscription 41 42% Fixed route 14 14% Group 14 14% Other 1 1%
Source: NGO provider survey
Service availability and coverage area Service hours and areas reported by NGO providers were very similar to those reported by county providers. Table 3.11 provides data on the number of NGO providers surveyed that operate at least some service at different times of the day. As was the case with county providers, the vast majority of NGO service providers operate during the morning commute (6-10 am), midday (10-3 pm) and evening commute (3-7 pm) periods. Only about 1 in ten provides early morning, late night or weekend service. Eight NGOs reported providing service seven days a week, 24 hours per day. On average, NGO providers operate about 45 hours per week. In terms of area served, 47 NGOs or 48 percent reported serving only one county. This is a pattern similar to that reported by county providers. Another 28 NGO providers reported serving a multi-county service area. Twelve reported serving customers in a defined local (less than county) service area. Only 5 reported having no designated service boundary.

Meeting the Employment Transportation Needs of People with Disabilities in New Jersey
56
Table 3.11: Hours of operation – NGO service providers
Hours of operation
Number of NGO operating at least
some service during period
Percent of total
Early morning (12-6 am) 11 11% Morning commute (6-10 am) 84 86% Midday (10-3 pm) 80 82% Evening commute (3-7 pm) 81 83% Late night (7-12 pm) 13 13% Saturday 11 11% Sunday 12 12%
Source: NGO provider survey
Fleet characteristics Data vehicle fleet size, mix and other characteristics was provided by 83 of the NGOs surveyed. At 8 vehicles, the average fleet size for NGO providers is small. Most (86 percent) have fewer than 20 vehicles. The average fleet includes a mix of sedans, vans, and mini-buses. None of the NGO providers operate ambulances and only a few of the larger fleets include buses. Table 3.12: Fleet size and mix operated by private NGO providers in each county
County Sedan Van Mini-bus Ambulance Total Wheelchair Accessible
Percent Accessible
Atlantic 4 20 6 0 30 12 40% Bergen 0 16 8 1 25 11 44% Burlington 64 62 9 8 143 9 6% Camden 9 14 19 20 62 4 6% Cape May 0 35 4 0 39 3 8% Cumberland 0 3 0 0 3 0 0% Essex 2 5 13 6 26 10 38% Gloucester 16 24 40 18 98 23 23% Hudson 0 1 9 0 10 8 80% Hunterdon 2 4 0 0 6 1 17% Mercer 106 10 17 3 136 9 7% Middlesex 45 4 4 1 54 8 15% Monmouth 5 14 23 13 55 31 56% Morris 7 23 7 14 51 16 31% Ocean 2 1 4 3 10 7 70% Passaic 0 9 5 1 15 14 93% Salem 0 27 0 0 27 0 0% Somerset 6 3 3 1 13 5 38% Sussex 1 8 10 0 19 4 21% Union 0 2 7 3 12 6 50% Warren 0 5 12 3 20 6 30% Total 269 290 200 95 854 187 22%
Source: Survey interviews

Meeting the Employment Transportation Needs of People with Disabilities in New Jersey
57
Surprisingly, less than one quarter (187) of the total 854 vehicles operated by the NGOs surveyed was identified as being wheelchair accessible. This appears to be largely due in part to the reliance of some NGOs on sedans and small vans which are generally not considered wheelchair accessible. The number of vehicles operated in each county by the NGO providers surveyed is listed in Table 3.12.
Customers served Ninety NGO service providers provided information related to the customer groups they serve. The overwhelming majority of those providing information reported that their “main” customers were seniors and people with disabilities. Sixty one NGOs (77 percent) reported serving a single group as their “main” customers. Of these, 21 (34 percent) identified the disabled as the customer group they served. An additional 24 NGOs identified the disabled as one of the main customer groups served.
Trip purposes Ninety two of the NGOs surveyed provided information on the types of trips made by their clients. When asked to identify “main” trip purpose for travel by their customers, only twenty two identified employment trips. Almost 60 percent of the NGO providers surveyed reported non-emergency medical trips as the “main” purpose for the trips made by their clients. About one third (28 percent) reported recreational trips as a “main” purpose. A similar number (26 providers) reported making trips for other purposes, including day programs, counseling, legal services and to and from nutrition sites.
Eligibility requirements Forty five NGO service providers indicated that they have some type of eligibility criteria for service. Sixteen organizations reported allowing disabled customers to self identify need for service. Twenty four require some form of medical documentation and five require an interview or other agency provided process for eligibility determination.
Driver Training Fifty two NGO’s (53 percent) surveyed report requiring drivers to undergo training related to assisting passengers with mobility impairments. Thirty six require their drivers to be trained to deal with emergency situations and/or to administer first aid, and 39 stated that their drivers receive sensitivity training.

Meeting the Employment Transportation Needs of People with Disabilities in New Jersey
58
Private Medical Access Vehicle (MAV) Services There are 189 private medical access vehicle (MAV) service providers registered to operate in New Jersey. Approximately one third (61) of the MAV providers were surveyed to determine the nature and extent of the services they provide. The sample was generally representative of the geographic distribution of providers statewide and the diversity of providers in terms of vehicle fleet size. The geographic distribution by county type is significantly different than it is for the county-based and NGO providers; there appears to be better service coverage in more urban and suburban counties than in rural counties. This could be partially a reflection of the market-driven nature of MAV providers. They operate in more urban area where the density of need and demand for services is greater and the cost per mile of operation is lower.
Funding Sources Information on funding sources was offered by 60 of the MAV agencies surveyed. Fifty MAV providers (83 percent) identified Medicaid funds as a “main” funding source. In addition, 17 agencies (28 percent) are funded through private insurance companies. Of the 60 agencies that provided data, 39 (65 percent) reported a single source of funding. The most common single source of funding is Medicaid. Thirty one agencies or 79 percent of those interviewed were funded solely by Medicaid. In addition, five MAV operators (13 percent) reported being funded solely on private insurance payments. Two stated they are funded exclusively by State funding and one provider said they are funded through county funds. Twenty-one MAV providers (35 percent) have two or more sources of funding. The most commonly reported source was Medicaid (19), and the second most common source was private insurance payments. Ten MAV operators are funded on a combination of Medicaid and private insurance payments. Eight of the agencies with more than one funding source stated that part of their income comes from fare receipts.
Types of service provided The vast majority (92 percent) of the MAV agencies surveyed provide demand-response services. In addition, 39 agencies (64 percent) offer subscription services to their clients. Very few provide fixed-route or group services. Twenty-five of the providers surveyed offer only one type of transportation service. Of these, 20 (80 percent) provide only demand-response service, four offer subscription services and one agency operates a fixed-route service.
Service availability and coverage area MAV providers have much more extensive hours of service than either the county-based or NGO operated services. Twenty-five providers or 41 percent operate 24 hours per day, seven days a week. The average MAV provider operates 121 hours per week. The minimum schedule of service is Monday through Friday, 8 am to 5 pm. However, all but one agency operates more than 45 hours per week. Fifty MAV agencies (83 percent) operate on Saturdays, and 28 (46%) operate on Sundays. In general, MAV providers have a larger service area than either county or NGO service providers; however, MAV providers are not located in every county. More than half (62%) of the MAV agencies surveyed will transport clients within an area greater than one county. Nine agencies have no designated service area and will travel anywhere requested. Twelve operate

Meeting the Employment Transportation Needs of People with Disabilities in New Jersey
59
within a single county, one is restricted to a defined set of municipalities and one agency operates within a single municipality.
Fleet characteristics Data on vehicle fleet size, mix and other characteristics was provided by all but one of the agencies surveyed. All 61 agencies that provided information operate their own vehicles. The average fleet size for MAV providers is 16 vehicles, which include a mix of sedans, vans, mini-buses and ambulances. As might be expected, most of the MAV providers surveyed operate ambulances. None of those surveyed operate full size buses. The number of vehicles operated in each county by the MAV providers surveyed is listed in Table 3.13 Table 3.13: Fleet size and mix operated by private MAV providers in each county
County Sedan Van Mini-bus Ambulance Total Wheelchair Accessible
Percent Accessible
Atlantic 4 36 5 7 52 38 73% Bergen 2 31 4 18 55 36 65% Burlington 0 17 0 7 24 24 100% Camden 0 35 0 15 50 32 64% Cape May 1 25 0 9 35 25 71% Cumberland 0 0 0 0 0 0 0% Essex 0 59 15 10 84 68 81% Gloucester 0 0 0 0 0 0 0% Hudson 0 25 0 5 30 30 100% Hunterdon 0 0 0 0 0 0 0% Mercer 0 20 0 6 26 13 50% Middlesex 0 41 9 24 74 68 92% Monmouth 4 8 0 0 12 8 67% Morris 0 11 1 7 19 9 47% Ocean 0 37 0 16 53 37 70% Passaic 0 22 0 15 37 37 100% Salem 0 0 0 0 0 0 0% Somerset NA NA NA NA NA NA NA Sussex 0 10 0 15 25 10 40% Union 6 34 0 0 40 34 85% Warren 0 2 0 3 5 5 100% Total 17 413 34 157 621 474 76%
Source: Survey interviews
Customers served More than half, 34 of the 61 providers surveyed, serve only one type of customer. Of this group, 24 agencies (71 percent) provide services exclusively to Medicaid recipients. Those agencies that provide service to more than one customer group most commonly transport Medicaid recipients and disabled clients. Twenty-six of the 61 MAV agencies (43 percent) interviewed serve the disabled population, and 17 of them (28 percent) provide transportation for the elderly. Three quarters (46) provide transportation for Medicaid patients. A small number of agencies also serve the general public, children, welfare recipients, and non-Medicaid medical clients.

Meeting the Employment Transportation Needs of People with Disabilities in New Jersey
60
Trip purposes Forty-eight agencies or 79 percent of those surveyed provide for only medical trip purposes. Thirteen agencies provide trips for more than one trip purpose. Only five agencies reported offering transportation for either employment or educational purposes, two stated that they will transport for recreation and one for shopping. As stated above, medical trips make up the vast majority of all trips provided by MAV agencies. The MAV providers that make trips for a more diverse set of purposes appear to be the smaller operators that build a close relationship with their clients over a period of time. Although it may not be part of their policy or business plan, some smaller providers reported transporting regular medical trip clients to other purposes on occasion. Although only five agencies stated that employment trips are a “main” trip purpose, nine MAV agencies reported that they do, on occasion, transport their clients to work. Although the data is incomplete, it appears that the majority of these agencies transport their clients to work using demand-response services. Of the 52 (85 percent) MAV agencies that reported never providing work trips, 46 of them offered an explanation. Thirty-four claimed that it was a result of the rules of their funding. This is a function of the high numbers of agencies heavily supported by Medicaid funds which can only be used to pay for medical trips. In addition, four agencies stated that it was due to the rules of their operation, two said they did not have the demand for employment trip service, and six agencies would not offer an explanation.
Eligibility requirements All 26 agencies that transport disabled passengers provided information on eligibility requirements. Twenty MAV agencies surveyed require medical documentation, reflecting the large number of agencies that transport Medicaid recipients. Two agencies only require that the passengers self-report their disability. Four MAV operators require either medical documentation, or a self-report, depending upon how the fare will be paid (e.g. Medicaid reimbursement or out-of-pocket payment). None of the MAV providers included in this survey conduct their own evaluation to determine eligibility. All 61 agencies surveyed operate their own vehicles.
Driver Training All but one of the agencies surveyed stated that they require their drivers to be certified in First Aid. In addition, 59 reported that their drivers are trained to assist passengers with mobility impairments, and 54 stated that their drivers receive sensitivity training. These high numbers of trained drivers may be due to the fact that many of the MAV agencies operate ambulances as well as other types of vehicles.

Meeting the Employment Transportation Needs of People with Disabilities in New Jersey
61
3.5 Summary of key findings: There are many types of accessible transportation services and operational models. These include but are not limited to: community shuttle bus services; on-call, accessible, fixed-route bus service; route deviation service; flex-route or point deviation service; feeder service; general public dial-a-ride; subscription bus service; and flag-stop or request-a-stop service. To document the range of mobility options offered in New Jersey by public, nongovernmental and private sector transportation providers, a transportation service provider inventory and survey was conducted. The results of the inventory and survey are documented in the preceding sections. The following is a summary of key findings from the transportation inventory and survey:
NJ TRANSIT bus and rail service and Access Link A range of accessible transportation services are available in New Jersey, including:
traditional bus and rail services; Access Link, NJ TRANSIT’s ADA paratransit service; community transportation services operated by counties, nongovernmental organizations and municipal government; as well as medical transport vehicles, taxis and livery services.
NJ TRANSIT currently operates approximately 150 bus routes and contracts with private
companies to operate an additional 24 public bus routes. These routes are divided into two major types – local and commuter. According to NJ TRANSIT’s Guide to Accessible Services, all local buses operated by NJ TRANSIT are accessible to passengers with mobility limitations. Commuter routes, which travel to New York, Philadelphia or Newark, require advance reservations for an accessible vehicle to be provided.
NJ TRANSIT also operates a regional rail system consisting of eight commuter routes, two light rail systems and the Newark City subway. The combined system has more than 151 rail stations. According to NJ TRANSIT’s Guide to Accessible Services, approximately one third of its passenger rail stations are accessible to individuals with disabilities. In addition, its Hudson-Bergen Light Rail line and the Riverline light rail operating in Mercer, Burlington and Camden counties are fully accessible.
Compliant with requirements of the Americans with Disabilities Act, NJ TRANSIT operates Access Link, a statewide paratransit service that “shadows” its fixed-route bus system within a ¾ mile buffer of existing bus routes. The system operates on a paid basis, with routes, hours of operation, and fares comparable to the standard bus network. Eligibility for Access Link is restricted and requires an in-person interview at a designated “Assessment Agency” office. To be eligible passengers must have a disability of a nature that precludes use of the public bus network.
Although information provided by NJ TRANSIT indicates compliance with ADA requirements, numerous consumer focus group and survey participants reported that that stop announcements are frequently not made or are inaudible; equipment such as wheelchair lifts, bridge plates and elevators are not always operable; and accessible station facilities are not well marked.

Meeting the Employment Transportation Needs of People with Disabilities in New Jersey
62
Access Link operates on an appointment basis, with reservations required at least one day in advance. Vehicles may arrive at a pick-up point as much as twenty minutes before or after the desired pick-up time, creating a forty-minute window within which the vehicle might arrive (see Figure 3.2). There is no restriction or prioritization on the types of trips that can be made as long as they are within a ¾ mile radius of regular bus routes. Passengers are charged fares based on the standard local bus fare and number of fare zones traveled. Access Link services are organized into 5 service regions (see Figure 3.3) and all services are performed by third-party contractors.
County-operated community transportation services Each county in New Jersey operates its own community transportation system providing
a variety of transit and/or paratransit services to passengers with disabilities. In some counties transportation services are provided by one office or agency, in others, multiple offices, departments or agencies operate transport services. The extent and nature of service varies widely across counties in terms of the agency operating services, area covered, hours of service, types of service offered and reservation requirements.
Much of the county-to-county variation in community transportation service relates to the
type and amount of funding counties receive. Counties use a variety of funding methods.
- The most common source of funding is casino revenue also known as the Senior Citizen & Disabled Transportation Assistance Program (SCDRTAP). The second most common source of funding used by county agencies to support community transportation services is county funds.
- In 2005, the state administered Casino Revenue Fund is expected to receive $384 million dollars from casino taxes. Over $25 million dollars of that is set aside to fund transportation services for seniors and the disabled. Eighty-five percent of the funds are allocated to the counties. Ten percent of the remaining funds are used by NJ TRANSIT to administer the SCDRTAP program and the balance is set aside for NJ TRANSIT accessibility projects.
- County transportation spending levels vary widely. While most rely significantly on SCDRTP funds, many also use other sources of funding, including Federal grants, Title III, XIX and XX funds, Job Access Reverse Commute funds, Veterans funding, county funds, contributions from municipalities, foundation support, donations and fares.
Demand-response services are available in all 21 counties. Most of these services require advance reservations, and trip purposes may be limited. All have pick-up and drop-off “windows” for when the transit vehicle may arrive and some do not allow and/or encourage scheduled work trips. Subscription service is available in all but two counties. Seven county paratransit providers and an additional five other county agencies offer fixed and/or flex-route services. Group services are available in ten counties.

Meeting the Employment Transportation Needs of People with Disabilities in New Jersey
63
One of the major limitations of many community transportation services is the generally limited times in which they operate. County-based services operate an average of 80 hours per week.
Every county paratransit provider operates during weekday business hours. Only a few provide service in the early evening, late at night or on weekends. Twenty one of the county agencies surveyed stated that, in general, they only provide service within their own county. All but two county paratransit providers (Somerset and Cape May) limit operations to the county of origin. This makes using county paratransit to travel to and from a work location in neighboring counties difficult.
The average fleet size for all county providers surveyed was 36 vehicles. County paratransit providers maintain slightly larger fleets with an average size of 46 vehicles. Typical fleets are composed of a mix of vehicles including sedans, small vans, mini-buses and buses. Somerset county has the largest fleet with more than 100 vehicles. Burlington has the smallest with less than 20 vehicles. Agencies reported that slightly less than half of the county paratransit vehicles are wheelchair accessible and about two-thirds of the overall 1,200 vehicles operated by county agencies surveyed are accessible.
A total of 25 county agencies reported serving the disabled as a “main” customer group. These included all of the 21 county paratransit providers who also identified seniors as their “main” customers.
More than half of the county agencies surveyed reported that the “main” purpose for their customers’ trips is for employment. This included 18 of the county paratransit providers. Although all of the county paratransit providers that receive SCDRTAP funding are required to provide employment transportation when requested, Burlington, Hudson and Ocean Counties did not identify employment as a “main” trip purpose for their customers.
Only 25 county agencies surveyed reported having eligibility criteria for people with disabilities wishing to use their services. Of those, 14 permitted self-evaluation of need, 11 require medical documentation (e.g., certification from a doctor) of a qualifying disability.
Twenty one agencies surveyed provide training for drivers on how to operate assistive devices such as wheelchair tie-downs and lifts. Only seven agencies surveyed provide training related to handling emergency situations and first aid, and sixteen agencies provide sensitivity training related to serving the disabled population.
Community transportation services provided by NGOs A significant component of the transportation provider network is nongovernmental
organizations (NGO) that provide a variety of social services including in places transportation for a variety of clients.

Meeting the Employment Transportation Needs of People with Disabilities in New Jersey
64
One third of the NGOs surveyed reported the state as a “main” source of funding. Twenty seven percent reported receiving funding from private foundations and 20 percent receive funding from county government. Other less significant sources include: fares and program fees, federal grants, Medicaid funding, and support from municipal government.
About half (56 percent) of the NGO providers surveyed operate demand response services. Somewhat fewer (42 percent) offer subscription services. Only 14 organizations offer fixed route or group services.
Service hours and areas reported by NGO providers were very similar to those reported by county providers. As was the case with county providers, the vast majority of NGO service providers operate during the morning commute (6-10 am), midday (10-3 pm) and evening commute (3-7 pm) periods. Only about 1 in ten provides early morning, late night or weekend service. Eight NGOs reported providing service seven days a week, 24 hours per day. On average, NGO providers operate about 45 hours per week.
In terms of area served, 47 NGOs or 48 percent reported serving only one county. This is a pattern similar to that reported by county providers. Another 28 NGO providers reported serving a multi-county service area. Twelve reported serving customers in a defined local (less than county) service area; and only 5 reported having no designated service boundary.
The average fleet size for NGO providers is small, only 8 vehicles. Most (86 percent) have fewer than 20 vehicles. The average fleet includes a mix of sedans, vans, and mini-buses. None of the NGO providers operate ambulances and only a few of the larger fleets include buses. Surprisingly, less than one quarter (187) of the total 854 vehicles operated by the NGOs surveyed was identified as being wheelchair accessible. This appears to be largely due in part to the reliance of some NGOs on sedans and small vans, which are generally not considered wheelchair accessible.
The overwhelming majority of NGO providers surveyed reported that their “main” customers were seniors and people with disabilities. Sixty one NGOs (77 percent) reported serving a single group as their “main” customers. Of these, 21 (34 percent) identified the disabled as the customer group they served. An additional 24 NGOs identified the disabled as one of the main customer groups served.
Only twenty two of the 98 NGO providers surveyed identified employment trips as a “main” trip purpose for their clients. Almost 60 percent of the NGO providers surveyed reported non-emergency medical trips as the “main” purpose.
Forty five NGO service providers indicated that they have some type of eligibility criteria for service. Sixteen organizations reported allowing disabled customers to self identify need for service, 24 require some form of medical documentation, and five require an interview or other agency evaluation for eligibility determination.
Fifty two NGO’s (53 percent) surveyed report requiring drivers to undergo training related to assisting passengers with mobility impairments. Thirty six require their drivers

Meeting the Employment Transportation Needs of People with Disabilities in New Jersey
65
to be trained to deal with emergency situations and/or to administer first aid, and 39 stated that their drivers receive sensitivity training.
Private Medical Access Vehicle (MAV) services There are 189 private medical access vehicle (MAV) service providers registered to operate
in New Jersey. A review of business addresses indicates that MAV providers are more likely to be located in urban and suburban counties than in rural counties. This could be partially a reflection of the market-driven nature of MAV providers. They operate in densely populated areas where the need and demand for services is greater and the cost per mile of operation is lower.
Medicare and Medicaid funds provide the large majority (66%) of the financial support for MAV providers.
The vast majority (92 percent) of the MAV agencies surveyed provide demand-response services. In addition, 39 agencies (64 percent) offer subscription services to their clients. Very few provide fixed-route or group services. Twenty-five of the providers surveyed offer only one type of transportation service. Of these, 20 (80 percent) provide only demand-response service, four offer subscription services and one agency operates a fixed-route service.
MAV providers have much more extensive hours of service than either the county-based or NGO operated services. Twenty-five providers or 41 percent operate 24 hours per day, seven days a week. The average MAV provider operates 121 hours per week. The minimum schedule of service is Monday through Friday, 8 am to 5 pm. However, all but one agency operates more than 45 hours per week. Fifty MAV agencies (83 percent) operate on Saturdays, and 28 (46%) operate on Sundays.
In general, MAV providers have a larger service area than either county or NGO service providers; however, MAV providers are not located in every county. More than half (62%) of the MAV agencies surveyed will transport clients within an area greater than one county. Nine agencies have no designated service area and will travel anywhere requested. Twelve operate within a single county, one is restricted to a defined set of municipalities and one agency operates within a single municipality.
The average fleet size for MAV providers is 16 vehicles, which include a mix of sedans, vans mini-buses and ambulances. As might be expected, most of the MAV providers surveyed operate ambulances.
More than half, 34 of the 61 providers surveyed, serve only one type of customer. Of this group, 24 agencies (71 percent) provide services exclusively to Medicaid recipients. Those agencies that provide service to more than one customer group most commonly transport Medicaid recipients and disabled clients. Twenty-six of the 61 MAV agencies (43 percent) interviewed serve the disabled population, and 17 of them (28 percent) provide transportation for the elderly.

Meeting the Employment Transportation Needs of People with Disabilities in New Jersey
66
Forty-eight agencies or 79 percent of those surveyed provide only trips for medical purposes. Thirteen agencies provide trips for more than one trip purpose. Only five agencies reported offering transportation for either employment or educational purposes, two stated that they will transport for recreation and one for shopping. As stated above, medical trips make up the vast majority of all trips provided by MAV agencies.
The MAV providers that make trips for a more diverse set of purposes appear to be the
smaller operators that build a close relationship with their clients over a period of time. Although it may not be part of their policy or business plan, some smaller providers reported transporting regular medical trip clients to other purposes on occasion.
Of the 52 (85 percent) MAV agencies that reported never providing work trips, 46 of them offered an explanation. Thirty-four claimed that it was a result of the rules of their funding. This is a function of the high numbers of agencies heavily supported by Medicaid funds which can only be used to pay for medical trips. In addition, four agencies stated that it was due to the rules of their operation, two said they did not have the demand for employment trip service, and six agencies would not offer an explanation.
Twenty MAV agencies surveyed require medical documentation, reflecting the large number of agencies that transport Medicaid recipients. Two agencies only require that the passengers self-report their disability. Four MAV operators require either medical documentation, or a self-report, depending upon how the fare will be paid (e.g. Medicaid reimbursement or out-of-pocket payment). None of the MAV providers included in this survey conduct their own evaluation to determine eligibility. All 61 agencies surveyed operate their own vehicles.
All but one of the agencies surveyed stated that they require their drivers to be certified in
First Aid. In addition, 59 reported that their drivers are trained to assist passengers with mobility impairments, and 54 stated that their drivers receive sensitivity training. These high numbers of trained drivers may be due to the fact that many of the MAV agencies operate ambulances as well as other types of vehicles.

Meeting the Employment Transportation Needs of People with Disabilities in New Jersey
67

Meeting the Employment Transportation Needs of People with Disabilities in New Jersey
68
CHAPTER 4: TRANSPORTATION NEEDS ANALYSIS
4.1 Introduction Personal mobility is an important component of quality of life for everyone. For the general population, personal mobility is largely defined by the ability to drive and access to a private automobile. While public transportation is a consideration for some, the vast majority of all trips made in the United States are made by car. For people with disabilities, the concept of personal mobility is more complex, especially for those who are sight impaired or who have mobility impairment(s) that require the use of a wheelchair or other assistive device. National statistics indicate that more than half of non-working adults with disabilities studied encountered difficulties looking for work. Twenty-nine percent cited lack of transportation as a reason why they were discouraged from seeking work. Nineteen percent reported needing an accommodation in the form of accessible parking or an accessible transit stop nearby to take and keep a job (Loprest 2001). Interestingly, a recent survey of NJ Workability enrollees found that 54 percent of those employed drive their own vehicle to work. Another 11 percent receive a ride from a friend or family member and seven percent worked from home. Very few, less than 1 percent, reported traveling to work by public transportation (Honeycutt 2005). In order to address the transportation barriers to work faced by people with disabilities in New Jersey, it is important to understand fully their work-related travel needs. Toward that end, the research team convened and facilitated a series of focus groups, designed and administered a consumer survey and conducted an access and work “opportunity” analysis exploring the relationship between consumer residence data, data on available transportation services and employment data. This chapter presents a summary of the focus group and consumer survey findings as well as the results of the spatial data analyses used to identify patterns of access and work “opportunity” for people with disabilities living in the state.

Meeting the Employment Transportation Needs of People with Disabilities in New Jersey
69
4.2 Focus groups As briefly mentioned above, the research team conducted a series of six in-person focus groups as part of the study – one each with vocational rehabilitation counselors and paratransit drivers, and four regional meetings with consumers. In addition, two on-line bulletin board focus groups were also conducted with consumers. The purpose of the focus groups was to help gain a more comprehensive understanding of the transportation experiences and challenges faced by people with disabilities living in New Jersey and those working with consumers on a daily basis.
Focus Group 1 – Consumers The first focus group was held on May 16, 2002, with fourteen clients from Atlantic, Burlington, Cumberland, Mercer, Middlesex, Monmouth and Somerset counties attending. Meeting participants were engaged in a discussion related to the following general questions:
1. How do you get to/from work and how/why did you select that means of transport?
2. Is your selected means of transport effective and reliable and why?
3. What positive and negative experiences have you had?
4. What are your transportation expectations and needs?
5. What are your ideas for eliminating barriers and improving travel options for people with disabilities?
The mode of transportation most frequently cited by participants as their means to get to/from work was driving. Other frequent responses included Access Link, taxi/car service, county paratransit and traditional bus and rail transit services. Participants reported that a variety of factors, including their disability, affect their choice of transportation mode to/from work. For those not driving, factors considered included service schedules, cost, reliability, ease of access and prescribed wait times, as well as personal safety (both during a trip and at trip locations). With specific regard to trip scheduling, it was noted by several participants that the inflexibility of the Access Link scheduling window (20 +/- minutes before and after the scheduled pick up time) and the time and inconvenience related to Access Link trip planning were issues. For those who drove, parking issues and availability of an appropriate vehicle were cited as issues of concern in selecting which mode of transportation to use in order to commute to/from work. Participants discussed various modes of transportation in terms of reliability and effectiveness relative to meeting their travel needs. They also offered a variety of suggestions related to improving the existing transportation system. Participants noted that residential location and accessibility to different transportation options can influence individual decisions to seek employment. They also noted that the often overwhelming task of trip planning within the current system and the uncertainty and irregularity of service can affect an individual’s work experience as well as their decision to stay employed. Participants commented that work trips are often not a priority for certain providers (e.g., county paratransit systems) which often favor trips for medical and other purposes. Employed participants and those seeking work were also concerned about finding appropriate transportation during the work day when business-related travel was required. Some remarked that lack of a guaranteed ride home in the event of an emergency was a concern. Participants agreed that there was a need for greater employer buy-in
Meeting the Employment Transportation Needs of People with Disabilities in New Jersey
70
to addressing transportation and other accessibility issues. Other suggestions for improvement included, but were not limited, to the following two broad topics:
Increase driver education and training related to a host of concerns which include wheelchair tie-down procedures and bridge plate operation; maintenance of these assistance facilities; and driver sensitivity; and
Improve coordination between different services and service providers. Related to this issue is the lack of a “one-stop” contact point for transportation information and trip planning assistance.
Participants had mixed travel experiences. Some shared positive experiences which included the overall perception that NJ TRANSIT employees are knowledgeable and sensitive to customer needs. With regard to county paratransit, some participants acknowledged that some counties are beginning to expand and improve services. In terms of negative travel experiences, participants noted that advanced scheduling requirements and restrictions on children riding in vehicles are problematic. Also mentioned were real and perceived restrictions on the use of funding for services. Participants specifically noted that greater uniformity in services is needed from county to county. In addition to discussing work-related transportation needs and travel experiences, participants were engaged in discussion related to their expectations regarding the ideal transportation service and ideas for expanding travel options for people with disabilities. A diversity of comments and suggestions were offered. Many echoed comments made earlier in the session. Some expectations and suggestions cited included the following:
Provide more travel training for users and employment counselors; Address safety concerns on current transit systems; Utilize Smart Card technology and voice activated ticketing/validating machines and
schedules; and Expand and improve service options and coordination.
Many of the comments were oriented specifically toward improving Access Link service. In that regard, participants suggested increased flexibility in terms of scheduling requirements and cancellation policies/penalties, as well as expanding the “shadow” service boundary beyond the current three quarters of a mile.
Focus Group 2 – Vocational Rehabilitation Counselors A second focus group was held on June 4, 2002 with vocational rehabilitation counselors from the following counties: Atlantic, Burlington, Essex, Hudson, Hunterdon, Middlesex, Monmouth, Passaic, Somerset, Sussex and Warren counties. Meeting participants were engaged in a discussion related to the following general questions:
1. What have been your experiences with regard to finding transportation to support job placement for your clients? What are the challenges and major issues you face?
2. What modes of transportation do your clients use to get to work, and how are these arranged?

Meeting the Employment Transportation Needs of People with Disabilities in New Jersey
71
3. What are your ideas about eliminating barriers and improving New Jersey’s transportation network?
Participants agreed that the current transportation system is fragmented. This fragmentation makes it challenging to find their clients an appropriate means of getting to/from work. Participants made the following comments and observations:
The range of transportation options for people with disabilities is lacking. The availability and quality of transportation services often varies depending on geographic location and transportation needs often vary depending on client disability.
There are a number of problems with county paratransit services, including: various service restrictions (e.g. age requirements for travel), unwillingness of most county-operated services to cross county lines, and general unsuitability for work trips. For example, many county paratransit systems offer limited operating hours and vehicles are sometimes overcrowded. In addition, participants remarked that paratransit services continue to be stigmatized.
Most part-time and flexible hour jobs are located in the suburbs. As such, many clients must travel between suburban residences and suburban work locations, with few travel options to meet their needs.
There is no central source for transportation information and trip planning assistance.
Issues related to trip planning, scheduling and personal safety often hinders employment options.
Participants reported that their clients use a variety of means to travel to and from work, including: Access Link, county paratransit, traditional transit, private transportation (e.g. auto), walking/bicycling, grant funded transportation, taxi/car companies and family/friends. They emphasized that without a central source for transportation information available, success in finding transportation for clients is often premised on the personal knowledge and/or contacts of individual counselors.
Participants reported that their first point of contact relative to finding transportation for one of their clients is the county paratransit provider. Participants reported positive past experiences working with county providers in Monmouth, Hunterdon, Warren and Sussex counties. Participants generally agreed that taxis are too expensive for daily commuting. In addition, participants noted that taxi providers are sometimes unwilling to take disabled passengers.
With regard to eliminating transportation barriers to work and improving transport options for people with disabilities, participants shared a diverse range of ideas. These included:
Provide better travel training and trip planning services for clients;
Develop a central resource for obtaining transportation information about both public and private services;
Make more use of fares when clients are able to pay for the services they receive;
Create a door-to-hub service model (e.g. airport limos);

Meeting the Employment Transportation Needs of People with Disabilities in New Jersey
72
Develop a car donation program that could offer vehicles for use by the clients who are able to drive but can’t afford a car and make funds available to retrofit vehicles with assistive devices as needed;
Place bicycle racks on all transit vehicles; and
Provide tax benefits to clients who use transit a certain percentage of the time.
Focus Group 3 – Paratransit drivers A third focus group was held on June 12, 2002. Participants included six drivers of paratransit vehicles serving elderly and disabled residents of Middlesex County. The operations manager and director of the Middlesex County Area Wide Transportation Services facility also participated in the focus group. Participants were engaged in a discussion related to the following general questions:
What challenges have you faced serving disabled clients? What challenges face your clients?
What positive and negative experiences have you and your clients encountered?
From your perspective, what things do your clients want most from transportation? What do they most depend on?
How can transportation services and the delivery of those services be improved for your clients?
Participants commented on various challenges encountered while serving disabled clients and on the challenges faced by their clients in using the county services. For example, several drivers noted a lack of common courtesy on the part of both clients and drivers. They also noted that paratransit vehicle design often poses problems for drivers and clients. For example, vehicle height can be a problem for drivers seeking to drop off/pick up clients under low building overhangs. In addition, some aspects of vehicle design, including getting in and out of vehicles are perceived to compromise driver safety. From a client perspective, participants noted that not all clients readily adapt to the vehicles in use. For example vehicles do not always match a given client’s needs relative to their specific disability. Vehicle maintenance was also mentioned as a specific concern and issue for drivers.
Participants emphasized that there are differing and often conflicting expectations related to the level of service offered and possible from the county paratransit system. This creates problems for both clients and drivers. For example, drivers explained that many disabled clients want services similar to a door-to-door taxi service, whereas existing paratransit services are required by law or regulation to operate curb-to curb service. As such, some clients expect drivers to provide assistance in getting to and boarding the vehicle. However, due to liability issues, drivers are not permitted to provide such assistance. With this said, participants acknowledged that some drivers will assist clients while others will not. This results in inconsistent service and conflicting expectations, which is frustrating for both drivers and clients.
In addition, drivers noted that the characteristics of demand response service (e.g., advance reservation requirements, changing schedules and varied routing) are not conducive to daily

Meeting the Employment Transportation Needs of People with Disabilities in New Jersey
73
commute trips. This conflicts with the expectations of clients who don’t understand how the system works.
Several participants noted that demand for service exceeds available resources. This is a point of frustration for both clients and drivers. To address this issue, participants suggested that stricter client eligibility criteria and a more rigorous screening process be utilized. Participants also suggested implementing a fare policy whereby working clients or those above a certain income threshold are required to pay a fee for the services they receive. This could provide additional revenue to expand or enhance existing services.
In the context of limited resources, drivers expressed the perception that they do no have the resources needed to conduct their jobs properly. Drivers explained that they lack enough well-maintained vehicles, as well as manpower to get the job done. They also discussed various constraints related to current scheduling and dispatch processes. Drivers explained that the scheduling system does not allow room for unpredictable travel conditions (e.g., traffic and congestion). They suggested that real time vehicle tracking information could be used to address this issue. In addition, client provided information, such as address and destination, is sometimes unreliable and schedulers/dispatchers are often unfamiliar with trip geography.
When asked to comment on what they felt clients wanted most in terms of transportation, drivers agreed that disabled clients want independence, efficiency and flexibility from their transportation systems. They also want to make appointments with shorter planning timeframes; and they want vehicles to be modern and well maintained. Participants noted that in some ways, this is in conflict with the thing most important to drivers, which is safety.
Drivers made a number of suggestions related to improving transportation and the way in which services are delivered. First, they stressed that transportation must become a public priority. To make this goal a reality, policymakers, elected officials and the public must become more aware of client needs, the complexities of providing transportation services, and the need for increased resources. Second, differing and sometimes conflicting service expectations must be addressed. One way to do so would be to conduct a complete review of existing policies, procedures and service models to ensure they coincide with the needs, demands and expectations of current clients. This can best be done by seeking out and using client feedback as a means to improve the system.
Follow up consumer focus groups A total of three additional in-person and two online bulletin board focus groups were conducted with consumers. The in-person focus groups were held in Newark, New Brunswick and Vineland over the course of three days in May 2004. The online bulletin board groups were open for a period of 24-hours over the course of three days in December 2004. Participants were advised that they could log onto the bulletin board at any time during each 24-hour period to respond to questions posed by the moderator or to review comments/questions posed by their peers. Participants were required to log in at least twice during each 24-hour period for each of the three days.

Meeting the Employment Transportation Needs of People with Disabilities in New Jersey
74
A total of 35 consumers were able to participate in the follow up focus groups. Although most participated without assistance, depending on their disability, some participants, both in-person and online, received help from a caregiver to participate in the research.
The major topics of conversation for all of the follow up focus groups related to current travel behavior, available mobility options, transportation barriers to seeking and retaining employment, and perceptions regarding the ‘ideal’ transportation system for disabled persons. Participants were also asked to react to the concept of creating a mobility website for persons with disabilities and to consider the content, linkages and utility of such a resource.
The thoughts and feelings of those participating in the in-person focus groups were quite consistent with those who participated in the online bulletin board focus groups.
General patterns of mobility Persons with disabilities, depending on the nature of their disability, can be categorized as mobile, somewhat mobile, or not mobile (e.g. cannot travel without the assistance of a caregiver or have a perception that they cannot travel without assistance). Reasons for not being mobile appeared to vary by disability type and/or access (real or perceived) to alternate transportation.
Typical trip making by participants included trips to medical facilities, social service agencies, recreation and entertainment, libraries, school, shopping and work. As noted above, some disabled persons seemed unable to travel without depending on others to drive or travel with them, thus they typically stay home. When considering their travel patterns during a typical week participants observed the following:
Mobile
“Monday I went to work and took my daughter to school. I drove my mini van. Then I came home and cleaned the apartment. After school I took my daughter to the mall again I drove. Then we came home and went to bed. Tuesday got up and went to work drove and took Kristen to school. Then she had a basketball game so I picked her up at 6:30 PM. Then we came home and I helped her with homework and ate dinner and went to bed. Wednesday I went to work and then took her school. Then we met up with friends at Bridgewater mall I drove there. We did shopping and then came home.
Somewhat Mobile
“I belong to an Aphasia Support Group which meets each Friday at the Kip Center in Rutherford. The NJ Transit Access Link Bus picks me up. My wife has a standing reservation order for me for pick up to and from the Center. A couple of old friends call me during the week. On Saturdays my wife and I go out for lunch and we go shopping and visiting my father-in -law who is in a Nursing Home.”
“Sunday, I stayed at home and my family came to visit. Monday, I took a vacation day to go shopping at Freehold mall and my friend drove. Tuesday through today I went back and forth to work via Access Link. I have a standing order Monday - Friday with Access Link to get back and forth to work.”
“This past week, I traveled about 30 minutes from my house in Keyport to my school in West Long Branch. My dad drove me in our wheelchair accessible van. After that, the only

Meeting the Employment Transportation Needs of People with Disabilities in New Jersey
75
traveling I did was drive my wheelchair across campus to get to class. Thankfully, my campus is small so I was able to do that easily. Tomorrow, my mother will be picking me up and driving me back to my house. I don't travel anywhere outside of campus while I'm at school because I can't drive myself.”
Not Mobile
“I do not drive so I ask my husband Clayton to drive me around when I have to pick up my medicine or to go food shopping. I am a Homemaker so I stay home and clean our apartment during the week. I feel safer on the ACCESS LINK bus by NJ TRANSIT because I won't hit my head on the back of a seat, and usually my husband and I get the bus or a car to ourselves. On the local NJ TRANSIT buses there is a bus full of people on board and if I have a seizure at least 5 of them are watching me. I feel very uncomfortable after I have a seizure. Since I have been taking the ACCESS LINK bus a driver hasn't noticed me having a seizure yet because they are usually too busy talking to my husband.”
Available Mobility Options Mobile or somewhat mobile participants reported making use of a variety of available transportation options, including: Traditional bus and rail services, Access Link, and county paratransit services, taxis, and medical transport vehicles. Many also reported walking, even when the assistance of a cane or wheelchair is required. Some reported driving themselves, while others need to depend on someone else, usually a family member or friend, to drive them. Users of Access Link expressed mixed feelings about the service. Some shared the perception that the service is better than nothing, while others described it as a reasonable transportation system. One individual observed that even if you meet Access Link eligibility criteria, the service is only available if you reside close to an existing bus route and thus, cannot necessarily be used by transportation needy people. Most participants general noted that there are many features of the system that do not serve the disabled population well. Specific comments related to Access Link included the following:
“Using Access Link for work has helped me keep my job. They're inexpensive; if I'd had to pay cab fares with a part time job it wouldn't have been worth it. Keeping my job has let me keep my house! I even used them (Access Link) to go all the way to Wayne to visit a friend. Their drivers are usually nice. I don't have to always ask for favors.”
“It gets me to where I have to go, without relying on friends or family members.”
“When I was walking better I was hoping to go to New York City and thought I might be able to use the ferry but it was off the main bus route and Access Link wouldn't take me there. I never got to NY. Even if they (Access Link) go to a particular place they may not go there at the time you need. That has to agree with the regular bus schedules too. It used to be with 3/4 of a mile, but they (Access Link) may have changed it to 1/4.”
“Because of Jennifer's recent blindness, she has lost almost all independence. Using access link has become somewhat difficult because of the amount of assistance and guidance that she now requires getting on and off the bus. The drivers are not required to give the riders much assistance.”

Meeting the Employment Transportation Needs of People with Disabilities in New Jersey
76
“They are not sufficient to meet my needs since sometimes I have emergency doctor appointments and the trips need to be booked ahead of time. I don't have family on which to rely.”
“… There are drawbacks to Access Link. When I take them (Access Link) from home I have full confidence in them because I can sit inside and wait. They're very reliable. If I have to go some place unknown to me I won't know if there will be a place where I can wait for Access Link to pick me up. I can't stand and frequently I can't see from inside if they are waiting for me.”
Barriers to seeking and retaining employment According to focus group participants, the travel behavior of persons with disabilities is highly dependant on the nature and extent of their disability as well as the transportation environment. Both of these factors may influence whether or not a disabled person is working or able to retain employment. The following specific comments were shared by participants:
“I run a very small business from my house, through an online store. Other than that, I am not employed and have never been employed. I spend my time doing schoolwork (I'm in my 4th year of college), reading, and doing crafts. My disability is Muscular Dystrophy, and I'm pretty limited in what I can do. I have looked for a job in the past, but I can't find anything suitable. I either don't have enough experience, can't get to the location, or physically can't do the job.”
“I would like to find some form of work but I have been having lots of trouble drifting into manic moods. The doctor is working with me to find a happy medium with my meds. I hope he does. I hate the state of MANIA. I also have no car so I am limited to finding a job close to my home. Sometimes I feel like I am caught in a catch 22 and I HATE it !!!”
“I live in Kearny, NJ. I am disabled, I walk with a 4-prong cane, and use a wheel-chair for outings with my wife's assistance. I spend the day at home. I walk on a tread-mill for 1/2hr each morning after breakfast. I have use of only one hand and do my best to help my wife with dusting & folding towels. I watch movies during the day. My son comes over & loads the DVD player with 5 movies … I am not able to work.”
“I am Jennifer's mother. My name is Lena. We live in Cherry Hill. I am participating in this survey on Jennifer's behalf. Jennifer is blind and works in a sheltered workshop. She lives at home with us … Jennifer was born almost completely blind. She was able to see shadows and had some light and depth perception. She also was born with some right-sided weakness. During this summer, she had some eye problems, had eye surgery, and eventually lost all of her remaining sight. She is at the rehab center to learn cane travel, and other activities of daily living. Jen is also learning disabled, which of course limits her in many areas.”
Specific characteristics of the transportation environment that pose challenges to disabled persons include the following.
Eligibility requirements – some participants cited having to repeatedly apply for Access Link services before being accepted. Several participants reported knowing a disabled person who had given up attempting to demonstrate their eligibility and were left in the difficult situation of being completely dependent on someone else for transportation. Participants with visual impairments stressed that Access Link is particularly insensitive

Meeting the Employment Transportation Needs of People with Disabilities in New Jersey
77
to their needs and suggested that the definition of visual impairment used to determine Access Link eligibility be changed.
Multiple pick-ups and long routes – participants reported being frequently tardy for appointments because services were often running late. Service reliability has a severe impact on job seeking and job retention.
Lack of advance notice or communication regarding schedule delays and arrival times – participants acknowledged that communication makes the difference in a variety of ways such as having to wait outside in bad weather, or receiving employer support.
Policies regarding boarding and alighting assistance.
Driver rudeness, impatience, insensitivity.
Policies related to scheduling, including advance reservation requirements and cancellation consequences.
Access Link service area within a 3/4 buffer of fixed-route bus service.
Pick-up/drop-off window (e.g., Access Link 20 minutes before and 20 minutes after scheduled time).
Lack of transportation options/alternatives in some areas.
Vehicle safety issues.
Difficulty with making linked trips – users are not permitted to make trips for multiple purposes to save time and be as productive as they would like to be.
Participants made the following specific comments:
“A friend with heart trouble was denied Access Link and became frustrated.”
“Some (disabled) people are not able to articulate the need for (Access Link) service.”
“A friend lost her job from multiple pick-ups. Access Link refuses to alter schedules to make it convenient for the client and will never call the employer if the service is running late.”
“I feel that if my husband has to be ready to go 20 minutes ahead of schedule and also know that the bus could be 20 minutes late and he has to be outside, the transportation should show up within the window not extra late and also if there are other passengers on the bus the closest destination should be dropped off first not last.”
“When I had to rely solely on Access Link, I was late many times no matter how early I scheduled my ride. For instance, I was only a half hour away from work so then I needed to keep in mind that there is the 20 minute window before pick up time that they can pick me up and the 20 minute window of time that they can be late. But then you need to account for the time that they give you a tour of South Jersey before they drop you off. This is not including the half hour that it would normally take someone to get there. So I would usually schedule myself at least 2 hours before I would need to arrive for work. Sometimes I would get there late with all of that preparation I tried to do. This is not including the time to get home and the two 20 min windows of time and another tour before they drop me off. It just wasn't worth trying to work with that kind of transportation that was available to me.”

Meeting the Employment Transportation Needs of People with Disabilities in New Jersey
78
“The 20 minute window can be quite frustrating. Waiting outside for the bus to arrive in the winter is not very convenient. The bus drivers are not permitted to honk when they arrive, so that Jennifer sometimes doesn't even know when they’ve arrived to pick her up.”
“I work about ten blocks away (from home) and I have been taken all the way to Jersey City (about a 20 minute trip each way) and then brought back and taken to work. Of course I was late.”
“The return trip is always a concern to me when I use Access Link. Will I be able to wait sitting down and inside, will I be able to see the bus and get to it within five minutes, if it is late, will I miss the bus while I am trying to phone them.”
“The SpeedLine (PATCO) should announce stops and provide an escalator for the 36 steps.”
“In bad weather (she) was not aware when the bus was present and the driver did not get out and see if she was waiting.”
“I really do wish that Access Link was more dependable. The drivers are not allowed to assist getting from the apartment or destination. If it is raining or bad weather or too many leaves on the ground etc. I cancel his trip because I am afraid he will fall.”
“Access Link makes her stomach tighten because they are insensitive and do not care.”
“With Access Link you have to schedule your rides ahead of time and may not get the times you request.”
“Access Link is a very good service. The only problem is that it does not go to some areas because that place may not be on a regular bus route.”
“I live in Piscataway. There is no public transportation and I can’t afford cabs and I am unable to walk to bus stops.”
“Where I live there isn't much public transportation at all. If you don't have a car or live with someone who has a car you are on your own. The food store close to here is 7 blocks up the hill. My asthma acts up by the time I get to the top of the hill. I wish we even had a cab company here, but all we have is the link (Hunterdon County paratransit).”
“I take Access Link to work but not home from work. My friend passes the library at 5:30 and so he usually takes me home. If I need to pick up a prescription at the druggist or go to the pet store, he will take me if he has time, if not, it has to wait. I do my banking at the supermarket, so that is integrated. My aunt used to sometimes drive me for a quick errand before she had her stroke. Errands, per se, are not possible with Access Link.”
“In the current system you cannot do stops in between. When I had to do multiple trips in a day then I would have to allow a couple of hours in between. Therefore, multiple trips are pretty much out and only a few can be done.”
“When I had to rely solely on paratransit services, I was not able to accomplish the same amount as I can now since you could not plan as much for multiple activities in the same day.”
When asked for their vision of the ‘ideal’ transportation system, focus group participants responded with an array of desired features. Some of these features would be desired by the general public (e.g. “Door-to-door service”), while many were reasonable expectations for a

Meeting the Employment Transportation Needs of People with Disabilities in New Jersey
79
seamless, integrated, effective transportation system. The following comments illustrate what participants expressed as desired characteristics:
“Safe, efficient and comfortable”
“Reliable, convenient, dependable, (goes) more places”
“Timeliness”
“Caring bus driver”
“Friendly and careful drivers”
“Driver sensitivity training”
“Increased mobility connections”
“Better shelters for consumers utilizing public transportation”
“Reasonable costs”
Timely communication – “The driver or dispatcher would call when the vehicle was about 10 minutes away to give the person ample time to be outside their home or apartment;” “The driver would enter the building to let the rider know he was there for the return trip.”
“People on the phone and who drive will be kinder and more understanding. No smoking!!!! Services would be on time or (driver) would be courteous enough to phone and say that they will be a little late. The means of transportation will be clean and at least in decent working condition. There will be a number one can call if one needs to get to ER so we do not have to call the police and an ambulance- it often is not needed -we just need to get to ER. The services would be equipped and trained to deal with people of ALL disabilities. And everything that goes on in the vehicle is confidential. The driver should not be discussing my situation with me or especially anyone else in the vehicle. I've discovered that a lot of people are chatty and want to tell you the story of their life-and that's ok-for them. But if I don't wish to do so I can remain comfortably silent. Buses, cars, trains, whatever- I would take any means to get to my doctors ON TIME and back.
“Every bus would be equipped with a lift and they would be able to carry more than one wheelchair user that needs the tie downs. Bus drivers wouldn't be lazy and pass us by (I have had that experience where the bus driver just passed us by I guess because they would need to get off their rear ends to tie the wheelchair down). So if I am allowed to dream here, I would also have the buses have automatic tie downs so that way the drivers wouldn't feel like we are too much work.”
“There could be more wheelchair ramps on the busses. (Could be) easier to get up the steps and let people who are disabled sit in front of the bus instead of the back where it is hard to get out from and get air.”
When participants were asked “What one transportation characteristic (such as service frequency, type of service, etc.) would you be willing to give up to have more of something else?”, responses generally indicated a willingness to forego an existing feature in order to gain more reliability, flexibility or assistance. However, several participants stressed that they should not have to give up anything to gain something else. The following are some of the specific comments shared by participants:

Meeting the Employment Transportation Needs of People with Disabilities in New Jersey
80
“We would give up having a Standing Order and would like to gain being picked up at the actual pick up time instead of the 20 minute window. This would avoid waiting outside for an extended period of time. The other change we would really like to see is that if there are other passengers on the bus the closest destination gets dropped off first, this would avoid a lot of frustration.”
“I would give up the distance (Access Link will travel) if I could be certain of the return pick up time.”
“The standing order is convenient, but I would give that up (in order) to have the driver come to the door.”
“I'd be willing to give up ANYTHING if I could have the option of picking up the phone and saying, ‘Can you please pick me up at 9:00 am for the next 10 days and be on time.”
“Well, I don't think we should have to give up any options. But if I had to choose, I would say that I would pay more money to get better service and more route options.”
“I don't think we should have to give up any service in order to have the same privileges as the able-bodied. I guess it would be the cost that I would be willing to pay for.”
Website for disabled persons Among focus group participants, there was strong support for the idea of developing a website for disabled persons. Although some participants indicated they do not currently utilize computers and/or the Internet, the desire to have a place to go for information and to share and discuss common experiences was evident. As explained by participants, the website concept would have the broadest appeal if it included timely and relevant content on a host of topics, not only those related to mobility. According to focus group participants, the desired website would serve the disabled community, caregivers and resource/service providers and meet a variety of currently unmet needs, including the following:
“I think the Web-based community should consist of the Disabled, Care-Givers and Resource Centers. I personally (as a Care-Giver) would like to get some advice when I have a specific problem… I really think a Web-based community would benefit me because I can talk even though most people are sleeping & I can still get an answer when someone has time to reply.”
“Links to physical (doctors and hospitals), mental (how to cope, support groups etc.), spiritual (churches), cultural (arts), communal (local places, opportunities), and educational (on-line and not.) “
“Listings for doctors and dentists--(including what insurance plans they accept--Medicaid, etc), support groups, latest up-dates on medical procedures and treatments for the disabled; restaurants and other "social" places that are accessible; forums for information and friendship; (places) to find a personal assistant, to shop that deliver--food, etc; up-dates on transportation issues--new places and ways to go; arts and creativity encouragement; educational opportunities; help with computers; job related issues and job postings… I think anyone with a permanent condition that limits their participation in the "real" community should be part of the web community. Forums would sort them into categories.
“I would like this web based community. It should be used for people with disabilities. It would be a fun way for people to communicate with friends and relatives.”

Meeting the Employment Transportation Needs of People with Disabilities in New Jersey
81
“I would like to see some suggestions on different types of day trips for people with disabilities & their care-giver. I would like to see a resource center (and a) care-giver support group. I would like some type of magazine for people with disabilities & caregivers.”
“Links to all types of products for people with disabilities and links to Resorts, Parks, Group Cruises (to get the best possible rate), (to) all kinds of companies that will give a discount to people with disabilities for any type of product they need.”
“I would just like to talk to people about issues such as transportation and discrimination. People with all disabilities can make use of this community.” “I would like to see a web-based community that tells you who the proper authorities to contact, how to contact them, and suggestions on what to say or ask for.” “People talking about the means of transportation they use to get from one place to another and being able to suggest to others if it was a good experience or not. Also if some people wanted to talk about their disability or ask some questions to someone who has a similar disability-that might be good or if someone knows of any available jobs. It could be used sort of like a bulletin board. And most important- have a listing of all the means of transportation for people with disabilities and the phone numbers.” “Links to different disability web sites, information on our transportation options, information on other disability services, message boards, and maybe a chat room.” “(Have) who we can contact if we have a problem dealing with transportation or dealing with anything in general.”

Meeting the Employment Transportation Needs of People with Disabilities in New Jersey
82
4.3 Consumer survey In addition to the consumer focus groups described in Section 4.2 above, the research team designed and administered a consumer survey. Like the focus groups, the purpose of the survey was to help the research team to understand better the transportation needs and experiences of persons with disabilities living in New Jersey, especially in relation to work-related travel. The survey provided an opportunity to receive important input from a larger number of consumers than could participate in the focus groups.
Survey overview and methodology The survey included a total of 21 questions organized in four topical areas, including: employment and travel experiences; awareness and perceptions of transportation options; information and communication related to transportation alternatives; and personal characteristics. Surveys were distributed in winter 2004 to past and current NJ TRANSIT Access Link users via NJ TRANSIT’s LinkNotes newsletter. The survey was also mailed to individuals enrolled in the NJ Division of Disabilities Workability program. The survey was voluntary; however, as an incentive to encourage participation, those completing and returning the survey were entered to win a $100 gift certificate. In total, 4,600 surveys were distributed and 381 responses were received. As shown in Table 4.1, this represented an 8.2 percent response rate. Approximately half of the survey respondents provided information regarding their zip code of residence. Figure 4.1 depicts a map showing the geographic distribution of survey respondents based on this information. As can be seen from the map, survey respondents were generally well distributed throughout the state in a pattern consistent with overall population densities.

Meeting the Employment Transportation Needs of People with Disabilities in New Jersey
83
Figure 4.1: Geographic distribution of survey respondents

Meeting the Employment Transportation Needs of People with Disabilities in New Jersey
84
Table 4.1: Consumer survey response rates
NJT Access Link –
Link Notes Newsletter DDS Workability
database Overall
Surveys mailed 4,000 600 4,600 Surveys returned 341 40 381 Response rate 8.5% 6.6% 8.2%
General Characteristics of Survey Respondents As indicated above, 381 individuals responded to the survey. Two hundred thirty nine were women (65 percent) and 127 (35 percent) were men. Approximately three quarters of the respondents (280) were “working age” between the ages of 18 and 64. The remaining 25 percent or approximately 90 respondents were 65 years or older (see Table 4.2). Table 4.2: Age of Respondents
Respondent’s Age Number Percent
under 18 1 0% 18 to 24 25 7% 25 to 34 52 14% 35 to 44 54 14% 45 to 54 70 19% 55 to 64 82 22% 65 and over 93 25% Total 377 100%
As shown in Table 4.3, approximately one-third of the survey respondents reported high school graduation or equivalency as their last year of education attained. Another 30 percent reported having some college, trade or technical school experience. Ten percent reported less than a high school education and approximately 17 percent reported having a college or post graduate education. Table 4.3: Educational Attainment
Number Percent
Less than high school 40 10% High school graduate or GED 129 34% Some college, trade or technical school 116 30% College graduate 44 12% Post graduate 20 5% Other education 19 5% No Response 13 3% Total 381 100%

Meeting the Employment Transportation Needs of People with Disabilities in New Jersey
85
Employment Characteristics As previously stated, 280 of the survey respondents were working age. Of those, 128 or 46 percent reported being employed. As described in Chapter 2, according to the 2000 census, the statewide employment rate for people with disabilities was 58 percent. As such, it should be noted that unemployed people with disabilities are slightly overrepresented in the survey when compared to the general population of people with disabilities living in New Jersey. Table 4.4: Employment rates of working age respondents
Number Percent
Employed 128 46%
Unemployed 152 54%
As might be expected, employment rates declined with age (see Table 4.2). Those aged 25 to 34 and 35 to 44 were most likely to be employed. These age groups accounted for half of all the employed working age respondents. Table 4.5: Employment rates by age group
Respondent's age Number
Employed Percent Number
Unemployed Percent Total Percent under 18 0 0% 1 0% 1 0% 18 to 24 16 12% 9 4% 25 7% 25 to 34 35 27% 16 7% 51 14% 35 to 44 30 23% 23 10% 53 14% 45 to 54 25 19% 44 18% 69 19% 55 to 64 22 17% 59 25% 81 22% 65 and over 4 3% 86 36% 90 24% TOTAL 132 100% 238 100% 370 100%
As shown in Table 4.6, 44 percent of employed survey respondents reported being a high school graduate or having a high school equivalency degree. Employment rates were highest among this group. The next highest category was individuals possessing some college, trade or technical school education. Twenty-four percent of employed survey respondents were from this group. Table 4.6: Last year of education: Employed working age respondents
Number Percent Less than high school 7 6% High school graduate or GED 56 44% Some college, trade or technical school 31 24% College graduate 16 13% Post graduate 7 6% Other education 11 9%

Meeting the Employment Transportation Needs of People with Disabilities in New Jersey
86
Most working age unemployed survey respondents (74 percent) reported that they were not actively looking for work. These respondents were asked the reason why they were not seeking work. Table 4.7 summarizes the reasons cited. Of the 113 respondents who provided an answer, 51 (45 percent) reported a permanent physical disability; eight (7 percent) reported a temporary health problem; eight (7 percent) reported a permanent mental disability; four (4 percent) cited lack of transportation as being a barrier to seeking work; eleven (10 percent) cited some other reason and 31 (27 percent) reported multiple reasons. Among the 31 people citing multiple reasons, seven had a temporary health problem, 25 had a permanent physical disability, 13 had a permanent mental disability, 12 cited a lack of transportation, and 2 cited other reasons for not seeking employment. In total, 16 survey respondents (14 percent) indicated that lack of transportation was a barrier to seeking employment. Table 4.7: Reasons for not seeking employment
Number Percent
Number with more than one
reason Temporary health problem 8 7% 7 Permanent physical disability 51 45% 25 Permanent mental disability 8 7% 13 Lack of adequate transportation 4 4% 12 Other reason 11 10% 2 More than one reason 31 27% 31 Total 113 100%
Regarding transportation as a barrier to work, respondents were asked the following question: “If lack of adequate transportation is a barrier to working, what is the main reason?” Forty-six respondents provided an answer for this question. Their responses were as follows:
26 percent reported that service was not available at the right times; 17 percent reported that they need assistance to get to a train or bus stop; 15 percent reported that their disability prevented them from traveling; 13 percent indicated that it was difficult to obtain transportation; 11 percent reported that there were no accessible transportation options available in their
area; 7 percent indicated that transportation was not accessible based on their disability type;
and 11 percent indicated that transportation was a barrier for other reasons.
Vehicle ownership and accessibility requirements According to a recent survey of past and current Workability program enrollees, 54 percent reported driving their own vehicle to work (Honeycutt 2005). Given how important use of a private automobile is to personal mobility in New Jersey, survey participants were queried regarding vehicle ownership and accessibility requirements. Table 4.7 presents the survey results for working age employed and unemployed respondents. As shown in the table, only 10 percent of all employed working age respondents reported owning a private car or van they used

Meeting the Employment Transportation Needs of People with Disabilities in New Jersey
87
regularly for transportation. Interestingly, a slightly larger percentage (16 percent) of unemployed working age respondents own a vehicle. Less than one quarter of employed working age respondents (18 percent) reported needing a wheelchair accessible or specially equipped vehicle to travel. In contrast, almost two in five unemployed working age respondents or 38 percent reported needing an accessible vehicle. Table 4.7: Vehicle ownership and accessibility requirements
Yes No Total No. Percent No. Percent No. Percent Employed working age
Own private car/van used for regular transportation 13 10% 114 90% 127 100%
Require a wheel chair accessible or specially equip vehicle to travel 22 18% 103 82% 125 100%
Unemployed working age Own private car/van used for regular
transportation 23 16% 123 84% 146 100%
Require a wheel chair accessible or specially equip vehicle to travel 55 38% 90 62% 145 100%
Travel Experiences by Mode The availability of transportation options and the characteristics of that service play an important role in shaping individual travel experiences. As such, survey respondents were asked a series of questions related to their travel patterns and service quality. Questions ranged from what types of transportation they use on a regular basis for work and other purposes to their opinions related to service quality and how well various travel modes meet their travel needs. Respondents were asked about public transit bus and train service, NJ TRANSIT Access Link, county-operated community transportation services (paratransit), taxis as well as other modes. As might be expected given the means of distributing the survey, more than one-third of survey respondents (35 percent) reported using Access Link most often for non-work travel (see Table 4.8). Traveling as a passenger in a private automobile was the second most frequent means of travel for non-work purposes. Interestingly, only seven percent of survey respondents reported using county paratransit “most often.” Table 4.8: Travel from home to places other than work
Number Percent
How do you most often travel for non-work trips? Bus or Train 9 2% Access Link 130 35% County paratransit 27 7% Taxi 11 3% Car/van - I am the driver 7 2% Car/van - I am a passenger 107 29% Other 8 2% More than one mode 76 20%

Meeting the Employment Transportation Needs of People with Disabilities in New Jersey
88
Among employed survey respondents, Access Link was the most frequently reported means of traveling from home to work. As shown in Table 4.9, more than two-thirds (69 percent) of employed survey respondents indicated they use Access Link at least once per week for commuting purposes. Another eight percent reported using Access Link “occasionally.” Many respondents also reported traveling from home to work as a passenger in a private automobile. Very few respondents traveled by taxi, worked from home, walked or biked to work. Table 4.9: Travel from home to work
Frequently (at least once/week)
Occasionally (less than once/week)
Never/No Response
No. Percent No. Percent No. Percent How often do you use each mode to travel from home to work?
Bus or Train 17 13% 7 5% 104 81% Access Link 88 69% 10 8% 30 23% County paratransit 16 13% 9 7% 103 80% Taxi 2 2% 19 15% 107 84% Car/van - I am the driver 8 6% 2 2% 118 92% Car/van - I am a passenger 23 18% 30 23% 75 59% Dropped off at bus stop or train station 3 2% 10 8% 115 90% Walk or bike 6 5% 6 5% 116 91% Work at home 4 3% 3 2% 121 95% Other means 5 4% 2 2% 121 95%
Employed survey respondents were asked whether their job required them to travel for business during the work day. Approximately 23 percent responded affirmatively. Of those, almost half (43 percent) indicated they most often use Access Link for business travel during the day. Finally, survey respondents were presented with a series of statements related to the availability and quality of service for traditional bus and rail transit, Access Link, county paratransit and taxis. Respondents were asked to indicate how much they agreed or disagreed with each statement. On a scale of one to four, one indicated they “strongly agree” and four indicated they “strongly disagree” with each statement. For the purposes of analysis, responses were aggregated into two categories – “agree” (responses one or two) and “disagree” (responses three and four). The results for each mode of travel are presented in the following series of tables (see Tables 4.10 to 4.13). It should be noted that many respondents provided no opinion for different travel modes. This most likely reflects differing levels of personal experience related to each of the travel options presented. Given the survey results, it appears that most (approximately 80 percent) of the survey respondents have some experience using Access Link. The same is not true for the other modes. Personal experience with other modes drops to approximately 65 percent for traditional bus and train, 62 percent for county paratransit and 37 percent for taxis. These rates of experience generally reflect perceptions of service availability as reported by survey respondents. For example, when asked if different types of transportation service were “available in their area,” 84

Meeting the Employment Transportation Needs of People with Disabilities in New Jersey
89
percent reported that Access Link was available, while far fewer reported that bus and train service (36 percent), county paratransit (35 percent) or taxi service (38 percent) was available. These results are interesting given the fact that county paratransit services directed toward seniors and people with disabilities are available in all 21 counties in the state. This may indicate a general lack of awareness related to available travel options, especially with regard to county-operated services. Table 4.10: Perceptions of service quality – Traditional bus or train service
Of those expressing an opinion
No
Opinion Agree Disagree Service is available 2% 36% 63% Service is convenient 54% 53% 47% The cost of service is reasonable 55% 83% 18% Service is easily accessible for someone with my disability 55% 46% 54% Service is flexible 56% 47% 53% I feel safe when using the service 57% 64% 36% Vehicles are clean and well maintained 59% 80% 20% Service is prompt, on time and reliable 41% 66% 34% Drivers are friendly and helpful 59% 77% 23% The service does a good job getting me where I want to go 58% 69% 31% The service is doing all that can be done to meet my travel needs 57% 56% 46%
Table 4.10 presents the survey results for traditional bus and train service. As shown in the table, only half (53 percent) of those expressing an opinion agreed that services were “convenient.” Less than half felt bus and train service was “easily accessible” for someone with their disability (46 percent). Similarly, less than half felt that bus and train service was “flexible” (47 percent). Approximately two thirds felt that services were “safe” (64 percent) and “reliable” (66 percent). More than three quarters felt that the cost of service was “reasonable” (83 percent), that drivers were “friendly and helpful” (77 percent) and that vehicles were “clean and well maintained” (80 percent). Table 4.11 presents the survey results for Access Link. As previously noted, most survey respondents had experience using Access Link services. Most also expressed a favorable opinion of the service in every category. As shown in the table, approximately nine out of every 10 respondents reported that Access Link services were “convenient” (85 percent); priced reasonably (88 percent); “easily accessible” for someone with their disability (89 percent); and “safe” (94 percent). Similarly, the vast majority of respondents felt that Access Link vehicles were “clean and well maintained” (94 percent) and that drivers were “friendly and helpful” (91 percent). Somewhat less felt that Access Link services were “reliable” (75 percent) and “flexible” (69 percent).
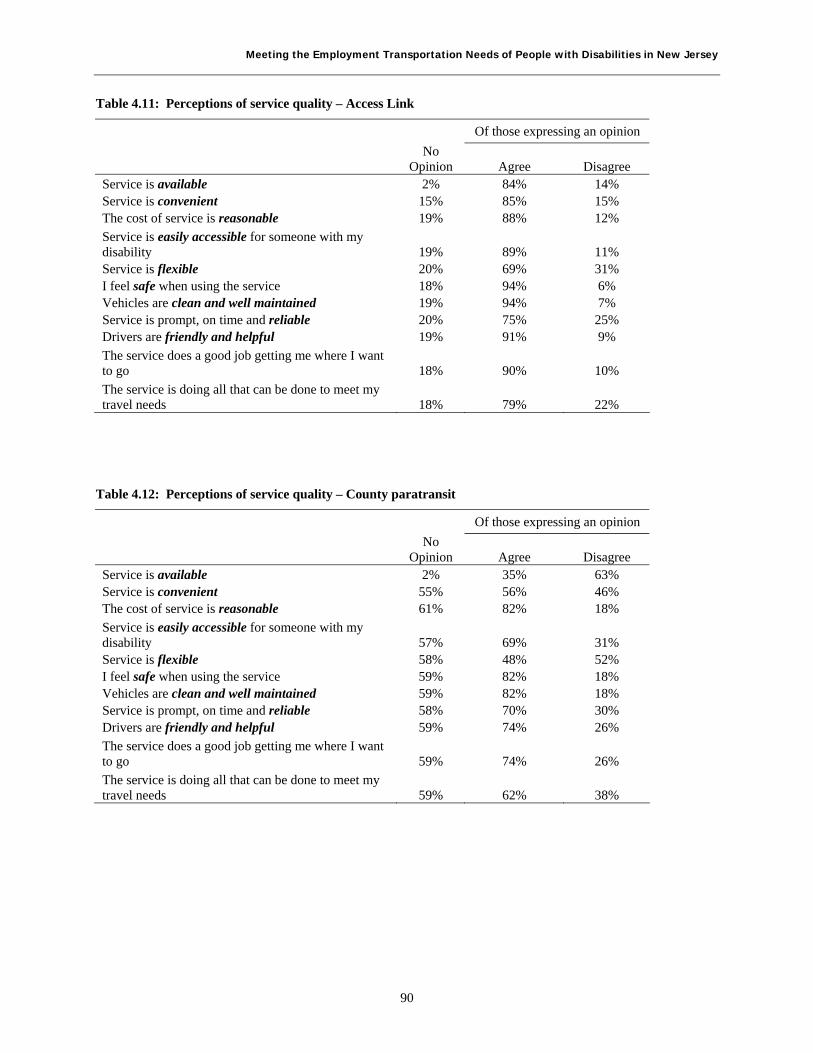
Meeting the Employment Transportation Needs of People with Disabilities in New Jersey
90
Table 4.11: Perceptions of service quality – Access Link
Of those expressing an opinion
No
Opinion Agree Disagree Service is available 2% 84% 14% Service is convenient 15% 85% 15% The cost of service is reasonable 19% 88% 12% Service is easily accessible for someone with my disability 19% 89% 11% Service is flexible 20% 69% 31% I feel safe when using the service 18% 94% 6% Vehicles are clean and well maintained 19% 94% 7% Service is prompt, on time and reliable 20% 75% 25% Drivers are friendly and helpful 19% 91% 9% The service does a good job getting me where I want to go 18% 90% 10% The service is doing all that can be done to meet my travel needs 18% 79% 22%
Table 4.12: Perceptions of service quality – County paratransit
Of those expressing an opinion
No
Opinion Agree Disagree Service is available 2% 35% 63% Service is convenient 55% 56% 46% The cost of service is reasonable 61% 82% 18% Service is easily accessible for someone with my disability 57% 69% 31% Service is flexible 58% 48% 52% I feel safe when using the service 59% 82% 18% Vehicles are clean and well maintained 59% 82% 18% Service is prompt, on time and reliable 58% 70% 30% Drivers are friendly and helpful 59% 74% 26% The service does a good job getting me where I want to go 59% 74% 26% The service is doing all that can be done to meet my travel needs 59% 62% 38%

Meeting the Employment Transportation Needs of People with Disabilities in New Jersey
91
Far fewer survey respondents had experience using community transportation services operated by counties. Table 4.12 presents the survey results for county paratransit services. Only one third of survey respondents indicated having any experience using county-operated community transportation options. Of those expressing an opinion related to the quality of county paratransit, the vast majority expressed favorable opinions in most categories. For example, More than three quarters indicated that county paratransit was priced “reasonably (82 percent) and “safe” (82 percent). Similar numbers felt that vehicles were “clean and well maintained” (82 percent) and that drivers were “friendly and helpful” (74 percent). Slightly less felt that services were “easily accessible” for someone with their disability (69 percent) and “reliable” (70 percent). County paratransit received its lowest marks in the areas of service convenience and flexibility. Less than half (48 percent) of those expressing an opinion agreed that services were “flexible;” and slightly more than half (56 percent) felt that services were “convenient.” Table 4.13: Perceptions of service quality – Taxi
Of those expressing an opinion
No
Opinion Agree Disagree Service is available 2% 38% 61% Service is convenient 62% 54% 46% The cost of service is reasonable 62% 17% 83% Service is easily accessible for someone with my disability 62% 55% 45% Service is flexible 64% 65% 36% I feel safe when using the service 65% 64% 36% Vehicles are clean and well maintained 57% 58% 42% Service is prompt, on time and reliable 62% 57% 43% Drivers are friendly and helpful 65% 74% 26% The service does a good job getting me where I want to go 66% 81% 19% The service is doing all that can be done to meet my travel needs 65% 64% 36%
About two in five (38 percent) survey respondents reported that taxi services were “available in their area.” Of those with personal experience using taxi services, about half felt that taxis were “convenient” (54 percent) and “easily accessible” (55 percent) for someone with their disability. Somewhat more felt that taxis were “reliable” (57 percent) and vehicles were “clean and well maintained (58 percent). Approximately two-thirds of those expressing an opinion felt that taxis were “flexible” (65 percent) and “safe” (64 percent). About three quarters felt that drivers were “friendly and helpful” (74 percent). Only 17 percent of survey respondents expressing an opinion felt that the cost of using a taxi was “reasonable.”

Meeting the Employment Transportation Needs of People with Disabilities in New Jersey
92
Information and communication The final area of survey questions was intended to help understand how people with disabilities obtain/receive information about transportation options and how communication could be improved to provide information better. Fifty-eight percent of survey respondents felt they received “adequate information” regarding available transportation options. Most (52 percent) reported currently receiving information via direct mail. Twenty eight percent receive information through the newspaper or some other form of general media and 25 percent receive information from employment counselors or other social service providers. Less than one quarter (16 percent) receives information on transportation options by word-of-mouth and very few reported currently receiving information via the Internet (7 percent) or by telephone (4 percent). Table 4.14 provides summary data on how people with disabilities currently receive information and how they would prefer to receive information in the future. Table 4.14: Means of communication for receiving information on transportation options
Male Female All
How do you currently receive information related to transportation options?
Internet 8% 7% 7% Mail 48% 54% 52% Phone 2% 5% 4% Newspaper or other media 25% 30% 28% Employment counselor or other social services provider 36% 20% 25% Friends, family or word of mouth 12% 18% 16%
How would you prefer to receive information related to transportation options?
Internet 36% 28% 31% Mail 87% 84% 85% Phone 1% 5% 2% Newspaper or other media 37% 36% 36% Employment counselor or other social services provider 40% 23% 29% Friends, family or word of mouth 0% 5% 3%
Although men are somewhat more likely to receive information from employment counselors or other social service providers and women are more likely to receive information from newspapers or via direct mail, communication patterns relative to receiving transportation-related information are generally consistent amongst men and women. In terms of the future, both men and women are interested in receiving more information via the Internet (31 percent) and direct mail (85 percent). Both men and women would like to continue to receive information from employment counselors and other social service providers (40 percent and 23 percent respectively) and from newspapers or other media sources (37 percent and 36 percent respectively. Finally, survey respondents regardless of gender expressed the desire to depend less on friends, family and word-of-mouth to receive information on transportation options.

Meeting the Employment Transportation Needs of People with Disabilities in New Jersey
93
4.4 Access and Work “Opportunity” Analysis As is the case for the general population, employment prospects for people with disabilities are a function of many complex and often related conditions. Personal characteristics such as educational attainment and job skills are important, as are characteristics of the local economy such as the availability of appropriate jobs and labor force competition. For people with disabilities, employer characteristics are also important. For example, in many cases, people with disabilities will need workplace flexibility and accommodations in order to permit them to work at a particular job or work location. Not all employers are willing and/or able to make the accommodations needed to ensure the success of a disabled employee. The consumer survey and focus groups conducted for this study provide valuable qualitative information related to transportation barriers to work for people with disabilities in New Jersey. However, to more fully understand and appreciate these barriers it is useful to examine geographic relationships between demographics and available transportation services. Toward this end, the research team conducted a series of spatial analyses utilizing population and employment data and data related to the characteristics of available transportation services in New Jersey’s twenty-one counties. These analyses are described here in after as the access and work opportunity analysis. For the purpose of these analyses, the research team assumed that employment prospects for people with disabilities are in part a function of job opportunity as expressed by the number of jobs available in a given area, mobility impairment and access to transportation.
Characteristics of transportation service As described in Chapter 3, the range of transportation options available in different parts of New Jersey varies significantly. However, three major options operate to one degree or another in each of the state’s twenty-one counties. These include accessible bus and train services operated by NJ TRANSIT, Access Link which “shadows” existing bus services within a three quarter mile buffer and county-operated paratransit services which operate based largely on county boundaries. These three options provide the central focus of the access and work opportunity analysis presented in this chapter. As a general measure, the transportation services component of the analysis examines the availability of accessible transportation services in terms of coverage area for NJ TRANSIT bus and rail services and Access Link and hours of operation and available seats for county paratransit services. Table 4.15 presents data related to the proportion of land area in each county proximate to bus and rail services and Access Link. For the purpose of this analysis, proximate was defined as within a one quarter mile buffer of bus lines and rail stations and within a three quarter mile buffer of bus lines for Access Link.

Meeting the Employment Transportation Needs of People with Disabilities in New Jersey
94
Table 4.15: Characteristics of bus, rail and Access Link coverage
County
County land area (sq. miles)
Miles of bus routes
Number of rail
stations
Percent of county land area within 1/4 mile buffer of
bus routes and rail stations
Percent of county land area within 3/4 mile buffer of
bus routes (Access Link)
Atlantic 611 3,239 4 17% 31% Bergen 247 4,545 29 39% 47% Burlington 819 2,734 11 10% 19% Camden 228 4,623 18 40% 64% Cape May 286 1,200 0 19% 42% Cumberland 504 940 0 7% 19% Essex 129 5,527 34 63% 91% Gloucester 337 1,786 0 20% 47% Hudson 56 4,923 25 71% 79% Hunterdon 438 123 4 2% < 1% Mercer 229 3,039 7 33% 50% Middlesex 318 3,836 10 32% 45% Monmouth 486 3,303 14 23% 37% Morris 481 1,110 18 13% 22% Ocean 757 1,480 2 11% 18% Passaic 197 3,124 9 31% 35% Salem 349 835 0 7% 18% Somerset 305 485 12 7% 8% Sussex 536 25 0 1% < 1% Union 105 3,500 16 61% 76% Warren 363 177 1 3% < 1%
Source: NJ Transit 2004, NJ DEP It is clear from the data that transit coverage varies dramatically by county. Essex and Hudson Counties have the most route miles of bus services and the greatest land area within one quarter mile of bus routes and rail stations. More than two thirds of each county’s land area falls within a quarter mile of fixed route transit service. On the other end of the spectrum, five counties, Cumberland, Hunterdon, Salem, Somerset, Sussex and Warren, have the fewest route miles of bus service available. Less than 10 percent of each county’s land area is located proximate to fixed route transit. Similar patterns can be seen when considering land area within the Access Link three quarter mile service boundary of fixed route bus lines. Once again, Essex and Hudson have the greatest proportion of total land area located within a three quarter mile buffer of existing bus routes. Ninety one percent of Essex County and 79 percent of Hudson County fall within the Access Link service area. Somerset, Sussex and Warren counties have the least coverage. Only eight percent of Somerset county is served by Access Link. Sussex and Warren counties have virtually no land area within the Access Link service boundary. Figures 4.2 and 4.3 depict maps of the state showing NJ TRANSIT bus routes with ¼ and ¾ mile buffers shaded.

Meeting the Employment Transportation Needs of People with Disabilities in New Jersey
95
Figure 4.2: NJ TRANSIT bus routes with ¼ mile buffer

Meeting the Employment Transportation Needs of People with Disabilities in New Jersey
96
Figure 4.3: NJ TRANSIT bus routes with ¾ mile Access Link service boundary

Meeting the Employment Transportation Needs of People with Disabilities in New Jersey
97
Table 4.16: Characteristics of county paratransit services
County
Weekday hours of
operation
Total vehicles
Estimate of Available
seats
Vehicle hours of
operation
Population of seniors
and disabled
Seats per 1,000 seniors and disabled
Atlantic 6 50 848 300 58,419 14.5 Bergen 14 75 1,040 1050 196,733 5.3 Burlington 8 19 228 152 83,149 2.7 Camden 8 43 483 344 109,114 4.4 Cape May N/A N/A N/A N/A 27,122 N/A Cumberland 8 37 444 296 32,046 13.9 Essex 18 25 300 450 192,491 1.6 Gloucester 11 36 618 396 50,625 12.2 Hudson 16 43 444 688 144,103 3.1 Hunterdon 11 29 651 319 19,927 32.7 Mercer 12 27 528 324 81,194 6.5 Middlesex 9.5 68 810 646 55,236 14.7 Monmouth 11.5 53 900 609.5 131,665 6.8 Morris 12 62 732 744 88,835 8.2 Ocean 10 70 1,011 700 150,289 6.7 Passaic 9 62 958 558 104,082 9.2 Salem 12 28 672 336 13,849 48.5 Somerset 14 109 2,372 1526 54,284 43.7 Sussex 5 23 595 115 23,815 25.0 Union 9.5 40 546 380 122,069 4.5 Warren 11 36 603 396 19,875 30.3
Source: County provider survey, US Census
Three critical measures of paratransit level of service are hours of operation, service area and system capacity. Table 4.16 presents data on the characteristics of county-operated paratransit. The data includes information on hours of operation, number of vehicles in each county’s fleet and an estimate of the number of paratransit seats available in each county. As noted in Chapter 3, one of the major limitations of many community transportation services is the generally limited times in which they operate. Every county paratransit provider operates during weekday business hours; however, only a few provide service in the early evening, late at night or on weekends. All but two of the county paratransit providers (Somerset and Cape May) limit operations to their county of origin, making travel to and from a work location in neighboring counties difficult. To measure system capacity, the research team developed an estimate of available seats in each county using a series of multipliers based on the size of the vehicles in each county’s fleet. Vehicle fleet characteristics were documented via telephone interviews with county paratransit operators. No data for Cape May County was available for the analysis. After estimating the number of seats available in each county, the estimate was divided by the number of seniors (65 and over) and disabled residents living in each county. The resulting system capacity measure is available seats per 1,000 residents.

Meeting the Employment Transportation Needs of People with Disabilities in New Jersey
98
As shown in table 4.16, Bergen, Essex, Hudson, Mercer, Morris, Salem and Somerset counties all operate services an average of 12 or more hours per day each work day. Bergen, Ocean, and Somerset Counties operate the largest paratransit fleets in the state, both in terms of total vehicles and estimated available seats. The smallest systems are operated by Burlington and Essex Counties. Each have fleets with 25 or less vehicles and have an estimated 300 or fewer available seats. Salem and Somerset Counties have the highest ratios of available seats to residents, while Essex, Burlington, Hudson, and Union have the lowest ratios.
Residential accessibility – Go outside the home disabled The second component of the access and work opportunity analysis examines the relationship between where people with disabilities live relative to available transportation options. Given the apparent likelihood that persons with disabilities possessing the ability to drive and financial means to afford private auto transportation will opt for this mode when feasible, the analysis focuses on people with disabilities self-identifying themselves as having a “go outside the home” disability. According to the Census 2000 definition, this includes those reporting a condition that made it difficult for them to go outside the home alone to shop, visit a doctor’s office, etc. As noted in Chapter 2, two in five disabled New Jersey residents (39 percent) report having a condition that makes it difficult to go outside the home. At the county level, five counties (Burlington, Cape May, Gloucester, Hunterdon, and Sussex) have go outside the home disability rates ten or more percentage points lower than the statewide average of 39 percent. At the same time, Hudson and Passaic Counties have rates more than ten percentage points higher than average. Residential accessibility was examined by analyzing the proportion of residents with a go outside the home disability in each county living within a ¼ mile buffer of existing bus lines and/or rail stations and within the Access Link service area. As shown in Table 4.17, transit services are far more accessible to residents living in the state’s urbanized counties, than for those living in rural counties. For example, more than 90 percent of go outside the home disabled residents live within the Access Link service boundary in Bergen, Camden, Essex, Hudson, Passaic and Union Counties, while less than 50 percent of go outside the home disabled residents in Hunterdon, Salem, Somerset, Sussex, and Warren Counties do. Hunterdon has the lowest proportion of disabled residents served by Access Link. Each of these counties can be characterized as mostly rural or suburban. Table 4.18 compares land area covered by Access Link service and the number of go outside the home disabled living within the Access Link service boundary. Interestingly, the ratios are very different. In most counties a far greater proportion of disabled residents are served by Access Link than would otherwise be supposed if considering only the amount of area covered.

Meeting the Employment Transportation Needs of People with Disabilities in New Jersey
99
Table 4.17: Proportion of working age go outside the home disabled living proximate to existing bus routes, rail stations and Access Link
County
Number of working age go
outside the home disabled
Percent living within 1/4 mile buffer of bus routes
and rail stations
Percent living within 3/4 mile buffer of bus routes
(Access Link)
Atlantic 12,276 61% 81% Bergen 29,834 76% 91% Burlington 11,112 37% 68% Camden 20,456 73% 95% Cape May 2,716 36% 74% Cumberland 6,524 31% 62% Essex 50,152 93% 99% Gloucester 7,093 37% 72% Hudson 48,958 95% 100% Hunterdon 1,804 6% 11% Mercer 12,975 76% 88% Middlesex 30,685 53% 85% Monmouth 16,107 46% 80% Morris 12,937 38% 66% Ocean 15,411 26% 58% Passaic 34,566 86% 96% Salem 2,292 28% 49% Somerset 7,522 30% 46% Sussex 3,137 0% 2% Union 23,174 86% 99% Warren 3,122 28% 38%
Source: US Census, NJ Transit 2004, NJ DEP

Meeting the Employment Transportation Needs of People with Disabilities in New Jersey
100
Table 4.18: Land area covered by Access Link compared to go outside the home disabled covered by Access Link
County
Percent of county land area within 3/4 mile buffer of bus routes
(Access Link)
Percent of go outside the home disabled living within 3/4 mile
buffer of bus routes (Access Link)
Atlantic 31% 81% Bergen 47% 91% Burlington 19% 68% Camden 64% 95% Cape May 42% 74% Cumberland 19% 62% Essex 91% 99% Gloucester 47% 72% Hudson 79% 100% Hunterdon < 1% 11% Mercer 50% 88% Middlesex 45% 85% Monmouth 37% 80% Morris 22% 66% Ocean 18% 58% Passaic 35% 96% Salem 18% 49% Somerset 8% 46% Sussex < 1% 2% Union 76% 99% Warren < 1% 38%
Source: US Census, NJ Transit 2004, NJ DEP
Employment accessibility The third and final component of the access and work opportunity analysis considers the location of jobs relative to available transportation options. For the purpose of the analysis, the research team utilized a commercially available data set (purchased from Info USA, Inc.) containing detailed establishment data such as employer address, number of jobs and industry classification to provide geographically referenced employment data. The baseline data was then analyzed to determine employer and job proximity to available transportation services. The number of jobs within a one quarter mile buffer of existing bus lines and rail stations was quantified as was the number of jobs within Access Link’s three quarter mile service area buffer of existing bus routes. Favorable establishment characteristics were also noted. For example, the literature on employment for people with disabilities indicates that persons with disabilities are more likely to be employed by larger employers (Loprest 2001). In addition, a recent survey of past and current enrollees in New Jersey’s Workability program found that people with disabilities in New Jersey are more likely to be employed in the wholesale and retail trade, education and health, leisure and hospitality, and other services industries (Honeycutt, 2005).

Meeting the Employment Transportation Needs of People with Disabilities in New Jersey
101
The results of the analysis are summarized in Tables 4.19 to 4.21. It is evident from the data that the vast majority of jobs in most counties are located within the Access Link service area. The most notable exceptions are Hunterdon County, where only 27 percent of jobs are covered by Access Link; Somerset County, where 49 percent of jobs are served; Sussex County, where only 14 percent of jobs are served; and Warren County, where 51 percent of jobs are located within the Access Link service boundary. As stated above, favorable establishment characteristics (e.g., large employers and employers from key industries) were noted and examined separately. With very few exceptions, patterns of job accessibility are very similar when considering jobs associated with large employers and key industry sectors. The vast majority of jobs in both categories are again covered by Access Link service. Table 4.19: Job proximity to bus routes, rail stations and Access Link – ALL jobs
Jobs Within 1/4 mile buffer of bus lines and
rail stations Jobs Within 3/4 mile buffer of Access Link
County
Total Number of
Jobs Number Percent Number Percent Atlantic 69,900 53,502 77% 63,813 91% Bergen 295,905 228,767 77% 248,324 84% Burlington 119,083 79,985 67% 100,534 84% Camden 139,845 118,182 85% 134,594 96% Cape May 32,058 21,648 68% 27,633 86% Cumberland 39,892 22,126 55% 30,424 76% Essex 274,647 254,480 93% 272,815 99% Gloucester 71,060 52,630 74% 64,339 91% Hudson 162,425 151,879 94% 160,843 99% Hunterdon 35,629 6,183 17% 9,554 27% Mercer 158,019 134,496 85% 149,151 94% Middlesex 254,073 153,651 60% 214,187 84% Monmouth 180,898 110,779 61% 153,802 85% Morris 200,752 121,934 61% 157,079 78% Ocean 113,288 54,527 48% 84,752 75% Passaic 133,157 123,097 92% 129,778 97% Salem 13,666 7,993 58% 9,467 69% Somerset 107,016 42,854 40% 52,651 49% Sussex 30,702 1,672 5% 4,401 14% Union 177,964 161,313 91% 174,579 98% Warren 26,210 11,753 45% 13,342 51%
Sources: Info USA, Inc., NJ DEP, NJ TRANSIT 2004

Meeting the Employment Transportation Needs of People with Disabilities in New Jersey
102
Table 4.20: Job proximity to bus routes, rail stations and Access Link – Jobs with large employers (100 + employees)
Jobs Within 1/4 mile buffer of bus lines and
rail stations Jobs Within 3/4 mile buffer of Access Link
County
Total Number of
Jobs Number Percent Number Percent Atlantic 23,841 18,068 76% 22,560 95% Bergen 102,739 79,359 77% 86,950 85% Burlington 42,375 28,829 68% 36,342 86% Camden 44,875 37,458 83% 43,300 96% Cape May 7,575 4,482 59% 5,558 73% Cumberland 14,380 7,075 49% 10,650 74% Essex 127,910 119,698 94% 127,220 99% Gloucester 27,376 20,918 76% 24,716 90% Hudson 77,433 71,680 93% 76,800 99% Hunterdon 11,000 1,476 13% 3,445 31% Mercer 79,607 70,083 88% 77,519 97% Middlesex 106,180 60,084 57% 89,839 85% Monmouth 55,911 31,614 57% 48,452 87% Morris 89,177 57,144 64% 75,388 85% Ocean 37,262 16,723 45% 29,496 79% Passaic 47,695 45,415 95% 47,323 99% Salem 4,080 3,220 79% 3,650 89% Somerset 47,107 21,016 45% 24,418 52% Sussex 9,613 385 4% 885 9% Union 73,473 66,500 91% 72,488 99% Warren 7,804 4,121 53% 4,321 55%
Sources: Info USA, Inc., NJ DEP, NJ TRANSIT 2004

Meeting the Employment Transportation Needs of People with Disabilities in New Jersey
103
Table 4.21: Job proximity to bus routes, rail stations and Access Link – Jobs with employers from key industries 1
Jobs Within 1/4 mile buffer of bus lines and
rail stations Jobs Within 3/4 mile buffer of Access Link
County
Total Number of
Jobs Number Percent Number Percent Atlantic 27,827 22,039 79% 25,417 91% Bergen 118,488 87,524 74% 99,090 84% Burlington 49,195 33,466 68% 41,200 84% Camden 59,809 49,314 82% 57,451 96% Cape May 12,539 9,341 74% 11,808 94% Cumberland 16,340 9,778 60% 12,540 77% Essex 111,719 101,807 91% 110,480 99% Gloucester 34,750 25,809 74% 31,431 90% Hudson 55,171 52,045 94% 54,907 100% Hunterdon 14,003 1,876 13% 2,958 21% Mercer 58,334 50,793 87% 54,787 94% Middlesex 94,585 56,450 60% 78,414 83% Monmouth 77,868 48,893 63% 65,688 84% Morris 74,864 40,856 55% 55,230 74% Ocean 57,245 25,947 45% 43,707 76% Passaic 56,789 51,663 91% 54,666 96% Salem 7,473 4,272 57% 5,364 72% Somerset 38,693 12,902 33% 17,329 45% Sussex 12,528 599 5% 1,919 15% Union 68,931 59,211 86% 67,254 98% Warren 11,694 5,817 50% 6,520 56%
Sources: Info USA, Inc., NJ DEP, NJ TRANSIT 2004 Notes:
1 – As noted above, key industries include: wholesale trade, retail trade, educational services, health care and social assistance, arts, entertainment and recreation

Meeting the Employment Transportation Needs of People with Disabilities in New Jersey
104
Composite analysis Finally, as shown in Table 4.22, a comparison of the three key measures of access and work opportunity appears to indicate that the counties with the lowest levels of access to traditional public transit and Access Link coverage, by necessity, have compensated by operating strong county paratransit systems. For example, Hunterdon, Salem, Somerset, and Warren counties have among the lowest rates of transit and Access Link coverage. At the same time, they have the highest ratios of available paratransit seats per 1,000 residents. Similarly, the counties with the highest rates of transit and Access Link coverage (Camden, Essex, Hudson, Passaic, and Union) are those with weaker paratransit systems in terms of available seats per 1,000 residents. The remaining counties, which are mostly suburban in nature, are shaded in the table. These counties have less access to traditional transit and Access Link services and because the capacity of existing paratransit systems are generally lower, there is greater competition for available paratransit seats. Table 4.22: Comparison of access and work opportunity factors and employment rates
County
Percent go outside the home disabled living within 3/4
mile buffer of bus routes
(Access Link)
Percent of all jobs located with ¾
mile buffer of bus routes
(Access Link)
Seats per 1,000 seniors and
disabled
Atlantic 81% 91% 14.5 Bergen 91% 84% 5.3 Burlington 68% 84% 2.7 Camden 95% 96% 4.4 Cape May 74% 86% N/A Cumberland 62% 76% 13.9 Essex 99% 99% 1.6 Gloucester 72% 91% 12.2 Hudson 100% 99% 3.1 Hunterdon 11% 27% 32.7 Mercer 88% 94% 6.5 Middlesex 85% 84% 14.7 Monmouth 80% 85% 6.8 Morris 66% 78% 8.2 Ocean 58% 75% 6.7 Passaic 96% 97% 9.2 Salem 49% 69% 48.5 Somerset 46% 49% 43.7 Sussex 2% 14% 25.0 Union 99% 98% 4.5 Warren 38% 51% 30.3
Source: County provider surveys, US Census, NJ Transit 2004, NJ DEP

Meeting the Employment Transportation Needs of People with Disabilities in New Jersey
105
4.5 Summary of key findings: To understand the work-related travel needs of people with disabilities, as explained in detail above, the research team convened and facilitated a series of focus groups, designed and administered a consumer survey and conducted an access and work opportunity analysis to explore the relationship between available transportation services, consumer residence location and job location. The following is a summary of key findings from the focus groups, consumer survey and access and work opportunity analysis:
Focus Groups The mode of transportation most frequently cited by participants as their means to get
to/from work was driving. Other frequent responses included Access Link, taxi/car service, county paratransit and traditional bus and rail transit services. Participants reported that a variety of factors, including their disability, affect their choice of transportation mode to/from work. For those not driving, factors considered included service schedules, cost, reliability, ease of access and prescribed wait times, as well as personal safety (both during a trip and at trip locations).
Residential location and accessibility to different transportation options can greatly
influence individual decisions to seek employment. Furthermore, the often overwhelming task of trip planning within the current system and the uncertainty and irregularity of service can affect an individual’s work experience as well as their decision to remain employed.
Many people with disabilities and their service providers believe that the fragmented
nature of the current transportation system makes it challenging to find an appropriate means of getting to/from work. Furthermore, the availability and quality of transportation services often varies depending on geographic location and transportation needs often vary depending on client disability.
From a consumer’s perspective, there are a number of problems with county paratransit services, including: advance reservation requirements, changing schedules and varied routing, various service restrictions (e.g. age requirements for travel) and unwillingness of most county-operated services to cross county lines, making demand response services not conducive to daily commute trips. This conflicts with the expectations of consumers who don’t understand how the system works.
There is no central source for transportation information and/or trip planning assistance. Issues related to trip planning, scheduling and personal safety often hinders employment options. There was strong support for the idea of developing a website for disabled persons which includes information related to transportation options.
There are differing and often conflicting expectations related to the level of service offered and possible from county paratransit systems. This creates problems for clients, drivers and managers. For example, drivers explained that many disabled clients want

Meeting the Employment Transportation Needs of People with Disabilities in New Jersey
106
services similar to a door-to-door taxi service, whereas existing paratransit services are required by law or regulation to operate curb-to curb service. As such, some clients expect drivers to provide assistance in getting to and boarding the vehicle. However, due to liability issues, drivers are not permitted to provide such assistance.
Travel behavior of persons with disabilities is highly dependant on the nature and extent of their disability as well as the transportation environment. Both of these factors may influence whether or not a disabled person is working or able to retain employment.
Specific characteristics of the transportation environment that pose challenges to disabled persons include: eligibility requirements; multiple pick-ups and long routes; lack of advance notice or communication regarding schedule delays and arrival times; policies regarding boarding and alighting assistance; driver rudeness, impatience, insensitivity; policies related to scheduling, including advance reservation requirements and cancellation consequences; Access Link’s 3/4 mile service area; pick-up/drop-off window (e.g., 20 minutes before and 20 minutes after scheduled time); lack of transportation options/alternatives in some areas; vehicle safety issues; and difficulty with making linked trips.
Consumer survey Most working age unemployed survey respondents (74 percent) reported that they were
not actively looking for work. Fourteen percent indicated that lack of transportation was a barrier to seeking employment. Regarding transportation as a barrier to work, respondents provided the following reasons:
- 26 percent reported that service was not available at the right times; - 17 percent reported that they need assistance to get to a train or bus stop; - 15 percent reported that their disability prevented them from traveling; - 13 percent indicated that it was difficult to obtain transportation; - 11 percent reported that there were no accessible transportation options available
in their area; - 7 percent indicated that transportation was not accessible based on their disability
type; and - 11 percent indicated that transportation was a barrier for other reasons.
Ten percent of all employed working age survey respondents reported owning a private
car or van they used regularly for transportation. Interestingly, a slightly larger percentage (16 percent) of unemployed working age respondents own a vehicle. Less than one quarter of employed working age respondents (18 percent) reported needing a wheelchair accessible or specially equipped vehicle to travel. In contrast, almost two in five unemployed working age respondents or 38 percent reported needing an accessible vehicle.
More than one-third of survey respondents (35 percent) reported using Access Link most
often for non-work travel (see Table 4.8). Traveling as a passenger in a private automobile was the second most frequent means of travel for non-work purposes.

Meeting the Employment Transportation Needs of People with Disabilities in New Jersey
107
Interestingly, only seven percent of survey respondents reported using county paratransit “most often” for non-work travel.
Among employed survey respondents, Access Link was the most frequently reported
means of traveling from home to work. More than two-thirds (69 percent) indicated they use Access Link at least once per week for commuting purposes. Very few respondents traveled by taxi, worked from home, walked or biked to work.
Approximately 23 percent of employed survey respondents reported that their job
required travel during the business work day. Of those, almost half (43 percent) indicated they most often use Access Link for business travel during the day.
Most (approximately 80 percent) of the survey respondents have some experience using
Access Link. The same is not true for the other modes. Personal experience with other modes drops to approximately 65 percent for traditional bus and train, 62 percent for county paratransit and 37 percent for taxis. These rates of experience generally reflect perceptions of service availability as reported by survey respondents. For example, when asked if different types of transportation service were “available in their area,” 84 percent reported that Access Link was available, while far fewer reported that bus and train service (36 percent), county paratransit (35 percent) or taxi service (38 percent) was available.
Only half (53 percent) of those expressing an opinion agreed that bus and train services
were “convenient.” Less than half (46 percent) felt bus and train service was “easily accessible” for someone with their disability. Similarly, less than half (47 percent) felt that it was “flexible.” Approximately two thirds felt that services were “safe” (64 percent) and “reliable” (66 percent). More than three quarters felt that the cost of service was “reasonable” (83 percent), that drivers were “friendly and helpful” (77 percent) and that vehicles were “clean and well maintained” (80 percent).
Most survey respondents expressed a favorable opinion of Access Link service in every
category. Approximately nine out of ten respondents reported that Access Link services were “convenient” (85 percent); priced reasonably (88 percent); “easily accessible” for someone with their disability (89 percent); and “safe” (94 percent). Similarly, the vast majority of respondents felt that Access Link vehicles were “clean and well maintained” (94 percent) and that drivers were “friendly and helpful” (91 percent). Somewhat less felt that Access Link services were “reliable” (75 percent) and “flexible” (69 percent).
Only one third of survey respondents indicated having any experience using county-
operated community transportation options. Of those expressing an opinion related to the quality of county paratransit, the vast majority expressed favorable opinions in most categories.
About two in five (38 percent) survey respondents reported that taxi services were
“available in their area.” Of those with personal experience using taxi services, about half felt that taxis were “convenient” (54 percent) and “easily accessible” (55 percent) for

Meeting the Employment Transportation Needs of People with Disabilities in New Jersey
108
someone with their disability. Somewhat more felt that taxis were “reliable” (57 percent) and vehicles were “clean and well maintained (58 percent). Approximately two-thirds of those expressing an opinion felt that taxis were “flexible” (65 percent) and “safe” (64 percent). About three quarters felt that drivers were “friendly and helpful” (74 percent). Only 17 percent of survey respondents expressing an opinion felt that the cost of using a taxi was “reasonable.”
Fifty-eight percent of survey respondents felt they received “adequate information”
regarding available transportation options. Most (52 percent) reported currently receiving information via direct mail. Twenty eight percent receive information through the newspaper or some other form of general media and 25 percent receive information from employment counselors or other social service providers. Less than one quarter (16 percent) receives information on transportation options by word-of-mouth and very few reported currently receiving information via the Internet (7 percent) or by telephone (4 percent).
In terms of the future, both men and women are interested in receiving more information
via the Internet (31 percent) and direct mail (85 percent). Both men and women would like to continue to receive information from employment counselors and other social service providers (40 percent and 23 percent respectively) and from newspapers or other media sources (37 percent and 36 percent respectively). Finally, survey respondents regardless of gender expressed the desire to depend less on friends, family and word-of-mouth to receive information on transportation options.
Access and work opportunity analysis
Transit coverage varies dramatically by county. Essex and Hudson Counties have the most route miles of bus services and the greatest land area within one quarter mile of bus routes and rail stations. More than two thirds of the counties’ land area falls within a quarter mile of fixed route transit service. On the other end of the spectrum, five counties, Cumberland, Hunterdon, Salem, Somerset, Sussex and Warren, have very few route miles of bus service available; and less than 10 percent of each county’s land area is located proximate to fixed route transit.
Similar patterns can be seen when considering land area within Access Link’s three
quarter mile service area of fixed route bus lines. Once again, Essex and Hudson have the greatest proportion of total land area located within a three quarter mile buffer of existing bus routes. Ninety one percent of Essex County’s land area and 79 percent of Hudson County’s land area fall within the Access Link service boundary. Somerset, Sussex and Warren counties have the least coverage. Only eight percent of Somerset County is served by Access Link; and Sussex and Warren counties have virtually no land area within the Access Link service boundary.
Bergen, Essex, Hudson, Mercer, Morris, Salem and Somerset counties all operate county
paratransit services an average of 12 or more hours per day each work day. Bergen,

Meeting the Employment Transportation Needs of People with Disabilities in New Jersey
109
Ocean, and Somerset Counties operate the largest paratransit fleets in the state, both in terms of total vehicles and estimated available seats. The smallest systems are operated by Burlington and Essex Counties. Each have fleets with 25 or less vehicles and have an estimated 300 or fewer available seats. Salem and Somerset Counties have the highest ratios of available seats to residents, while Essex, Burlington, Hudson, and Union have the lowest ratios.
Transit services are far more accessible to disabled residents living in the state’s
urbanized counties, than for those living in rural counties. For example, more than 90 percent of go outside the home disabled residents live within the Access Link service boundary in Bergen, Camden, Essex, Hudson, Passaic and Union Counties, while less than 50 percent of go outside the home disabled residents in Hunterdon, Salem, Somerset, Sussex, and Warren Counties are served by Access Link. Each of these counties can be characterized as mostly rural or low density suburban.
When comparing proportion of land area within the Access Link service boundary with
the proportion of go outside the home disabled living within the service boundary, the ratios are very different. In most counties a far greater proportion of disabled residents are served by Access Link than might otherwise be estimated if considering only the proportion of land area covered.
The vast majority of jobs in most counties are located within the Access Link service
area. The most notable exceptions are Hunterdon County, where only 27 percent of jobs are served by Access Link; Somerset County, where 49 percent of jobs are served; Sussex County, where only 14 percent of jobs are served; and Warren County, where 51 percent of jobs are located within the Access Link service boundary. With very few exceptions, patterns of job accessibility are very similar when considering jobs associated with large employers and key industry sectors.
A comparison of the three key measures of access and work opportunity appears to
indicate that the counties with the lowest levels of access to traditional public transit and Access Link, by necessity, have compensated by operating strong county paratransit systems. For example, Hunterdon, Salem, Somerset, and Warren counties have among the lowest rates of transit and Access Link coverage. At the same time, they have the highest ratios of available paratransit seats per 1,000 residents. Similarly, the counties with the highest rates of transit and Access Link coverage (Camden, Essex, Hudson, Passaic, and Union) are those with weaker paratransit systems in terms of available seats per 1,000 residents. The remaining counties, which are mostly suburban in nature, have less access to traditional transit and Access Link services and because the capacity of existing paratransit systems are generally lower, there is greater competition for available paratransit seats.

Meeting the Employment Transportation Needs of People with Disabilities in New Jersey
110
CHAPTER 5: INSTITUTIONAL BARRIERS, BEST PRACTICES AND MODEL PROGRAMS
5.1 Introduction This chapter considered institutional barriers to transportation reform and specifically the challenge of coordinating human services transportation. It also examines the prospects for better coordination in New Jersey. Finally, it describes a series of best practices and model programs for expanding transportation options and enhancing transportation services.
5.2 Coordinating human services transportation Coordinating transportation services better for transportation disadvantaged persons has been on the public policy agenda for decades (GAO 2003). Transportation coordination, as defined by the Federal Transit Administration, involves providing specialized transportation through “…a process by which representatives of different agencies and client groups work together to achieve any one or all of the following goals: more cost-effective service delivery; increased capacity to serve unmet needs; improved quality of service; and services which are easily understood and accessed by riders” (FTA, 2004). During the 1990’s there was a heightening of awareness among human service agencies regarding the importance of coordinating their transportation services in order to achieve multiple aims, including access to jobs and medical transportation, while at the same time enhancing service quality. Major changes at the federal level prompted workforce development agencies to examine the transportation barriers that keep people from obtaining and maintaining employment. The Personal Responsibility & Work Reconciliation Act of 1996 and the Transportation Equity Act of 1998 were two pieces of Federal legislation that altered the way public assistance agencies aid citizens in obtaining and retaining employment. TEA-21 increased funding for public transportation and also provided money to community partnerships to build upon existing public transportation services so that low-income people have greater opportunities to get to work (Marsico 2001). In addition, the Americans with Disabilities Act required public transportation agencies to provide complementary paratransit services for persons with disabilities (Burkhardt 2000). Numerous specialized transportation services have since been established throughout the country by public transit agencies and others to respond to the variety of transportation needs. Most often, each service has been accompanied by distinct funding sources, specific objectives for serving limited clienteles, and with specific rules (TRB 2003). The unplanned proliferation of these transportation services has led to poorly coordinated systems resulting in economic inefficiencies and duplication of expenditures and services (CTAA 2004). For example, in 1998, the American Public Welfare Association (APWA) published a report highlighting issues related to non-emergency medical transportation. According to the authors, non-emergency medical trips are one of the most extensive uses of the paratransit system, so adequately accommodating and paying for them has become a primary focus for many paratransit providers. Medicaid pays for many such trips. The report suggests three strategies for managing non-emergency medical transportation more effectively. These include:

Meeting the Employment Transportation Needs of People with Disabilities in New Jersey
111
1) Use contracted transportation brokers statewide or for certain areas. These brokers enroll and pay providers, determine and authorize the most appropriate type of transportation service for each client, including notifying the client of the scheduling of rides, and contract out the actual services to other companies;
2) Restrict the number of providers competing for state contracts. This lowers administrative costs and makes the individual providers more accountable; and
3) Coordinate among human services and transportation providers. Agencies can cut costs if they coordinate public transit and paratransit with transportation services offered by Medicaid, Head Start programs, services for the aging, and others.
The authors note that Medicaid cannot fund welfare-to-work needs, but vehicles provided for Medicaid trips could be used for both work and medical purposes. In addition, the report recognizes that the application of each of these strategies may vary depending on the region, but should be considered in efforts to improve accessible transportation service. (APWA 1998). The Department of Labor has published an employment transportation toolkit to help local workforce development agencies to understand and respond to the transportation challenge. The “Linking People to the Workplace” toolkit is a technical assistance guide designed to help workforce development agencies access community transportation services for dislocated workers and other un- and under-employed people, including those with disabilities. The toolkit hopes to engage workforce development agencies in a collaborative effort to work with transportation providers, employers, and social service agencies to create transportation services that provide the mobility link to employment, independence and self-sufficiency (Marsico, 2001). There are also a number of associations and non-profit organizations that currently promote coordinated transportation as a way to meet the needs of a variety of clients, including the elderly, the disabled, and the poor. One such organization is the Community Transportation Association of America. Its goals is to build a strong network of transportation professionals, human service professionals and policymakers at every level who understand the issues involved in the coordination of human services transportation and how this coordination can be accomplished (CTAA, 2004). These activities are designed to provide information, support and resources to those concerned with community transportation (CTAA, 2004). The CTAA participates in advocacy and lobbying activities, publishes journals related to community transportation, and serves as an information clearinghouse for researching the issue of coordinated transportation. State governments are also beginning to recognize the opportunity that exists in coordinating transportation. A report by the National Governors Association in 2000, called “Improving Public Transportation Services through Effective Statewide Coordination”, discussed the advantages of coordinated transportation within a state and identified mechanisms and strategies that result in successfully coordinated transportation services (NGA, 2000). There are a great number of benefits to be derived from coordinating transportation services. According to the NGA, coordination among transportation providers and agencies can increase transportation availability and access to jobs, enhance service quality, eliminate duplicative

Meeting the Employment Transportation Needs of People with Disabilities in New Jersey
112
efforts, and improve the cost effectiveness of transportation dollars (NGA, 2000). The report also concludes that successful coordination programs require leadership at the highest levels of government, broad participation of state, regional, and local stakeholders, and the development and monitoring of performance measures to gauge the overall effectiveness of the coordination program (NGA, 2000). The United States General Accounting Office (GAO) released a report in June of 2003 titled “Transportation-Disadvantaged Populations: Some Coordination Efforts Among Programs Providing Transportation Services, but Obstacles Persist.” The report outlines the current status in efforts to coordinate, identifies obstacles to coordination and provides recommendations to increase the success of coordination efforts. The GAO report clearly states that the Coordinating Council on Access and Mobility (CCAM) possesses an untapped potential to affect change in the area of coordinating human service transportation and transit services. The obstacles that the GAO report has identified as barriers to coordination are important to consider for the purpose of this study. These include:
Unwillingness or inability to share vehicles due to the different needs and characteristics of client populations;
Perception of the high costs of coordination from the provider perspective;
Lack of feasibility for coordination in areas lacking a range of transportation services or options;
Inconsistency among programs with regard to rider eligibility, funding sources, reporting requirements, safety standards and programmatic goals and missions;
Lack of guidance from federal level officials on implementation strategies; and
Lack of leadership or commitment on the state level to guide coordination. The GAO report suggests three solutions to help address these issues. First, program standards and requirements must be “harmonized” to: allow providers to serve multiple client groups; provide consistent cost accounting procedures; provide common vehicle safety standards; and synchronize funding cycles and streams. Second, the GAO recommends expanding the number of agencies involved in coordination efforts to expand available resources and improve information sharing. Finally, the report suggests providing financial incentives and/or mandates at all levels to promote coordination (GAO 2003).
United We Ride The most recent federal initiative designed to promote coordination of human services transportation is “United We Ride,” an interagency collaboration designed to support states and local governments to deliver coordinated human services transportation. United We Ride grew out of Executive Order 13330 signed by President Bush in February 2004. The Executive Order established the Interagency Transportation Coordinating Council on Access and Mobility (CCAM), chaired by the Secretary of Transportation. The council includes representation from eleven Federal departments, including the Departments of Transportation, Health and Human Services, Labor, Education, Housing and Urban Affairs, Agriculture, Justice, Interior, the

Meeting the Employment Transportation Needs of People with Disabilities in New Jersey
113
Veterans Administration, the Social Security Administration, and the National Council on Disabilities. According to the executive order, “the purpose of the council is to coordinate 62 different Federal programs across 9 Federal departments that provide funding to be used in support of human services transportation” (EO 13330 2004). Since it was created, the CCAM has developed a self-assessment tool for states and communities called “A Framework for Action.” The tool can be used to “identify areas of success and highlight actions needed to improve the coordination of human services transportation” on the state and local level. In addition, the council has provided 45 states with coordination grants to “address gaps and needs related to human service transportation in their geographic regions”; has developed a program of technical assistance to “provide hands-on assistance to States and communities in the development and delivery of human service transportation programs”; and sponsored “Regional Leadership Meetings” for states in six of the ten United States Department of Transportation regions (United We Ride 2005). A number of states have successfully coordinated their transportation services. In February 2004 the first annual State Leadership Awards were presented to North Carolina, Ohio, Maryland, Washington State and Florida.4 Each of these five states has taken a unique approach toward coordinating human service transportation with transit service. Their policies and initiatives should be considered as potential models in the effort to coordinate transportation in the state of New Jersey.
Coordinating human services transportation in New Jersey The single largest challenge to expanding and enhancing transportation options and services for people with disabilities in New Jersey appears to be coordinating better the way human services transportation is funded and delivered in the state. New Jersey has a long history and experience in state-wide approaches to improve transportation for transportation disadvantaged groups. The first state-wide effort, which began in the early 1980’s identified the need to expand and improve accessible transportation options and recommended a consistent funding stream to improve local paratransit services. With the successful implementation of a new funding stream from casino revenue funds administered centrally through the new state wide transit agency, NJ TRANSIT, consistency and reliability of funding in New Jersey improved the provision of county-based paratransit services. The next evolution of institutional coordination at the state level occurred as part of national and state welfare reform efforts in the early 1990’s. At the same time, a new federal transit funding program was established to assist in the provision of transportation for individuals transitioning from public assistance to work. The program is known as Jobs Access and Reverse Commute (JARC). As the name implies the program provides funds designed to address job access issues resulting from the decades long, deconcentration of jobs from central cities to the suburbs. As described in more detail in Chapter 1, the State of New Jersey took advantage of the opportunity provided by these public policy changes to try to further advance transportation coordination in the state. The Workfirst New Jersey Community Transportation Planning 4 http://www.fta.dot.gov/CCAM/UWR_Awards.html

Meeting the Employment Transportation Needs of People with Disabilities in New Jersey
114
Process, a multi-agency effort resulted in the creation of a State Management Plan for coordinating transportation as well as 21 county-based plans designed to address the transportation barriers faced by Workfirst New Jersey clients. The most recent evolution of New Jersey’s interest and on-going effort to coordinate human services transportation was catalyzed by a federal United We Ride effort. New Jersey has formed a state level Coordinating Council on Access and Mobility (NJCCAM) that mirrors the membership of the federal body. The council has been meeting monthly since 2004 and has sponsored a series of statewide forums as well as an effort to inventory the range and amount of funding used to provide and support human services transportation in the state. NJCCAM has also proposed an Executive Order designed to institutionalize a coordinated multi-agency planning process over the long term. The EO recognizes that such process is critical to understanding how to optimize federal and state funding sources used for transportation, eliminating duplicative services, identifying opportunities for improved coordination and eliminating administrative barriers that hinder coordination of resources.
5.3 Best Practices and Model Programs The national literature on mobility options for transportation disadvantaged populations is wide ranging, covering many different topics and programs. This section presents a short list of best practices and model programs selected to illustrate a range of specific techniques and recommended programs related to coordinating human services transportation and providing accessible transportation services. The programs and practices are drawn from experiences around the nation.
Coordinating paratransit and fixed route transit Suburban Mobility Authority for Transportation (SMART) One of the best current examples in the United States of transit agencies providing innovative services is the Suburban Mobility Authority for Transportation (SMART) in the Detroit, Michigan metropolitan area. In the mid 1990’s, SMART rebuilt its system focusing on the movement of people who do not have the option to drive (the elderly, the low-income and the disabled). The new system relies on small 28-foot transit vehicles and demand responsive routes to compliment fixed-route services that use full-sized buses. Using a real-time demand-responsive computer scheduling and dispatching system, clients easily book trips and vehicles are seamlessly dispatched. New technology options permit 50 remote transportation providers to link up to the computer system and add their private transportation services to the list of options available to each client. Transit users looking to schedule a trip could then see a complete description of all transportation options available to them instead of just the services offered by one transit provider (CTAA 1995). The routes that were converted to demand-response have also been popular and run like a dial-a-ride service, except that there is no advanced notice deadline for reservations. Some routes try to adhere to a time schedule across a highly flexible route, while others simply operate door-to-door as needed. Employers have worked with SMART on issues such as schedule adjustments to get employees to work at the right times, and the agency has also taken the lead in working with job

Meeting the Employment Transportation Needs of People with Disabilities in New Jersey
115
placement organizations to promote the transit system to job seekers (CTAA, Getting SMART, 1995). SMART also launched separate programs designed to help people find jobs along fixed-route bus lines and to help the newly employed get to work using transit. Fixed routes were adjusted to better serve new suburban job centers. Ridership improved dramatically as a result. A large marketing campaign accompanied these service improvements to help attract ridership. Detroit’s largest radio station began announcing job openings and the bus line that an employee would use to access these jobs (CTAA, Employment Trans. Practices, Michigan, 2001). SMART, as a transit provider, is largely concerned with the supply side of the system. Their approach has been to look at the services they provide, and to determine how to alter them to serve their passengers more effectively. Whether greater coordination, better information, or altered routes, SMART realized that only through multiple efforts could they truly improve their system. Their innovative changes serve as an intriguing model for other systems to employ.
Using Taxi Coupons to expand transportation options Accessible Raleigh Transportation (ART) The accessible transportation system in Raleigh, North Carolina was developed in response to difficulties experienced with providing both traditional accessible fixed-route transit service and door-to-door demand response transportation. The fixed-route service was not able to serve all clients and thus was underutilized. Once implemented, the demand-response service was immediately overwhelmed as social service agencies reduced their services, and people who had been riding the fixed-route transit began to take advantage of a service that was more convenient and similar in price (Olason, 3). Raleigh’s unique open-door policy toward taxi companies provided the transit agency with an opportunity. Since there is no limit to the number of taxis allowed to operate, an open market exists that made room for a contract with the transit agency to provide accessible service. In an attempt to provide diverse services, a two tiered system was implemented: “Tier I is available to all ART users for any one-way taxi or handicap trip that begins and ends within the Raleigh city limits” (City of Raleigh Transit website). Tier I users pay 48% of the regular taxi fare using coupons that they purchase through the city. In addition, “Tier II is available to ART users who qualify under the American with Disabilities ACT (ADA)…ART trips are available for Tier II only if the taxi or handicap trip begins and ends within ¾ miles of a bus stop” (City of Raleigh Transit website). The cost per Tier II trip is $1.50. It is believed that this system is saving the transit agency a considerable amount of money since “some eligible persons prefer to spend more out of their own pocket for the greater convenience of using Tier I coupons for half price taxi service” (Olason, 7). It is estimated that every Tier I trip that is taken in place of a Tier II trip saves the city $4.22. The success of this program in highly dependent upon the type of private-for-hire vehicle industry in the area. However, it is a model worth noting as it is providing a high level of ADA approved service at a relatively low cost.

Meeting the Employment Transportation Needs of People with Disabilities in New Jersey
116
Travel training for People with Disabilities People Accessing Community Transportation (PACT) People Accessing Community Transportation (PACT), run by the Kennedy Center in Bridgeport, Connecticut trains people with a variety of disabilities on the use of regular public transit routes using a hands on step-by-step method. The idea is to transition these trainees from paratransit to accessible fixed-route transit and give them a greater sense of mobility and independence. The trainees work with a counselor one-on-one. The trainer first assesses the individual’s travel needs (such as distance traveled, available bus services, and distance from bus stop to destination/origin) and then works with the trainee to prepare them to use the bus service. On average, 12 hours of training is required for the average candidate and 90% of trainees reported they are still riding the bus independently three months after training. Formal follow-up of these trainees initially occurs at one and three-month intervals in order to ensure that individuals are using the system properly. As part of their training, participants learn about their rights under the ADA and when they need to advocate for themselves. “The PACT training goal is self-sufficiency”. The program was developed with Project ACTION funding and is still in operation today (Easter Seals Project Action 2002).
“One-Stop” Transportation Centers According to the U.S. Department of Labor, “One-Stop Career Centers are designed to provide a full range of assistance to job seekers under one roof. Established under the Workforce Investment Act, the centers offer training referrals, career counseling, job listings, and similar employment-related services (USDOL 2005). In 2001, the Institution for Community Inclusion (IFCI) published a report, called Access for All: A Resource Manual for Meeting the Needs of One-Stop Customers with Disabilities. This wide-ranging report includes a section on transportation issues, suggesting that transportation is “one of the most significant barriers to employment for people with disabilities who don’t drive.” (IFCI 2001) The report recommends that One-Stop centers take a lead role in identifying all available transportation options for their clients while also exploring potential sources of funding. Two examples are the creation of joint disabilities/welfare-to-work transit services or the use of Social Security Work Incentives to help offset the costs of transportation. Two specific Social Security incentives are identified as potential sources:
Plan for Achieving Self-Support (PASS) – These incentives can be used by people receiving Supplemental Security Income to subsidize hiring of private or commercial carriers; leasing, renting, or purchase of private vehicle and related fees; and taking public transit and common carriers.
Impairment Related Work Expense (IRWE) – These funds can be used to subsidize the cost of structural or operational modifications to a vehicle that the person needs to drive to work, even if the vehicle is also used for non-work purposes; the cost of driver assistance or taxicabs where unimpaired individuals in the community do not generally require such special transportation; and mileage expenses for an approved vehicle at a rate determined by the Social Security Administration. Only travel related to employment can be reimbursed.

Meeting the Employment Transportation Needs of People with Disabilities in New Jersey
117
The researcher argues that by reviewing and using available funding and transportation resources, agencies and One-Stop centers can serve as a clearinghouse for information on accessible transportation and help to expand transport options (IFCI 2001).
Using Federal Job Access Reverse Commute (JARC) funds to support work-related transportation for people with disabilities Allegan County Transportation JARC initiative In Allegan County Michigan, JARC funding supports transportation services designed to meet the employment transportation needs of transportation disadvantaged populations, including employees with disabilities. The service currently involves the operation of six vehicles, four of which are lift-equipped. The service is demand responsive, offers subscription service for regular commuters, will deviate out of its service area upon request, and drivers will pick up passengers who flag down the bus at stores and other locations. “Over the past year, Allegan County Transportation has carried an average of 1,200 passengers per month. Sixty-five percent of these riders are people with disabilities, most using the service to reach jobs both in and out of the county. These employment destinations are largely in the service industry at hotels, restaurants, retail stores, gas stations, and other locations (Easter Seals Project Action 2002 p.16).
Emergency ride home for people with disabilities OUTREACH Guaranteed Ride Program In Santa Clara County, CA, JARC funds were used to create a guaranteed ride program (GRP) to offer CalWORKS (California’s Temporary Assistance for Needy Families program) participants and other low-income individuals a short term transportation service (up to 60 rides) should they need a back up ride to or from work-related destinations. The GRP is operated by OUTREACH, the paratransit broker for the Santa Clara Valley Transportation Authority. OUTREACH uses technology solutions “…to schedule trips, track vehicle locations and map travel patterns and needs. As part of the GRP, OUTREACH staff provides individualized transportation planning services and promotes job access self-sufficiency through one-on-one management of client mobility needs” (Easter Seals Project Action 2002 p.17).
Coordinating human services transportation using a brokerage model The transportation broker model is an administrative structure designed to help coordinate a wide range of transportation services funded and operated under the auspices of multiple social service programs by a variety of transportation service providers. It provides a cost-effective, politically neutral means of providing community transportation services. Similar to the concept of a Health Maintenance Organization for health care services, a transportation broker provides administrative services and sub-contracts for transportation services. This arrangement creates an incentive to keep the cost of transportation services low and provides the means to introduce competition among transportation service providers. In addition, the transportation broker can concentrate on marketing and administration, two essential and often neglected components of a successful community transportation system.

Meeting the Employment Transportation Needs of People with Disabilities in New Jersey
118
Transportation brokers initially gained popularity in managing the transportation of Medicaid clients and have the potential to serve multiple programs, creating economies of scale as more programs and riders participate in their systems. Medicaid transportation brokers now operate in Florida, Maryland, Massachusetts, Oregon, Pennsylvania, Vermont, and Washington (APHS 1998; CTAA 2005; VPTA 2005). Many of these brokers are expanding their client network and working toward the creation of community transportation systems, serving Medicaid and welfare participants as well as the general population.
In New Jersey, the closest equivalent to a transportation broker is Hunterdon County, where the Department of Human Services provides suburban fixed route and demand response services to human services clients, seniors, individuals with disabilities, and the general population. It should be noted, however, that the low number of riders and rural/suburban development pattern in Hunterdon County are very different from that of the more urbanized parts of New Jersey. When using this example, few comparisons should be made for the purpose of planning and implementing a transportation broker in more urbanized communities. In Hunterdon, a single provider is adequate and efficient. A true transportation broker separates the broker function from the service delivery function in order to create competition among service providers and drive efficiency.
Using Flex-Route services to enhance mobility and system efficiency Demand-response paratransit can be very expensive because it most often provides service door-to-door or curb-to-curb. As such, it most often requires significant funding subsidies in order to be affordable to the user. At the same time, fixed-route transit service is more cost-effective but less practical in low-density areas with fewer riders and destinations. Also, it is less accessible to many riders because it follows a defined route. In a growing number of locations the best features of both services have been combined into “Flex-route” service operating generally on a defined schedule and route with provision for some route deviation.
The Santee Wateree Regional Transportation Authority in South Carolina has implemented flex-route services in two counties within its jurisdictions. Characteristics of these services include:
Bus stops, which are open to the public, are overlaid on an existing subscription service.
Funded clients are assigned to routes based on where they live, not on routes exclusive to the agency that funds the trip; and
Drivers serve the general public at published stops according to a bus schedule, as they pick up and drop off funded clients at their doorstep.
It is interesting to note that the above example starts with a subscription demand-response service and adds scheduled stops. This contrasts with a service offered by the Potomac and Rappahannock Transportation Commission in Virginia which operates a flex-route that serves published stops but allows reservations for deviations anywhere within a 1.5 mile corridor. Deviation riders are picked up within four blocks of their home, except for riders with disabilities, who board the bus at their home. Reservations two hours in advance are required. The bus may follow any path between bus stops. In Wyoming, Cheyenne Transit Program operates a checkpoint deviation system, where vehicles have a flexible but scheduled route.

Meeting the Employment Transportation Needs of People with Disabilities in New Jersey
119
Buses can deviate from their route to pick up and drop off passengers as long as they arrive and leave the scheduled stops on time (Crain & Associates).
Two examples of successful flex-route services operating in New Jersey include routes implemented in Warren and Union Counties. Warren, a rural county which offers little public transit and has small urban centers, and Union, an urban county with considerable rail and bus transit encompasses a major city and numerous suburban communities. Commonalities between the two counties include the following:
Both have paratransit systems struggling to service the employment and other travel needs of seniors/disabled and the economically disadvantaged;
Both have underserved senior citizen populations;
Both have workforce development agencies struggling to meet the mobility needs of their clients; and
Both had destinations in suburban areas not linked well by transit. In both cases, the counties leveraged funding from various sources (e.g. JARC and Casino Revenue) to initiate small flexible route services. Both systems were able to expand their services, as they received additional funding by demonstrating their value to the human services and workforce development programs. While each county’s service plan had distinct operational characteristics, both provided connections to NJ TRANSIT bus and rail routes. According to Steve Fittante who designed the routes, connections to existing fixed route transit contributed significantly to the success of the services. With regard to utilizing excess seating capacity on service vehicles, funding grantors of both programs accepted the concept of coordination and serving other client groups. Thus, provided that the needs of primary welfare to work clients were being met, other client groups and destinations could be served on a modified fixed route using open seats. This practice resulted in increased efficiency and contributed to further service expansion in Warren County through application of fare revenue. (Note: Union county did not charge fare for their flexible service). These two examples demonstrate that the use of flex route services can increase mobility for all transportation dependent individuals. At the same time flex routes can increase the efficiency of paratransit systems by shifting some senior and disabled trips away from demand-response service to shuttles. In addition, these examples demonstrate the importance and benefits of integrating transit and paratransit services whenever possible (Fittante 2004).
5.4 Summary of key findings The following is a summary of key findings related to coordinating better human services transportation in New Jersey and best practices and model programs for expanding transportation options and enhancing transportation services:
Coordinating transportation services better for transportation disadvantaged persons has been on the public policy agenda for decades (GAO 2003). Transportation coordination, as defined by the Federal Transit Administration, involves providing specialized

Meeting the Employment Transportation Needs of People with Disabilities in New Jersey
120
transportation through “…a process by which representatives of different agencies and client groups work together to achieve any one or all of the following goals: more cost-effective service delivery; increased capacity to serve unmet needs; improved quality of service; and services which are easily understood and accessed by riders” (FTA, 2004).
According to the United States General Accounting Office, barriers to coordination include:
- Unwillingness or inability to share vehicles due to the different needs and characteristics of client populations;
- Perception of the high costs of coordination from the provider perspective;
- Lack of feasibility for coordination in areas lacking a range of transportation services or options;
- Inconsistency among programs with regard to rider eligibility, funding sources, reporting requirements, safety standards and programmatic goals and missions;
- Lack of guidance from federal level officials on implementation strategies; and
- Lack of leadership or commitment on the state level to guide coordination.
According to the National Governor’s Association, coordination among transportation providers and agencies can increase transportation availability and access to jobs, enhance service quality, eliminate duplicative efforts, and improve the cost effectiveness of transportation dollars (NGA, 2000).
The most recent federal initiative designed to promote coordination of human services
transportation is “United We Ride,” an interagency collaboration designed to support states and local governments to deliver coordinated human services transportation. United We Ride grew out of Executive Order 13330 signed by President Bush in February 2004. The Executive Order established the Interagency Transportation Coordinating Council on Access and Mobility (CCAM), chaired by the Secretary of Transportation. The council includes representation from eleven Federal departments, including the Departments of Transportation, Health and Human Services, Labor, Education, Housing and Urban Affairs, Agriculture, Justice, Interior, the Veterans Administration, the Social Security Administration, and the National Council on Disabilities. According to the executive order, “the purpose of the council is to coordinate 62 different Federal programs across 9 Federal departments that provide funding to be used in support of human services transportation” (EO 13330 2004).
The most recent evolution of New Jersey’s interest and on-going effort to coordinate
human services transportation was catalyzed by the federal United We Ride effort. New Jersey has formed a state level Coordinating Council on Access and Mobility (NJCCAM) that mirrors the membership of the federal body. The council has been meeting monthly since 2004 and has sponsored a series of statewide forums as well as an effort to inventory the range and amount of funding used to provide and support human services transportation in the state.

Meeting the Employment Transportation Needs of People with Disabilities in New Jersey
121
There are many examples of best practices and model programs from around the country related to coordinating human services transportation and providing accessible transportation services. These include but are not limited to:
- Coordinating paratransit and fixed route transit;
- Using taxi coupon and voucher programs to expand transportation options;
- Providing travel training for people with disabilities;
- Creating One-stop transportation centers;
- Using Job Access Reverse Commute funds to support employment transportation for people with disabilities;
- Providing emergency ride home programs for people with disabilities commuting to work by transit or paratransit;
- Using a brokerage model to coordinate human services transportation; and
- Using flex-route services to enhance mobility and paratransit system efficiency.

Meeting the Employment Transportation Needs of People with Disabilities in New Jersey
122
CHAPTER 6: RECOMMENDATIONS The continuing debate over how to best provide superior transport service to transportation disadvantaged persons points to the conclusion that the transportation system needs to provide a diverse set of accessible service options, tailored to a specific region. New Jersey’s past experience and the best practices and model programs highlighted in Chapter 5 show that unique and successful types of service result from creative thinking and a willingness to take the risk to try something new. This study suggests two broad based recommendations. First, mandated coordination between the public and private sector could enhance service and make use of available but underutilized or untapped resources. And second, a mechanism for implementing a variety of types and levels of service throughout the varied regions in the state would further the goal of improved employment transportation for the disabled population.
This study highlights the complexity of the problems facing human services agencies dealing with the provision of transportation services for people with disabilities. Even when users can use paratransit to travel to work, there are issues that limit the use and effectiveness of the systems. The variety of locations that can be reached is often constrained, and systems often stop at county boundaries. This causes critical physical and information disconnects in the overall system from a users’ perspective. Often there is no single place users can go to get information about all available transportation options. Unfortunately some service limitations are characteristics of the type of paratransit being offered. For example, any demand-responsive system requires a time window for pick up, and it is inevitable that sometimes the vehicle will not arrive in the given window. However, other issues affecting demand-responsive services are solvable. Problems such as the fear of being left stranded in case of a family emergency, or being unable to travel with children, can be mitigated by means of a guaranteed ride home program or changing the eligibility requirements.
For any system, there are choices to be made from a menu of types of service options, such as fixed route, door-to-door, etc., as well as days and hours of operation, service areas, and integration levels with other providers. There are a variety of user needs in terms of mobility limitations, trip purposes and destinations, and times of travel. Early paratransit systems often were ad hoc, created in isolation with corollary inefficiencies. Today increased coordination among systems is essential. Beyond coordination there is also the need to focus on more traditional transportation planning endeavors, such as revising transit routes and scheduling and assessing vehicle needs. Finally, the central focus must be on the consumers of transportation services, providing the highest level of care possible.
There are a variety of actions or policy initiatives that can be explored to better assist people with disabilities in meeting their mobility needs. Some actions or initiatives will involve coordination across agencies and entities that currently operate independently, some will involve changes in current practices in the delivery of existing services, and some will involve sensitizing the public and service providers to the mobility needs and expectations of the disabled population. Other actions or initiatives will involve educating the disabled population on their mobility options, how to effectively advocate for change, and creating a forum to encourage communication and sharing of ideas, opinions and feelings among the disabled and other interested parties.

Meeting the Employment Transportation Needs of People with Disabilities in New Jersey
123
Personal mobility is a sensitive and powerful issue for persons with disabilities. The absence or presence of mobility affects perceptions of esteem, worthiness, capability, freedom, comfort, independence and significance and can impact employment options and healthcare choices.
The following recommendations are intended to improve/enhance overall mobility for people with disabilities living in New Jersey and help meet the employment transportation needs of those working in or seeking employment in a competitive work environment:
Foster awareness and understanding regarding the employment transportation needs of people with disabilities in New Jersey, the range of transportation options currently available and the benefits of coordinating transportation services at the state and local level, especially among elected officials, business leaders, and transportation providers.
- The Division of Disability Services (DDS) should convene a statewide conference to provide consumers, employers, elected officials, employment counselors, social service providers and transportation providers with a venue to discuss consumer needs and expectations related to transportation, service delivery limitations and paratransit resource needs as well as opportunities for coordinating existing services. The conference should highlight best practices and model programs for enhanced coordination and service delivery.
- DDS, working with NJ TRANSIT and county paratransit providers, should develop informational materials and training programs for consumers on the range of transportation options currently available throughout the State and how to access and use those services.
- DDS, working with the Department of Labor and other partners, should develop and disseminate informational materials for employment counselors, vocational rehabilitation specialists and employers regarding the range of transportation options available, the unique transportation needs of people with disabilities and how those needs can be accommodated to support employment in a competitive work environment.
Participate fully in the United we Ride initiative, which is designed to improve and enhance the coordination of human services transportation at the Federal, State and local level.
- State agencies should continue to advance coordination efforts related to human services transportation in New Jersey. Currently, the most effective means to do this appears to be the New Jersey Coordinating Council on Access and Mobility (NJCCAM) formed in 2004. NJCCAM’s success thus far in advancing a coordination agenda has been hampered by what appears to be too little commitment and interagency support at the cabinet level. Agency staff engaged in the NJCCAM process and disability advocates should strongly urge the Governor to sign a draft Executive Order prepared by NJCCAM. The Executive Order would require cabinet level commitment and participation in the coordination process.
- NJ TRANSIT and the NJ Department of Human Services, through the NJCCAM process, should undertake a statewide human services transportation planning process

Meeting the Employment Transportation Needs of People with Disabilities in New Jersey
124
designed to update the county community transportation plans developed in 1999-2000 as part of the Workfirst New Jersey initiative. These plans provide a solid foundation on which to build a more comprehensive inventory of services and action agenda to address gaps in available transportation services for people with disabilities. It is anticipated that such plans will be required for New Jersey to be eligible to receive New Freedom Initiative grant funds from the Federal Transit Administration beginning in Federal fiscal year 2006. The data collected as part of this study should be a valuable contribution to the planning process.
Expand the resources available to improve and enhance transportation services for people with disabilities.
- The State should reexamine the current formula used to allocate funds distributed as part of the Senior Citizen & Disabled Transportation Assistance Program (SCDRTAP) administered by NJ TRANSIT. Revenue from the SCDRTAP is the most common source of funding used by county paratransit providers. Currently the funding distribution formula is based on the percentage of county population over the age of sixty. This formula generally favors urban counties and does not fully account for the population of people with disabilities. In addition, it does not consider access to traditional public transit services which are generally more available in urban counties. Modifications to the funding allocation formula should be considered to account for these additional factors and to ensure that funds are being allocated based on the needs of the consumers intended to be served by the program.
- County paratransit providers and other transportation operators should consider making greater use of fares. Currently, very few collect fare revenue. Fare policies should be based on a riders ability to pay and fare collection could be facilitated through the use of smart card technology. The collection of additional fare revenue could support the expansion of services.
- As additional resources become available, county paratransit and other service providers should expand their hours of operation to accommodate work-related commutation and shift employment.
Work cooperatively to create a more seamless community transportation system and consistently work toward improving and expanding travel options available to people with disabilities.
- NJ TRANSIT and county paratransit providers should expand the use of flex-route transit services where feasible and appropriate. Carefully planned and implemented flex-route services have the potential to increase the efficiency of existing paratransit operations and offer expanded service options to people with disabilities.
- County paratransit providers and NGO service providers should explore partnership opportunities and examine ways to link better their services with existing fixed route transit operated by NJ TRANSIT and others. By making better connections and providing coordinated transfers, paratransit systems can “feed” riders to accessible

Meeting the Employment Transportation Needs of People with Disabilities in New Jersey
125
fixed route services that are less expensive to operate, serve multiple jurisdictions, and operate on regular schedules with reasonable frequencies.
- County paratransit providers should develop ways to facilitate and or provide service to and from origins and destinations that cross county boundaries. This could be accomplished by changing policies that restrict operation to in-county locations, entering into inter-local agreements with neighboring counties and through other appropriate means.
- Transportation providers should employ technology, such as real-time and/or centralized dispatching, to better meet consumer needs and service expectations, especially with regard to advance scheduling, wait time “windows,” general service reliability and timeliness.
- To the maximum extent feasible, NJ TRANSIT, county paratransit providers, and other service providers should work toward creating more uniform policies and procedures concerning eligibility determination, passenger assistance practices, scheduling and fare/payment policies. Surveys, interviews and focus groups conducted for this study confirm that there is wide variation regarding the policies and procedures followed by different services providers. This variation causes confusion among consumers and contributes to a significant expectation gap between what consumers expect from the transportation system and what the transportation system can and does provide throughout the state. Further, inconsistent policies and procedures complicate and discourage service coordination.
- Transportation management associations (TMAs) that offer emergency ride home (ERH) programs serving commuters traveling by carpool, vanpool and public transportation should ensure that those services can accommodate people with disabilities traveling to and from work by similar means. The NJ Department of Transportation, which provides support funding to TMAs, should work with them to establish fully accessible ERH programs in every county.
Increase the number of accessible vehicles and facilities available from all public, private and NGO service providers.
- Ensure that NJ TRANSIT is complying with the requirements of the Americans with Disabilities Act. Although information provided by NJ TRANSIT indicates compliance with the law, numerous consumer reports received as part of this study’s focus groups and surveys indicate that stop announcements are frequently not made or are inaudible; equipment such as wheel chair lifts, bridge plates and elevators are not always operable; and station facilities are not well marked. NJ TRANSIT should strive toward a goal of universal accessibility for all of its services.
- Reform the State’s taxi and livery license laws to require that a minimum portion of each operator’s fleet is wheelchair accessible. The State should provide incentives to encourage compliance and facilitate the retrofitting of existing fleets over time.
- Establish minimum accessibility requirements for county paratransit fleets and NGO providers receiving State and Federal funds. Information collected for this study

Meeting the Employment Transportation Needs of People with Disabilities in New Jersey
126
indicates that less than half of the county paratransit fleet statewide is wheelchair accessible. Less than one quarter of the NGO fleet inventoried for the study was wheelchair accessible.
Develop a concierge/brokerage service demonstration project that would offer coordinated, seamless trip planning and scheduling assistance to disabled individuals throughout the state.
- DDS should work with NJ TRANSIT to create a Regional Travel Concierge service as a three year demonstration project designed to address transportation barriers to work for people with disabilities and other transportation disadvantaged populations. The demonstration project should build on the significant body of research already conducted for this study regarding the transportation needs of people with disabilities in New Jersey and the transportation services available in each of state’s twenty-one counties. The project should be implemented in two phases. The first phase which should focus on planning activities would occur over the first year of the three year demonstration period. Significant components of phase one should include but not be limited to:
a) Developing a request for proposals and managing the procurement process for selecting a local implementation partner (e.g., county government, transportation management association or other nongovernmental organization);
b) Supplementing existing databases as needed to ensure an accurate and up to date inventory of transportation services, providers and eligibility requirements in the demonstration region;
c) Developing model policies and procedures to guide implementation of the regional concierge services and monitor and evaluate its success;
d) Negotiating memoranda of agreement with various transportation and social service providers to ensure cooperation relative to brokering their services; and
e) Developing public relations and marketing strategies to get the word out about the service.
Phase two should focus on implementation, monitoring and evaluation over the remaining two years of the demonstration period.
Create an Internet-based one-stop for information on available transportation options and services for disabled persons.
- DDS should seek out partners to create a one-stop Internet “web portal” to improve access to information on transportation options for people with disabilities. The web portal should contain information related to: the types of services available in each of New Jersey’s 21 counties, contact information for existing service providers, use and eligibility requirements for existing services, hours of operation, reservation
Meeting the Employment Transportation Needs of People with Disabilities in New Jersey
127
procedures, fare policies, and other relevant information with an emphasis on those service characteristics relevant to employment travel needs. To the extent feasible and appropriate, the “web portal” should incorporate Internet mapping technology to communicate service information and to facilitate trip planning. This effort should build upon the extensive database of transportation service information collected as part of this study. In addition, DDS should explore making the one-stop information available via an 800 telephone number.
Increase driver education and training on a variety of topics, including the use of wheelchair tie-downs and lifts, bridge plate operation; emergency preparedness and first aid as well as driver sensitivity.
- NJ TRANSIT and county paratransit providers should expand the availability of driver training programs and require drivers to participate in skill enhancement training on a regular basis. Only half of the 40 county providers surveyed for this study require training related to operating wheelchair tie-downs and lifts. Fewer than one quarter required emergency training and less than half required sensitivity training related to serving disabled consumers.
Expand the quality and availability of travel training programs for people with disabilities and the employment/social service counselors that serve them.
- DDS should work with NJ TRANSIT, county paratransit providers, and other related agencies to develop travel training curricula for people with disabilities. The travel training programs should include modules on what services are available and how to use them. The training should be available as a component of workforce development services. In addition, employment counselors and vocational rehabilitation specialist should be required to complete the training program so they can more effectively advise their clients.
Ensure transportation service planning at all levels incorporates and addresses the transportation needs of people with disabilities.
- All agencies and organizations involved in the transportation planning process should ensure that the needs of people with disabilities are considered as part of all planning activities. Input from the disabled community should be solicited on an on-going and regular basis. Planning efforts should recognize the diverse mobility needs of persons with disabilities which can vary significantly based on disability type, severity and employment status. Agencies should seek to create non-traditional opportunities for input and take extraordinary steps to include consumers in the planning and policymaking process so that service changes and enhancements best meet their needs.

Meeting the Employment Transportation Needs of People with Disabilities in New Jersey
128
Implementation Implementing the above recommendations will require the participation and sustained commitment of many organizations, agencies and individuals. The recommendations represent an aggressive but achievable action agenda of legislative, regulatory, programmatic and policy changes necessary to ensure improved mobility options for people with disabilities living in New Jersey, with a special emphasis on those working in or seeking employment in a competitive work environment. Potential implementation partners include members of the New Jersey Legislature; state agencies, including: New Jersey Department of Transportation (NJDOT), NJ TRANSIT, New Jersey Department of Human Services (NJDHS); the NJDHS Division of Disability Services; counties; and a variety of nonprofit service and advocacy organizations. In addition, for its part, the Alan M. Voorhees Transportation Center is committed to focusing attention on transportation equity and the mobility needs of transportation disadvantaged populations as critical public policy issues facing New Jersey. Toward that end, we will continue to work with the Division of Disability Services and its partners to facilitate and monitor implementation of the recommendations. Table 6.1 provides a framework for implementation by identifying which potential partners could take a leadership and/or supporting role in advancing specific recommendations.

Meeting the Employment Transportation Needs of People with Disabilities in New Jersey
129
Table 6.1: Implementation Matrix
Potential Leadership/Supporting Partners
Recommendation NJD
HS
- DD
S
NJD
HS
NJ
TRA
NSI
T
NJD
OT
Cou
ntie
s
NJ
Legi
slat
ure
Other
1. Foster Awareness and understanding regarding the employment transportation needs of people with disabilities in New Jersey, the range of transportation options available and the benefits of coordinating services.
NJ Dept. of Labor
2. Participate fully in United We Ride initiative, which is designed to improve and enhance the coordination of human service transportation.
Other state agencies
providing transportation
services
3. Expand the resources available to improve and enhance transportation services for people with disabilities.
4. Create a more seamless community transportation system and consistently work toward improving and expanding travel options for people with disabilities.
NGO
transportation providers
5. Increase the number of accessible vehicles and facilities available from public, private and NGO service providers
NGO service providers, private
taxi and livery companies
6. Develop a concierge/brokerage service demonstration project
NGO transportation
providers, TMAs
7. Create and Internet-based one-stop for transportation information.
8. Increase driver education and training. NGO Service providers
9. Expand the quality and availability of travel training for people with disabilities. NJ Dept. of
Labor, TMAs
10. Ensure transportation service planning at all levels incorporates and addresses the transportation needs of people with disabilities
NOTE: = potential leadership partner = potential supporting partner

Meeting the Employment Transportation Needs of People with Disabilities in New Jersey
130
CHAPTER 7: REFERENCES Adams, Moss. “The Coordination Challenge.” Community Transportation Association of America.
Washington, D.C. June 2000. Allen, Judy Stein and Paul M. Muchinsky. “Assessing Raters’ Policies in Evaluating Proposed Services
for Transporting the Physically Handicapped.” Journal of Applied Psychology Vol. 69, No. 1 (1984): 3-11.
American Public Human Services Association. “Designing and Operating Cost-Effective Medicaid Non-
Emergency Transportation Systems: A Guide for State Medicaid Agencies.” Washington, D.C. 1998. Available at http://www.aphsa.org/hotnews/NET.pdf
ATR Institute. “At The Crossroads: Disability and Transportation in New Mexico.” ATR December 2002.
Bogren, Scott. “Getting SMART.” Community Transportation Reporter. (November 1995). Available http://www.ctaa.org/ct/nov95/smart
Burkhardt, Jon E. “Coordinated Transportation Systems.” AARP. Washington, D.C. 2000. Available: http://research.aarp.org/consume/2000_16_transport.pdf
Burkhardt, Jon E. et al. “Coordinated Transportation Demonstration Results: Evaluation of the Office of
Human Development Services Transportation Demonstration Program.” U.S. Department of Health, Education, and Welfare. Washington, D.C. February 1980.
Burkhauser, Richard V., Mary C. Daly, Andrew J. Houtenville, and Nigar Nargis. 2001. “The
Employment of Working-Age People with Disabilities in the 1980s and 1990s: What Current Data Can and Cannot Tell Us.” Accessed online: www.frbsf.org/publications/economics/papers/2001/wp01-20bk.pdf (7-14-2004)
Bush, President George. “Executive Order Human Service Transportation Coordination.” Washington,
D.C. February 2004. Cervero, Robert. Paratransit in America: Redefining Mass Transportation. Connecticut: Praeger
Publishers, 1997. Chen, Iris Wan Hui, Francis Gross, Kelley Pecheux and Paul P. Jovanis. “Estimating Modal Preferences
between ITS-Enhanced and Existing Paratransit Services.” TRB 2004 Annual Meeting CD-ROM. Community Transportation Association of America (CTAA) website. Internet (2004). Available
http://www.ctaa.org Community Transportation Association of America. “Best Practices.” Washington, D.C. Available
http://www.ctaa.org/adaview.asp?pageid=916 Community Transportation Association of America. “Coordinating Community Transportation Services:
A Planning and Implementation Handbook.” U.S. Department of Health and Human Services. Washington, D.C. May 1992.
Community Transportation Association of America. “Employment Transportation Practices: Michigan.”
Washington, D.C. 2001. Available http://www.ctaa.org/ ntrc/atj/practices/mi_smart_first.html

Meeting the Employment Transportation Needs of People with Disabilities in New Jersey
131
Community Transportation Association of America. “Innovations for Seniors: Public and Community Transit Services Respond to Special Needs.” Washington, D.C. February 2004. Available: www.ctaa.org/ntrc/senior/innovations.pdf
Crain & Associates, Inc. Handbook for Rural Flexroute Implmentation: The Santee Wateree Regional
Transportation Authority Experience. For Easter Seals Project ACTION: Document No. 20-0200. Accessed online: http://projectaction.easterseals.com/site/DocServer/00FLEX.pdf?docID=3437 (12-1-04)
Creative Action, Inc. “Coordinating Transportation Services: Local Collaboration and Decision-Making.”
Project ACTION. Washington D.C. May 2001. Easter Seals Project ACTION. “Innovative Practices in Paratransit Services.” Washington, D.C. 2002. Easter Seals Project ACTION. “Mobility Planning Services Toolkit.” Available
http://www.projectaction.org/ Easter Seals Project ACTION. “Travel Training in Bridgeport, CT.” Project Action Magazine May
2002. Available http://www.projectaction.org/ European Conference of Ministers to Transport. “Access to Taxis: Support for People with Mobility
Handicaps.” ECMT, 1992. Federal Transit Administration (FTA). “Planning Guidelines for Coordinated State and Local Specialized
Transportation Services.” Internet (2004). Available www.fta.gov Fittante, Steve. April 2004. “Flexible Bus Routes: Designing Bus Services to Meet Senior Citizen and
Transportation Dependent Needs.” Presentation to Safe Mobility At Any Age Policy Forum No. 4. Alan M. Voorhees Transportation Center, Rutgers, The State University of New Jersey. New Brunswick, New Jersey.
Gilbert, Gorman and Thomas J. Cook. “The Private-for-Hire Vehicle (PHV) Industry and Its Contracts
with Public Transit Operators.” TRB 2003 Annual Meeting CD-ROM. Gilderboom, John I. and Mark S. Rosentraub. “Creating the Accesible City: Proposals for Providing
Housing and Transportation for Low Income, Elderly and Disabled People.” American Journal of Economics and Sociology Vol. 49, No. 3 (July 1990): 271-282.
Healthcare Financing Administration. “Designing and Operating Cost-Effective Medicaid Non-
Emergency Transportation Systems: A Guide for State Medicaid Agencies.” August 1998. Honeycutt, Todd and Carol Harvey. “The New Jersey Workability Evaluation.” Program for Disability
Research at Rutgers, the State University of New Jersey. New Brunswick, NJ February 2005. Institute for Community Inclusion, Children’s Hospital Boston and The University of Massachusetts
Boston. “Access for All: A Resource Manual for Meeting the Needs of One-Stop Customers with Disabilities.” Internet 2002. Available: http://www.childrenshospital.org/
Institute for Transportation Research and Education, Transit Operations Group. “Community
Transportation Services Alternatives Analysis.” ITRE, North Carolina State University April 1997.
Meeting the Employment Transportation Needs of People with Disabilities in New Jersey
132
Ireys, Henry T., Justin S. White, Craig Thorton. October 2003. The Medicaid Buy-in Program: Quantitative Measures of Enrollment Trends and Participant Characteristics in 2002. Mathmatica Policy Research, Inc. Washington, DC
Jackson, Raymond. “The Cost and Quality of Paratransit Service for the Elderly and Handicapped.”
Transportation Quarterly Vol. 36, No. 4 (October 1982): 527-540. Kaye, Steven. 2001. “Improved Employment Opportunities for People with Disabilities.” Mimeo,
Disability Statistics Center, Institute for Health & Aging, University of California, San Francisco, CA.
King, Joe Jr. “Adequacy of Transportation in Minority Communities for Handicapped, Low Income and
Elderly Groups.” Transportation Quarterly Vol. 41, No. 2 (April 1987): 247-261. Koska, Robert. April 2004. “NJ TRANSIT Local Community Transportation Programs” Presentation to
Safe Mobility At Any Age Policy Forum No. 4. Alan M. Voorhees Transportation Center, Rutgers, The State University of New Jersey. New Brunswick, New Jersey.
LaPlante, Kennedy, Kaye, & Wenger. “Disability and Employment.” Disability Statistics Abstract, No.
11 January 1996. San Francisco, CA: Disability Statistics Rehabilitation Research and Training Center, Institute for Health & Aging, School of Nursing, University of California.
London, Alice. “Transportation Services for the Disabled: A Complex Public Policy Issue.” GAO
Review (Spring 1986): 21-27. Loprest, Pamela and Elaine Maag. 2001. ‘Barriers to and Supports for Work among Adults with
Disabilities: Results from the NHIS-D.” Washington, DC: Urban Institute Marsico, Dale J. “Linking People to the Workplace.” Community Transportation Association of America.
Washington, D.C. January 2001. Available: http://www.ctaa.org/data/toolkit_full.pdf McNeil, J.M. 1997. Americans with disabilities: 1994-95. US Bureau of the Census Current Population
Reports, Washington, DC: US Government Printing Office. McNeil, J.M. 2000. “Employment, Earnings and Disability.” Prepared for the 75th Annual Conference of
the Western Economic Association International. June 29-July 3, 2000. Vancouver, British Columbia.
McKnight, Claire, Marcia Walsh, Leonard Robins and Ashish Sen. “Transportation for the Mobility-
Limited: An Analysis of Current Options.” Policy Analysis 6 (1980): 441-65. Middendorf, D.P., K.W. Heathington, F.J. Wegmann, M.W. Redford, A. Chatterjee and T.L. Bell. “Cost
Effectiveness of Transportation Services for the Handicapped.” Ekistics 306 (May/June 1984): 230-237.
National Council on Disability. 2002. National Disability Policy: A Progress Report, December 2000-
December 2001. Accessed online: www.ncd.gov/newsroom/publications/progressreport_07-26-02.html (12-1-04)
National Governor’s Association (NGA). “Improving Public Transportation Services through Effective
Statewide Coordination.” Washington, D.C. 2000. Available: http://www.nga.org

Meeting the Employment Transportation Needs of People with Disabilities in New Jersey
133
National Transportation Consortium of States, Esometrics Incorporated & American Public Works
Association. “Working Together: A Directory of State Coordination Programs, Policies, and Contacts: 1999-2000.” Coordinating Council on Access and Mobility. February, 2000.
New Jersey Department of Human Services. TANJ State Plan Amendments. Trenton, NJ. 2002. Available
at http://www.state.nj.us/humanservices/dfd/tanf1.html NJ TRANSIT Guide to Accessible Services. Available at: http://www.njtransit.com/as.shtml. Accessed
online 2004. O’Connell, Lenahan, Bruce Siria and Ted Grossardt. “Bringing Fixed-Route Transit Service to Small
Cities and Towns: The Potential Contribution of Existing Demand-Response Brokerages.” TRB 2003 Annual Meeting CD-ROM.
Odutola, Adeniji A. and Addis C. Taylor. “Services and Longevity of Paratransit Operation.”
Transportation Quarterly Vol. 44, No. 1 (January 1990): 151-162. Olason, Robert Alan. “ART: A Paratransit System Based on City Ordinance, Using Trip-by-Trip
Eligibility Determination and A Two-Tiered, User-Side Subsidy.” TRB 2003 Annual Meeting CD-ROM.
Pagano, Anthony M., Paul Metaxatos and Alicia Morreale. “State Strategies for Implementing Computer
Assisted Scheduling and Dispatching Systems for Paratransit Brokerage and Coordination.” TRB 2004 Annual Meeting CD-ROM.
Palladino, RJ. “NJ TRANSIT’s Access Link Paratransit Service.” A report for Richard K. Brail.
December 2004. Pfeiffer, David. “Public Transit Access for Disabled Persons in the United States.” Disability, Handicap
& Society, Vol. 5, No. 2 (1990): 153-166. Pfeiffer, David. “MBTA Call-a-Lift Bus Program.” Transportation Quarterly Vol. 45, No. 2 (April
1991): 243-258. Research Results Digest. “Integrating Americans with Disabilities Act Paratransit Services and Human
Services Transportation.” Number 10, Transit Cooperative Research Program. (April 1997). Available at http://nationalacademies.org/ trb/publications/ tcrp/tcrp_rrd_10.pdf
RLS & Associates. “A Guide for Implementing Coordinating Transportation Systems.” A report for the
Ohio Department of Transportation. Columbus, OH. October 1997. Transit Cooperative Research Program. “ADA Paratransit Eligibility Certification Practices.” TCRP
Synthesis 30 (1998). Transit Cooperative Research Program. “Economic Benefits of Coordinating Human Service
Transportation and Transit Services.” TCRP Report 91 (2003). Transit Cooperative Research Program. “Guidebook for Attracting Paratransit Patrons to Fixed-Route
Services.” TCRP Report 24 (1997).
Meeting the Employment Transportation Needs of People with Disabilities in New Jersey
134
Transit Cooperative Research Program. “Integrating Americans with Disabilities Act Paratransit Services and Health and Human Services Transportation.” Research Results Digest, No. 10 (April 1997).
Transit Cooperative Research Program. “Paratransit Contracting and Service Delivery Methods.”
Transportation Research Board, Report 75, National Academy Press (1998). Transit Cooperative Research Program. “The Role of the Private-for-Hire Vehicle Industry in Public
Transit.” Transportation Research Board, Report 75, National Academy Press (2002). Transit Cooperative Research Program. “Transit Operations for Individuals with Disabilities.”
Transportation Research Board, Report 9, National Academy Press (1995). Transportation Research Board (TRB) of the National Academies. “Transit Cooperative Research Board
Report 91: Economic Benefits of Coordinating Human Services Transportation and Transit Services.” Washington, D.C. 2003. Available: http://trb.org/publications/tcrp/tcrp_rpt_91.pdf
United We Ride Coordinating Council on Access and Mobility. 2005. Report to the President: Human
Service Transportation Coordination. Accessed online: http://www.unitedweride.gov/0216_LAYOUT_1.3F_v6.pdf
U.S. Census Bureau. Disability Definitions. Washington, D.C. Accessed March 1, 2005. Available
www.census.gov/hhes/www/disability/disab_defn.htm U.S. Census Bureau. “Selected Appendixes: 2000 Summary Social, Economic, and Housing
Characteristics.” Washington, D.C. June 2003. U.S. Department of Education (US Dept. of Ed.), ADA & IT Technical Assistance Centers website.
Internet (September 2003). http://www.adata.org/whatsada-history.html U.S. Department of Labor. One-Stop Career Centers. Washington, D.C. Accessed March 1, 2005.
Available www.dol.gov/dol/topic/training/onestop.htm U.S. General Accounting Office. June 2003. Transportation Disadvantaged Populations: Some
Coordination Efforts Among Programs Providing Transportation Services, but Obstacles Persist. GAO-03-697. Washington, DC. http://www.gao.gov/new.items/d03697.pdf (12-1-04)
Venter, Christoffel. “Towards Estimating the User Impacts of Next-Day Reservation Policies in ADA
Paratransit Systems.” TRB 2003 Annual Meeting CD-ROM. Vermont Public Transportation Association. “Medicaid/Reach Up Program.” White River Junction, VT.
Accessed April 2, 2005. Available http://vpta.net/publicservice_medical.cfm Washington State Agency Council on Coordinated Transportation. “Improving Transportation for People
with Special Transportation Needs through Coordination.” Olympia, WA. August 1999.