meeting the co challenge - automotivebusiness.com.br · © pa knowledge limited | confidential...
TRANSCRIPT

1© PA Knowledge Limited | Confidential between PA and intended recipient
MEETING THE CO2
CHALLENGEIMPLICATIONS FOR THE AUTOMOTIVE INDUSTRY
Discussion paper
PA CONSULTING GROUP
JUNE 2018

2© PA Knowledge Limited | Confidential between PA and intended recipient
2017 2025
Pri
ori
ty
Today
low
hig
h
PRIORITY OF CURRENT MEGATRENDS IN THE AUTOMOTIVE INDUSTRY AND CHANGE IN NUMBERS GLOBALLY*
THE STRATEGIC
PRIORITISATION OF THE
MEGATRENDS TAKES PLACE
IN THOSE MAIN AREAS:
▪ Resources & invest
▪ Return
▪ Time-to-Impact
THE FOLLOWING
DEVELOPMENT CAN BE
OBSERVED:
▪ Autonomous driving after
the first hype phase now
rising sharply again and
dominating in the future
▪ CO2 reduction with
increasing relevance by
tightening targets and
impending driving bans
▪ Mobility platforms currently
stagnating and in a
consolidation phase from
2020
▪ Connectivity is evolving
along ever shorter release
cycles
IMPLICATIONS
1
12
0.001
EVs, annually
L3 vehicles, annually
Connectivity
New Mobility &
Platforms
CO2 Reduction &
EVs
Autonomous
Driving
CO2 TARGET ACHIEVEMENTTOP items in the automotive agenda
1
2017 2025
15-30
8
20252017
35-40
30
2017 2025
400-600
*in million vehicles; Source: Citibank 2017, IHS Global Insight 2017, Statistica 2017, Frost & Sullivan 2016, Autofacts 2017, PA analysis 2017
2015 2020 2025
Car Sharing user
Connected vehicles, total
3© PA Knowledge Limited | Confidential between PA and intended recipient
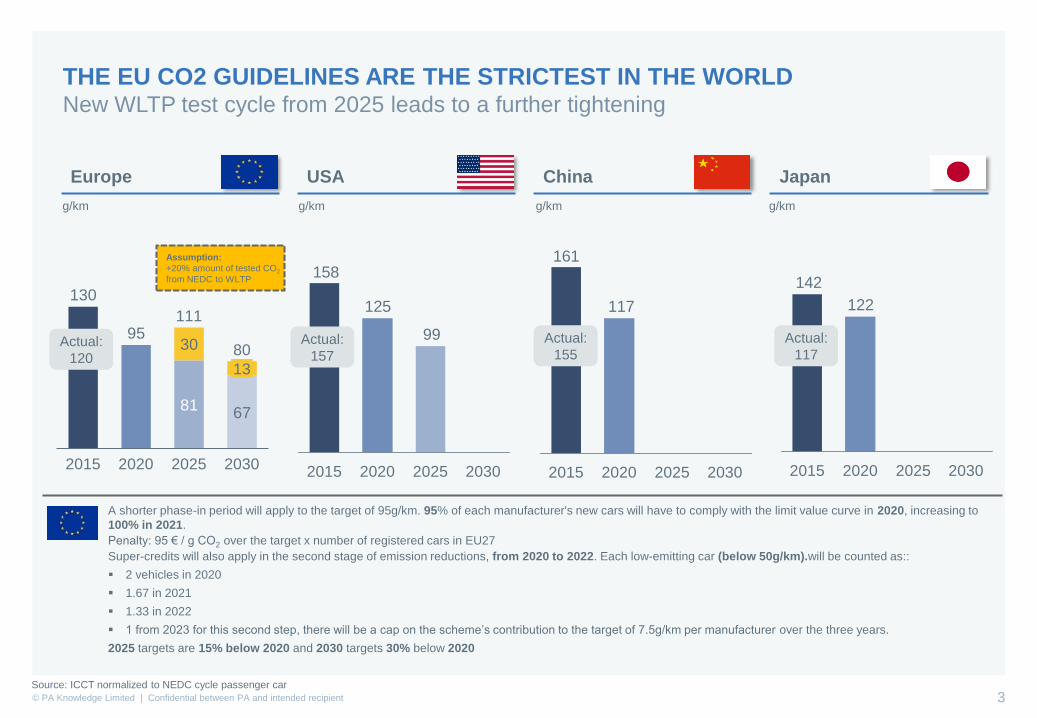
THE EU CO2 GUIDELINES ARE THE STRICTEST IN THE WORLDNew WLTP test cycle from 2025 leads to a further tightening
Europe USA China Japan
130
95
8167
30
2015 2020 2025
13
2030
111
8099
125
158
2015 2020 2025 2030
117
161
20202015 2025 2030
122
142
20202015 20302025
Assumption:
+20% amount of tested CO2
from NEDC to WLTP
A shorter phase-in period will apply to the target of 95g/km. 95% of each manufacturer's new cars will have to comply with the limit value curve in 2020, increasing to
100% in 2021.
Penalty: 95 € / g CO2 over the target x number of registered cars in EU27
Super-credits will also apply in the second stage of emission reductions, from 2020 to 2022. Each low-emitting car (below 50g/km).will be counted as::
▪ 2 vehicles in 2020
▪ 1.67 in 2021
▪ 1.33 in 2022
▪ 1 from 2023 for this second step, there will be a cap on the scheme’s contribution to the target of 7.5g/km per manufacturer over the three years.
2025 targets are 15% below 2020 and 2030 targets 30% below 2020
g/km g/km g/km g/km
Source: ICCT normalized to NEDC cycle passenger car
Actual:
155
Actual:
117Actual:
157Actual:
120

4© PA Knowledge Limited | Confidential between PA and intended recipient
THREATENING DRIVING BANS AND GOVERNMENT INCENTIVES
Pressure for action for car makers continues to grow
India 2030
China “in the near future”
California 2040
from 2030
from 2025
from 2040
from 2040
Government incentives
for BEVs & HEVs
in
discussion
Planned driving bans for combustion engines
?
Source: PA Research
Subsid
ies
at
purc
hase
Vehic
le tax
reduction
VA
T
Reduction
Fin
ancia
l
incentives
Oth
er
incentives
(lik
e fre
e
park
ing, use o
f
bus lanes)
Austria x x x x x
Belgium x x x
Denmark x x
Finland x x
France x x x x
Germany x x x x
Greece x x
Ireland x x x x x
Italy x
Netherlands x x
Norway x x x x
Portugal x x x x
Spain x x x x
Sweden x x x
Switzerland x x
United
Kingdomx x x x
5© PA Knowledge Limited | Confidential between PA and intended recipient
-
-
-
-
200
290
570
1,200
500
455
1,300
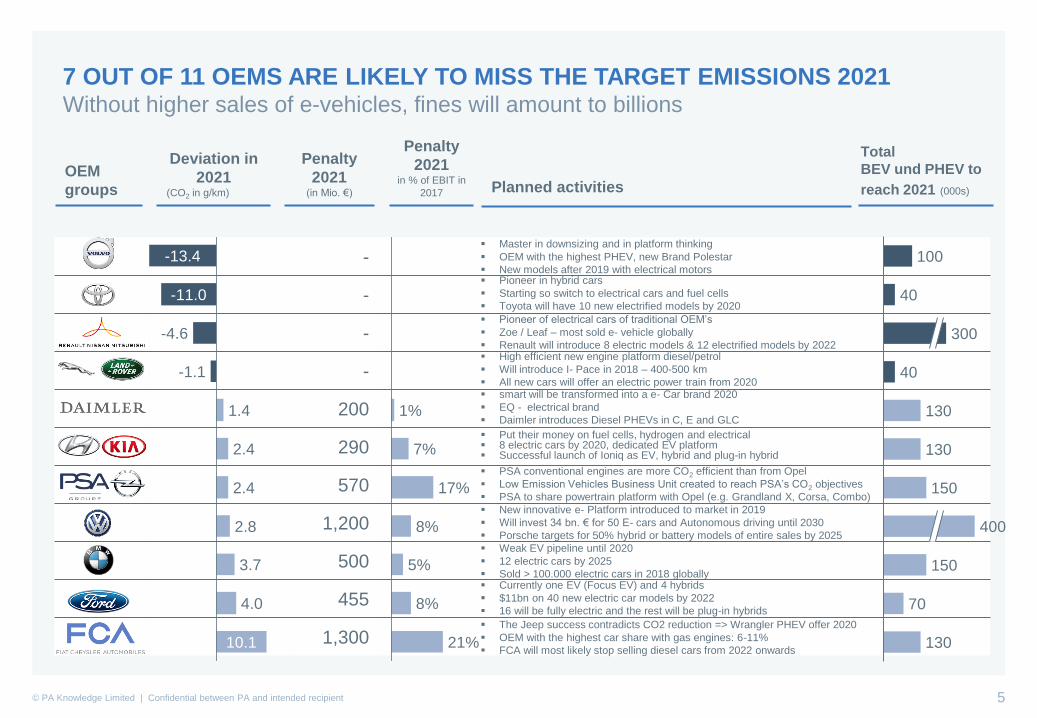
7 OUT OF 11 OEMS ARE LIKELY TO MISS THE TARGET EMISSIONS 2021 Without higher sales of e-vehicles, fines will amount to billions
Deviation in
2021(CO2 in g/km)
Penalty
2021(in Mio. €) Planned activities
Total
BEV und PHEV to
reach 2021 (000s)
OEM
groups
-11.0
-13.4
10.1
-1.1
-4.6
2.4
2.4
1.4
2.8
3.7
4.0
▪ Master in downsizing and in platform thinking
▪ OEM with the highest PHEV, new Brand Polestar
▪ New models after 2019 with electrical motors▪ Pioneer in hybrid cars
▪ Starting so switch to electrical cars and fuel cells
▪ Toyota will have 10 new electrified models by 2020
▪ Pioneer of electrical cars of traditional OEM’s
▪ Zoe / Leaf – most sold e- vehicle globally
▪ Renault will introduce 8 electric models & 12 electrified models by 2022▪ High efficient new engine platform diesel/petrol
▪ Will introduce I- Pace in 2018 – 400-500 km
▪ All new cars will offer an electric power train from 2020▪ smart will be transformed into a e- Car brand 2020
▪ EQ - electrical brand
▪ Daimler introduces Diesel PHEVs in C, E and GLC
▪ Put their money on fuel cells, hydrogen and electrical▪ 8 electric cars by 2020, dedicated EV platform▪ Successful launch of Ioniq as EV, hybrid and plug-in hybrid
▪ PSA conventional engines are more CO2 efficient than from Opel
▪ Low Emission Vehicles Business Unit created to reach PSA’s CO2 objectives
▪ PSA to share powertrain platform with Opel (e.g. Grandland X, Corsa, Combo)
▪ New innovative e- Platform introduced to market in 2019
▪ Will invest 34 bn. € for 50 E- cars and Autonomous driving until 2030
▪ Porsche targets for 50% hybrid or battery models of entire sales by 2025
▪ Weak EV pipeline until 2020
▪ 12 electric cars by 2025
▪ Sold > 100.000 electric cars in 2018 globally▪ Currently one EV (Focus EV) and 4 hybrids
▪ $11bn on 40 new electric car models by 2022
▪ 16 will be fully electric and the rest will be plug-in hybrids
▪ The Jeep success contradicts CO2 reduction => Wrangler PHEV offer 2020
▪ OEM with the highest car share with gas engines: 6-11%
▪ FCA will most likely stop selling diesel cars from 2022 onwards
100
40
40
130
130
150
150
70
130
300
400
Penalty
2021in % of EBIT in
2017
1%
21%
8%
5%
7%
17%
8%

6© PA Knowledge Limited | Confidential between PA and intended recipient
FUTURE MOBILITY
PERFORMANCE SCORE
SIX KEY FACTORS
FOR CAR MAKERS'
E-MOBILITY SUCCESS
PA CONSULTING
JUNE 2018

7© PA Knowledge Limited | Confidential between PA and intended recipient
PA‘S FUTURE MOBILITY PERFORMANCE SCORE FOR TOP 13 GLOBAL CAR MAKERS
SIX KEY FACTORS INDICATE CAR MAKER’S POTENTIAL TO SUCCEED IN E-MOBILITY
1. Technology & Strategy
▪ Model portfolio & technology
roadmap
▪ E-Branding
▪ Organisational strategy & set-up
PA’s Future Mobility Performance Score
Future MobilityPerformanceScore
6. Financial
Performance
1. Technology & Strategy
2. Battery Technology
3. Culture &
Incentives
4. Supplier
Network
5. Ecosystem
& Partners
30%
20%
10%15%
10%
15%
Key success factors
2. Battery Technology
▪ Cost position & scalability
▪ Technology maturity
▪ Value creation strategy
3. Culture & Incentives
▪ Culture & leadership
▪ Incentive system & motivation
▪ New working models (e.g. agile)
4. Supplier Network
▪ Value chain integration
▪ Make or buy
▪ Raw material supply & recycling
5. Ecosystem & Partners
▪ Charging technology & stations
▪ 3rd party services
▪ Technology standards &
interfaces
6. Financial Performance
▪ EBIT performance (E-Mobility
investment indication)
xx% weightingfactor
8© PA Knowledge Limited | Confidential between PA and intended recipient
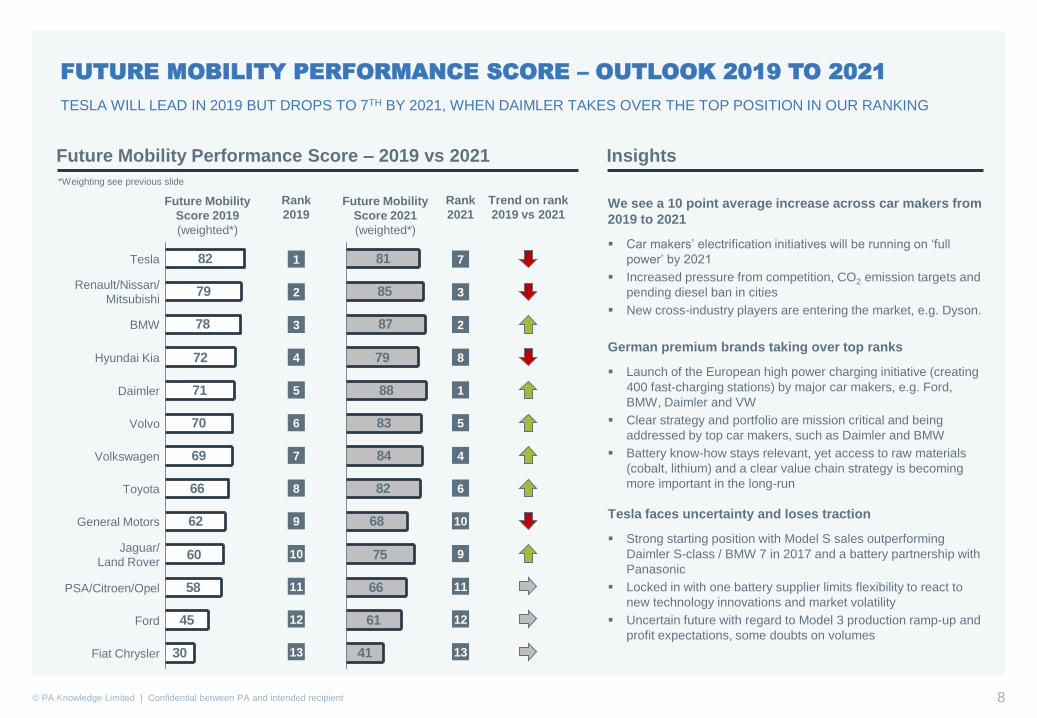
FUTURE MOBILITY PERFORMANCE SCORE – OUTLOOK 2019 TO 2021
TESLA WILL LEAD IN 2019 BUT DROPS TO 7TH BY 2021, WHEN DAIMLER TAKES OVER THE TOP POSITION IN OUR RANKING
82
79
78
72
71
70
69
66
62
60
58
45
30
BMW
General Motors
Fiat Chrysler
Renault/Nissan/
Mitsubishi
Daimler
Tesla
Jaguar/
Land Rover
Toyota
Volvo
Volkswagen
Ford
Hyundai Kia
PSA/Citroen/Opel
Future Mobility Performance Score – 2019 vs 2021
1
2
3
4
5
6
7
10
8
9
11
12
13
Rank
2019
Insights
Future Mobility
Score 2019
(weighted*)
81
85
87
79
88
83
84
82
68
75
66
61
41
Future Mobility
Score 2021
(weighted*)
7
3
2
8
1
5
4
9
6
10
11
12
13
Rank
2021
Trend on rank
2019 vs 2021We see a 10 point average increase across car makers from
2019 to 2021
▪ Car makers’ electrification initiatives will be running on ‘full
power’ by 2021
▪ Increased pressure from competition, CO2 emission targets and
pending diesel ban in cities
▪ New cross-industry players are entering the market, e.g. Dyson.
German premium brands taking over top ranks
▪ Launch of the European high power charging initiative (creating
400 fast-charging stations) by major car makers, e.g. Ford,
BMW, Daimler and VW
▪ Clear strategy and portfolio are mission critical and being
addressed by top car makers, such as Daimler and BMW
▪ Battery know-how stays relevant, yet access to raw materials
(cobalt, lithium) and a clear value chain strategy is becoming
more important in the long-run
Tesla faces uncertainty and loses traction
▪ Strong starting position with Model S sales outperforming
Daimler S-class / BMW 7 in 2017 and a battery partnership with
Panasonic
▪ Locked in with one battery supplier limits flexibility to react to
new technology innovations and market volatility
▪ Uncertain future with regard to Model 3 production ramp-up and
profit expectations, some doubts on volumes
*Weighting see previous slide

9© PA Knowledge Limited | Confidential between PA and intended recipient
FUTURE MOBILITY PERFORMANCE SCORE – SPOTLIGHT ON GERMAN CAR MAKERS
INCREASE IS DRIVEN BY A RAMP-UP AND EXTENSION OF PRODUCT PORTFOLIOS
Future Mobility Score & key success factors 2019 vs 2021 Insights
7887
20212019
95
80
7093
93
90
Technology & Strategy
Battery Technology Supplier Network Financial Performance
Culture & Incentives Ecosystem & Partners
50
65100
87
90
80
71
88
2019 2021
93
83
95
80
93
80
69
84
2019 2021
80
90
8376
80
8765
7070
80
50
67
BMW
Daimler
VW
6390
75
8060
73
▪ Strong starting point with highest total sales of EVs and
PHEVs globally (more than 100,000) and gradual
broadening of product portfolio. However, no major
innovations until iNext in 2021.
(13 PHEV/BEV models by 2018, 12 EV models by 2025)
▪ Increased focus on the EV ecosystem through a service
portfolio and charging station installation
(e.g. car sharing, European charging initiative)
▪ Strongest raw material strategy
▪ Industry leader in profit and productivity
▪ Internal alignment and commitment to EV (CASE Business
Unit, Factory 56, Brand EQ, agile development)
▪ Full-scale electrification of all Smarts by 2020
▪ Increased focus on the EV ecosystem through a service
portfolio and charging station installation – similar to BMW
▪ Limited robustness of raw material strategy
▪ Fast acceleration and huge volume potential across multiple
brands
▪ Gradual ramp-up with 48 volt mild hybrid, 14 PHEV/BEV models
(2018) and e-platform (2019)
▪ Initial plans for in-house battery production (focus on modules
with potential for cell production), raw material strategy yet to
evolve further – need to rethink
▪ Potential investment in ECU development and production
▪ Strong board level commitment for e-mobility
▪ Sales incentives models yet to be improved
Late starter
Long-term
strategist
Joint, smart &
agile driver

10© PA Knowledge Limited | Confidential between PA and intended recipient
FUTURE MOBILITY PERFORMANCE SCORE – SPOTLIGHT ON TESLA, HYUNDAI KIA
E-MOBILITY INDEX INCREASE IS DRIVEN BY A RAMP-UP AND EXTENSION OF PRODUCT PORTFOLIOS
Insights
8182
20212019
93
90
70
95
1585
Financial Performance
Ecosystem & Partners
Supplier Network
Culture & Incentives
Battery Technology
Technology & Strategy
90
65
090 95
95
Tesla
▪ Tesla is 4 years ahead of the competition in terms of
powertrain development and is catching up on the remaining
car development
▪ Tesla is working on too many projects and business units
(cars, Hyperloop, SpaceX, Solar City,…) => focus
▪ Globalisation into China and Europe requires lots of
management attention and experience
▪ Trumps tariff policy is not in favour of Telsa’s expansion e.g.
China
▪ Tesla is suffering from a severe brain drain, lot of key
management people are leaving the firm due to the culture
▪ Tesla is a great and cool brand, but will struggle to recruit
potential automotive experts because of stable stock price
▪ Auto Industry benchmark: Appr. 6 weeks until full production
from SOP and then stable production while Tesla needed 1
full year as a minimum, and still not being stable
▪ Tesla will be profitable (Source Reuters) either at Tesla or a
new owner
Industry
Shaper
75
65
50
90
40 80
9370
49
73
80
90
Hyundai Kia
Fast follower
7972
20212019
▪ Very strong pipeline and positive platform approach to share
Hybrid, PHEV and BEV technology and models
▪ Culture and incentives does not support a very agile and high
performance culture in Europe
▪ Management of battery suppliers to be revisited; high degree
dependency on LG Chen and SK Innovation
▪ Ionic battery at lower range than E-Golf, high TCO cost
compared to peers, Kia Soul EV long charging time without
wallbox – range is impacted by heating system
▪ No visible raw material access strategy in place
▪ A limited ECO System – partnering model to be improved
▪ Financial performance in last quartile compared to peers
Future Mobility Score & key success factors 2019 vs 2021

11© PA Knowledge Limited | Confidential between PA and intended recipient
Levers
ProductDevelop the right offers fast
CustomersInspire customers & increase
sales
Supply chainRealize efficient products and
services for the customer
External
factorsDefine incentives for additional
sales
Typical questions CO2 target 2021
▪ What must the future brand / model / engine portfolio look like?
▪ Which R & D competencies will be decisive in the future?
▪ Which partnerships bring additional speed?
▪ How can the development process be more agile and development cycles be
shortened?
▪ How can the multichannel approach be optimally used?
▪ How can the customer experience of e-mobility be improved significantly?
▪ What is the optimal pricing strategy?
▪ What sales approaches and competences are required for sales of e-mobility
products?
▪ How can new drive technologies be integrated into existing plant footprint?
▪ Which competences are required in the future for the supply chain?
▪ What can strategic suppliers and partners contribute?
▪ How can the procurement of specific raw materials be ensured?
▪ Which activities support the expansion of e-mobility infrastructure?
▪ How can standardisation and the introduction of technical standards be
advanced?
▪ How can acceptance and sales be further enhanced with government and
industry cooperation?
1
99.1
CO2
Target 2021
CO2 Footprint
VW 2021
96.3
-3%
-2.8 g/km
2
3
4
Example: Volkswagen AG
CO2 TARGETS CAN BE REACHED BY 4 LEVERSSpeed and reorientation in product development and supply chain as well as increased
sales through customer focus and influencing external factors

12© PA Knowledge Limited | Confidential between PA and intended recipient
SCOPE FOR ACTIONAcross the 16 brands in Europe, 267,000 employees are redundant of which 141,000 need
to be retrained
-69,400
4,300
-51,900
39,100
-37,400
-7,100
8,000 11,600
-5,700
13,10029,000
-38,100
-57,300
35,700
116,200
220,800
21,100 20,600
75,800 83,100
293,400
Overview functions Sum
Positioning in Europe BMW, Daimler, VW, Audi,
Porsche, Volvo, Opel/PSA,
Renault, Nissan, JLR, SEAT,
SKODA, FCA, Ford,
Hyundai/Kia, Toyota
R&DSales &
After Sales ProductionPurchasing
Redundancy(Factory Realignment,
Department Realignment)
Requalification &
build up new
competencies
Topic
Sum
ca. 267,000
Sum
ca. 141,000
Sum
ca. 840,000
Engines Drive Vehicles
Inland
Vehicles
Abroad
Source: PA Research; Assumptions see Back-Up
13© PA Knowledge Limited | Confidential between PA and intended recipient
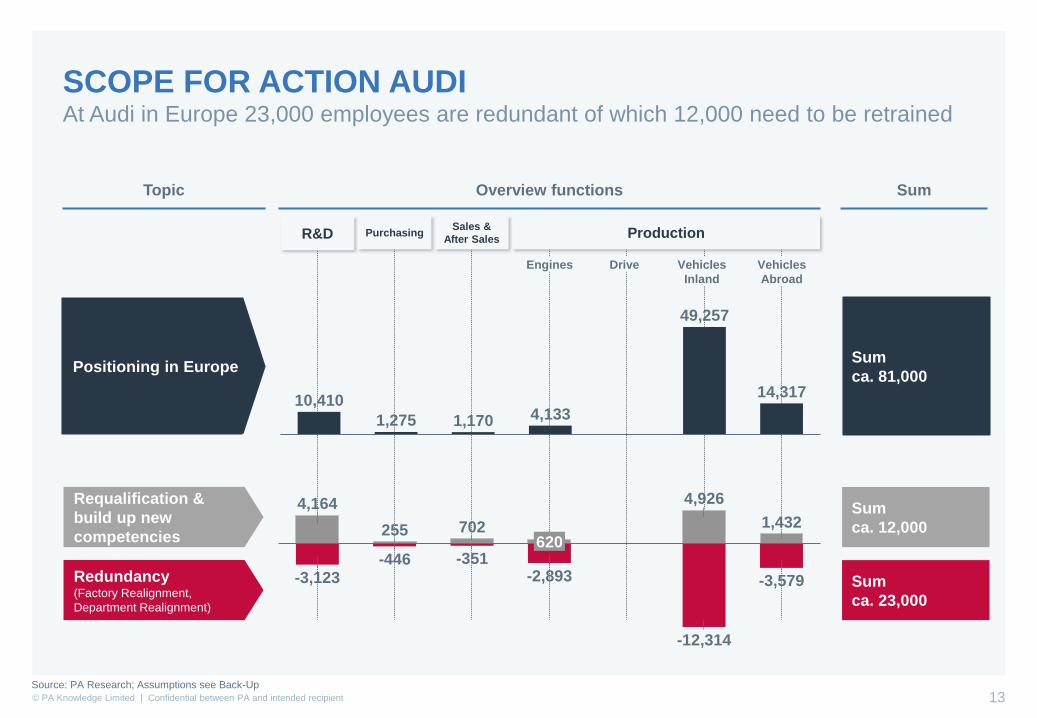
SCOPE FOR ACTION AUDIAt Audi in Europe 23,000 employees are redundant of which 12,000 need to be retrained
255 702
-446 -351620
-2,893
4,164
-3,123
4,926
-12,314
1,432
-3,579
10,410
1,1701,275 4,133
14,317
49,257
Positioning in Europe
Sum
ca. 23,000
Sum
ca. 12,000
Sum
ca. 81,000
Source: PA Research; Assumptions see Back-Up
Overview functions Sum
R&DSales &
After Sales ProductionPurchasing
Topic
Engines Drive Vehicles
Inland
Vehicles
Abroad
Redundancy(Factory Realignment,
Department Realignment)
Requalification &
build up new
competencies

14© PA Knowledge Limited | Confidential between PA and intended recipient
SCOPE FOR ACTION BMWAt BMW in Europe 21,000 employees are redundant of which 13,000 need to be retrained
450 780 480
-630 -325
-9,465
-3,300
5,2454,400
1,365
-6,435
-1,120
11,000
1,800
9,100
1,3004,800
38,100
Sum
ca. 21,000
Sum
ca. 13,000
Sum
ca. 66,000
Source: PA Research; Assumptions see Back-Up
Positioning in Europe
Overview functions Sum
R&DSales &
After Sales ProductionPurchasing
Topic
Engines Drive Vehicles
Inland
Vehicles
Abroad
Redundancy(Factory Realignment,
Department Realignment)
Requalification &
build up new
competencies

15© PA Knowledge Limited | Confidential between PA and intended recipient
SCOPE FOR ACTION DAIMLERAt Daimler AG in Europe 31,000 employees are redundant of which 17,000 need to be
retrained
300 780 470
-525 -390 -1,075
-8,250
6,520
-4,890
1,231
-4,155
4,725
-11,860
3,300
16,300
25,950
1,5004,300
1,3006,500
33,000
Sum
ca. 31,000
Sum
ca. 17,000
Sum
ca. 89,000
Source: PA Research; Assumptions see Back-Up
Positioning in Europe
Overview functions Sum
R&DSales &
After Sales ProductionPurchasing
Topic
Engines Drive Vehicles
Inland
Vehicles
Abroad
Redundancy(Factory Realignment,
Department Realignment)
Requalification &
build up new
competencies

16© PA Knowledge Limited | Confidential between PA and intended recipient
SCOPE FOR ACTION PORSCHEAt Porsche in Europe 9,000 employees are redundant of which 5,000 need to be retrained
140 200878
272
-210 -125-680
1,0502,000
-1,500
-4,095
-2,625
700 500
2,720
10,498
5,0005,850
Sum
ca. 9,000
Sum
ca. 5,000
Sum
ca. 25,000
Source: PA Research; Assumptions see Back-Up
Positioning in Europe
Overview functions Sum
R&DSales &
After Sales ProductionPurchasing
Topic
Engines Drive Vehicles
Inland
Vehicles
Abroad
Redundancy(Factory Realignment,
Department Realignment)
Requalification &
build up new
competencies

17© PA Knowledge Limited | Confidential between PA and intended recipient
SCOPE FOR ACTION VWAt VW in Europe 56,000 employees are redundant of which 30,000 need to be retrained
700
-750-4,241-4,500
-1,050
-16,681
6,0001,200 1,837
-8,573
5,147
12,647
-20,578
2,540
82,612
3,00015,000
33,700
3,50012,247 17,008
Sum
ca. 56,000
Sum
ca. 30,000
Sum
ca. 167,000
Source: PA Research; Assumptions see Back-Up
Positioning in Europe
Overview functions Sum
R&DSales &
After Sales ProductionPurchasing
Topic
Engines Drive Vehicles
Inland
Vehicles
Abroad
Redundancy(Factory Realignment,
Department Realignment)
Requalification &
build up new
competencies

18© PA Knowledge Limited | Confidential between PA and intended recipient
WALK THE TALK – E-MOBILITY TRANSFORMATION MATRIX5 ways and recommended actions for the 16 brands
CH
AN
GE
PR
ES
SU
RE
OF
TH
E O
RG
AN
IZA
TIO
N
MODEL PORTFOLIO &
PLANNING GAP
AUDI
Porsche
Ford
BMW
VW
RENAULT
VOLVO
JLR
FCA
Hyundai
Toyota
SKODA
Seat
Nissan
OPEL/PSADAIMLER
1
2
3
4
5
highlow
hig
hlo
w
Transform for Leading EdgeCar makers with ambitious electrification targets in a tight time frame currently with a
production footprint focussed to traditional drives
Way forward
Comprehensive transformation and creation of the necessary structures to cushion
redundancy and requalification needs
Maintain MomentumCar makers who are successful in the market with the first e-models and have
already built up competence and structures
Way forward
Realisation of time and knowledge advantage through know-how expansion and
scaling of today's platforms
Make or BreakCar makers whose current transformation is dominated by internal (merger) and
external drivers (Brexit)
Way forward
Linking clear electrification targets with rapid development of necessary electrification
structures and knowledge in the course of transformation
Platform AddictsCar makers whose electrification success largely depends on the transformation at
group level
Way forward
Create future-proof electrification strategy as well as group-wide connection of
structures and secure local resources
Big Sell OutCar makers who are threatened to lose their competitive position due to their
strategic orientation
Way forward
Create future-proof electrification strategy as well as group-wide connection of
structures and secure local resources
1
2
3
4
5
Source: PA Research; Assumptions see Back-Up
E-mobility Transformation Matrix

19© PA Knowledge Limited | Confidential between PA and intended recipient
DIMENSIONS: E-MOBILITY TRANSFORMATION MATRIXThe two dimensions of the E-mobility Transformation Matrix are based on a number of
selected factors
Model portfolio & planning gap
Model portfolio
&
Planning
6. Financial
Performance
1. Technology & Strategy
2. Battery Technology
3. Culture &
Incentives
4. Supplier
Network
5. Ecosystem
& Partners
30%
20%
10%15%
10%
15%
xx%weightingfactor
Change pressure of the organisation
Change pressure of the
organisation
10%10%
40%
30%
10%
1. Number of employees in
Europe
2.Redundancy
3. Requalification need
4. Avg. age ofemployees
5. Influence of unions
xx%weightingfactor

20© PA Knowledge Limited | Confidential between PA and intended recipient
ASSUMPTIONS: REDUNDANCY & REQUALIFICATION NEEDSThe two dimensions of the E-mobility Transformation Matrix are based on a number of
selected factors
Timing
Vehicles sold
Engine split /
Europe
Cost of oil
Price level / battery
Raw materials
CO2 legislation
▪ 2025-2030
▪ Increase max. 5-15%, depending
on the OEM during study scope
▪ 0-10% Diesel
▪ 30-40% BEV/PHEV
▪ 15-25% Hybrid / Mild Hybrid
▪ 3-5% CNG
▪ 20-30% petrol
▪ 1-3% fuel cell
▪ Price level / battery: from 2020 –
90-120 € / KWh (cell module,
system parts and supply chain)
▪ $60-90 / Barrel
▪ Price level 2018 after the high
increase (e.g. cobalt) at 70-100 € /
kg – assumption will be around
70-150 €/ kg during study scope
▪ Consistent until 2021; until 2025
further tightening to 81 g / km
currently in discussion (test cycle
NEDC, 67g / km in 2030)

21© PA Knowledge Limited | Confidential between PA and intended recipient
Michael Schweikl
An der Welle 3
60322 Frankfurt
+49 17155 728 42 (mobil)
YOUR CONTACT TO PA
Thomas Brand
An der Welle 3
60322 Frankfurt
+49 171 55 72 846 (mobil)