meeting overview review agenda items ◦ mineral lease ◦ personnel, capital, operating...
Post on 21-Dec-2015
224 views
TRANSCRIPT

Meeting OverviewReview Agenda Items
◦Mineral lease◦Personnel, Capital, Operating
Recommendations◦Bonds and loans ◦Academic overview◦Extension of moratorium on new
campusesInformational Items
◦Transfer◦Reporting of Dev. Ed. Exit Exams◦Out-of-state student report ◦Complete College America

Mineral Lease Funds It is recommended that $1.0 million be allocated (from
the H.E. Research Development Fund) to the University of Arkansas, Fayetteville for expenses associated with the connection and expansion of ARE-ON to all public universities in the state.
$5,103,726 has been distributed as of November of 2009

Personnel Recommendations• No exceptional line-item maximum salary increases were
considered this biennium, but all line-item maximums were adjusted by 3% per year.
• Faculty/Staff to student ratios were used to compare similar
institutions when considering requests for additional positions.
• Salary recommendations for new positions were based on salaries for similar positions previously established at comparable institutions.

Bonds and loans
Bonds◦MSCC◦UCA◦NWACC
Loan◦UACCM

Capital RecommendationsA total of $134.2 million was
recommended for all projects.
◦$68.72 million for renovation, new construction and technology infrastructure
◦$43.7 million for deferred maintenance ◦$21.9 million for equipment and library needs.

Operating Recommendations 80/20 split

Academic Overview

Transfer (Act182)--working with 4yr and 2yr CAOs

Social Science
Humanities/ Fine Arts
Math
US History/Gov’tEnglishScience
Lower Level General Education Courses: Required by major Prerequisites for major courses Required by an accrediting/licensure body
State Core 35 hrs.
Major Program RequirementsMajor Requirements:
Minimum of 30 hours with 20 hours of upper level coursework in the major.
Upper level major courses
Lower level major courses
Arkansas Baccalaureate Degree Education Requirements
Institutional general education core requirements 10-25 hrs
Minimum of 40 hours of upper level courses are required for a baccalaureate
AA/AS/AAT

Social Science
Humanities/ Fine Arts
Math
US History/Gov’tEnglishScience
Lower Level General Education Courses: Required by major Prerequisites for major courses Required by an accrediting/licensure body
State Core 35 hrs.
Major Program RequirementsMajor Requirements:
Minimum of 30 hours with 20 hours of upper level coursework in the major.
Upper level major courses
Lower level major courses
Arkansas Baccalaureate Degree Education Requirements
Institutional general education core requirements 10-25 hrsAA/AS/AAT
Minimum of 40 hours of upper level courses are required for a baccalaureate

Reporting of Dev. Ed. Exit ExamsAct 971 Starts in the FallRemedial level 3 only (last course)Only have to report scores for
students who pass (we will ignore non-passer scores)
We will report:Students in remediationStudents in level 3 remediationStudents in level 3 who passCompare student scores on exit to entrance
score

Out-of-State ad-hoc survey20% of University full-time first-time freshmen were from out-of-state in the Fall of 2009
2.4% of CC FT/FT freshmen enrolled in a two-year college were from out-of-state. 106 (52%).
1,717 (67.1%) of Univ out-of-state full-time first-time freshmen received a waiver (840 paid)
The percentage of students receiving waivers range from a low of 17.6 % to a high of 98.8%
49.4% of all university waivers of out-of-state tuition were enrolled at one University
Arkansas State Team Meeting
July 1, 2010
Arkansas Department of Higher Education

OverviewComplete College America is an
initiative aimed at increasing college completion.
CCA’s goal is to double the number of college graduates by 2020 and have asked multiple states to collaborate with each other in doing so.

“I realize that, without improvement in higher education, our economic development efforts will face enormous barriers.”
-Gov. Mike Beebe

Overview22 states participating in the
Complete College America Alliance.These states are participating
because:◦They face similar challenges.◦Goals are aligned with the strategies of
Complete College America.◦States have both the resources and
political will to bring about the changes needed to accomplish these goals.

Arkansas Student Data

Four-Year Graduation Rate
Source: National Center for Education Statistics
Out of 100 ninth-graders in Arkansas in 2003,
74 graduated in 2007.
High School Graduation
In the U.S., 74 graduated that year.
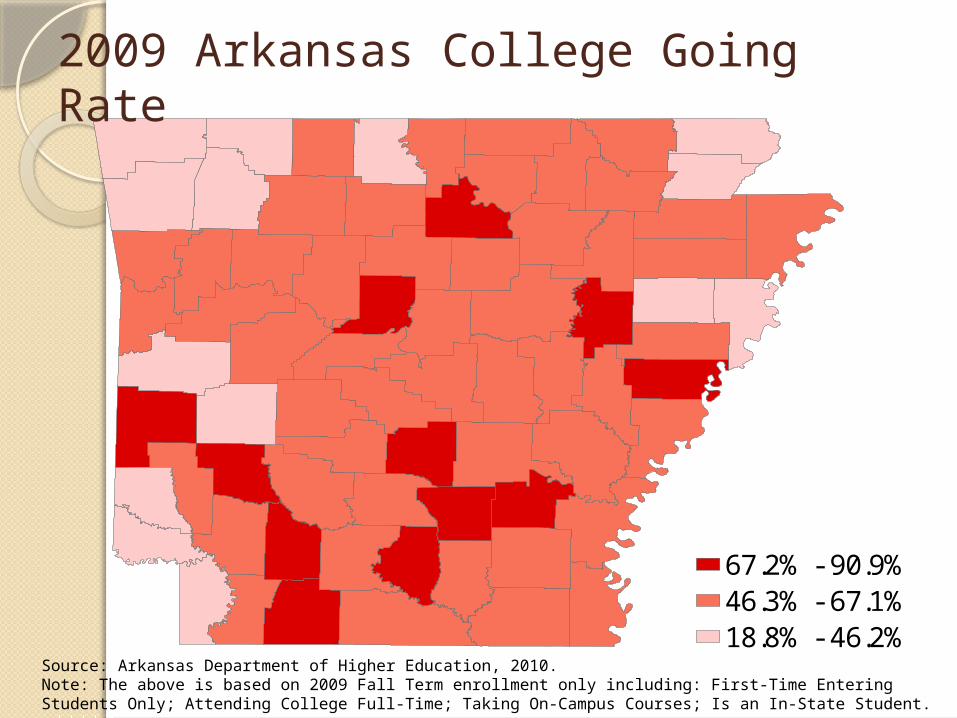
67.2% - 90.9%46.3% - 67.1%18.8% - 46.2%
2009 Arkansas College Going Rate
Source: Arkansas Department of Higher Education, 2010.Note: The above is based on 2009 Fall Term enrollment only including: First-Time Entering Students Only; Attending College Full-Time; Taking On-Campus Courses; Is an In-State Student.

67.6% - 84.3%52.9% - 67.5%34.0% - 52.8%
AY2010 Remediation In Any Subject
Source: Arkansas Department of Higher Education, 2010.Note: This is students’ legal county of residence at the time of testing; Number of students remediated = students not meeting the Freshman Assessment and Placement Standards (Act 1052 on the ACT, SAT, ASSET, or COMPASS exams).

44.4% - 67.5%31.0% - 44.3%20.7% - 30.9%
AY2010 Remediation In English
Source: Arkansas Department of Higher Education, 2010.Note: This is students’ legal county of residence at the time of testing; Number of students remediated = students not meeting the Freshman Assessment and Placement Standards (Act 1052 on the ACT, SAT, ASSET, or COMPASS exams).

40.2% - 65.1%24.4% - 40.1%6.2% - 24.3%
AY2010 Remediation In Reading
Source: Arkansas Department of Higher Education, 2010.Note: This is students’ legal county of residence at the time of testing; Number of students remediated = students not meeting the Freshman Assessment and Placement Standards (Act 1052 on the ACT, SAT, ASSET, or COMPASS exams).

54.6% - 72.6%40.0% - 54.5%23.4% - 39.9%
AY2010 Remediation In Math
Source: Arkansas Department of Higher Education, 2010.Note: This is students’ legal county of residence at the time of testing; Number of students remediated = students not meeting the Freshman Assessment and Placement Standards (Act 1052 on the ACT, SAT, ASSET, or COMPASS exams).

AR
SREB
U.S.
37%
53%
55%
Six-Year Graduation Rates in 2008for First-Time, Full-Time Freshmen Who Entered Public Four-Year Colleges and Universities in Fall 2002
Postsecondary Certificates & Degrees
Source: SREB-State Data Exchange

Current percentage of young adults (25-34) with a college degree3
3 “College degree” means an associate degree, bachelor’s degree, or higher. National Center for Higher Education Management Systems (NCHEMS), 2008 (from U.S. Census Bureau, 2008 American Community Survey Public Use Microdata Sample File.) http://www.higheredinfo.org
Ark
an
sas
Lou
isia
na
Ne
vad
aW
est
Vir
gin
iaN
ew
Me
xico
Ala
ska
Okl
ah
om
aA
rizo
na
Te
nn
ess
ee
Te
xas
Ala
ba
ma
Ke
ntu
cky
Mis
siss
ipp
iG
eo
rgia
Ida
ho
So
uth
Ca
rolin
aW
yom
ing
Flo
rid
aC
alif
orn
iaD
ela
wa
reIn
dia
na
Ma
ine
Mic
hig
an
Mo
nta
na
No
rth
Ca
rolin
aO
hio
Ore
go
nM
isso
uri
Uta
hW
ash
ing
ton
Wis
con
sin
Co
lora
do
Ha
wa
iiK
an
sas
Vir
gin
iaIll
ino
isPe
nn
sylv
an
iaR
ho
de
Isla
nd
Ne
bra
ska
So
uth
Da
kota
Ve
rmo
nt
Ma
ryla
nd
Co
nn
ect
icu
tIo
wa
Ne
w H
am
psh
ire
Ne
w Je
rse
yM
inn
eso
taN
ew
Yo
rkN
ort
h D
ako
taM
ass
ach
use
tts
10%
15%
20%
25%
30%
35%
40%
45%
50%
55%
26%
53%

U.S. SREB AR
27% 25%
19%17% 17%12%13% 14%
9%
29% 27%
20%
All Black Hispanic White
Postsecondary Certificates & Degrees
Adults With Bachelor’s Degrees or Higher 2008
Source: U.S. Census Bureau

Statewide Strategic Plan and
Alignment of CCA Plan

CCA Plan TemplateEssential Steps for States
Set State and Campus Completion Goals
Uniformly Measure Progress and Success
Shift to Performance FundingReduce Time to Degree and
Accelerate SuccessTransform RemediationRestructure Delivery for Today’s
Students
LEAD MEASURE
ACT INNOVATE

Proposed ArkansasHigher Education Strategic Plan
Degree Production• Redesign programs to meet the criteria of “Speed to Market—
Close to Customer” in a modern global society including accelerated degree programs, modular program designs, and effective use of instructional technology.
• Increase college-going rates in counties below the state average.
• Close the college achievement gap of minority students.• Increase number of adults attending/returning to college• Encourage the redesign of developmental education statewide
and provide state support for innovative programs.
Program Quality and Viability
Two-Year Colleges and Workforce Training
Research
Teacher and School Administrator Effectiveness
Stewardship of Resources and Public Trust
Six Goals

Alignment of CCA Goals and the State Strategic Plan
Complete College America Proposed State Strategic Plan Goals
Set State and Campus Completion Goals
Degree Production (Close college achievement gap & increase number of adults)
Uniformly Measure Progress and Success
Stewardship of Resources and Public Trust
Shift to Performance Funding Stewardship of Resources and Public Trust
Reduce Time to Degree and Accelerate Success
Degree Production (Redesign Academic Programs)
Transform Remediation Degree Production (Redesign Developmental Education)
Restructure Delivery for Today’s Students
Degree Production (Redesign Academic Programs and Developmental Education)

State and Campus-Level Goals

Characteristics of a Strong State Goal
Has broad support
Requires stretching
Preserves access
Has a firm deadline
Is a single, easily explained number
Serves as reference point for campus goals

TYPES OF STATE GOALS___________________________
Degree Production Goal Example:
Award 10,000 additional degrees and high-quality certificates annually by 2020.
Attainment Goal Example:
Six out of 10 young adults will have a degree by 2020.

CCA Data/Metrics Arkansas Preliminary Results

CCA Metrics
State-Level
Metrics
DEGREES AWARDED ANNUALLY
(# and change over time)
GRADUATION RATES(Full-time, Part-time, Transfer)
TRANSFER RATES(2 to 4-year
transfer)
REMEDIATION: ENTRY and SUCCESS
RETENTION RATES
TIME and CREDITS to DEGREE
(by degree type)
PROGRESS METRICS OUTCOME METRICS
Campus-Level
Metrics
DEGREES AWARDED ANNUALLY
(# and change over time)
GRADUATION RATES
(Full-time, Part-time, Transfer)
TRANSFER RATES(2 to 4-year
transfer)
REMEDIATION: ENTRY and SUCCESS
RETENTION RATES
TIME and CREDITS to DEGREE
(by degree type)
SUCCESS in FIRST-YEAR COLLEGE
COURSES
CREDIT ACCUMULATION
COURSE COMPLETION

State and Campus Completion Goals

Goal: Arkansas will reach the Southern Regional Education Board’s (SREB) average for citizens holding bachelor’s degrees by 2015.
Increase the current production of bachelor’s degrees by 64% (7,098 more graduates per year) each of the next six years to reach the SREB average.

Possible Institutional Goals(Example @ 6%)
2009 2010 2011 2012 2013 2014 2015 2016 2017 2018 2019 2020
ASUJ 1414 1499 1589 1684 1785 1892 2006 2126 2254 2389 2532 2684
ATU 973 1031 1093 1159 1228 1302 1380 1463 1551 1644 1742 1847
HSU 463 491 520 551 585 620 657 696 738 782 829 879
SAUM 370 392 416 441 467 495 525 556 590 625 663 702
UAF 2494 2644 2802 2970 3149 3338 3538 3750 3975 4214 4466 4734
UAFS 396 420 445 472 500 530 562 595 631 669 709 752
UALR 1084 1149 1218 1291 1369 1451 1538 1630 1728 1831 1941 2058
UAM 265 281 298 316 335 355 376 398 422 448 475 503
UAMS 290 307 326 345 366 388 411 436 462 490 519 551
UAPB 401 425 451 478 506 537 569 603 639 677 718 761
UCA 1532 1624 1721 1825 1934 2050 2173 2304 2442 2588 2744 2908
Private 2228 2362 2503 2654 2813 2982 3160 3350 3551 3764 3990 4229
TOTAL 11910 12625 13382 14185 15036 15938 16895 17908 18983 20122 21329 22609

Additional Graduates Needed Each Year (Example @ 6%)
2010 2011 2012 2013 2014 2015 2016 2017 2018 2019 2020
ASUJ 85 90 95 101 107 114 120 128 135 143 152
ATU 58 62 66 70 74 78 83 88 93 99 105
HSU 28 29 31 33 35 37 39 42 44 47 50
SAUM 22 24 25 26 28 30 31 33 35 38 40
UAF 150 159 168 178 189 200 212 225 239 253 268
UAFS 24 25 27 28 30 32 34 36 38 40 43
UALR 65 69 73 77 82 87 92 98 104 110 116
UAM 16 17 18 19 20 21 23 24 25 27 28
UAMS 17 18 20 21 22 23 25 26 28 29 31
UAPB 24 26 27 29 30 32 34 36 38 41 43
UCA 92 97 103 109 116 123 130 138 147 155 165
Private 134 142 150 159 169 179 190 201 213 226 239
TOTAL 715 757 803 851 902 956 1014 1074 1139 1207 1280

Discussion of CCA Plan
•Goals
•Strategies
•Outcomes