medium term debt trategy managggyement strategy period 1 period 2 period 3 period 4 period 5 overall...
TRANSCRIPT

MMEDIUMEDIUM TTERMERM DDEBTEBT SSTRATEGYTRATEGY
Maria A. OlivaSenior EconomistInternational Monetary Fundy
Note: A portion of this content appears as text within the course itself.
This training material is the property of the International Monetary Fund and is intended for use in IMF Institute for Capacity Development courses. Any reuse requires the permission of the IMF. The views expressed in this material are those of the course staff and do not necessarily represent those of the IMF or IMF policy.

Public debt managementPublic debt management
“Public debt management is the process of Public debt management is the process of establishing and implementing a strategy for managing debt to achieve the
t’ fi i i k t government’s financing, risk, cost objectives and other goals, such as developing the domestic debt market”developing the domestic debt market
Guidelines for Public Debt Management: IMF/World Bank, 2001

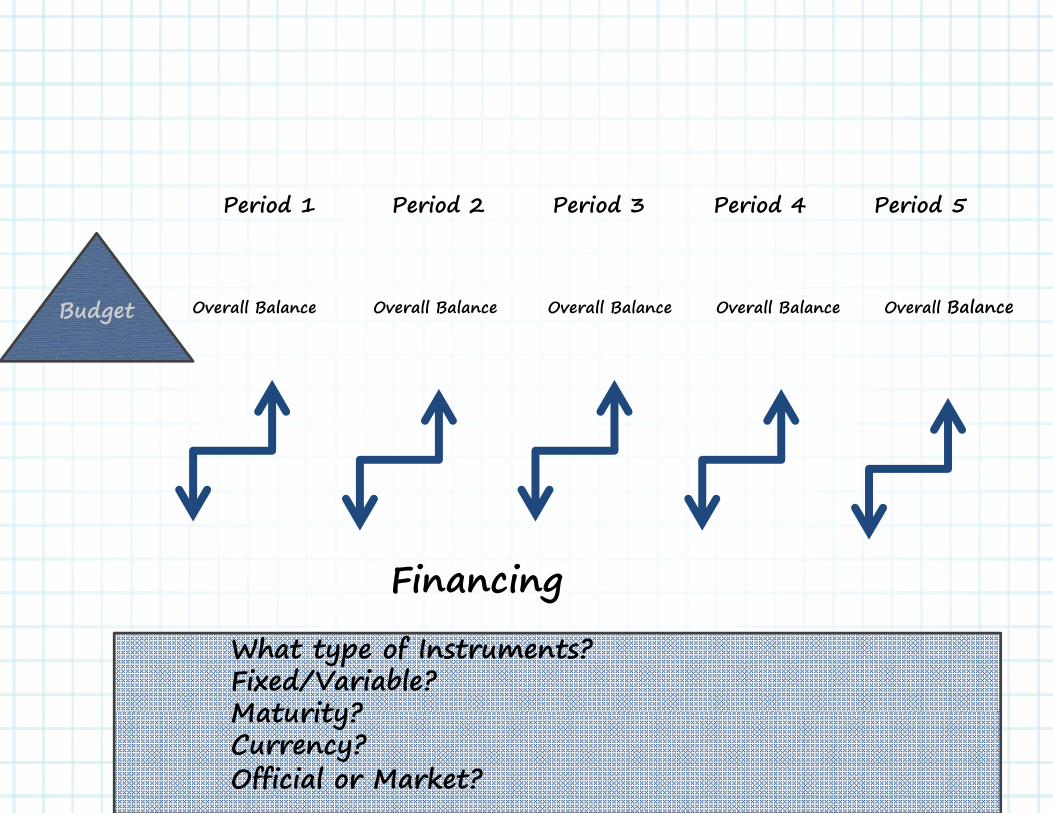
Debt Management Strategyg gy
Period 1 Period 2 Period 3 Period 4 Period 5
Overall Fiscal Overall Fiscal Overall Fiscal Overall Fiscal Overall Fiscal Overall Fiscal Overall Fiscal Overall Fiscal Overall Fiscal Overall Fiscal Balance Balance Balance Balance BalanceBudget
Financing
What type of Instruments?
Fixed/Variable? Maturity? Currency? yOfficial or Market?

• Sovereign debt management is distinct f om fiscal policy a d the DSA exe cise from fiscal policy and the DSA exercise
– Fiscal policy determines the level of public debt;
– Public debt management involves its i i i k i k
gcomposition, i.e. exposure to market risks

The Capacity to Fund the Debt Matters
2013 2014Algeria 9.8 10.2
Stock of Debt to GDP
Algeria 9.8 10.2Bahrain 35.4 39.5Djibouti 38.6 34.5Iraq 17 5 14 9
G7 2013 2014Stock of Debt to GDP
Iraq 17.5 14.9Jordan 83.8 87Kuwait 2.4 2.4
USA 106.0 107.3Japan 243.5 242.0EU 89.5 90.0
Lebanon 143.1 147.9Mauritania 98.5 83.1Qatar 33.2 30.2
Canada 87.1 85.6France 93.5 94.8Germany 80.4 78.1
Sudan 66.2 66Syria … …Tunisia 45 5 49 7
Italy 132.3 133.1UK 92.1 95.3
Tunisia 45.5 49.7West Bank & Gaza 21.7 20Yemen 48.1 50.1
Source: World Economic Outlook, http://www.imf.org/external/index.htm

Medium-term Debt Sustainability Framework (MTDS):
• Framework to design the characteristics of the sovereign debt portfolio taking into account a sovereign debt portfolio taking into account a medium-term/long-term objective.
• Framework to examine costs and risks d bl bassociated to possible borrowing strategies to
cover a financing need.

Why an Explicit Debt Management Why an Explicit Debt Management Strategy Framework??Because we need to understand
… cost-risk tradeoffs of our sovereign debt portfolio
h th iti f d bt tf li h l … how the composition of our debt portfolio can help minimize amplify the magnitude of external and domestic shocks
… how the macro affects borrowing
ff d d b… how monetary policy affects domestic debt issuance
… new risks and complexities affecting the debt portfoliop g p

The Framework: A 8 step approach
The Framework: A 8 step approachA 8-step approachA 8-step approach
Step1: Identify Objectives & Scope p fy j p
Step 2: Identify Costs & Risks of the Existing Debt
Step 3: Identify Potential Funding Sources
Step 4: Identify Baseline Projections & Risks _ fiscal, monetary & k tmarket
Step 5: Review Key Structural FactorsIF NeededIF Needed
Step 6: Identify Cost-Risk trade-offs for alternative debt management strategies
Step 7: Review Implications for macroeconomic policies and market IF NeededIF Needed
Step 8: Recommend MTDS for approval

MTDS ToolkitMTDS Toolkit
Guidance Note
Analytical tool provides generic template for quantitative analysis of costs and risks of q y f fborrowing strategies
The analytical tool is just one component of the framework.

DD MM SS DDEBTEBT MMANAGEMENTANAGEMENT SSTRATEGYTRATEGY: : TTHEHE TTOOLOOLKKITIT OOUTCOMESUTCOMES
3

Cost and Risk Indicators as of end-T0Cost a d Risk I dicators as of e d T0
Cost and Risk Indicators External debt Domestic debt Total debt
Nominal debt as % of GDP 10 4.6 14.6
Implied interest rate 1.9 3.6 2.4
Refinancing risk
ATM (years) 8.6 2.6 5.9
Debt maturing in 1yr (% of total) 4.3 75.5 36.7
ATR (years) 6.5 2.6 4.7
Debt refixing in 1yr (% of total) 30 75.5 50.7
Interest rate risk Fixed rate debt (% of total) 71.3 100 84.4
FX risk
FX debt (% of total debt) 54.5
ST FX debt (% of reserves) 7.4

R d ti P fil t TRedemption Profile at T0

Q tif i th Ch t i ti f th Quantifying the Characteristics of the Alternative Portfolios
Risk Indicators T0 As at end-T
Current S1 S2 S3 S4
N i l d b % f GDP 14 6 29 0 28 9 29 7 30 4Nominal debt as % of GDP 14.6 29.0 28.9 29.7 30.4
PV as % of GDP 12.8 21.0 24.6 24.8 31.2
Implied interest rate 2.3 2.4 2.5 3.9 5.4
Refinancing risk ATM External Portfolio (years) 12.4 18.3 14.0 17.7 16.8
ATM Domestic Portfolio (years) 4.3 3.0 3.0 2.0 3.5
ATM Total Portfolio (years) 9 7 15 8 12 2 11 7 9 8 ATM Total Portfolio (years) 9.7 15.8 12.2 11.7 9.8
Interest rate risk ATR (years) 9.6 15.6 11.6 11.6 9.7
Debt re-fixing in 1yr (% of total) 11.5 14.3 31.0 32.6 9.2
Fixed rate debt (% of total) 96.4 88.6 71.9 69.4 95.5
FX risk FX debt as % of total 66.8 83.2 83.2 61.7 46.9
ST FX debt as % of reserves 26 3 45 4 36 7 45 4 45 4 ST FX debt as % of reserves 26.3 45.4 36.7 45.4 45.4

Quantifying Refinancing Risks
Strategy 1 (S1): External borrowing accounts for 70 percent of new borrowing. Domestic b wi is stl sh t te
Strategy 2 (S2): Same external/domestic composition but less highly concessional and fixed rate loans.borrowing is mostly short-term.
800,000
1,000,000
Strategy 4
External Domestic
0
200,000
400,000
600,000
0
2017
2020
2023
2026
2029
2032
2035
2038
2041
2044
2047
2050
2053
2056
2059
2062
2065
Strategy 3 (S3): Domestic borrowing increases, especially the issuance of short-term instruments.
Strategy 4 (S4): Domestic borrowing increases, specially the issuance of 2- and 5-year fixed-rate instruments.

Quantifying Risk-Cost Trade-Offsy g
Debt/GDP (end-year T) Interest/GDP (end-year T)
PV of Public Debt to GDP Debt Service to GDPPV of Public Debt to GDP
35 37 39
Debt Service to GDP
1.2
1.4 S4
2325 27 29 31 33
Cost
(%) S4
S1
S2
0.8
1.0
1.2
Cost
(%)
S1
S2 S3
19 21 23
0.0 0.2 0.4 0.6 0.8 1.0Risk
S3
0.4
0.6
0.0 0.2 0.4 0.6 0.8 1.0Risk

h ld Y C l d ?What Would You Conclude?
• Cost-Risk trade offs vis-à-vis objectives
• The Structural Agenda

MMEDIUMEDIUM TTERMERM DDEBTEBT SSTRATEGYTRATEGYMMEDIUMEDIUM TTERMERM DDEBTEBT SSTRATEGYTRATEGYSSTEPTEP 11

The Framework: A 8 step approach
The Framework: A 8 step approachA 8-step approachA 8-step approach
Step1: Identify Objectives & Scope Step1: Identify Objectives & Scope

KKEYEY IISSUESSSUES MMAINAIN MMESSAGESESSAGESMMAINAIN MMESSAGESESSAGES
OOBJECTIVESBJECTIVESClear about:
The main goal and intermediate goals Steps to reach the goal Steps to reach the goal.
SSCOPECOPE Choosing the “appropriate” definition of “government” matters.
f d b f l lTTHEHE CCURRENTURRENTDDEBTEBT PPORTFOLIOORTFOLIO
The characteristics of the current debt portfolio is legacy that conditions future decisions.

Medium MTDS:
Framework to design the characteristics of the sovereign debt portfolio taking into account a sovereign debt portfolio taking into account a medium-term/long-term objective.
Period 1 Period 2 Period 3 Period 4 Period 5Period 1 Period 2 Period 3 Period 4 Period 5
Overall Balance Overall Balance Overall Balance Overall Balance Overall BalanceB d t Overall Balance Overall Balance Overall Balance Overall Balance Overall BalanceBudget
Financing
What type of Instruments?Fixed/Variable? Maturity? Maturity? Currency? Official or Market?

OOBJECTIVESBJECTIVESOOBJECTIVESBJECTIVES

OBJECTIVE: GO FROM A TO E
CB “Go with h idCB the tides
and wind”
D
AA
EStart: Einitial portfolio
Final Note: plans are made subject to constraints Final destination: desired portfolio
p j(navigation skills, weather conditions and forecast, ship size, etc.)

TTHEHE SSTRATEGYTRATEGYPlan that provides direction and benchmarks for debt management
Government’s medium term goals
TTHEHE FFORMALORMAL
g
Standard goals: 1 tt i i i i k/ t OOBJECTIVEBJECTIVE 1.- attaining a given risk/cost level 2 - domestic debt market
24
2. domestic debt market development

SUBJECT TO: SUBJECT TO:
CCONSTRAINTSONSTRAINTSTTHEHE REALITYREALITY &
MT Macro-economic outlook
Stock of debt
Market development Market development
Market access
25
Legal and institutional framework

SSCOPECOPESSCOPECOPE

Liabilities: Financial claims to financial sector Non-fin Liabilities: Financial claims to financial sector, Non-fin private sector and to the rest of the world
MMARKETABLEARKETABLE DEBTDEBTOO
But …..
OOTHERSTHERSLLOANSOANS
What is the relevant coverage ? Is it feasible?
Central Government, General Government, Public Government, Public Enterprises?
Should contingencies be included? If so, which ones? How should these be valued?
Explicit/Implicit guarantees

Contingent liabilities Implicit contingencies
Financial Sector (SIFIs)Financial Sector (SIFIs)
Foreign exchange in fixed ERs
Explicit contingencies
ERs
SInFIs bail outs/SOEs
Credit guarantees Natural Disasters
A d the s State insurance schemes
Legal proceedings and
And others …
g p gdisputes
• And
Sub-national debt :
On lendingothers …
On lending
Implicit Contingent liability?

MMEDIUMEDIUM TTERMERM DDEBTEBT SSTRATEGYTRATEGY: : SSTEPTEP 22SSTEPTEP 22

The Framework: A 8 step approach
The Framework: A 8 step approachA 8-step approachA 8-step approach
Step1: Identify Objectives & Scope
Step 2: Identify Costs & Risks of the Existing DebtStep 2: Identify Costs & Risks of the Existing Debt

Period t-3 Period t-2 Period t-1 Period t…. Period t 3 Period t 2 Period t 1 Period t
BudgetOverall Fiscal Overall Fiscal Overall Fiscal Overall Fiscal Overall Fiscal
Balance Balance Balance Balance Balance
Debt OutstandingDomestic and External DebtDomestic and External Debt
The sovereign debt portfolio at time t is
1
NewDebtIssued t LegacyDebtt‐1 maturity t i*Debt t‐1 g y yPrimaryBalancet ContingentLiabilities t Valuationt

Analyzing the current portfolio implies using some matrix
800,000Baseline
600,000Domestic debt
400,000
External debt
0
200,000
0
2013
2016
2019
2022
2025
2028
2031
2034
2037
2040
2043
2046
2049

Financing of Debt:Financing of Debt:d bl ff lWhat Instruments? Fixed/Variable? Maturity? Currency? Official/
Market?
Cost characteristics
Risk characteristics:
Market riskMarket risk
Refinancing risk

External debt Domestic debt Total debtRisk Indicators External debt Domestic debt Total debtRisk IndicatorsAmount (in millions of USD)Nominal debt as % GDPNPV as % of GDPCost of debt Weighted Av. IR (%)
ATM (years)
NPV as % of GDP
Debt maturing in 1yr (% of total)ATR (years)Debt refixing in 1yr (% of total)
Refinancing risk
Fixed rate debt (% of total)FX debt (% of total debt)ST FX debt (% of reserves)FX risk
Interest rate risk
ST FX debt (% of reserves)FX risk
Debt Portfolio Debt Portfolio and
Cost Measures

Defining Cost:Defining Cost:
D bt t bj ti ll f th • Debt management objectives usually focus on the economic cost
– Measures that focus exclusively on prevailing accounting/budgetary practices may also be inadequate
• Cost can be measured in different ways– Accrual, due-for-payment, cash, p y ,– Nominal versus real value– Discounted cash-flows (Present Value) versus cash-flow measures
• Different cost measures provide different information on cost - do not rely on one cost measurecost do ot rely o o e cost easure

Cost indicators? Key indicatorsCost indicators? Key indicators
• Interest cost – key for budget preparation
• Interest / GDP– captures economic burden (liquidity)
• Debt / GDP and NPV of Debt / GDP also capture extent of debt burden – also “costs” (solvency)
• Annual interest payments + the potential impact of changes in exchange rates and other changes to the changes in exchange rates and other changes to the principal (e.g. inflation indexed debt)

D bt P tf li Debt Portfolio and
Risk Measures
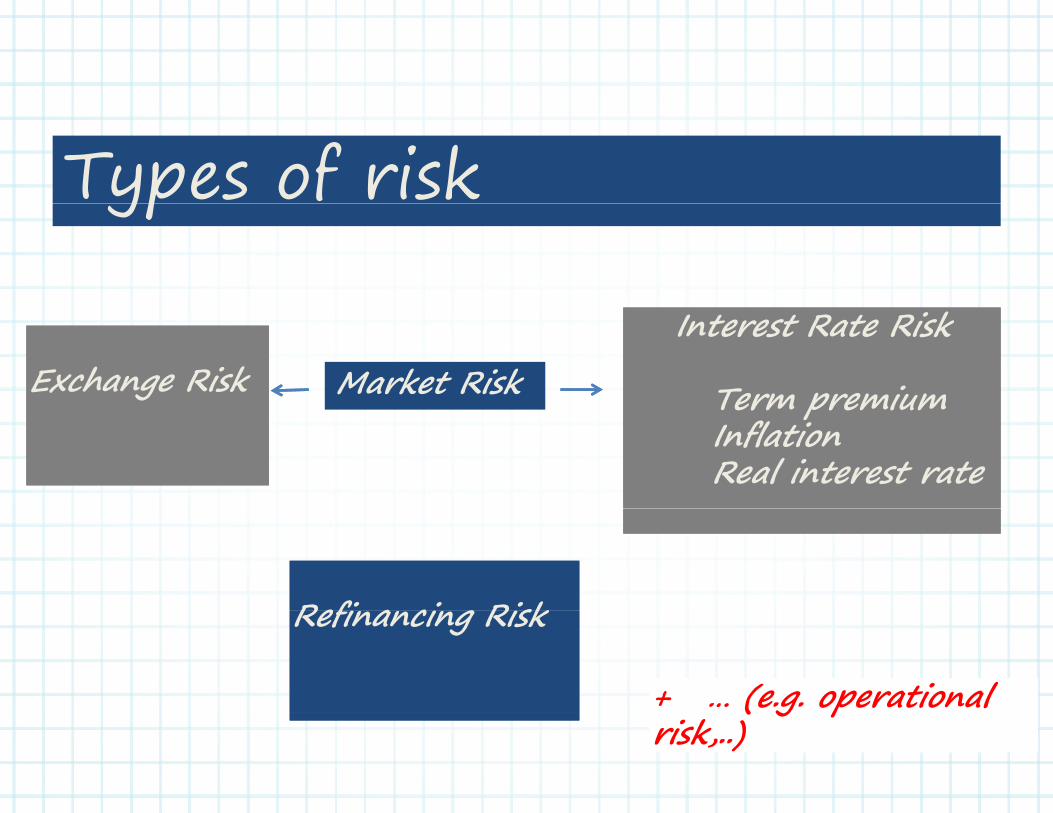
Types of riskyp
Exchange RiskExchange RiskInterest Rate Risk
Term premium
Interest Rate Risk
Term premiumMarket Risk Term premiumInflationReal interest rate
Term premiumInflationReal interest rate
Refi a ci g RiskRefi a ci g RiskRefinancing RiskRefinancing Risk
+ … (e.g. operational + … (e.g. operational ( g prisk,..)
( g prisk,..)

k i kMarket Risk
M k t i k i f ti fMarket risk is a function of
– Volatility of underlying factors (risk factors = interest and exchange rate volatility)
– Trends
Our main focus here is on downside risk

Interest rate riskInterest rate risk
Vulnerability of funding costs to higher interest rates when variable rates are reset and/or fixed rate debt needs to be refinanced
Typical measures of exposure– Fixed-Floating ratio
– Floating rate debt as a percentage of total debt
– Debt exposed to interest rate re-fixing within a specific time period • Maturing fixed rate debt to be rolled over• Maturing fixed rate debt to be rolled over• Variable rate debt (include interest rate swaps)
– Average Time to Re-fixing (ATR)
ATR = time weighted average until all principal payments in the debt portfolio become subject to a new interest rate

E h i kExchange rate risk The exposure of the portfolio to changes in the
exchange rate exchange rate
Typical measure of exposure
– Share of foreign currency debt in total debt• Can be split by specific currency (dollar risk Euro risk • Can be split by specific currency (dollar risk, Euro risk
etc.) – Currency composition
f f b– Degree of foreign currency liabilities mismatch relative to foreign currency reserves
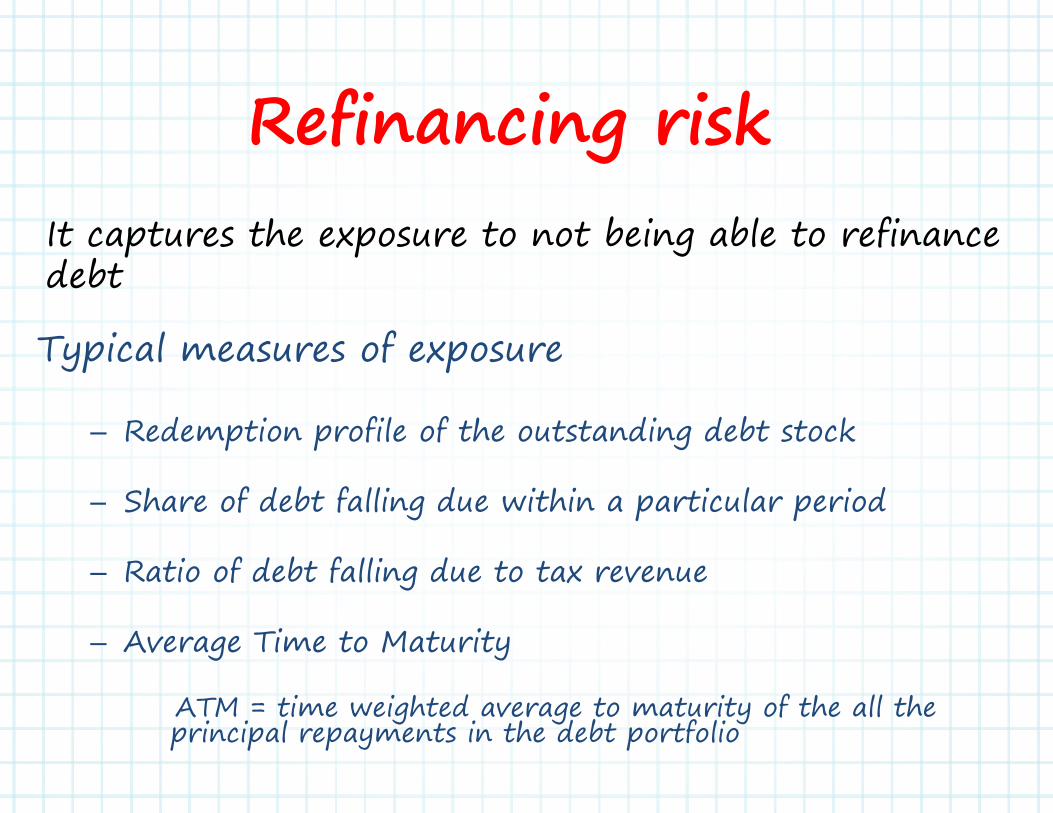
R fi i i kRefinancing riskIt captures the exposure to not being able to refinance debt
Typical measures of exposure
– Redemption profile of the outstanding debt stock
– Share of debt falling due within a particular periodShare of debt falling due within a particular period
– Ratio of debt falling due to tax revenue
– Average Time to Maturity
ATM = time weighted average to maturity of the all the ATM time weighted average to maturity of the all the principal repayments in the debt portfolio

What Can Mitigate Refinancing Risk?
Smooth debt profile Smooth debt profile
Offi i l s s s b ff f B P ds d t Official reserves as a buffer for BoP needs and to enhance confidence
bR/STD = reserves over short-term external debt
Broad creditor-base concentration
Macro-financial stability Macro-financial stability

E iExerciseLets compute the average time of maturity and refixing of the following portfolio
Principal Repayments T0 T0+1 T0+2 T0+3
Currency Indicator Type Code Years to maturity 1 2 3 4USD 1 Fix USD_1 255 100 55 60 40EUR 2 Fix EUR_2 85 40 30 10 5EUR 3 VAR EUR_3 137 25 12 80 20
Total 477 165 97 150 65
All figures are in USDg

An Indicator of Refinancing RiskAn Indicator of Refinancing RiskAverage Time to Maturity
Calculate average time to maturity
Time to maturity 1.0 2.0 3.0 4.0Principal repayments (fixed
rate only) $ 340=255+85 =100+40 =55+30 =60+10 =40+5 Principal repayments (variable
rate only) $ 137 =25+12+80+20 25 12 80 20
Total principal repayments $ 477= 340+137 165 97 150 65
0 34= 0 2= 0 31=0.34= 0.2= 0.31=
(100+40+25) / 477 (55+30+12) /477 (60+10+80) / 477
0.34= 0.41= 0.94= 0.54=
0.34*1 0.2*2 0.31*3 0.136*4
Weights of cash flow0.14= (40+5+20) /477
Weight * Time to maturity
Weighted average time to maturity (years)
2.24=
0.34+0.41+0.94+0.54
; Tt tP Pt= principal payments due
TD = total outstanding debt;0
tt TD
TD = total outstanding debtT = time to maturity

An Indicator of Interest RiskAn Indicator of Interest RiskAverage Time to Refixing Calculate average time to refixing
Time to refixing1 0 2 0 3 0 4 01.0 2.0 3.0 4.0
Principal repayments (fixed rate only) $=255+85 =100+40 =55+30 =60+10 =40+5
Principal repayments (variable rate only) $
=25+12+80+20 =25+12+80+2025 12 80 20 25 12 80 20
Total principal repayments $255+85+137 =100+40+25+12+80+20 =55+30 =60+10 =40+5
Weights of cash flow0.58=
(100+40+25+12+80+20) / 0.18= 0.146= 0.09= (40+5) / ( )(255+85+137) (55+30) / (255+85+137) (60+10) / (255+85+137)
( )(255+85+137)
Weight * Time to refixing0.58=[(100+40+25+12+80+20) /
(255+85+137)]*1
0356= [(55+30) /
(255+85+137)]*20.44 = [(60+10) / (255+85+137)]*3
0.38=[(40+5) / (255+85+137)]*4
= 1.75 Weighted average time to refixing (years)
[(100+40+25+12+80+20) / (255+85+137)]*1+[(55+30) / (255+85+137)]*2+[(60+10) / (255+85+137)]*3+[(40+5) / (255+85+137)]*4

MMEDIUMEDIUM TTERMERM DDEBTEBT SSTRATEGYTRATEGY: S: STEPTEP 33

The Framework: A 8 step approach
The Framework: A 8 step approachA 8-step approachA 8-step approach
Step1: Identify Objectives & Scope
Step 2: Identify Costs & Risks of the Existing Debt
Step 3: Potential sources of financingStep 3: Potential sources of financing

KKEYEY IISSUESSSUESKKEYEY IISSUESSSUESMMAINAIN MMESSAGESESSAGESMMAINAIN MMESSAGESESSAGES
OOPTIONSPTIONSAll types of loans carry some type of risk.IDA loans are very concessional (long maturity/low rates)
TT--SECURITIESSECURITIESNot only a source of financing but also a tool to create benchmarks
h i l h i b l h di i
benchmarks
CCOSTOST OFOF LOANSLOANSThe cost is not only the interest but also other conditions attached to them.

Potential Sources of Financing
Non-marketable
Concessional loansSemi-concessional loans Commercial loansOther non-marketable sources
MarketableMarketable
International bondi i i
51
Domestic securities

N k t bl D btNon-marketable DebtStructure Issues Cost Principal Risk
ExposureExposure
Fixed or
Size constraint; volatility and
speed of Very low cashOfficial sector loans
floating, amortizing, long-term
speed of disbursement;
may be conditions
h d
Very low cash cost; indirect
costs
FX – risk mitigated by LT
attached
Commercial Variable, bullet
Domestic,
Liquidity conditions; h lth f M k t b d
FX where l t llbank loans
,internationalShort-term
health of banking sector
(domestic)
Market based relevant; roll-over; refixing
Need efficient Uncertainty as toRetail debt Fixed or variable
Need efficient sales network.
Reliable source.
Can be competitive
Uncertainty as to quantum of
supply
Non-transparent;Other non-marketable Depends
Non transparent; hampers market
development
Cost born indirectly
Hidden costs; abuse

Marketable DebtStructure Issues Cost Principal Risk
ExposureSi l b
T-bills Discount, bullet
Simple; robust demand from banking sector
Low, except in liquidity crisis
Rollover and refinancing risk
D d
T-bondsFixed /
variable, bullet
Market development will impact demand
LT can be expensive (inflation
risk premium).
Depends on tenors achieved, may be some
rollover and refinancing Refixing ifbullet impact demand Deflation is costly. refinancing. Refixing if
variable rate.
Requires reliable index Can secure
Depends on link between inflation and
Inflation indexed
Indexation structure
index. Can secure maturity
extension. But complex
Depends on credibility of
monetary policy
between inflation and tax revenue and
likelihood of supply side shock. Reduces p
instrument. roll-over risk.
International Fixed / i bl
Large size, timing risk, Credit rating.
D d RER FX ll i kbond variable, bullet
g ,excess cash at
issuance
Depends on RER trend
FX, rollover risk

Concessional BorrowingConcessional Borrowing
L d Lenders:
Multilateral and bilateral official creditors Risk characteristicscreditors Risk characteristics
Interest rate exposure limited – typically long-term, fixed rate
Cost characteristics: Low cost –grant element 35% for multilateral rate
Exchange rate exposure –mitigated by amortizing structure
grant element 35% for multilateral
Factors that may influence the l bl structure
Rollover exposure – also mitigated by amortizing structure and nature of
amounts available
Income level Q lit f i tit ti structure, and nature of
creditor
Amount – often linked to an
Quality of institutions Access to market financingSize of multilateral balance sheet Amount often linked to an
allocation rulesheetEconomic developments

Example: Current IDA termsExample: Current IDA terms
h // ldb k /id /fi i h l55
http://www.worldbank.org/ida/financing.html

IMF Funding FacilitiesIMF Funding Facilities
IMF’s Stand By Arrangement(non-concessional)
The IMF’s Poverty Reduction and Growth Trust (concessional)

IMF loans: IMF loans: To help member countries tackle
b l f t bl balance of payments problems, stabilize their economies, and restore sustainable economic growth.
The global financial crisis
Crisis resolution role
Crisis prevention role Crisis prevention role
Detail on program conditions is publicly available:
http://www.imf.org/external/np/exr/facts/howlend.htm
Detail on program conditions is publicly available:

Semi-Concessional BorrowingSemi Concessional Borrowing
Lenders:
Multilateral and bilateral official creditors Risk characteristics:
In specific cases, these could be negotiated.Cost characteristics: at a discount to
market financing There could be Interest rate exposure - floating rate
Exchange rate exposure – mitigated by amortizing structure
market financing. There could be indirect cost [exchange rate; purchase conditions]
h i fl h by amortizing structure
Rollover exposure – similar to concessional
Factors that may influence the amounts available
F d ’ il bilit
Amount – can be linked to
Funds’ availabilityStrategic factors Economic developments
Amount can be linked to allocation rules

Commercial Bank LoansCommercial Bank Loans
Lenders:
Domestic and international banks Risk characteristics:D l
In specific cases, these could be negotiated.
Cost characteristics: At market rates (typically more expensive than
Interest rate exposure – often floating rate
Exchange rate exposure – depends
yp y pbonds, but cost of carry may be lower.)
Exchange rate exposure – depends
Rollover exposure – shorter maturityFactors that may influence the amounts available
Amount – Depends on allocated
Strategic factors Economic conditions Liquidity conditions p
credit lineLiquidity conditionsThese may be marketable –through syndication (fees increase).
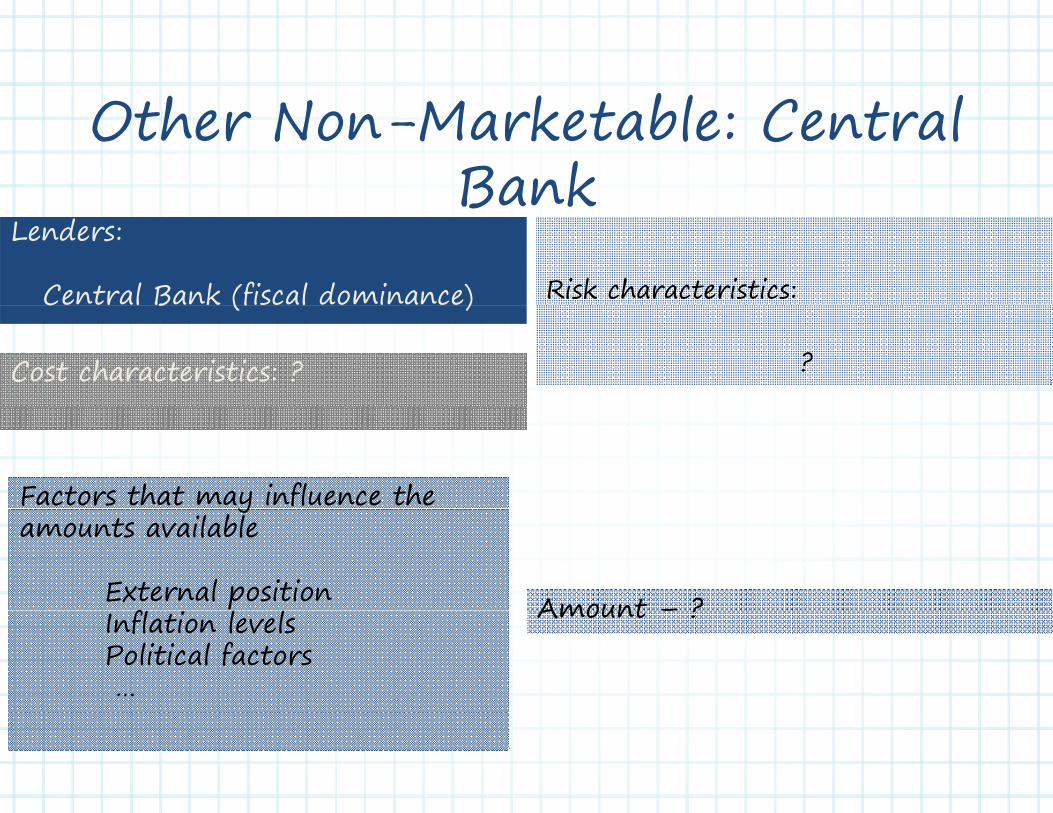
Oth N M k t bl C t l Other Non-Marketable: Central BankBank
Lenders:
Central Bank (fiscal dominance) Risk characteristics:C l B (f l )
?Cost characteristics: ?
Factors that may influence the
Amount – ?
yamounts available
External positionf Amount – ? Inflation levels
Political factors…

International Sovereign BondsInternational Sovereign Bonds
Lenders:
International and domestic institutional investors
Risk characteristics:
Rollover risk and exchange rate exposure aggravated by “bullet” investors p gg ystructure
Reflects nature of market demand
E d t “ dd t ” i
Cost characteristics:
k d i d Exposed to “sudden stops” in international capital markets
Tenors and interest rate structure ca be c stomi ed
Market determined. High transaction cost
can be customized
Possibly longer tenors than in the domestic market
Factors that may influence the amounts available
Helps diversify investor base
Amount – typically there is a
Established track record of good economic performancePositive medium-term outlookCredit rating Amount typically there is a
minimum (e.g. $200mn), maximum depends on market conditions
Credit ratingInvestors’ risk appetite/ global market conditions

Financing Environment – Debut Spreadsg p
53 500
Timeline of International Bond Issuance(in millions of US dollars)
3
4
5
2,500
3,000
3,500AfricaEastern EuropeLatin AmericaMiddle EastAsia# of issues (rhs)
1
2
3
1,000
1,500
2,000
0
1
0
500
2004 2005 2006 2007 2008 2009 2010 2011 2012 2013 (Q3)Source: Dealogic and IMF staff calculations.
Maturity(in years and percent of total issuers)
5 year 6 year 7 year 10 year
42
50
44
50
4

Financing Environment – Debut Spreads
Financial Characteristics of First-time International Sovereign Issuances (2004- December 2013)
Issue size Spread at issue
8 25
Issue size (in US$ and percent of total issuers)
up to 200 mn. 201-499 mn.500-649 mn. 650-749 mn.
33
Spread at issue(in bps and percent of total issuers)
below 200 bps. 200-299 bps.300-399 bps. 400-499 bps.
58
8
50
17
33
17
Maturity(in years and percent of total issuers)
5 year 6 year7 year 10 year
Yields at issue(in bps and percent of total issuers)
Less 4% 4%-5%5.01%-6% 6.01%-7%
42
50
29
54
Source: Dealogic;and IMF staff calculations
44
17
54
Source: Dealogic; and IMF staff calculations.

Domestic Market

Domestic Securities: T-billsDomestic Securities: T bills
dLenders: Domestic (banks, pension, insurance and
mutual funds, etc) and international investors Risk characteristics
Interest rate risk: high
Rollover riskCost characteristics:
k d i dMarket determined.
Amount – ?Factors that may influence the amounts available Others:
Economic developmentsSize of banking sectorMarket development
Useful at early stages of market development
T l t t ti i Tools to meet reserve ratios, in payment systems, etc.
Often tool of monetary policy

Domestic Securities: T-bondsDomestic Securities: T bonds
Lenders: Domestic (banks, pension, insurance and
mutual funds, etc) and international investors
Types:
Fixed d fl ti te
Cost characteristics:
Fixed and floating rate bonds Zero coupon bondsIndexed bonds
Risk characteristicsMarket determined. They usually require a risk premium.
Interest rate risk –
Rollover risk –Factors that may influence the amounts available
Exchange rate exposure –
Amount – ?
Economic developmentsSize of banking sectorMarket development Amount ?Market development

MMEDIUMEDIUM TTERMERM DDEBTEBT SSTRATEGYTRATEGY MMEDIUMEDIUM TTERMERM DDEBTEBT SSTRATEGYTRATEGY: : SSTEPSTEPS 4&54&5

The Framework: A 8 step approach
The Framework: A 8 step approachA 8-step approachA 8-step approach
Step1: Identify Objectives & Scope
Step 2: Identify Costs & Risks of the Existing Debt
Step 3: Potential sources of financing
Step 4&5 : Identifying baseline projections and risks in key policy areas—fiscal, monetary, external sectors Step 4&5 : Identifying baseline projections and risks in key policy areas—fiscal, monetary, external sectors

To develop an explicit Debt Management StrategyManagement Strategy…
There is a need to understand
• … cost-risk tradeoffs of the debt… cost risk tradeoffs of the debt
• … how debt structures can dampen or amplify the it d f t l d d ti h kmagnitude of external and domestic shocks
• … how the macro affects borrowingg
• … how monetary control helps domestic debt issuance
• … constraints: institutional, market, …
• … new risks and complexities
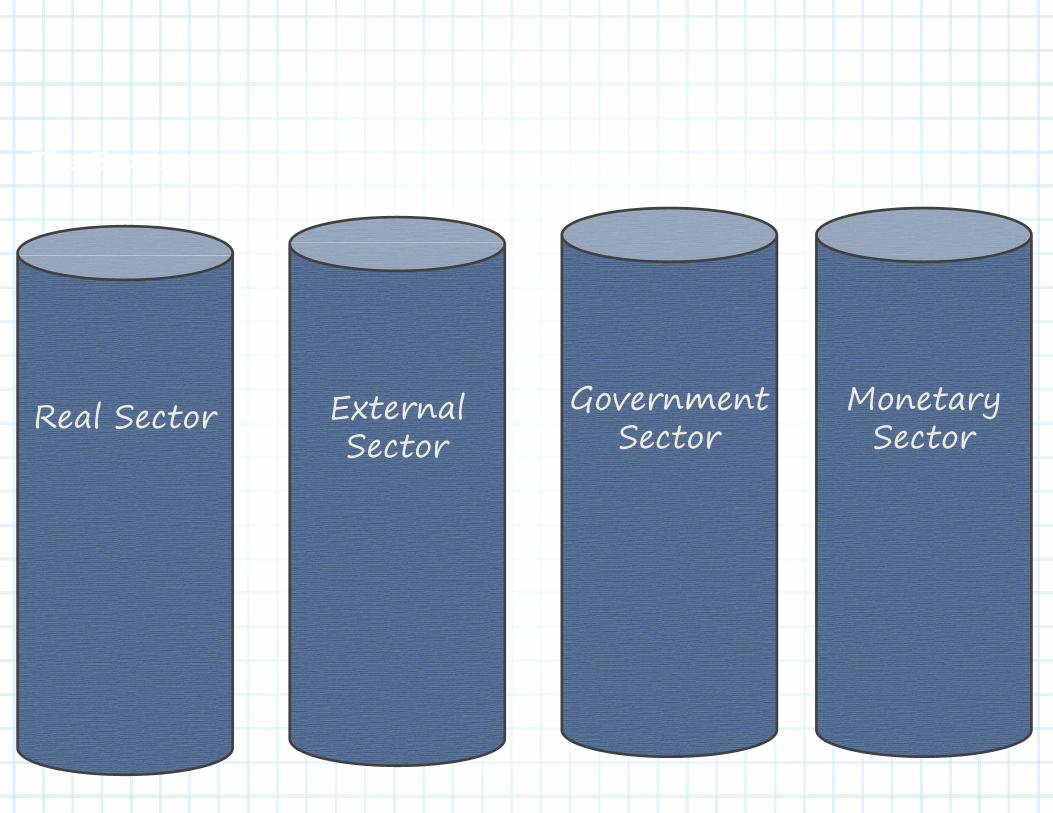
The Economy
R l S t External Government Monetary Real Sector External Sector
Government Sector
Monetary Sector
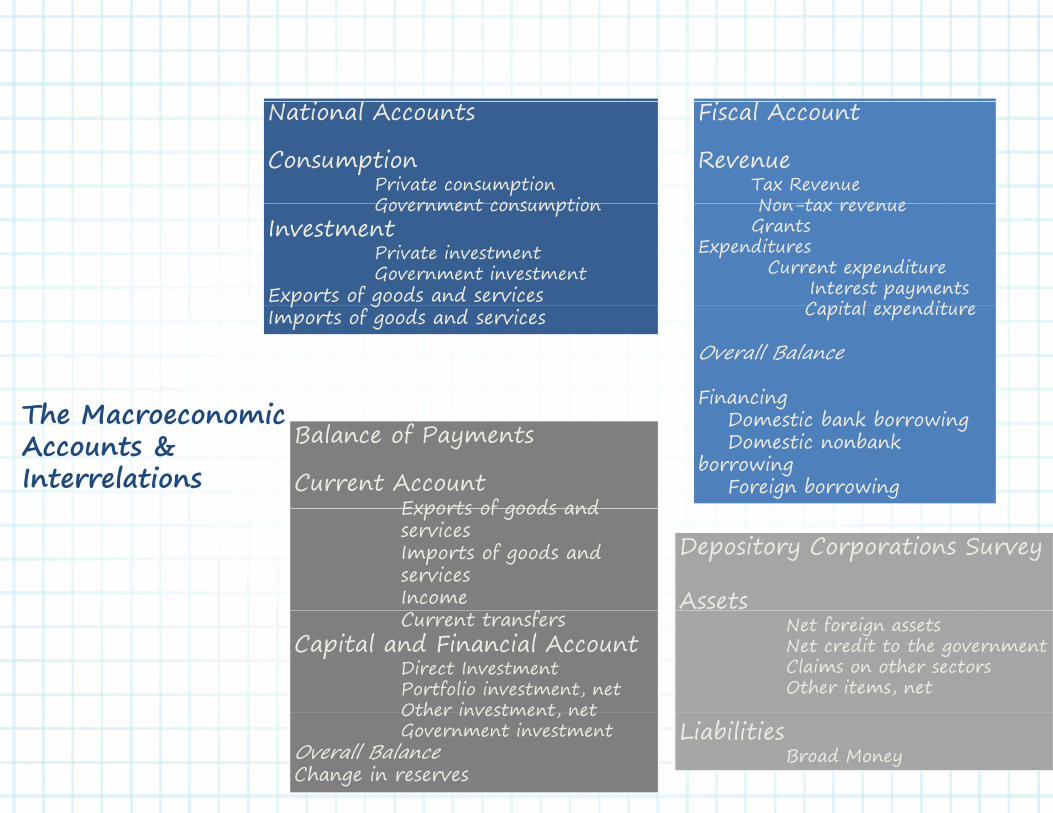
i l i lNational Accounts
ConsumptionPrivate consumptionGovernment consumption
Fiscal Account
Revenue Tax RevenueNon tax revenue Government consumption
InvestmentPrivate investmentGovernment investment
Exports of goods and services
Non-tax revenue Grants
ExpendituresCurrent expenditure
Interest paymentsC pit l xp dit
p gImports of goods and services Capital expenditure
Overall Balance
FinancingTh M i
gDomestic bank borrowingDomestic nonbank
borrowing Foreign borrowing
Balance of Payments
Current AccountExports of goods and
The MacroeconomicAccounts & Interrelations
Exports of goods and servicesImports of goods and servicesIncome
f
Depository Corporations Survey
Assets Current transfers
Capital and Financial AccountDirect Investment Portfolio investment, netOther investment net
Net foreign assets Net credit to the governmentClaims on other sectors Other items, net
Other investment, netGovernment investment
Overall Balance Change in reserves
Liabilities Broad Money

Real GDP Growth Inflation Overall fiscal Balance
(with grants)External Current
Account
(Percent)(Annual average, percent change) (Percent of GDP) (Percent of GDP)
2012 2013 (e) 2014 (p) 2012 2013 (e) 2014 (p) 2012 2013 (e) 2014 (p) 2012 2013 (e) 2014 (p)
South Sudan -47.6 24.7 43.0 45.1 2.8 7.2 -16.0 -9.0 8.1 -27.7 -14.9 8.7
Middle-income
Botswana 4.2 3.9 4.1 7.5 6.8 5.8 0.2 0.2 1.5 -4.9 -1.8 -1.2
Lesotho 4.5 4.1 5.0 5.6 6.5 6.2 5.3 2.0 2.2 -13.6 -13.6 -13.4
Namibia 5.0 4.4 4.0 6.5 6.4 6.2 -3.0 -4.2 -1.6 -2.6 -3.4 -5.2
Zambia 7.2 6.0 6.5 6.6 7.1 7.3 -3.1 -7.8 -6.6 0.0 -3.7 -3.8
Kenya 4.6 5.9 6.2 9.4 5.4 5.0 -6.3 -5.8 -4.2 -9.3 -7.8 -7.3
Malawi 1.9 5.0 6.1 21.3 26 8.4 -4.0 -2.7 -2.1 -4.4 -3.1 -5.1
Tanzania 6.9 7.0 7.2 16 8.5 5.8 -5.0 -5.3 -4.5 -15.3 -14.9 -14.1Tanzania 6.9 7.0 7.2 16 8.5 5.8 5.0 5.3 4.5 15.3 14.9 14.1
Uganda 2.8 5.6 6.5 4.4 5.2 4.8 -3.5 -1.8 -6.0 -10.5 -12.0 -13.9
Fragile countries
Zimbabwe 4.4 3.2 3.6 3.7 2.6 3.3 -0.7 -0.7 1.3 -26.2 -21.7 -16.8
Source: IMF REO (October, 2013)

180
Low Income Countries: Higher Growth Translated into Lower Debt Levels
ERI
LBR
120
140
160
DP
at t
DRC
GMBGIN
GNB
80
100
120
Deb
t to
GD
BEN BFA
BDI
KHM
CAF
TCD
COM
ETHHTI
KENKYR
MDGMWI
MLI
MOZMMR
NPLNER
RWA
SLETZA
UGA20
40
60
Aver
age
00 2 4 6 8 10 12
Average Growth Rates at t-2Average Growth Rates at t 2(In Percent)

How much (Financing Need)How much (Financing Need)Input 20132014201520162017
h
Macro
Growth rateInflation ratePrimary deficitMacro Primary deficit
DebtInterestInterest on existing debtInterest on new debt
Fiscal deficit (Net financing)( g)
DebtPrincipal repaymentPrincipal on existing debt
l d bPrincipal on new debtGross financing requirementrequirement

2013 Financing Needs (In domestic currency)2013 Financing Needs (In domestic currency)
Gross Central Government Cash Requirements 20,000
Redemptions -- Example Total Financing Need 20,000
Financing Sources 20,000
External Financing (60%) 12,000
Multilateral concessional (40%) 4 800Multilateral concessional (40%) 4,800
Bilateral concessional (30%) 3,600
Eurobonds (10%) 1,200
Commercial bank loans (20%) 2,400
MTDS
Domestic Financing (40%) 8,000
T-Bonds (60%) 4,800
T-bills (40%) 3,200

Macro-Framework
National Accounts
Consumption
Fiscal Account
Revenue ConsumptionPrivate consumptionGovernment consumption
InvestmentP i t i t t
Revenue Grants
ExpendituresCurrent expenditure
Interest paymentsCapital expenditure
MTDsPrivate investmentGovernment investment
Exports of goods and servicesImports of goods and services
Capital expenditure
Overall Balance
Financingb k b
p gDomestic bank borrowingDomestic nonbank
borrowing Foreign borrowing
Balance of Payments
Current AccountCurrent AccountExports of goods and servicesImports of goods and servicesI
Depository Corporations Survey
IncomeCurrent transfers
Capital and Financial AccountDirect Investment Portfolio investment, net
Assets Net foreign assets Net credit to the governmentClaims on other sectors
DSA
Portfolio investment, netOther investment, net
Overall Balance Change in reserves
Claims on other sectors Other items, net
Liabilities Broad Money

Key Challenges in FundingInvestor base: geographyInvestor base: geography
Local borrowingInvestor base: composition
g
I te ti l
Market borrowing
InstrumentsConditions with
Roll-over risksInternational borrowing
g
“New” bilateral official lenders
Roll-over risksFX-risk exposuresIR-risk exposures
Less concessional borrowing
IR-risk exposuresOperational risks

6
Average interest on new external
Average Yields for New External Credits Obtained by HIPCs(as percent)
38 Average Maturity of New External Debt Borrowings(in years)
4
5
gdebt commitments, official (%)
Average interest on new external debt commitments, private (%)
23
28
33
2
3
13
18 Average maturity on new external debt commitments, private (years)
Average maturity on new external debt commitments, official (years)
1
-2
3
8
1971
1973
1975
1977
1979
1981
1983
1985
1987
1989
1991
1993
1995
1997
1999
2001
2003
2005
2007
2009
2011
02003 2004 2005 2006 2007 2008 2009 2010 2011

The Structural Agenda? E l f t t l Agenda?
M k t A ?
Examples of structural factors:
Market Access?
Investor Base?Structural changes in monetary policy (inflation targeting)
Pricing?
Institutional constraints?
targeting)
Domestic debt markets development Institutional constraints? development
Price of commodities trend
Real effective exchange rate and productivity
Trade liberalization reform

Why a MTDS? Mitigating Fiscal Vulnerabilities
• Choice of strategy can reduce risks and therefore, reduce the likelihood of crisis
– Longer debt maturity helps reduce fiscal vulnerabilities: reduces roll-over risk
– More domestic funding reduces foreign exchange rate risk exposurerate risk exposure
– And, reducing variable rate debt can reduce b
gbudgetary uncertainty and exposure to interest risk

Why a MTDS? Financial Markets Development
P blic debt ma a eme t ca effecti el s pp t the • Public debt management can effectively support the development of more robust financial markets, improving the functioning of the financial system
– Facilitating corporate debt markets• Providing a benchmark for the private sector• Providing scope for securitization of banks’ assetsg p f z f
– Facilitate repo market development• Improving liquidity of banks’ balance sheetsp g q y
– Facilitate development of derivatives markets• Allowing for more effective risk management within g g
the economy

Pricing and Monetary Policy

Baseline and Monetary Policy
• Key variables: Interest and Exchange Rates
• Interest rates:
–Short-term driven by monetary policy–Nominal rates driven by inflation expectations–Monetary policy stance may influence real interest rates given the Monetary policy stance may influence real interest rates given the impact of macroeconomic stability on risk premium
• Exchange Rates:• Exchange Rates:
–Influenced by interest rates (parity equation) f f f–Relationship with foreign reserves, including a policy of foreign
reserve accumulation

THE YIELD CURVE

Yield Curve or Term Structure Plots of yields to maturity of a series of bonds against their term to maturity
Crude representation of risk: return trade off of bond investment alternatives
with reasonably equivalent risk (liquidity, credit, call, premium/discount)
Determinants:
real interest rate
Term structure in one year
inflation premium risk premium
)1()1()1()1( )1( ,13
3,12
2,11 n
nn fffii
Term structure in one year

Term Structure Shapes
NormalYTM YTM
Symptoms of economic downturn, recession
Normal
Inverse
YTM YTMThe longer maturity
the higher the risk
Term to maturity (in years) Term to maturity (in years)
Flat
Humped
YTM YTM
Term to maturity (in years)Term to maturity (in years)

L ss liq id b dsLess liquid bonds
YTM Liquid bondsq
Term to maturity (in years)Term to maturity (in years)

EXCHANGE RATE POLICY EXCHANGE RATE POLICY
• Foreign currency denominated debt
• Exchange rate regimes:
–Fixed exchange rate regimes with an open capital account can aggravate liquidity risk in case of sudden stops or reversals (changes in market sentiment)
– Reducing FX debt and monetary policy, and exchange rate policy coordination.
• FX support, public debt management coordination and FX reserves

d l li i bTo develop an explicit Debt Management StrategyManagement Strategy…
There is a need to understand
• … cost-risk tradeoffs of the debt
• … how debt structures can dampen or amplify the magnitude of external and domestic shocks
• … how the macro affects borrowing
• how monetary control helps domestic debt issuance• … how monetary control helps domestic debt issuance
• … constraints: institutional, market, …
• … new risks and complexities

They got speculative grades … with few variations from Moody’s 4
Moodys: Government Bonds Ratings, a Historical View
B1 few variations from Moody s
3B2
Foreign currencyLocal currency
… and below investment grade from S&P2B3
4
S&P: Local and Foreign Currency Ratings, An Historical Perspective to Date
B+
0
1Caa1
2
3B
B-
Ma
y-98
Ap
r-03
Se
p-0
9Ju
n-1
0D
ec-1
0Ju
n-1
2
Ma
y-07
Se
p-1
3
De
c-12
Se
p-9
8Ju
l-99
Fe
b-1
3
No
v-12
Se
p-1
3
Ma
r-98
Jun
-03
Ma
y-10
Ma
r-11
No
v-12
BOL KHM DRC GHA HND KEN MOZ NIC SEN ZMB
1
B
CCC
0 No
v-05
Ma
y-0D
ec-1
0
Jul-0
6
De
c-04
Ma
y-0
No
v-05
Se
p-0
7A
ug
-10
Oct-0
8S
ep
-09
Jun
-12
Au
g-1
3M
ay-0
Jul-0
8Ju
l-04
Ap
r-06
Au
g-1
3D
ec-1
1
No
v-05
Ma
y-0M
ay-1
De
c-12
Ma
r-1
NR…and if rated by S&P and Moody’s… 5 7 0 4 6 5 7 0 8 9 2 3 4 6 3 1 5 9 0 2 1
BRB BFR CMR GHA HND MLI MOZ RWA SEN UGAZMB
y

Ri kMacro-economic risks and
implications for the debt strategy Risksimplications for the debt strategy
Risks
For the Governme
nt Implications
for the MTDSFinances
f D
Real Sector
Real Growth Inflation
Fiscal Sector Risks Implications
Fiscal receiptsPrimary Balance
Monetary Sector
Further global economic slowdown
Reduce inflows of aid and FDI ?Decline in oil and other commodityMonetary Sector
Commodity PricesInterest rate
commodityprices?
Capital flow reversalStrains in financial markets?
Homegrown risks Political instability?

MMEDIUMEDIUM TTERMERM DDEBTEBT SSTRATEGYTRATEGY MMEDIUMEDIUM TTERMERM DDEBTEBT SSTRATEGYTRATEGY: : SSTEPSTEPS 6&76&7

The Framework: A 8 step approach
The Framework: A 8 step approachA 8-step approachA 8-step approach
Step1: Identify Objectives & Scope p fy j p
Step 2: Identify Costs & Risks of the Existing Debt
Step 3: Identify Potential Funding Sources
Step 4: Identify Baseline Projections & Risks _ fiscal, monetary & k tmarket
Step 5: Review Key Structural FactorsIF NeededIF Needed
Step 6: Identify Cost-Risk trade-offs for alternative debt management strategiesStep 6: Identify Cost-Risk trade-offs for alternative debt management strategies
IF NeededIF Needed
Step 7: Review Implications for macroeconomic policies and marketStep 7: Review Implications for macroeconomic policies and market
Step 8: Recommend MTDS for approval

Setting up alternative strategies

New debt S1 S2 S3 S4% of gross borrowing - Over Projection Period
New debt S1 S2 S3 S4IDA FX 100% 0% 20% 50%AfDF FX 0% 0% 30% 0%Bilateral semi-conc FX 0% 0% 50% 0%Bilateral semi-conc FX 0% 0% 0% 0%Bilateral semi-conc DX 0% 0% 0% 0%Bilateral semi-conc DX 0% 100% 0% 0%Eurobond FX 0% 0% 0% 0%
Are these the right st t i s? Eurobond FX 0% 0% 0% 0%
Dom 1 an DX 0% 0% 0% 25%Dom 3 ans DX 0% 0% 0% 0%Dom 5 ans DX 0% 0% 0% 25%
strategies?
Dom 7 ans DX 0% 0% 0% 0%Commercial DX 0% 0% 0% 0%Arrears FX 0% 0% 0% 0%Arrears DX 0% 0% 0% 0%Arrears DX 0% 0% 0% 0%
0 FX 0% 0% 0% 0%External 100% 0% 100% 50%Domestic 0% 100% 0% 50%
100% 100% 100% 100%

Or, are these the most reasonable strategies?
New debt S1 S2 S3 S4% of gross borrowing - Over Projection Period
New debt S1 S2 S3 S4IDA FX 19% 13% 8% 15%AfDF FX 11% 8% 5% 9%Bilateral semi-conc FX 11% 8% 5% 9%Bilateral semi-conc FX 11% 8% 5% 9%Bilateral semi-conc FX 11% 8% 5% 9%Bilateral semi-conc FX 11% 8% 5% 9%Eurobond FX 0% 0% 0% 0%Dom 1 year DX 13% 0% 14% 7%Dom 3 year DX 13% 0% 28% 13%Dom 5 year DX 0% 0% 14% 10%D 7 DX 0% 50% 14% 9%Dom 7 year DX 0% 50% 14% 9%Commercial loan DX 0% 0% 0% 0%Arrears FX 0% 0% 0% 0%Arrears DX 0% 0% 0% 0%Instrument EUR Var FX 0% 0% 0% 0%External 75% 50% 30% 60%Domestic 25% 50% 70% 40%
100% 100% 100% 100%100% 100% 100% 100%

Issues: Debt Rollover?
Many economies fit under the group of
– long-term external debt holdings and long term external debt holdings and – short-term domestic debt
The question is: could the FX risk of external debt be rebalanced using domestic market instruments?
Committed but undisbursed loans?loans?

Evaluating alternative strategies

Evaluating Strategies: d i k d ffcost and risk trade-off
• Step1: Simulate range of candidate viable and li i i d ifi b lip g
realistic strategies under specific baseline
• Step 2: Have already defined the set of p yalternative strategies and alternative scenarios –the stress tests
• Step 3: Consider and compare the outcomes
k f d d i h• Step 4: Rank performance and determine the preferred strategy

Assessing performanceAssessing performance
• Need to be critical in the assessment
Consider ex ante the possible ranking / effects of stress scenarios…
Which strategy is likely to be least costly?
What risk exposures are likely to increase with each strategy?
Do expectations differ from outcomes? If so, why?
• Need to determine in advance indicators and • Need to determine in advance indicators and cost/risk levels

Recall Cost and Risk IndicatorsRecall Cost and Risk Indicators
• Cost?
– Interest– Interest / Revenues or Interest / GDP
I t t Adj t d P i i l– Interest + Adjusted Principal– Debt / GDP
hi h l f hWhich measures are relevant for the economy?
• Risk? What is the reasonable level of risk? What is the reasonable level of risk?

Measurement of riskMeasurement of risk
Cost
Risk Scenario 1Risk1,X
Baseline Scenario Cost1,X Cost baseline
TimeTime

Borrowing Strategies
80%
100%IDA AfDF
Bilateral semi-conc Bilateral semi-conc
60%
80% Bilateral semi conc Bilateral semi conc
Bilateral semi-conc Bilateral semi-conc
Eurobond Dom 1 year
40%
Eurobond Dom 1 year
Dom 3 year Dom 5 year
Dom 7 year Commercial loan
0%
20%Dom 7 year Commercial loan
Arrears Arrears
Instrument EUR Var0%Current S1 S2 S3 S4
Instrument EUR Var

Outcomes: Interest / Revenues
0 7
S2S3
S40.5
0.6
0.7
%)
S1S4
0.2
0.3
0.4
Cost
(%
-
0.1
- 0.01 0.01 0.02 0.02 0.03 0.03 Risk
N l t d ff S1 l l l t t d l t i kNo real trade-off: S1 clearly least cost and least risk

250,000Strategy 1 External Domestic
500,000Strategy 2 External Domestic
100,000
150,000
200,000
200,000
300,000
400,000
0
50,000
2018
2021
2024
2027
2030
2033
2036
2039
2042
2045
2048
2051
2054
2057
2060
2063
2066
0
100,000
2018
2021
2024
2027
2030
2033
2036
2039
2042
2045
2048
2051
2054
2057
2060
2063
2066
2 2 2 2 2 2 2 2 2 2 2 2 2 2 2 2 2 2 2 2 2 2 2 2 2 2 2 2 2 2 2 2 2 2
350,000400,000450,000
Strategy 3 External Domestic
250,000
300,000Strategy 4 External Domestic
100,000150,000200,000250,000300,000
100,000
150,000
200,000
050,000
100,000
2018
2021
2024
2027
2030
2033
2036
2039
2042
2045
2048
2051
2054
2057
2060
2063
2066
0
50,00020
1820
2120
2420
2720
3020
3320
3620
3920
4220
4520
4820
5120
5420
5720
6020
6320
66

Risk Indicators 2013 As at end FY2017Current S1 S2 S3 S4
Nominal debt as % of GDP 17.6 13.3 13.9 14.0 13.6
PV as % of GDP 17.3 11.1 12.6 13.0 11.9
Implied interest rate (%) 3.6 2.6 4.2 4.4 3.3Refinancing risk ATM E t l P tf l i ( ) 7 7 16 5 15 7 15 6 16 2Refinancing risk ATM External Portfolio (years) 7.7 16.5 15.7 15.6 16.2
ATM Domestic Portfolio (years) 2.3 2.7 4.5 3.2 3.4ATM Total Portfolio (years) 3.2 14.6 10.2 8.4 12.1
Interest rate risk ATR (years) 3.2 13.2 9.4 7.8 11.0(y )Debt refixing in 1yr (% of total) 29.9 19.8 10.0 20.7 17.9Fixed rate debt (% of total) 99.8 88.3 93.5 94.9 91.0
FX risk FX debt as % of total 15.5 85.8 51.0 42.0 67.6d b % fST FX debt as % of reserves 6.9 22.1 18.9 17.0 20.3

Other relevant indicators?Other relevant indicators?
• Can compare ….
Current S1 S2 S3 S4End-Simulation Horizon (2017)
% DX in debt portfolio 1% 30% 27% 39%ATM (years) 15.6 13.0 9.3 8.3% of debt refixing within 12 months 6.2% 24.4% 23.6% 33.0%% f d bt fi i ithi 12 th 5 5% 31 4% 28 6% 34 7%% of debt refinancing within 12 months 5.5% 31.4% 28.6% 34.7%Short-term external debt / Reserves 3% 3% 3% 3%External debt / Reserves 102% 81% 91% 78%Average interest rate 2.4% 2.5% 2.6% 2.8%Average interest rate 2.4% 2.5% 2.6% 2.8%

Stress Scenarios …2013 2014 2015 2016 2017
Baseline FX depreciation USD 0.2% 0.4% 0.5% 0.4% 0.4%EUR 0.0% 0.0% 0.0% 0.0% 0.0%JPK 0.1% 0.3% 0.4% 0.3% 0.3%GBP 2 9% 3 1% 3 2% 3 2% 3 1%GBP 2.9% 3.1% 3.2% 3.2% 3.1%CNYUTP 0.0% 0.0% 0.0% 0.0% 0.0%
2013 2014 2015 2016 201730% depreciation in year 2 (stand-alone exchange rate shock)
30.00% USD 0.2% 30.4% 0.5% 0.4% 0.4%EUR 0.0% 0.0% 0.0% 0.0% 0.0%JPK 0.1% 0.3% 0.4% 0.3% 0.3%GBP 2.9% 3.1% 3.2% 3.2% 3.1%CNY 0.0% 0.0% 0.0% 0.0% 0.0%
% % % % %UTP 0.0% 0.0% 0.0% 0.0% 0.0%
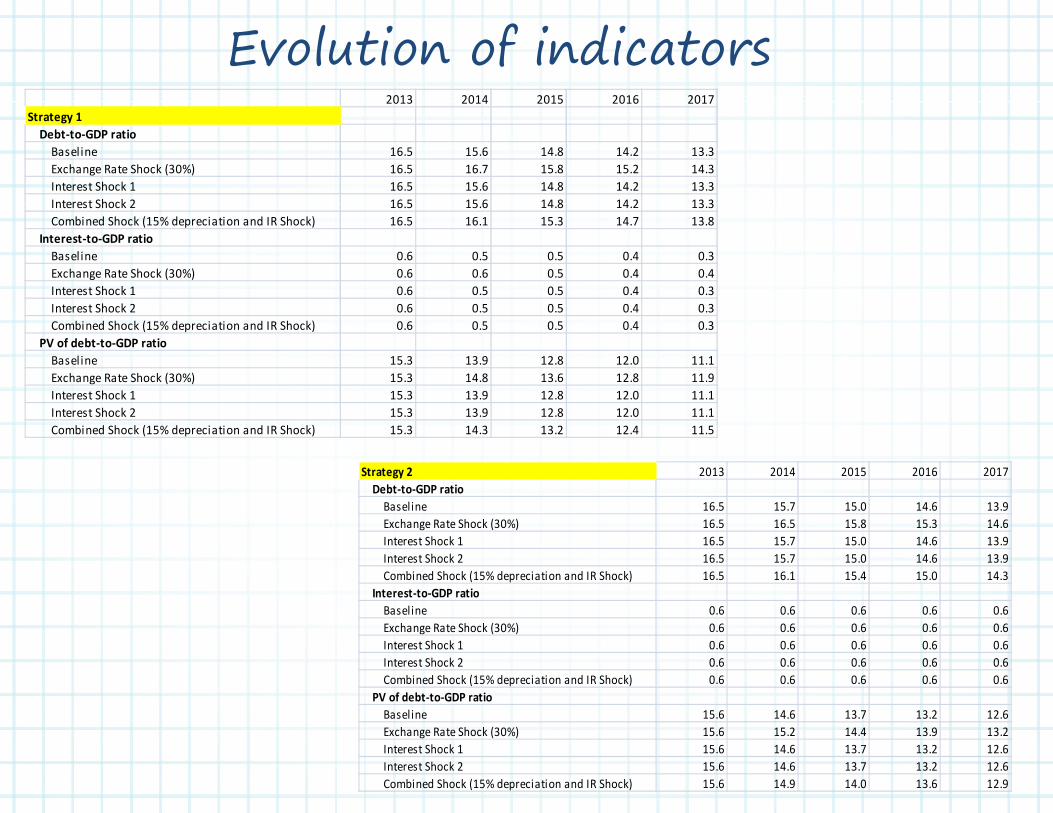
Evolution of indicators2013 2014 2015 2016 20172013 2014 2015 2016 2017
Strategy 1Debt-to-GDP ratio
Baseline 16.5 15.6 14.8 14.2 13.3Exchange Rate Shock (30%) 16.5 16.7 15.8 15.2 14.3Interest Shock 1 16.5 15.6 14.8 14.2 13.3Interest Shock 2 16 5 15 6 14 8 14 2 13 3Interest Shock 2 16.5 15.6 14.8 14.2 13.3Combined Shock (15% depreciation and IR Shock) 16.5 16.1 15.3 14.7 13.8
Interest-to-GDP ratioBaseline 0.6 0.5 0.5 0.4 0.3Exchange Rate Shock (30%) 0.6 0.6 0.5 0.4 0.4Interest Shock 1 0.6 0.5 0.5 0.4 0.3I t t Sh k 2 0 6 0 5 0 5 0 4 0 3Interest Shock 2 0.6 0.5 0.5 0.4 0.3Combined Shock (15% depreciation and IR Shock) 0.6 0.5 0.5 0.4 0.3
PV of debt-to-GDP ratioBaseline 15.3 13.9 12.8 12.0 11.1Exchange Rate Shock (30%) 15.3 14.8 13.6 12.8 11.9Interest Shock 1 15.3 13.9 12.8 12.0 11.1
Strategy 2 2013 2014 2015 2016 2017Debt-to-GDP ratio
Baseline 16 5 15 7 15 0 14 6 13 9
Interest Shock 2 15.3 13.9 12.8 12.0 11.1Combined Shock (15% depreciation and IR Shock) 15.3 14.3 13.2 12.4 11.5
Baseline 16.5 15.7 15.0 14.6 13.9Exchange Rate Shock (30%) 16.5 16.5 15.8 15.3 14.6Interest Shock 1 16.5 15.7 15.0 14.6 13.9Interest Shock 2 16.5 15.7 15.0 14.6 13.9Combined Shock (15% depreciation and IR Shock) 16.5 16.1 15.4 15.0 14.3
Interest-to-GDP ratioBaseline 0 6 0 6 0 6 0 6 0 6Baseline 0.6 0.6 0.6 0.6 0.6Exchange Rate Shock (30%) 0.6 0.6 0.6 0.6 0.6Interest Shock 1 0.6 0.6 0.6 0.6 0.6Interest Shock 2 0.6 0.6 0.6 0.6 0.6Combined Shock (15% depreciation and IR Shock) 0.6 0.6 0.6 0.6 0.6
PV of debt-to-GDP ratioB li 15 6 14 6 13 7 13 2 12 6Baseline 15.6 14.6 13.7 13.2 12.6Exchange Rate Shock (30%) 15.6 15.2 14.4 13.9 13.2Interest Shock 1 15.6 14.6 13.7 13.2 12.6Interest Shock 2 15.6 14.6 13.7 13.2 12.6Combined Shock (15% depreciation and IR Shock) 15.6 14.9 14.0 13.6 12.9

Evolution of indicatorsStrategy 3 2013 2014 2015 2016 2017Strategy 3 2013 2014 2015 2016 2017
Debt-to-GDP ratioBaseline 16.5 15.7 15.0 14.7 14.0Exchange Rate Shock (30%) 16.5 16.3 15.6 15.2 14.6Interest Shock 1 16.5 15.7 15.0 14.7 14.0Interest Shock 2 16.5 15.7 15.0 14.7 14.0Combined Shock (15% depreciation and IR Shock) 16.5 16.0 15.3 15.0 14.3( p )
Interest-to-GDP ratioBaseline 0.6 0.6 0.6 0.6 0.6Exchange Rate Shock (30%) 0.6 0.6 0.6 0.6 0.6Interest Shock 1 0.6 0.6 0.6 0.6 0.6Interest Shock 2 0.6 0.6 0.6 0.6 0.6Combined Shock (15% depreciation and IR Shock) 0.6 0.6 0.6 0.6 0.6
PV of debt-to-GDP ratioBaseline 15.9 14.9 14.1 13.6 13.0Exchange Rate Shock (30%) 15.9 15.4 14.7 14.1 13.4Interest Shock 1 15.9 14.9 14.1 13.6 13.0Interest Shock 2 15.9 14.9 14.1 13.6 13.0Combined Shock (15% depreciation and IR Shock) 15.9 15.2 14.4 13.9 13.2
Strategy 4Debt-to-GDP ratio
Baseline 16.5 15.6 14.9 14.4 13.6Exchange Rate Shock (30%) 16 5 16 6 15 8 15 2 14 4Exchange Rate Shock (30%) 16.5 16.6 15.8 15.2 14.4Interest Shock 1 16.5 15.6 14.9 14.4 13.6Interest Shock 2 16.5 15.6 14.9 14.4 13.6Combined Shock (15% depreciation and IR Shock) 16.5 16.1 15.3 14.8 14.0
Interest-to-GDP ratioBaseline 0.6 0.6 0.5 0.5 0.4Exchange Rate Shock (30%) 0.6 0.6 0.5 0.5 0.5Interest Shock 1 0.6 0.6 0.5 0.5 0.4Interest Shock 2 0.6 0.6 0.5 0.5 0.4Combined Shock (15% depreciation and IR Shock) 0.6 0.6 0.5 0.5 0.5
PV of debt-to-GDP ratioBaseline 15.5 14.3 13.3 12.6 11.9Exchange Rate Shock (30%) 15.5 15.0 14.0 13.3 12.6Interest Shock 1 15.5 14.3 13.3 12.6 11.9Interest Shock 2 15.5 14.3 13.3 12.6 11.9Combined Shock (15% depreciation and IR Shock) 15.5 14.7 13.7 13.0 12.2

Resolving a conflict between indicators?
• Consider wider set of indicators?
• Consider more closely how well the strategies meet other objectives meet other objectives
• Consider how they perform relative to identified • Consider how they perform relative to identified priorities for mitigate macro vulnerabilities
• At the end of the day … need to use judgment

Implied Issuance Patterns
Is this viable? (Average over simulation) S1 S2 S3 S4Net external borrowing 2 3% 1 3% 1 0% 1 8%
Implied net borrowing (% of GDP)
How realistic are the strategies being analyzed?
Net external borrowing 2.3% 1.3% 1.0% 1.8%Net domestic borrowing -1.9% -0.8% -0.4% -1.3%External net borrowing 2013 2014 2015 2016 2017S1 3.9% 2.8% 2.2% 1.8% 1.1%
analyzed?
What do these
S2 2.5% 1.5% 1.2% 0.8% 0.4%S3 1.5% 1.1% 0.9% 0.9% 0.6%S4 3.1% 2.1% 1.6% 1.5% 0.8%D ti t b i 2013 20 20 20 6 20 What do these
decisions imply for the rest of the economy?
Domestic net borrowing 2013 2014 2015 2016 2017S1 -3.3% -2.3% -1.7% -1.5% -0.8%S2 -2.0% -0.9% -0.6% -0.3% 0.1%S3 -0.9% -0.5% -0.2% -0.4% 0.0%
Is this compatible with the monetary policy stance?
S3 0.9% 0.5% 0.2% 0.4% 0.0%S4 -2.5% -1.5% -1.1% -1.1% -0.4%
p y

Drawing conclusionsDrawing conclusions
Q tit ti e t ls help i f decisi ki • Quantitative tools help inform decision-making process by allowing producing a ranking of candidate strategies on a consistent basisg
• However,
The quality of outputs is only as good as th lit f th i tthe quality of the inputs
Decisions need to be made in line with Decisions need to be made in line with the pre-set objectives and take constrains into account

MMEDIUMEDIUM TTERMERM DDEBTEBT SSTRATEGYTRATEGY MMEDIUMEDIUM TTERMERM DDEBTEBT SSTRATEGYTRATEGY: : SSTEPTEP 88

OUTLINEOUTLINEKKEYEY IISSUESSSUES MMAINAIN MMESSAGESESSAGESMMAINAIN MMESSAGESESSAGES
IIMPLEMENTATIONMPLEMENTATIONDefining financing plan in line with budgetary cash needs
Issuance plan
MMONITORINGONITORING
ssua e p a
Impact on key targetsMeet?
Developing/improving risk management system.
Meet?
“S“STRUCTURALTRUCTURAL” ” REFORMSREFORMS
Developing/improving risk management system. Market development objectivesInvestor base relation

Developing a consistent borrowing planDeveloping a consistent borrowing plan

After choosing a DMS….l iImplementation
• What is the annual financing plan that is consistent with the selected strategy?consistent with the selected strategy?
• Are there other portfolio management activities p gthat are needed to attain the portfolio targets? (e.g. derivatives?)
• How is the monitoring of implementation going to be applied? And if there are deviations how to be applied? And, if there are deviations, how are these going to be addressed?

The Financing Plan

H D th Fi i Pl f th How Does the Financing Plan for the Next Budgetary Cycle Look Like? g
D t i th ss b i ds f h t p • Determine the gross borrowing needs for each type of instrument to cover
expected budgetary needs roll over needs/amortization needs /
• Are these consistent with the debt strategy? gy
• Borrowing plan. What is the timing?

2013 Financing Needs (In domestic currency)
Gross Central Government Cash Requirements 20,000Redemptions --Total Financing Need 20,000
Financing Sources 20,000
External Financing (60%) 12,000
Multilateral concessional (40%) 4,800 Bilateral concessional (30%) 3,600 Eurbonds (10%) 1,200 Commercial bank loans (20%) 2,400
Domestic Financing (40%) 8,000T-Bonds (60%) 4,800 T-bills (40%) 3,200

Timing Issues and program design
The debt program needs to be consistent with the cash management program management program.
Calendar of issuances. Quarterly?
Inputs: revenue & spending (including debt service) programming
l f d b lLevel of deposits, TSA balancesProgrammed grants/loans disbursements

Ministry of Finance
Tax and spending Tax and spending data Fiscal position
forecasts il h fl
Back Office Middle Front Daily cash flowsDefines debt and cash
management policy Debt manager
Office Office
policy gBorrowing to meet medium/long term needsDeveloping secondary marketI terfaces to i vestor base a d Interfaces to investor base and creditors
Central Bank
Government’s banker
Key Relationships: Need for Prompt Updates
Manages monetary policyUpdates

Key Relationships
Ministry of Finance
Tax and spending Tax and spending data Fiscal position
forecasts il h fl
Back Office Middle Front Daily cash flowsDefines debt and cash
management policy Debt manager
Office Office
policy gBorrowing to meet medium/long term needsDeveloping secondary marketI terfaces to i vestor base a d Interfaces to investor base and creditors
Central Bank
Government’s banker
Manages monetary policy

Filling the Domestic and External Borrowing Plans: Filling the Domestic and External Borrowing Plans: Consistency
External Borrowing: Options
Official sector flowsDomestic Borrowing:
Options Official sector flows Access to market sources Financing from reserves
f
Options
Marketable debt Instruments Financing secured from FX
market Postponing spending plans
Overdraft facilities Non-marketable instruments Pre funding p p p Pre-funding
Issues Difficult to forecast the Issues Difficult to forecast the
timing of disbursements Need for sterilization, bridge
fi i
Issues Market development
objectivesfinancing?
Identifying the matching liability
j
Fiscal dominance?

Examples

Example of an Issuance Plan:• Target balance on TSA?
• Target bond financing: 4,500Target bond financing: 4,500
• Market development considerations
–Regular issuance: Bonds are auctioned on a Friday.
–Standard amounts: Minimum size of an auction is 150, Standard amounts: Minimum size of an auction is 150, maximum is 400, increments of 25
– Frequency: Maximum frequency of every two weeksq y q y y
– Seasonal factors: No auctions are scheduled in August or December
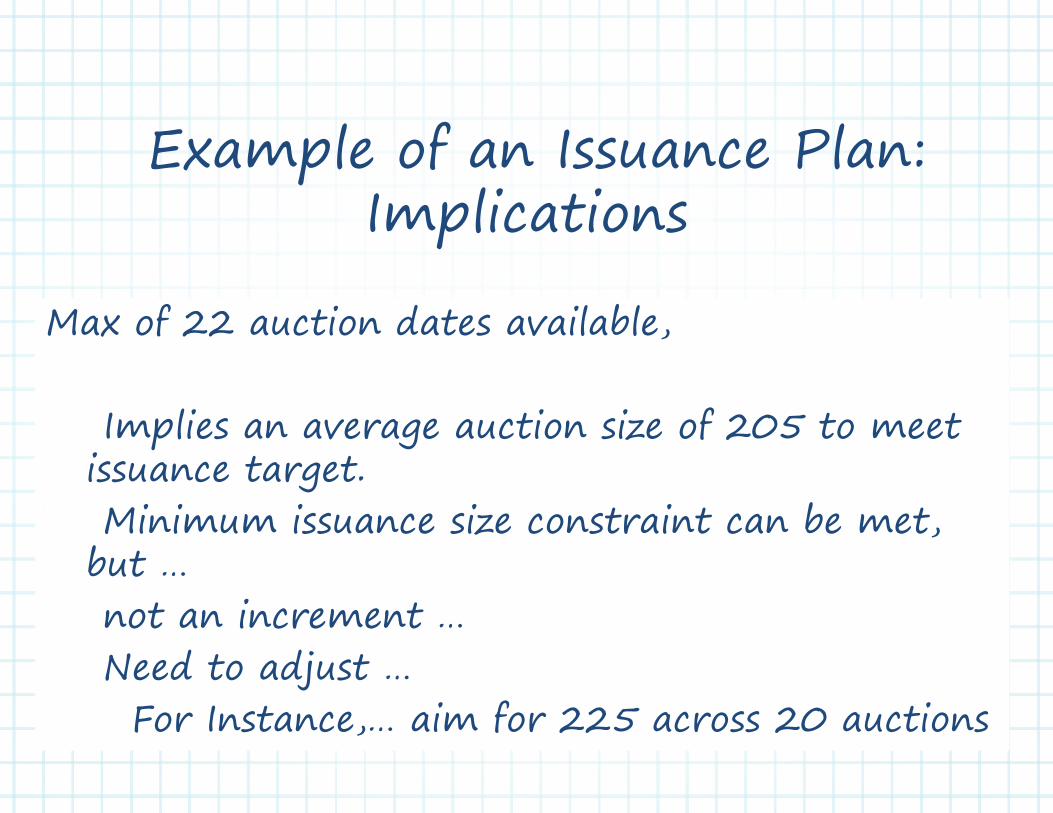
Example of an Issuance Plan: Implicatio sImplications
f d l blMax of 22 auction dates available,
Implies an average auction size of 205 to meet issuance target. Mi i i i t i t b t Minimum issuance size constraint can be met,
but …not an increment not an increment … Need to adjust … F I sta ce ai f 225 ac ss 20 a cti sFor Instance,… aim for 225 across 20 auctions

Example:
The French Calendar
for Domestic Debt for Do estic Debt
Issuances
http://www.aft.gouv.fr/articles/monthly-auction-calendar_669.html

26W T BILLS 13W T BILLS
LATEST T-BILLS AUCTION RESULTS
26W T-BILLS 13W T-BILLS
AUCTION DATE 5-Nov-13 12-Νov-13ISSUE DATE 8-Nov-13 15-Nov-13
MATURITY DATE 9 M 14 14 F b 14MATURITY DATE 9-May-14 14-Feb-14
AMOUNT AUCTIONED 1,000,000,000 1,000,000,000
TOTAL BIDS 1,860,000,000 2,025,000,000
b l
COMPETITIVE BIDS 1,560,000,000 1,725,000,000
NON-COMP. BIDS 300,000,000 300,000,000
COVERAGE RATIO 1.86 2.03
Greece: November 2013 ResultsTOTAL ACCEPT. AMNT 1,300,000,000 1,300,000,000
UNIFORM YIELD 4.15% 3.90%
CUT-OFF PRICE 97.945 99.024CUT OFF PRICE 97.945 99.024
CUT-OFF RATIO 71.60% 90.90%
SECOND DAY BIDS
AUTHORIZED AMNT 300 MLN EURO 300 MLN EURO
EXERCISED AMNT 300 MLN EURO 300 MLN EURO
http://www.pdma.gr/index.php/en/

Spain Tesoro Público funding in 2011 Forecast(in Bn Euros) Forecast 2 0 1 0 Forecast 2 0 1 1 2012
Jan-10 Close Jan-11 Close Strategy
Funding requirement (=Net Issuance) 76 8 62 1 47 2 48 2 36 8Funding requirement (=Net Issuance) 76.8 62.1 47.2 48.2 36.8Redemptions of long-term bonds and loans* -35.4 -35.8 -46.6 -47.1 -50.1Net issuance of long-term bonds and loans* 61.6 58.7 47.2 48.6 35.8Gross issuance of long-term bonds and loans* 97 94.5 93.8 95.6 85.9Net increase in Letras del Tesoro outstanding 15.2 3.4 0 -0.4 1Net change in outstanding Central Government Debt** 78.3 65.2 47.2 51.5 36.8Central Government Debt outstanding at year-end** 553.5 540.6 588 592.1 628.9
*Including foreign-currency debt, medium- and long-term bonds and assumed debt**In nominal terms
i i i d iSpain: 2012 Financing Needs Programming

Spain
http://www tesoro es/en/deuda/index deuda asp
Auction Calendar for Spain
http://www.tesoro.es/en/deuda/index_deuda.asp
Debt Issuance Strategy for Spain
http://www.tesoro.es/en/home/estrategia.asp

Mi i M iIndicators 2011
Limits for 2012
Minimum Maximun
Stock of FDP (R$ billions)
1,866.4 1,950.0 2,050.0 , , ,
Profile (%)
Fixed Rate 37.2 37.0 41.0
Inflation Linked 28.3 30.0 34.0
Floating Rate 30.1 22.0 26.0
E h R t 4 4 3 0 5 0Exchange Rate 4.4 3.0 5.0
Maturity Structure
Average maturity (years) 3.6 3.6 3.8g y (y )
% Maturing in 12 months 21.9 22.0 26.0
www tesouro fazenda gov brwww.tesouro.fazenda.gov.br
http://www.tesouro.fazenda.gov.br/english/hp/public_debt_report.asp.

Turkey
http://www.tukuphane.tcmb.gov.tr
Canada
http://www.fin.gc.ca/treas/frame/tmrf08_1-eng.asp

MMEDIUMEDIUM TTERMERM DDEBTEBT SSTRATEGYTRATEGYMMEDIUMEDIUM TTERMERM DDEBTEBT SSTRATEGYTRATEGYSSTEPTEP 88

The Framework: A 8 step approach
The Framework: A 8 step approachA 8-step approachA 8-step approach
Step8: Recommend MTDS for approval Step8: Recommend MTDS for approval Step8: Recommend MTDS for approval Step8: Recommend MTDS for approval

Not only developed but also a number of developing countries have y p p gpublished their MTDS document and got Parliaments’ approval.
Reports published include:
Kenya (2009, 2010, 2011)Ghana 2010Ta a ia 2011 2012Tanzania 2011, 2012Malawi 2011Moldova 2011Bangladesh Bangladesh Kyrgyz Republic
Tool that permits
Improved policy coordination p p yEnhanced transparency Better communication also with investorsCommitment to a medium-term debt funding strategy