medium energy neutral atom (mena) imager for the image...
TRANSCRIPT

MEDIUM ENERGY NEUTRAL ATOM (MENA) IMAGER FOR THEIMAGE MISSION
C. J. POLLOCK1, K. ASAMURA2, J. BALDONADO3, M. M. BALKEY 4,P. BARKER3, J. L. BURCH1, E. J. KORPELA8, J. CRAVENS1, G. DIRKS1,
M.-C. FOK5, H. O. FUNSTEN3, M. GRANDE6, M. GRUNTMAN7, J. HANLEY1,J.-M. JAHN1, M. JENKINS1, M. LAMPTON8, M. MARCKWORDT8,
D. J. MCCOMAS3, T. MUKAI 2, G. PENEGOR8, S. POPE1, S. RITZAU3,M. L. SCHATTENBURG9, E. SCIME4, R. SKOUG3, W. SPURGEON3,
T. STECKLEIN1, S. STORMS3, C. URDIALES1, P. VALEK1,10, J. T. M. VAN BEEK11,S. E. WEIDNER1, M. WÜEST1, M. K. YOUNG1 and C. ZINSMEYER1
1Southwest Research Institute, 6220 Culebra Road, San Antonio, TX 78238-5166, U.S.A.2Institute of Space and Astronautical Sciences, 311 Yoshinodai Sagamihara, Kanagawa 229-8510,
Japan3Los Alamos National Laboratory, CSSE/NIS-1, Los Alamos, NM 87545, U.S.A.
4West Virginia University, Department of Physics, Box 6315, Morgantown, WV 26506, U.S.A.5Universities Space Research Association, NASA GSFC, Greenbelt MD 20771, U.S.A.
6Rutherford Appleton Laboratory, Oxfordshire OX11 0QX, England7University of Southern California, Department of Aerospace Engineering, Los Angeles, CA 90089,
U.S.A.8University of California at Berkeley, Space Sciences Laboratory, Centennial Drive at Grizzly Peak
Blvd, Berkeley, CA 94720, U.S.A.9MIT Center for Space Research, 77 Massachusetts Ave, Cambridge, MA 02139, U.S.A.
10Auburn University, Department of Physics, 206 Allison Laboratory, Auburn, AL 36849, U.S.A.11Philips Research Laboratories, Prof. Holstlaan 4, 5656 AA Eindoven, The Netherlands
(Received May 25, 1999)
Abstract. The Medium Energy Neutral Atom (MENA) imager was developed in response to theImaging from the Magnetopause to the Aurora for Global Exploration (IMAGE) requirement toproduce images of energetic neutral atoms (ENAs) in the energy range from 1 to 30 keV. Theseimages will be used to infer characteristics of magnetospheric ion distributions. The MENA imageris a slit camera that images incident ENAs in the polar angle (based on a conventional sphericalcoordinate system defined by the spacecraft spin axis) and utilizes the spacecraft spin to image inazimuth. The speed of incident ENAs is determined by measuring the time-of-flight (TOF) from theentrance aperture to the detector. A carbon foil in the entrance aperture yields secondary electrons,which are imaged using a position-sensitive Start detector segment. This provides both the one-dimensional (1D) position at which the ENA passed through the aperture and a Start time for theTOF system. Impact of the incident ENA on the 1D position-sensitive Stop detector segment providesboth a Stop-timing signal and the location that the ENA impacts the detector. The ENA incident polarangle is derived from the measured Stop and Start positions. Species identification (H vs. O) is basedon variation in secondary electron yield with mass for a fixed ENA speed. The MENA imager isdesigned to produce images with 8◦×4◦ angular resolution over a field of view 140◦×360◦, over anenergy range from 1 keV to 30 keV. Thus, the MENA imager is well suited to conduct measurementsrelevant to the Earth’s ring current, plasma sheet, and (at times) magnetosheath and cusp.
Space Science Reviews91: 113–154, 2000.© 2000Kluwer Academic Publishers. Printed in the Netherlands.

114 C. J. POLLOCK ET AL.
1. Introduction
1.1. SCIENTIFIC BACKGROUND AND OBJECTIVES
The IMAGE mission was conceived in response to the need to achieve instanta-neous visualization of many of the major structures in the Earth’s magnetosphere.Global visualization of the magnetosphere will add greatly to our understanding ofits structure and the processes that link the magnetosphere with the exterior solarwind and the Earth’s atmosphere and ionosphere. The case was made eloquently byWilliams et al. (1992) in their comprehensive review of magnetospheric imaging.Here we have a classic case of a picture being worth a thousand words. In this anal-ogy, each of those ‘thousand words’ may be thought of as an isolated observationby an in situ spacecraft. The ensemble of such observations at points separatedin both space and time has, for the most part, formed the basis of our currentunderstanding of magnetospheric structures and processes. Sampled at one or a fewwidely separated places, these data have formed a very large, yet still sparse, arrayof constraints on the system under study. This paper describes the measurementtechnique of the Medium Energy Neutral Atom (MENA) imager that, as part of theIMAGE mission, will enable global observation of magnetospheric structure anddynamics using images of the magnetosphere in energetic neutral atoms (ENAs).The images will not be photographs. Rather, we may call them ‘enagraphs’.
A body of work in magnetospheric imagery that has had large scientific andpublic impact is that of auroral imaging from space. Though preceded and fol-lowed by several space-based auroral imagers, the first planetary scale images ofthe aurora were presented to the world with the launch of the DE-1 spacecraft(Frank et al., 1981, 1982). The utility of global auroral imaging for the study ofmagnetospheric physics is difficult to overstate. The technique is used to monitorthe spatio-temporal evolution of substorms, discern spatial relationships in highlydynamic contexts, estimate global ionospheric energy deposition, and to under-stand important aspects of the magnetosphere’s morphology. Nevertheless, auroralimaging is limited since global dynamics are interpreted through their effects onthe aurora. With the MENA instrument we can directly observe global structureand dynamics.
In situ magnetospheric data products are epitomized by energy-time particleflux spectrograms and frequency-time field spectrograms obtained along spacecrafttrajectories. Space physicists have developed intuition unique to these data dis-plays, such that profound physical understanding has been obtained through carefulconsideration and analysis of such products. However, single point measurementsdo have some limitations, which the IMAGE mission has been designed to address:1. Causality: The traditional data of magnetospheric physics, coupled with knowl-
edge of plasma physics, are well suited for use in characterizing various pop-ulations and processes resident in the magnetosphere. However, the physicaldimensions (particle energy, field frequency) in which the detail exists are not
MEDIUM ENERGY NEUTRAL ATOM (MENA) IMAGER FOR THE IMAGE MISSION 115
necessarily well suited for the determination of spatio-temporal relationshipswithin the global system. The sampling in space is highly detailed but sparse,and very few locations can be sampled simultaneously. Thus, causality is oftendifficult to determine, and the global significance of any given observation isnot necessarily evident.
2. Context: Most observations in magnetospheric physics have no context be-cause of their relative isolation in space and time. Whatever context can beapplied is typically rooted in a concept or model of the system accumulatedover time by an individual or community of researchers. This lack of definitivecontext severely inhibits growth of understanding of the system, especiallywith respect to its global behavior.
3. Intuition: The physical dimensions sampled by the traditional data of mag-netospheric physics are not the dimensions of everyday human experience.Therefore, whatever intuition is available to be applied to the study is typi-cally developed at great effort – and not easily shared with an uninitiated layaudience.
A classic example of a study of the use of isolated ion and electron distributionfunctions to gain understanding of magnetospheric structure is provided by thework of Mauk and Meng (1983). Their painstaking analyses of geosynchronousparticle spectrogram shapes led to an understanding of the spatial morphology ofenergetic particle injections near the inner edge of the plasma sheet. The resultis known as the double spiral injection boundary. A single image from a mediumenergy ENA camera could be sufficient to elucidate such a feature by providingdirect visualization of the shape of the energetic ion injection boundary. A seriesof images from such an instrument will provide direct observation of the dynamicsand evolution of these boundaries. Such observations have thus far been unavail-able, owing to technological constraints. With IMAGE, we have the first concertedeffort to overcome these constraints.
Figure 1, reproduced from Williams et al. (1992), provides an excellent sum-mary of the fundamental aspects of ENA images, the magnetospheric structuresof interest in such images, and a representation of an image expected from a highperformance (1 deg resolution) ENA camera.
The MENA imager is very well suited to make lower energy ring current ob-servations. The Earth’s ring current is characterized by large fluxes of ions inthe energy range accessible to both the MENA and High Energy Neutral Atom(HENA) (Mitchell et al., 2000) imagers. As illustrated in Figure 1, these energeticions are subject to charge exchange collisions with low energy atoms that makeup the neutral hydrogen geocorona. These collisions transform the energetic ionsinto ENAs that exit the interaction region on energetic ballistic trajectories. Thus,the ring current continuously emits ENAs detectable by a properly designed anddeployed ENA imager.
The ring current is highly dynamic, undergoing growth and decay as geomag-netic storms wax and wane in response to external (solar wind) driving forces.

116 C. J. POLLOCK ET AL.
Figure 1.Schematic diagram of Earth’s magnetosphere and processes relevant to energetic neutralatom imaging. Insets show: (a) the density profile of the geocorona; (b) a schematic view of colli-sional charge exchange, the mechanism responsible for ENA creation; (c) a simulated ENA imagefrom a hypothetical imager with 1 deg resolution (from Williams et al., 1992).
Using the MENA imager, we will track injection fronts (Moore et al., 1981) asthey move earthward, and correlate their geometry and motion with solar windand interplanetary magnetic fields (IMF) conditions. We will directly observe thedifferential drift of ions around the Earth, under the influence of energy-dependentgradient and curvature drift. Global estimates of the ring current decay rate will beprovided by combining MENA and HENA observations of ENA escape with globalring current precipitation measurements from the Far Ultra-Violet imager (Mendeet al., 2000). Other potential targets of interest for the MENA imager include thenear-Earth plasma sheet and the cusp.

MEDIUM ENERGY NEUTRAL ATOM (MENA) IMAGER FOR THE IMAGE MISSION 117
1.2. IMAGE MEASUREMENT OBJECTIVES AND THE ROLE OF THEMENAIMAGER
The broad objective of the IMAGE mission is to answer the question: How doesthe magnetosphere respond globally to the changing conditions in the solar wind?We address this broad objective by posing several more specific questions anddesigning our instrumentation to provide answers to them:1. What are the dominant mechanisms for injecting plasma into the magnetosphere
on substorm and magnetic storm time scales?Solar wind protons with speeds of 500 km s−1 possess 1.5 keV directed ki-netic energy when they encounter the Earth’s bow shock. Higher solar windspeeds are not uncommon. Shocked solar wind plasma is the primary con-stituent of the magnetosheath, which must be the dominant solar wind plasmasource for the magnetosphere. This plasma engulfs the exterior of the magne-topause. At the cusps it has direct access to the ionosphere and thermosphere.The magnetosheath plasma therefore acts both as a source of energy for dayside ionospheric outflow and as a source of plasma for the magnetosphere.Particularly during times of large solar wind speed, MENA will be able toimage the cusp in few keV magnetosheath protons. The Low Energy Neu-tral Atom (LENA) imager (Moore et al., 2000), which operates at lower en-ergy than MENA, will make images of the ionospheric outflow on the dayside, for comparison to cusp images obtained using MENA magnetosheathobservations.
2. What is the directly driven response of the magnetosphere to changes in thesolar wind?MENA images of magnetospheric regions will show the global magnetosphereresponse to solar wind changes measured upstream. Time series of global mag-netospheric properties will be directly compared with time series of solar windand interplanetary magnetic field conditions.
3. How and where are magnetospheric plasmas energized, transported, and sub-sequently lost during storms and substorms?Within the magnetosphere, substorm and storm-time plasma injections will beimaged using MENA. Near-Earth plasma sheet and energetic plasma injectionsin the tail will be primary observational targets. The shape of injection bound-aries in space will be visualized. If these boundaries propagate, we will observetheir global propagation, measure propagation speeds, and track the evolutionof the boundaries and their plasma populations. The variation in energy of theinjected particles as a function of time and position will be measured usingMENA. The plasma sheet tailward of injections may be imaged on longer timescales. The MENA imager will be in an excellent position to view the plasmasheet (kT∼10 keV) and its extensions to low altitudes in the nightside auroralzones. The global evolution of the plasma sheet before and after tail unloadingis directly connected to the injection mechanisms themselves.

118 C. J. POLLOCK ET AL.
The transport of energetic ring current particles subsequent to injection willbe revealed using time series of ring current images. Resultant energy andmass distribution and loss will be parameterized and tracked using MENAobservations.
The MENA imager is intended to operate in concert with the other instruments onIMAGE to answer the above questions. It is well suited to address each, using ringcurrent, magnetosheath, and plasma sheet observations, as discussed above.
1.3. INSTRUMENT REQUIREMENTS, PERFORMANCE, AND RESOURCES
In order to achieve the scientific objectives described above, the MENA imageris required to provide ENA flux images of hydrogen and oxygen. The images arerequired to be provided with 8-deg angular resolution, 80% energy resolution, and2-min time resolution over the energy range from 1 keV to 30 keV for the 2-yearduration of the prime mission.
All of these requirements are fundamentally met by the flight instrument, andgenerally the imager performs very well. However, the performance across theentire instrument sample space does not uniformly meet these requirements. Forexample, heavy ENAs scatter in the foil to large angles at low energies, irreduciblylimiting the angular resolution of downstream optics and detectors (see Figure 10).Thus, 8-deg angular resolution is not achieved for oxygen within the MENA en-ergy range, as it is for hydrogen and helium. However, the imager energy rangeextends to 50 keV and above (limited by the short end of TOF). Furthermore,this angle measurement deficiency exists only in the polar (imaging) angle. Theazimuth (spin phase; collimated) angle is not affected. A second example of the in-strument’s inability to fully satisfy the performance requirements involves speciesdetermination. This topic is discussed below and in Section 3.4.
The more energetic (30–50 keV) oxygen will be imaged with full resolutionby MENA. Specified polar angle resolution is achieved for hydrogen at energiesslightly greater than 3 keV. MENA will do an excellent job measuring polar in-cidence angle of ring current and plasma sheet hydrogen and oxygen at energiesabove those called out directly above, but not below those energies. The energetictail of Earth’s magnetosheath ions will be nicely imaged by MENA. Charge ex-change targets will be sparse, however, except during periods of extremely highsolar wind ram pressure, when the magnetopause will be forced to small geocentriclocations. The mid-altitude cusp should be very nicely and simply imaged in itshigh-energy hydrogen tail using MENA.
The MENA imager concept was selected from among several promising ideasthat have been put forward during the last five to ten years (McComas et al., 1991,1994, 1998; Gruntman, 1997). The slit camera concept (McComas et al., 1998) wasselected due primarily to the very large (approximately 24 cm2) aperture presentedto space.

MEDIUM ENERGY NEUTRAL ATOM (MENA) IMAGER FOR THE IMAGE MISSION 119
TABLE I
MENA required and achieved performance
Quantity Requirement Performance Performance Units
(O) (H)
Angle FOV
Azimuthal 360 360 360 degrees
Polar 90 140 140 degrees
Angle resolution
Azimuthal 8 5 5 degrees
Polar 8 12 8 degrees
Energy range 1–30 3–70 1–70 keV
Energy resolution 80 80 80 %
Species ID H, O probabilistic probabilistic unitless
Effective area∗ 1.0 0.83 0.83 cm2
∗3 sensors combined.
TABLE II
Physical resources for the MENA Imager.
Quantity Value Units
Mass 13.9 kg
Power 22.5 W
Data Rate 4.3 kbps
Dimensions 42.5× 22.3× 29.3 cm× cm× cm
The weakest aspect of the MENA slit camera approach is that only the speedis directly measured, using time of flight. Energy per charge is not independentlymeasured and therefore mass per charge is not directly derivable from the data inthis way. Using the slit camera approach as in the case of MENA, species may beinferred with finite certainty as described in Section 3.4. These limitations wereknown at the time of the selection of the MENA instrument concept. For a firstENA instrument in this energy range, we prioritized larger geometric factor andsimplicity over certainty with respect to mass.
Table I lists the performance requirements described above, as well as mea-surements and estimates of the performance achieved by the flight MENA imager.Details are to be found in the text of this paper and in direct consultation withMENA team members.
Table II lists a number of critical physical parameters and spacecraft resourcerequirements associated with the MENA imager as delivered for flight.

120 C. J. POLLOCK ET AL.
2. MENA Measurement Approach and Implementation
2.1. OBJECTIVES VERSUS CONSTRAINTS
The unique challenges in developing a medium-energy ENA imager lie in the na-ture of the species under study and the environment in which the imager operates(Gruntman, 1997). Unlike charged particles, ENAs are not responsive to electricor magnetic fields, and therefore they cannot be steered through an electrostaticor magnetic analyzer. Unlike photons, ENAs do not pass through solid lensesor specularly reflect at large angles off of polished surfaces (grazing incidencespecular reflection, with ionization, of low-energy ENAs is used in LENA imager(Moore et al. 2000)). Medium-energy ENAs can therefore not be steered throughconventional reflective or refractive optical systems. Finally, unlike the most ener-getic ENAs, those in the energy range 1–30 keV are not energetic enough to (a)generate measurable charge in a solid state detector or (b) pass through a relativelythick (a fewµg cm−2) UV rejecting foil (not to be confused with UV blockinggratings) without severe scattering and attenuation.
The MENA operational environment is distinguished foremost by the presenceof intense fluxes of UV photons, primarily hydrogen Ly-α, of both solar origin(∼5 × 1011 cm−2 s−1) (Hall et al., 1985) and from the Earth’s day glow (∼4 ×109 cm−2 sr−1 s−1) (Meier, 1991). This flux is a potentially crippling source ofbackground noise, which is particularly troublesome in view of the low fluxes ofmedium energy ENAs to be measured. The MENA imager approach describedhere has been developed to address these issues and provide the largest possiblescientific return.
2.2. TOF/SLIT CAMERA APPROACH
By analogy to the canonical pinhole camera, MENA uses the wide-slit camera ap-proach to ENA imaging as first suggested by McComas et al. (1998). The concept isschematically illustrated in Figure 2. A slit camera is distinguished from a pinholecamera in that it provides only 1D imaging (transverse to the slit), whereas thepinhole camera provides fully 2D imaging. In the MENA case, the second imagedimension is acquired using collimation and spacecraft spin.
The ENA polar angle is determined based on knowledge of two-dimensional(2D) position at two points along the incident trajectory. The simplest implemen-tation is a very narrow slit, in which the first trajectory location is known a priori.However, we have implemented a wide slit to increase the aperture area, and there-fore sensitivity, due to the low ENA fluxes. The added sensitivity comes at the priceof added complexity. In the wide-slit case of the MENA imager, the incident ENAposition within the slit must be determined independently (McComas et al., 1998).This position and the position of the second trajectory point (fixed at the detectorplane) are independently determined using a single segmented position-sensitivedetector.

MEDIUM ENERGY NEUTRAL ATOM (MENA) IMAGER FOR THE IMAGE MISSION 121
Figure 2.Schematic view of a MENA sensor. A neutral atom passes through the START foil, pro-ducing secondary electrons. Secondary electrons are accelerated towards the START segment ofthe detector, whereas the ENA will impact the detector STOP segment. Particles incident on theSTART and STOP segment of the detector will provide TOF timing signals, which together withtheir respective pulse height and ID position on the detector provide the required information forpolar incidence angle, energy and species determination of the ENA.
3. Instrument Description
3.1. OVERVIEW
A functional block diagram of the MENA imager system is provided in Figure 3.An isometric drawing of the imager and photograph taken just prior to calibrationare presented in Figures 4 and 5, respectively. The MENA imager is composed ofthree identical sensors, labelled as shown in Figure 4 and mounted to a commonDPU assembly. Each sensor is supported by two dedicated front-end electronics(FEE) cards (time of flight, or FEETOF, and pulse height analyzer, or FEEPHA)and a triple function (+10 kV,+4 kV,−1 kV) high-voltage power supply (HVPS).The three sensors share common low-voltage power sources (LVPS), high-voltage

122 C. J. POLLOCK ET AL.
Figure 3.MENA Imager block diagram. All electrical interfaces to the spacecraft, other than chassisground, are those shown to the CIDP. Only one of the three identical sensors, HVPS, FEE, TOF, andFEE_PHA subsystems are shown, though they are indicated to be three.
and pulser control circuitry (HVPC), data acquisition, lookup table, and storagefacilities (MLUT), and a microcontroller (CPU) for command and data processingand interface to the IMAGE Central Instrument Data Processor (CIDP) (Gibsonet al., 2000). The three sensors each provide 1D imaging of incident ENAs inthe polar angle direction based on a spherical coordinate system defined using thespacecraft positive spin axis as the+z-axis. The second imaging dimension (az-imuth) is obtained using collimation and spacecraft spin. The sensors are mountedto provide look directions that view a common azimuth (spin) angle, but are offsetfrom one another in their polar angle field of view. The center of the Sensor 2look direction is perpendicular to the spin axis, at a polar angle of 90 deg. Thecenters of the Sensor 1 and 3 look directions lie at polar angles of 110 deg and70 deg, respectively. Each sensor has a 20-deg wide blind spot associated with theStart anode segment in the center of its field of view. The 20-deg offset among thesensors was selected to eliminate the blind spots and produce a constant instrumentresponse when the three sensors are combined. The spacecraft coordinate systemis also shown in Figure 4, for reference.
ENAs, charged particles, and photons incident from within a sensor’s field ofview enter through the collimator, where charged particles with energies up to 13times the adjustable applied voltage are removed by electrostatic deflection. Theremaining particles and photons must pass through a free-standing UV blockinggrating, where the UV photons are removed around a very wide stop band by theoptical properties of the grating. The grating structure was designed to eliminatethe 121.6 nm (solar hydrogen Ly-α) light reflected from the geocorona. Within the

MEDIUM ENERGY NEUTRAL ATOM (MENA) IMAGER FOR THE IMAGE MISSION 123
Figure 4. Isometric drawing of the MENA imager. Shown are the three identical MENA sensors,mounted on the DPU unit. The detectors are offset 20 deg in the azimuth (spin) angle direction. Thespacecraft coordinate system is also shown, for reference. Compare with Figure 2, where we haveshown the coordinate system applicable to each of the three sensors.
aperture, the ENAs pass through a thin carbon foil where they produce secondaryelectrons and undergo angular scattering that depends upon the species and energy.Secondary electrons are accelerated to the MCP detector Start segment, while theprimary ENA continues along its trajectory to impact the MCP detector Stop seg-ment. ENAs incident on the stop detector segment and their correlated secondaryelectrons incident on the Start detector segment provide position measurementsfrom which the ENA polar angle is calculated. This information is combined withTOF timing signals to yield a determination of speed. Detector pulse heights areused to provide information on species and detector health. UV photons not ab-sorbed by the UV blocking gratings are not counted due to the TOF coincidencerequirement.
Start and Stop MCP pulses stimulate charge-sensitive amplifiers (CHAMPS),housed at the rear of the detectors. CHAMP outputs are fed through lower-level

124 C. J. POLLOCK ET AL.
discriminators (LLD, located in the DPU) to the FEE where they are analyzed forcharge magnitude, relative timing, 1D ratiometric position, and conformance tospecified logical valid event criteria. For a valid event, the result of this analysisis 5 bytes of data that, along with spin phase and sensor identification, comprisethe core raw data associated with a detected ENA. These data are provided to theMass Look-up Table (MLUT), which uses them to form images in hardware mem-ory. These hardware images are accessible to the Central Processing Unit (CPU)for selection or collapse, followed by formation into data packets for telemetrydownlink. The MLUT, residing in EEPROM, is populated with data that embodyknowledge of the imager response, in principle making is possible for the raw datato be interpreted in terms of ENA incidence angle, energy, and species. Image dataproducts formed using the MLUT, as well as other data products described be-low, are packetized and delivered to the Central Instrument Data Processor (CIDP)(Gibson et al., 2000) for optional compression and telemetry downlink.
Flight electrical interfaces to the IMAGE spacecraft include+28 V instrumentbus power (from which all routine functional power is derived),+28 V heaterbus power, which is used only to open each sensor’s non-reclosable door; anda bi-directional RS-422 interface to the CIDP. All command and telemetry datapass through the RS-422 interface. Further details of the DPU are provided inAppendix A.
3.2. SENSOR OPTICS
The MENA imager is composed of three identical sensors, numbered as in Figure 4.The sensor design concept is illustrated in Figure 2. Each has a collimator, anaperture populated with UV blocking gratings and thin carbon foils, a groundedacceleration grid, a field-free drift chamber, and a segmented 1D position-sensitivedetector.
Incoming ENAs, charged particles, and photons must pass first through an 85%-transmission grounded screen placed on the front face of the collimator and thenthrough the collimator itself. The vanes on the collimator are blackened with adendritic cupric oxide (Ebanol-C) to absorb photons and charged particles, andarranged geometrically to allow a nominal 4 deg FWHM azimuthal resolution.This angular band pass is aligned at a constant spacecraft azimuth angle. Alter-nate vanes are grounded or electrically biased at up to+10 kV (determined byground command) to sweep out charged particles with energies per charge up toapproximately thirteen times the applied bias voltage. Laboratory measurementsshow charged particle transmission at 30 keV to be 10−4, with 5 kV applied to thecollimator vanes.
Those ENAs and photons that are transmitted though the collimator impingeupon the aperture, which is rectangular in shape and approximately 8 cm× 1 cm inarea (the 1 cm dimension is imaged while the 8 cm dimension is not). The apertureis populated with five rectangular assemblies, each comprising one free-standing

MEDIUM ENERGY NEUTRAL ATOM (MENA) IMAGER FOR THE IMAGE MISSION 125
Figure 5. Photograph of MENA imager prior to calibration. The large handling base plate withhandles, protective red covers, and purge distribution system (small alodyne coated box with purgelines in and out) are all non-flight.
gold UV blocking grating and a thin carbon foil. Each grating/foil assembly hasa 1.6 cm× 1.0 cm rectangular shape. The purpose of the gratings is to passENAs while blocking UV photons. They were developed and manufactured forthe MENA imager at the Massachusetts Institute of Technology (MIT) using holo-graphic lithography techniques (Van Beek et al., 1998). A schematic diagram ofthe grating structure is shown in Figure 6.
The grating consists of an ensemble of gold bars, each with a thickness of400 nm and a width of 160 nm. The bars lie parallel to one another with a pe-riodic spacing of 200 nm. A critical parameter for the absorption of hydrogen Ly-α
is the∼40 nm spacing between the gold bars. The gold bars are supported onnickel grids, much coarser and stronger than the gold gratings themselves. The Nigrids provide a strong substructure on which to support the gold without severelyreducing geometric open area of the grating. The gold grating ensemble acts asboth as a strong polarizer and a lossy wave guide, tuned for maximal absorption ofhydrogen Ly-α (λ = 121.6 nm) photons, the dominant source of UV noise in near-Earth space. Photons at shorter and longer wavelengths have higher transmissions

126 C. J. POLLOCK ET AL.
Figure 6.Schematic diagram of UV transmission gratings. The drawing is not to scale. Therefore,disparate dimensions like the 60 nm gaps between gold bars and the 4µm nickel grid period aredisplayed on similar scales.
than hydrogen Ly-α, but hydrogen Ly-α fluxes are by far the dominant source ofUV noise near Earth.
The photon transmission of prototype gold gratings has been modeled as afunction of wavelength and measured in the laboratory (Gruntman et al., 1995;Scime et al., 1995; Balkey et al., 1998). The results are shown in Figure 7. Thesolid curve is the model result, and the data points are measurements. Figure 7shows that the transmission of the prototype gratings at 121.6 nm is∼3 × 10⁻⁵,while that at 30.4 nm and 58.4 nm is 5× 10⁻² and 1× 10⁻², respectively. Thesemeasurements serve as spot checks on the model; both show good agreement. Thisresult gives confidence that the expected grating performance will be attained inflight. The flight gratings differ slightly from the prototypes whose performance isshown in Figure 7. MENA flight gratings also have been modelled and measured.They show uniformly superior UV attenuation to that shown in Figure 7.
The flight grating photon transmission has been convolved, as a function ofwavelength, with the geocoronal emission profile of Meier (1991) to estimate thetotal noise rate in a MENA sensor due to geocoronal luminescence. The result,shown in Figure 8, shows both the differential (with respect to wavelength) andtotal (integrated over wavelength) MCP count rate near apogee due to geocoro-nal photons. The total expected noise rate is shown to be less 250 Hz, yield-ing a predicted (accidental) coincidence rate of only a few mHz due to the UVbackground.

MEDIUM ENERGY NEUTRAL ATOM (MENA) IMAGER FOR THE IMAGE MISSION 127
Figure 7. Model and measured photon transmission through MENA prototype gratings. The solidcurve represents model results, points indicate measurements.
Figure 8.Background noise rate due to geocoronal photons. Shown are the total (STARTS+ STOPS)expected MCP count rates due to UV photons near the IMAGE apogee. Both differential count ratesand their integral are shown and labeled.
Figure 9 shows measurements of the particle transmission plotted versus hydro-gen Ly-α transmission for the fifteen gratings installed in the flight MENA imager.The data points are labelled according to whether the gratings were installed inSensor 1, 2, or 3. The hydrogen Ly-α transmission for these samples ranges from6×10−7 to 2×10⁻⁵, with a mean value of 6×10⁻⁶. The particle transmission rangesfrom 4.1% to 7.8%, with a mean of 5.1%. Taking the sensitivity of microchannelplates to be 0.8 and 0.01, for ENAs and hydrogen Ly-α photons, respectively,

128 C. J. POLLOCK ET AL.
Figure 9.Particle and UV transmission map for MENA flight gratings. Data points are labeled withthe number of the sensor in which they were installed. Individual serial numbers are tabulated, alsoaccording to sensor.
the MENA sensitivity for ENAs is seen to be larger than that for hydrogen Ly-α
photons by a factor of 7× 10⁵!ENAs that pass through the gold grating impact a thin (nominally 0.6 or 0.7µg
cm−2 for MENA flight foils) carbon foil that has been affixed to the back face ofthe grating. In the past, carbon foils have been floated onto metal grids that wereclamped into grid holders. We chose to float the foils directly onto the gratingsand avoid a 35% ENA transmission deficit associated with the metal grid. Thepurpose of the foil is to generate secondary electrons due to the interaction ofthe ENA with the carbon foil. The secondary electrons mark thez-coordinate ofthe ENA as it passes through the aperture (see Figure 2) and produce a Startsignal for the TOF system. The number of secondary electrons emitted providesinformation regarding the ENA species. Emission of secondary electrons from thefoil is a probabilistic phenomenon and can only be quantified in statistical terms.The energy of the emitted electrons is broadly distributed near a few eV. Theirangular distribution is peaked about the forward direction. Both emission angleand energy are largely independent of the characteristics of the incoming ENA.The secondary electron yield (number of electrons emitted per incident ENA) isalso a probabilistic quantity that is influenced by the mass, speed, and incidenceangle of the ENA. At energies less than a few hundred keV, the yield increases forENAs that are faster, heavier, and incident at larger angles with respect to the foilsurface normal.
The entire assembly for each sensor is cosists of five carbon foils, gold gratings,and stainless steel grating frames. It is clamped into a light-tight mounting assem-

MEDIUM ENERGY NEUTRAL ATOM (MENA) IMAGER FOR THE IMAGE MISSION 129
Figure 10.Angular scattering of ENAs upon passage through nominal a 0.5µg cm−2 foil (fromFunsten et al. (1993)).
bly in the sensor aperture and electrically biased to−1 kV with respect to chassisground. Since the secondary electrons are emitted with a broad angular distributionand energies of a few eV, the−1 kV bias is required to accelerate electrons towardthe detector, thereby retaining the z-coordinate of the ENA passage through theaperture. A grounded (85% transmission) grid is placed 1 mm downstream fromthe carbon foil, inside the sensor. Secondary electrons are accelerated to 1 keVthrough this grid and pass through a nearly field free 3 cm (L in Figure 2) regionbefore striking the detector over the Start anode segment. Thus, they provide theTOF Start signal and thez-coordinate of detector impact, which is interpreted asthez-coordinate of ENA passage through the aperture, or Start position. The pulseheight of the MCP charge burst, or Start Height, is measured and recorded to assistin the statistical measurement of PHA for species identification.
ENAs undergo energy- and mass-dependent scattering during passage throughthe foil, causing some degradation in our ability to measure polar angle for incidentENAs. Figure 10 contains results of a laboratory study by Funsten et al. (1993),applicable to ENA scattering in a nominal 0.5µg cm−2 foil These data may beinterpreted directly as a lower bound on the scattering half angle for ENAs passingthrough the MENA aperture, and therefore as a lower bound on the (half width)polar angle resolution achievable using the MENA imager. The angular resolutionin the collimated azimuth direction is not affected since the collimator fixes this atapproximately 5 deg FWHM.
An incoming ENA continues (nearly) along its original trajectory and strikesthe detector over the Stop anode segment, providing the TOF Stop signal, the z-

130 C. J. POLLOCK ET AL.
coordinate of ENA impact on the detector (or Stop Position), and the pulse heightof the Stop MCP charge burst, or Stop Height. Like the Start Height, Stop Heightis related to ENA species. The path length of the ENA from the aperture to thedetector is (3/cos(α)) cm, whereα is the measured polar incidence angle as shownin Figure 2. The timing of the Start and Stop signals is compared in the FEETOFto produce a time of flight.
In view of the−1 kV accelerating potential applied to the carbon foil, a sec-ondary electron’s transit time from foil to detector is∼1.6 ns, assuming initialsecondary electron energy of 2 eV and a 45-deg emission angle. During this time,an electron will have travelled less than 1 mm transverse to the aperture normal(z-direction). This displacement adds to the uncertainty in the measurement of thez-coordinate of the ENA as it passes through the aperture, and therefore, in theENA polar angle which is derived from it. The choice of−1 kV acceleration poten-tial represents a compromise between the requirement to minimize the electron’stransverse displacement, on one hand, and the distortion of the ENA trajectory afterpassage through the foil, on the other hand. The latter is a consideration becauseof the fact that a significant percentage of ENAs will emerge from the foil witha non-zero charge state and will be subject to trajectory distortion in the appliedelectric field.
3.3. DETECTOR SYSTEM
The detector system fastens into the back of the sensor as a sub-assembly. It iscomposed of az-stack MCP array, a segmented 1D position sensitive anode withindependent Start and Stop regions, four CHAMPS (Start A&B, Stop A&B), anda network of resistors and capacitors to distribute high voltage and filter out noise.
The detector is based on large area rectangular MCPs, similar to Hamamatsucommercial model 2396-04, but manufactured specially for the MENA imageraccording to provided specifications. The MCPs provide large area (72 mm×90 mm), relatively high resistance (∼100 M-Ohm per plate), high gain due to chan-nels with 60:1 length-to-diameter ratio, and narrow pulse height distribution (aslow as 70% over the entire detector). They also operate with low noise (<1 cm−2
s−1), very low rate of after-pulsing as required for the TOF work, and excellentuniformity (<10% variations over their surface).
Representations of the front face (MCP side) and rear face (connected toCHAMPs) of the anode are shown in Figures 11(a) and 11(b). In Figure 11, wepresent the actual anode layout drawings, modified for this illustration. Importantly,alternate bars have been removed for this illustration (front and rear) for the sakeof clarity. The small pads shown are sites for mounting surface mount resistors, ascalled in the detail, Figure 11(a). On the top side (Figure 11(a)), one M� resistorsare used in these locations. On the bottom side, small (100�) resistors were usedduring early development, but the MENA imager was calibrated and will fly with0� (short circuit) resistors in place.

MEDIUM ENERGY NEUTRAL ATOM (MENA) IMAGER FOR THE IMAGE MISSION 131
The anode performs several functions. First, it decouples the detector high volt-age such that the front face operates at positive high voltage and the back faceoperates at ground. MCP charge bursts are capacitively coupled to the back sidethrough the alumina substrate. Second, it isolates and separately processes Startand Stop events from the detector, using separate charge amplifier pickups forStarts and Stops. These are shielded from one another by grounded ‘gutters’ thatnecessarily act as dead spots on the anode. Third, the anode provides 1D positionencoding using capacitive charge division independently for Start and Stop anodesegments. Note that, although the two Stop segments to the left and right of thecentral Start region are physically separated on the substrate, the two portions ofthe A side and the two portions of the B side are electrically connected at the inputsto the Stop A&B CHAMPs. Electrically, they form contiguous A and B Stop anodesegments.
The 1D position encoding anode functions as follows: Charge deposited by theMCP will land on one or two of the conducting bars of the uniform array on thefront face of the anode. The charge will promptly distribute itself uniformly alongthe length of the bar and reside there for a period of time until it bleeds off throughthe terminating resistor. The bar capacitively couples to the back face of the an-ode, more or less strongly to the A- or B-side depending on the capacitance. Thiscoupling will drive electrons off backside conductors and onto the inputs of therespective CHAMPs. Stronger capacitive coupling to the A- or B-conductor arrayresults in proportionally more charge being driven onto the attached CHAMP. Notethe opposing linear variation in the lengths of the A- and B-conductors withz. Theratio of charge delivered to the A- or B-CHAMP to that delivered to the A- andB-CHAMPs (equal to total deposited by MCP) is itself a linear function ofz. Thisratio is encoded by the FEEPHA card and calibrated with respect to position.
The detector is serviced by four (Start A&B, Stop A&B) CHAMPs. Each isa fast charge-sensitive amplifier that integrates charge deposited on its input andcreates a bipolar output pulse. The CHAMPs are designed to provide a uniformtime interval from charge deposition to the zero-cross at transition from positiveto negative lobe. They are tuned to provide gains of 0.15 V/pC. The CHAMPs’output stages are wired such that the four outputs provided to the FEE are StartA,StartSum, StopA, and StopSum. StartSum and StopSum are the sum of the A- andB-signals for Start and Stop pulses described in the above paragraph.
3.4. EVENT PROCESSING
The four CHAMP outputs listed above represent the complete response of a sensorto a detected ENA. These signals are provided to the FEE for analysis and validevent determination. The response of the FEE to CHAMP outputs depends on theircharacteristics. The minimum response for StartSum or StopSum pulses whichexceed commandable LLD thresholds is to increment Start and Stop counters thatare read out and reset 45 times per spin as part of the StartStops data product. In the

132 C. J. POLLOCK ET AL.
Figure 11.Schematic representation of the MENA front (a) and rear (b) anode surfaces. Start andStop anode segments are indicated, as is the shape of the alumina substrate. The black regions in bothdiagrams show gold-coated copper conductors. Every other conducting bar has been removed for thisillustration for clarity. The detail in (a) shows that surface mount electrical resistors are installed onthe small pads near the end of signal pick-up bars. Thez (imaging) direction is marked in (a). (b) isshown as if one could view the bottom side through the top side of the anode.

MEDIUM ENERGY NEUTRAL ATOM (MENA) IMAGER FOR THE IMAGE MISSION 133
case of a StopSum pulse not immediately preceded by a StartSum pulse, the FEEresponds no further. In the case of a StartSum pulse, the FEE decides whether aValid Event has occurred. If no Valid Event is declared, the FEE increments one of10 Singles counters corresponding to an identified error condition (StartStop andSingles data products are described more fully in Section 5). If a Valid Event isdeclared, the FEE increments a Valid Event counter which is read out and reset 45times per spin, completing the StartStops data product. In this case, the FEE alsoreports five bytes of data to the MLUT. These include Start Position, Start (pulse)Height, Stop Position, Stop (pulse) Height, and Time of Flight.
With respect to Figure 2, the incident polar angle (α) and speed (s) of a detectedENA are determined from the FEE data as
α = cot−1[(Zp − Zt)/L] (1)
and
s = 3.0/(t sin(α)) . (2)
Hereα is the polar angle shown in Figure 2,zp andzt are Stop and Start positionsin cm,L is the distance between the foil and the MCP (also in cm),t is the timeof flight in seconds, ands is the ENA speed in cm s−1. It is noted thatzp, zt , andtare related to corresponding bytes delivered by the FEE in a fashion that is ideallylinear but in reality will only be approximately linear. Specification of the truerelationship between the physical quantities and their byte representation comesfrom the laboratory calibration.
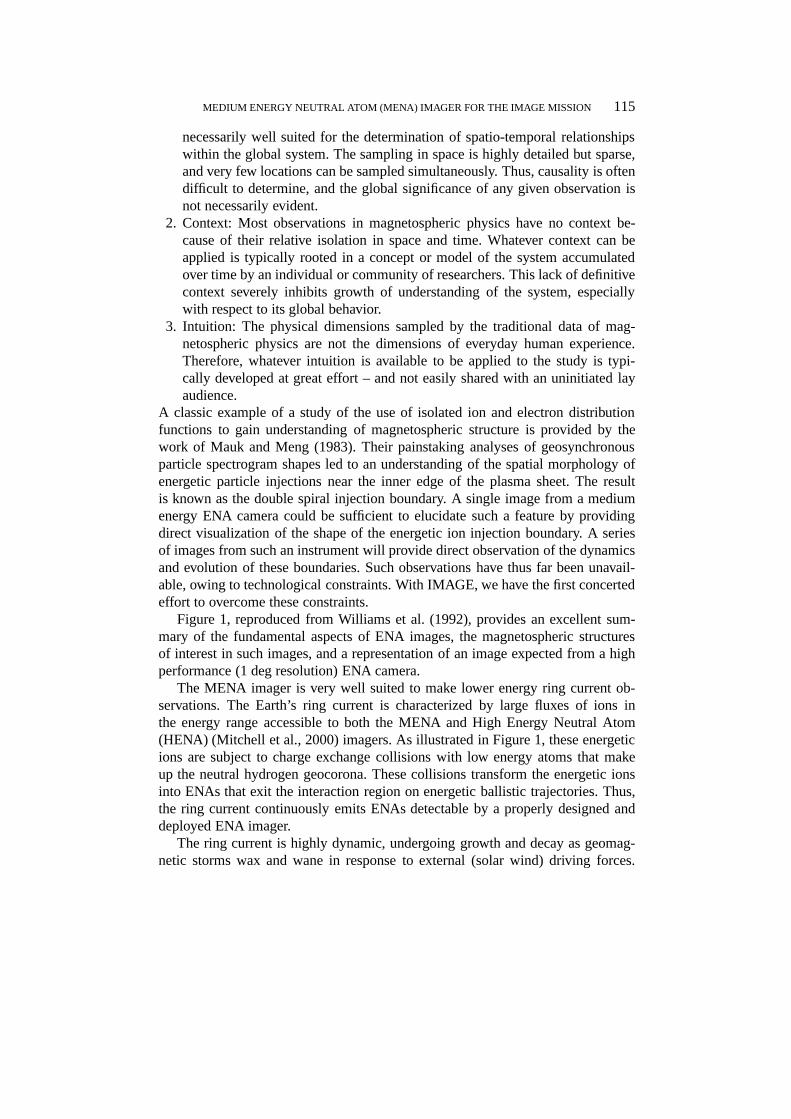
Determination of ENA species with the MENA imager can only be done in astatistical sense. The approach is to utilize the observed dependence of the sec-ondary electron yield from carbon foils on the speed and mass of incident ENAsto differentiate between species. Larger secondary electron yield at the carbon foilwill produce larger Start Heights, and larger yields at the Stop MCP input mayyield larger Stop Heights. Therefore, comparing Start and Stop Heights amongevents with similar speeds provides a basis for species identification. Figure 12shows data published by Ritzau and Baragiola (1998) that demonstrate increasingsecondary yields with increasing primary ENA speed and mass. Owing to thestatistical nature of the emission process (approximately Poisson), the width ofthe yield distribution for a single species at a fixed speed is large enough that theyield distributions for H, He, and O with equal speeds overlap substantially. Thusone can only derive probabilities that individual events are associated with a givenENA species based on the data available from the MENA imager. The MENAImage data (Section 5.1.1) will use the assumption that the species is Hydrogen.The bulk of the data will be sorted by pulse height on the ground, allowing tentativeidentification of species within bands of pulse height.
134 C. J. POLLOCK ET AL.
Figure 12. Dependence of the forward secondary electron yield upon ENA speed, showing anincreased average yield with both particle mass and speed (from Ritzau and Baragiola, 1998).
4. Operations
4.1. MODES
The MENA imager has three operating modes: Low-Voltage Science, High-VoltageScience, and Engineering. Only the High-Voltage Science mode allows applicationof high voltages and therefore the detection of ENAs. The Low-Voltage Sciencemode is identical to the High Voltage Science mode, except that high voltagescannot be applied. The Engineering mode allows execution of a class of commandsnot allowed in the other modes, such as memory loads and software patches.
4.2. COMMANDING
Although the flight software supports a full suite of ground commands, electivecommanding of the MENA imager is expected to be kept to a minimum once stableHV operation is achieved. Occasional adjustment of the detector HV levels and theFEE LLD thresholds throughout the mission are anticipated. Adjustment of theENA spin segment definition, described below, may be required twice per orbit.The three sensors can operate independently of one another. That is, their highvoltage levels and LLD thresholds are independent. If one or more sensor suffers ananomaly or displays performance variations, that sensor can be operated at differentvoltages or thresholds, or can be shut down altogether, without influencing theoperation of the other two sensors.

MEDIUM ENERGY NEUTRAL ATOM (MENA) IMAGER FOR THE IMAGE MISSION 135
4.3. DATA ACQUISITION
Two data acquisition cycles are defined for the MENA imager. These operate si-multaneously and asynchronously with respect to one another. In one cycle, thespacecraft spin is divided into 45 intervals, each 8 deg in azimuth, that are calledStartStop bins. Acquisition and reporting of the StartStop and Statistics data prod-ucts described below are based on this cycle. In the other cycle, ENA and anti-ENAviewing spin segments are defined based on the portion of the spin for which we doand do not expect ENA fluxes to be detected. Definition of the ENA and anti-ENAportions of the spin may be modified by uplink command. Near apogee, the ENAportion of the image will be Earthward viewing. Near perigee, the ENA portion ofthe image may be anti-Eathward viewing. Two commands per orbit can implementsuch a scenario. Error Singles and Image data products (also described below) arebased on the ENA/anti-ENA cycle. Error Singles are reported from both ENA andanti-ENA spin portions. The Image data products are only reported from the ENAportion of the spin.
The ENA spin segment is by default defined to be 128 deg wide and centered onlocal nadir. This definition may be adjusted by ground command. The definition ofthe ENA spin segment may be modified, for example, to view more tailward in thedawn/dusk orbital configuration, or to place the ENA spin segment in such a waythat facilitates ‘inside-out’ viewing as appropriate for observing at low altitudes.
4.4. SUN SAFING
The aperture UV gratings provide sufficient hydrogen Ly-α extinction to allowscience observations when viewing toward the Earth, but will not prevent largeMCP count rates whenever the Sun is within the MENA field of view. Thoughthe rates from viewing the Sun are not expected to be large enough to damage theMCPs on a short time scale, they may be large enough to reduce their lifetime.Therefore autonomous Sun safing is executed on orbit. Two algorithms are used.Periodic Sun safing reduces the MCP voltages every spin as the Sun spins throughthe MENA field of view and then returns them to their nominal values. This actionis based on a Sun pulse received from the CIDP (Gibson et al., 2000). The angularwidth and depth of the period of reduced MCP voltages may be adjusted by groundcommand. Emergency Sun safing is performed through on-board monitoring ofStart and Stop count rates. If either of these rates for any sensor exceeds a thresholdvalue more than a specified consecutive number of times, then the high voltagefor that sensor will be shut off and a flag will be set for reporting in telemetry.This condition will require intervention by ground operators to return that sensorto normal operation. The counting thresholds and number of exceedences allowedmay be modified by ground command.

136 C. J. POLLOCK ET AL.
5. Data Products
Four data product levels are produced. Level 0 data is the raw telemetry data. Level0 data is not distributed, but is instead used to derive Level 0.5 data, which isarchived at the National Space Science Center (NSSDC). Level 0.5 data consistsof the entire imager Level 0 data set, together with ancillary data such as calibrationfactors and standard facilities for converting the raw data to physical units and forretrieval and display. Level 0.5 data is stored and distributed on physical media inUniversal Data Format, described by Gurgiolo (2000). Level 0.5 data will form theprimary working set for scientific and engineering analysis. The description of theLevel 0 data products below also applies to Level 0.5. Level 1 data are a browseproduct derived from the Level 0.5 data set. Level 2 data products will be derivedfrom the Level 0.5 data set as the results of more advanced analysis.
5.1. LEVEL 0 DATA PRODUCT SET
Six data product types are delivered as MENA Level 0 data. These are listed inTable III and briefly described below. In view of the difficulty of species identifica-tion with MENA, we have selected a data reporting strategy that delivers as muchraw data as possible for ground-based analysis, while still delivering some imagesfor direct viewing.
The Image array elements are 8-bit representations of counts per accumulationthat have been lossy compressed from 16-bits according to a pseudo-logarithmicscheme, such that 3% accuracy is retained for all 16-bit values. Image data productsare by default subject to lossless compression in the CIDP. This can be changed byground command.
5.1.1. Statistics DataThe raw FEE data, in addition to Sensor ID and spin phase, are reported for asmany events as possible in the Statistics Data Product. Each event is reported asfour bytes. These four bytes contain information as listed in Table 3. The numberof bits reported for each quantity reduces the 8-bit knowledge available but retainssufficient resolution for our purposes. For example, eight degree resolution in polarangle requires a mean uncertainty in Start Position and Stop Position of 2 mm. Thewidth of the Start anode segment is 11 mm and that of the Stop anode segmentis effectively 73.5 mm. Thus one part in 5.5 and one part in 34 is the requiredresolution for the Start and Stop anode segments. This is provided by reporting 4bits and 7 bits, respectively.
Statistics data packets contain up to 128 events. All events reported in a packetare acquired only from a single StartStop spin bin, which is identified in the packetheader. The single bit provided in Statistics for Azimuth localizes an event to1
2 ofa StartStop bin, increasing the effective reported azimuth resolution to 4 deg.
If there are more valid events in a spin than can be reported in the availabletelemetry (approximately 13 000 events per spin, assuming no lossless compres-

MEDIUM ENERGY NEUTRAL ATOM (MENA) IMAGER FOR THE IMAGE MISSION 137
TABLE III
MENA data products
Image Data (counts per pixel)
16 polar angles× 32 azimuth
angles× 5 speeds× 3 sensors
Statistics (Raw Front End Electronics
Data; per event)
Start position, 4 bits
Start height, 6 bits
Stop position, 7 bits
Stop height, 6 bits
Time of flight, 6 bits
Fine azimuth, 1 bit
Sensor ID, 2 bits
StartStops Data
(counts per pixel)
Starts in 45 azimuth angles× 3 sensors
Stops in 45 azimuth angles× 3 sensors
Valid events in 45 azimuth angles× 3 sensors
ENA – Viewing Error singles
(Esingles; counts per pixel)
Hardware error (Illegal state machine condition)
TOF overflow (TSTOP– TSTART> preset threshold)
TOF underflow (TSTOP– TSTART> preset threshold)
Start height overflow (Start_Sum> preset threshold)
Start ratio overflow (Start_A/Start_Sum>preset threshold)
Start ratio underflow (Start_A/Start_Sum< preset threshold)
Stop height overflow (Stop_Sum> preset threshold)
Stop ratio overflow (Stop_A/Stop_Sum> preset threshold)
Stop ratio underflow (Stop_A/Stop_Sum< preset threshold)
Start-start (Two consecutive Starts without an
intervening Stop)
sion), Valid Event reporting in Statistics will be rationed. The rationing will bebased on the distribution of Valid Events acquired during the previous spin.

138 C. J. POLLOCK ET AL.
TABLE III
Continued.
Anti-ENA-Viewing Error singles
(Asingles; counts per pixel)
Hardware error (Illegal state machine condition)
TOF overflow (TSTOP– TSTART> preset threshold)
TOF underflow (TSTOP– TSTART> preset threshold)
Start height overflow (Start_Sum> preset threshold)
Start ratio overflow (Start_A/Start_Sum>preset threshold)
Start ratio underflow (Start_A/Start_Sum>preset threshold)
Stop height overflow (Stop_Sum> preset threshold)
Stop ratio overflow (Stop_A/Stop_Sum> preset threshold)
Stop ratio underflow (Stop_A/Stop_Sum< preset threshold)
Start-start (Two consecutive Starts without an intervening Stop)
Housekeeping (engineering data relevant to
Instrument health and safety)
∗Course azimuth (8 deg resolution) provided in Statistics data packet header. All events inpacket share same coarse azimuth.
TABLE IV
Speed and energy bands for the MENA image data products
Minimum speed Maximum speed Nominal speed∗ Nominal energy∗∗(km s−1) (km s−1) (km s−1) (keV; H)
438 669 565 1.6700
656 1003.5 848 3.7540
984 1505 1271 8.4387
1476 2256 1906 18.969
2214 3382 2858 42.641
∗RMS.∗∗Assumes hydrogen.
5.1.2. StartStops DataStarts, Stops, and Valid Events from each sensor are accumulated in 16 bit counterswhich are read out and reset every eight degrees of spin phase. The three resulting3× 45 element count arrays are then lossy compressed down to 8-bits each andpacketized for telemetry downlink.
5.1.3. Singles DataNumerous conditions can result in failure to declare a valid event even thoughStart and/or Stop MCP pulses have been detected (and counted). Ten of these have

MEDIUM ENERGY NEUTRAL ATOM (MENA) IMAGER FOR THE IMAGE MISSION 139
been identified and are reported separately for the ENA and anti-ENA segments ofspacecraft spin (32 spin bins each). They are also reported separately for the threesensors, giving two Singles arrays of size (3, 32, 10). These singles data productsundergo lossy compression, and are by default subject to lossless compression inthe CIDP. This can be changed by ground command. The ten error conditionsreported in Singles data are listed in Table III.
5.1.4. Housekeeping DataData relevant to engineering concerns and health and safety are reported in 212bytes of housekeeping data every spin. In view of the 2-min spacecraft spin pe-riod, many quantities such as voltage and temperature are reported as maximum,minimum, and mean values observed during the spin. Housekeeping data enjoysthe highest priority among data products for telemetry downlink. It is the only dataproduct reported in the Low and High Voltage Science modes which may not besubjected to lossless compression in the CIDP.
5.2. LEVEL 1 DATA
MENA Level 1 data will be derived directly from the Image data products (A1,A2, and A3) described above. Data from the three sensors and the three or fourlargest speeds will be combined to form a single contiguous 2D image of ENA fluxin units of #/(cm2 sr s). This image will span the range of polar angles from 20 to160 deg in 28 pixels, each 5 deg wide. There will be 32 pixels in azimuth, spanningthe range of the ENA spin segment. By default, each azimuth pixel will be 4 degwide such that the image will span the range from−64 to+64 degrees to eitherside of local nadir.
Figure 13 contains an example of the MENA level 1 browse product. The ENAfluxes shown here are generated from the ring current model of Fok et al. (1999)during a dipolarization event. Brief description of the ring current model and thesimulation results of a substorm injection can be found in the deconvolution paperin this issue (Perez et al., 2000). Figure 13 shows the integrated ENA fluxes fromthe upper 3 energy channels of MENA. The left panel shows the image at thebeginning of a geomagnetic dipolarization and the right panel at the end of thedipolarization. It can be seen that fluxes increase during the dipolarization (notethat different scales for 2 panels) and the enhanced region propagates earthward inresponse to the inductive electric field.
These Level 1 images will be extracted from the Level 0.5 data at GSFC, usingalgorithms provided by the MENA science team, and formed into both GIF andCDF files. They will be distributed along with other IMAGE data products to theentire IMAGE science team. They will also be made available to the scientificcommunity and the public both through the NSSDC and the GSFC IMAGE website.

140 C. J. POLLOCK ET AL.
Figure 13. Simulated ENA images from a hypothetical instrument with characteristics similar tothe MENA imager. These images are formed using a model for energetic ion fluxes before andafter a large scale geomagnetic reconfiguration where the magnetosphere transitions from a statecharacterized by a stretched out tail (a) to one where the tail field lines are much more dipolar (b).The region of enhanced ENA flux is located on the anti-sunward portion of the magnetosphere.Directions of the magnetic dipole and to the sun are shown. The color bars scale the ENA flux andare different for the two cases (a and b).
6. Calibration
The MENA imager has undergone extensive calibration at several levels. All flightFEE (FEETOF and FEEPHA) and HVPS cards were calibrated on the bench atSouthwest Research Institute (SwRI). All flight detector assemblies were calibratedusing point UV illumination under high vacuum at the University of Californiaat Berkeley. Every flight grating was characterized for UV and energetic parti-cle transmission under high vacuum at the Los Alamos National Laboratory (LosAlamos). Each of the three flight sensors was calibrated under illumination by H+,He+, and O+, incident from a variety of directions and with a variety of energies,under high vacuum at Los Alamos. End-to-end calibration of the MENA imagersystem, including all three sensors was conducted using both ions and ENAs underhigh vacuum at SwRI. A sampling of results from the end-to-end calibrations isgiven below.

MEDIUM ENERGY NEUTRAL ATOM (MENA) IMAGER FOR THE IMAGE MISSION 141
6.1. POLAR ANGLE MEASUREMENT
ENA polar angle is derived from the MENA Start and Stop positions as given byEquation (1). Uncertainty in the polar angle (angular resolution) is derived fromuncertainty in the Start and Stop positions as
|δα| = sin2(α)
L
√(δZp)2+ (δZT )2 , (3)
assuming that errors inzp andzt are uncorrelated. This equation can be cast strictlyin terms of Start and Stop positions with the following result:
|δα| = L√(δZp)2+ (δZT )2/(L2+ Z2
p − 2ZpZT + Z2p) . (4)
The task of polar angle calibration is to determine, for any pair of Start and Stopvalues, the most likely Start and Stop positions associated with the ENA, and thelikely uncertainty in those positions. This information allows identification of thepolar angle and its uncertainty according to Equations (1) and (4).
Polar angle calibration was accomplished by illuminating the aperture at a knownlocation with a narrow beam, while acquiring and recording the Statistics dataproduct. This was done at multiple locations and from multiple directions witha 31 keV proton beam, allowing a full range of known locations on the Startand Stop anodes to be sampled. A collimated broad beam was passed through anarrow (0.05 cm) slit upstream of the MENA imager, resulting in the pattern ofaperture illumination sketched in Figure 14. Figure 14 shows a front view of aMENA sensor (without the collimator), overlaid with the footprint of the narrowslit calibration beam. At any given angle, the imager was translated such that thenarrow beam was scanned across the narrow dimension of the aperture (up anddown in the figure). Data was acquired at each position, providing samples acrossthe full range of Start positions and a small (1 cm) range of Stop positions for asingle polar angle. Executing this routine at various polar angles allowed the entireStop anode segment to be calibrated.A priori knowledge of the beam positionwithin the aperture was not required, since decreases in count rates at the apertureedges on either side provided this information.
Figure 15 shows summary data from a single polar angle acquired in this man-ner. All data are plotted versus position in the chamber (different from sensor)frame of reference. StartStop count rates are plotted in the top three panels. Local-ization of counts to within the aperture is apparent. The five bottom panels displayspectrograms of the five raw FEE bytes, reported in the Statistics data product asdescribed above. The top two panels among these five show the Start Height andStart Position byte distributions. The Start position byte distributions vary acrossthe range as the position is incremented. The next two panels show the Stop Heightand Stop Position byte distributions. The Stop Position byte also varies with posi-tion, but not across the entire range since this plot displays data acquired at a single

142 C. J. POLLOCK ET AL.
Figure 14.Sketch of the footprint of narrow calibration beam upon the MENA aperture. A narrowbeam (black line) illuminates the complete width of the aperture for a given, fixed elevation angle. Forclarity, the aperture is shown without collimators. This pattern could be scanned across the aperture(in z-direction), while independently controlling the polar incidence angle.
polar angle. The TOF byte distribution displayed in the bottom panel shows valueslocalized to approximately 40, appropriate for this 31 keV proton beam.
Figure 16 shows a map of calibration points on the Sensor 2 Start and Stopanode segments obtained in this manner. Though the displayed dimensions areactually parallel, and not physically orthogonal to one another, this display formatprovides an effective summary of the coverage obtained. The horizontal lines showthe inner and outer limits of the two Stop anode segments. Note that groups ofdata points lie along lines slanted slightly upward to the right, which are groupsobtained at constant polar angles.
Samples of Start and Stop Position byte distributions obtained in the experi-ments described above yield the data shown in Figures 17(a) and 17(b), respec-tively. In each, we have performed a least squares Gaussian fit to the distribution.The logarithmic plot of the data reveals non-Gaussian characteristics of the distri-butions at first order and below. The blind spot in Stops is evident in Figure 17(b)between byte values 128 and 174. The small peak in the Stops near bin 120 is anartifact which will be removed from the raw data in software.
Summaries of data such as that shown in Figure 17 are shown in Figure 18.Here we show fitted gaussian centroids of the Start and Stop Position byte dis-tributions versus position within the aperture for Starts (Figure 18(a)), and versus

MEDIUM ENERGY NEUTRAL ATOM (MENA) IMAGER FOR THE IMAGE MISSION 143
Figure 15.Stack plot of MENA sensor 2 narrow slit calibration data. The top three panels showStartStop count rate data (Starts, Stops, and Valid Events). The lower five panels provide spectro-grams of the five raw front-end electronics bytes. The grey scale represents count rates, as functionsof position and byte value. The position axis representsz-coordinate of the narrow beam footprint(refer to Figure 14) in the frame of reference of the calibration chamber.
position projected geometrically onto the Stop anode segment in the case of Stops(Figure 18(b)). The error bars represent FWHM of the distributions, derived fromthe fitted Gaussian widths. The linear response of the system is evident. In theStops distributions, the error bars expand near the edges of the anode segments.Completion and synthesis of this type of analysis for the entire data set representedin Figure 16 for all three sensors will be required to form images from the dataobtained once IMAGE is in orbit.

144 C. J. POLLOCK ET AL.
Figure 16.Map of the narrow slit calibration coverage for MENA sensor 2. Dashed lines indicate theinner and outer limits of the two Stop anode segments.
The analysis just outlined addresses only a single mass at a single energy –and a high energy case at that. ENAs with larger mass and smaller energy willyield similar results with larger error bars because of scattering within the foils,as discussed earlier. The MENA calibration data set includes sufficient energy andmass sampling to quantify this effect.
6.2. TIME-OF-FLIGHT CALIBRATION
Data were acquired in the calibration laboratory using species, energies, and polarangles sufficient to sample a wide range of times-of-flight (TOF) for all three sen-sors. TOF byte distributions from the Statistics data product have been analyzed fora small portion of that data. The results are summarized in Figure 19. Here we plotthe mean value of TOF byte versus expected TOF based on the input ENA energy,mass, and angle of incidence. The large error bar associated with the data point near160 ns TOF is due largely to energy and angular scattering of the 3.9 keV O beam.Though we have not yet analyzed the calibration data, we fully expect to observesimilar smearing in the polar angle distributions for this species and energy. Thesehigh mass, low energy data show the limitations of the current technology.
6.3. SENSITIVITY AND FIELD OF VIEW
A simple method was used to measure the absolute sensitivity and limits on theMENA imager fields of view. The entire aperture was illuminated with a collimatedbroad beam of known flux from a wide range of directions spanning the 2D fieldof view. Under these circumstances, the ratio of the Valid Event rate reported in

MEDIUM ENERGY NEUTRAL ATOM (MENA) IMAGER FOR THE IMAGE MISSION 145
Figure 17.Histograms of count rates in the Start (a) and Stop (b) position bytes from a single positionin the narrow slit calibration.

146 C. J. POLLOCK ET AL.
Figure 18.Fitted Gaussian centroids for Start (a) and Stop (b) position byte distributions plottedversus the measuredz-coordinate of the narrow beam footprint within the aperture for Starts, andthe nominalz-coordinate of ENA impact on the detector for Stops. Error bars are derived as FWHMusing the fitted Gaussian widths.
Figure 19.Fitted Gaussian centroids for TOF byte distributions plotted versus nominal time of flightfor an incident calibration beam. Error bars are derived as FWHM using the fitted Gaussian widths.

MEDIUM ENERGY NEUTRAL ATOM (MENA) IMAGER FOR THE IMAGE MISSION 147
Figure 20.MENA imager valid event rate in Hz for exposure of a single sensor to a broad beam froma wide range of azimuth and elevation angles.
the StartStops data product to the magnitude of the incident flux yields a directmeasure of the sensor effective area as a function of both polar angle and azimuthangle. Displays of this quantity in the case of Sensor 2 are contained in Figure 20.Integral moments of this distribution, approximated using numeric sums, providethe single sensor geometric factor in units such as cm2 sr. They also provide thesize of the fields of view in azimuth and polar angle. Figures 21(a) and 21(b)display preliminary results of analysis of data such as that in Figure 20. Notethat the polar angles plotted in Figure 21 are in the vacuum chamber frame ofreference, which is offset from the Sensor 3 frame of reference by 20 degrees.Figure 21(a) shows effective area plotted differentially with respect to polar anglefor MENA flight Sensor 3. The effective area for this single sensor maximizesat a value∼0.175 cm2 near polar angles of 12 deg with respect to sensor normal.Figure 21(b) demonstrates that the FWHM azimuthal field of view (and resolution)varies somewhat with sensor polar angle but has a mean value near 5 degrees.
7. Ground System
MENA data will be processed to Level 0.5 and distributed along with spacecraft or-bit and attitude (OA) data, and other ancillary data in Universal Data Format (UDF)(Gurgiolo, 2000) to IMAGE team institutions. The distribution medium will bedigital video diskette (DVD). At SwRI, the data will be ingested and placed onlineon two redundant servers. Both servers will provide identical data structures butdifferent default client interfaces. One server will provide data access and browseproducts through a web interface to the general scientific community. The otherwill serve the MENA science team at SwRI and elsewhere. In the event one serveris disabled, the other will provide both functions until the situation is rectified. Theentire MENA data set will remain online for the duration of the IMAGE mission.

148 C. J. POLLOCK ET AL.
Figure 21.Subsets of the data shown in Figure 20. (a) shows sensor effective area at a single azimuthangle. (b) shows the second integral moment (with respect to azimuth) of the distribution in Figure 20.This result is interpreted as the FWHM of the azimuth (spin) angle pass band. Both quantities areplotted as a function of incident polar angle.
8. Summary
The MENA imager, together with the other scientific instruments on IMAGE, ispoised to provide the data upon which breakthrough scientific understanding canbe achieved regarding our planetary magnetosphere and ionosphere. Global scaleobservation of magnetospheric response to the solar wind driver will foster intuitiveunderstanding of system properties.
In this paper we have described the goals and broad objectives of theIMAGE/MENA project. We have described the MENA imager and its principles ofoperation, and have shown examples of measured component and instrument levelperformance. We have described instrument data products and, briefly, the grounddata system. The reader hopefully has gained an understanding of what we aretrying to accomplish, how we are going about it, and a vision of how the MENAand other imager data sets can contribute to the study of magnetospheric physics.

MEDIUM ENERGY NEUTRAL ATOM (MENA) IMAGER FOR THE IMAGE MISSION 149
The simulated images in Figure 13 provide a realistic forward-looking esti-mate of what one might see when looking at the magnetosphere through MENAeyes. The transition from stretched (pre-substorm) to more dipolar (after expansionphase) tail configuration is reflected in the ENA images. Note that the image onthe left is more elongated anti-Earthward (stretched tail), while that on the rightis less so; the emitting region is more bulbous in the case of the post expansionphase magnetosphere on the right. The tail has unloaded. The geomagnetic fieldhas undergone a dipolarization (Fok et al., 1999). The electric current supportingthe stretched tail field has been diverted and/or undergone collapse. The result ofthis process is the ‘snap’ to a more dipolar configuration. Details of global scaleenergetic ion transport and ion energization associated with this global transitionin magnetic topology will be revealed, as in this demonstration (Figure 13).
The challenges of neutral atom imaging and other forms of large-scale globalsystem sampling are only now dawning on the global scientific and technical com-munity. For ENA imaging, the low flux level is a determining constraint. As thegeocoronal density falls off with Earth-centered radial distance, the ENA produc-tion rate per energetic ion falls off proportionally. Signal levels from the high-altitude magnetosheath, the down-tail plasma sheet, and magnetopause or near-tailreconnection sites are typically quite low for this reason. This can be overcome bydeploying future imagers with large effective area, or by employing long accumu-lation periods (untenable for studying dynamic processes).
It is interesting and useful to conjecture about what we will observe and learnwith IMAGE, and about how future generations of ENA imagers will evolve.Standing on the shoulders of authors cited and others, we anticipate the MO/DAphase of IMAGE with curiosity and optimism.
Appendix A
The MENA imager is designed for a two-year mission aboard the IMAGE satellite.This program is one of NASA’s Medium-class Explorer missions. As such, allelectrical and electronic parts are required to meet Grade 3 or better screeninglevels. Electronics on the IMAGE satellite are expected to accumulate a total doseof 30 krad (Si) behind 0.200′′ aluminum walls. Parts used for MENA electronicsmeet a design goal of 60 krad (Si) total dose or else they have extra shielding.
The total mass of the MENA imager is 13.9 kg. It requires 0.8 A of 28 Vspacecraft power for normal operations. The instrument maintains isolation fromthe spacecraft power bus. It uses RS-422 differential signaling to communicatewith the spacecraft. All instruments on the IMAGE satellite are required to passMIL-461C EMI tests. MENA passed all aspects of the EMI testing with no waiversrequired.
The MENA imager is composed of three identical sensor heads, positioned atoffset angles to reduce the effects of the blind-spot that is inherent to the sensor

150 C. J. POLLOCK ET AL.
design. To service the sensor heads, there are three identical sets of front-end elec-tronics. The front-end electronics include a high voltage power supply (HVPS),a pair of Charge Amplifiers (CHAMPS), a time of flight board (FEETOF), and apulse height analysis board (FEEPHA). These three sets of front end electronicsare operated using the four other boards in the instrument: the look-up table board(LUT), the high voltage and pulser control board (HVPC), the central processingunit board (CPU), and the low voltage power supply board (LVPS).
The sensor requires three different high voltage supply levels. A+4 KV supplyis used to power the micro-channel plates (MCPs). A+10 KV supply is requiredfor the collimator plates to sweep out ions. A−1 KV supply provides an acceler-ation potential for secondary electrons from the carbon foil. Each sensor head issupplied by its own independent High Voltage Power Supply board (HVPS).
Each HVPS is a single circuit board (4.8′′ × 5.3′′) that provides 3 outputs(+4 KV, +10 KV, and−1 KV). There are actually two−1 KV outputs on eachboard and they are diode OR-ed together to provide redundancy. The+4 KV outputproduces more than 54µA at full voltage, the+10 KV output produces more than12 µA at full voltage, and the−1 KV output produces more than 35µA at fullvoltage.
The HVPS boards are very robust. The outputs are ‘zap trapped’ to providea protective current path if an arc should occur in the load. The supplies safelydrive a dead short indefinitely and have a small overshoot (<10%) on short circuitrecovery. The outputs of the HVPS may be shorted to ground while at full voltagewithout damaging the supplies. Finally, the HVPS boards are parylene coated foradditional protection. Parylene is a conformal coating with a very high dielectricstrength.
The CHAMPS are a high speed, discrete design. A JFET input stage is followedby a pair of RF transistors for current gain. Then a shaping network produces abipolar pulse. An operational amplifier in the final stage has high gain in the narrowfrequency band of the bipolar pulse and is capable of driving the coaxial outputcable. The CHAMPS are adjusted to provide a gain of 0.15 V/pC. Their noise flooris 0.6 mV r.m.s. and their maximum output without any distortion is 7 V.
The CHAMPS also perform a summation of the A and B wedges of the anode.Each CHAMP provides an A and an A+B output. This output is the most conve-nient form for processing by the FEETOF and FEEPHA boards. The amplitude ofthe sum, A+B, is not modulated by location on the anode and is therefore usefulfor TOF work and to determine total charge.
The bipolar pulses are used to prevent a shift up in the baseline when there isa pileup of pulses. This would affect the accuracy of the pulse height analysis andthe accuracy of our position measurement. The zero crossing of the bipolar pulseoccurs at a fixed time after every MCP charge dump. Like a pendulum, the zerocross time is theoretically independent of pulse height. In practice the variation isvery small and provides an excellent way to determine TOF using a simple zerocrossing circuit.

MEDIUM ENERGY NEUTRAL ATOM (MENA) IMAGER FOR THE IMAGE MISSION 151
The FEETOF and FEEPHA have a board to board connector that allows themto work as a single unit. Both boards’ circuitry is held in reset until the Start Sumsignal exceeds the minimum threshold that has been set by software command.Once the threshold has been broken, a fast, low dispersion comparator (AD9696) isused to detect the zero crossing of the Start Sum bipolar pulse. This signal is usedto steer a 6 mA constant current source into a 2000 pF polycarbonate capacitor(M87217/01). A similar circuit is used to process the Stop Sum signal, whichis used to steer the constant current source away from the 2000 pF capacitor. A15 nS delay is inserted into the path of the Stop Sum signal so that the circuitturn on and turn off times don’t cause non-linearities for small times-of-flight. Thevoltage on the 2000 pF capacitor is digitized by an A/D converter (7672RP) andthen subsequently cleared. The times-of-flight that the FEETOF measures rangefrom 5 nS to 350 nS.
The FEEPHA detects the peak of all four signals from the CHAMP: Start (A),Start Sum (A+B), Stop (A), and Stop Sum (A+B). These peaks are held and anynoise inputs during the conversion process will not corrupt their values. An analogdivider is used to divide the Start signal by Start Sum Signal to create the StartPosition signal. An analog divider is also used to create the Stop Position Signal.The analog dividers are given time to settle and then the results are digitized byA/D converters (7672RP). The Start Sum and Stop Sum signals are also digitizedto yield Start Height and Stop Height.
The FEETOF and FEEPHA then signal that a valid event has been acquired.The event is read out and processed by a state machine that is running inside afield programmable gate array (FPGA) on the LUT board. Besides valid events,the FEETOF and FEEPHA check for several error conditions. These include: Startevent followed by a second Start event, Ratio overflow, Ratio underflow, StartSum overload, Stop Sum overload, Time-to-Amplitude (TAC) underflow, and TACoverflow. In order to decrease the dead time of the front end electronics, some ofthese errors cause the conversion cycle to be immediately terminated. This reducesour susceptibility to noise caused by UV photons. Another piece of diagnosticinformation that the FEETOF board sends down to the LUT board is the raw EventStart and Event Stop digital signals that are generated every time the threshold isbroken. This allows the system to determine total count rates without any maskingcaused by the dead time.
The Look-Up Table board (LUT) processes all of the events that are generatedby the three sensor heads. When a valid event has occurred, the LUT board readsout the data from the FEETOF and FEEPHA that captured it. Then it clears theFEETOF and FEEPHA to re-arm them to capture the next event. There are fivebytes of raw data which are read from the front end electronics: time-of-flight, startposition, start height, stop position, and stop height. The LUT cascades these rawbytes through a series of look-up tables that are stored in EEPROM (electricallyerasable programmable read only memory). In principle, these tables allow theinstrument to compute the angle, speed, species, and energy of the ENA that caused

152 C. J. POLLOCK ET AL.
the event. This information, along with the spin angle of the spacecraft, is usedto form a seventeen-bit event address into the science image memory. The eventcount at this address is then incremented. This process can be used to form anarray of images with each image in the array corresponding to a different speciesand energy range, though in practice we form the Image data product assumingHydrogen; species determination will be pursued in the ground based analysis,using the Statistics data product. The science image memory is double buffered sothat one spacecraft spin of data can be collected while the previous spin’s data isbeing transferred. The LUT also counts the error events and total starts and totalstops so that these can be transferred down in the telemetry data. Finally, the LUTpasses the raw data bytes from the front end electronics to the CPU so that it cancollect statistics data. This data path allows us to pass the raw events down in ourtelemetry data.
The CPU board uses an RTX2010 micro-controller. Its job is to execute thecommands that are received from the spacecraft and to process instrument sciencedata into packets and transmit it to the spacecraft. It performs a lossy 16-bit to8-bit compression on the science images using a look-up table. The CPU boardalso collects and reports housekeeping data. The data communication between theinstrument and the spacecraft is done over RS-422 signal lines. The spacecraftprovides pulses to the CPU that allow it to monitor the spin of the spacecraft anddetermine nadir as well as the location of the Sun. The CPU uses this informationto periodically dip the voltage on the MCPs when they are about to have directexposure to the Sun. The processor’s code is stored in EEPROM so that it can bemodified while on orbit.
Acknowledgements
This paper and the work it describes could not exist without the dedicated ef-forts of countless individuals at many levels. The many contributors include RudyAbeyeta, Janice Anderson, Tom Booker, Pat Casey, Michelle Chippie, Kathy Co-ers, Ken Cook, Dan Everett, Bob Fleming, Carrie Gonzalez, Pat Gonzalez, BrianGupta, Ron Harper, Pat Hindle, Ernest Mayfield, Bill McLaren, John McLeod,Greg Palacios, Norm Pelletier, Benny Piepgrass, Jane Prentiss, Adrian Ramirez,Syrrell Rogillio, Dorothy Rosales, John Rudzki, Y. Saito, James Sanders, MarySattler, Tony and Norma Sawka, Stanley Silvus, Kirk Smith, Brian Stone, JackTaguiam, Glenda Waters, Edie Wilson, and Dave Young. The authors appreciateuseful conversations with Steve Fuselier, Don Mitchell, Joe Perez, and Ed Roelofon the topic of ENA imaging, Dave Slater and Ossy Siegmund regarding detectorfunction, and innumerable others from whom good advice was given. This workwas supported at SwRI under NASA Contract NAS 5-96020. Work at the LosAlamos National Laboratory was carried out under the auspices of the U. S. De-partment of Energy with financial support from the NASA IMAGE Program. Work

MEDIUM ENERGY NEUTRAL ATOM (MENA) IMAGER FOR THE IMAGE MISSION 153
at MIT, UCB, and WVU was performed under subcontract to SwRI. Work at theUniversity of Southern California was performed under subcontracts from SwRIand Los Alamos.
References
Balkey, M. M., Scime, E. E., Schattenburg, M. L. and van Beek, J.: 1998, ‘Effects of Gap Width onEUV Transmission Through Sub-Micron Period, Free-Standing Transmission Gratings’,AppliedOptics37, 5087–5092.
Fok, M.-C., Moore, T. E. and Delcourt, D. C.: 1999, ‘Modeling of Inner Plasma Sheet and RingCurrent During Substorms’,J. Geophys. Res.104, 14,557–14,569.
Frank, L. A., Craven, J. D., Ackerson, K. L., English, M. R., Eather, R. H. and Carovillano, R. L.:1981, ‘Global Auroral Imaging Instrumentation for the Dynamics Explorer Mission’,Sp. Sci.Instrum.5, 369–393.
Frank, L. A., Craven, J. D., Burch, J. L. and Winningham, J. D.: 1982, ‘Polar Views of the Earth’sAurora with Dynamics Explorer’,Geophys. Res. Lett.9(9), 1001–1004.
Funsten, H. O., McComas, D. J. and Barraclough, B. L.: 1993, ‘Ultrathin Foils Used for Low EnergyNeutral Atom Imaging of Planetary Magnetospheres’,Opt. Eng32, 3090–3095.
Gibson, W. C. et al.: 2000, ‘The IMAGE Observatory’,Space Sci. Rev.91, 15–50 (this issue).Gurgiolo, C.: 2000, ‘The IMAGE High-Resolution Data Set’,Space Sci. Rev.91, 461–481 (this
issue).Gruntman, M. A: 1995, ‘Extreme Ultraviolet Radiation Filtering by Freestanding Transmission
Gratings‘,Appl. Opt.34, 5732–5737.Gruntman, M. A.: 1997, ‘Energetic Neutral Atom Imaging of Space Plasmas’,Rev. Sci. Instrum.68,
3617–3656.Hall, L. A.: 1985, ‘Solar Ultraviolet Irradiance’, in A. S. Jursa (ed.),Handbook of Geophysics and
the Space Environment, Air Force Geophysics Laboratory.Mauk, B. H. and Meng, C.-I.: 1983, ‘Characterization of Geostationary Particle Signatures Based on
the ‘Injection Boundary’ Model’,J. Geophys. Res.86(A4), 3055–3071.McComas, D. J., Funsten, H. O. and Scime, E. E.: 1998, ‘Advances in Low Energy Neutral Atom
Imaging’, in R. Pfaff, J. Borovsky and D. T. Young (eds),Measurement Techniques for SpacePlasmas (Fields), American Geophysical Union, Washington, AGU Monograph 103, 275–280.
McComas, D. J., Funsten, H. O., Gosling, J. T., Moore, K. R., Scime, E. E. and Thomsen, M. F.:1994, ‘Fundamentals of Low-Energy Neutral Atom Imaging’,Opt. Eng.33(2), 335–341.
McComas, D. J., Barraclough, B. L., Elphic, R. C., Funsten, H. O. III and Thomsen, M. F.: 1991,‘Magnetospheric Imaging with Low-Energy Neutral Atoms’,Proc. Natl. Acad. Sci.88, 9598–9602.
Meier, R. R.: 1991, ‘Ultraviolet Spectroscopy and Remote Sensing of the Upper Atmosphere’,SpaceSci. Rev.58, 1–186.
Mende, S. B. et al.: 2000, ‘Far Ultraviolet Imaging From the IMAGE Spacecraft: 1. System Design’,Space Sci. Rev.91, 243–270 (this issue).
Mitchell, D. G. et al.: 2000, ‘High Energy Neutral Atom (HENA) Imager for the IMAGE Mission’,Space Sci. Rev.91, 67–112 (this issue).
Moore, T. E., Arnoldy, R. L., Feynman, J. and Hardy, D. A.: 1981, ‘Propagating Substorm InjectionFronts’,J. Geophys. Res.86, 6713.
Moore T. E. et al.: 2000, ‘Low Energy Neutral Atom (LENA) Imager for the IMAGE Mission’,SpaceSci. Rev.91, 155–195 (this issue).
Perez, J. D., Fok, M.-C. and Moore, T. E.: 2000, ‘Deconvolution of Energetic Neutral Atom Imagesof the Earth’s Magnetosphere’,Space Sci. Rev.91, 421–436 (this issue).

154 C. J. POLLOCK ET AL.
Ritzau, S. M. and Baragiola, R. A.: 1995, ‘Electron Emission from Thin Carbon Foils by keV Ions’,Phys. Rev. B44, 2529–2538.
Scime, E. E, Anderson, E. H., McComas, D. J. and Schattenburg, M. L.: 1995, ‘Extreme-UltravioletPolarization and Filtering with Gold Transmission Gratings’,Appl. Opt.34, 648–654.
Van Beek, J. T. M, Fleming, R. C., Hindle, P. S., Prentiss, J. D., Schattenburg, M. L. and Ritzau, S.:1998, ‘Nanoscale Freestanding Gratings for Ultraviolet Blocking Filters’,J. Vac. Sci. Technol.B16(6), 3911–3916.
Williams, D. J., Roelof, E. C. and Mitchell, D. G.: 1992, ‘Global Magnetospheric Imaging’,Rev.Geophys.30(3), 183–208.