medigap reform legislation of 1990: a 10-year … reform legislation of 1990: a 10-year review peter...
TRANSCRIPT
The 1990 Medigap reform legislationsought to make it easier for consumers tocompare policies, provide market stability,promote competition, and avoid adverseselection. Evidence is that the standardiza-tion of benefits has simplified consumerchoice and is strongly supported by con-sumers and State regulators. The 1990reforms also decreased carrier and agentabuses. However, loss ratios (the proportionof premiums paid in benefits versus beingretained for administration and profit)have changed little since 1990, bringinginto question whether price competition hasbeen enhanced. The prescription drug bene-fit, which is included in 3 of the 10 stan-dardized plans, provides only limited finan-cial protection yet is expensive, one reasonbeing adverse selection. Access to coveragefor Medicare disabled beneficiaries is prob-lematic in most States.
INTRODUCTION
Since the inception of the MedicareProgram, beneficiaries have purchasedindividual supplemental insurance—knownas Medigap—which reimburses forMedicare cost sharing and selected ser-vices that Medicare does not cover. An esti-mated 27 percent of beneficiaries haveMedigap coverage, second only to the 36percent who have coverage from a former
or current employer (Rice and Bernstein,1999). Approximately 15 percent are cov-ered by Medicare managed care plans.However, enrollment in these plans peakedin November 1999 at 6,356,000, decliningto 4,963,000 in August 2002, a 22-percentdecline (Centers for Medicare & MedicaidServices, 2003), underscoring the criticalrole that Medigap plays in supplementingMedicare coverage.
The Medigap market changed dramati-cally with the passage of the OmnibusBudget Reconciliation Act (OBRA) of 1990.That legislation, most of whose provisionswent into effect in 1992, requires that allnew Medigap policies sold conform to 1 of10 standardized benefits packages, labeledPlans A through J.1 Other provisions ofOBRA 1990 include the following: • Higher requirements for loss ratios,
which is the percent of the premium dol-lar that is paid in benefits rather thanbeing used for administration and profit.Minimum loss ratios were set at 65 per-cent for individual policies and 75 per-cent for group policies. Failure to meetthese standards generates requirementsfor premium refunds.
• Severe penalties on agents or insurerswho knowingly sold duplicate policies.
• Limitations on agent commissions dur-ing the initial year of coverage to nomore than twice the commissions forrenewal policies. This provision isintended to discourage agents fromchurning, i.e., inducing beneficiaries toswitch policies in order to generate com-mission income.
HEALTH CARE FINANCING REVIEW/Spring 2003/Volume 24, Number 3 121
Peter D. Fox is with PDF, LLC; Rani E. Snyder is with theDonald W. Reynolds Foundation; and Thomas Rice is with theUCLA School of Public Health. This research was supported bya grant from the Changes in Health Care Financing andOrganization initiative of The Robert Wood Johnson Foundation.The views expressed in this article are those of the authors anddo not necessarily reflect the views of PDF, LLC; Donald W.Reynolds Foundation; UCLA School of Public Health; or theCenters for Medicare & Medicaid Services (CMS).
Medigap Reform Legislation of 1990: A 10-Year ReviewPeter D. Fox, Ph.D., Rani E. Snyder, M.P.A., and Thomas Rice, Ph.D.
1 The 10 benefit packages were designed by an advisory groupthat was convened by the National Association of InsuranceCommissioners (NAIC).

• A requirement that insurers hold a 6-month open enrollment period whenbeneficiaries who are 65 or over firstenroll in Part B of Medicare. During thatperiod, a person can purchase any policyoffered regardless of health status andreceive the carrier’s most favorable rate.
• Limitations on pre-existing conditionexclusions to no more than 6-monthsduration.We conducted a study from 1992 to 1995
on the impact of this legislation on the performance of the Medigap market(McCormack et al., 1996). That study con-cluded that most of the objectives of thelegislation appeared to have been met.Consumers were better able to makechoices because comparing the policiesacross carriers was facilitated, marketingabuses had declined, and the level of com-petition was adequate. However, since themost recent data used in that study werefrom early 1995, less than 3 years afterimplementation, how the market wouldbehave in the long run was not yet clear.
This article examines the Medigap mar-ket a decade after the implementation ofthe OBRA-1990 reform provisions. Like theprevious one, the findings reflect site visitsto six States; interviews with insurance car-riers, government officials, and policymak-ers; and analyses of Medigap sales trends.The article addresses the following ques-tions:• What policies are most popular with con-
sumers, including two variants on thestandardized plans, i.e., (1) plans with limit-ed networks, known as Medicare SELECT,and (2) plans with high deductibles?
• Are Medicare disabled, who do not comewithin the scope of the Federal openenrollment provisions, able to obtainMedigap policies?
• How expensive are Medigap policies, howhas this changed over time, and what pat-terns are there among the 10 plan types?
• Is prescription drug coverage available,and is there evidence of adverse selec-tion?
• What is the impact of the Medigapreform provisions on consumers?
• Should the standardized benefit pack-ages be restructured?The concluding section raises a number
of overarching issues associated withFederal regulation of the Medigap market.
DATA SOURCES
The information compiled for this studywas collected from several sources. First,we conducted site visits in fall 2001 to theinsurance departments in six States:Florida, Missouri, New York, South Carolina,Texas, and Washington. These Stateswere also site-visited as part of the previ-ous study (McCormack et al., 1996). Theywere selected to provide variation in geog-raphy, population, and regulatory environ-ment. In each of these States, we met withthe principal staff to discuss topics such as:trends in the Medigap market, policy ben-efits, policy filings, premiums, reportingrequirements, consumer information, com-plaints, Medicare SELECT, and impacts ofthe Medicare+Choice (M+C) program onthe Medigap market. Typically, six to eightstaff members were interviewed in eachState.
Second, trend data were requested fromthe six States on the number of carriersselling Medigap policies in the State andon consumer complaints. Also, in our pre-vious study (McCormack et al., 1996), datawere obtained on premiums and sales foreach policy type (A-J) for the five largestcarriers in the State for the year 1994.2 Inthe current study the same data wereobtained for the same carriers for the years1997 and 2000, thus generating a timeseries that spans 6 years.
122 HEALTH CARE FINANCING REVIEW/Spring 2003/Volume 24, Number 3
Third, we conducted telephone interviewswith 15 insurance carriers that sell Medigappolicies. Respondents were queried aboutsuch issues as sales trends and otherchanges in the market, how premiums areset, experience with biased selection, issuesregarding prescription drugs, whether theopen enrollment provisions for the agedshould also apply to Medicare disabled ben-eficiaries, experiences with Federal andState regulators, as well as their opinionsabout how public policy and regulation ofthe market might be changed.
Finally, telephone interviews were con-ducted with some 20 Federal officials, rep-resentatives of interest groups, and policy-makers in order to obtain factual informa-tion and to elicit the perspectives of keystakeholders about market trends, successesand failures of Medigap and Medigap regu-lation, and recommendations for policychanges.
FINDINGS
Policy Offerings and Sales
The period immediately following theimplementation of policy standardization in1992 found fewer insurance carriers offer-ing Medigap plans. Most of the carriersthat exited the market had small marketshares and had difficulty being price com-petitive with the large carriers, in partbecause they faced diseconomies of scalein such activities as marketing, claims processing, and regulatory compliance(McCormack et al., 1996).
Respondents from the six State insur-ance departments report that both thenumber of carriers and market share intheir respective States have been stable thelast several years. Similarly, most insur-
ance carriers interviewed report that theirrespective market shares have also remainedrelatively stable, with some experiencingfluctuations based on factors such as thepenetration of M+C plans, premium-settingpolicies, and whether their marketingdepartments were pushing Medicare sup-plemental products. The largest carrier,United Healthcare, the agent for AARP,accounts for approximately 21 percent ofthe market, with a number of (generally,State-based) BlueCross® and BlueShield®
plans garnering a large portion of theremainder (National Association ofInsurance Commissioners, 2001b). Amongcarriers that increased their market sharein recent years, the main reason is relatedto M+C plan withdrawals. Some Medigapcarriers have advertised their stability inthe face of uncertain health maintenanceorganization (HMO) offerings.
Table 1 displays the benefits covered byeach of the standardized plans. It alsoshows estimates of the distribution of salesin 2000 based on data from two sources:(1) five of the six site-visited States (all butSouth Carolina, which declined to providethe data)3 and (2) the Medicare PaymentAdvisory Commission (MedPac) (MedicarePayment Advisory Commission, 2002). Thelatter source, which uses data from theNAIC, is more comprehensive; the formeris of value principally in that it has been col-lected longitudinally and thus permits ananalysis of trends.
Plans C and F remain very popular,accounting for 54.1 percent of sales betweenthem based on the five-State data, anincrease from our prior work, which esti-mated that, in 1994, 47.5 percent of Medigapenrollees were in one of these two plans.MedPAC places the combined enrollmentin Plans C and F at 61 percent. Both planscover all Medicare cost sharing; the differ-
HEALTH CARE FINANCING REVIEW/Spring 2003/Volume 24, Number 3 123
2 That study also collected information on policy benefits andpremiums of these five carriers in 1991, the year prior to stan-dardization, so that we could assess how the OBRA-1990 legisla-tion affected policy benefits (Rice, Graham, and Fox, 1997).
3 The percentages represent an average of the estimates for eachof the States; thus each State has equal weight.

124 HEALTH CARE FINANCING REVIEW/Spring 2003/Volume 24, Number 3
Tab
le 1
Ben
efit
s C
over
ed b
y S
tan
dar
diz
ed P
lan
s an
d P
erce
nt
Dis
trib
uti
on
of
Sal
es:
2000
Ben
efit
AB
CD
EF
GH
IJ
Cor
e B
enef
itsx
xx
xx
xx
xx
xS
kille
d N
ursi
ng F
acili
ty C
oins
uran
ce–
–x
xx
xx
xx
xM
edic
are
Par
t A
Ded
uctib
lex
xx
xx
xx
xx
Med
icar
e P
art
B D
educ
tible
––
x–
–x
––
–x
Med
icar
e P
art
B E
xces
s C
harg
es–
––
––
Hig
hLo
w–
Hig
hH
igh
For
eign
Tra
vel
––
xx
xx
xx
xx
At-
Hom
e R
ecov
ery
––
–x
––
x–
xx
Pre
scrip
tion
Dru
gs–
––
––
––
Low
Low
Hig
hP
reve
ntiv
e M
edic
al C
are
––
–x
––
––
–x
Per
cent
Dis
trib
utio
n of
Sal
es (
Fiv
e-S
tate
Dat
a)4.
012
.618
.610
.62.
935
.62.
72.
87.
43.
7D
istr
ibut
ion
of S
ales
(M
edP
ac D
ata)
10.0
10.0
26.0
6.0
2.0
35.0
3.0
2.0
3.0
4.0
NO
TE
S:C
ore
bene
fits
incl
ude
cove
rage
of
all P
art
A c
oins
uran
ce fo
r st
ays
long
er t
hat
60 d
ays,
the
20-
perc
ent
coin
sura
nce,
the
Par
ts A
and
B b
lood
ded
uctib
le,
and
365
lifet
ime
rese
rve
days
of
inpa
tient
car
e.Lo
w P
art
B e
xces
s ch
arge
cov
erag
e pa
ys 8
0 pe
rcen
t of
the
diff
eren
ce b
etw
een
the
phys
icia
n's
char
ge a
nd t
he M
edic
are
allo
wab
le r
ate;
high
cov
erag
e pa
ys 1
00 p
erce
nt o
f th
e di
ffere
nce.
Low
pre
scrip
tion
drug
cove
rage
has
a $
250
annu
al d
educ
tible
, 50
-per
cent
coi
nsur
ance
, an
d a
max
imum
ann
ual b
enef
it of
$1,
250;
high
cov
erag
e is
iden
tical
exc
ept
that
the
max
imum
ann
ual b
enef
it of
$3,
000.
Med
Pac
is M
edic
are
Pay
men
t A
dvis
ory
Com
mis
sion
.
SO
UR
CE
S:S
ite v
isits
to
Flo
rida,
Mis
sour
i, N
ew Y
ork,
Tex
as,
and
Was
hing
ton
(Sou
th C
arol
ina
decl
ined
to
prov
ide
data
), 2
001;
and
(Med
icar
e P
aym
ent
Adv
isor
y C
omm
issi
on,
2002
).

ence is that Plan F, but not plan C, covers100 percent of physician balanced billing.Plan B is also popular, accounting for 12.6percent of enrollees as estimated by the five-State data and 10 percent in the MedPACestimates; the difference between Plans Aand B is that the latter covers the Part Adeductible. The three plans that cover pre-scription drugs, H, I, and J, togetheraccount for only 13.9 percent (9 percent inthe MedPAC estimates) compared with ourprior estimate for 1994 of 15.5 percent.
Variants of the Standardized Plans
Federal law allows carriers to sell twovariants of the standardized plans: MedicareSELECT and high-deductible plans.Medicare SELECT plans have the samebenefits design as the standardized plansbut with the added restriction that theenrollee must receive services through thecarrier’s contracted network in order toreceive full Medigap benefits. (Medicarebenefits are payable regardless.) MedicareSELECT was authorized by OBRA-1990 asa 15-State demonstration and became anational program in 1995. The objectivewas to allow carriers to contract with a lim-ited network of providers. The intent wasthat these providers would waive Medicarecost sharing in return for greater patientvolume, with the resulting savings beingpassed along to the consumer in the formof premium reductions. Federal regula-tions allow waiver of cost sharing for Part Aservices only, and Medigap carriers thatoffer a SELECT product have mostly con-tracted with hospitals to waive the Part Adeductible.4 That deductible had an actuar-ial value of $210 a year in 2002, equivalent
to slightly more than 10 percent of the costof a typical Medigap policy (Plans C or F).5
Few Medicare SELECT policies havebeen sold, largely because the savingshave not been sufficient to generate signif-icant consumer demand. Most beneficia-ries who are willing to accept a limited net-work can obtain greater savings byenrolling in a M+C plan. Of the 15 carriersthat were interviewed as part of this study,only 6 offered SELECT plans, and then typ-ically only in limited geographic areas.Four of the six are BlueCross® BlueShield®
plans, which, unlike most commercial car-riers, typically have ongoing relationshipswith most hospitals in their respective ser-vice areas. In addition to the limited con-sumer appeal, carriers expressed concernthat offering Medicare SELECT productsentailed administrative costs that could notbe recouped in premiums. These adminis-trative costs result, for example, from hav-ing to develop the provider network, revisemarketing materials, educate the salesforce, and obtain State regulatory approval.
State representatives confirmed thatSELECT plans had limited appeal. In five ofthe six site-visited States, between one andeight carriers offered SELECT plans, oftenin only a limited portion of the State. In thesixth State, Florida, 12 carriers marketedSELECT products. Overall, State represen-tatives had little to say about SELECTplans, reflecting it not being a major factorin the market place.
The Balanced Budget Act (BBA) of 1997also authorized insurers to offer highdeductible Medigap policies. These poli-cies correspond to Plans F and J except foran annual deductible of $1,500 in 1998 and1999, increasing with the Consumer PriceIndex thereafter. The reductions in premi-
HEALTH CARE FINANCING REVIEW/Spring 2003/Volume 24, Number 3 125
5 Actuarial value of the Part A deductible provided by CMS’Office of the Actuary. An overall evaluation of the MedicareSELECT program can be found in Lee et al.(1997).
4 In August 2000, CMS announced its intent to change Federalregulations to allow Medicare SELECT plans to negotiate withproviders, including physicians, to waive cost sharing for Part Bservices as well.
ums from high-deductible plans are sub-stantial. We compared the premiums forthe high-deductible Plan F with the standard plan using the buyers guidesobtained from the six site-visited Statesand found substantial reductions, from anaverage of $1,522 in 2001 to $670, adecrease of 56 percent. In none of the sixStates did any carrier sell a high-deductibleplan for Plan J.
Like SELECT plans, consumers and car-riers have shown scant interest in high-deductible plans. Many in the policy fieldhave advocated incorporating higher cost-sharing into Medigap policies in light ofthe consistent research finding that cost-sharing reduces the use of health servicesand, hence, Medicare spending (McCormacket al., 1996; Christensen and Shinogle, 1997;McCall et al., 1991; Christensen, Long, andRodgers, 1987). Thus, to some this lack ofconsumer interest is disappointing.
Of the 15 carriers interviewed, only 2offered such plans, although 2 others wereconsidering doing so. The primary reasonfor the paucity of offerings was the per-ceived lack of consumer demand; carrierrepresentatives reported that seniors tendto be risk averse and prefer not to facelarge deductibles. In addition, agents maynot actively seek to market the highdeductible plans because sales commis-sions are lower. Also, some carriersexpressed the concern that, while benefitpayments are lower, high-deductible planshave administrative costs that are compa-rable to those of the regular plan, making itmore difficult to meet the federally-man-dated loss ratio requirements. One possi-ble factor that contributes to the low vol-ume of sales is that the high-deductibleplans have not been well publicized. Forexample, many State consumer guidesonly describe them in footnotes to the cor-responding regular plan.
Impact on Medicare DisabledBeneficiaries
In 1998, 5.0 million out of 38.8 millionMedicare beneficiaries were under age 65and qualified for Medicare by virtue ofbeing disabled, a number that has beengrowing several times faster than the num-ber of aged beneficiaries (Health CareFinancing Review, 2001). Although dis-abled beneficiaries represent 13 percent ofall Medicare beneficiaries, they representonly 1 percent of Medigap policyholders(National Association of Insurance Commis-sioners, 2000a). A major reason is that theyare not covered by the Federal 6-monthopen enrollment period when someoneturns age 65, although they are eligible forthe 6-month open enrollment period whenthey turn age 65. For those who areenrolled, claims cost and resulting premi-ums, are considerably higher, reflectingboth the high medical costs of disabledbeneficiaries and adverse selection, i.e.,sicker disabled disproportionately enrollingin Medigap plans. In 1998, disabled benefi-ciaries incurred an average Medicare cost-sharing liability of $1,043 per capita com-pared with $915 for aged beneficiaries, adifference of 14 percent. (Health CareFinancing Administration, 2001). In con-trast, annual claims cost were an average of78 percent higher, with the differencebetween the two percentages being largelyattributable to adverse selection (NationalAssociation of Insurance Commissioners,2000a).
Some States have enacted legislation toimprove access to Medigap benefits. In2000 the NAIC reported that 19 States hadmandated an open enrollment period fordisabled, in some cases limited to Plan A(unpublished compilation prepared by theNAIC). In most of these States, however,carriers can charge more to disabled thanto aged beneficiaries. Another approach
126 HEALTH CARE FINANCING REVIEW/Spring 2003/Volume 24, Number 3

that States have adopted is allowing benefi-ciaries to purchase coverage through Statehigh-risk pools, priced at some multiple(e.g., twice) of the typical premium. NewYork requires continuous open enrollmentalong with community rating, i.e., carrierscannot make premium distinctions basedon age, a provision that applies to disabledas well as aged beneficiaries and results ina single rate for each plan that a carriersells. State representatives report thatbetween 2 and 3 percent of Medigapenrollees are disabled, compared with only1 percent nationally.
Missouri has mandated a 6-month openenrollment period when someone firstbecomes eligible as a disabled beneficiary.What is novel is that each carrier isrequired to set premiums for disabledenrollees for each of the plans that it mar-kets at the average premium for agedenrollees. The effect is a potential cross-subsidy from aged to disabled beneficia-ries. The provision became effective July1998, at which time a 6-month open enroll-ment period for all disabled beneficiarieswas initiated; thereafter, the provisionapplies only to the first 6 months afterMedicare eligibility is first established.
The State estimated at the time the pro-vision was adopted that Medigap costsoverall would increase by only 1 percent. Itreports no significant change in premium
trends as a result of the provision, and nocarrier has left the market as a result. Theextent to which enrollment among Medicaredisabled beneficiaries increased as a resultof this provision can only be approximatedbecause the State has tracked these num-bers only from 1998 on.6 As one measure,in 1998 some 758 disabled beneficiarieshad Medigap policies compared with 3,283in 1999 and 3,807 in 2002, indicating thatgreater access to coverage did result.
Premium Trends
Sales data and premium data (for a 70-year old female) for each of the 10 stan-dardized plans was requested for 1997 and2000 from the States that were site visited.These data were requested of the same fivecarriers from our prior study (McCormacket al., 1996). Five of the six States (all butSouth Carolina) responded.
Table 2 shows average premiums for theselected years for each of the 10 standard-ized plans. In computing the averages,each of the five States was given equalweight, a procedure used in previous stud-ies of the Medigap market (Rice, Graham,and Fox, 1997; Rice and McCall, 1985;McCall et al., 1991). Within each State,however, the data were weighted by the
HEALTH CARE FINANCING REVIEW/Spring 2003/Volume 24, Number 3 127
6 The number of disabled beneficiaries is obtained from the car-riers at the time of they resubmit their premium rate filings,which occurs throughout the year.
Table 2
Average Annual Medigap Premiums and Changes in Premiums in Five States: Selected Years,1994-2000
Percent ChangePlan 1994 1997 2000 1994-1997 1997-2000 1994-2000
Plan A $551 $717 $1,085 30 51 97Plan B 862 1,036 1,438 20 39 67Plan C 881 1,131 1,592 28 41 81Plan D 897 1,091 1,513 22 37 69Plan E 886 1,005 1,359 13 33 53Plan F 1,137 1,287 1,716 13 29 51Plan G 1,076 1,176 1,457 9 24 35Plan H 1,215 1,617 2,428 33 52 100Plan I 1,348 1,679 2,382 25 42 77Plan J 1,851 1,939 2,665 5 37 44
SOURCE: Insurance carrier data provided by Florida, Missouri, New York, Texas, and Washington, 2001.
number of policies sold. For example, if ina particular State one carrier sold 500 poli-cies and another sold 1,000, the latterwould receive twice the weight.
In 2000, the lowest average premium was$1,085 for Plan A. As would be expected,the most expensive plans were those thatcover prescription drugs, with the highestbeing $2,665 for Plan J. Plans H and I hadaverage premiums of $2,428 and $2,382,respectively. To place these numbers incontext, in 1999 the pretax median house-hold income for those age 65 or over was$22,800 (U.S. Bureau of the Census, 2001).
Table 2 also shows the rate of change inpremiums between selected years 1994-1997 and 1997-2000. For each of the 10 plantypes, premiums rose far faster in the latterperiod. Averaging the plan types, they rose20 percent during the first 3 years, and 39percent during the last 3 years. A majorcontributor to the increase is the growth inclaims costs for hospital outpatient ser-vices. A report by the American Academyof Actuaries (2000) states that: “From 1995to 1998, the increase in outpatient claimcosts caused [the] overall trend to be 2.9percent higher per year than it would havebeen if the outpatient trend had equaledthe average of the other components.”However, carrier representatives reportthat the trend of high rates of increase haslargely been reversed starting in 2001 as aconsequence of the initiation that year ofthe phase-in of the hospital outpatientprospective payment system provisions ofthe 1997 BBA, which includes limitationsin patient balance billing. Plans A, C, and Hhad particularly high premium rateincreases. Various sources said that Plan Ahad experienced adverse selection becauseit was promoted by some organizationsrepresenting or serving disabled beneficia-ries, some of which, including dialysis cen-ters, reportedly subsidize the Plan A pre-mium.
An important regulatory issue is the wayin which premium rates are set. There arethree different methods. They can beeither community rated, meaning that allpolicyholders in a geographic area arecharged the same amount; issue-age rated,whereby premiums are based on the age atinitial purchase; or attained-age rated,whereby premiums rise as beneficiariesage. Many State officials and consumeradvocates dislike attained-age rating becauseit results in higher premiums as beneficia-ries grow older, when their incomes in realterms are likely to decline. In contrast,most insurance carriers we interviewedheld that rating practices should not berestricted in order to give consumers moreoptions, i.e., allow consumers to purchaseeither an attained-age or an entry-age poli-cy, with the understanding that the formerwould be the less expensive in earlier yearsbut more expensive in later years. In 2000,a dozen States had either mandated com-munity rating or banned attained-age rat-ing (National Association of InsuranceCommissioners, 2000b). Among the sixstudy States, New York and Washingtonmandate community rating, Florida requiresissue-age rating, and starting in 2000,Missouri banned newly issued policiesfrom using attained-age rating.
Prescription Drugs Benefits
Medigap prescription drug benefits havebeen problematic, with many of the prob-lems being unrelated to standardization.Many carriers do not offer prescription drugcoverage. Out of the 15 carriers interviewed,only 8 offer any of the three plans thatincludes prescription drug coverage (i.e.,Plans H, I, or J). Some of the eight carriers offering coverage do so in only a lim-ited number of States that they serve, andonly three of the eight offer all three plans.The major policy question, however, is not
128 HEALTH CARE FINANCING REVIEW/Spring 2003/Volume 24, Number 3

the proportion of carriers that offer prescrip-tion drug coverage but whether consumershave sufficient choices. Indeed, we foundthat choices were available, although in someStates they were few in number, notably inthe case of New York, which may reflect thatState’s regulatory environment. Of particularnote is New York State’s requirement thatcarriers have continuous open enrollment,meaning that beneficiaries can purchase anyof the 10 plans at any time regardless ofhealth status. To illustrate, a Medicare bene-ficiary who waited until age 75 before pur-chasing Medigap coverage could do so fromany carrier, although that individual could besubject to a 6-month pre-existing conditionexclusion. Table 3 provides the number ofplan offerings in each of the six States thatwere site visited, based on information inState-issued consumer guides.
The bigger problem is its limited scopeand high cost of coverage, due in part toadverse selection. The drug benefit inPlans H and I has a $250 annual deductible,50 percent coinsurance, and an annualmaximum on benefit payments of $1,250.Actuarial estimates show that in a typicalpopulation of Medicare beneficiaries, thedrug benefit would pay on average an esti-mated 35.5 percent of expenses. The bene-fit in Plan J differs from Plans H and I onlyin that the annual maximum is increased to$3,000; it reimburses some 39 percent ofdrug expenses on average.
In addition to paying only a small pro-portion of drug expenses, the premiumsfar exceed the actuarial value of the benefitin an average population of beneficiaries.Plans H, I, and J can each be paired withanother plan that is similar, except that itexcludes prescription drugs. The closematches make prescription drug benefitsnearly equivalent to a freestanding rider,which is likely to generate adverse selec-tion as a result of beneficiaries with chron-ic conditions disproportionately electingthe coverage. The matches and the benefitdifferences other than drugs are as fol-lows:• Plans H and C differ only in the coverage
of the Part B deductible.• Plans I and D differ only in the coverage
of excess charges.• Plan J and E differ only in the coverage
of the Part B deductible, physicianexcess charges, and at-home recovery.For each pair, the impact of benefit dif-
ferences other than prescription drugs wasremoved, leaving a dollar amount that canbe attributed to drug coverage, as shown inTable 4.7 The resulting amounts can becompared with the actuarial value of thedrug benefit in a cross-section of theMedicare population. That value has beenestimated at $403 for Plans H and I and at$435 for Plan J. We increased these num-bers by 25 percent to account for a typical
HEALTH CARE FINANCING REVIEW/Spring 2003/Volume 24, Number 3 129
Table 3
Number of Carriers Selling Medigap Prescription Drug Coverage in Selected States: 2001
Plans Total NumberState H I J H, I, J of Carriers
Florida 7 12 4 12 37Missouri 8 9 5 13 54New York 7 3 1 8 16South Carolina 3 3 3 5 32Texas 10 10 8 14 59Washington 8 15 10 17 35
NOTES: Carrier listing in the South Carolina consumer guide is voluntary; thus the data for the State may represent an undercount. Also, althoughmost carriers sell statewide, five of the seven carriers selling Plan H in New York are BlueCross® BlueShield® plans that operate in only a portion ofthe State. The three carriers that market Plan I and the one that markets Plan J are all statewide.
SOURCE: State-issued consumer guides from Florida, Missouri, New York, South Carolina, Texas, and Washington, 2001.
7 The adjustments reflect a combination of claims experience oftwo large carriers and actuarial estimates.
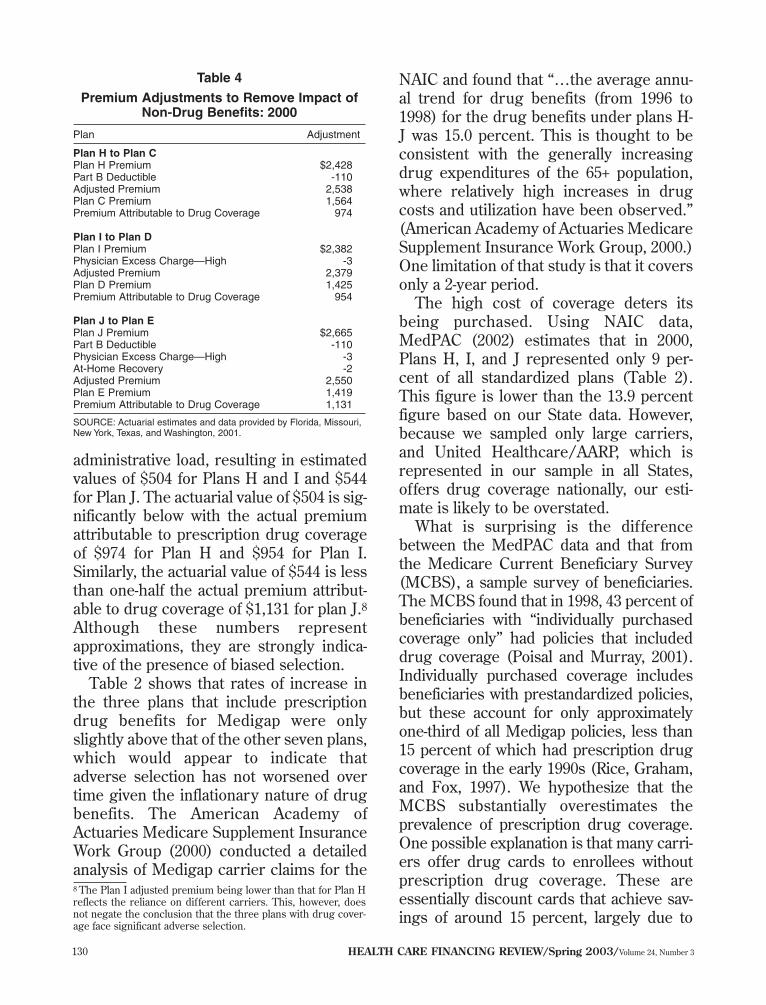
administrative load, resulting in estimatedvalues of $504 for Plans H and I and $544for Plan J. The actuarial value of $504 is sig-nificantly below with the actual premiumattributable to prescription drug coverageof $974 for Plan H and $954 for Plan I.Similarly, the actuarial value of $544 is lessthan one-half the actual premium attribut-able to drug coverage of $1,131 for plan J.8Although these numbers representapproximations, they are strongly indica-tive of the presence of biased selection.
Table 2 shows that rates of increase inthe three plans that include prescriptiondrug benefits for Medigap were onlyslightly above that of the other seven plans,which would appear to indicate thatadverse selection has not worsened overtime given the inflationary nature of drugbenefits. The American Academy ofActuaries Medicare Supplement InsuranceWork Group (2000) conducted a detailedanalysis of Medigap carrier claims for the
NAIC and found that “…the average annu-al trend for drug benefits (from 1996 to1998) for the drug benefits under plans H-J was 15.0 percent. This is thought to beconsistent with the generally increasingdrug expenditures of the 65+ population,where relatively high increases in drugcosts and utilization have been observed.”(American Academy of Actuaries MedicareSupplement Insurance Work Group, 2000.)One limitation of that study is that it coversonly a 2-year period.
The high cost of coverage deters itsbeing purchased. Using NAIC data,MedPAC (2002) estimates that in 2000,Plans H, I, and J represented only 9 per-cent of all standardized plans (Table 2).This figure is lower than the 13.9 percentfigure based on our State data. However,because we sampled only large carriers,and United Healthcare/AARP, which isrepresented in our sample in all States,offers drug coverage nationally, our esti-mate is likely to be overstated.
What is surprising is the differencebetween the MedPAC data and that fromthe Medicare Current Beneficiary Survey(MCBS), a sample survey of beneficiaries.The MCBS found that in 1998, 43 percent ofbeneficiaries with “individually purchasedcoverage only” had policies that includeddrug coverage (Poisal and Murray, 2001).Individually purchased coverage includesbeneficiaries with prestandardized policies,but these account for only approximatelyone-third of all Medigap policies, less than15 percent of which had prescription drugcoverage in the early 1990s (Rice, Graham,and Fox, 1997). We hypothesize that theMCBS substantially overestimates theprevalence of prescription drug coverage.One possible explanation is that many carri-ers offer drug cards to enrollees withoutprescription drug coverage. These areessentially discount cards that achieve sav-ings of around 15 percent, largely due to
130 HEALTH CARE FINANCING REVIEW/Spring 2003/Volume 24, Number 3
8 The Plan I adjusted premium being lower than that for Plan Hreflects the reliance on different carriers. This, however, doesnot negate the conclusion that the three plans with drug cover-age face significant adverse selection.
Table 4
Premium Adjustments to Remove Impact ofNon-Drug Benefits: 2000
Plan Adjustment
Plan H to Plan CPlan H Premium $2,428 Part B Deductible -110Adjusted Premium 2,538Plan C Premium 1,564Premium Attributable to Drug Coverage 974
Plan I to Plan DPlan I Premium $2,382 Physician Excess Charge—High -3Adjusted Premium 2,379Plan D Premium 1,425Premium Attributable to Drug Coverage 954
Plan J to Plan EPlan J Premium $2,665 Part B Deductible -110Physician Excess Charge—High -3At-Home Recovery -2Adjusted Premium 2,550Plan E Premium 1,419Premium Attributable to Drug Coverage 1,131
SOURCE: Actuarial estimates and data provided by Florida, Missouri,New York, Texas, and Washington, 2001.

contracted pharmacists’ accepting lowerdispensing fees. Enrollees with these cardsmay commonly reply affirmatively to thequestion of whether they have prescriptiondrug coverage. The difference between thetwo estimates is important because theMCBS has received widespread attention inpolicy circles and appears to have resultedin the proportion of beneficiaries with pre-scription drug coverage being overstated.
The Bush Administration has proposedthat carriers be allowed to offer two addi-tional Plans, labeled K and L, that combinedrug coverage with reduced coverage ofMedicare cost sharing. Plan K would pro-vide the same drug coverage as Plan J;however, it would not cover the Part Bdeductible and would only cover 50 per-cent of Medicare cost sharing, with a$4,000 limit on out-of-pocket expenses.Plan L would provide the same coverage asPlans H and I; however, it would not coverthe Part B deductible and would pay 75percent of Medicare cost sharing with a$2,000 limit on out-of-pocket expenses.Such an approach has the potential to beattractive to consumers without generatingthe extent of adverse selection that hascharacterized Plans H, I, and J, for whichthere are close counterparts that do nothave drug coverage. A case can be madethat, for beneficiaries without any supple-mental coverage, the financial exposure isgreater for prescription drug expensesthan for Medicare cost sharing. However,whether these two plans would be attrac-tive to consumers is not known, particular-ly in light of the lack of interest in high-deductible plans.
The standardization of prescription drugbenefits illustrates the tradeoff betweenenhancing consumer understanding andencouraging innovation. Left unstandard-ized, prescription drugs are perhaps themost confusing of all benefits because ofthe almost infinite variations among health
plans with respect to differences in thewording that is used to describe identicalbenefits, the cost sharing structure, andthe nature of the cost-containment mea-sures that are undertaken (Fox et al.,1999). While enhancing consumer under-standability, standardization has severelyrestricted the ability of carriers to imple-ment cost-containment measures. Carriersmay engage in educational programs withpatients and providers, although these aregenerally viewed as having limited impact.Furthermore, the high level of cost shar-ing in Plans H, I, and J creates an incentivefor the consumer to be cost conscious.
What current law precludes is a myriadof cost-management techniques that areincreasingly being adopted by employeebenefit programs in both the private andthe public sector. First and foremost is theincorporation of financial incentives toencourage the use of drugs that are on aformulary. Some 79 percent of prescriptiondrug expenses in 1998 were for brandname drugs that did not have genericequivalents (Henry J. Kaiser FamilyFoundation, 2000). For a significant num-ber of these, multiple products within agiven drug class are available that areroughly equivalent in terms of effective-ness. Private-sector purchasers, such asemployers, commonly create incentivesand take other measures to encourage theuse of less expensive drugs. Medigap car-riers are also precluded from requiringprior authorization for selected high-costdrugs, something that many private pur-chasers do if safe, less expensive drugs areavailable that might be tried first or if thedrug can be used for purely cosmetic pur-poses.
The constraints in OBRA 1990 onMedigap carriers illustrate two dilemmasassociated with standardization. First,many of the cost-management activities,which are commonplace today, were rare
HEALTH CARE FINANCING REVIEW/Spring 2003/Volume 24, Number 3 131
10 years ago when the standardized poli-cies were established, yet the legislationhas not been modified. One argument fornot changing the law is to avoid theinevitable resulting consumer confusionand additional administrative expenses tothe carriers. Second, carrier flexibility onsuch matters as formulary selection wouldmilitate against standardization, creatingthe potential for consumer misunderstand-ing and for carriers’ developing overlyrestrictive formularies. It would be difficultto standardize the formulary (or otheraspects of cost containment), particularlyas an actively managed formulary entailsmaking regular changes as new medica-tions enter the market, pharmaceuticalmanufacturers alter their prices, and newscientific evidence about individual drugsbecomes available.
Consumer Impact
Standardization can benefit consumers,first, by facilitating consumer understand-ing and, second, by enhancing price com-petition, resulting in premiums beinglower than they would have been other-wise. Available evidence is that the firstobjective has been achieved but not thesecond. Attitudes towards standardizationare overwhelmingly positive. Consumerrepresentatives at both the national and theState level report that Medicare beneficia-ries have become knowledgeable about the10 standardized plans and are comfortablechoosing among them.
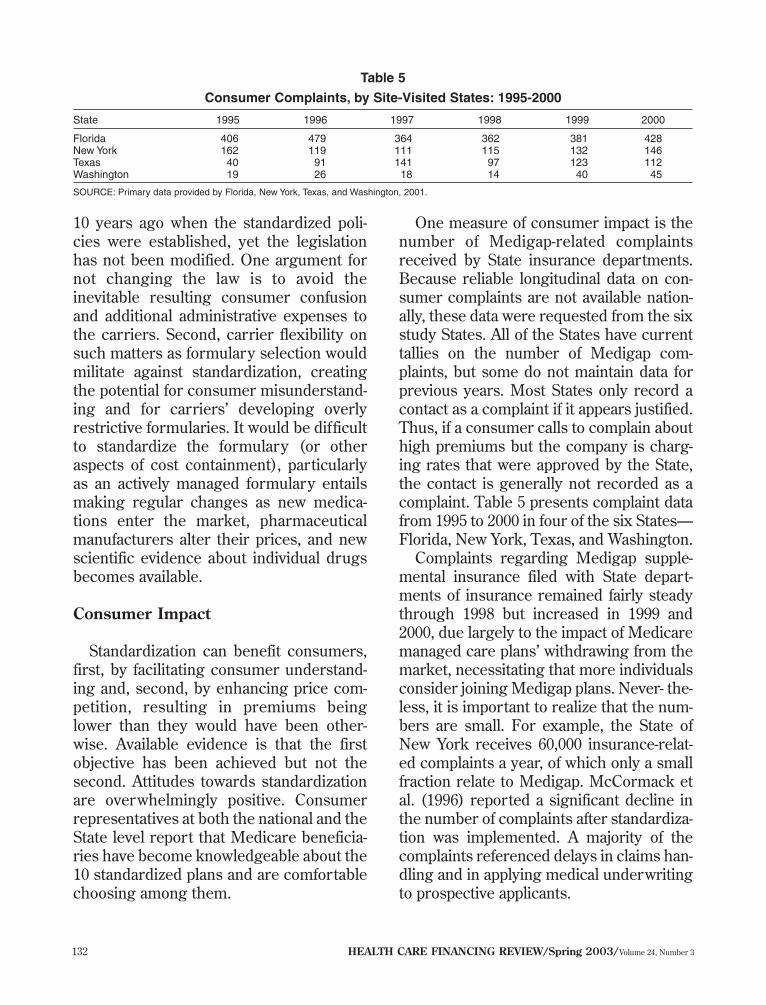
One measure of consumer impact is thenumber of Medigap-related complaintsreceived by State insurance departments.Because reliable longitudinal data on con-sumer complaints are not available nation-ally, these data were requested from the sixstudy States. All of the States have currenttallies on the number of Medigap com-plaints, but some do not maintain data forprevious years. Most States only record acontact as a complaint if it appears justified.Thus, if a consumer calls to complain abouthigh premiums but the company is charg-ing rates that were approved by the State,the contact is generally not recorded as acomplaint. Table 5 presents complaint datafrom 1995 to 2000 in four of the six States—Florida, New York, Texas, and Washington.
Complaints regarding Medigap supple-mental insurance filed with State depart-ments of insurance remained fairly steadythrough 1998 but increased in 1999 and2000, due largely to the impact of Medicaremanaged care plans’ withdrawing from themarket, necessitating that more individualsconsider joining Medigap plans. Never- the-less, it is important to realize that the num-bers are small. For example, the State ofNew York receives 60,000 insurance-relat-ed complaints a year, of which only a smallfraction relate to Medigap. McCormack etal. (1996) reported a significant decline inthe number of complaints after standardiza-tion was implemented. A majority of thecomplaints referenced delays in claims han-dling and in applying medical underwritingto prospective applicants.
132 HEALTH CARE FINANCING REVIEW/Spring 2003/Volume 24, Number 3
Table 5
Consumer Complaints, by Site-Visited States: 1995-2000
State 1995 1996 1997 1998 1999 2000
Florida 406 479 364 362 381 428New York 162 119 111 115 132 146Texas 40 91 141 97 123 112Washington 19 26 18 14 40 45
SOURCE: Primary data provided by Florida, New York, Texas, and Washington, 2001.

We find no evidence of greater pricecompetition as a result of standardization.One would expect greater price competi-tion to cause premiums to be lower thanthey would have been otherwise, resultingin a higher proportion of the premium dol-lar being devoted to benefit paymentsrather than administration and profit, i.e.,one would expect loss ratios to rise. Table6 displays loss ratios from 1990 to 2000 andshows no evidence of higher loss ratiossince the advent of standardization (NationalAssociation of Insurance Commissioners,2001b). Indeed, the loss ratio in 2000 was80.4 percent, compared with 83.4 percentin 1991, the year prior to the implementa-tion of standardization.
State regulatory and consumer informa-tion staff endorse standardization because itfacilitates beneficiary choice. One unfore-seen consequence of standardization, afavorable one, is that it has enabled Statesto reduce staffing levels devoted to regu-lating the insurance market because it isneither a significant source of consumerconfusion or complaints nor of carrier oragent fraud. Other lines of insurance areviewed as more problematic. Accuratelyquantifying staffing levels is difficultbecause staff often work on several lines ofinsurance. Also, consumer inquiries maybe handled either by the State insurance
department, a separate department (usual-ly, the Departments on Aging), or by theState Health Insurance Assistance Programs(SHIPs), which are federally funded butmay be administered by either a govern-ment agency or under contract with pri-vate, nonprofit organizations. To illustratethe small levels of staff devoted to regula-tion in four of the site-visited States9: NewYork has two staff members devoted torate reviews and two attorneys who reviewmarketing materials and regulations, eachof whom spends only 5-10 percent of theirtime on Medigap matters, and four staffmembers at the SHIP. In Florida, two indi-viduals spend less than one-half of theirtime on regulatory matters. Missouri andNew York each have 1.5 full-time equiva-lents devoted to Medigap regulatory issuesincluding rate reviews. South Carolina hasonly two staff members who spend mea-surable amounts of time, each between 20and 25 percent, on Medigap regulatory.
States ameliorate consumer confusion byinstituting consumer information efforts.The six States we visited all had informa-tion for beneficiaries available online,including consumer guides that explainMedigap plans and offer charts with con-tract and premium comparison informationfor individual Medigap carriers. In addition,they mail out consumer guides, conductoutreach and consumer counseling, spon-sor toll-free information numbers, and runvolunteer programs. The SHIPs provideone-on-one counseling services and groupseminars. Two areas of significant con-sumer confusion are: (1) the Federal guar-anteed issue requirements and (2) the dif-ference between issue and attained-age rat-ing in States where attained-age rating isallowed. The 1997 BBA expanded guaran-tee issue for Medigap policies in threeways:
HEALTH CARE FINANCING REVIEW/Spring 2003/Volume 24, Number 3 133
Table 6
Average Loss Ratios for All Medigap Policies:1990-2000
Year Loss Ratio
Percent1990 81.21991 83.41992 79.71993 75.91994 81.31995 85.61996 82.51997 82.71998 79.81999 79.32000 80.4
SOURCE: (National Association of Insurance Commissioners, 2001.)
9 Meaningful data were difficult to obtain for Washington andTexas.

• Beneficiaries who enroll in a MedicareHMO at age 65 and who disenroll withinone year can enroll in any Medigap Plan(A-J) within 63 days of disenrollment.
• Beneficiaries who switch from a Medigappolicy to a Medicare HMO and who dis-enroll within 1 year can re-enroll in thatsame Medigap policy type within 63 daysof disenrollment.
• Beneficiaries can enroll in MedigapPlans A, B, C, or F within 63 days of anyof the following qualifying events: (1)their employer terminates its Medicaresupplemental plan, (2) their MedicareHMO terminates coverage, (3) theymove outside of the HMO’s service area,or (4) their Medigap plan becomes insol-vent or violates the terms of contract. Widespread confusion has caused not
only beneficiary but also by carrier mis-conceptions about how and when guaran-tee issue provisions apply.
Benefit Package Issues
Standardizing benefits inevitably raisescontroversy as policymakers seek toaddress the often competing issues of: sim-plicity and ease of understanding, allowinga reasonable range of consumer choice,achieving public health objectives such asencouraging prevention, and restrainingincreases in Federal spending resultingfrom Medigap policies’ paying for Medicarecost sharing. The 10 plans include severalbenefits whose value has been debated,among them: the Part B deductible, preven-tive care, and at-home recovery. Eliminationof these benefits would reduce the numberof standardized plans below 10, somethingthat some consumer advocates havefavored.
Coverage of the annual $100 Part Bdeductible is commonly described as dol-lar trading, rather than insurance, since inany given year roughly 90 percent of bene-
ficiaries spend the deductible amount, andthe cost of the coverage is typically pricedabove $100 after factoring in administrativecosts. However, consumer choice of plansindicates that some beneficiaries wanttheir Medigap policies to cover all of theMedicare cost sharing and, therefore, likethis benefit. Another reason for wantingcoverage is to minimize the burden of filingclaims.
The prevention benefit reimburses up to$120 in charges for virtually any preventiveservice. It is included in Plans E and J,which are rarely purchased (Table 1). Thiswas done at the behest of some consumerrepresentatives, not as a form of insurance,but to further public health objectives. Theexperience of two very large Medigap car-riers (which wish to remain anonymous) isthat the value of this benefit, including theadministrative load, for those who have thebenefit is around $1 per year, indicatingthat it is hardly ever used. It is possible thatdoctors are able to justify most medical ser-vices as illness related. Also, beneficiariesmay not understand, or particularly want,this benefit. It was controversial when itwas adopted in the early 1990s, and itsvalue may be less today because Medicarenow covers more prevention services thanit did then, mostly as a result of expansionsin the 1997 BBA.10
The at-home recovery benefit also addslittle to premiums—between $2 and $3 ayear for the two benefits combined—indi-cating that beneficiaries who have this ben-efit rarely use it, although it may providean element of financial security. The at-home recovery benefit is poorly under-stood and is difficult to administer. It cov-ers “…short-term, at-home assistance withactivities of daily living for those recover-ing from an illness, injury, or surgery.”There is a series of limitations that are con-fusing and that are not fully described inany of the consumer guides of the States
134 HEALTH CARE FINANCING REVIEW/Spring 2003/Volume 24, Number 3

that we site visited. They are also not artic-ulated in the consumer-oriented informa-tion that the Medicare Program providesbeneficiaries, e.g., the requirement thatthe total number of at-home recovery visitsnot exceed the number of Medicare-approved home health visits.
The underlying benefit structure of theMedigap policies can also be questioned.The major focus is to cover most or all(depending on the specific plan) Medicarecost sharing. From the plan choices of ben-eficiaries, one can infer that beneficiarieswant all cost sharing covered. However,the effect is to increase the utilization ofhealth services and, hence, Medicareexpenditures (McCormack et al., 1996).
CONCLUSION
Overall, the Medigap reform legislationhas had a favorable impact. Consumerconfusion has lessened, and consumerslike the Medigap reforms that OBRA 1990introduced. State regulators are support-ive, both because the changes it intro-duced are popular with consumers andbecause it has lessened both the number ofbeneficiary complaints and carrier oragent abuses, thereby decreasing theenforcement burden. However, we find noevidence that it has enhanced price com-petition.
As one would expect, issues remain.One question is whether to change the 10standardized plans in light of both theexperience gained with the OBRA 1990provisions over the last decade and thechanges in Medicare, e.g., the expandedcoverage of preventive services. Questionsarise as to whether the continued inclusionof certain benefits is desirable, whetherfirst-dollar coverage should be avoided inorder to reduce the cost-increasing impact
on the Medicare budget of the 10 currentplans, and whether some level of prescrip-tion drug coverage should be mandated inall of the plans. Any restructuring of thestandardized benefits will generate disloca-tions and costs. Medicare beneficiarieswould have to become re-educated to anew set of benefits; whether and how toconvert existing plan designs to the newset of benefits would have to be addressed;and carriers would face administrativeexpenses as a result of having, for exam-ple, to rewrite their policies, educate exist-ing enrollees, and revise marketing materi-als. Some argue that any changes in the 10standardized plans should await broaderMedicare reform, although the timing ofsuch reform is at best is conjectural.
Notwithstanding these reservations,there are certain changes that wouldinvolve minimal beneficiary confusion ordislocations. First, carriers selling theplans with drug coverage (H, I, and J)could be allowed to engage in broader cost-management activities, such as encourag-ing use of contracted pharmacies so thatthe beneficiary does not pay full retail priceand allowing carriers to require priorauthorization for expensive drugs. Suchmeasures have the potential for loweringpremiums. Federal standards would bedesirable, e.g., regarding network size orthe types of drugs that could be subject toprior authorization. Second, some of thebenefits that are hardly ever used—e.g., in-home services, which is also poorly under-stood—could be eliminated, which couldlead to a reduction in the number of offer-ings. Whatever their theoretical merit, thefact that enrollees hardly ever use thesebenefits indicates a lack of consumerappeal, something that was not clear at thetime the 10 standardized packages weredesigned. Finally, greater effort might bemade to publicize the availability of highdeductible plans.
HEALTH CARE FINANCING REVIEW/Spring 2003/Volume 24, Number 3 135
10 Medicare currently pays for flu and pneumococcal shots, Papsmears and pelvic exams, mammography, diabetes self-manage-ment, and screening for colorectal and prostate cancer.
Some analysts believe that the standard-ization provisions enacted in 1990 were toolimited and should have included standard-izing the policy forms themselves, whichnow vary from State to State, increasingregulatory compliance cost for multi-Statecarriers. The main aspect of Medigap thathas not been standardized is the manner inwhich age is reflected in premiums. Mostcarrier representatives with whom wetalked felt that beneficiaries should be ableto choose between attained or entry-agerating. However, few beneficiaries under-stand the difference. Some States havehandled the issue by precluding attained-age rating, and consideration might begiven to the Federal Government stan-dardizing age-rating practices.
The absence of any open enrollment pro-vision in Federal law for Medicare disabledbeneficiaries remains problematic. Manyof the representatives of the carriers withwhom we spoke oppose such a provision,fearing adverse selection. However, theprogram in Missouri, which not onlyrequires open enrollment in all 10 plans,but also sets a limit on what may becharged based on the premiums chargedthe aged population, was not opposed bythe industry and has resulted in only minorincreases in premiums.
REFERENCES
American Academy of Actuaries MedicareSupplement Insurance Work Group: Report to theNational Association of Insurance Commissioners.Washington, DC. June 8, 2000.Centers for Medicare & Medicaid Services:Medicare Managed Care Contract Plans MonthlySummary Reports. Internet address: http://cms.hhs.gov/healthplans/statistics/mmcc.(Accessed 2003.)Christensen, S., and Shinogle, J.: Effects ofSupplemental Coverage on Use of Services byMedicare Enrollees. Health Care Financing Review19(1):5-17, Fall 1997.
Christensen, S., Long, S.H., and Rodgers, J.: AcuteHealth Care Costs for the Aged MedicarePopulation: Overview and Policy Options. MilbankQuarterly 65(3):397-425, 1987.Fox, P.D., Snyder, R., Dallek, G., and Rice, T.:Should Medicare HMO Benefits Be Standardized?Health Affairs 18(4):40-52, July/August 1999.Henry J. Kaiser Family Foundation: PrescriptionDrug Trends: A Chartbook. The Henry J. KaiserFamily Foundation. Menlo Park, CA. July 2000.Health Care Financing Administration: Health CareFinancing Review Medicare and Medicaid StatisticalSupplement, 2000. U.S. Government PrintingOffice. Washington, DC. June 2001. Lee, A., Garfinkel, S.A., Khandker, R.K, and Norton,E.C.: Impact of Medicare SELECT on Cost andUtilization in 11 States. Health Care FinancingReview 19(1):19-40, Fall 1997.McCall, N., Rice, T., Boismier, J., and West R.:Private Health Insurance and Medical CareUtilization: Evidence from the Medicare Population.Inquiry 28(3):276-287, Fall 1991.McCormack, L.A., Fox, P.D., Rice T., and GrahamM.L. : Medigap Reform Legislation of 1990: Havethe Objectives Been Met? Health Care FinancingReview 18(1):157-174, Fall 1996. Medicare Payment Advisory Commission: Reportto Congress: Assessing Medicare Benefits. MedicarePayment Advisory Commission. Washington, DC.June 2002.National Association of Insurance Commissioners:Medicare Supplement Insurance Issue Paper. KansasCity, MO. November 30, 2000a.National Association of Insurance Commissioners:Medicare Supplement Survey Results. Kansas City,MO. 2000b. National Association of Insurance Commissioners.Medicare Supplement Loss Ratios in 2000. KansasCity, MO. November 2001.Poisal, J.A. and Murray, L.: Growing DifferencesBetween Medicare Beneficiaries With and WithoutDrug Coverage. Health Af fairs 20(2):74-85,March/April 2001.Rice, T., and Bernstein J.: Supplemental HealthInsurance for Medicare Beneficiaries. Medicare BriefNumber 6. National Academy of Social Insurance.Washington, DC. November 1999.Rice, T., and McCall, N.: The Extent of Ownershipand the Characteristics of Medicare SupplementalPolicies. Inquiry 22(2):188-200, Summer 1985.
136 HEALTH CARE FINANCING REVIEW/Spring 2003/Volume 24, Number 3

Rice, T., Graham, M.L., Fox, P.D.: The Impact ofPolicy Standardization on the Medigap Market.Inquiry 34(2):106-116, Summer 1997.U.S. Bureau of the Census: Statistical Abstract of theUnited States, 2001. Internet address:http://www.census.gov/prod/2002pubs/01statab/stat-ab01.html.
Reprint Requests: Peter D. Fox; PDF, LLC; 8101 ConnecticutAvenue, Number N–706; Chevy Chase, MD 20815. E-mail:[email protected]
HEALTH CARE FINANCING REVIEW/Spring 2003/Volume 24, Number 3 137