medicare 2019 part c & d star ratings cut point trends · cut points: year 1 star 2 stars 3...
TRANSCRIPT
(Last Updated 12/19/2018) Page 1
Trends in Part C & D
Star Rating Measure Cut Points
Updated – 12/19/2018
(Last Updated 12/19/2018) Page i
Document Change Log
Previous Version Description of Change
Revision Date
- Final release of the 2019 Star Ratings Cut Point Trend document 12/19/2018

(Last Updated 12/19/2018) Page ii
Table of Contents
DOCUMENT CHANGE LOG .............................................................................................................................. I
TABLE OF CONTENTS .................................................................................................................................... II
INTRODUCTION ............................................................................................................................................... 1
PART C MEASURES ........................................................................................................................................ 2
Measure: C01 - Breast Cancer Screening ........................................................................................................................ 2
Measure: C02 - Colorectal Cancer Screening .................................................................................................................. 3
Measure: C03 - Annual Flu Vaccine .................................................................................................................................. 4
Measure: C04 - Improving or Maintaining Physical Health ............................................................................................ 5
Measure: C05 - Improving or Maintaining Mental Health ............................................................................................... 6
Measure: C06 - Monitoring Physical Activity ................................................................................................................... 7
Measure: C07 - Adult BMI Assessment ............................................................................................................................ 8
Measure: C08 - Special Needs Plan (SNP) Care Management ....................................................................................... 9
Measure: C09 - Care for Older Adults – Medication Review ........................................................................................ 10
Measure: C10 - Care for Older Adults – Functional Status Assessment .................................................................... 11
Measure: C11 - Care for Older Adults – Pain Assessment .......................................................................................... 12
Measure: C12 - Osteoporosis Management in Women who had a Fracture .............................................................. 13
Measure: C13 - Diabetes Care – Eye Exam .................................................................................................................... 14
Measure: C14 - Diabetes Care – Kidney Disease Monitoring ...................................................................................... 15
Measure: C15 - Diabetes Care – Blood Sugar Controlled ............................................................................................ 16
Measure: C16 - Controlling Blood Pressure .................................................................................................................. 17
Measure: C17 - Rheumatoid Arthritis Management ...................................................................................................... 18
Measure: C18 - Reducing the Risk of Falling ................................................................................................................ 19
Measure: C19 - Improving Bladder Control ................................................................................................................... 20
Measure: C20 - Medication Reconciliation Post-Discharge ......................................................................................... 21
Measure: C21 - Plan All-Cause Readmissions .............................................................................................................. 22
Measure: C23 - Getting Needed Care ............................................................................................................................. 23
Measure: C24 - Getting Appointments and Care Quickly ............................................................................................ 24
Measure: C25 - Customer Service .................................................................................................................................. 25
Measure: C26 - Rating of Health Care Quality ............................................................................................................... 26
Measure: C27 - Rating of Health Plan ............................................................................................................................. 27
Measure: C28 - Care Coordination ................................................................................................................................. 28
Measure: C29 - Complaints about the Health Plan ....................................................................................................... 29
Measure: C30 - Members Choosing to Leave the Plan ................................................................................................. 30
Measure: C32 - Plan Makes Timely Decisions about Appeals ..................................................................................... 31
Measure: C33 - Reviewing Appeals Decisions .............................................................................................................. 32
Measure: C34 - Call Center – Foreign Language Interpreter and TTY Availability .................................................... 33
PART D MEASURES ...................................................................................................................................... 34
Measure: D01 - Call Center – Foreign Language Interpreter and TTY Availability .................................................... 34
Measure: D02 - Appeals Auto–Forward ......................................................................................................................... 36
Measure: D03 - Appeals Upheld ...................................................................................................................................... 38
Measure: D04 - Complaints about the Drug Plan .......................................................................................................... 40
Measure: D05 - Members Choosing to Leave the Plan ................................................................................................. 42
Measure: D07 - Rating of Drug Plan ............................................................................................................................... 44
Measure: D08 - Getting Needed Prescription Drugs ..................................................................................................... 46
Measure: D10 - Medication Adherence for Diabetes Medications............................................................................... 48

(Last Updated 12/19/2018) Page iii
Measure: D11 - Medication Adherence for Hypertension (RAS antagonists) ............................................................ 50
Measure: D12 - Medication Adherence for Cholesterol (Statins) ................................................................................ 52
Measure: D13 - MTM Program Completion Rate for CMR ............................................................................................ 54
(Last Updated 12/19/2018) Page 1
Introduction
One of CMS’ most important strategic goals is to improve quality of care and general health status for Medicare beneficiaries, and we continue to make enhancements to the current Star Ratings methodology to further align it with our policy goals. Effective for the 2016 Star Ratings, CMS no longer applies predetermined 4-star thresholds for specific measures. These had previously been used in the Star Ratings program as an attempt to help contracts set achievement goals, but analyses over time found they contributed to misclassification in star assignments and discouraged plans from focusing on a holistic approach of higher quality.
The current Part C & D Star Rating Technical Notes including specifications and methodology for all measures is available at: http://go.cms.gov/partcanddstarratings. For the 2019 Star Ratings, there are a total of 47 Part C and Part D measures. Over the years, unless there were specification changes, we generally see gradual changes in star cut points. This relative stability in cut points from year to year should enable plans to establish a baseline for performance for each measure. When there are shifts in the cut points, it is generally driven by changes in industry performance and/or the distribution of scores across contracts.
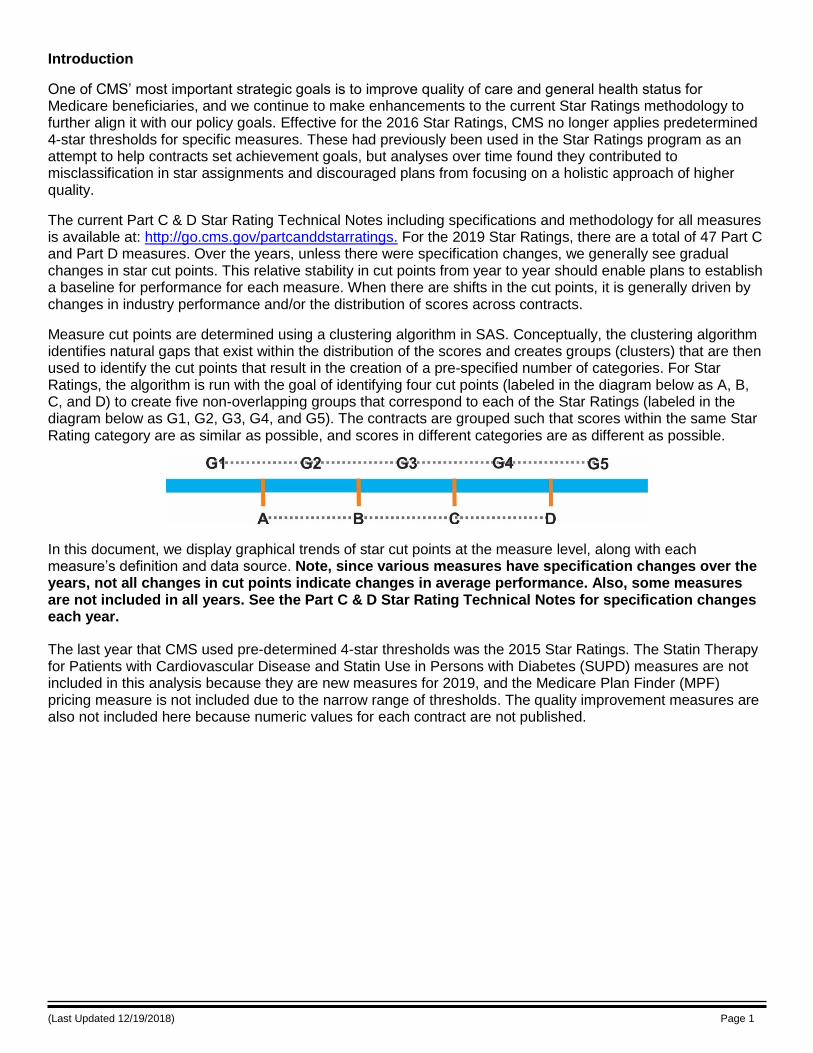
Measure cut points are determined using a clustering algorithm in SAS. Conceptually, the clustering algorithm identifies natural gaps that exist within the distribution of the scores and creates groups (clusters) that are then used to identify the cut points that result in the creation of a pre-specified number of categories. For Star Ratings, the algorithm is run with the goal of identifying four cut points (labeled in the diagram below as A, B, C, and D) to create five non-overlapping groups that correspond to each of the Star Ratings (labeled in the diagram below as G1, G2, G3, G4, and G5). The contracts are grouped such that scores within the same Star Rating category are as similar as possible, and scores in different categories are as different as possible.
In this document, we display graphical trends of star cut points at the measure level, along with each measure’s definition and data source. Note, since various measures have specification changes over the years, not all changes in cut points indicate changes in average performance. Also, some measures are not included in all years. See the Part C & D Star Rating Technical Notes for specification changes each year.
The last year that CMS used pre-determined 4-star thresholds was the 2015 Star Ratings. The Statin Therapy for Patients with Cardiovascular Disease and Statin Use in Persons with Diabetes (SUPD) measures are not included in this analysis because they are new measures for 2019, and the Medicare Plan Finder (MPF) pricing measure is not included due to the narrow range of thresholds. The quality improvement measures are also not included here because numeric values for each contract are not published.

(Last Updated 12/19/2018) Page 2
Part C Measures
Measure: C01 - Breast Cancer Screening
Title Description
Description: Percent of female plan members aged 52-74 who had a mammogram during the past two years.
Data Source: HEDIS
General Trend: Higher is better
Cut Points: Year 1 Star 2 Stars 3 Stars 4 Stars 5 Stars
2016 < 39% ≥ 39% to < 63% ≥ 63% to < 74% ≥ 74% to < 80% ≥ 80%
2017 < 43% ≥ 43% to < 63% ≥ 63% to < 69% ≥ 69% to < 76% ≥ 76%
2018 < 56% ≥ 56% to < 70% ≥ 70% to < 78% ≥ 78% to < 84% ≥ 84%
2019 < 47% ≥ 47% to < 68% ≥ 68% to < 76% ≥ 76% to < 82% ≥ 82%
80
76
8482
74
69
7876
63 63
7068
39
43
56
47
30
40
50
60
70
80
90
100
2016 2017 2018 2019
Pe
rce
nta
ge
Breast Cancer Screening
5 Star
4 Star
3 Star
2 Star
(Last Updated 12/19/2018) Page 3
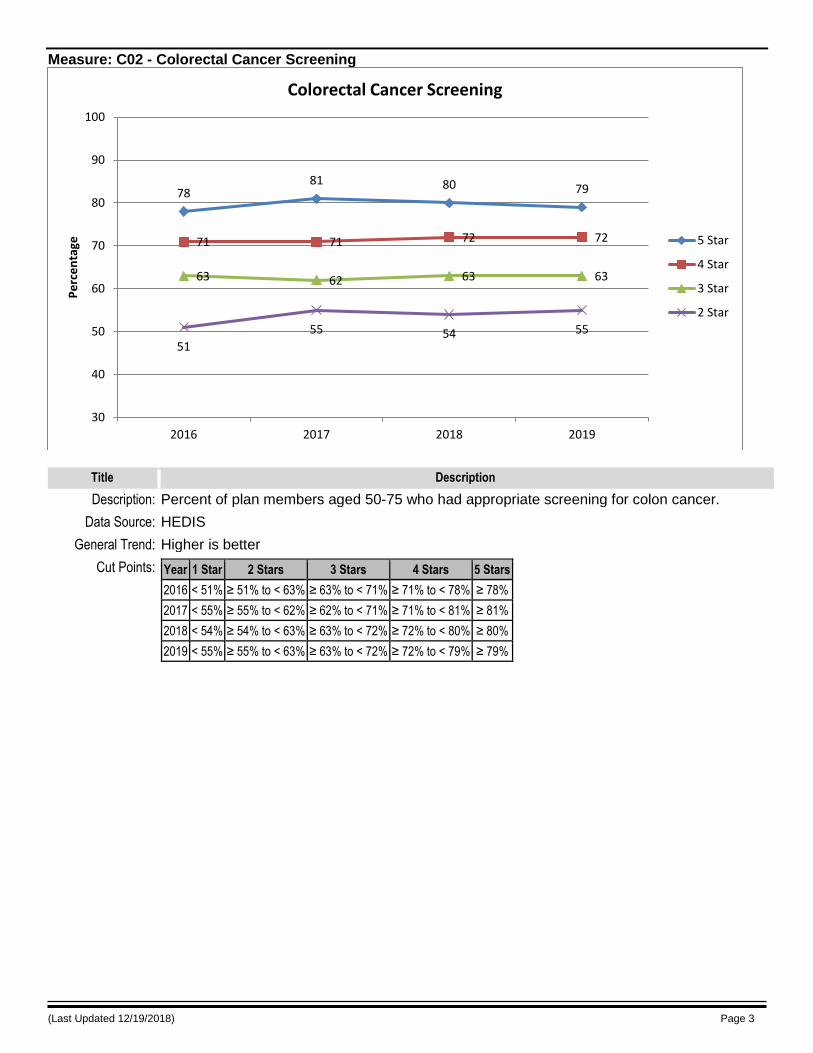
Measure: C02 - Colorectal Cancer Screening
Title Description
Description: Percent of plan members aged 50-75 who had appropriate screening for colon cancer.
Data Source: HEDIS
General Trend: Higher is better
Cut Points: Year 1 Star 2 Stars 3 Stars 4 Stars 5 Stars
2016 < 51% ≥ 51% to < 63% ≥ 63% to < 71% ≥ 71% to < 78% ≥ 78%
2017 < 55% ≥ 55% to < 62% ≥ 62% to < 71% ≥ 71% to < 81% ≥ 81%
2018 < 54% ≥ 54% to < 63% ≥ 63% to < 72% ≥ 72% to < 80% ≥ 80%
2019 < 55% ≥ 55% to < 63% ≥ 63% to < 72% ≥ 72% to < 79% ≥ 79%
7881 80 79
71 71 72 72
63 62 63 63
51
55 54 55
30
40
50
60
70
80
90
100
2016 2017 2018 2019
Pe
rce
nta
ge
Colorectal Cancer Screening
5 Star
4 Star
3 Star
2 Star
(Last Updated 12/19/2018) Page 4
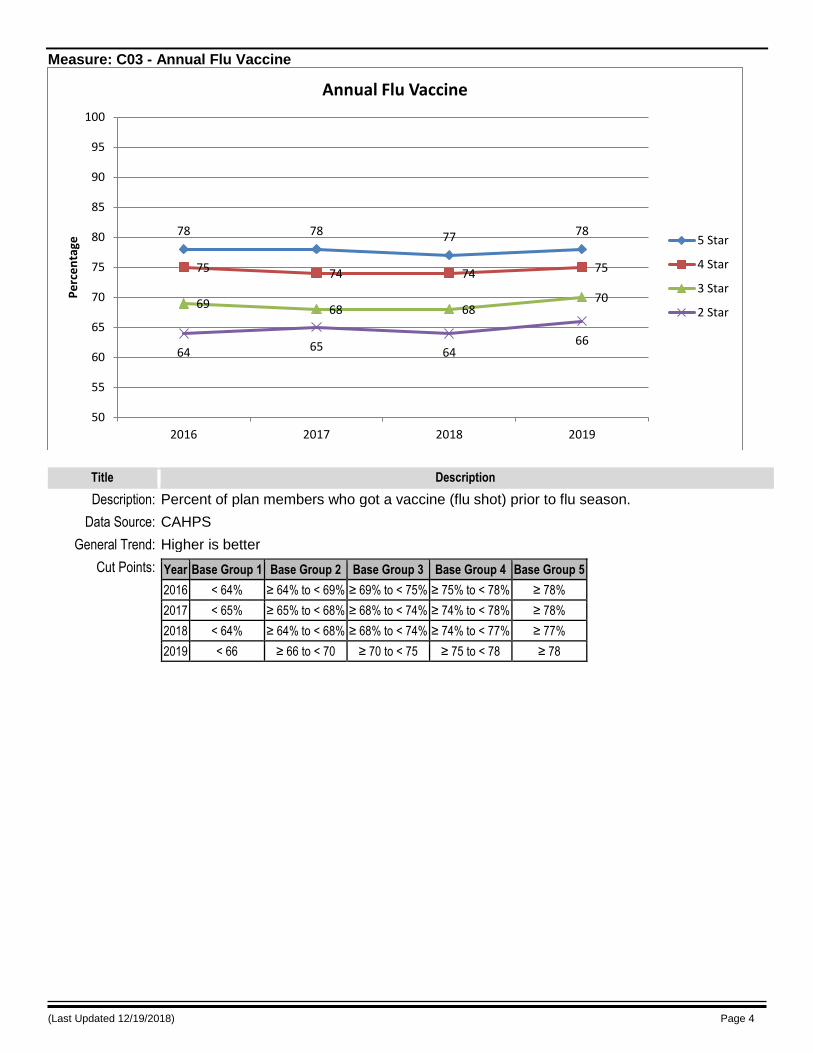
Measure: C03 - Annual Flu Vaccine
Title Description
Description: Percent of plan members who got a vaccine (flu shot) prior to flu season.
Data Source: CAHPS
General Trend: Higher is better
Cut Points: Year Base Group 1 Base Group 2 Base Group 3 Base Group 4 Base Group 5
2016 < 64% ≥ 64% to < 69% ≥ 69% to < 75% ≥ 75% to < 78% ≥ 78%
2017 < 65% ≥ 65% to < 68% ≥ 68% to < 74% ≥ 74% to < 78% ≥ 78%
2018 < 64% ≥ 64% to < 68% ≥ 68% to < 74% ≥ 74% to < 77% ≥ 77%
2019 < 66 ≥ 66 to < 70 ≥ 70 to < 75 ≥ 75 to < 78 ≥ 78
78 78 77 78
75 74 74 75
69 68 6870
64 65 6466
50
55
60
65
70
75
80
85
90
95
100
2016 2017 2018 2019
Pe
rce
nta
ge
Annual Flu Vaccine
5 Star
4 Star
3 Star
2 Star

(Last Updated 12/19/2018) Page 5
Measure: C04 - Improving or Maintaining Physical Health
Title Description
Description: Percent of plan members whose physical health was the same or better than expected after two years.
Data Source: HOS
General Trend: Higher is better
Cut Points: Year 1 Star 2 Stars 3 Stars 4 Stars 5 Stars
2016 < 63% ≥ 63% to < 67% ≥ 67% to < 69% ≥ 69% to < 72% ≥ 72%
2017 < 64% ≥ 64% to < 67% ≥ 67% to < 72% ≥ 72% to < 84% ≥ 84%
2018 < 63% ≥ 63% to < 67% ≥ 67% to < 69% ≥ 69% to < 72% ≥ 72%
2019 < 64% ≥ 64% to < 68% ≥ 68% to < 70% ≥ 70% to < 75% ≥ 75%
72
84
72
75
69
72
69 70
67 67 67 68
63 64 63 64
50
55
60
65
70
75
80
85
90
95
100
2016 2017 2018 2019
Pe
rce
nta
ge
Improving or Maintaining Physical Health
5 Star
4 Star
3 Star
2 Star

(Last Updated 12/19/2018) Page 6
Measure: C05 - Improving or Maintaining Mental Health
Title Description
Description: Percent of plan members whose mental health was the same or better than expected after two years.
Data Source: HOS
General Trend: Higher is better
Cut Points: Year 1 Star 2 Stars 3 Stars 4 Stars 5 Stars
2016 < 75% ≥ 75% to < 77% ≥ 77% to < 80% ≥ 80% to < 82% ≥ 82%
2017 < 79% ≥ 79% to < 83% ≥ 83% to < 85% ≥ 85% to < 87% ≥ 87%
2018 < 75% ≥ 75% to < 82% ≥ 82% to < 84% ≥ 84% to < 88% ≥ 88%
2019 < 76% ≥ 76% to < 80% ≥ 80% to < 84% ≥ 84% to < 86% ≥ 86%
82
8788
86
80
8584 84
77
8382
80
75
79
7576
60
65
70
75
80
85
90
95
100
2016 2017 2018 2019
Pe
rce
nta
ge
Improving or Maintaining Mental Health
5 Star
4 Star
3 Star
2 Star
(Last Updated 12/19/2018) Page 7
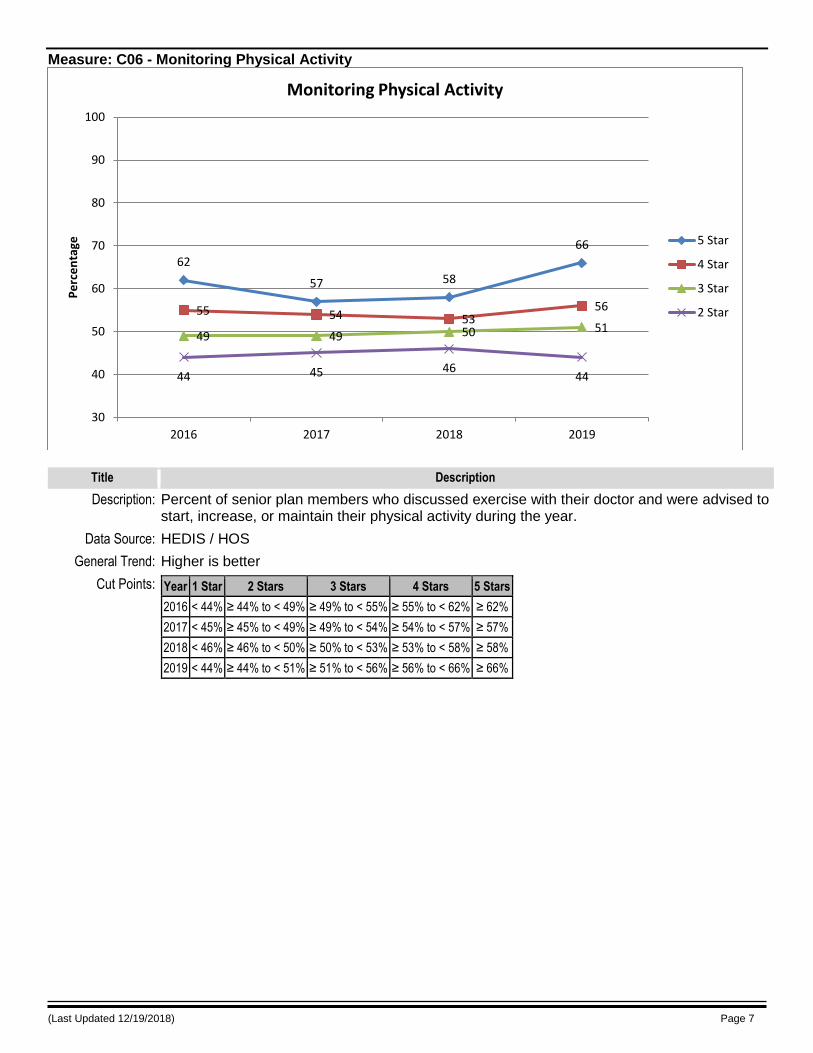
Measure: C06 - Monitoring Physical Activity
Title Description
Description: Percent of senior plan members who discussed exercise with their doctor and were advised to start, increase, or maintain their physical activity during the year.
Data Source: HEDIS / HOS
General Trend: Higher is better
Cut Points: Year 1 Star 2 Stars 3 Stars 4 Stars 5 Stars
2016 < 44% ≥ 44% to < 49% ≥ 49% to < 55% ≥ 55% to < 62% ≥ 62%
2017 < 45% ≥ 45% to < 49% ≥ 49% to < 54% ≥ 54% to < 57% ≥ 57%
2018 < 46% ≥ 46% to < 50% ≥ 50% to < 53% ≥ 53% to < 58% ≥ 58%
2019 < 44% ≥ 44% to < 51% ≥ 51% to < 56% ≥ 56% to < 66% ≥ 66%
62
57 58
66
55 54 5356
49 49 50 51
44 45 4644
30
40
50
60
70
80
90
100
2016 2017 2018 2019
Pe
rce
nta
ge
Monitoring Physical Activity
5 Star
4 Star
3 Star
2 Star
(Last Updated 12/19/2018) Page 8
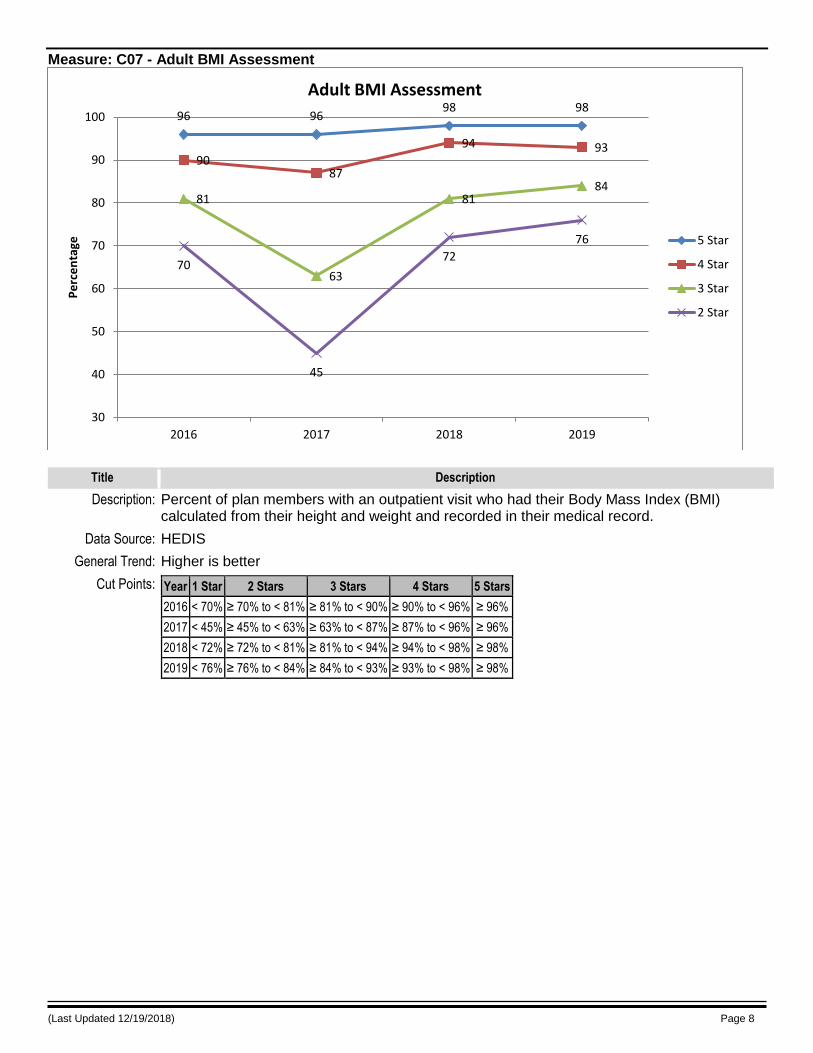
Measure: C07 - Adult BMI Assessment
Title Description
Description: Percent of plan members with an outpatient visit who had their Body Mass Index (BMI) calculated from their height and weight and recorded in their medical record.
Data Source: HEDIS
General Trend: Higher is better
Cut Points: Year 1 Star 2 Stars 3 Stars 4 Stars 5 Stars
2016 < 70% ≥ 70% to < 81% ≥ 81% to < 90% ≥ 90% to < 96% ≥ 96%
2017 < 45% ≥ 45% to < 63% ≥ 63% to < 87% ≥ 87% to < 96% ≥ 96%
2018 < 72% ≥ 72% to < 81% ≥ 81% to < 94% ≥ 94% to < 98% ≥ 98%
2019 < 76% ≥ 76% to < 84% ≥ 84% to < 93% ≥ 93% to < 98% ≥ 98%
96 9698 98
9087
94 93
81
63
8184
70
45
72
76
30
40
50
60
70
80
90
100
2016 2017 2018 2019
Pe
rce
nta
ge
Adult BMI Assessment
5 Star
4 Star
3 Star
2 Star
(Last Updated 12/19/2018) Page 9
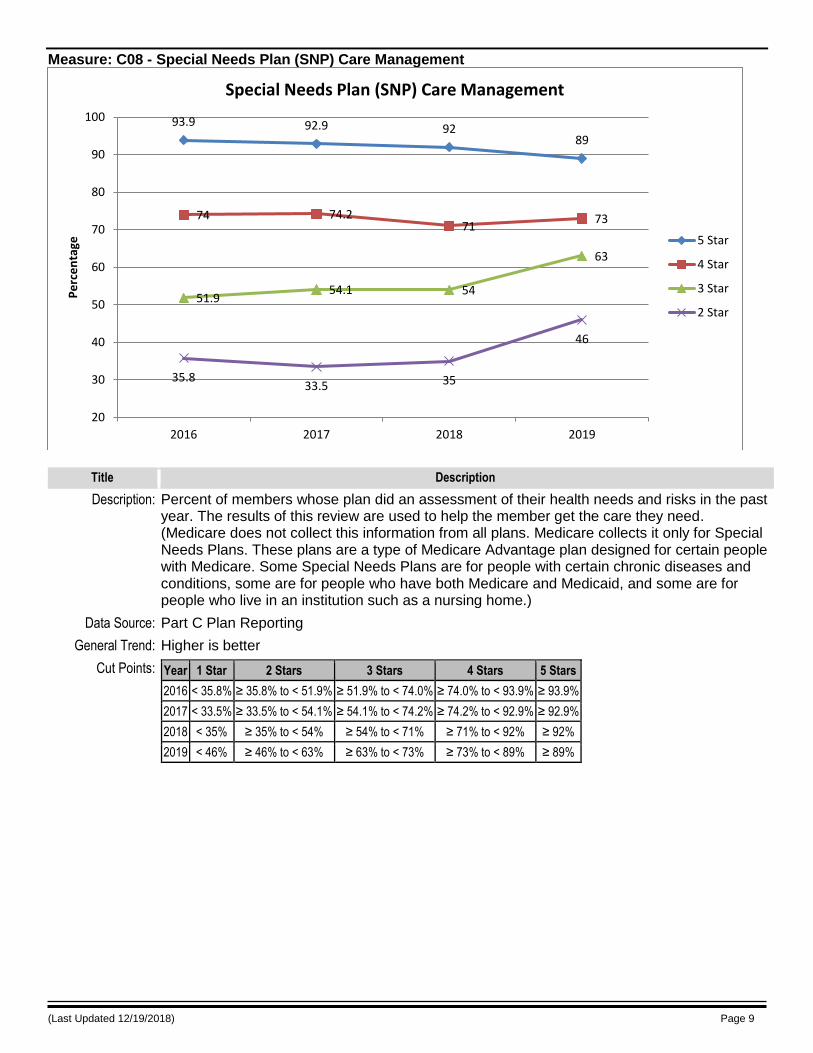
Measure: C08 - Special Needs Plan (SNP) Care Management
Title Description
Description: Percent of members whose plan did an assessment of their health needs and risks in the past year. The results of this review are used to help the member get the care they need. (Medicare does not collect this information from all plans. Medicare collects it only for Special Needs Plans. These plans are a type of Medicare Advantage plan designed for certain people with Medicare. Some Special Needs Plans are for people with certain chronic diseases and conditions, some are for people who have both Medicare and Medicaid, and some are for people who live in an institution such as a nursing home.)
Data Source: Part C Plan Reporting
General Trend: Higher is better
Cut Points: Year 1 Star 2 Stars 3 Stars 4 Stars 5 Stars
2016 < 35.8% ≥ 35.8% to < 51.9% ≥ 51.9% to < 74.0% ≥ 74.0% to < 93.9% ≥ 93.9%
2017 < 33.5% ≥ 33.5% to < 54.1% ≥ 54.1% to < 74.2% ≥ 74.2% to < 92.9% ≥ 92.9%
2018 < 35% ≥ 35% to < 54% ≥ 54% to < 71% ≥ 71% to < 92% ≥ 92%
2019 < 46% ≥ 46% to < 63% ≥ 63% to < 73% ≥ 73% to < 89% ≥ 89%
93.9 92.9 9289
74 74.271
73
51.954.1 54
63
35.833.5 35
46
20
30
40
50
60
70
80
90
100
2016 2017 2018 2019
Pe
rce
nta
ge
Special Needs Plan (SNP) Care Management
5 Star
4 Star
3 Star
2 Star

(Last Updated 12/19/2018) Page 10
Measure: C09 - Care for Older Adults – Medication Review
Title Description
Description: Percent of plan members whose doctor or clinical pharmacist reviewed a list of everything they take (prescription and non-prescription drugs, vitamins, herbal remedies, other supplements) at least once a year. (Medicare does not collect this information from all plans. Medicare collects it only for Special Needs Plans. These plans are a type of Medicare Advantage plan designed for certain people with Medicare. Some Special Needs Plans are for people with certain chronic diseases and conditions, some are for people who have both Medicare and Medicaid, and some are for people who live in an institution such as a nursing home.)
Data Source: HEDIS
General Trend: Higher is better
Cut Points: Year 1 Star 2 Stars 3 Stars 4 Stars 5 Stars
2016 < 47% ≥ 47% to < 60% ≥ 60% to < 77% ≥ 77% to < 87% ≥ 87%
2017 < 30% ≥ 30% to < 57% ≥ 57% to < 75% ≥ 75% to < 87% ≥ 87%
2018 < 59% ≥ 59% to < 79% ≥ 79% to < 88% ≥ 88% to < 93% ≥ 93%
2019 < 1% ≥ 1% to < 54% ≥ 54% to < 83% ≥ 83% to < 92% ≥ 92%
87 87
93 92
77 75
8883
6057
79
54
47
30
59
10
10
20
30
40
50
60
70
80
90
100
2016 2017 2018 2019
Pe
rce
nta
ge
Care for Older Adults – Medication Review
5 Star
4 Star
3 Star
2 Star
(Last Updated 12/19/2018) Page 11
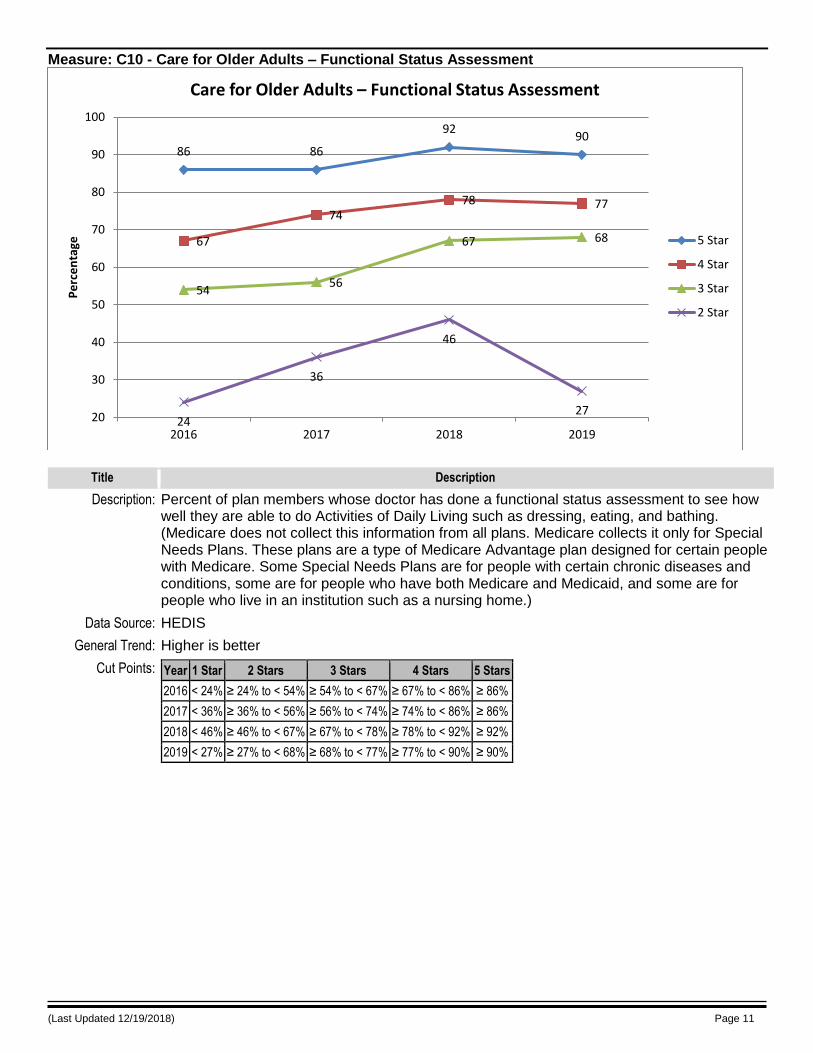
Measure: C10 - Care for Older Adults – Functional Status Assessment
Title Description
Description: Percent of plan members whose doctor has done a functional status assessment to see how well they are able to do Activities of Daily Living such as dressing, eating, and bathing. (Medicare does not collect this information from all plans. Medicare collects it only for Special Needs Plans. These plans are a type of Medicare Advantage plan designed for certain people with Medicare. Some Special Needs Plans are for people with certain chronic diseases and conditions, some are for people who have both Medicare and Medicaid, and some are for people who live in an institution such as a nursing home.)
Data Source: HEDIS
General Trend: Higher is better
Cut Points: Year 1 Star 2 Stars 3 Stars 4 Stars 5 Stars
2016 < 24% ≥ 24% to < 54% ≥ 54% to < 67% ≥ 67% to < 86% ≥ 86%
2017 < 36% ≥ 36% to < 56% ≥ 56% to < 74% ≥ 74% to < 86% ≥ 86%
2018 < 46% ≥ 46% to < 67% ≥ 67% to < 78% ≥ 78% to < 92% ≥ 92%
2019 < 27% ≥ 27% to < 68% ≥ 68% to < 77% ≥ 77% to < 90% ≥ 90%
86 86
9290
67
7478 77
5456
67 68
24
36
46
2720
30
40
50
60
70
80
90
100
2016 2017 2018 2019
Pe
rce
nta
ge
Care for Older Adults – Functional Status Assessment
5 Star
4 Star
3 Star
2 Star

(Last Updated 12/19/2018) Page 12
Measure: C11 - Care for Older Adults – Pain Assessment
Title Description
Description: Percent of plan members who had a pain screening at least once during the year. (Medicare does not collect this information from all plans. Medicare collects it only for Special Needs Plans. These plans are a type of Medicare Advantage plan designed for certain people with Medicare. Some Special Needs Plans are for people with certain chronic diseases and conditions, some are for people who have both Medicare and Medicaid, and some are for people who live in an institution such as a nursing home.)
Data Source: HEDIS
General Trend: Higher is better
Cut Points: Year 1 Star 2 Stars 3 Stars 4 Stars 5 Stars
2016 < 30% ≥ 30% to < 62% ≥ 62% to < 78% ≥ 78% to < 95% ≥ 95%
2017 < 37% ≥ 37% to < 59% ≥ 59% to < 75% ≥ 75% to < 88% ≥ 88%
2018 < 40% ≥ 40% to < 62% ≥ 62% to < 80% ≥ 80% to < 94% ≥ 94%
2019 < 41% ≥ 41% to < 73% ≥ 73% to < 89% ≥ 89% to < 97% ≥ 97%
95
88
9497
7875
80
89
6259
62
73
30
3740 41
20
30
40
50
60
70
80
90
100
2016 2017 2018 2019
Pe
rce
nta
ge
Care for Older Adults – Pain Assessment
5 Star
4 Star
3 Star
2 Star

(Last Updated 12/19/2018) Page 13
Measure: C12 - Osteoporosis Management in Women who had a Fracture
Title Description
Description: Percent of female plan members who broke a bone and got screening or treatment for osteoporosis within 6 months.
Data Source: HEDIS
General Trend: Higher is better
Cut Points: Year 1 Star 2 Stars 3 Stars 4 Stars 5 Stars
2016 < 20% ≥ 20% to < 32% ≥ 32% to < 51% ≥ 51% to < 75% ≥ 75%
2017 < 21% ≥ 21% to < 34% ≥ 34% to < 51% ≥ 51% to < 70% ≥ 70%
2018 < 24% ≥ 24% to < 42% ≥ 42% to < 52% ≥ 52% to < 71% ≥ 71%
2019 < 29% ≥ 29% to < 45% ≥ 45% to < 57% ≥ 57% to < 78% ≥ 78%
7570 71
78
51 51 5257
32 34
4245
20 2124
29
0
10
20
30
40
50
60
70
80
90
100
2016 2017 2018 2019
Pe
rce
nta
ge
Osteoporosis Management in Women who had a Fracture
5 Star
4 Star
3 Star
2 Star

(Last Updated 12/19/2018) Page 14
Measure: C13 - Diabetes Care – Eye Exam
Title Description
Description: Percent of plan members with diabetes who had an eye exam to check for damage from diabetes during the year.
Data Source: HEDIS
General Trend: Higher is better
Cut Points: Year 1 Star 2 Stars 3 Stars 4 Stars 5 Stars
2016 < 53% ≥ 53% to < 65% ≥ 65% to < 75% ≥ 75% to < 82% ≥ 82%
2017 < 46% ≥ 46% to < 61% ≥ 61% to < 73% ≥ 73% to < 81% ≥ 81%
2018 < 47% ≥ 47% to < 59% ≥ 59% to < 72% ≥ 72% to < 81% ≥ 81%
2019 < 56% ≥ 56% to < 64% ≥ 64% to < 73% ≥ 73% to < 80% ≥ 80%
82 81 81 80
7573 72 73
65
6159
64
53
46 47
56
30
40
50
60
70
80
90
100
2016 2017 2018 2019
Pe
rce
nta
ge
Diabetes Care – Eye Exam
5 Star
4 Star
3 Star
2 Star

(Last Updated 12/19/2018) Page 15
Measure: C14 - Diabetes Care – Kidney Disease Monitoring
Title Description
Description: Percent of plan members with diabetes who had a kidney function test during the year.
Data Source: HEDIS
General Trend: Higher is better
Cut Points: Year 1 Star 2 Stars 3 Stars 4 Stars 5 Stars
2016 < 85% ≥ 85% to < 89% ≥ 89% to < 93% ≥ 93% to < 97% ≥ 97%
2017 < 92% ≥ 92% to < 94% ≥ 94% to < 96% ≥ 96% to < 98% ≥ 98%
2018 < 92% ≥ 92% to < 94% ≥ 94% to < 96% ≥ 96% to < 98% ≥ 98%
2019 NA NA ≥ 87% to < 95% ≥ 95% to < 97% ≥ 97%
9798 98
97
93
96 9695
89
94 94
87
85
92 92
70
75
80
85
90
95
100
2016 2017 2018 2019
Pe
rce
nta
ge
Diabetes Care – Kidney Disease Monitoring
5 Star
4 Star
3 Star
2 Star

(Last Updated 12/19/2018) Page 16
Measure: C15 - Diabetes Care – Blood Sugar Controlled
Title Description
Description: Percent of plan members with diabetes who had an A1C lab test during the year that showed their average blood sugar is under control.
Data Source: HEDIS
General Trend: Higher is better
Cut Points: Year 1 Star 2 Stars 3 Stars 4 Stars 5 Stars
2016 < 49% ≥ 49% to < 60% ≥ 60% to < 71% ≥ 71% to < 84% ≥ 84%
2017 < 49% ≥ 49% to < 62% ≥ 62% to < 76% ≥ 76% to < 84% ≥ 84%
2018 < 40% ≥ 40% to < 64% ≥ 64% to < 73% ≥ 73% to < 80% ≥ 80%
2019 < 39% ≥ 39% to < 68% ≥ 68% to < 78% ≥ 78% to < 87% ≥ 87%
84 84
80
87
71
7673
78
6062
64
68
49 49
40 39
30
40
50
60
70
80
90
100
2016 2017 2018 2019
Pe
rce
nta
ge
Diabetes Care – Blood Sugar Controlled
5 Star
4 Star
3 Star
2 Star

(Last Updated 12/19/2018) Page 17
Measure: C16 - Controlling Blood Pressure
Title Description
Description: Percent of plan members with high blood pressure who got treatment and were able to maintain a healthy pressure.
Data Source: HEDIS
General Trend: Higher is better
Cut Points: Year 1 Star 2 Stars 3 Stars 4 Stars 5 Stars
2016 < 47% ≥ 47% to < 62% ≥ 62% to < 75% ≥ 75% to < 82% ≥ 82%
2017 < 38% ≥ 38% to < 56% ≥ 56% to < 64% ≥ 64% to < 75% ≥ 75%
2018 < 55% ≥ 55% to < 67% ≥ 67% to < 75% ≥ 75% to < 86% ≥ 86%
2019 < 51% ≥ 51% to < 62% ≥ 62% to < 75% ≥ 75% to < 82% ≥ 82%
82
75
86
82
75
64
75 75
62
56
67
62
47
38
55
51
30
40
50
60
70
80
90
100
2016 2017 2018 2019
Pe
rce
nta
ge
Controlling Blood Pressure
5 Star
4 Star
3 Star
2 Star
(Last Updated 12/19/2018) Page 18
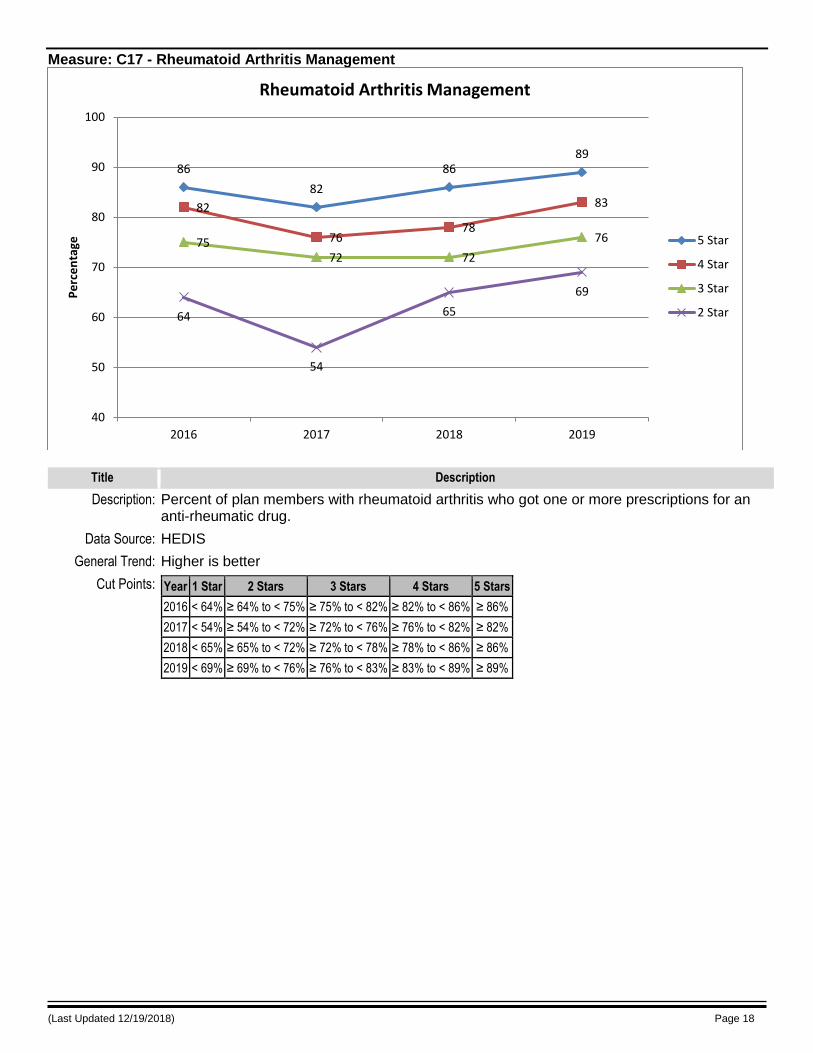
Measure: C17 - Rheumatoid Arthritis Management
Title Description
Description: Percent of plan members with rheumatoid arthritis who got one or more prescriptions for an anti-rheumatic drug.
Data Source: HEDIS
General Trend: Higher is better
Cut Points: Year 1 Star 2 Stars 3 Stars 4 Stars 5 Stars
2016 < 64% ≥ 64% to < 75% ≥ 75% to < 82% ≥ 82% to < 86% ≥ 86%
2017 < 54% ≥ 54% to < 72% ≥ 72% to < 76% ≥ 76% to < 82% ≥ 82%
2018 < 65% ≥ 65% to < 72% ≥ 72% to < 78% ≥ 78% to < 86% ≥ 86%
2019 < 69% ≥ 69% to < 76% ≥ 76% to < 83% ≥ 83% to < 89% ≥ 89%
86
82
8689
82
7678
83
7572 72
76
64
54
65
69
40
50
60
70
80
90
100
2016 2017 2018 2019
Pe
rce
nta
ge
Rheumatoid Arthritis Management
5 Star
4 Star
3 Star
2 Star

(Last Updated 12/19/2018) Page 19
Measure: C18 - Reducing the Risk of Falling
Title Description
Description: Percent of plan members with a problem falling, walking, or balancing who discussed it with their doctor and received a recommendation for how to prevent falls during the year.
Data Source: HEDIS / HOS
General Trend: Higher is better
Cut Points: Year 1 Star 2 Stars 3 Stars 4 Stars 5 Stars
2016 < 53% ≥ 53% to < 60% ≥ 60% to < 67% ≥ 67% to < 73% ≥ 73%
2017 < 53% ≥ 53% to < 57% ≥ 57% to < 63% ≥ 63% to < 73% ≥ 73%
2018 < 52% ≥ 52% to < 59% ≥ 59% to < 66% ≥ 66% to < 74% ≥ 74%
2019 < 48% ≥ 48% to < 54% ≥ 54% to < 61% ≥ 61% to < 70% ≥ 70%
73 73 74
70
67
6366
616057
59
54
40
50
60
70
80
90
100
2016 2017 2018 2019
Pe
rce
nta
ge
Reducing the Risk of Falling
5 Star
4 Star
3 Star
2 Star

(Last Updated 12/19/2018) Page 20
Measure: C19 - Improving Bladder Control
Title Description
Description: Percent of plan members with a urine leakage problem in the past 6 months who discussed treatment options with a provider.
Data Source: HEDIS / HOS
General Trend: Higher is better
Cut Points: Year 1 Star 2 Stars 3 Stars 4 Stars 5 Stars
2018 < 39% ≥ 39% to < 43% ≥ 43% to < 46% ≥ 46% to < 50% ≥ 50%
2019 < 38% ≥ 38% to < 42% ≥ 42% to < 48% ≥ 48% to < 53% ≥ 53%
5053
4648
43 42
39 3830
40
50
60
70
80
90
100
2018 2019
Pe
rce
nta
ge
Improving Bladder Control
5 Star
4 Star
3 Star
2 Star
(Last Updated 12/19/2018) Page 21
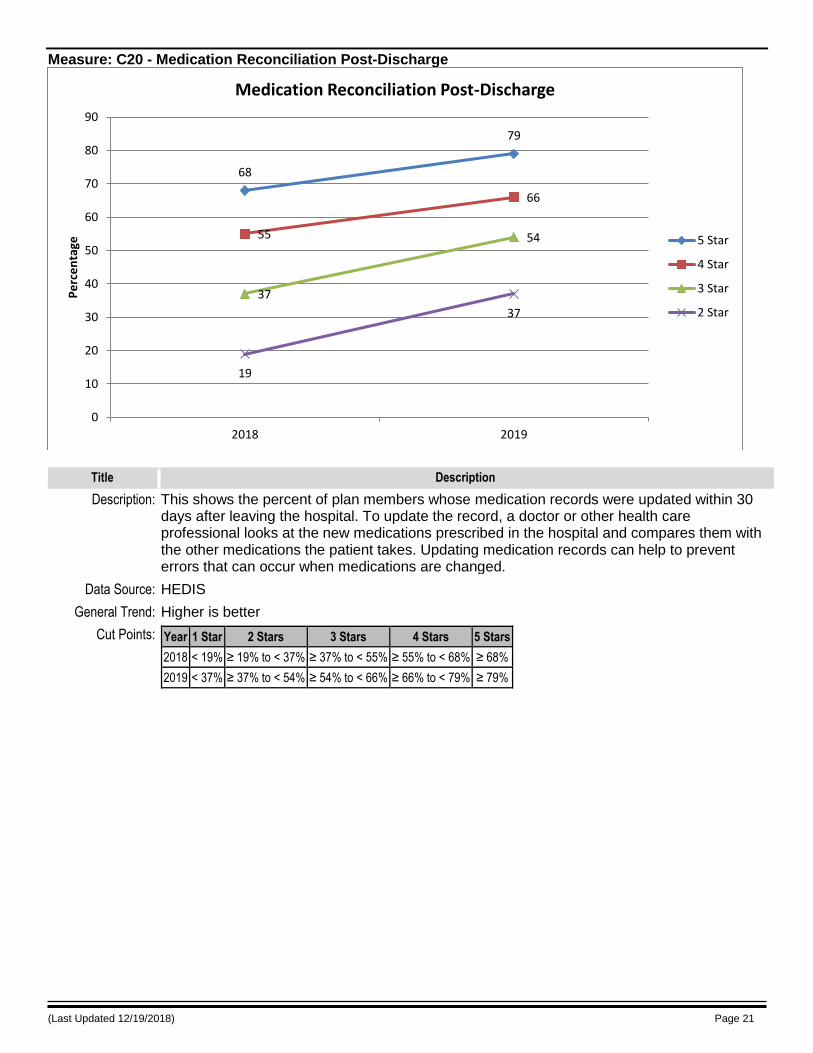
Measure: C20 - Medication Reconciliation Post-Discharge
Title Description
Description: This shows the percent of plan members whose medication records were updated within 30 days after leaving the hospital. To update the record, a doctor or other health care professional looks at the new medications prescribed in the hospital and compares them with the other medications the patient takes. Updating medication records can help to prevent errors that can occur when medications are changed.
Data Source: HEDIS
General Trend: Higher is better
Cut Points: Year 1 Star 2 Stars 3 Stars 4 Stars 5 Stars
2018 < 19% ≥ 19% to < 37% ≥ 37% to < 55% ≥ 55% to < 68% ≥ 68%
2019 < 37% ≥ 37% to < 54% ≥ 54% to < 66% ≥ 66% to < 79% ≥ 79%
68
79
55
66
37
54
19
37
0
10
20
30
40
50
60
70
80
90
2018 2019
Pe
rce
nta
ge
Medication Reconciliation Post-Discharge
5 Star
4 Star
3 Star
2 Star

(Last Updated 12/19/2018) Page 22
Measure: C21 - Plan All-Cause Readmissions
Title Description
Description: Percent of senior plan members discharged from a hospital stay who were readmitted to a hospital within 30 days, either for the same condition as their recent hospital stay or for a different reason. (Patients may have been readmitted back to the same hospital or to a different one. Rates of readmission take into account how sick patients were when they went into the hospital the first time. This “risk-adjustment” helps make the comparisons between plans fair and meaningful.)
Data Source: HEDIS
General Trend: Lower is better
Cut Points: Year 1 Star 2 Stars 3 Stars 4 Stars 5 Stars
2016 > 17% > 11% to ≤ 17% > 9% to ≤ 11% > 6% to ≤ 9% ≤ 6%
2017 > 15% > 12% to ≤ 15% > 10% to ≤ 12% > 8% to ≤ 10% ≤ 8%
2018 > 18% > 11% to ≤ 18% > 9% to ≤ 11% > 6% to ≤ 9% ≤ 6%
2019 > 12% > 10% to ≤ 12% > 8% to ≤ 10% > 5% to ≤ 8% ≤ 5%
6
8
65
910
98
1112
1110
0
5
10
15
20
25
30
2016 2017 2018 2019
Pe
rce
nta
ge
Plan All-Cause Readmissions
5 Star
4 Star
3 Star
2 Star
(Last Updated 12/19/2018) Page 23
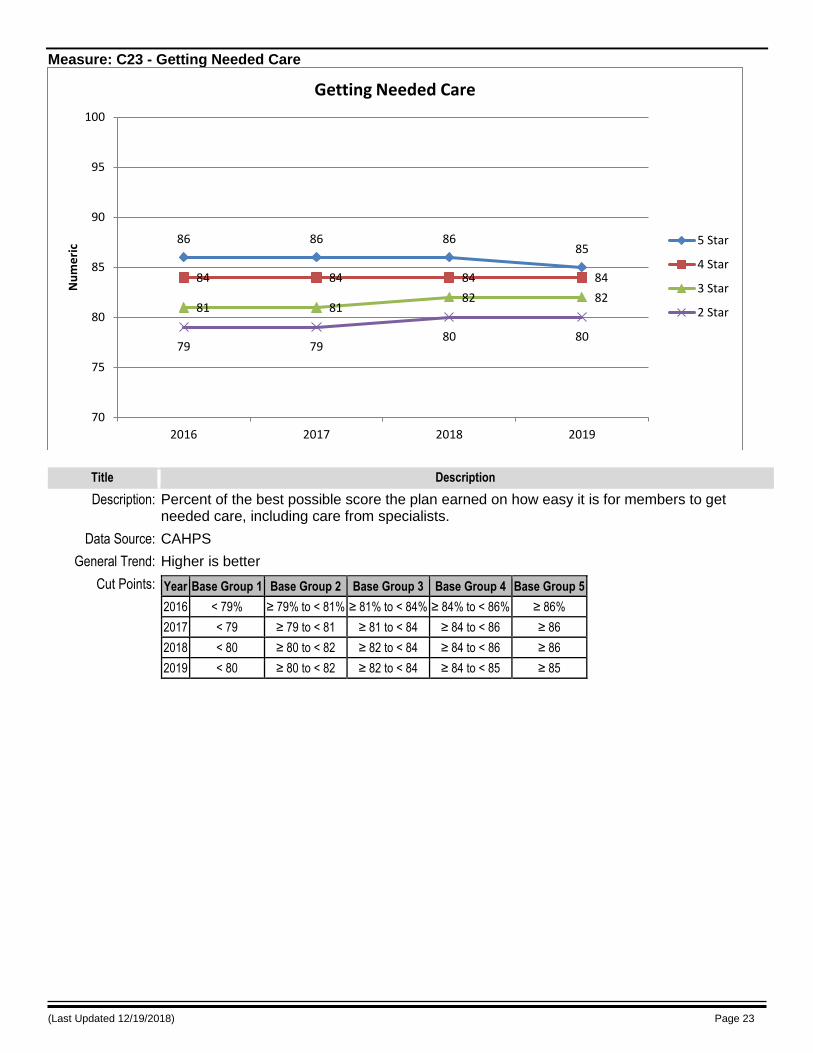
Measure: C23 - Getting Needed Care
Title Description
Description: Percent of the best possible score the plan earned on how easy it is for members to get needed care, including care from specialists.
Data Source: CAHPS
General Trend: Higher is better
Cut Points: Year Base Group 1 Base Group 2 Base Group 3 Base Group 4 Base Group 5
2016 < 79% ≥ 79% to < 81% ≥ 81% to < 84% ≥ 84% to < 86% ≥ 86%
2017 < 79 ≥ 79 to < 81 ≥ 81 to < 84 ≥ 84 to < 86 ≥ 86
2018 < 80 ≥ 80 to < 82 ≥ 82 to < 84 ≥ 84 to < 86 ≥ 86
2019 < 80 ≥ 80 to < 82 ≥ 82 to < 84 ≥ 84 to < 85 ≥ 85
86 86 8685
84 84 84 84
81 8182 82
79 7980 80
70
75
80
85
90
95
100
2016 2017 2018 2019
Nu
me
ric
Getting Needed Care
5 Star
4 Star
3 Star
2 Star
(Last Updated 12/19/2018) Page 24
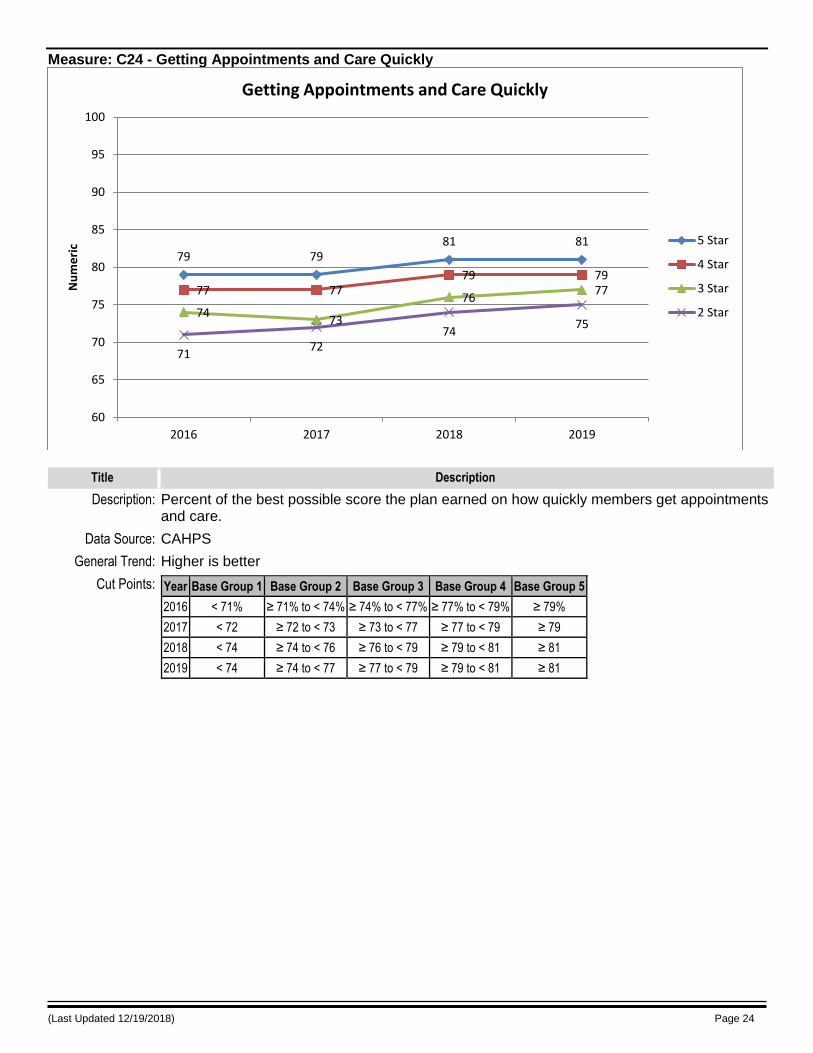
Measure: C24 - Getting Appointments and Care Quickly
Title Description
Description: Percent of the best possible score the plan earned on how quickly members get appointments and care.
Data Source: CAHPS
General Trend: Higher is better
Cut Points: Year Base Group 1 Base Group 2 Base Group 3 Base Group 4 Base Group 5
2016 < 71% ≥ 71% to < 74% ≥ 74% to < 77% ≥ 77% to < 79% ≥ 79%
2017 < 72 ≥ 72 to < 73 ≥ 73 to < 77 ≥ 77 to < 79 ≥ 79
2018 < 74 ≥ 74 to < 76 ≥ 76 to < 79 ≥ 79 to < 81 ≥ 81
2019 < 74 ≥ 74 to < 77 ≥ 77 to < 79 ≥ 79 to < 81 ≥ 81
79 7981 81
77 7779 79
7473
7677
7172
7475
60
65
70
75
80
85
90
95
100
2016 2017 2018 2019
Nu
me
ric
Getting Appointments and Care Quickly
5 Star
4 Star
3 Star
2 Star

(Last Updated 12/19/2018) Page 25
Measure: C25 - Customer Service
Title Description
Description: Percent of the best possible score the plan earned on how easy it is for members to get information and help from the plan when needed.
Data Source: CAHPS
General Trend: Higher is better
Cut Points: Year Base Group 1 Base Group 2 Base Group 3 Base Group 4 Base Group 5
2016 < 83% ≥ 83% to < 85% ≥ 85% to < 88% ≥ 88% to < 90% ≥ 90%
2017 < 84 ≥ 84 to < 86 ≥ 86 to < 89 ≥ 89 to < 90 ≥ 90
2018 < 88 ≥ 88 to < 89 ≥ 89 to < 91 ≥ 91 to < 92 ≥ 92
2019 < 88 ≥ 88 to < 89 ≥ 89 to < 91 ≥ 91 to < 92 ≥ 92
90 90
92 92
8889
91 91
8586
89 89
82
84
88 88
70
75
80
85
90
95
100
2016 2017 2018 2019
Nu
me
ric
Customer Service
5 Star
4 Star
3 Star
2 Star
(Last Updated 12/19/2018) Page 26
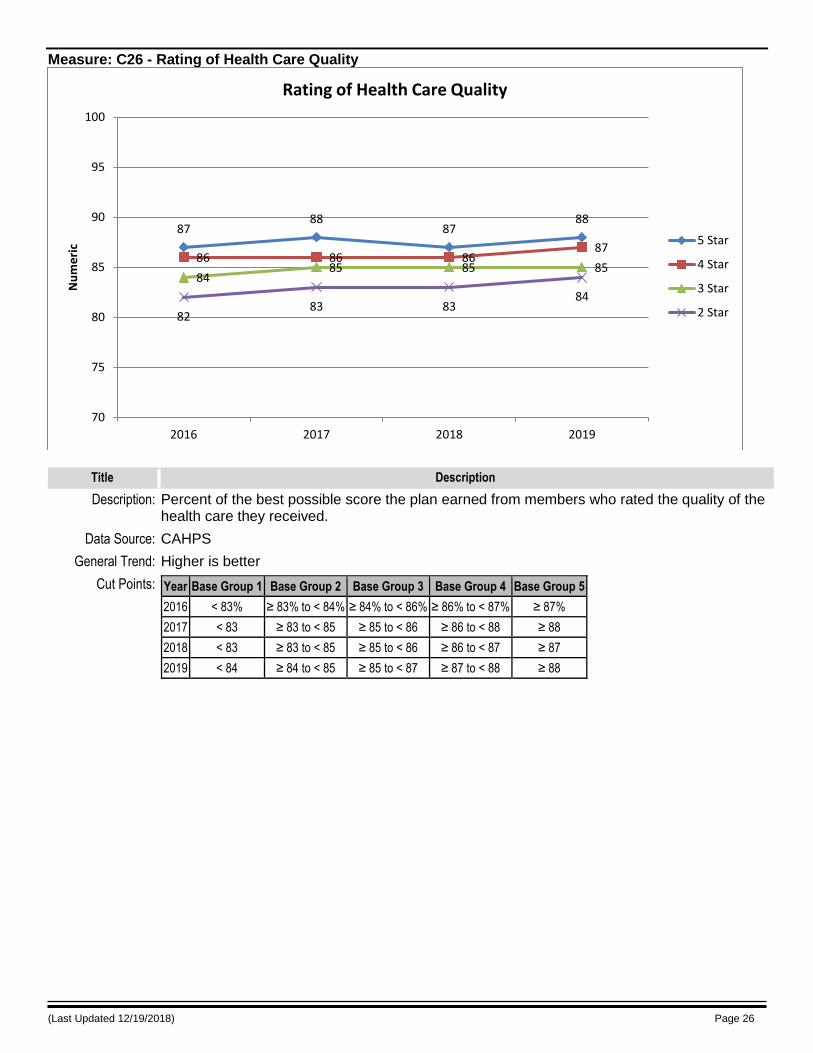
Measure: C26 - Rating of Health Care Quality
Title Description
Description: Percent of the best possible score the plan earned from members who rated the quality of the health care they received.
Data Source: CAHPS
General Trend: Higher is better
Cut Points: Year Base Group 1 Base Group 2 Base Group 3 Base Group 4 Base Group 5
2016 < 83% ≥ 83% to < 84% ≥ 84% to < 86% ≥ 86% to < 87% ≥ 87%
2017 < 83 ≥ 83 to < 85 ≥ 85 to < 86 ≥ 86 to < 88 ≥ 88
2018 < 83 ≥ 83 to < 85 ≥ 85 to < 86 ≥ 86 to < 87 ≥ 87
2019 < 84 ≥ 84 to < 85 ≥ 85 to < 87 ≥ 87 to < 88 ≥ 88
8788
8788
86 86 8687
8485 85 85
8283 83
84
70
75
80
85
90
95
100
2016 2017 2018 2019
Nu
me
ric
Rating of Health Care Quality
5 Star
4 Star
3 Star
2 Star

(Last Updated 12/19/2018) Page 27
Measure: C27 - Rating of Health Plan
Title Description
Description: Percent of the best possible score the plan earned from members who rated the health plan.
Data Source: CAHPS
General Trend: Higher is better
Cut Points: Year Base Group 1 Base Group 2 Base Group 3 Base Group 4 Base Group 5
2016 < 80% ≥ 80% to < 83% ≥ 83% to < 85% ≥ 85% to < 87% ≥ 87%
2017 < 81 ≥ 81 to < 83 ≥ 83 to < 85 ≥ 85 to < 88 ≥ 88
2018 < 82 ≥ 82 to < 84 ≥ 84 to < 86 ≥ 86 to < 88 ≥ 88
2019 < 83 ≥ 83 to < 84 ≥ 84 to < 86 ≥ 86 to < 88 ≥ 88
8788 88 88
85 8586 86
83 8384 84
8081
8283
70
75
80
85
90
95
100
2016 2017 2018 2019
Nu
me
ric
Rating of Health Plan
5 Star
4 Star
3 Star
2 Star

(Last Updated 12/19/2018) Page 28
Measure: C28 - Care Coordination
Title Description
Description: Percent of the best possible score the plan earned on how well the plan coordinates members’ care. (This includes whether doctors had the records and information they needed about members’ care and how quickly members got their test results.)
Data Source: CAHPS
General Trend: Higher is better
Cut Points: Year Base Group 1 Base Group 2 Base Group 3 Base Group 4 Base Group 5
2016 < 82% ≥ 82% to < 84% ≥ 84% to < 86% ≥ 86% to < 87% ≥ 87%
2017 < 82 ≥ 82 to < 84 ≥ 84 to < 86 ≥ 86 to < 87 ≥ 87
2018 < 83 ≥ 83 to < 85 ≥ 85 to < 87 ≥ 87 to < 88 ≥ 88
2019 < 84 ≥ 84 to < 85 ≥ 85 to < 86 ≥ 86 to < 88 ≥ 88
87 8788 88
86 8687
86
84 8485 85
82 8283
84
70
75
80
85
90
95
100
2016 2017 2018 2019
Nu
me
ric
Care Coordination
5 Star
4 Star
3 Star
2 Star

(Last Updated 12/19/2018) Page 29
Measure: C29 - Complaints about the Health Plan
Title Description
Description: Percent of members filing complaints with Medicare about the health plan.
Data Source: Complaints Tracking Module (CTM)
General Trend: Lower is better
Cut Points: Year 1 Star 2 Stars 3 Stars 4 Stars 5 Stars
2016 > 0.98 > 0.50 to ≤ 0.98 > 0.21 to ≤ 0.50 > 0.08 to ≤ 0.21 ≤ 0.08
2017 > 1.44 > 0.90 to ≤ 1.44 > 0.54 to ≤ 0.90 > 0.27 to ≤ 0.54 ≤ 0.27
2018 > 0.86 > 0.53 to ≤ 0.86 > 0.31 to ≤ 0.53 > 0.14 to ≤ 0.31 ≤ 0.14
2019 > 0.64 > 0.31 to ≤ 0.64 > 0.18 to ≤ 0.31 > 0.10 to ≤ 0.18 ≤ 0.10
0.080.27
0.14 0.1
0.21
0.54
0.310.18
0.5
0.9
0.53
0.31
0.98
1.44
0.86
0.64
-1
-0.5
0
0.5
1
1.5
2
2.5
2016 2017 2018 2019
Nu
me
ric
pe
r 1
,00
0 m
em
be
rs
Complaints about the Health Plan
5 Star
4 Star
3 Star
2 Star

(Last Updated 12/19/2018) Page 30
Measure: C30 - Members Choosing to Leave the Plan
Title Description
Description: Percent of plan members who chose to leave the plan.
Data Source: MBDSS
General Trend: Lower is better
Cut Points: Year 1 Star 2 Stars 3 Stars 4 Stars 5 Stars
2016 > 31% > 23% to ≤ 31% > 16% to ≤ 23% > 10% to ≤ 16% ≤ 10%
2017 > 47% > 24% to ≤ 47% > 17% to ≤ 24% > 9% to ≤ 17% ≤ 9%
2018 > 28% > 18% to ≤ 28% > 13% to ≤ 18% > 8% to ≤ 13% ≤ 8%
2019 > 24% > 18% to ≤ 24% > 11% to ≤ 18% > 6% to ≤ 11% ≤ 6%
10 9 86
16 17
1311
23 24
18 18
31
47
28
24
0
5
10
15
20
25
30
35
40
45
50
2016 2017 2018 2019
Pe
rce
nta
ge
Members Choosing to Leave the Plan
5 Star
4 Star
3 Star
2 Star
(Last Updated 12/19/2018) Page 31
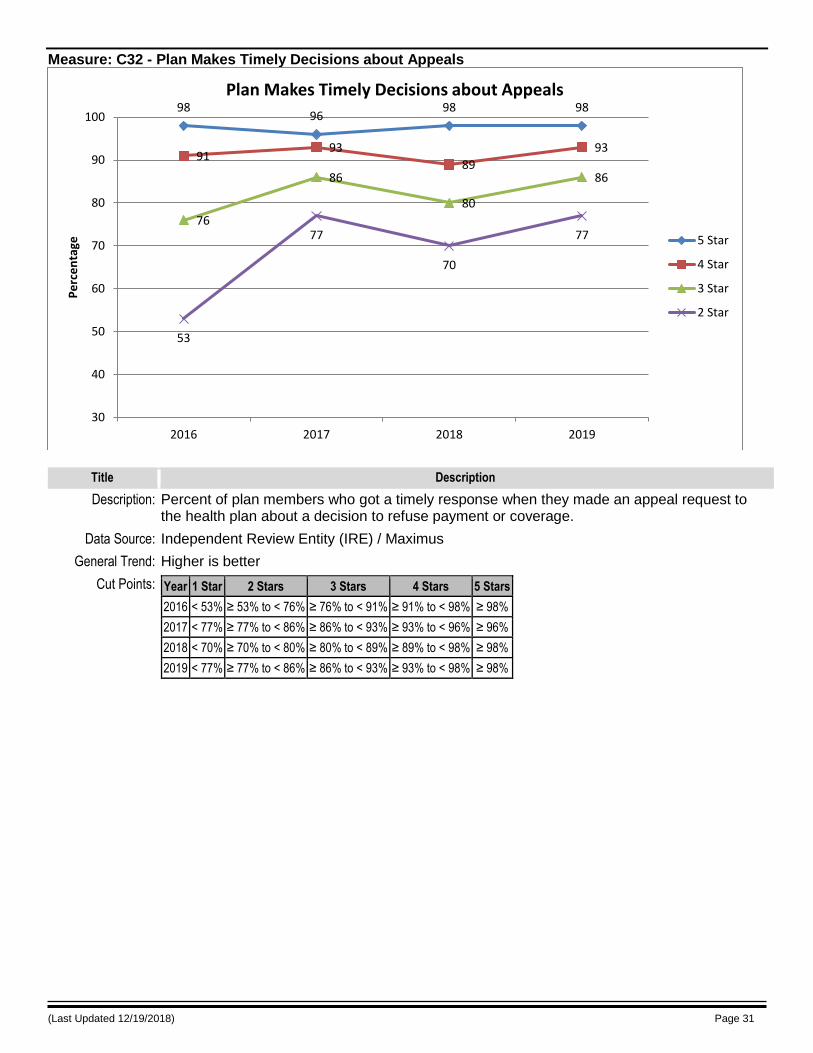
Measure: C32 - Plan Makes Timely Decisions about Appeals
Title Description
Description: Percent of plan members who got a timely response when they made an appeal request to the health plan about a decision to refuse payment or coverage.
Data Source: Independent Review Entity (IRE) / Maximus
General Trend: Higher is better
Cut Points: Year 1 Star 2 Stars 3 Stars 4 Stars 5 Stars
2016 < 53% ≥ 53% to < 76% ≥ 76% to < 91% ≥ 91% to < 98% ≥ 98%
2017 < 77% ≥ 77% to < 86% ≥ 86% to < 93% ≥ 93% to < 96% ≥ 96%
2018 < 70% ≥ 70% to < 80% ≥ 80% to < 89% ≥ 89% to < 98% ≥ 98%
2019 < 77% ≥ 77% to < 86% ≥ 86% to < 93% ≥ 93% to < 98% ≥ 98%
9896
98 98
9193
89
93
76
86
80
86
53
77
70
77
30
40
50
60
70
80
90
100
2016 2017 2018 2019
Pe
rce
nta
ge
Plan Makes Timely Decisions about Appeals
5 Star
4 Star
3 Star
2 Star

(Last Updated 12/19/2018) Page 32
Measure: C33 - Reviewing Appeals Decisions
Title Description
Description: This rating shows how often an independent reviewer thought the health plan’s decision to deny an appeal was fair. This includes appeals made by plan members and out-of-network providers. (This rating is not based on how often the plan denies appeals, but rather how fair the plan is when they deny an appeal.)
Data Source: Independent Review Entity (IRE) / Maximus
General Trend: Higher is better
Cut Points: Year 1 Star 2 Stars 3 Stars 4 Stars 5 Stars
2016 < 73% ≥ 73% to < 85% ≥ 85% to < 89% ≥ 89% to < 94% ≥ 94%
2017 < 71% ≥ 71% to < 77% ≥ 77% to < 88% ≥ 88% to < 93% ≥ 93%
2018 < 62% ≥ 62% to < 76% ≥ 76% to < 86% ≥ 86% to < 93% ≥ 93%
2019 < 59% ≥ 59% to < 78% ≥ 78% to < 88% ≥ 88% to < 97% ≥ 97%
94 93 93
97
89 8886
88
85
77 7678
7371
62
59
50
55
60
65
70
75
80
85
90
95
100
2016 2017 2018 2019
Pe
rce
nta
ge
Reviewing Appeals Decisions
5 Star
4 Star
3 Star
2 Star
(Last Updated 12/19/2018) Page 33
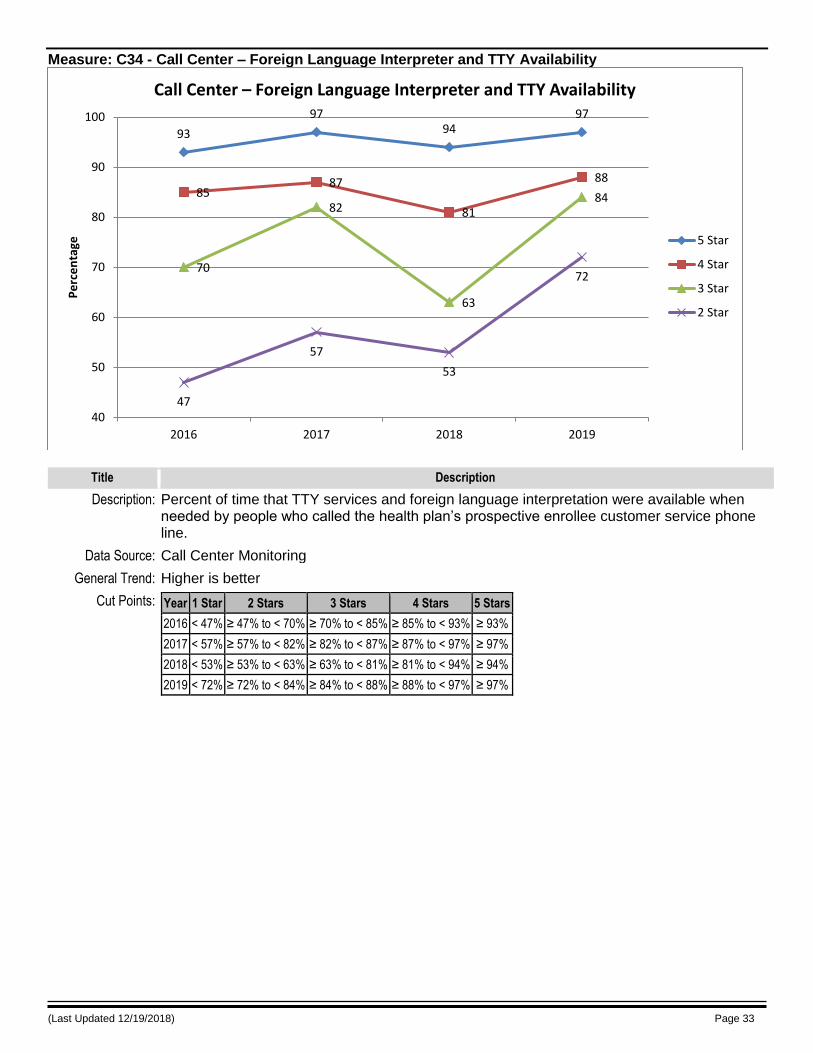
Measure: C34 - Call Center – Foreign Language Interpreter and TTY Availability
Title Description
Description: Percent of time that TTY services and foreign language interpretation were available when needed by people who called the health plan’s prospective enrollee customer service phone line.
Data Source: Call Center Monitoring
General Trend: Higher is better
Cut Points: Year 1 Star 2 Stars 3 Stars 4 Stars 5 Stars
2016 < 47% ≥ 47% to < 70% ≥ 70% to < 85% ≥ 85% to < 93% ≥ 93%
2017 < 57% ≥ 57% to < 82% ≥ 82% to < 87% ≥ 87% to < 97% ≥ 97%
2018 < 53% ≥ 53% to < 63% ≥ 63% to < 81% ≥ 81% to < 94% ≥ 94%
2019 < 72% ≥ 72% to < 84% ≥ 84% to < 88% ≥ 88% to < 97% ≥ 97%
93
9794
97
8587
81
88
70
82
63
84
47
57
53
72
40
50
60
70
80
90
100
2016 2017 2018 2019
Pe
rce
nta
ge
Call Center – Foreign Language Interpreter and TTY Availability
5 Star
4 Star
3 Star
2 Star
(Last Updated 12/19/2018) Page 34
Part D Measures
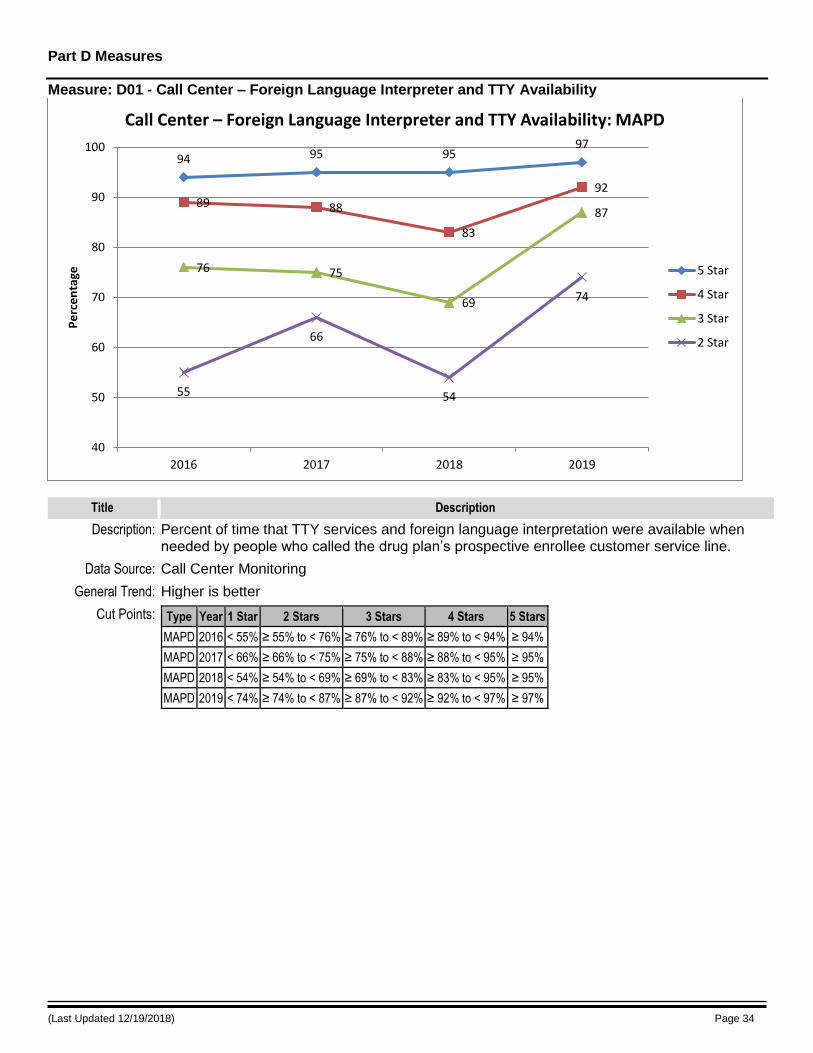
Measure: D01 - Call Center – Foreign Language Interpreter and TTY Availability
Title Description
Description: Percent of time that TTY services and foreign language interpretation were available when needed by people who called the drug plan’s prospective enrollee customer service line.
Data Source: Call Center Monitoring
General Trend: Higher is better
Cut Points: Type Year 1 Star 2 Stars 3 Stars 4 Stars 5 Stars
MAPD 2016 < 55% ≥ 55% to < 76% ≥ 76% to < 89% ≥ 89% to < 94% ≥ 94%
MAPD 2017 < 66% ≥ 66% to < 75% ≥ 75% to < 88% ≥ 88% to < 95% ≥ 95%
MAPD 2018 < 54% ≥ 54% to < 69% ≥ 69% to < 83% ≥ 83% to < 95% ≥ 95%
MAPD 2019 < 74% ≥ 74% to < 87% ≥ 87% to < 92% ≥ 92% to < 97% ≥ 97%
94 95 9597
89 88
83
92
76 75
69
87
55
66
54
74
40
50
60
70
80
90
100
2016 2017 2018 2019
Pe
rce
nta
ge
Call Center – Foreign Language Interpreter and TTY Availability: MAPD
5 Star
4 Star
3 Star
2 Star

(Last Updated 12/19/2018) Page 35
Title Description
Description: Percent of time that TTY services and foreign language interpretation were available when needed by people who called the drug plan’s prospective enrollee customer service line.
Data Source: Call Center Monitoring
General Trend: Higher is better
Cut Points: Type Year 1 Star 2 Stars 3 Stars 4 Stars 5 Stars
PDP 2016 < 72% ≥ 72% to < 82% ≥ 82% to < 90% ≥ 90% to < 95% ≥ 95%
PDP 2017 < 82% ≥ 82% to < 89% ≥ 89% to < 95% ≥ 95% to < 98% ≥ 98%
PDP 2018 < 77% ≥ 77% to < 87% ≥ 87% to < 93% ≥ 93% to < 99% ≥ 99%
PDP 2019 < 63% ≥ 63% to < 73% ≥ 73% to < 88% ≥ 88% to < 97% ≥ 97%
9598 99
97
90
9593
88
82
8987
73
72
82
77
63
40
50
60
70
80
90
100
2016 2017 2018 2019
Pe
rce
nta
geCall Center – Foreign Language Interpreter and TTY Availability: PDP
5 Star
4 Star
3 Star
2 Star
(Last Updated 12/19/2018) Page 36
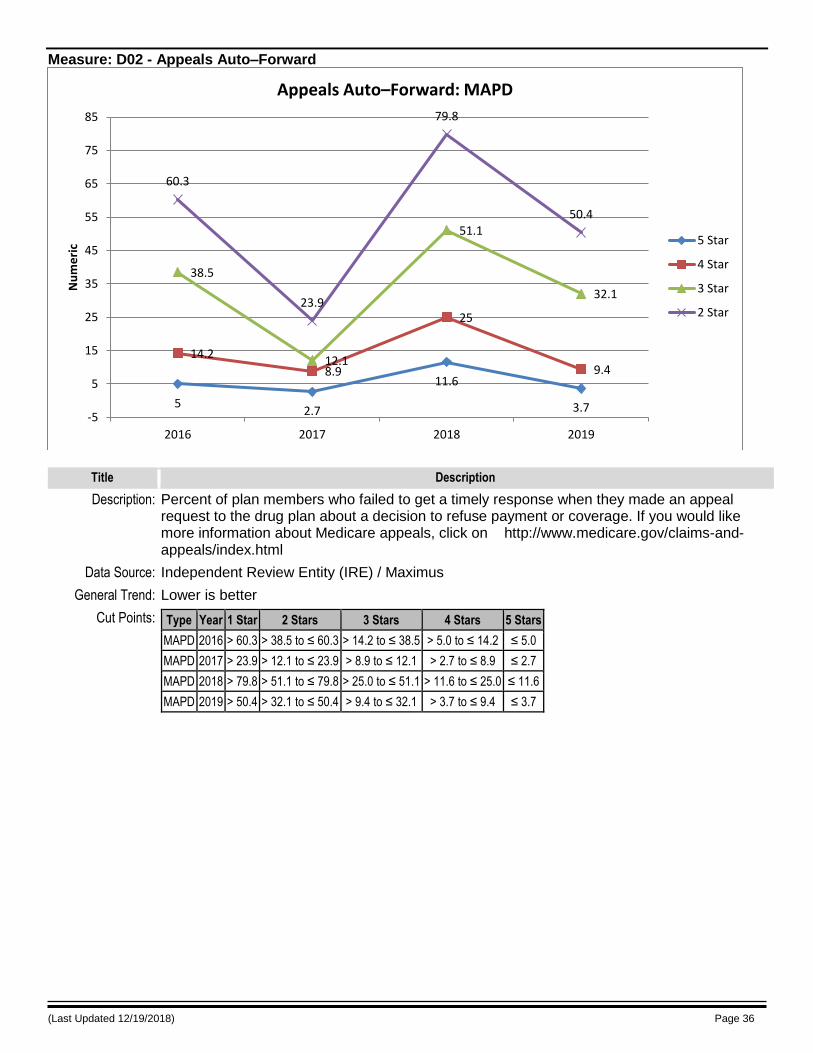
Measure: D02 - Appeals Auto–Forward
Title Description
Description: Percent of plan members who failed to get a timely response when they made an appeal request to the drug plan about a decision to refuse payment or coverage. If you would like more information about Medicare appeals, click on http://www.medicare.gov/claims-and-appeals/index.html
Data Source: Independent Review Entity (IRE) / Maximus
General Trend: Lower is better
Cut Points: Type Year 1 Star 2 Stars 3 Stars 4 Stars 5 Stars
MAPD 2016 > 60.3 > 38.5 to ≤ 60.3 > 14.2 to ≤ 38.5 > 5.0 to ≤ 14.2 ≤ 5.0
MAPD 2017 > 23.9 > 12.1 to ≤ 23.9 > 8.9 to ≤ 12.1 > 2.7 to ≤ 8.9 ≤ 2.7
MAPD 2018 > 79.8 > 51.1 to ≤ 79.8 > 25.0 to ≤ 51.1 > 11.6 to ≤ 25.0 ≤ 11.6
MAPD 2019 > 50.4 > 32.1 to ≤ 50.4 > 9.4 to ≤ 32.1 > 3.7 to ≤ 9.4 ≤ 3.7
52.7
11.6
3.7
14.2
8.9
25
9.4
38.5
12.1
51.1
32.1
60.3
23.9
79.8
50.4
-5
5
15
25
35
45
55
65
75
85
2016 2017 2018 2019
Nu
me
ric
Appeals Auto–Forward: MAPD
5 Star
4 Star
3 Star
2 Star

(Last Updated 12/19/2018) Page 37
Title Description
Description: Percent of plan members who failed to get a timely response when they made an appeal request to the drug plan about a decision to refuse payment or coverage. If you would like more information about Medicare appeals, click on http://www.medicare.gov/claims-and-appeals/index.html
Data Source: Independent Review Entity (IRE) / Maximus
General Trend: Lower is better
Cut Points: Type Year 1 Star 2 Stars 3 Stars 4 Stars 5 Stars
PDP 2016 > 66.8 > 38.6 to ≤ 66.8 > 18.0 to ≤ 38.6 > 5.3 to ≤ 18.0 ≤ 5.3
PDP 2017 NA NA > 8.6 > 4.3 to ≤ 8.6 ≤ 4.3
PDP 2018 > 24.2 > 10.2 to ≤ 24.2 > 6.2 to ≤ 10.2 > 3.3 to ≤ 6.2 ≤ 3.3
PDP 2019 > 30.7 > 10.8 to ≤ 30.7 > 5.2 to ≤ 10.8 > 1.8 to ≤ 5.2 ≤ 1.8
5.3 4.3 3.3 1.8
18
8.66.2 5.2
38.6
10.2 10.8
66.8
24.2
30.7
-5
5
15
25
35
45
55
65
75
2016 2017 2018 2019
Nu
me
ric
Appeals Auto–Forward: PDP
5 Star
4 Star
3 Star
2 Star

(Last Updated 12/19/2018) Page 38
Measure: D03 - Appeals Upheld
Title Description
Description: How often an independent reviewer thought the drug plan’s decision to deny an appeal was fair. This includes appeals made by plan members and out-of-network providers. (This rating is not based on how often the plan denies appeals, but rather how fair the plan is when they deny an appeal.)
Data Source: Independent Review Entity (IRE) / Maximus
General Trend: Higher is better
Cut Points: Type Year 1 Star 2 Stars 3 Stars 4 Stars 5 Stars
MAPD 2016 < 42% ≥ 42% to < 60% ≥ 60% to < 73% ≥ 73% to < 88% ≥ 88%
MAPD 2017 < 47% ≥ 47% to < 66% ≥ 66% to < 78% ≥ 78% to < 88% ≥ 88%
MAPD 2018 < 56% ≥ 56% to < 71% ≥ 71% to < 79% ≥ 79% to < 89% ≥ 89%
MAPD 2019 < 60% ≥ 60% to < 69% ≥ 69% to < 81% ≥ 81% to < 92% ≥ 92%
88 88 8992
73
78 7981
60
66
7169
42
47
5660
20
30
40
50
60
70
80
90
100
2016 2017 2018 2019
Pe
rce
nta
ge
Appeals Upheld: MAPD
5 Star
4 Star
3 Star
2 Star

(Last Updated 12/19/2018) Page 39
Title Description
Description: How often an independent reviewer thought the drug plan’s decision to deny an appeal was fair. This includes appeals made by plan members and out-of-network providers. (This rating is not based on how often the plan denies appeals, but rather how fair the plan is when they deny an appeal.)
Data Source: Independent Review Entity (IRE) / Maximus
General Trend: Higher is better
Cut Points: Type Year 1 Star 2 Stars 3 Stars 4 Stars 5 Stars
PDP 2016 < 54% ≥ 54% to < 65% ≥ 65% to < 76% ≥ 76% to < 91% ≥ 91%
PDP 2017 < 60% ≥ 60% to < 66% ≥ 66% to < 77% ≥ 77% to < 91% ≥ 91%
PDP 2018 < 61% ≥ 61% to < 71% ≥ 71% to < 81% ≥ 81% to < 92% ≥ 92%
PDP 2019 < 64% ≥ 64% to < 78% ≥ 78% to < 89% ≥ 89% to < 91% ≥ 91%
91 91 92 91
76 7781
89
65 66
71
78
54
60 6164
20
30
40
50
60
70
80
90
100
2016 2017 2018 2019
Pe
rce
nta
geAppeals Upheld: PDP
5 Star
4 Star
3 Star
2 Star
(Last Updated 12/19/2018) Page 40
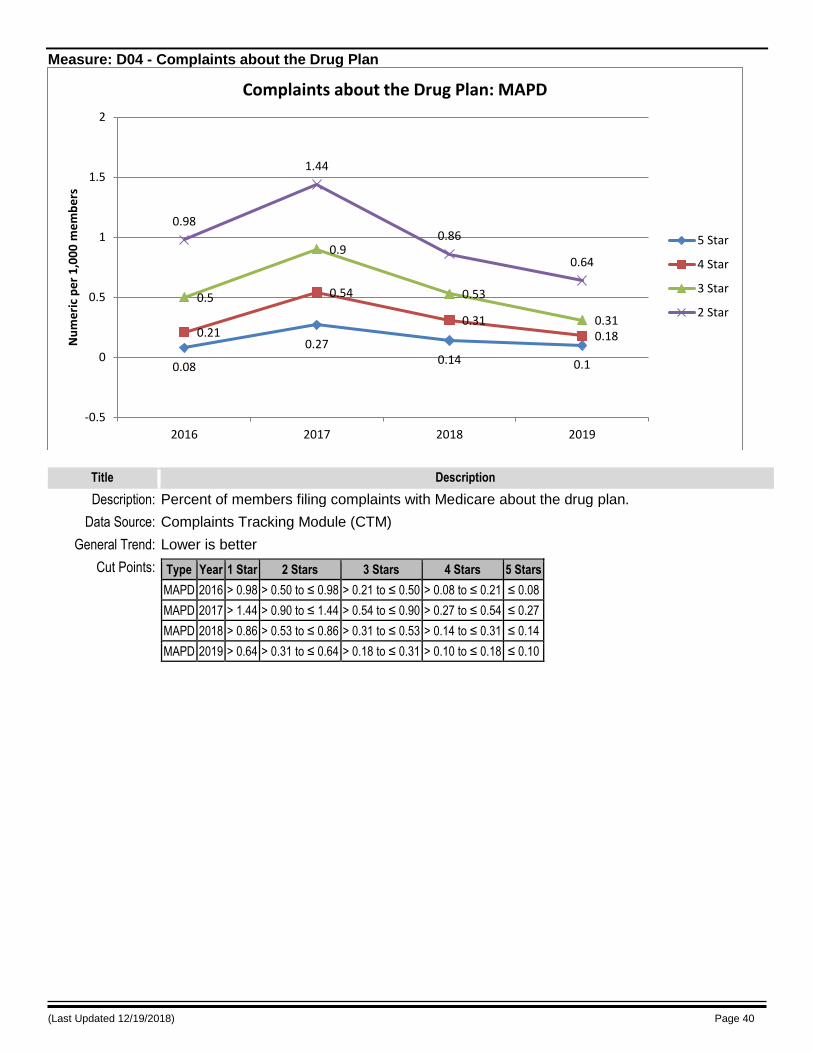
Measure: D04 - Complaints about the Drug Plan
Title Description
Description: Percent of members filing complaints with Medicare about the drug plan.
Data Source: Complaints Tracking Module (CTM)
General Trend: Lower is better
Cut Points: Type Year 1 Star 2 Stars 3 Stars 4 Stars 5 Stars
MAPD 2016 > 0.98 > 0.50 to ≤ 0.98 > 0.21 to ≤ 0.50 > 0.08 to ≤ 0.21 ≤ 0.08
MAPD 2017 > 1.44 > 0.90 to ≤ 1.44 > 0.54 to ≤ 0.90 > 0.27 to ≤ 0.54 ≤ 0.27
MAPD 2018 > 0.86 > 0.53 to ≤ 0.86 > 0.31 to ≤ 0.53 > 0.14 to ≤ 0.31 ≤ 0.14
MAPD 2019 > 0.64 > 0.31 to ≤ 0.64 > 0.18 to ≤ 0.31 > 0.10 to ≤ 0.18 ≤ 0.10
0.08
0.270.14 0.1
0.21
0.54
0.310.18
0.5
0.9
0.53
0.31
0.98
1.44
0.86
0.64
-0.5
0
0.5
1
1.5
2
2016 2017 2018 2019
Nu
me
ric
pe
r 1
,00
0 m
em
be
rs
Complaints about the Drug Plan: MAPD
5 Star
4 Star
3 Star
2 Star
(Last Updated 12/19/2018) Page 41
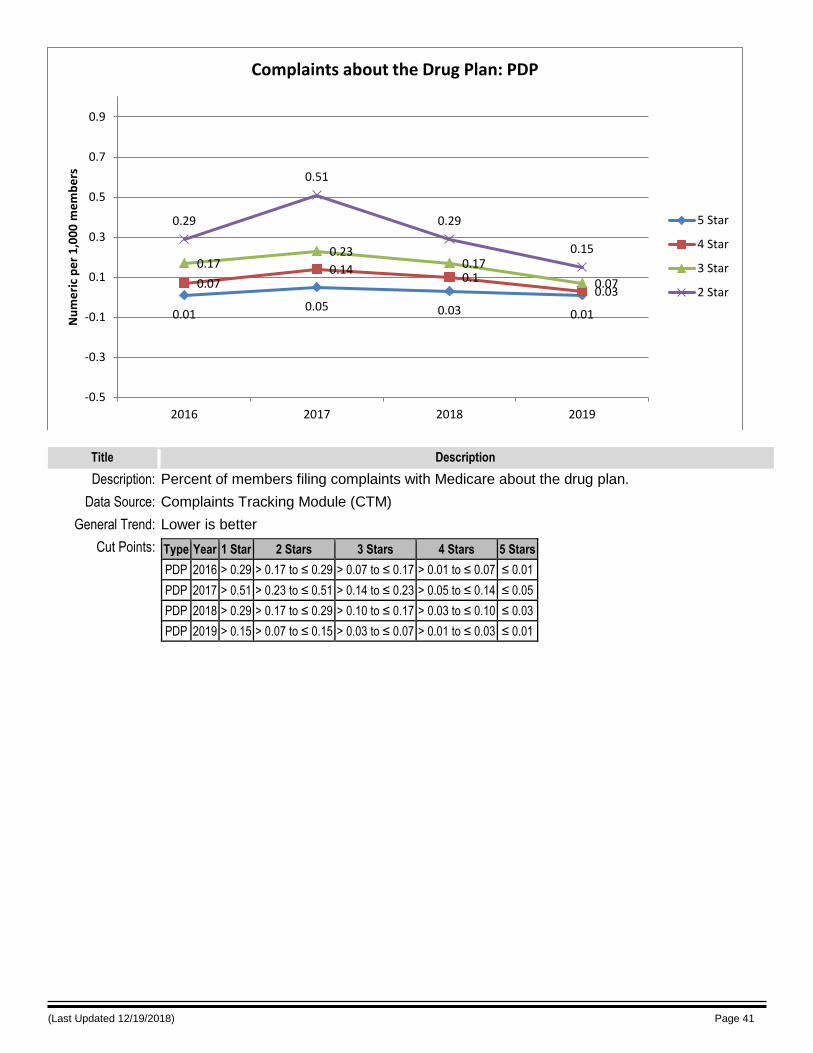
Title Description
Description: Percent of members filing complaints with Medicare about the drug plan.
Data Source: Complaints Tracking Module (CTM)
General Trend: Lower is better
Cut Points: Type Year 1 Star 2 Stars 3 Stars 4 Stars 5 Stars
PDP 2016 > 0.29 > 0.17 to ≤ 0.29 > 0.07 to ≤ 0.17 > 0.01 to ≤ 0.07 ≤ 0.01
PDP 2017 > 0.51 > 0.23 to ≤ 0.51 > 0.14 to ≤ 0.23 > 0.05 to ≤ 0.14 ≤ 0.05
PDP 2018 > 0.29 > 0.17 to ≤ 0.29 > 0.10 to ≤ 0.17 > 0.03 to ≤ 0.10 ≤ 0.03
PDP 2019 > 0.15 > 0.07 to ≤ 0.15 > 0.03 to ≤ 0.07 > 0.01 to ≤ 0.03 ≤ 0.01
0.010.05 0.03 0.01
0.070.14
0.10.03
0.170.23
0.17
0.07
0.29
0.51
0.29
0.15
-0.5
-0.3
-0.1
0.1
0.3
0.5
0.7
0.9
2016 2017 2018 2019
Nu
me
ric
pe
r 1
,00
0 m
em
be
rsComplaints about the Drug Plan: PDP
5 Star
4 Star
3 Star
2 Star
(Last Updated 12/19/2018) Page 42
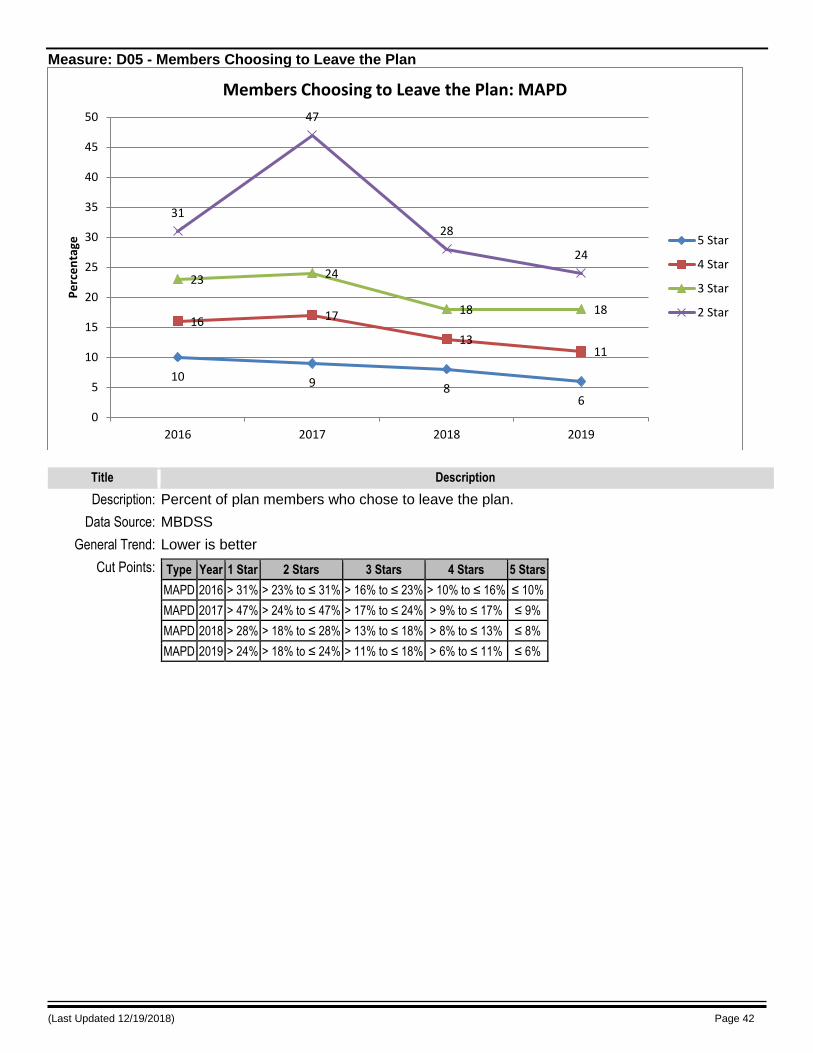
Measure: D05 - Members Choosing to Leave the Plan
Title Description
Description: Percent of plan members who chose to leave the plan.
Data Source: MBDSS
General Trend: Lower is better
Cut Points: Type Year 1 Star 2 Stars 3 Stars 4 Stars 5 Stars
MAPD 2016 > 31% > 23% to ≤ 31% > 16% to ≤ 23% > 10% to ≤ 16% ≤ 10%
MAPD 2017 > 47% > 24% to ≤ 47% > 17% to ≤ 24% > 9% to ≤ 17% ≤ 9%
MAPD 2018 > 28% > 18% to ≤ 28% > 13% to ≤ 18% > 8% to ≤ 13% ≤ 8%
MAPD 2019 > 24% > 18% to ≤ 24% > 11% to ≤ 18% > 6% to ≤ 11% ≤ 6%
10 9 86
16 17
1311
23 24
18 18
31
47
28
24
0
5
10
15
20
25
30
35
40
45
50
2016 2017 2018 2019
Pe
rce
nta
ge
Members Choosing to Leave the Plan: MAPD
5 Star
4 Star
3 Star
2 Star
(Last Updated 12/19/2018) Page 43
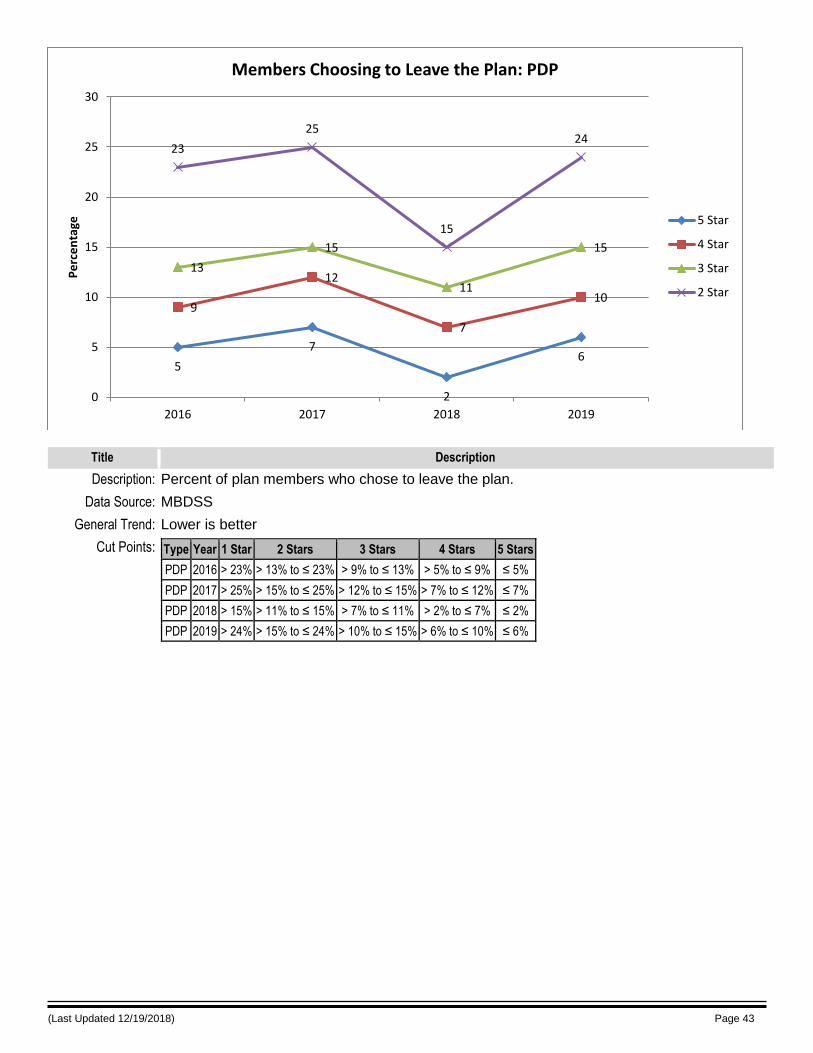
Title Description
Description: Percent of plan members who chose to leave the plan.
Data Source: MBDSS
General Trend: Lower is better
Cut Points: Type Year 1 Star 2 Stars 3 Stars 4 Stars 5 Stars
PDP 2016 > 23% > 13% to ≤ 23% > 9% to ≤ 13% > 5% to ≤ 9% ≤ 5%
PDP 2017 > 25% > 15% to ≤ 25% > 12% to ≤ 15% > 7% to ≤ 12% ≤ 7%
PDP 2018 > 15% > 11% to ≤ 15% > 7% to ≤ 11% > 2% to ≤ 7% ≤ 2%
PDP 2019 > 24% > 15% to ≤ 24% > 10% to ≤ 15% > 6% to ≤ 10% ≤ 6%
5
7
2
6
9
12
7
10
13
15
11
15
23
25
15
24
0
5
10
15
20
25
30
2016 2017 2018 2019
Pe
rce
nta
geMembers Choosing to Leave the Plan: PDP
5 Star
4 Star
3 Star
2 Star

(Last Updated 12/19/2018) Page 44
Measure: D07 - Rating of Drug Plan
Title Description
Description: Percent of the best possible score the plan earned from members who rated the prescription drug plan.
Data Source: CAHPS
General Trend: Higher is better
Cut Points: Type Year Base Group 1 Base Group 2 Base Group 3 Base Group 4 Base Group 5
MAPD 2016 < 80% ≥ 80% to < 82% ≥ 82% to < 84% ≥ 84% to < 86% ≥ 86%
MAPD 2017 < 80 ≥ 80 to < 82 ≥ 82 to < 84 ≥ 84 to < 86 ≥ 86
MAPD 2018 < 81 ≥ 81 to < 83 ≥ 83 to < 85 ≥ 85 to < 86 ≥ 86
MAPD 2019 < 82 ≥ 82 to < 83 ≥ 83 to < 85 ≥ 85 to < 87 ≥ 87
86 86 8687
84 8485 85
82 8283 83
80 8081
82
70
75
80
85
90
95
100
2016 2017 2018 2019
Nu
me
ric
Rating of Drug Plan: MAPD
5 Star
4 Star
3 Star
2 Star
(Last Updated 12/19/2018) Page 45
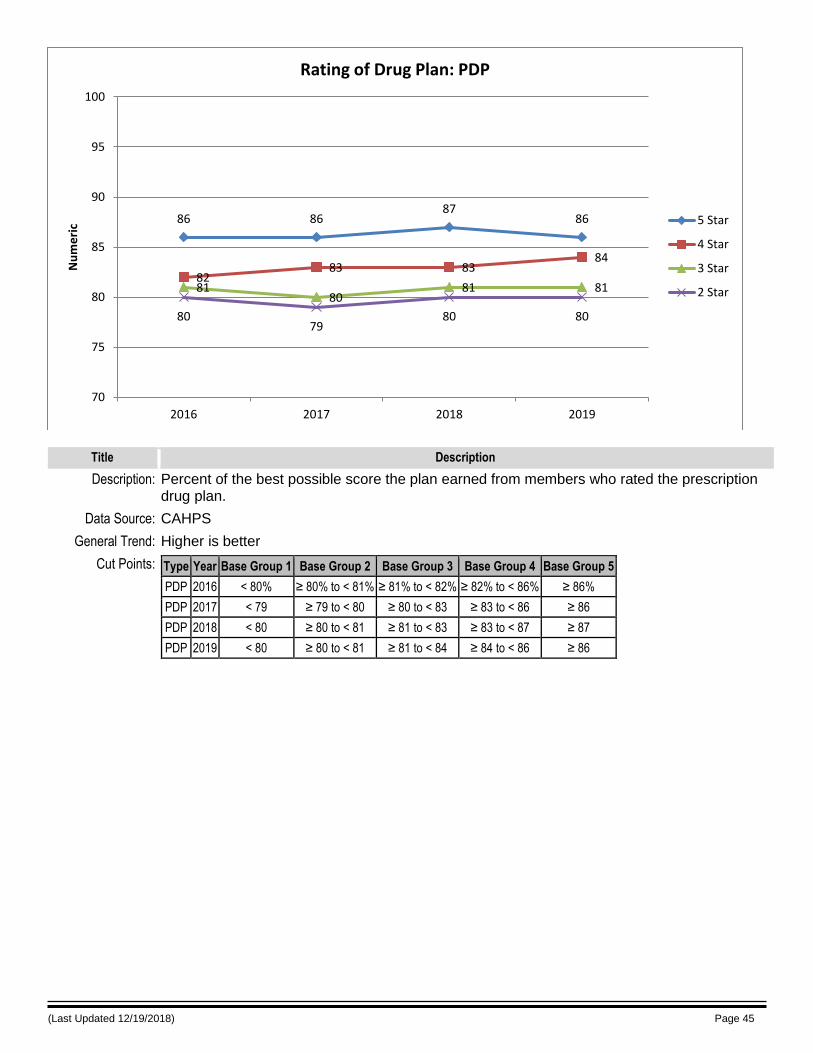
Title Description
Description: Percent of the best possible score the plan earned from members who rated the prescription drug plan.
Data Source: CAHPS
General Trend: Higher is better
Cut Points: Type Year Base Group 1 Base Group 2 Base Group 3 Base Group 4 Base Group 5
PDP 2016 < 80% ≥ 80% to < 81% ≥ 81% to < 82% ≥ 82% to < 86% ≥ 86%
PDP 2017 < 79 ≥ 79 to < 80 ≥ 80 to < 83 ≥ 83 to < 86 ≥ 86
PDP 2018 < 80 ≥ 80 to < 81 ≥ 81 to < 83 ≥ 83 to < 87 ≥ 87
PDP 2019 < 80 ≥ 80 to < 81 ≥ 81 to < 84 ≥ 84 to < 86 ≥ 86
86 8687
86
8283 83
84
8180
81 81
8079
80 80
70
75
80
85
90
95
100
2016 2017 2018 2019
Nu
me
ric
Rating of Drug Plan: PDP
5 Star
4 Star
3 Star
2 Star

(Last Updated 12/19/2018) Page 46
Measure: D08 - Getting Needed Prescription Drugs
Title Description
Description: Percent of the best possible score the plan earned on how easy it is for members to get the prescription drugs they need using the plan.
Data Source: CAHPS
General Trend: Higher is better
Cut Points: Type Year Base Group 1 Base Group 2 Base Group 3 Base Group 4 Base Group 5
MAPD 2016 < 87% ≥ 87% to < 89% ≥ 89% to < 91% ≥ 91% to < 92% ≥ 92%
MAPD 2017 < 88 ≥ 88 to < 89 ≥ 89 to < 91 ≥ 91 to < 92 ≥ 92
MAPD 2018 < 88 ≥ 88 to < 89 ≥ 89 to < 90 ≥ 90 to < 91 ≥ 91
MAPD 2019 < 88 ≥ 88 to < 89 ≥ 89 to < 90 ≥ 90 to < 92 ≥ 92
92 9291
92
91 9190
91
89 89 89 89
8788 88 88
80
82
84
86
88
90
92
94
96
98
100
2016 2017 2018 2019
Nu
me
ric
Getting Needed Prescription Drugs: MAPD
5 Star
4 Star
3 Star
2 Star

(Last Updated 12/19/2018) Page 47
Title Description
Description: Percent of the best possible score the plan earned on how easy it is for members to get the prescription drugs they need using the plan.
Data Source: CAHPS
General Trend: Higher is better
Cut Points: Type Year Base Group 1 Base Group 2 Base Group 3 Base Group 4 Base Group 5
PDP 2016 < 87% ≥ 87% to < 88% ≥ 88% to < 90% ≥ 90% to < 91% ≥ 91%
PDP 2017 < 87 ≥ 87 to < 89 ≥ 89 to ≤ 91 * ≥ 91
PDP 2018 < 87 ≥ 87 to < 89 ≥ 89 to < 90 ≥ 90 to < 92 ≥ 92
PDP 2019 < 88 ≥ 88 to < 89 ≥ 89 to < 91 ≥ 91 to < 92 ≥ 92
*Due to rounding, no contracts were assigned to this base group this year. However, after application of the further criteria of significance and reliability, some contracts may have received this star assignment in this year.
91 9192 92
90 9091
8889 89 89
87 87 8788
80
82
84
86
88
90
92
94
96
98
100
2016 2017 2018 2019
Nu
me
ric
Getting Needed Prescription Drugs: PDP
5 Star
4 Star
3 Star
2 Star

(Last Updated 12/19/2018) Page 48
Measure: D10 - Medication Adherence for Diabetes Medications
Title Description
Description: Percent of plan members with a prescription for diabetes medication who fill their prescription often enough to cover 80% or more of the time they are supposed to be taking the medication. One of the most important ways people with diabetes can manage their health is by taking their medication as directed. The plan, the doctor, and the member can work together to find ways to do this. (“Diabetes medication” means a biguanide drug, a sulfonylurea drug, a thiazolidinedione drug, a DPP-IV inhibitor, an incretin mimetic drug, a meglitinide drug, or an SGLT2 inhibitor. Plan members who take insulin are not included.)
Data Source: Prescription Drug Event (PDE) Data
General Trend: Higher is better
Cut Points: Type Year 1 Star 2 Stars 3 Stars 4 Stars 5 Stars
MAPD 2016 < 60% ≥ 60% to < 69% ≥ 69% to < 75% ≥ 75% to < 82% ≥ 82%
MAPD 2017 < 70% ≥ 70% to < 76% ≥ 76% to < 79% ≥ 79% to < 83% ≥ 83%
MAPD 2018 < 72% ≥ 72% to < 78% ≥ 78% to < 81% ≥ 81% to < 86% ≥ 86%
MAPD 2019 < 72% ≥ 72% to < 78% ≥ 78% to < 81% ≥ 81% to < 85% ≥ 85%
8283
8685
75
79
81 81
69
76
78 78
60
70
72 72
55
60
65
70
75
80
85
90
2016 2017 2018 2019
Pe
rce
nta
ge
Medication Adherence for Diabetes Medications: MAPD
5 Star
4 Star
3 Star
2 Star
(Last Updated 12/19/2018) Page 49
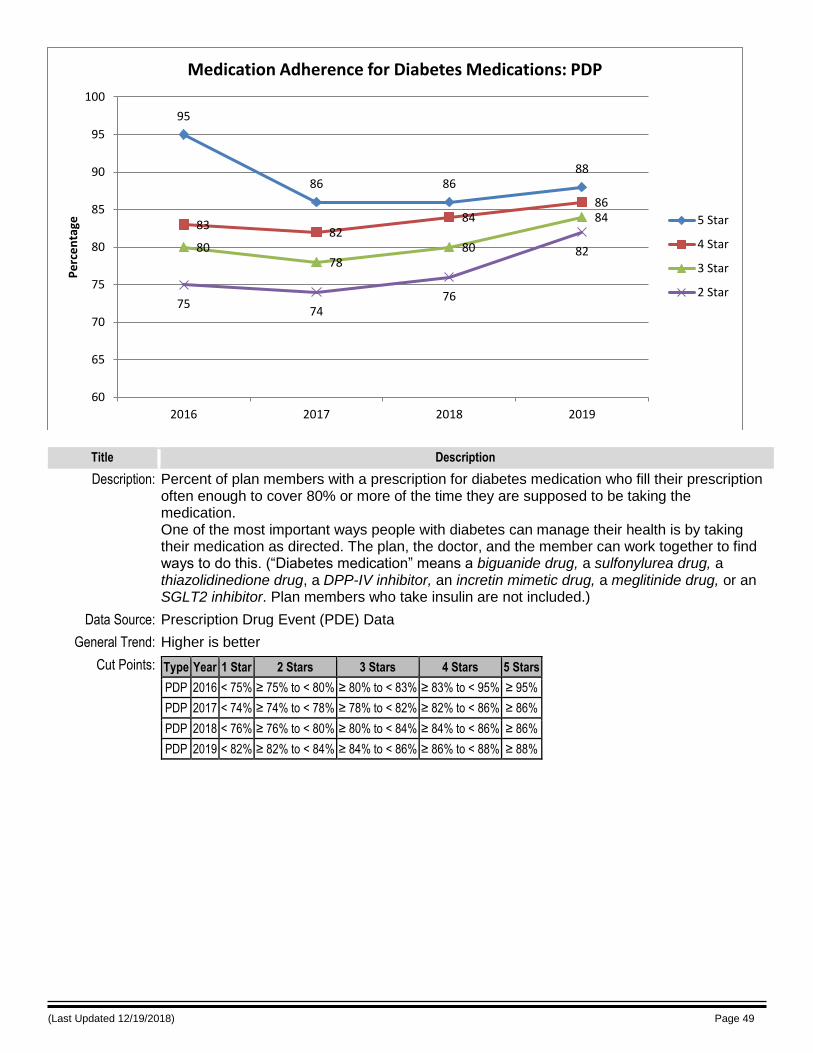
Title Description
Description: Percent of plan members with a prescription for diabetes medication who fill their prescription often enough to cover 80% or more of the time they are supposed to be taking the medication. One of the most important ways people with diabetes can manage their health is by taking their medication as directed. The plan, the doctor, and the member can work together to find ways to do this. (“Diabetes medication” means a biguanide drug, a sulfonylurea drug, a thiazolidinedione drug, a DPP-IV inhibitor, an incretin mimetic drug, a meglitinide drug, or an SGLT2 inhibitor. Plan members who take insulin are not included.)
Data Source: Prescription Drug Event (PDE) Data
General Trend: Higher is better
Cut Points: Type Year 1 Star 2 Stars 3 Stars 4 Stars 5 Stars
PDP 2016 < 75% ≥ 75% to < 80% ≥ 80% to < 83% ≥ 83% to < 95% ≥ 95%
PDP 2017 < 74% ≥ 74% to < 78% ≥ 78% to < 82% ≥ 82% to < 86% ≥ 86%
PDP 2018 < 76% ≥ 76% to < 80% ≥ 80% to < 84% ≥ 84% to < 86% ≥ 86%
PDP 2019 < 82% ≥ 82% to < 84% ≥ 84% to < 86% ≥ 86% to < 88% ≥ 88%
95
86 8688
8382
8486
8078
80
84
7574
76
82
60
65
70
75
80
85
90
95
100
2016 2017 2018 2019
Pe
rce
nta
geMedication Adherence for Diabetes Medications: PDP
5 Star
4 Star
3 Star
2 Star
(Last Updated 12/19/2018) Page 50
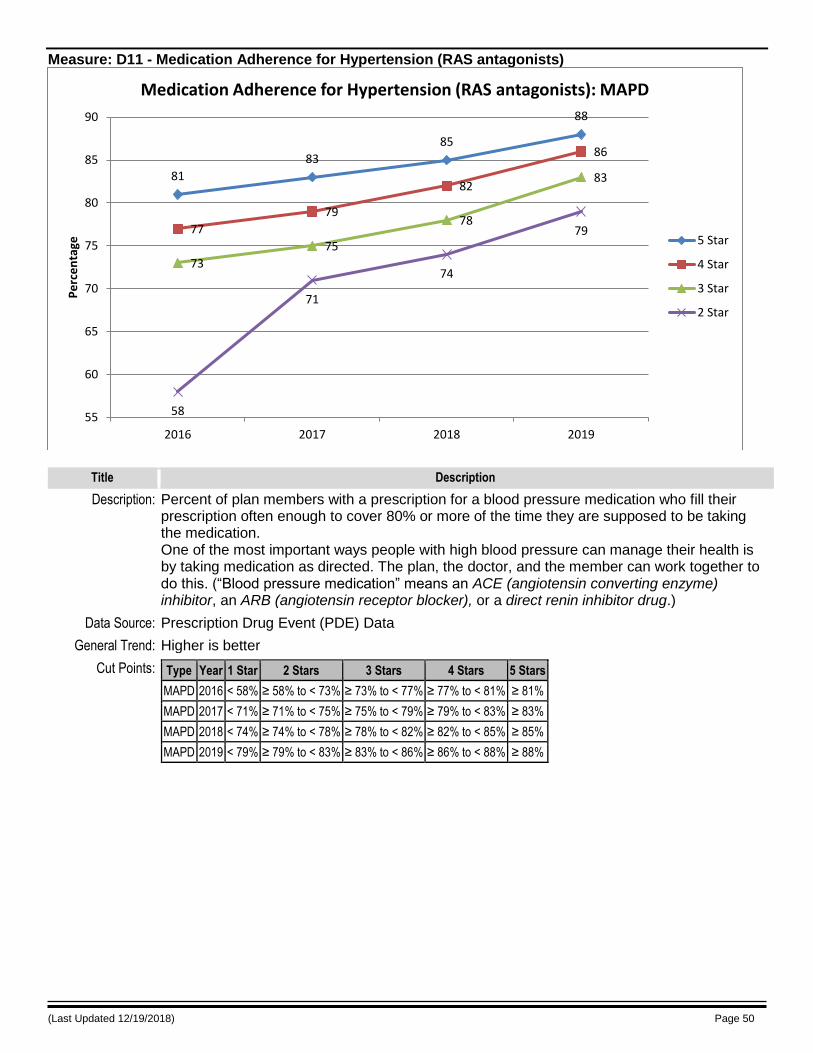
Measure: D11 - Medication Adherence for Hypertension (RAS antagonists)
Title Description
Description: Percent of plan members with a prescription for a blood pressure medication who fill their prescription often enough to cover 80% or more of the time they are supposed to be taking the medication. One of the most important ways people with high blood pressure can manage their health is by taking medication as directed. The plan, the doctor, and the member can work together to do this. (“Blood pressure medication” means an ACE (angiotensin converting enzyme) inhibitor, an ARB (angiotensin receptor blocker), or a direct renin inhibitor drug.)
Data Source: Prescription Drug Event (PDE) Data
General Trend: Higher is better
Cut Points: Type Year 1 Star 2 Stars 3 Stars 4 Stars 5 Stars
MAPD 2016 < 58% ≥ 58% to < 73% ≥ 73% to < 77% ≥ 77% to < 81% ≥ 81%
MAPD 2017 < 71% ≥ 71% to < 75% ≥ 75% to < 79% ≥ 79% to < 83% ≥ 83%
MAPD 2018 < 74% ≥ 74% to < 78% ≥ 78% to < 82% ≥ 82% to < 85% ≥ 85%
MAPD 2019 < 79% ≥ 79% to < 83% ≥ 83% to < 86% ≥ 86% to < 88% ≥ 88%
81
83
85
88
77
79
82
86
73
75
78
83
58
71
74
79
55
60
65
70
75
80
85
90
2016 2017 2018 2019
Pe
rce
nta
ge
Medication Adherence for Hypertension (RAS antagonists): MAPD
5 Star
4 Star
3 Star
2 Star

(Last Updated 12/19/2018) Page 51
Title Description
Description: Percent of plan members with a prescription for a blood pressure medication who fill their prescription often enough to cover 80% or more of the time they are supposed to be taking the medication. One of the most important ways people with high blood pressure can manage their health is by taking medication as directed. The plan, the doctor, and the member can work together to do this. (“Blood pressure medication” means an ACE (angiotensin converting enzyme) inhibitor, an ARB (angiotensin receptor blocker), or a direct renin inhibitor drug.)
Data Source: Prescription Drug Event (PDE) Data
General Trend: Higher is better
Cut Points: Type Year 1 Star 2 Stars 3 Stars 4 Stars 5 Stars
PDP 2016 < 76% ≥ 76% to < 78% ≥ 78% to < 82% ≥ 82% to < 85% ≥ 85%
PDP 2017 < 77% ≥ 77% to < 80% ≥ 80% to < 83% ≥ 83% to < 85% ≥ 85%
PDP 2018 < 78% ≥ 78% to < 83% ≥ 83% to < 86% ≥ 86% to < 89% ≥ 89%
PDP 2019 < 84% ≥ 84% to < 86% ≥ 86% to < 87% ≥ 87% to < 89% ≥ 89%
85 85
89 89
8283
8687
78
80
83
86
7677
78
84
60
65
70
75
80
85
90
2016 2017 2018 2019
Pe
rce
nta
geMedication Adherence for Hypertension (RAS antagonists): PDP
5 Star
4 Star
3 Star
2 Star

(Last Updated 12/19/2018) Page 52
Measure: D12 - Medication Adherence for Cholesterol (Statins)
Title Description
Description: Percent of plan members with a prescription for a cholesterol medication (a statin drug) who fill their prescription often enough to cover 80% or more of the time they are supposed to be taking the medication. One of the most important ways people with high cholesterol can manage their health is by taking medication as directed. The plan, the doctor, and the member can work together to do this.
Data Source: Prescription Drug Event (PDE) Data
General Trend: Higher is better
Cut Points: Type Year 1 Star 2 Stars 3 Stars 4 Stars 5 Stars
MAPD 2016 < 50% ≥ 50% to < 61% ≥ 61% to < 73% ≥ 73% to < 79% ≥ 79%
MAPD 2017 < 66% ≥ 66% to < 73% ≥ 73% to < 77% ≥ 77% to < 82% ≥ 82%
MAPD 2018 < 66% ≥ 66% to < 76% ≥ 76% to < 80% ≥ 80% to < 85% ≥ 85%
MAPD 2019 < 73% ≥ 73% to < 77% ≥ 77% to < 83% ≥ 83% to < 87% ≥ 87%
79
82
8587
73
77
80
83
61
73
7677
50
66 66
73
45
50
55
60
65
70
75
80
85
90
2016 2017 2018 2019
Pe
rce
nta
ge
Medication Adherence for Cholesterol (Statins): MAPD
5 Star
4 Star
3 Star
2 Star

(Last Updated 12/19/2018) Page 53
Title Description
Description: Percent of plan members with a prescription for a cholesterol medication (a statin drug) who fill their prescription often enough to cover 80% or more of the time they are supposed to be taking the medication. One of the most important ways people with high cholesterol can manage their health is by taking medication as directed. The plan, the doctor, and the member can work together to do this.
Data Source: Prescription Drug Event (PDE) Data
General Trend: Higher is better
Cut Points: Type Year 1 Star 2 Stars 3 Stars 4 Stars 5 Stars
PDP 2016 < 68% ≥ 68% to < 73% ≥ 73% to < 78% ≥ 78% to < 83% ≥ 83%
PDP 2017 < 70% ≥ 70% to < 74% ≥ 74% to < 80% ≥ 80% to < 84% ≥ 84%
PDP 2018 < 73% ≥ 73% to < 79% ≥ 79% to < 82% ≥ 82% to < 86% ≥ 86%
PDP 2019 < 80% ≥ 80% to < 82% ≥ 82% to < 84% ≥ 84% to < 88% ≥ 88%
8384
8688
7880
8284
7374
79
82
6870
73
80
50
55
60
65
70
75
80
85
90
2016 2017 2018 2019
Pe
rce
nta
geMedication Adherence for Cholesterol (Statins): PDP
5 Star
4 Star
3 Star
2 Star
(Last Updated 12/19/2018) Page 54
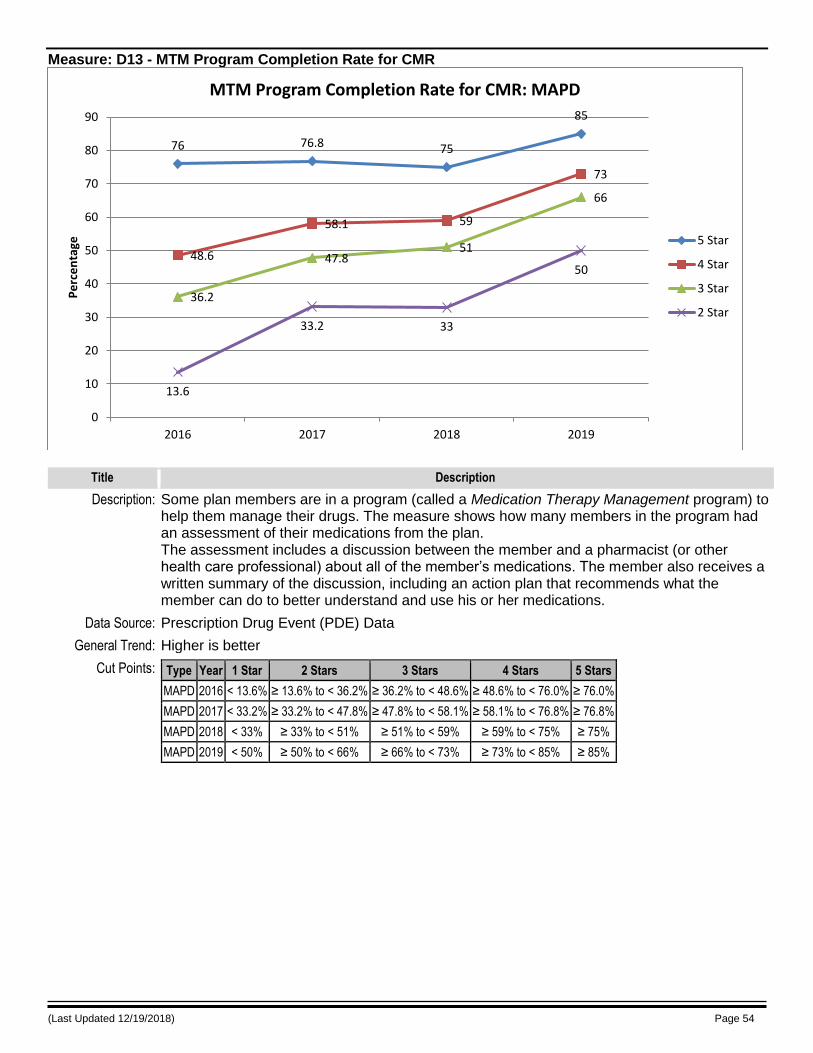
Measure: D13 - MTM Program Completion Rate for CMR
Title Description
Description: Some plan members are in a program (called a Medication Therapy Management program) to help them manage their drugs. The measure shows how many members in the program had an assessment of their medications from the plan. The assessment includes a discussion between the member and a pharmacist (or other health care professional) about all of the member’s medications. The member also receives a written summary of the discussion, including an action plan that recommends what the member can do to better understand and use his or her medications.
Data Source: Prescription Drug Event (PDE) Data
General Trend: Higher is better
Cut Points: Type Year 1 Star 2 Stars 3 Stars 4 Stars 5 Stars
MAPD 2016 < 13.6% ≥ 13.6% to < 36.2% ≥ 36.2% to < 48.6% ≥ 48.6% to < 76.0% ≥ 76.0%
MAPD 2017 < 33.2% ≥ 33.2% to < 47.8% ≥ 47.8% to < 58.1% ≥ 58.1% to < 76.8% ≥ 76.8%
MAPD 2018 < 33% ≥ 33% to < 51% ≥ 51% to < 59% ≥ 59% to < 75% ≥ 75%
MAPD 2019 < 50% ≥ 50% to < 66% ≥ 66% to < 73% ≥ 73% to < 85% ≥ 85%
76 76.8 75
85
48.6
58.1 59
73
36.2
47.851
66
13.6
33.2 33
50
0
10
20
30
40
50
60
70
80
90
2016 2017 2018 2019
Pe
rce
nta
ge
MTM Program Completion Rate for CMR: MAPD
5 Star
4 Star
3 Star
2 Star

(Last Updated 12/19/2018) Page 55
Title Description
Description: Some plan members are in a program (called a Medication Therapy Management program) to help them manage their drugs. The measure shows how many members in the program had an assessment of their medications from the plan. The assessment includes a discussion between the member and a pharmacist (or other health care professional) about all of the member’s medications. The member also receives a written summary of the discussion, including an action plan that recommends what the member can do to better understand and use his or her medications.
Data Source: Prescription Drug Event (PDE) Data
General Trend: Higher is better
Cut Points: Type Year 1 Star 2 Stars 3 Stars 4 Stars 5 Stars
PDP 2016 < 8.5% ≥ 8.5% to < 16.6% ≥ 16.6% to < 27.2% ≥ 27.2% to < 36.7% ≥ 36.7%
PDP 2017 < 12.6% ≥ 12.6% to < 20.3% ≥ 20.3% to < 33.9% ≥ 33.9% to < 51.6% ≥ 51.6%
PDP 2018 < 17% ≥ 17% to < 31% ≥ 31% to < 39% ≥ 39% to < 53% ≥ 53%
PDP 2019 < 21% ≥ 21% to < 39% ≥ 39% to < 56% ≥ 56% to < 72% ≥ 72%
36.7
51.6 53
72
27.2
33.9
39
56
16.620.3
31
39
8.512.6
1721
0
10
20
30
40
50
60
70
80
90
2016 2017 2018 2019
Pe
rce
nta
geMTM Program Completion Rate for CMR: PDP
5 Star
4 Star
3 Star
2 Star