medical training review panel - department of · web viewthe medical training review panel...
TRANSCRIPT

Medical Training Review PanelEighteenth Report
May 2015
MTRP 18th Report ii
Medical Training Review Panel 18th Report
ISBN: 978-1-76007-162-2
Online ISBN: 978-1-76007-163-9
Publications approval number: 11027
Copyright Statements:
Paper-based publications
© Commonwealth of Australia 2015
This work is copyright. You may reproduce the whole or part of this work in unaltered form for your own personal use or, if you are part of an organisation, for internal use within your organisation, but only if you or your organisation do not use the reproduction for any commercial purpose and retain this copyright notice and all disclaimer notices as part of that reproduction. Apart from rights to use as permitted by the Copyright Act 1968 or allowed by this copyright notice, all other rights are reserved and you are not allowed to reproduce the whole or any part of this work in any way (electronic or otherwise) without first being given the specific written permission from the Commonwealth to do so. Requests and inquiries concerning reproduction and rights are to be sent to the Communication Branch, Department of Health, GPO Box 9848, Canberra ACT 2601, or via e-mail to [email protected].
Internet sites
© Commonwealth of Australia 2015
This work is copyright. You may download, display, print and reproduce the whole or part of this work in unaltered form for your own personal use or, if you are part of an organisation, for internal use within your organisation, but only if you or your organisation do not use the reproduction for any commercial purpose and retain this copyright notice and all disclaimer notices as part of that reproduction. Apart from rights to use as permitted by the Copyright Act 1968 or allowed by this copyright notice, all other rights are reserved and you are not allowed to reproduce the whole or any part of this work in any way (electronic or otherwise) without first being given the specific written permission from the Commonwealth to do so. Requests and inquiries concerning reproduction and rights are to be sent to the Communication Branch, Department of Health, GPO Box 9848, Canberra ACT 2601, or via e-mail to [email protected].

MTRP 18th Report iii
The Hon Sussan Ley MPMinister for HealthMinister for SportParliament HouseCanberra ACT 2600
Dear Minister
In accordance with the requirements of subsection 3GC(4) of the Health Insurance Act 1973, I am pleased to submit to you the eighteenth report of the Medical Training Review Panel (MTRP).
The report covers the three levels of medical training in Australia, providing data on all trainees in undergraduate, postgraduate and vocational training programs in 2014. It also provides information on graduates and college fellows for 2013. Details of overseas trained medical practitioners and their education levels, and their migration patterns to work in Australia have also been documented to provide a more complete picture of the supply of medical practitioners.
Data were provided by the Medical Deans Australia and New Zealand Inc., state and territory health departments through their postgraduate medical councils, specialist medical colleges, General Practice Education and Training Limited and the Australian Medical Council. Selected administrative data from the Australian Government Department of Health and the Australian Government Department of Immigration and Border Protection are also included in the report.
In 2014, there were 16,837 medical students studying in Australian universities. Overthree-quarters of all places were Commonwealth-supported.
Of the total medical students, 3,737 were in the first year of their medical studies and 3,185 or 85.2% of these were domestic students. Domestic students with a rural background comprised just over a quarter of all commencing domestic students.
Overall, international students occupied 2,453 or 14.6% of places. These students were studying onshore in Australia as private or sponsored students and were not Australian citizens, permanent residents or New Zealand citizens.
In 2013, a total of 3,441 students graduated from Australian medical schools. Of these, 2,944 or 85.6% were domestic students.
There were also 3,287 trainees commencing their postgraduate year 1 training in 2014. This was an increase of 169 (5.4%) from 2013.
The number of vocational medical trainees (19,158) in 2014 was over two and a half times the number reported in 2000.
Medical Training Review PanelGPO Box 9848, Canberra ACT 2601
Telephone: (02) 6289 9175 [email protected]

MTRP 18th Report iv
There were 2,954 new college fellows in 2013, of these over two-fifths were females.
In 2013, a total of 50,704 medical practitioners were fellows of medical colleges, overone-third of all fellows were females.
In 2013-14, there were 2,650 visas granted to medical practitioners across the two main subclasses – 457 and 442/402. Almost half of visas under the main classes were granted to applicants from the United Kingdom and Republic of Ireland.
The data within the report highlight the continued increase in medical education and training that has occurred during the last ten years.
The production of the MTRP annual report is managed with involvement of representatives from the key stakeholders in medical workforce training. These representatives bring different insights into the way medical education and training can deal with the challenges of increasing student and trainee numbers, and produce a workforce with the skills that match the future needs of the Australian community.
Yours sincerely
Penny ShakespeareChairMedical Training Review Panel
15 April 2015

MTRP 18th Report v
ContentsLIST OF TABLES ......................................................................................................................
LIST OF FIGURES ....................................................................................................................
ACRONYMS .............................................................................................................................
EXECUTIVE SUMMARY ..........................................................................................................
University Medical Training ...................................................................................................
Prevocational Medical Training .............................................................................................
Vocational Medical Training ..................................................................................................
Fellowship ..............................................................................................................................
Female Medical Training ...................................................................................................11
International Supply of Medical Practitioners
CHAPTER 1: INTRODUCTION ............................................................................................14
Medical Training Review Panel Structure and Responsibilities ........................................14
Report Structure ................................................................................................................15
University Medical Education .........................................................................................15
Prevocational Medical Training ......................................................................................15
Vocational Medical Training ...........................................................................................15
International Supply .......................................................................................................15
Special Purpose Training Programs ..............................................................................16
Appendices ....................................................................................................................16
Notes on the Data and its Preparation ..............................................................................16
Data Sources .................................................................................................................16
Data Quality Issues ........................................................................................................17
Reporting Periods ..........................................................................................................17
Examination of Trends ...................................................................................................18
Medical College Acronyms and Specialties ...................................................................18
CHAPTER 2: UNIVERSITY MEDICAL EDUCATION AND TRAINING.................................19
Medical Students ...............................................................................................................19
Current Data 20
Types of Student Places 23
Scholarships ..................................................................................................................26
Student Characteristics 27
Aboriginal and/or Torres Strait Islander Students ..........................................................32
Rural Exposure ..............................................................................................................32
Attrition Rates ................................................................................................................35

MTRP 18th Report vi
Trends
Medical Graduates
Current Data ..................................................................................................................42
Trends ............................................................................................................................42
Projected Numbers of Graduates ..................................................................................46
CHAPTER 3: PREVOCATIONAL MEDICAL TRAINING ......................................................50
Background .......................................................................................................................50
Postgraduate Year 1 51
Current Data 51
Internship in Rural Location 54
Trends ............................................................................................................................54
Postgraduate Year 2 ..........................................................................................................55
Current Data ..................................................................................................................55
Trends ............................................................................................................................56
CHAPTER 4: VOCATIONAL MEDICAL TRAINING ..............................................................58
Vocational Medical Training in Australia 58
General Practice Training 59
Changes to College Training in Australia 60
Accredited Training 60
Vocational Training Data 63
Basic Training 65
Trends in Basic Training 67
Advanced Training 71
Subspecialty Training
Trends in Advanced Training
General Practice
Medical College Examinations 92
Current Data 92
Trends 95
New College Fellows 98
Current Data 98
Trends 101
New Fellows by Subspecialty – Selected Colleges 104
College Fellows 107
Fellows by Subspecialty – Selected Colleges 111

MTRP 18th Report vii
CHAPTER 5: INTERNATIONAL SUPPLY
Australian Government Department of Immigration and Border Protection
Entry Processes
Temporary Work (Skilled) visa (subclass 457)
Medical Practitioner (Temporary) visa (subclass 422)
Occupational Trainee visa (subclass 442)
Training and Research visa (subclass 402)
Current Data
Requirements for Practicing Medicine in Australia
Common Assessment Requirements
Competent Authority Pathway
Standard Pathway
Assessment of Overseas Trained Specialists
Standard Specialist Assessment
Medicare Provider Number Restrictions
Restrictions of Practice
Current Distribution of Overseas Trained Doctors
CHAPTER 6: SPECIAL PURPOSE TRAINING PROGRAMS
Background
3GA Programs Providers
Section 3GA Programs
Approved Medical Deputising Services Program
Approved Private Emergency Department Program
Approved Placements for Sports Physicians Program
Sports Physician Trainees
Australian General Practice Training
Prevocational General Practice Placements Program
Queensland Country Relieving Doctors Program
Rural Locum Relief Program
Special Approved Placements Program
Temporary Resident Other Medical Practitioners Program
Remote Vocational Training Scheme
APPENDICES .....................................................................................................................144
Appendix A: MEDICAL TRAINING REVIEW PANEL ROLE AND MEMBERSHIP .........145
Appendix B: MEDICAL COLLEGE TRAINING REQUIREMENTS ........................................
Appendix C: GLOSSARY OF TERMS ..................................................................................

MTRP 18th Report viii
Appendix D: EXTENDED DATA TREND TABLES ..........................................................215
Appendix E: DATA SPECIFICATIONS ............................................................................255
Appendix F: TRAINING PROGRAM TERMINOLOGY.....................................................266

MTRP 18th Report ix
List of TablesTABLE DESCRIPTION PAGE
CHAPTER 1: INTRODUCTION
Table 1.1: Medical colleges: Acronyms, names and specialities ....................................18
CHAPTER 2: UNIVERSITY MEDICAL EDUCATION AND TRAINING
Table 2.1: Medical students in Australian universities, 2014 20
Table 2.2: Domestic medical students in Australian universities, 2014 ..........................21
Table 2.3: International medical students in Australian universities, 2014 .....................22
Table 2.4: International students studying in Australian offshore programs, 2014 .........23
Table 2.5: Medical students by type of student place and university, 2014 ....................24
Table 2.6: Commencing medical students by type of student place and university, 2014 ..............................................................................................25
Table 2.7: Medical students by type of student place: Number and proportion of places, 2010–2014 .....................................................................................26
Table 2.8: Commencing medical students source of scholarships, 2013 .......................27
Table 2.9: Commencing medical students by sex and age, 2013 ..................................27
Table 2.10: Commencing medical students discipline of highest tertiary qualification completed, 2013 ............................................................28
Table 2.11: Commencing medical students level of highest prior tertiary qualification by medical degree entry program, 2013 ........................28
Table 2.12: Preferred type of medical practice in final year of medical degree by gender, 2013 .............................................................................................29
Table 2.13: Preferred type of medical practice in postgraduate year 1 by gender, 2013 .............................................................................................30
Table 2.14: International commencing medical students holding temporary or ‘other’ entry permits by place of birth, 2013 ...............................................31
Table 2.15: Commencing medical students by Aboriginal and/or Torres Strait Islander status, 2008-2013 .......................................................32
Table 2.16: Aboriginal and/or Torres Strait Islander medical students studying in Australian universities, 2006-2014 .................................................................32
Table 2.17: Commencing domestic students with a rural background by state/territory, 2014 ...................................................................................34
Table 2.18: Commencing domestic medical students: Attrition rates, 2013 .....................35
Table 2.19: Commencing international medical students: Attrition rates, 2013 ................36
Table 2.20: Commencing medical students: Attrition rates, 2008-2013 ...........................37
Table 2.21: Continuing domestic medical students: Attrition rates, 2013 .........................38
Table 2.22: Continuing international medical students: Attrition rates, 2013 ....................39

MTRP 18th Report x
Table 2.23: Continuing medical students: Attrition rates, 2008-2013 ...............................40
Table 2.24: Commencing medical students: Domestic, international and proportion of females, 2010-2014 ..................................................................41
Table 2.25: Commencing medical student projections, 2015 ...........................................41
Table 2.26: Medical students: Domestic, international and proportion of females, 2010-2014 ......................................................................................................42
Table 2.27: Domestic medical school graduates in Australian universities, by state/territory, 2009-2013 ..........................................................................43
Table 2.28: International medical school graduates in Australian universities by state/territory, 2009-2013 ..........................................................................44
Table 2.29: Medical graduates: Domestic, international and proportions of females, 2009-2013 ......................................................................................................45
Table 2.30: Medical graduates by type of student place: Number and proportion of places, 2012-2013 ....................................................................45
Table 2.31: Domestic medical students expected to graduate from Australian universities: Projected numbers by state/territory, 2014-2019 .......................47
Table 2.32: International medical students expected to graduate from Australian universities: Projected numbers by state/territory, 2014-2019 .......................48
Table 2.33: Medical students expected to graduate from Australian universities: Projected number of domestic and international students, 2014-2019 ..........49
CHAPTER 3: PREVOCATIONAL MEDICAL TRAINING CHAPTER
Table 3.1: Commencing postgraduate year 1 trainees or supervised training positions: Total, females and proportion of females by doctor category and state/territory, 2014 .................................................................................52
Table 3.2: Commencing postgraduate year 1 trainees or supervised trainingpositions (RA2-RA5) by state/territory, 2014 .................................................54
Table 3.3: Commencing postgraduate year 1 trainees by state/territory, 2010-2014 ......................................................................................................55
Table 3.4: Commencing doctors in postgraduate year 2 training positions: Total, females and proportion of females by doctor category and state/territory, 2014 ........................................................................................56
Table 3.5: Postgraduate year 2 commencements by state/territory, 2010-2014 ............57
CHAPTER 4: VOCATIONAL MEDICAL TRAINING
Table 4.1: Basic training: Positions/posts and facilities/programs by medicalspecialty, 2014 ...............................................................................................61
Table 4.2: Advanced training: Positions/posts and facilities/programs bymedical specialty, 2014 ..................................................................................62
Table 4.3: Vocational training positions/trainees by medical specialty, 2014 .................64
Table 4.4: Basic trainees and first-year basic trainees by medical specialty and state/territory, 2014 ........................................................................................66

MTRP 18th Report xi
Table 4.5: Female basic trainees by medical specialty and state/territory, 2014 ...........67
Table 4.6: Vocational training positions/trainees: Total, basic, female basicand first-year basic trainees, 2010-2014 .......................................................68
Table 4.7: Basic training positions/trainees by medical specialty, 2010-2014 ................68
Table 4.8: Basic training positions/trainees by state/territory, 2010-2014 ......................69
Table 4.9: First-year basic trainees by medical specialty, 2010-2014 ............................69
Table 4.10: First-year basic trainees by state/territory, 2010-2014 ..................................70
Table 4.11: Proportion of female basic trainees by medical specialty, 2010-2014 ...........70
Table 4.12: Proportion of female basic trainees by state/territory, 2010-2014 .................71
Table 4.13: Advanced training positions/trainees by medical specialty and state/territory, 2014 ........................................................................................72
Table 4.14: Proportion of advanced training positions/trainees by medical specialty and state/territory, 2014 ................................................73
Table 4.15: First-year advanced positions/trainees by medical specialty and state/territory, 2014 ........................................................................................74
Table 4.16: Female advanced trainees by medical specialty and state/territory, 2014 ........................................................................................75
Table 4.17: Advanced trainees undertaking part-time training by medicalspecialty and state/territory, 2014 ..................................................................77
Table 4.18: Advanced trainee discontinuations by state/territory, 2010-2014 ..................78
Table 4.19: Obstetrics and gynaecology advanced trainees: Total, proportionof total and females by subspecialty, 2014 ....................................................78
Table 4.20: Pathology advanced trainees: Total, proportion of total and femalesby subspecialty, 2014 ...................................................................................79
Table 4.21: Pathology advanced trainees by subspecialty and state/territory, 2014 ........79
Table 4.22: Physician adult medicine advanced trainees: Total, proportion oftotal and females by subspecialty, 2014 ........................................................80
Table 4.23: Physician adult medicine advanced trainees by subspecialty and state/territory, 2014 ........................................................................................81
Table 4.24: Physician paediatric and child health advanced trainees: Total, proportion of total and females by subspecialty, 2014 ...................................82
Table 4.25: Physician paediatric and child health advanced trainees bysubspecialty and state/territory, 2014 ............................................................83
Table 4.26: Surgical advanced trainees: Total, proportion of total and females by subspecialty, 2014 .......................................................................84
Table 4.27: Surgical advanced trainees by subspecialty and state/territory, 2014 ...........84
Table 4.28: Vocational training positions/trainees: Total, advanced, female advanced and part-time advanced trainees, 2010-2014 ...............................85

MTRP 18th Report xii
Table 4.29: Advanced training positions/trainees by medical specialty, 2010-2014 ......................................................................................................86
Table 4.30: Advanced training positions/trainees by state/territory, 2010-2014 ...............87
Table 4.31: Proportion of female advanced trainees by medical specialty,2010-2014 ......................................................................................................88
Table 4.32: Proportion of female advanced trainees by state/territory, 2010-2014 ..........89
Table 4.33: Advanced trainees undertaking part-time training by medicalspecialty, 2010-2014 ......................................................................................90
Table 4.34: General practice trainees: Registrars, first-year registrars and female registrars by state/territory and training consortium, 2014 .................91
Table 4.35: General practice rural pathway trainees by state/territory, 2014....................92
Table 4.36: Vocational trainees sitting a final or fellowship examination: Trainees sitting and proportion passing by medical specialty, 2013...............93
Table 4.37: Vocational trainees undertaking additional examinations: Numbers and proportions passing by medical specialty, 2013 ......................94
Table 4.38: Vocational trainees who passed final or fellowship examinationby medical specialty, 2009-2013 ....................................................................96
Table 4.39: Proportion of vocational trainees sitting a final or fellowship examination who passed by medical specialty, 2009-2013 ...........................97
Table 4.40: New fellows: Total, females and overseas trained specialists by medical specialty, 2013 .............................................................................98
Table 4.41: New fellows by medical specialty and state/territory, 2013 ...........................99
Table 4.42: Female new fellows by medical specialty and state/territory, 2013 .............100
Table 4.43: New fellows by medical specialty, 2009-2013 .............................................101
Table 4.44: New fellows by state/territory, 2009-2013 ....................................................102
Table 4.45: Proportion of female new fellows by medical specialty, 2009-2013 ............103
Table 4.46: Proportion of female new fellows by state/territory, 2009-2013 ...................104
Table 4.47: Obstetrics and gynaecology subspecialties: New fellows, femalesand proportion of females by subspecialty, 2013 ........................................104
Table 4.48: Pathology subspecialties: New fellows, females and proportionof females by subspecialty, 2013 .................................................................104
Table 4.49: Physician adult medicine subspecialties: New fellows, femalesand proportion of females by subspecialty, 2013 ........................................105
Table 4.50: Physician paediatric and child health subspecialties: New fellows, females and proportion of females by subspecialty, 2013 ...........................106
Table 4.51: Surgical subspecialties: New fellows, females and proportionof females by subspecialty, 2013 .................................................................107
Table 4.52: Fellows: Total, number and proportion of females, and new fellowsand proportion of all fellows by medical specialty, 2013 ..............................108

MTRP 18th Report xiii
Table 4.53: Fellows by medical specialty and state/territory, 2013 ................................109
Table 4.54: Female fellows by medical specialty and state/territory, 2013 .....................110
Table 4.55: Pathology fellows: Total, females and proportion of females by subspecialty, 2013 ..................................................................................111
Table 4.56: Physician adult medicine fellows: Total, females and proportion of females by subspecialty, 2013 .................................................................112
Table 4.57: Physician paediatric and child health fellows: Total, females and proportion of females by subspecialty, 2013 ...............................................113
Table 4.58: Surgical fellows: Total, females and proportion of females by subspecialty, 2013 ..................................................................................114
CHAPTER 5: INTERNATIONAL SUPPLY
Table 5.1: Major classes of primary visa granted to medical practitioners, 2009-2010 to 2013-2014 ..............................................................................118
Table 5.2: Primary visa applications granted to medical practitioners by visa subclass: Top 10 citizenship countries, 2013-14 ..................................119
Table 5.3: Primary visa holders where the occupation is medical practitioner by visa subclass, 2012-13 and 2013-14 ......................................................119
Table 5.4: International medical graduates: Applications assessment through Competent Authority Pathway, 2013 ...........................................................122
Table 5.5: International medical graduates: Applications assessed through Standard Pathway AMC examination, 2013 ................................................124
Table 5.6: International medical graduates: Workplace-based assessment through Standard Pathway, 2013 ..............................................................................125
Table 5.7: Specialist assessment process by medical specialty, 2013 ........................128
Table 5.8: Substantially comparable specialist applications by country of training and medical specialty, 2013 ........................................................129
Table 5.9: Overseas trained doctors with Section 19AB exemptions, 2014 .................131
Table 5.10: Overseas trained doctors by state/territory, 2014 ........................................131
CHAPTER 6: SPECIAL PURPOSE TRAINING PROGRAMS
Table 6.1: Providers on approved 3GA programs placements, 2004-05 to 2013-14 ......................................................................................137
APPENDIX B: MEDICAL COLLEGE TRAINING REQUIREMENTS
Table B1: Summary of specialty training requirements and entry time, 2013 ..............149
Table B2: Summary of specialty part-time training requirements, 2013 ......................154
Table B3: Summary of specialty interrupted training requirements, 2013 ...................157
APPENDIX D: EXTENDED DATA TREND TABLES
Table D1: Commencing medical students: Domestic, international and proportion of females, 2000-2014 ................................................................217

MTRP 18th Report xiv
Table D2: Commencing medical students by university and state/territory, 2005-2014 ....................................................................................................218
Table D3: Commencing domestic medical students by university and state/territory, 2005-2014 .............................................................................219
Table D4: Commencing international medical students by university and state/territory, 2005-2014 .............................................................................220
Table D5: Medical students in Australian universities, 2000-2014 ...............................221
Table D6: Medical students: Domestic, international and total by state/territory, 2005-2014 ........................................................................222
Table D7: Domestic medical school graduates from Australian universities, 1997-2013 ....................................................................................................223
Table D8: Medical graduates: Domestic, international and proportion of domestic, international and females, 1999-2013 .....................................224
Table D9: Medical graduates: Domestic, international and total by state/territory, 2004-2013 .............................................................................225
Table D10: Postgraduate year 1: Commencing trainees or supervised training places by state/territory, 2004-2014 .............................................................226
Table D11: Postgraduate year 2: Commencing doctors by state/territory, 2004-2014 ....................................................................................................227
Table D12: Basic training positions/trainees by medical specialty, 2000-2014 ..............228
Table D13: Basic training positions/trainees by state/territory, 2000-2014 ....................229
Table D14: Basic training first-year positions/trainees by medical specialty, 2000-2014 ....................................................................................................230
Table D15: Basic training first-year positions/trainees by state/territory, 2000-2014 ...................................................................................................231
Table D16: Basic trainees: Proportion of females by medical specialty, 2000-2014 ....................................................................................................232
Table D17: Basic trainees: Proportion of females by state/territory, 2000-2014 ............233
Table D18: Vocational training positions/trainees: Total, basic, female basic and first-year basic trainees, 2000-2014 .............................................................234
Table D19: Advanced training positions/trainees by medical specialty,1997-2014 ....................................................................................................235
Table D20: Advanced training positions/trainees by state/territory, 1997-2014 ....................................................................................................237
Table D21: Advanced training first-year positions/trainees by medical specialty,1997-2014 ....................................................................................................238
Table D22: Advanced training first-year positions/trainees by state/territory, 1997-2014 ........................................................................240
Table D23: Advanced trainees: Proportion of females by medical specialty, 1997-2014 ..................................................................241

MTRP 18th Report xv
Table D24: Advanced trainees: Proportion of females by state/territory, 1997-2014 ....................................................................................................242
Table D25: Vocational training positions/trainees: Total, advanced, female advanced and part-time advanced trainees, 1997-2014 .............................243
Table D26: New fellows by medical specialty, 2000-2013 .............................................244
Table D27: New fellows by state/territory, 2000-2013 ....................................................246
Table D28: New female fellows by state/territory, 2000-2013 ........................................247
Table D29: New fellows: Proportion of females by medical specialty, 2000-2013 .........248
Table D30: New fellows: Proportion of females by state/territory, 2000-2013 ...............249
Table D31: Fellows by medical speciality 2008-2013 .....................................................250
Table D32: Fellows by state/territory, 2008-2013 ...........................................................251
Table D33: Female fellows by state/territory, 2008-2013 ...............................................252
Table D34: Fellows: Proportion of females by medical specialty, 2008-2013 ................253
Table D35: Fellows: Proportion of females by state/territory, 2008-2013 ......................254

MTRP 18th Report xvi
List of FiguresTABLE DESCRIPTION PAGE
EXECUTIVE SUMMARY
Figure 1: Medical students by type of student place: Number and proportion of places, 2014 .................................................................................................2
Figure 2: Commencing medical students by age groups, 2013 ......................................3
Figure 3: Domestic and international medical graduates, 1999-2013 .............................4
Figure 4: Projections of domestic and international medical graduates, 2013-2019 ........................................................................................................5
Figure 5: Postgraduate year 1 commencements, 2005-2014 .........................................6
Figure 6: Postgraduate year 2 commencements, 2005-2014 .........................................7
Figure 7: Vocational medical trainees, 2000-2014 ..........................................................8
Figure 8: Vocational trainee positions by medical specialty, 2014 ..................................9
Figure 9: New fellows by gender, 2000-2013 ................................................................10
Figure 10: Proportion of new fellows by medical specialty, 2013 ...................................11
Figure 11: Country of training of overseas trained specialists with approved applications, 2013 ..........................................................................................13
CHAPTER 5: INTERNATIONAL SUPPLY
Figure 5.1: Overseas trained doctors in Major cities by state/territory, 2014
Figure 5.2: Overseas trained doctors in Inner regional areas by state/territory, 2014
Figure 5.3: Overseas trained doctors in Outer regional areas by state/territory, 2014
Figure 5.4: Overseas trained doctors in Remote and Very remote areas by state/territory, 2014

MTRP 18th Report xvii
AcronymsABS Australian Bureau of Statistics
ACD Australasian College of Dermatologists
ACEM Australasian College for Emergency Medicine
ACRRM Australian College of Rural and Remote Medicine
ACSP Australasian College of Sports Physicians
AGPT Australian General Practice Training Program
AMC Australian Medical Council
AMDSP Approved Medical Deputising Services Program
ANU Australian National University
ANZCA Australian and New Zealand College of Anaesthetists
ANZCA-FPM Australian and New Zealand College of Anaesthetists -Faculty of Pain Medicine
APEDP Approved Private Emergency Department Program
APSPP Approved Placements for Sports Physicians
ASGC-RA Australian Standard Geographical Classification - Remoteness Area
AST Advanced Specialist Training
BMP Bonded Medical Places Scheme
CCT Core clinical training
CICM College of Intensive Care Medicine of Australia and New Zealand
CMO Career Medical Officer
COAG Council of Australian Governments
CPMEC Confederation of Postgraduate Medical Education Councils
DWS District of Workforce Shortage
FACRRM Fellowship of the Australian College of Rural and Remote Medicine
FARGP Fellowship in Advanced Rural General Practice
FGAMS Foreign graduates of an accredited medical school
FTE Full-time equivalent
GPET General Practice Education and Training Ltd
HECS-HELP Higher Education Contribution Scheme - Higher Education Loan Program
HMO Hospital Medical Officer
MBBS Bachelor of Medicine and Bachelor of Surgery
MCQ Multiple Choice Questionnaire
MD Doctor of Medicine
MDANZ Medical Deans Australia and New Zealand Inc.
MRBS Medical Rural Bonded Scholarship Scheme

MTRP 18th Report xviii
MSOD Medical Schools Outcomes Database
MTRP Medical Training Review Panel
PESCI Pre-employment structured clinical interview
PG Postgraduate
PGPPP Prevocational General Practice Placements Program
PGY1 Postgraduate Year 1 (also known as Intern year)
PGY2 Postgraduate Year 2
PGY3 Postgraduate Year 3
PREP Physician Readiness for Expert Practice
PRRT Primary Rural and Remote Training
QCRD Queensland Country Relieving Doctors Program
RACDS Royal Australasian College of Dental Surgeons
RACGP Royal Australian College of General Practitioners
RACMA Royal Australasian College of Medical Administrators
RACP Royal Australasian College of Physicians
RACP-AChAM Royal Australasian College of Physicians - Australasian Chapter of Addiction Medicine
RACP-AChPM Royal Australasian College of Physicians - Australasian Chapter of Palliative Medicine
RACP-AFOEM Royal Australasian College of Physicians - Australasian Faculty of Occupational and Environmental Medicine
RACP-AFPHM Royal Australasian College of Physicians - Australasian Faculty of Public Health Medicine
RACP-AFRM Royal Australasian College of Physicians - Australasian Faculty of Rehabilitation Medicine
RACP-AM Royal Australasian College of Physicians - Adult Medicine Division
RACP-PCH Royal Australasian College of Physicians - Paediatrics and Child Health
RACS Royal Australasian College of Surgeons
RANZCO Royal Australian and New Zealand College of Ophthalmologists
RANZCOG Royal Australian and New Zealand College of Obstetricians and Gynaecologists
RANZCP Royal Australian and New Zealand College of Psychiatrists
RANZCR Royal Australian and New Zealand College of Radiologists
RCPA Royal College of Pathologists of Australasia
RLRP Rural Locum Relief Program
RMO Resident Medical Officer
RRMA Rural, Remote and Metropolitan Areas (Classification System)
RTP Regional Training Provider
RVTS Remote Vocational Training Scheme

MTRP 18th Report xix
RWA Rural Workforce Agency
SET Surgical Education and Training
TMO Trainee Medical Officer
TROMPs Temporary Resident Other Medical Practitioners Program
UG Undergraduate
UNE University of New England
UNSW University of New South Wales
UQ University of Queensland
UWA University of Western Australia
UWS University of Western Sydney
Symbols and other usages
- Nil or rounded to zero.. Not applicable
na Not available
MTRP 18th Report 1
EXECUTIVE SUMMARYThe Medical Training Review Panel (MTRP) was formed under legislation in 1997 to report to the Commonwealth Minister for Health on the activities of the MTRP and provide data on medical training opportunities in Australia. Over the years, through its annual report, the Panel has provided a comprehensive picture of medical education and training, supplementing this with other data on the medical workforce supply.
The eighteenth annual report of the MTRP, like the previous reports, provides information on university, prevocational and vocational medical training positions, students and trainees, examination results and college fellows. Information is also included on overseas trained medical practitioners who are seeking to work or currently work in Australia.
The report was compiled by the Australian Government Department of Health, with oversight by the MTRP.
Data were provided by the Medical Deans Australia and New Zealand Inc. (Medical Deans), state and territory health departments through their postgraduate medical councils, specialist medical colleges, General Practice Education and Training Limited (GPET) and the Australian Medical Council (AMC). Selected administrative data from the Australian Government Department of Health and the Australian Government Department of Immigration and Border Protection have also been included.
To aid readability, tables in the body of the report present time series information on the last five years for which data were available. Data for all years are included in Appendix D and where possible date back to 1997, which was the first year of annual reporting by the MTRP. For the purposes of the Executive Summary, the latest available data have been summarised and trends in the data have been examined across all years for which national data were available.
University Medical TrainingIn Australia, professional entry level medical education is provided by university medical schools as four to six year bachelor degree or largely four year postgraduate master level degree courses. There are 18 universities with accredited medical schools, and a number of these were established in the last ten years. All of these universities have now produced graduates. The University of Melbourne was the first to commence Doctor of Medicine (MD) program in 2011 and had the first cohort of postgraduate degree graduates in 2014.
In 2014, there were 16,837 medical students studying in Australian universities. This was a decrease of less than one percent (157 or 0.9%) from 2013. Almost half (8,132 or 48.3%) of these students were undertaking a four-year course. This was slightly higher than in 2013 (7,805 or 45.9%).
Over three-quarters of all places in 2014 were Commonwealth-supported (13,351 or 79.3%). This is similar to previous years, with 78.4% of students receiving Commonwealth support in 2013 and 78.8% in 2012. Figure 1 shows that the majority of these students (9,587 or 71.8%) received support through the Higher Education Contribution Scheme - Higher

MTRP 18th Report 2
Education Loan Program (HECS-HELP) only. The remaining students were in bonded places receiving assistance through the Bonded Medical Places (BMP) Scheme and the Medical Rural Bonded Scholarship (MRBS) Scheme.
Students participating in the BMP Scheme have a return of service obligation to work in a District of Workforce Shortage (DWS) as identified by the Commonwealth, for a period of time equal to the length of the medical degree. However, up to half of the return of service obligation can be met while completing prevocational and vocational training.
Recipients of the MRBS Scheme scholarship are required to work for six continuous years in locations within Australian Standard Geographical Classification – Remoteness Areas (ASGC-RA) 2 to 5. MRBS Scheme doctors start their six year commitment to work in rural Australia after completing their vocational training.
In addition, medical students can be supported by scholarships through a variety of other sources, namely the state or territory, the university or other institutions and, for international students, their home country.
Overall, international students occupied 2,453 or 14.6% of places. These students were studying as private or sponsored students and were not Australian citizens, permanent residents or New Zealand citizens. This proportion decreased from 2013. A small proportion of Australian citizens (936 or 5.6% of medical students) also pay fees.
Figure 1: Medical students by type of student place: Number and proportion of places, 2014
In 2014, 275 medical students identified that they were of Aboriginal or Torres Strait Islander descent. Although this is a small proportion of all medical students, it represents an increase of 5.4% from 2013 and is over two-and-a-half times the number of students who identified themselves as Aboriginal and/or Torres Strait Islander people(s) in 2006 (99).

MTRP 18th Report 3
Of the total medical students, 3,737 were in the first year of their medical studies and 3,185 or 85.2% of these were domestic students.
Most students were under the age of 25 years when they commenced their medical studies. Data from 2013 shows that just over three quarters (76.6%) of students were under 25 years (Figure 2). A further 16.2% were aged between 25 and 29 years and 7.2% were 30 years or older. Over half (57.3%) of the medical students commencing in 2013 began their studies after finishing another degree.
Figure 2: Commencing medical students by age groups, 2013
Less than 20 years; 941; 26.8%
20-24 years,1,747, 49.8%
25-29 years,570, 16.2%
30-34 years,162, 4.6%
35-39 years,57, 1.6% 40 years and over; 34; 1.0%
Source: Medical Schools Outcomes Database
Adult medicine and general practice were among the most preferred types of future medical practice for students in their final year of medical school and in their first postgraduate year (PGY1). Males ranked surgery as their most popular preference, while females favoured general practice.
Domestic students with a rural background comprised just over a quarter of all commencing domestic students (878 or 27.6%).
Over the last decade, the total number of commencing medical students has almost doubled, with the intake increasing by 1,617 or 76.3% from 2,120 in 2004 to 3,737 in 2014. This was primarily due to increases in the number of commencing domestic students, which rose by 87.5% compared with an increase of 31.1% for international students.
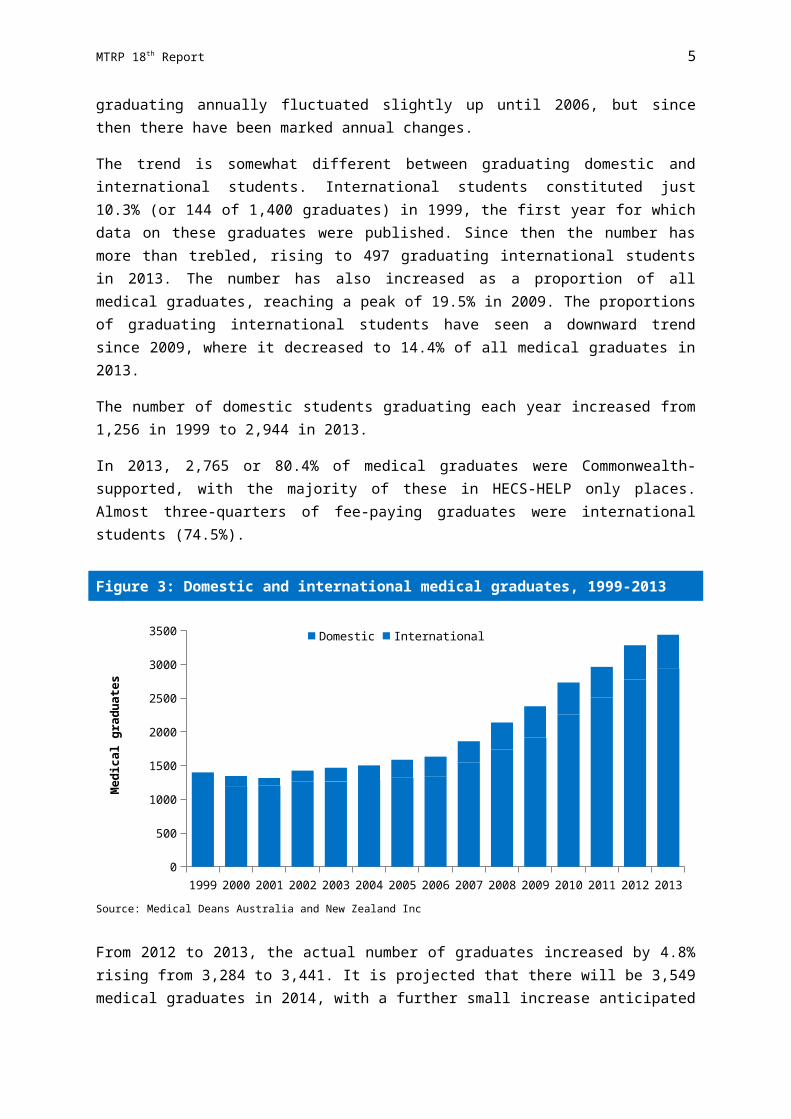
These increases are mirrored in the number of medical graduates each year. In 2013 there were 3,441 medical graduates, over double the 1,400 graduates in 1999 (Figure 3). The increase in numbers graduating annually fluctuated slightly up until 2006, but since then there have been marked annual changes.
The trend is somewhat different between graduating domestic and international students. International students constituted just 10.3% (or 144 of 1,400 graduates) in 1999, the first

MTRP 18th Report 4
year for which data on these graduates were published. Since then the number has more than trebled, rising to 497 graduating international students in 2013. The number has also increased as a proportion of all medical graduates, reaching a peak of 19.5% in 2009. The proportions of graduating international students have seen a downward trend since 2009, where it decreased to 14.4% of all medical graduates in 2013.
The number of domestic students graduating each year increased from 1,256 in 1999 to 2,944 in 2013.
In 2013, 2,765 or 80.4% of medical graduates were Commonwealth-supported, with the majority of these in HECS-HELP only places. Almost three-quarters of fee-paying graduates were international students (74.5%).
Figure 3: Domestic and international medical graduates, 1999-2013
1999 2000 2001 2002 2003 2004 2005 2006 2007 2008 2009 2010 2011 2012 20130
500
1000
1500
2000
2500
3000
3500 Domestic International
Med
ical
gra
duat
es
Source: Medical Deans Australia and New Zealand Inc
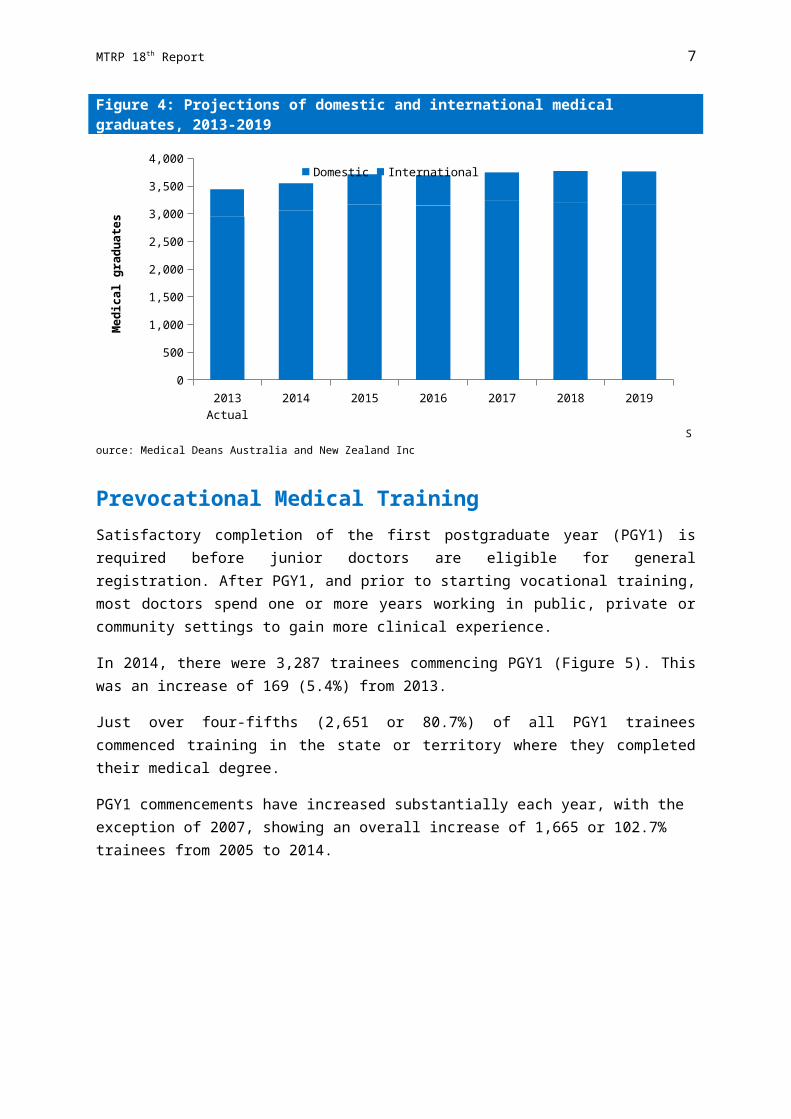
From 2012 to 2013, the actual number of graduates increased by 4.8% rising from 3,284 to 3,441. It is projected that there will be 3,549 medical graduates in 2014, with a further small increase anticipated in 2015 (to 3,712). Based on current student enrolments it is expected that the number of medical graduates will be 3,763 in 2019 (Figure 4).

MTRP 18th Report 5
Figure 4: Projections of domestic and international medical graduates, 2013-2019
2013 Actual 2014 2015 2016 2017 2018 20190
500
1,000
1,500
2,000
2,500
3,000
3,500
4,000 Domestic International
Med
ical
gra
duat
es
Source: Medical Deans Australia and New Zealand Inc
Prevocational Medical TrainingSatisfactory completion of the first postgraduate year (PGY1) is required before junior doctors are eligible for general registration. After PGY1, and prior to starting vocational training, most doctors spend one or more years working in public, private or community settings to gain more clinical experience.
In 2014, there were 3,287 trainees commencing PGY1 (Figure 5). This was an increase of 169 (5.4%) from 2013.
Just over four-fifths (2,651 or 80.7%) of all PGY1 trainees commenced training in the state or territory where they completed their medical degree.
PGY1 commencements have increased substantially each year, with the exception of 2007, showing an overall increase of 1,665 or 102.7% trainees from 2005 to 2014.

MTRP 18th Report 6
Figure 5: Postgraduate year 1 commencements, 2005-2014
2005 2006 2007 2008 2009 2010 2011 2012 2013 20140
500
1,000
1,500
2,000
2,500
3,000
3,500
PGY1
com
men
cem
ents
Source: State and Territory government health departments
In 2014, there were 3,107 doctors who were identified as commencing in postgraduate year 2 (PGY2) supervised medical training positions across Australia. This was a decrease of 87 or 2.7% from the previous year (Figure 6). This is likely to be an underestimation of the true numbers of doctors undertaking their second year of prevocational training, as unknown numbers may be recruited by health services.
The number of PGY2 commencements appears to have increased substantially in recent years. However, it is difficult to ascertain the true extent of the increase due to differences in the way prevocational trainees are actually contracted and methodological issues in obtaining data as a result of differences in the data captured through the various state and territory reporting systems.
Over two-thirds (2,343 or 75.4%) of all Australian trained PGY2 doctors commenced their second year of training in the state or territory in which they were trained in previously, compared with 351 or 11.3% who came from interstate.

MTRP 18th Report 7
Figure 6: Postgraduate year 2 commencements, 2005-2014
2005 2006 2007 2008 2009 2010 2011 2012 2013 20140
500
1,000
1,500
2,000
2,500
3,000
3,500
PGY2
com
men
cem
ents
Source: State and Territory government health departments
Not all junior doctors go on to train in a medical specialty. A number continue to work in hospital settings in non-vocational career roles, typically as career medical officers (CMOs).
While a number of specialist medical colleges may accept entrants to vocational training programs directly following completion of PGY1, most require applicants to have completed the PGY2 in general prevocational training.
Vocational Medical TrainingMost junior doctors seek entry into specialist or vocational training, which leads to a fellowship from an accredited specialist medical college. In 2014, training was provided through the specialist medical colleges and, in the case of general practice, General Practice Education and Training Ltd (GPET) and a network of Regional Training Providers. Vocational training programs were accredited by the Australian Medical Council (AMC). Each college had its own training program and requirements.
Data covers all Australian trainees, as well as international medical graduates who were registered vocational trainees and who were working or training in an accredited training position, post, facility or program.
There were 19,158 vocational trainees in 2014 (Figure 7). This is over two and a half times the number reported in 2000 (7,262 vocational trainees).
In 2014, there were 6,367 basic trainees, representing one third (33.2%) of all trainees. There has been a constant increase in the number of basic trainees since 2005, mainly due to some colleges having introduced basic training as a pre-requisite to entry into their advanced training programs. Of the total number of basic trainees, 1,666 or 26.2% were in their first year.

MTRP 18th Report 8
In total, there were 12,791 advanced trainees in 2014, making up a larger proportion (66.8%) of the total number of trainees. The increase in basic trainees has resulted in advanced trainees declining as a proportion of all trainees. However, total advanced trainee numbers have risen by 111.1% since 2005.
Figure 7: Vocational medical trainees, 2000-2014
2000 2001 2002 2003 2004 2005 2006 2007 2008 2009 2010 2011 2012 2013 20140
2,000
4,000
6,000
8,000
10,000
12,000
14,000
16,000
18,000
20,000
Total
Advanced
Basic
Voca
tiona
l med
ical
trai
nees
Source: Medical colleges
The education and training requirements of each medical specialty depend on the type of clinical medical practice, but commonly include basic and advanced training. Where required, a trainee can only apply for and compete for a position on an advanced specialist training program after successfully completing a basic training program or at a minimum PGY2.
Approximately one-third (33.0%) of all vocational trainees positions were in specialties governed by the Royal Australasian College of Physicians (RACP), such as addiction medicine, adult medicine, occupational and environmental medicine, paediatrics, palliative medicine, public health medicine, rehabilitation medicine and sexual health medicine, with 23.0% in adult medicine (Figure 8). Almost one-quarter (23.4%) of all vocational trainee positions were in general practice and 11.0% were in emergency medicine.

MTRP 18th Report 9
Figure 8: Vocational trainee positions by medical specialty, 2014
Adult medicine, 23.0%
Anaesthesia, 6.6%
Dermatology, 0.5%
Emergency medicine, 11.0%
General practice, 23.4%
Intensive care, 2.8%
Obstetrics and gynaecology, 2.8%
Ophthalmology, 0.8%
Paediatrics, 7.7%
Pathology, 2.8%
Psychiatry, 6.7%
Radiodiagnosis, 2.1%
Surgery, 5.7%Other specialities, 3.9%
Source: Medical colleges
FellowshipWhen medical practitioners finish their vocational training and have met all other requirements of the relevant specialist medical college, they are eligible to apply for fellowship of that college.
There were 2,954 new college fellows in 2013 (Figure 9). This is a significant increase since 2000, when the data were first collected, with the number of new fellows almost trebling (162.3%) from 1,126. The number of new fellows reported in 2013 slightly decreased from 2012, as new fellows who live overseas have been excluded from the total.
In 2013, over two-fifths (1,341 or 45.4%) of all new fellows were females.
Approximately one-quarter (710 or 24%) of new fellows were overseas trained specialists who had completed the requirements of the specialist medical colleges and were deemed substantially comparable with specialists trained by the medical college in Australia.

MTRP 18th Report 10
Figure 9: New fellows by gender, 2000-2013
2000 2001 2002 2003 2004 2005 2006 2007 2008 2009 2010 2011 2012 20130
500
1000
1500
2000
2500
3000
3500
Males
Females
New
fello
ws
Source: Medical colleges
The proportion of new fellows in each medical specialty is shown in Figure 10. The proportionate split has remained approximately the same across the specialties over recent years, with two-fifths of all new fellows in general practice. General practice had the largest increase over the last five years in terms of absolute numbers, with 213 more new fellows in 2013 than in 2009. There were also large increases in the number of new fellows in anaesthesia (59), radiodiagnosis (56) and adult medicine (41) in 2013 over 2009.
Ophthalmology had the greatest proportional increase with the number of new fellows increasing from 11 to 36 (227.3%) between 2009 and 2013, radiodiagnosis also showed substantial growth in the last five years (127.3%).
The significance of the increased training activity and consequently the number of new fellows can be put into perspective by looking at it in relation to the total number of college fellows. There were 50,704 fellows of medical colleges reported as actively practising in their specialty.
MTRP 18th Report 11
Figure 10: Proportion of new fellows by medical specialty, 2013
Adult medicine, 14.8%
Anaesthesia, 9.1%
Dermatology, 0.8%
Emergency medicine, 3.9%
General practice, 40.0%
Intensive care, 1.8%
Obstetrics and gynae-cology, 2.3%
Ophthalmology, 1.2%
Paediatrics, 4.5%
Pathology, 3.3%
Psychiatry, 4.8%
Radiodiagnosis, 3.4%
Surgery, 6.5%Other specialities, 3.6%
Source: Medical colleges
Overall, new fellows represented 5.8% of all college fellows in 2013. The proportion of each college’s fellows who were new fellows varied greatly across specialties, with the largest proportions of new fellows (8.6%) in pathology and RACP (jointly), followed by emergency medicine (7.9%), intensive care medicine (7.3%) and radiation oncology (7.0%).
Female Medical TrainingIn 2014, females comprised approximately half of the students commencing medical studies (52.3% domestic and 50.4% international students). Slightly different proportions of females (52.8% domestic and 49.1% international) were reported for medical graduates.
The proportion of female medical graduates has decreased slightly (0.8%) from 2012 to 52.3% in 2013. In vocational training, 53.9% of all basic trainees and 52.6% of advanced trainees were females in 2014. This proportion was far higher in some specialties, with females comprising three-fifths or more of advanced vocational trainees in obstetrics and gynaecology (74.5%), paediatrics (72.8%), public health medicine (72.8%), sexual health medicine (69.2%), rehabilitation medicine (66.3%), and general practice (63.1%). Oral and maxillofacial surgery (10.5%), sport and exercise medicine (22.0%) and surgery (27.5%) had low proportions of female advanced trainees in 2014.
The proportion of females who became new fellows in 2013 is somewhat lower than the proportion undertaking vocational training, remaining relatively stable at around two-fifths of the total new fellows each year since 2000. There were 1,341 new female fellows in 2013 (45.4%).
In 2013, 17,783 or 35.1% of all college fellows were females.

MTRP 18th Report 12
International Supply of Medical PractitionersOverseas trained medical practitioners form a key part of the medical workforce in Australia, not only in rural and remote areas, but in metropolitan and regional areas.
In 2013-14, there were 2,650 visas granted to medical practitioners across the two main subclasses – 457 and 442/402. Almost half (44.1%) of visas under the main classes were granted to applicants from the United Kingdom and Republic of Ireland. Just 5.1% and 2.2% of the medical practitioners granted visas came from Canada and the United States of America respectively. More recently, larger numbers of international recruits have come from a number of Asian countries. In 2013-14, almost a third (28.5%) of all applications (visas under subclasses 457 and 442/402) was granted to medical practitioners from Malaysia (8.2%), India (6.9%), Sri Lanka (4.6%), Iran (3.2%), Singapore (3.2%) and Pakistan (2.4%).
In July 2006, the Council of Australian Governments (COAG) agreed to the introduction of a nationally consistent assessment process for international medical graduates and overseas trained specialists. This process now consists of three main assessment streams: the Competent Authority Pathway, the Standard Pathway and Specialist Pathway. The Australian Medical Council is responsible for processing applications by international medical graduates and overseas trained specialists.
In 2013, the Australian Medical Council assessed a total of 1,123 applicants through the Competent Authority Pathway, with 662 applicants being granted Australian Medical Council Certificates, allowing them to apply for general registration. Just over two-thirds of the Australian Medical Council Certificates granted in 2013 were to international medical graduates from the United Kingdom.
Under the Standard Pathway 1,508 international medical graduates passed the Multiple Choice Questionnaire (MCQ) examination and 1,055 passed the Australian Medical Council clinical examinations. A total of 76 international medical graduates passed workplace-based assessment of their clinical skills and knowledge by an AMC-accredited authority.
There were 2,234 overseas trained specialists who applied to be recognised as a specialist under the Specialist Pathway to registration in 2013. Medical colleges conduct the assessments of comparability to Australian standards for the specialists and found 349 substantially comparable. These specialists were still required to complete periods of oversight and workplace based assessments by most medical colleges before being recommended to specialist registration. A further 335 specialists were deemed as partially comparable and requiring further training and/or examinations.
Of the 349 overseas trained specialists who were recognised as substantially comparable, over half (179 or 51.3%) were trained in the United Kingdom and the Republic of Ireland. This is a decrease in the number approved from these countries in 2012 (311 or 59.4%). The next largest number of overseas trained specialists (Figure 11) found substantially comparable in 2013 came from India (50 or 14.3%).
MTRP 18th Report 13
Figure 11: Country of training of overseas trained specialists with approved applications, 2013
Canada, 1.7%
India, 14.3%
New Zealand, 0.3%
South Africa, 7.2%
United Kingdom and Irelalnd, 51.3%
United States of America, 7.2%
Other, 18.1%
Source: Australian Medical Council administrative data
Under Section 19AA of the Health Insurance Act 1973 (the Act), Special Purpose Training Programs provide for those doctors who are seeking vocational recognition, but who are not involved in a specialist training program. Some of these programs specifically cover medical practitioners who have trained overseas to assist with their integration into the Australian workforce.
At June 2014, there were 11,138 overseas trained doctors with section 19AB exemptions restricting their practice to Districts of Workforce Shortage (DWS).
Although overseas trained doctors comprise a higher proportion of the medical workforce in more remote areas of Australia, the majority work in Major cities and Inner regional areas.
There is considerable variation between states and territories in the overall and relative numbers of overseas trained doctors. Queensland has relatively high numbers across all regions. Western Australia has relatively higher numbers of overseas trained general practitioners in Remote and Very remote areas. New South Wales has many across all regions with a lower portion in Remote and Very remote areas. Victoria continues to have a higher number of overseas trained general practitioners in its Major cities and Inner regional areas. Generally across all regions there are more overseas trained general practitioners than specialists for each state/territory, except Queensland in Remote and Very remote areas, Tasmania in Inner regional areas and the Australian Capital Territory in Major cities.

MTRP 18th Report 14
Chapter 1
INTRODUCTIONThe eighteenth annual report of the Medical Training Review Panel (MTRP) documents the availability of training places at the undergraduate, prevocational and vocational levels. The report also includes information about special purpose programs and national projects related to the education and training of medical practitioners. The MTRP report is tabled annually in Parliament and distributed to key medical educational stakeholders and jurisdictions as well as being made available to other interested parties and the wider community via the internet1.
The report presents the latest annual information on the different stages in the university medical education and vocational training pathways, and also includes analysis of trends and patterns in the supply of the medical workforce, where possible back to 1997, the first year of MTRP reporting. Data on medical practitioners who have trained overseas and have applied, or are now working in Australia, are also included.
Medical Training Review Panel Structure and ResponsibilitiesThe MTRP was established as a time-limited committee in June 1997 by the then Minister for Health and Family Services under Section 3GC of the Health Insurance Act 1973 (the Act). The terms of reference of the committee were to monitor the availability and take-up of medical training places by Hospital Medical Officers (HMOs) who come under the proficiency standards created by the Health Insurance Act 1973 (No. 2) 1996. The MTRP was made a permanent body in 2001 to ensure that the monitoring and reporting function continued in the future. In 2009 a review of the functions of the MTRP was undertaken. This reaffirmed the important role that the MTRP plays, both as a forum bringing together key stakeholders in medical education and training and also as an advisory group informing work in relation to medical education and training in this country.
Member organisations of the MTRP are appointed by Ministerial determination and include Medical Deans Australia and New Zealand Inc. (Medical Deans), the accredited specialist medical colleges, the Australian Medical Council (AMC), the Australian Medical Students’ Association (AMSA), the Confederation of Postgraduate Medical Education Councils (CPMEC), the Australian Medical Association Council of Doctors-in-Training (AMACDT), the Australian General Practice Network (AGPN), Rural Doctors Association of Australia (RDAA), Australian Salaried Medical Officers Federation (ASMOF), General Practice Education and Training Ltd (GPET), state and territory health departments and the Commonwealth. It is chaired by the Australian Government Department of Health. A full list of member organisations and members is provided at Appendix A.
1 Reports are available on the Australian Government Department of Health website.

MTRP 18th Report 15
To assist with carrying out its duties, the MTRP is empowered to establish subcommittees as needed. The Clinical Training Subcommittee and the Data Subcommittee have been established for a number of years and have been involved in various activities reported in this and previous MTRP reports. The Rural Subcommittee was created in 2010. Summary information of these is provided below and more detailed information is at Appendix A.
The Clinical Training Subcommittee was formed to monitor and report on the activities and progress being made to ensure that there are adequate clinical training positions for the increasing number of new medical graduates.
The Data Subcommittee has provided advice in relation to the content of this and previous annual reports and the specifications of the data that these cover.
The Rural Subcommittee was established to consider rural medical training issues.
Report StructureThe report presents background information and data on the various components of medical education and training as follows.
University Medical Education
Chapter 2 covers medical students enrolled in Australian universities, including information on numbers enrolled in each medical school by year of study, types of places, domestic and international student breakdowns, projections of the numbers expected to graduate over the next five years. Some data on students commencing medical studies collected through the Medical Schools Outcomes Database (MSOD) project have been included to provide additional information on the characteristics of students.
Prevocational Medical Training
Chapter 3 covers the number of prevocational junior doctors in training in the intern year or postgraduate year 1 (PGY1) and postgraduate year 2 (PGY2) positions across Australia.
Vocational Medical Training
Chapter 4 covers information on 2014 trainees by specialty and state and territory, and the results of college examinations in 2013. Data on new and total fellows for each of the medical colleges for 2013 are also included.
International Supply
Chapter 5 presents information on those doctors trained overseas (commonly referred to as international medical graduates), applying to work and working as medical practitioners in Australia. It provides a description of the Australian Medical Council process of assessment, and the number of overseas trained doctors and specialists seeking to practise medicine in Australia and the country in which they trained. Data are presented on approved working visas issued by the Australian Government Department of Immigration and Border Protection to medical practitioners. Information is also provided on medical practitioners who trained overseas who provided Medicare-funded services and how they are distributed across Australia.

MTRP 18th Report 16
Special Purpose Training Programs
Chapter 6 presents information on the range of special purpose training programs operating under Section 3GA of the Act. This allows medical practitioners undertaking postgraduate education or participating in approved workforce programs to provide professional services that attract Medicare benefits.
Appendices
The appendices contain more detailed information on the membership of MTRP and its subcommittees (Appendix A), and summary information about college training requirements (Appendix B).
A glossary of the main terms used throughout the report is provided at Appendix C.
The latest available data and, where possible, trend data for the previous five years have been presented in the main body of the report. Tables showing data from previous years (where possible back to 1997, the first year of MTRP reporting) have been included at Appendix D.
Appendices E and F contain the specifications used for collection of the data collated in this report and the difference in terminology between medical college training programs and those of the MTRP report.
Notes on the Data and its Preparation
Data Sources
Data for the MTRP report were supplied by a range of organisations.
Information on medical students was supplied by Medical Deans Australia and New Zealand Inc. (Medical Deans) from its Student Statistics Collection and from the Medical Schools Outcomes Database (MSOD) Project. Medical Deans is the peak national and cross-Tasman professional body representing entry-level medical education, training and research in Australia and New Zealand. The Student Statistics Collection is collated annually at the time of enrolment and includes all students. The MSOD Project collects data longitudinally by survey of individual students at all medical schools to create comprehensive demographic, educational and career intentions information.
Data on the first (internship) and second years of prevocational training were supplied by state and territory health departments. Information on Commonwealth Medical Internship initiative was provided by the Australian Government Department of Health.
In 2014, vocational training data relating to doctors pursuing specialist training were provided by each of the specialist medical colleges. GPET, as well as the Royal Australian College of General Practitioners (RACGP) and the Australian College of Rural and Remote Medicine (ACRRM), provided data on general practice training. Given these multiple sources, efforts have been made to ensure that there is no double counting of trainees.

MTRP 18th Report 17
Administrative data for Chapter 5 on international supply were sourced from the Australian Medical Council, the Australian Government Department of Immigration and Border Protection and the Australian Government Department of Health.
Data Quality Issues
The quality of the MTRP report, as a single reference point covering all aspects of medical education and training, is dependent on the provision and collation of comprehensive information from all contributors. Data templates and specifications defining each data element and the periods covered have been developed for all areas of the report with the assistance of members of the Data Subcommittee.
The specifications used in compilation of this report are attached in Appendix E. The MTRP has endeavoured to ensure the source data are according to the data specifications, but where this is not possible and data differ from the provided specifications, this is duly noted in the report.
These continued enhancements have greatly improved the comparability of data between state and territories and specialties within tables. This has, however, affected comparability of data across years. Where this is known to have significantly impacted the analysis of time series data, cautions have been noted.
There are a number of areas in which there have been attempts to source more and/or improved information, in particular to quantify activity in relation to the training and supervision of international medical graduates and specialists and the country from which they obtained their primary medical qualifications and previously worked. It is hoped that specialist medical colleges will introduce new data items that will allow this information to be presented in future reports.
The MTRP is dedicated to continue working with state and territories, specialist medical colleges and relevant external agencies to improve the data and provide more comprehensive information in medical training as necessary to inform policy and planning decisions.
Reporting Periods
Given the differing collection methodologies for different data, the year for which data are reported varies. The majority of data presented in the report are for 2014 with most data reported as at 30 June 2014.
The exceptions to these are MSOD statistics, data on medical graduates, college examinations, new and total college fellows, which are reported for the previous calendar year, 2013.
Data on international medical graduates and overseas trained specialists are also reported for 2013, however, where data are for 2014, this is noted.

MTRP 18th Report 18
Examination of Trends
The MTRP report has been produced annually since 1997. Tables in the body of the report present information pertaining to the latest five years. Where data were available from the previous years, this has been included in Appendix D.
In some cases data from previous years have been updated or amended. Where this has occurred, it is duly noted. Therefore, caution should be used when comparing data with that of previous editions of this report. Data can vary between years where its scope has changed due to more detailed specifications and different interpretations of what was required in previous reports. An effort has been made to note where there are significant differences in the way data have been collected or reported across years, or there have been changes in requirements, such as in relation to the training provided.
Medical College Acronyms and Specialties
Data on vocational training have been provided by specialist medical colleges and are reported by medical specialty. Table 1.1 provides a guide to the full names of the medical colleges, the acronym used for these throughout the report and the associated specialties under which data are reported.
Table 1.1: Medical colleges: Acronyms, names and specialities
Acronym College name SpecialtyACD Australasian College of Dermatologists DermatologyACEM Australasian College for Emergency Medicine Emergency medicineACRRM Australian College of Rural and Remote Medicine General practiceACSP Australasian College of Sports Physicians Sport and exercise medicineANZCA Australian and New Zealand College of Anaesthetists Anaesthesia
Faculty of Pain Medicine Pain medicine
CICM College of Intensive Care Medicine of Australia and New Zealand Intensive careRACDS Royal Australasian College of Dental Surgeons Oral and maxillofacial surgeryRACGP Royal Australian College of General Practitioners General practiceRACMA Royal Australasian College of Medical Administrators Medical administrationRACP Royal Australasian College of Physicians
Australasian Faculty of Occupational and Environmental Medicine
Occupational and environmental medicine
Australasian Faculty of Public Health Medicine Public health medicineAustralasian Faculty of Rehabilitation Medicine Rehabilitation medicineAdult Medicine Division Adult medicinePaediatrics and Child Health Division PaediatricsAustralasian Chapter of Addiction Medicine Addiction medicineAustralasian Chapter of Palliative Medicine Palliative medicineAustralasian Chapter of Sexual Health Medicine Sexual health medicine
RACS Royal Australasian College of Surgeons SurgeryRANZCO Royal Australian and New Zealand College of Ophthalmologists OphthalmologyRANZCOG Royal Australian and New Zealand College of Obstetricians and
GynaecologistsObstetrics and gynaecology
RANZCP Royal Australian and New Zealand College of Psychiatrists PsychiatryRANZCR Royal Australian and New Zealand College of Radiologists Radiodiagnosis
Faculty of Radiation Oncology Radiation oncology
RCPA Royal College of Pathologists of Australasia PathologyJoint Pathology – Royal Australasian College of Physicians and Royal College of Pathologists of Australasia
Pathology

MTRP 18th Report 19
Chapter 2
UNIVERSITY MEDICAL EDUCATION AND TRAININGThe latest data on medical students studying at Australian universities are presented in this chapter which analyses trends over the last five years. Additional data, where available, are presented in Appendix D. This information has been included in the MTRP report since 2006.
Medical StudentsIn Australia, university medical schools accredited by the Australian Medical Council provide professional entry level medical education. There are 18 universities with accredited medical schools in Australia, and a number of these were established in the last ten years. All of these universities have now produced graduates.
In the past, most medical doctors completed a five or six-year Bachelor of Medicine and Bachelor of Surgery (MBBS) degree to gain a professional entry level qualification. However, over the years an increasing number of four-year (graduate-entry) programs have been introduced.
Traditionally, these medical school programs resulted in a bachelor degree qualification. However, from 2015 approximately 45% of medical schools, representing nearly 50% of commencing domestic students will have moved to a Doctor of Medicine or equivalent program, resulting in graduates with a masters level qualification. The first of these was the University of Melbourne which commenced this program in 2011 and had the first cohort of masters graduates in 2014.
With the combination of graduate entry and Doctor of Medicine programs, over 60% of medical schools2 in Australia require seven years of tertiary study to attain a professional entry level medical qualification, which accounts for nearly 60% of commencing domestic students. This change is consistent with trends in other health professional programs moving into post graduate courses.
Current programs integrate pre-clinical and clinical components throughout the program and incorporate clinical experience from early in the course. However, the most significant clinical exposure occurs in the latter years of the program.
Medical students gain clinical exposure in a range of clinical settings and via simulation. Throughout their professional entry level medical program, students are provided with the skills, knowledge and attributes to move to the next phase of their training, which is the prevocational phase (prior to specialty training).
2 Some of these schools also offer additional entry pathways resulting in shorter tertiary education periods.

MTRP 18th Report 20
Current Data
In 2014, there were 16,837 medical students studying in Australian universities (Table 2.1). Of these, 4,388 (26.1%) were undertaking a six-year course, 4,317 (25.6%) were undertaking a five-year course and 8,132 (48.3%) were undertaking a four-year course.
Table 2.1: Medical students in Australian universities, 2014
University Year 1 Year 2 Year 3 Year 4 Year 5 Year 6 Total6-year courseAdelaide 150 151 197 185 183 167 1,033James Cook 214 219 195 170 191 162 1,151Melbourne UG(a) 0 0 0 4 8 6 18UNSW 295 297 256 263 287 280 1,678UWA UG(b) 0 0 0 166 182 160 508Subtotal 659 667 648 788 851 775 4,3885-year courseBond(c) 94 92 95 81 84 .. 446Monash UG(d) 310 318 311 304 236 .. 1,479Newcastle/UNE 194 213 202 220 206 .. 1,035Tasmania 117 120 104 108 113 .. 562UWA PG(b),(c) 0 0 52 67 53 .. 172UWS 127 120 123 123 130 .. 623Subtotal 842 863 887 903 822 .. 4,3174-year courseANU 93 98 82 91 .. .. 364Deakin 134 136 138 136 .. .. 544Flinders 166 167 151 131 .. .. 615Griffith 153 152 153 143 .. .. 601Melbourne MD(a) 347 326 319 313 .. .. 1,305Monash PG(d) 81 85 88 80 .. .. 334Notre Dame Sydney 120 121 112 109 .. .. 462Notre Dame Fremantle 113 108 89 108 .. .. 418Queensland(e) 413 438 435 435 .. .. 1,721Sydney 298 293 297 315 .. .. 1,203UWA MD(b) 233 0 0 0 .. .. 233Wollongong 85 82 85 80 .. .. 332Subtotal 2,236 2,006 1,949 1,941 .. .. 8,132Total 3,737 3,536 3,484 3,632 1,673 775 16,837
UG - undergraduate PG - postgraduate MD – Doctor of Medicine
(a) Undergraduate program last intake was in 2008. Master (MD) program commenced in 2011.(b) There were no enrolments into UWA PG or UG courses. All students now enrol into UWA MD course from 2014.(c) These courses are slightly less than 5 years in duration - Bond 4.8 years and UWA PG 4.7 years.(d) Excludes all offshore programs, including Monash Malaysia.(e) Excludes all offshore programs, including UQ Ochsner.
Source: Medical Deans Australia and New Zealand Inc
In 2014, 14,384 or 85.4% of all students were domestic students (Table 2.2). A domestic student is defined as being an Australian or New Zealand citizen, or an Australian permanent resident. Of these, 3,611 (25.1%) students were undertaking a six-year course,

MTRP 18th Report 21
3,676 (25.6%) were undertaking a five-year course and 7,097 (49.3%) were undertaking a four-year course.
Table 2.2: Domestic medical students in Australian universities, 2014
University Year 1 Year 2 Year 3 Year 4 Year 5 Year 6 Total6-year courseAdelaide 116 120 172 164 156 138 866James Cook 182 184 174 155 164 141 1,000Melbourne UG(a) 0 0 0 3 8 6 17UNSW 214 235 199 203 233 227 1,311UWA UG(b) 0 0 0 136 151 130 417Subtotal 512 539 545 661 712 642 3,6115-year courseBond(c) 94 92 95 79 82 .. 442Monash UG 242 265 248 255 188 .. 1,198Newcastle/UNE 173 186 176 187 174 .. 896Tasmania 99 100 79 86 86 .. 450UWA PG(b),(c) 0 0 43 67 53 .. 163UWS 108 100 103 109 107 .. 527Subtotal 716 743 744 783 690 .. 3,6764-year courseANU 90 97 81 88 .. .. 356Deakin 129 131 132 134 .. .. 526Flinders 152 142 131 113 .. .. 538Griffith 150 148 147 142 .. .. 587Melbourne MD(a) 302 293 285 292 .. .. 1,172Monash PG 76 77 83 65 .. .. 301Notre Dame Sydney 120 121 112 109 .. .. 462Notre Dame Fremantle 113 108 89 108 .. .. 418Queensland 306 328 315 335 .. .. 1,284Sydney 229 226 221 264 .. .. 940UWA MD(b) 210 0 0 0 .. .. 210Wollongong 80 73 76 74 .. .. 303Subtotal 1,957 1,744 1,672 1,724 .. .. 7,097Total 3,185 3,026 2,961 3,168 1,402 642 14,384
UG – undergraduate PG - postgraduate MD – Doctor of Medicine
(a) Undergraduate program last intake was in 2008. Master (MD) program commenced in 2011.(b) There were no enrolments into UWA PG or UG courses. All students now enrol into UWA MD course from 2014.(c) These courses are slightly less than 5 years in duration - Bond 4.8 years and UWA PG 4.7 years.
Source: Medical Deans Australia and New Zealand Inc
In 2014, 2,453 or 14.6% of all students were international students (Table 2.3). An international student is defined as a student studying onshore in Australia as a private or sponsored student who is not an Australian or New Zealand citizen, or permanent resident. Of these, 777 (31.7%) were undertaking a six-year course, 641 (26.1%) were undertaking a five-year course and 1,035 (42.2%) were undertaking a four-year course.
Table 2.3: International(a) medical students in Australian universities, 2014

MTRP 18th Report 22
University Year 1 Year 2 Year 3 Year 4 Year 5 Year 6 Total
6-year courseAdelaide 34 31 25 21 27 29 167James Cook 32 35 21 15 27 21 151Melbourne UG(b) 0 0 0 1 0 0 1UNSW 81 62 57 60 54 53 367UWA UG(c) 0 0 0 30 31 30 91Subtotal 147 128 103 127 139 133 777
5-year courseBond(d) 0 0 0 2 2 .. 4Monash UG(e) 68 53 63 49 48 .. 281Newcastle/UNE 21 27 26 33 32 .. 139Tasmania 18 20 25 22 27 .. 112UWA PG(c),(d) 0 0 9 0 0 .. 9UWS 19 20 20 14 23 .. 96Subtotal 126 120 143 120 132 .. 641
4-year courseANU 3 1 1 3 .. .. 8Deakin 5 5 6 2 .. .. 18Flinders 14 25 20 18 .. .. 77Griffith 3 4 6 1 .. .. 14Melbourne MD(b) 45 33 34 21 .. .. 133Monash PG(e) 5 8 5 15 .. .. 33Notre Dame Sydney 0 0 0 0 .. .. 0Notre Dame Fremantle 0 0 0 0 .. .. 0Queensland(f) 107 110 120 100 .. .. 437Sydney 69 67 76 51 .. .. 263
UWA MD(c) 23 0 0 0 23Wollongong 5 9 9 6 .. .. 29Subtotal 279 262 277 217 .. .. 1,035Total 552 510 523 464 271 133 2,453
UG - undergraduate PG - postgraduate MD – Doctor of Medicine
(a) International students are those studying onshore in Australia as private or sponsored students who are not Australian or New Zealand citizens, or permanent residents.
(b) Undergraduate program last intake was in 2008. Master (MD) program commenced in 2011.(c) There were no enrolments into UWA PG or UG courses. All students now enrol into UWA MD course from 2014.(d) These courses are slightly less than 5 years in duration - Bond 4.8 years and UWA PG 4.7 years.(e) Excludes all offshore programs, including Monash Malaysia.(f) Excludes all offshore programs, including UQ Ochsner.
Source: Medical Deans Australia and New Zealand Inc

MTRP 18th Report 23
There were an additional 998 international students in 2014, studying in Australian offshore programs3 (Table 2.4). This represented 28.9% of the total international students.
A total 621 or 18.0% of international students were studying in Monash Malaysia and 347 or 10.1% were in Ochsner (USA) program of Queensland University.
Table 2.4: International students studying in Australian offshore programs, 2014Total Proportion of total international students (%)
International Medical University (IMU) 30 0.9Monash Malaysia 621 18.0Queensland University Ochsner (USA) 347 10.1Total 998 28.9
Source: Medical Deans Australia and New Zealand Inc
Types of Student Places
In Australia a student undertaking medical studies may occupy either:
a Commonwealth-supported university place (CSP), where the student is required to pay for only part of the cost of his or her degree through HECS-HELP; or
a full fee-paying place, which is funded entirely by the tuition fees paid by the student.
Some medical students occupying Commonwealth-supported university places are participating in the Bonded Medical Places (BMP) Scheme or have received scholarships through the Medical Rural Bonded Scholarship (MRBS) Scheme, which commenced in 2004 and 2001 respectively.
Students participating in the BMP Scheme have a return of service obligation to work in a District of Workforce Shortage (DWS) as identified by the Commonwealth, for a period of time equal to the length of the medical degree. However, up to half of the return of service obligation can be met while completing prevocational and vocational training.
Recipients of the MRBS Scheme scholarship are required to work for six continuous years in locations within Australian Standard Geographical Classification – Remoteness Areas (ASGC-RA) 2 to 5. MRBS Scheme doctors start their six year commitment to work in rural Australia after completing their vocational training.
The Northern Territory government supports another unique program – the Northern Territory Medical Program. This program is a Northern Territory government funded program that funds all 24 student placements through a return of service obligation program.
3 While these programs are primarily delivered offshore, the majority of these students spend limited educational time in Australia during their degree.

MTRP 18th Report 24
Table 2.5 provides detailed information on the number and types of places available at each university in 2014.
Over three-quarters of all university places each year are Commonwealth-supported. In 2014, there were 13,351 Commonwealth-supported places or 79.3% of all places.
Approximately one-fifth (20.1%) of all medical students were fee-paying in 2014. Just fewer than three-quarters of full fee-paying places were occupied by international students and this number is similar among commencing students (72.1%) in Table 2.6 and all medical students (72.4%) in Table 2.5.
Table 2.5: Medical students by type of student place and university, 2014
Commonwealth-supported places
Fee-payingDomestic International(a) Other(b) Total
Adelaide 863 3 167 0 1,033ANU 356 0 8 0 364Bond 0 442 4 0 446Deakin 524 1 18 1 544Flinders 448 0 77 90 615Griffith 587 0 14 0 601James Cook 996 4 151 0 1,151Melbourne MD 999 173 133 0 1,305Melbourne UG 17 0 1 0 18Monash PG 294 7 33 0 334Monash UG 1,190 8 281 0 1,479Newcastle/UNE 894 2 139 0 1,035Notre Dame Sydney 240 222 0 0 462Notre Dame Fremantle 413 5 0 0 418Queensland 1,253 25 437 6 1,721Sydney 919 21 263 0 1,203Tasmania 450 0 112 0 562UNSW 1,294 17 367 0 1,678UWA MD 210 0 23 0 233UWA PG 163 0 9 0 172UWA UG 417 0 91 0 508UWS 521 6 96 0 623Wollongong 303 0 29 0 332Total 13,351 936 2,453 97 16,837
UG - undergraduate PG - postgraduate MD – Doctor of Medicine
(a) Excludes all offshore programs, including UQ Ochsner and Monash Malaysia.(b) Includes medical students on state health department bonded medical scholarships.
Source: Medical Deans Australia and New Zealand Inc
Table 2.6 provides detailed information on the number and types of places available at each university in 2014 for commencing students.
Similarly to Table 2.5, over three-quarters of all university places for commencing students were Commonwealth-supported. Of the 3,737 commencing medical students in 2014, 2,940 students or 78.7% were in these places.

MTRP 18th Report 25
Table 2.6: Commencing medical students by type of student place and university, 2014
Commonwealth-supported places
Fee-paying places
Domestic International(a) Other(b) TotalAdelaide 116 0 34 0 150ANU 90 0 3 0 93Bond 0 94 0 0 94Deakin 129 0 5 0 134Flinders 121 0 14 31 166Griffith 150 0 3 0 153James Cook 182 0 32 0 214Melbourne MD(c) 260 42 45 0 347Monash PG 74 2 5 0 81Monash UG 240 2 68 0 310Newcastle/UNE 173 0 21 0 194Notre Dame Sydney 55 65 0 0 120Notre Dame Fremantle 109 4 0 0 113Queensland 305 1 107 0 413Sydney 228 1 69 0 298Tasmania 99 0 18 0 117UNSW 211 3 81 0 295UWA MD(c) 210 0 23 0 233UWS 108 0 19 0 127Wollongong 80 0 5 0 85Total 2,940 214 552 31 3,737
UG - undergraduate PG - postgraduate MD – Doctor of Medicine
(a) Excludes all offshore programs, including UQ Ochsner and Monash Malaysia.(b) Includes medical students on state health department bonded medical scholarships.(c) UWA and University of Melbourne now only admit students to their MD programs.
Source: Medical Deans Australia and New Zealand Inc
Table 2.7 provides further information on recent trends in the proportion of student places.
In 2014, the majority of Commonwealth-supported students occupied HECS-HELP only places (9,587 places or 71.8% of Commonwealth-supported places), whereas 3,764 or 28.2% of Commonwealth-supported students had a return of service obligation under either the MRBS Scheme or BMP Scheme, in addition to contributing to the cost of their education under HECS-HELP.
Eleven years after the commencement of the BMP Scheme, there were 3,327 students in BMP Scheme places. This was a slight decrease from 2013 (by 49 students). However, from 2010 to 2014 the number of students supported through this scheme had increased by 641 places or 23.9%.
The number of students in the MRBS Scheme also increased from 2013 (by 21 students or 5.0%). However, the number of students in MRBS Scheme places remained relatively constant since 2010, ranging between 480 students in 2010 and 437 students in 2014. The number of MRBS Scheme students as a proportion of all student places decreased from

MTRP 18th Report 26
3.1% in 2010 to 2.6% in 2014, while the number of BMP Scheme students as a proportion of all students increased from 17.4% in 2010 to 19.8% in 2014.
The proportion of domestic fee-paying students was in steady decline for three years since 2010 (5.9% of all students in 2010 to 4.7% of all students in 2012). But the proportion of domestic fee-paying students increased in 2013 (to 5.1%) and 2014 (to 5.6%).
Over the last five years the absolute number of international fee-paying students has plateaued, but the proportion has decreased slightly from 15.9% in 2010 to 14.6% in 2014.
Table 2.7: Medical students by type of student place: Number and proportion of places, 2010-2014
2010 2011 2012 2013 2014Medical students
Commonwealth-supported 11,873 13,016 13,289 13,315 13,351 HECS-HELP only 8,707 9,435 9,538 9,621 9,587 BMP Scheme 2,686 3,122 3,282 3,278 3,327 MRBS Scheme 480 459 469 416 437Fee-paying 3,356 3,364 3,492 3,598 3,389 Domestic 905 829 801 871 936 International(a) 2,451 2,535 2,691 2,727 2,453Other(b) 231 111 87 81 97Total 15,460 16,491 16,868 16,994 16,837
Proportion of places (%)Commonwealth-supported 76.8 78.9 78.8 78.4 79.3 HECS-HELP only 56.3 57.2 56.5 56.6 56.9 BMP Scheme 17.4 18.9 19.5 19.3 19.8 MRBS Scheme 3.1 2.8 2.8 2.4 2.6Fee-paying 21.7 20.4 20.7 21.2 20.1 Domestic 5.9 5.0 4.7 5.1 5.6 International(a) 15.9 15.4 16.0 16.0 14.6Other(b) 1.5 0.7 0.5 0.5 0.6Total 100.0 100.0 100.0 100.0 100.0
(a) Excludes all offshore programs, including UQ Ochsner and Monash Malaysia.(b) Includes medical students on state health department bonded medical scholarships.
Source: Medical Deans Australia and New Zealand Inc
Scholarships
Students can receive scholarships through a variety of sources.
Data was collected through the Medical Schools Outcomes Database (MSOD) project from 3,511 medical students (95.7% of the total 3,669) commencing their studies in 2013. Of these, 367 (10%) students stated that they received a scholarship to support them in their medical studies (Table 2.8).

MTRP 18th Report 27
Table 2.8: Commencing medical students source of scholarships, 2013
Source of scholarships Students Proportion (%)Commonwealth scholarships 99 27.0State scholarships 8 2.2Scholarships provided by Australian universities 211 57.5Scholarships provided by home country to international students 28 7.6Scholarships provided by other institutions 8 2.2Unnamed 13 3.5Total 367 100.0
Source: Medical Schools Outcomes Database
Student Characteristics
Data from MSOD provide insights into who is undertaking medical studies. Data are recorded for the 3,511 students (95.7% of the total 3,669) who completed the MSOD entry requirements in 2013.
Just over three-quarters (76.6%) of students commencing their medical studies in 2013 were under the age of 25 years (Table 2.9).
Table 2.9: Commencing medical students by sex and age, 2013
Age group Male Female
Proportion female
(%) Total
Proportion of total
(%)Less than 20 years 403 538 57.2 941 26.820-24 years 898 849 48.6 1,747 49.825-29 years 294 276 48.4 570 16.230-34 years 91 71 43.8 162 4.635-39 years 29 28 49.1 57 1.640 years and over 21 13 38.2 34 1.0
Total 1,736 1,775 50.6 3,511 100.0
Source: Medical Schools Outcomes Database
Just over half (57.3%) of the medical students commencing in 2013 began their studies after finishing another degree, with 84% of these having completed a tertiary qualification in science, medical science and health and/or allied health (Table 2.10).
Table 2.10: Commencing medical students discipline of highest tertiary qualification completed, 2013
Discipline of prior degree Undergraduate entry Graduate entry Total
Science(a) 33 626 659
Medical Science(b) 24 431 455
Health/Allied Health(c) 46 531 577
Humanities 10 122 132
Commerce/Business/Law 8 72 80
Physical sciences(d) 2 47 49
Other/Unknown 5 56 61
Total 128 1,885 2,013
MTRP 18th Report 28
(a) B.Sci, B Applied Sci (no or unclear major), Vet Sci, Liberal Arts, B Sci in Human Movement, biotechnology, human kinetics, exercise science and psychology.
(b) B. Medical Science, pathology, biochemistry, microbiology, haematology, histopathology, cytology and immunology.(c) Radiography, nursing, optometry, podiatry, speech pathology, orthodontics, nutrition, public health and tropical medicine,
occupational therapy, kinesiology, naturopathy, pharmacy, physiotherapy, dentistry, dental surgery, oral health, prosthetics and orthotics.
(d) B Eng, B Computer Science, architecture, urban planning, electronics, surveying, IT and mathematics.
Source: Medical Schools Outcomes Database
The majority (93.6%) of these students entered a graduate-entry medical program. Just less than three quarters (74.1%) had bachelor degrees, 16.4% had completed honours, graduate diploma or certificate and 9.3% of these students had a master or doctoral degree. Only 1.1% (39) of commencing students in 2013 reported having a Doctoral qualification at entry to medical studies (Table 2.11).
Table 2.11: Commencing medical students level of highest prior tertiary qualification by medical degree entry program(a), 2013
Level of prior degreeUndergraduate
entry
Proportion undergraduate entry
(%)Graduate
entry
Proportion graduate entry
(%) TotalPhD 2 1.6 37 2.0 39Master 21 16.4 139 7.4 160Graduate Diploma/Certificate 5 3.9 53 2.8 58Honours 10 7.8 257 13.6 267Bachelor 82 64.1 1,396 74.1 1,478Associate Degree 2 1.6 0 0 2Other/unknown 6 4.7 3 0.2 9Total 128 100.0 1,885 100.0 2,013
(a) Based on all individuals who reported previous qualifications.
Source: Medical Schools Outcomes Database
Information on the preferred type of medical practice as reported in the MSOD questionnaire by students in their final year of a medical degree and by postgraduate year 1 (PGY1) trainees is provided in Table 2.12 and Table 2.13.
The most popular preferred types of medical practice among male graduates were surgery and adult medicine, followed by general practice (309, 230 and 156 respectively).
Female graduates noted general practice, adult medicine and paediatrics and child health most often as their first preference for type of medical practice (313, 226 and 197 respectively).
Table 2.12: Preferred type of medical practice in final year of medical degree by gender(a), 2013
Specialty
Preference 1 Preference 2 Preference 3
Male Female Male Female Male FemaleAddiction medicine 1 2 3 4 5 4Adult medicine/internal medicine 230 226 118 137 67 99Anaesthesia 117 76 88 70 79 62Dermatology 12 32 8 13 11 20Emergency medicine 102 127 114 121 97 108General practice 156 313 102 160 130 133

MTRP 18th Report 29
Table 2.12: Preferred type of medical practice in final year of medical degree by gender(a), 2013
Specialty
Preference 1 Preference 2 Preference 3
Male Female Male Female Male FemaleIndigenous health 1 3 4 7 4 10Intensive care medicine 34 25 63 47 68 38Medical administration (e.g. managing a hospital) 0 1 8 3 12 13Non-specialist hospital practice(e.g. career as a medical officer in a hospital) 2 3 1 2 7 7Obstetrics and gynaecology 28 139 25 80 18 63Occupational and environmental medicine 0 1 0 1 1 2Ophthalmology 31 24 18 14 19 15Oral and maxillofacial surgery 7 1 6 3 9 1Paediatrics and child health 67 197 60 113 45 93Pain medicine 1 1 5 3 3 6Palliative medicine 5 8 4 15 9 20Pathology 6 9 5 3 8 7Psychiatry 36 46 30 31 22 25Public health medicine 4 7 2 8 11 22Radiation oncology 10 4 8 3 10 10Radiology 37 14 20 13 32 13Rehabilitation medicine 2 3 3 2 1 6Rural and remote medicine 23 34 12 29 14 26Sexual health medicine 2 2 3 11 5 16Sport and exercise medicine 8 5 24 10 21 19Surgery 309 131 75 40 57 39Other 56 34 9 14 12 17
(a) Data were collected from 2,873 medical students in their final year who answered the MSOD questionnaire.
Source: Medical Schools Outcomes Database
Table 2.13 illustrates the distribution of postgraduate year 1 (PGY 1) trainee preferences for different specialised areas of medicine.
Preferences varied by gender, with male choices varying from first to third preferences. Specialties indicated as a first preference for males were surgery, general practice and adult medicine (163, 131 and 127 respectively). Specialties listed as a second preference for males were adult medicine, general practice and anaesthesia (31, 30 and 27 respectively). Third preferences for male PGY 1 trainees included general practice (37) and adult medicine (24), followed by anaesthesia (17) and intensive care medicine (also 17).
Female choices were more consistent than for males from first to third preferences. Specialties consistently indicated by females were general practice and adult medicine(225 and 162 respectively as a first preference, 45 and 36 as a second preference, 44 and 24 as a third preference). The third specialty favoured by female PGY 1 trainees varied from first to third preference, with paediatrics and child health in a first preference, emergency medicine in a second preference and anaesthesia in third (92, 25 and 15 respectively).
Table 2.13: Preferred type of medical practice in postgraduate year 1 by gender(a), 2013

MTRP 18th Report 30
Specialty
Preference 1 Preference 2 Preference 3
Male Female Male Female Male FemaleAddiction medicine 0 1 0 1 1 2Adult medicine/internal medicine 127 162 31 36 24 24
Cardiology 14 15 na na na na Endocrinology 5 10 na na na na Gastroenterology and Hepatology 10 6 na na na na General Medicine 3 5 na na na na Geriatric Medicine 2 6 na na na na Haematology 6 3 na na na na Immunology and Allergy 0 1 na na na na Infectious Disease 11 3 na na na na Medical Oncology 1 9 na na na na Nephrology 2 6 na na na na Neurology 9 13 na na na na Respiratory and Sleep Medicine 4 0 na na na na Rheumatology 2 4 na na na na
Anaesthesia 74 41 27 17 17 15Dermatology 4 13 0 3 4 6Dual Vocational Training Program 8 1 2 1 4 2Emergency medicine 38 70 20 25 14 14General practice 131 225 30 45 37 44Indigenous health 1 2 1 4 1 5Intensive care medicine 15 9 25 15 17 14Medical administration (e.g. managing a hospital) 1 3 0 3 7 3Non-specialist hospital practice (e.g. career as a medical officer in a hospital) 0 0 1 0 3 4Obstetrics and gynaecology 13 60 3 17 2 13Ophthalmology 17 16 4 2 2 2Oral and maxillofacial surgery 3 1 1 0 1 0Paediatrics and child health 33 92 4 19 9 11
Clinical Genetics 0 1 na na na na Community Child Health 0 2 na na na na General Paediatrics 2 17 na na na na Neonatal and Perinatal Medicine 1 4 na na na na Paediatric Cardiology 0 4 na na na na Paediatric Emergency Medicine 2 0 na na na na Paediatric Endocrinology 1 1 na na na na Paediatric Gastroenterology and Hepatology 2 0 na na na na Paediatric Haematology 0 1 na na na na Paediatric Infectious Diseases 0 1 na na na na Paediatric Intensive Care Medicine 0 1 na na na na Paediatric Palliative Medicine 1 0 na na na na Paediatric Medical Oncology 1 5 na na na na
Pain medicine 0 0 1 1 1 1Palliative medicine 1 6 1 5 4 7Pathology 6 11 4 3 3 2Psychiatry 24 30 7 9 5 7Public health medicine 6 3 3 5 2 4Radiation Oncology 3 6 2 2 1 2Radiology 27 13 10 7 3 3Rehabilitation medicine 2 1 1 1 4 3Rural and remote medicine 14 15 3 7 3 11Sexual health medicine 3 2 1 3 2 5Sport and Exercise Medicine 2 3 1 0 7 1
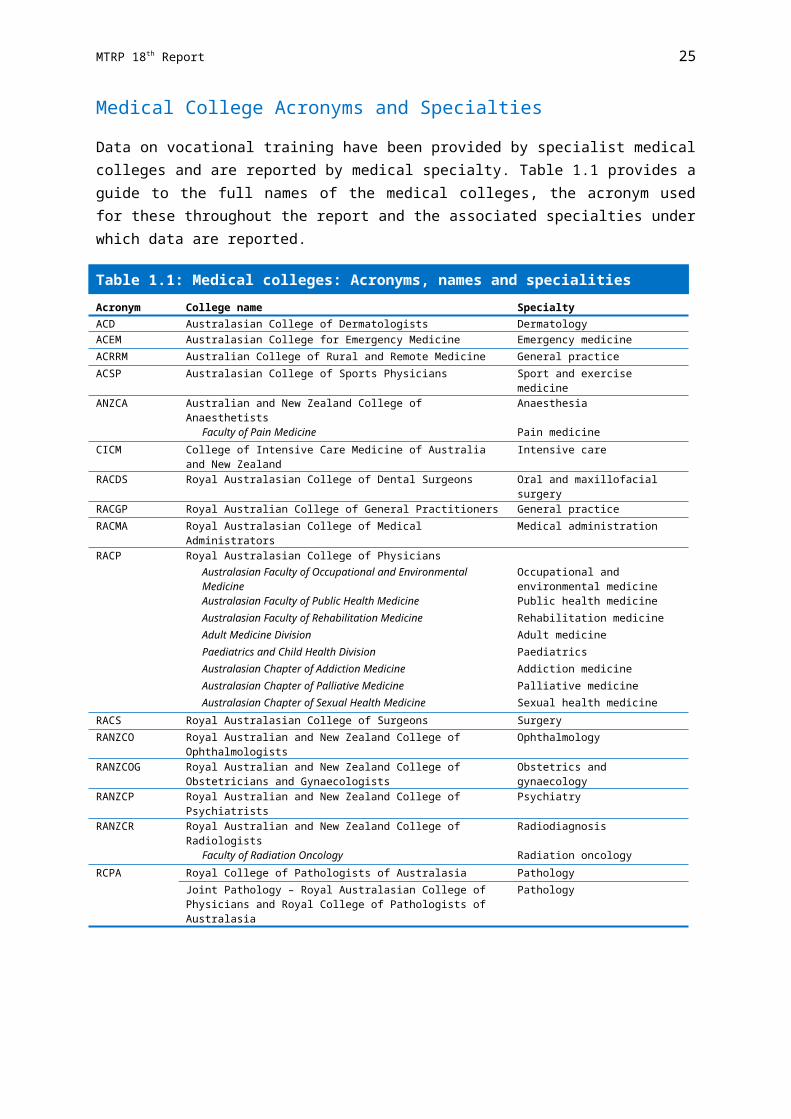
MTRP 18th Report 31
Specialty
Preference 1 Preference 2 Preference 3
Male Female Male Female Male FemaleSurgery 163 80 21 10 11 7
Cardiothoracic Surgery 5 1 na na na na General Surgery 25 24 na na na na Neurosurgery 5 4 na na na na Orthopaedic Surgery 32 7 na na na na Otolaryngology - Head and Neck Surgery 10 3 na na na na Paediatric Surgery 2 1 na na na na Plastic Surgery 9 9 na na na na Urology 7 1 na na na na Vascular Surgery 6 3 na na na na
Other 10 13 2 4 3 9
(a) Data were collected from 1,656 medical students in PGY1 who answered the MSOD questionnaire.
Source: Medical Schools Outcomes Database
In 2013, a total of 626 international students of the 3,511 commencing medical students completing the MSOD entry questionnaire reported that they held temporary or other entry permits to Australia (Table 2.14). The highest numbers of international students came from Singapore (24.3%), Canada (16.3%), Malaysia (14.9%) and United States of America (14.7%).
Table 2.14: International commencing medical students holding temporary or ‘other’ entry permits by place of birth, 2013Country of birth Students Proportion (%)Singapore 152 24.3Canada 102 16.3Malaysia 93 14.9United States of America 92 14.7Korea, Republic of (South) 23 3.7Hong Kong (SAR of China) 22 3.5India 15 2.4Indonesia 12 1.9All other (where n≤10) 115 18.4Total 626 100.0
Source: Medical Schools Outcomes Database
Aboriginal and/or Torres Strait Islander Students
Data on the Aboriginal and/or Torres Strait Islander people(s) status of medical students is available from two sources, Medical Deans Student Statistical Collection and the MSOD. Data from these two sources cannot necessarily be reconciled, so both are presented below as each provides different insights into the number of Aboriginal and/or Torres Strait Islander people(s) studying medicine.
The number and proportion of commencing medical students reporting that they are of Aboriginal and/or Torres Strait Islander descent when completing the MSOD entry questionnaire have risen slightly over the years from 37 or 1.2% of students in 2008, to 59 or 1.7% in 2013 (Table 2.15).

MTRP 18th Report 32
Table 2.15: Commencing medical students by Aboriginal and/or Torres Strait Islander status, 2008-2013
2008 2009 2010 2011 2012 2013Aboriginal and/or Torres Strait Islander students 37 38 47 69 48 59Non-Aboriginal and/or Torres Strait Islander students 3,180 3,113 3,064 3,483 3,403 3,438Unknown 18 10 4 10 20 14Total 3,235 3,161 3,115 3,562 3,471 3,511Proportion of Aboriginal and/or Torres Strait Islander students (%) 1.2 1.2 1.5 1.9 1.4 1.7
Source: Medical Schools Outcomes Database
Data from Medical Deans shows that there have been significant increases each year in the overall number of Aboriginal and/or Torres Strait Islander people(s) studying medicine.
In 2014, there was a total of 275 medical students studying in Australian universities who reported being of Aboriginal and/or Torres Strait Islander descent (Table 2.16), an increase of 177.8% over the nine years from 2006.
Table 2.16: Aboriginal and/or Torres Strait Islander medical students studying in Australian universities, 2006-2014
2006 2007 2008 2009 2010 2011 2012 2013 2014Aboriginal and/or Torres Strait Islander students 99 125 129 137 161 218 226 261 275
Annual change (%) 26.3 3.2 6.2 17.5 35.4 3.7 15.5 5.4
Source: Medical Deans Australia and New Zealand Inc
Rural Exposure
Exposure to rural and remote settings, whether through living, schooling and/or undertaking medical studies or training there, is shown to have a positive impact on the likelihood of medical professionals practising in rural and remote areas.
The Rural Clinical Training and Support (RCTS) program provides funding to participating universities for the establishment and support of medical student training in rural areas, and supports 17 rural clinical schools nationally. The RCTS program aims to improve the range of rural health care services and strengthen the health workforce in rural communities across Australia.
Participating Australian medical schools are required to meet a range of objectives set out in the program parameters, including:
providing at least 4 weeks rural training for all medical students; having at least 25% of their medical students undertake at least one year of clinical
training in a rural area; providing high-quality training of medical students in rural and remote areas; having at least 25% of their yearly student intake of rural origin; maintaining and enhancing measures to increase the number of Aboriginal and
Torres Strait Islander medical student graduates; and facilitating an increase in rural health and workforce research, rural health advocacy
and a raised awareness of rural and remote health issues.
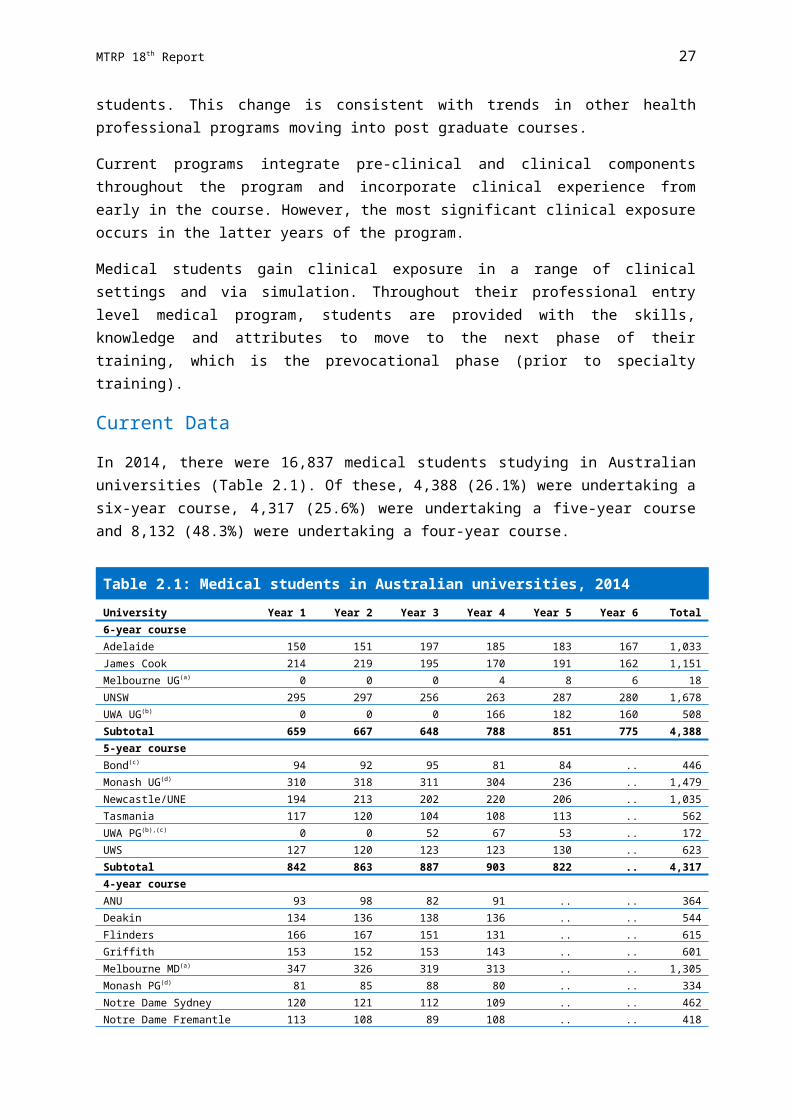
MTRP 18th Report 33
The RCTS is a component initiative of the Rural Health Multidisciplinary Training (RHMT) program, which also supports 11 University Departments of Rural Health, six dental schools that offer rural dental placements and the John Flynn Placement Program.
Data on students who have a rural background are collected by medical schools.
In 2014, 878 or 27.6% of commencing domestic students reported that they had lived in a rural or remote area prior to commencing their medical studies (Table 2.17). This is in line with the proportion of 27% in 2012 and 27.1% in 2013.
The proportion of domestic students with a rural background was roughly one quarter in each state and territory.

MTRP 18th Report 34
Table 2.17: Commencing domestic students with a rural background(a) by state/territory, 2014
Commonwealth or State supported Full-fee paying
Proportion of all domestic students with a
rural background (%)(a),(h)University Male Female Total Male Female Total
New South WalesNewcastle/UNE 19 27 46 0 0 0 26.6Notre Dame Sydney(b) 7 6 13 3 3 6 15.8Sydney 29 29 58 0 0 0 25.3UNSW 34 22 56 0 0 0 26.2UWS(c) 4 2 6 0 0 0 5.6Wollongong 21 32 53 0 0 0 66.3Total NSW 114 118 232 3 3 6 25.8
VictoriaDeakin 23 13 36 0 0 0 27.9Melbourne MD(d) 36 29 65 1 0 1 21.9Monash PG 13 10 23 0 0 0 30.3Monash UG 45 26 71 0 0 0 29.3Total VIC 117 78 195 1 0 1 26.2
QueenslandBond(e),(f) 0 0 0 0 0 0 0Griffith(e) 7 5 12 0 0 0 8.0Queensland 30 54 84 0 0 0 27.5James Cook 71 34 105 0 0 0 57.7Total QLD 108 93 201 0 0 0 27.5
Western AustraliaNotre Dame Fremantle(g) 14 14 28 0 0 0 24.8UWA PG 33 18 51 0 0 0 24.3Total WA 47 32 79 0 0 0 24.5
South AustraliaAdelaide 23 7 30 0 0 0 25.9Flinders 17 29 46 0 0 0 30.3Total SA 40 36 76 0 0 0 28.4
TasmaniaTasmania 28 33 61 0 0 0 61.6
Australian Capital TerritoryANU 20 7 27 0 0 0 30.0Total 474 397 871 4 3 7 27.6
UG - undergraduate PG - postgraduate MD – Doctor of Medicine
(a) Rural background is based on residency for at least five years from the commencement of primary school in an area classified as RA2 to RA5 under the Australian Standard Geographical Classification - Remoteness Areas (ASGC-RA) system.
(b) University of Notre Dame Sydney achieved a rural origin proportion of 32.7% against the RCTS program criteria, see footnote (h) below.
(c) University of Western Sydney is not subject to the RCTS rural origin target.(d) University of Melbourne achieved a rural origin proportion of 26.0% against the RCTS program criteria, see footnote (h)
below.(e) Bond and Griffith Universities do not participate in the Commonwealth RCTS program.(f) Bond University does not collect data on rurality.(g) University of Notre Dame Fremantle achieved a rural origin proportion of 26.5% against the RCTS program criteria, see
footnote (h) below.(h) The Rural Clinical Training and Support (RCTS) program requires that a number of Australian medical students equal to
at least 25% of the University's medical student CSP allocation must come from a rural background.
Source: Australian Government Department of Health and Medical Deans Australia and New Zealand Inc

MTRP 18th Report 35
Attrition Rates
The attrition rates report on the number of students that have permanently ceased candidature in a medical degree but do not include students who have deferred study or transferred to other medical schools.
In 2013, of 3,185 only 48 (1.5%) commencing domestic students (23 male and 25 female students) discontinued their medical degree in the first year (Table 2.18).
Table 2.18: Commencing domestic medical students: Attrition rates, 2013
University Male Female Total
Proportion of total commencing domestic students who ceased
candidature (%)New South Wales
Newcastle/UNE 1 2 3 6.3Notre Dame Sydney 1 0 1 2.1Sydney 4 0 4 8.3UNSW 0 0 0 0UWS 2 0 2 4.2Wollongong 1 1 2 4.2Total NSW 9 3 12 25.0
VictoriaDeakin 1 0 1 2.1Melbourne MD 0 0 0 0Monash PG 1 1 2 4.2Monash UG 4 9 13 27.1Total VIC 6 10 16 33.3
QueenslandBond 0 0 0 0Griffith 2 4 6 12.5Queensland 2 0 2 4.2James Cook 1 1 2 4.2Total QLD 5 5 10 20.8
Western AustraliaNotre Dame WA 0 0 0 0UWA MD 0 0 0 0UWA PG 0 0 0 0UWA UG 0 0 0 0Total WA 0 0 0 0
South AustraliaAdelaide 1 1 2 4.2Flinders 1 3 4 8.3Total SA 2 4 6 12.5
TasmaniaTasmania 1 2 3 6.3
Australian Capital TerritoryANU 0 1 1 2.1Total 23 25 48 100.0
UG – undergraduate PG - postgraduate MD – Doctor of Medicine
Source: Medical Deans Australia and New Zealand Inc
In 2013, a total of 17 out of 552 (3.1%) commencing international students (9 male and 8 female students) discontinued their medical degree in the first year (Table 2.19).

MTRP 18th Report 36
Table 2.19: Commencing international(a) medical students: Attrition rates, 2013
University Male Female Total
Proportion of total commencing international students who ceased
candidature (%)New South Wales
Newcastle/UNE 0 1 1 5.9Notre Dame Sydney 0 0 0 0Sydney 2 1 3 17.6UNSW 2 3 5 29.4UWS 2 0 2 11.8Wollongong 0 0 0 0Total NSW 6 5 11 64.7
VictoriaDeakin 0 0 0 0Melbourne MD 0 1 1 5.9Monash PG 1 0 1 5.9Monash UG 0 0 0 0Total VIC 1 1 2 11.8
QueenslandBond 0 0 0 0Griffith 0 0 0 0Queensland 1 0 1 5.9James Cook 1 0 1 5.9Total QLD 2 0 2 11.8
Western AustraliaNotre Dame WA 0 0 0 0UWA MD 0 0 0 0UWA PG 0 0 0 0UWA UG 0 0 0 0Total WA 0 0 0 0
South AustraliaAdelaide 0 0 0 0Flinders 0 0 0 0Total SA 0 0 0 0
TasmaniaTasmania 0 1 1 5.9
Australian Capital TerritoryANU 0 1 1 5.9Total 9 8 17 100.0
UG – undergraduate PG - postgraduate MD – Doctor of Medicine
(a) Excludes all offshore programs, including UQ Ochsner and Monash Malaysia.
Source: Medical Deans Australia and New Zealand Inc
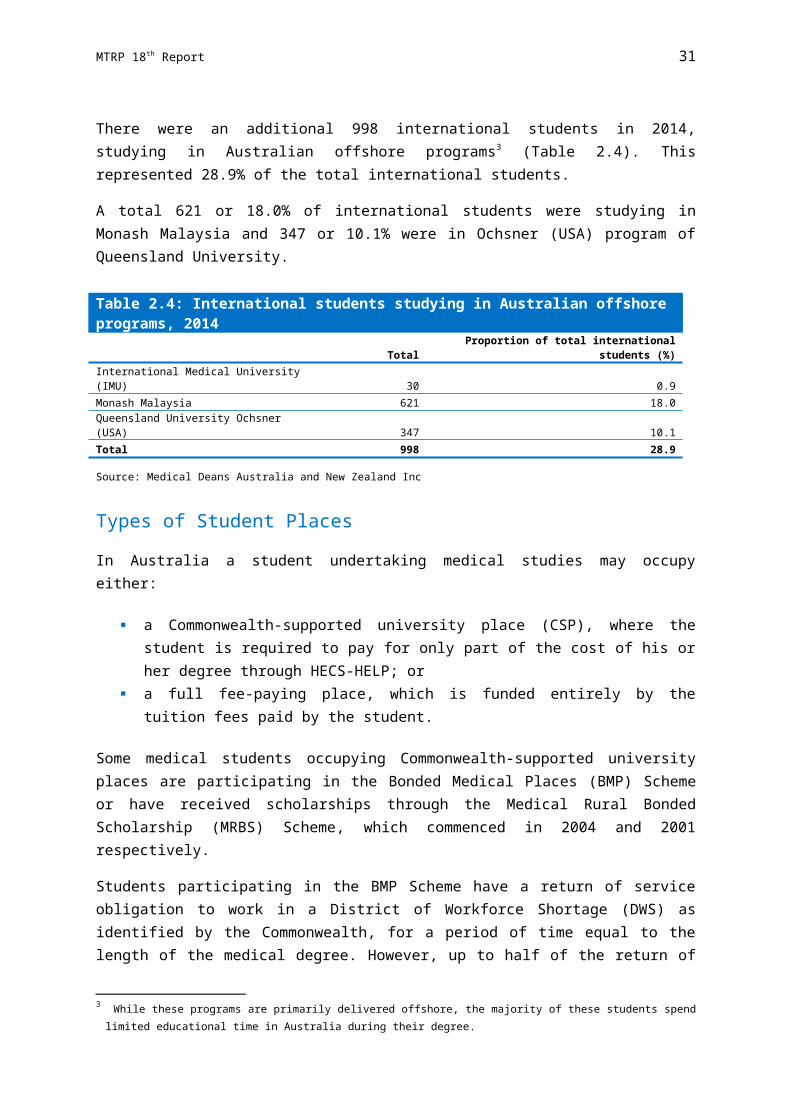
MTRP 18th Report 37
The attrition numbers and proportions over the period 2008-2013 have been variable (Table 2.20). A higher proportion of commencing domestic students (over 70%) have discontinued their degree compared with commencing international students. The gender breakdown has also been variable.
Table 2.20: Commencing medical students: Attrition(a) rates, 2008-2013
2008 2009 2010 2011 2012 2013
Change 2008-2013
(%)
Domestic 75 53 70 63 84 48 -36.0 Proportion domestic (%) 78.1 71.6 78.7 70.8 83.2 73.8 -5.5 Proportion female (%) 54.7 64.2 48.6 42.9 53.6 52.1 -4.8
International 21 21 19 26 17 17 -19.0 Proportion international (%) 21.9 28.4 21.3 29.2 16.8 26.2 19.6 Proportion female (%) 42.9 52.4 36.8 42.3 29.4 47.1 9.7
Total 96 74 89 89 101 65 -32.3
Annual change -22 15 0 12 -36Annual change (%) -22.9 20.3 0 13.5 -35.6
(a) Attrition rates report on the number of students that have permanently ceased candidature in a medical degree. This does not include students who have deferred study or transferred to other medical schools.
Source: Medical Deans Australia and New Zealand Inc
Attrition rates for medical courses are anticipated to be relatively low when compared to other courses and this is relevant to numbers of both commencing and continuing students. However, the highest attrition from a medical course occurs at the period of commencing studies.
The next set of tables provides information about attrition rates for continuing students. A continuing student is a student enrolled in any year of a medical program other than commencing.
In 2013, 65 of 11,199 (0.58%) continuing domestic students (27 male and 38 female students) discontinued their medical degree beyond the commencing period (Table 2.21).

MTRP 18th Report 38
Table 2.21: Continuing domestic medical students: Attrition rates, 2013
University Male Female Total
Proportion of total continuing domestic students who ceased candidature (%)
New South WalesNewcastle/UNE 1 5 6 9.2Notre Dame Sydney 0 0 0 0Sydney 3 6 9 13.8UNSW 6 3 9 13.8UWS 1 5 6 9.2Wollongong 0 0 0 0Total NSW 11 19 30 46.2
VictoriaDeakin 1 2 3 4.6Melbourne MD 0 0 0 0Melbourne UG 2 0 2 3.1Monash PG 0 0 0 0Monash UG 0 0 0 0Total VIC 3 2 5 7.7
QueenslandBond 0 1 1 1.5Griffith 2 0 2 3.1Queensland 3 1 4 6.2James Cook 5 7 12 18.5Total QLD 10 9 19 29.2
Western AustraliaNotre Dame WA 0 2 2 3.1UWA MD 0 0 0 0UWA PG 0 2 2 3.1UWA UG 0 0 0 0Total WA 0 4 4 6.2
South AustraliaAdelaide 2 3 5 7.7Flinders 1 0 1 1.5Total SA 3 3 6 9.2
TasmaniaTasmania 0 1 1 1.5
Australian Capital TerritoryANU 0 0 0 0Total 27 38 65 100.0
UG – undergraduate PG - postgraduate MD – Doctor of Medicine
Source: Medical Deans Australia and New Zealand Inc
In comparison to domestic students, 26 of 1,901 (1.4%) continuing international students (19 male and 7 female students) discontinued their medical degree beyond the commencing period in 2013 (Table 2.22).

MTRP 18th Report 39
Table 2.22: Continuing international(a) medical students: Attrition rates, 2013
University Male Female Total
Proportion of total continuing international students who
ceasedcandidature (%)
New South WalesNewcastle/UNE 1 0 1 3.8Notre Dame Sydney 0 0 0 0Sydney 1 1 2 7.7UNSW 4 0 4 15.4UWS 2 3 5 19.2Wollongong 1 0 1 3.8Total NSW 9 4 13 50.0
VictoriaDeakin 0 0 0 0Melbourne MD 0 0 0 0Monash PG 0 0 0 0Monash UG 0 1 1 3.8Total VIC 0 1 1 3.8
QueenslandBond 0 0 0 0Griffith 0 0 0 0Queensland 4 1 5 19.2James Cook 2 0 2 7.7Total QLD 6 1 7 26.9
Western AustraliaNotre Dame WA 0 0 0 0UWA MD 0 0 0 0UWA PG 0 0 0 0UWA UG 3 0 3 11.5Total WA 3 0 3 11.5
South AustraliaAdelaide 1 1 2 7.7Flinders 0 0 0 0Total SA 1 1 2 7.7
TasmaniaTasmania 0 0 0 0
Australian Capital TerritoryANU 0 0 0 0Total 19 7 26 100.0
UG – undergraduate PG - postgraduate MD – Doctor of Medicine
(a) Excludes all offshore programs, including UQ Ochsner and Monash Malaysia.
Source: Medical Deans Australia and New Zealand Inc
The attrition numbers and proportions of continuing medical students over the period2008-2013 have also been variable (Table 2.23). A higher proportion of continuing domestic students have discontinued their degree compared with continuing international students. The gender breakdown has also been variable.
Table 2.23: Continuing(a) medical students: Attrition(b) rates, 2008-2013

MTRP 18th Report 40
University 2008 2009 2010 2011 2012 2013
Change 2008-
2013 (%)
Domestic 75 82 75 81 110 65 -13.3 Proportion domestic (%) 87.2 77.4 80.6 77.1 79.7 71.4 -18.1 Proportion female (%) 50.7 48.8 54.7 64.2 50.0 58.5 15.4
International 11 24 18 24 28 26 136.4 Proportion international (%) 12.8 22.6 19.4 22.9 20.3 28.6 123.4 Proportion female (%) 36.4 50.0 38.9 33.3 50.0 26.9 -26.1
Total 86 106 93 105 138 91 5.8
Annual change 20 -13 12 33 -47
Annual change (%) 23.3 -12.3 12.9 31.4 -34.1
(a) Continuing student is a student enrolled in any year of a medical program other than commencing.(b) Attrition rates report on the number of students that have permanently ceased candidature in a medical degree. This
does not include students who have deferred study or transferred to other medical schools.
Source: Medical Deans Australia and New Zealand Inc
Trends
The number of commencing medical students increased from 2010 to 2011 (301 more commencements in 2011 compared to 2010), but decreased in both 2012 (by 84 students) and 2013 (by 17 students). It slightly increased again in 2014 by 68 students (1.9%).
However, overall the number of commencing medical students has remained relatively steady over the last five years, increasing by only 7.7%, from 3,469 in 2010 to 3,737 in 2014 (Table 2.24).
Over the same five year period, the number of domestic commencing students increased by 245 students or 8.3%, while the number of international commencing students increased by only 23 students or 4.3%.
The proportion of female domestic students commencing medical studies remained relatively stable over the last five years – around half the number of all commencing medical students were females. However, the proportion of female international students tended to be slightly less than half of all commencing international students, except 2014 where the number was similar.

MTRP 18th Report 41
Table 2.24: Commencing medical students: Domestic, international and proportion of females(a), 2010-2014
2010 2011 2012 2013 2014Domestic 2,940 3,241 3,035 3,033 3,185 Proportion female (%) 52.9 50.9 48.1 51.2 52.3International(b),(c) 529 529 651 636 552 Proportion female (%) 42.5 47.6 47.5 45.6 50.4Total 3,469 3,770 3,686 3,669 3,737Annual change 301 -84 -17 68Annual change (%) 8.7 -2.2 -0.5 1.9
(a) Based on the commencing year of the medical program.(b) International students are those studying onshore in Australia as private or sponsored students who are not Australian or
New Zealand citizens, or permanent residents.(c) Excludes all offshore programs, including UQ Ochsner and Monash Malaysia.
Source: Medical Deans Australia and New Zealand Inc
Projections suggest that 3,719 medical students will commence their studies in Australian universities in 2015 (Table 2.25). Of these, 3,150 (84.7%) are expected to be domestic students and 569 (15.3%) international students. This is slightly less (by 18 students or-0.5%) than the actual number of students who commenced medical studies in 2014.
Table 2.25: Commencing medical student projections(a), 2015
University Domestic International(b) TotalAdelaide 116 34 150ANU 90 4 94Bond 95 - 95Deakin 135 12 147Flinders 135 30 165Griffith 150 10 160James Cook 165 30 195Melbourne 295 40 335Monash 325 65 390Newcastle/UNE 170 24 194Notre Dame Sydney 120 - 120Notre Dame Fremantle 110 - 110Queensland 320 90 410Sydney 228 80 308Tasmania 100 20 120UNSW 208 68 276UWA 209 30 239UWS 105 20 125Wollongong 74 12 86Total 3,150 569 3,719
(a) These numbers are projections only and are subject to change.(b) Excludes all offshore programs, including UQ Ochsner and Monash Malaysia.
Source: Medical Deans Australia and New Zealand Inc
Between 2010 and 2014, there was an increase of 1,440 students (9.4%) of the total number of medical students studying in Australian universities (Table 2.26). Over the same period,

MTRP 18th Report 42
the number of domestic students increased proportionally more than the number of international students, rising by 11.1% to 14,384 students. The number of international students has increased by only 0.1% to 2,453.
Table 2.26: Medical students: Domestic, international and proportion of females(a), 2010-2014
2010 2011 2012 2013 2014Domestic 12,946 13,956 14,177 14,267 14,384 Proportion female (%) 54.2 53.0 51.5 51.2 51.3 Annual change (%) 7.0 7.8 1.6 0.6 0.8International(b),(c),(d) 2,451 2,535 2,691 2,727 2,453 Proportion female (%) 50.1 49.1 48.7 47.3 48.8 Annual change (%) 1.1 3.4 6.2 1.3 -10.0Total 15,397 16,491 16,868 16,994 16,837Annual change 1,094 377 126 -157Annual change (%) 7.1 2.3 0.7 -0.9
(a) Data cover all years of study.(b) International students are those studying as private or sponsored students who are not Australian or New Zealand
citizens or permanent residents.(c) From 2009 - 2013 data include the UQ Ochsner cohort.(d) From 2014 data exclude all offshore programs, including UQ Ochsner and Monash Malaysia.
Source: Medical Deans Australia and New Zealand Inc
Medical Graduates
Current Data
In 2013, a total of 3,441 students graduated from Australian medical schools. Of these, 2,944 or 85.6% were domestic students (Table 2.27).
Trends
Each year the number of domestic medical graduates has increased. The increase was 6.0% from 2012 to 2013 and there was an overall increase of 53.7% in domestic graduates across the last five years from 2009 to 2013 (Table 2.29).
From 2009 to 2013 the number of domestic medical graduates increased in each state and territory. The greatest increases were in New South Wales and Victoria by 90.4% and 85.4% respectively (Table 2.27).

MTRP 18th Report 43
Table 2.27: Domestic medical school graduates in Australian universities, by state/territory, 2009-2013
University 2009 2010 2011 2012 2013Change
2009-2013
Change 2009-2013
(%)New South Wales
Newcastle/UNE 85 104 70 140 147 62 72.9Notre Dame Sydney .. .. 103 106 107 .. ..Sydney 208 221 222 237 231 23 11.1UNSW 163 166 187 198 203 40 24.5UWS .. .. 86 91 108 .. ..Wollongong .. 63 67 66 72 .. ..Total NSW 456 554 735 838 868 412 90.4
VictoriaDeakin .. .. 109 123 136 .. ..Melbourne 198 212 234 231 240 42 21.2Monash 165 181 219 290 297 132 80.0Total VIC 363 393 562 644 673 310 85.4
QueenslandBond 55 74 81 69 85 30 54.5Griffith 116 151 133 150 144 28 24.1Queensland 279 332 290 307 314 35 12.5James Cook 82 94 88 92 136 54 65.9Total QLD 532 651 592 618 679 147 27.6
Western AustraliaNotre Dame Fremantle 80 86 98 104 114 34 42.5UWA 182 207 172 165 183 1 0.5Total WA 262 293 270 269 297 35 13.4
South AustraliaAdelaide 83 94 97 111 127 44 53.0Flinders 74 102 109 113 111 37 50.0Total SA 157 196 206 224 238 81 51.6
TasmaniaTasmania 73 89 67 97 104 31 42.5
Australian Capital TerritoryANU 72 83 75 87 85 13 18.1Total 1,915 2,259 2,507 2,777 2,944 1,029 53.7
Annual change 344 248 270 167
Annual change (%) 18.0 11.0 10.8 6.0
Source: Medical Deans Australia and New Zealand Inc
The number of international students graduating from Australian medical schools fluctuated over the period 2009-2013 with an overall increase of 32 graduates or 6.9% (Table 2.28).
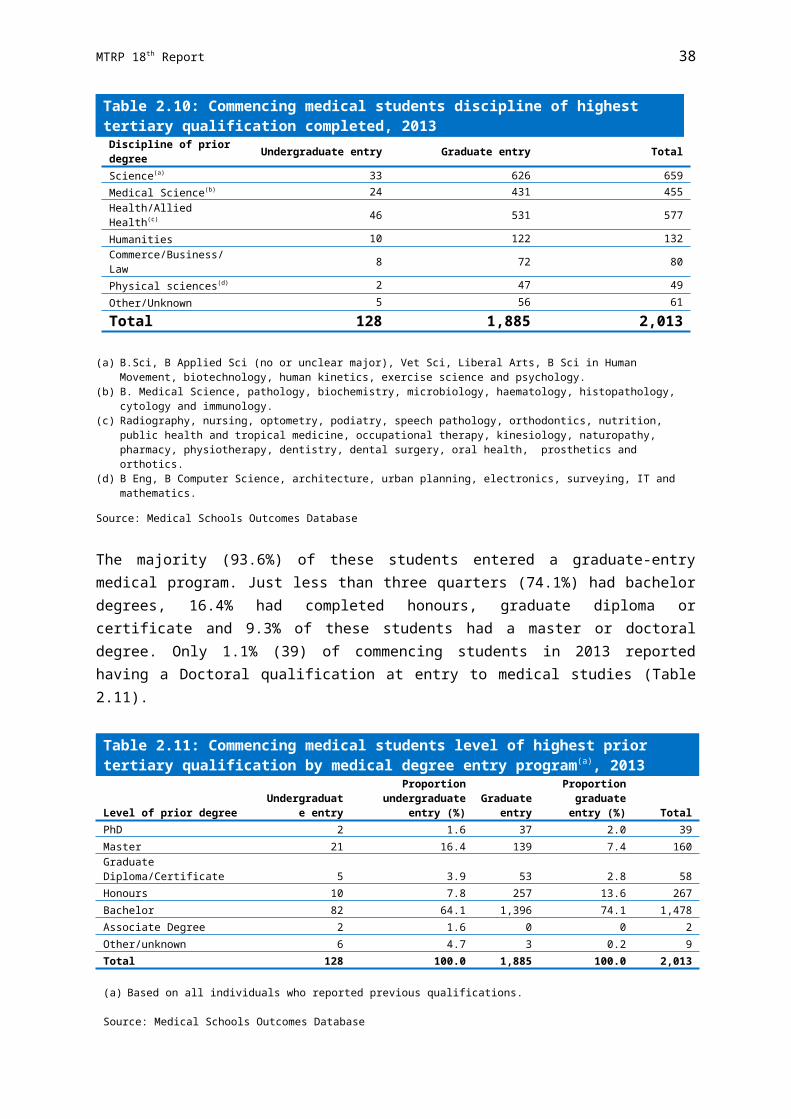
MTRP 18th Report 44
Table 2.28: International(a) medical school graduates in Australian universities by state/territory, 2009-2013
University 2009 2010 2011 2012 2013Change
2009-2013
Change2009-2013
(%)New South Wales
Newcastle/UNE 21 21 20 29 23 2 9.5Notre Dame Sydney .. .. .. .. 0 .. ..Sydney 54 35 32 38 48 -6 -11.1UNSW 36 55 36 46 58 22 61.1UWS .. .. .. 9 7 .. ..Wollongong .. 4 10 11 8 .. ..Total NSW 111 115 98 133 144 33 29.7
VictoriaDeakin .. .. 0 1 4 .. ..Melbourne 97 90 89 83 86 -11 -11.3Monash 74 94 70 67 62 -12 -16.2Total VIC 171 184 159 151 152 -19 -11.1
QueenslandBond 4 1 1 1 2 -2 -50.0Griffith 2 0 0 .. 0 -2 -100.0Queensland 67 77 98 130 114 47 70.1James Cook 2 3 2 3 2 0 0Total QLD 75 81 101 134 118 43 57.3
Western AustraliaNotre Dame Fremantle 0 0 0 0 0 .. ..UWA 15 25 27 21 28 13 86.7Total WA 15 25 27 21 28 13 86.7
South AustraliaAdelaide 38 40 21 24 24 -14 -36.8Flinders 28 14 19 19 11 -17 -60.7Total SA 66 54 40 43 35 -31 -47.0
TasmaniaTasmania 21 11 28 16 12 -9 -42.9
Australian Capital TerritoryANU 6 4 4 9 8 2 33.3Total 465 474 457 507 497 32 6.9
(a) Excludes all offshore programs, including UQ Ochsner and Monash Malaysia.
Source: Medical Deans Australia and New Zealand Inc
Table 2.29 shows that approximately half of all medical graduates, both domestic and international, were females (52.8% for domestic and 49.1% for international in 2013).

MTRP 18th Report 45
Table 2.29: Medical graduates: Domestic, international and proportions of females, 2009-2013
2009 2010 2011 2012 2013
Change 2009-2013
(%)Domestic 1,915 2,259 2,507 2,777 2,944 53.7 Proportion domestic (%) 80.5 82.7 84.6 84.6 85.6 6.3 Proportion female (%) 54.1 54.1 55.0 53.2 52.8 -2.4International(a) 465 474 457 507 497 6.9 Proportion international (%) 19.5 17.3 15.4 15.4 14.4 -26.1 Proportion female (%) 51.6 54.2 51.6 52.9 49.1 -4.8Total 2,380 2,733 2,964 3,284 3,441 44.6
Annual increase (%) 14.8 8.5 10.8 4.8
(a) Excludes all offshore programs, including UQ Ochsner and Monash Malaysia.
Source: Medical Deans Australia and New Zealand Inc
In 2013, 80.4% of medical graduates were Commonwealth-supported (Table 2.30)
Table 2.30: Medical graduates by type of student place: Number and proportion of places, 2012-2013
2012 2013Change
2012-2013
Change 2012-2013
(%)Medical Graduates
Commonwealth-supported 2,612 2,765 153 5.9 HECS-HELP only 1,879 1,931 52 2.8 BMP Scheme 633 733 100 15.8 MRBS Scheme 100 101 1 1.0Fee-paying 663 667 4 0.6 Domestic 156 170 14 9.0 International(a) 507 497 -10 -2.0Other 9 9 0 0Total 3,284 3,441 157 4.8
Proportion of places (%)Commonwealth-supported 79.5 80.4 HECS-HELP only 57.2 56.1
BMP Scheme 19.3 21.3
MRBS Scheme 3.0 2.9
Fee-paying 20.2 19.4 Domestic 4.8 4.9
International 15.4 14.4
Other 0.3 0.3(a) Excludes all offshore programs, including UQ Ochsner and Monash Malaysia.
Source: Medical Deans Australia and New Zealand Inc

MTRP 18th Report 46
Projected Numbers of Graduates
Table 2.31 shows the projected number of domestic medical graduates up until 2019. These figures are based on current and planned enrolments as of 2014. Attrition has not been factored into these figures.
The number of domestic medical graduates is projected to rise from 3,056 in 2014 to 3,173 in 2019. This is an overall increase of 3.8% over the five years from 2014 to 2019.

MTRP 18th Report 47
Table 2.31: Domestic medical students expected to graduate from Australian universities: Projected numbers(a) by state/territory, 2014-2019University 2014 2015 2016 2017 2018 2019
New South WalesNewcastle/UNE 174 187 176 186 173 170Notre Dame Sydney 109 112 121 120 120 120Sydney 264 221 226 229 228 228UNSW 227 233 203 199 235 214UWS 107 109 103 100 108 105Wollongong 74 76 73 80 74 74Total NSW 955 938 902 914 938 911
VictoriaDeakin 134 132 131 129 135 135Melbourne MD 292 285 293 302 295 295Melbourne PG 0 0 0 0 0 0Melbourne UG 6 8 3 0 0 0Monash PG 65 83 77 76 75 75Monash UG 188 255 248 265 242 250Total VIC 685 763 752 772 747 755
QueenslandBond 82 79 95 92 94 95Griffith 142 147 148 150 150 150Queensland 335 315 328 306 320 320James Cook 141 164 155 174 184 182Total QLD 700 705 726 722 748 747
Western AustraliaNotre Dame Fremantle 108 89 108 113 110 110UWA PG 53 67 43 0 0 0UWA UG 130 151 136 0 0 0UWA MD 0 0 0 210 209 209Total WA 291 307 287 323 319 319
South AustraliaAdelaide 138 156 164 172 120 116Flinders 113 131 142 152 135 135Total SA 251 287 306 324 255 251
TasmaniaTasmania 86 86 79 100 99 100
Australian Capital TerritoryANU 88 81 97 90 90 90Total 3,056 3,167 3,149 3,245 3,196 3,173
UG - undergraduate PG - postgraduate MD – Doctor of Medicine
(a) No allowance has been made for student attrition.
Source: Medical Deans Australia and New Zealand Inc
The projected numbers of international students to graduate from Australian universities are also expected to increase, rising by 19.7% from 493 in 2014 to 590 in 2019 (Table 2.32).
Table 2.32: International(a) medical students expected to graduate from Australian universities: Projected numbers(b) by state/territory, 2014-2019University 2014 2015 2016 2017 2018 2019
New South Wales

MTRP 18th Report 48
Table 2.32: International(a) medical students expected to graduate from Australian universities: Projected numbers(b) by state/territory, 2014-2019University 2014 2015 2016 2017 2018 2019Newcastle/UNE 32 33 26 27 21 24Notre Dame Sydney 0 0 0 0 0 0Sydney 51 76 67 69 80 80UNSW 58 57 70 57 62 81UWS 23 14 20 20 19 20Wollongong 6 9 9 5 12 12Total NSW 170 189 192 178 194 217
VictoriaDeakin 2 6 5 5 12 12Melbourne MD 21 34 33 45 40 40Melbourne PG 0 0 0 0 0 0Melbourne UG 0 0 1 0 0 0Monash PG 15 5 8 5 5 5Monash UG 48 49 63 53 68 60Total VIC 86 94 110 108 125 117
QueenslandBond 2 2 0 0 0 0Griffith 1 6 4 3 10 10Queensland 100 120 110 107 90 90James Cook 21 27 15 21 35 32Total QLD 124 155 129 131 135 132
Western AustraliaNotre Dame Fremantle 0 0 0 0 0 0UWA PG 0 0 9 0 0 0UWA UG 30 31 30 0 0 0UWA MD 0 0 0 23 30 30Total WA 30 31 39 23 30 30
South AustraliaAdelaide 29 27 21 25 31 34Flinders 18 20 25 14 30 30Total SA 47 47 46 39 61 64
TasmaniaTasmania 27 22 25 20 18 20
Australian Capital TerritoryANU 9 7 1 3 10 10Total 493 545 542 502 573 590
UG - undergraduate PG - postgraduate MD – Doctor of Medicine
(a) Excludes all offshore programs, including UQ Ochsner and Monash Malaysia.(b) No allowance has been made for student attrition.
Source: Medical Deans Australia and New Zealand Inc
Table 2.33 summarises the number of domestic and international students projected to graduate from Australian universities between 2014 and 2019.
In total, 3,763 medical students are expected to graduate in 2019, 6.0% more than predicted for 2014. This is 9.4% higher than the actual number of medical students who graduated in 2013 (3,441) and 58.1% higher than the 2,380 medical students who graduated in 2009.

MTRP 18th Report 49
Table 2.33: Medical students expected to graduate from Australian universities: Projected number of domestic and international students(a), 2014-2019
2014 2015 2016 2017 2018 2019
Change 2014-2019
(%)
Domestic 3,056 3,167 3,149 3,245 3,196 3,173 3.8International(b) 493 545 542 502 573 590 19.7Total 3,549 3,712 3,691 3,747 3,769 3,763 6.0
Change from previous year 163 -21 56 22 -6
Change from previous year (%) 4.6 -0.6 1.5 0.6 -0.2
(a) Attrition has not been factored into the numbers provided.(b) Excludes all offshore programs, including UQ Ochsner and Monash Malaysia.
Source: Medical Deans Australia and New Zealand Inc

MTRP 18th Report 50
Chapter 3
PREVOCATIONAL MEDICAL TRAININGThis chapter details the number of junior doctors undertaking postgraduate prevocational training across Australia. Data have been provided by state and territory health departments through their postgraduate medical councils and the Australian Government Department of Health, and covers training activities up to June 2014.
BackgroundMedical graduates of Australian universities are predominantly employed through public health services and enter the medical workforce as interns or postgraduate year 1 (PGY1) doctors. Junior doctors are required to satisfactorily complete an intern year before being granted general medical registration. All medical practitioners, including junior doctors, are registered through a single national board, the Medical Board of Australia (MBA).
In order to satisfy MBA registration requirements, interns undertake a series of rotations to enable them to experience a range of clinical situations and service environments. These rotations must be accredited in accordance with guidelines developed by the state and territory postgraduate medical councils or medical education and training units. These placements must ensure adequate case-mix, service, teaching, supervision and assessment.
Most junior doctors work for at least one, and often for two or more years after their intern year, in the public hospital system and community health services, to gain more clinical experience with greater levels of responsibility prior to commencing a vocational training program. An important goal of this experience is to consolidate the clinical skills developed during university training and the intern year, and to equip junior doctors with the prerequisite experience and procedural skills for entry into specialist or vocational training programs.
Generally, training at the prevocational level involves rotating between clinical departments in regional and urban public hospitals with some rotation from urban hospitals to regional and rural hospitals and community settings, including general practice. These rotations are intended to give junior doctors experience of a broader range of clinical settings, and meet service delivery needs.
Although a number of specialist medical colleges may accept entrants to vocational training programs directly following completion of postgraduate year 1, most prefer applicants to have completed a second or even third year of prevocational training (PGY2 and PGY3). Doctors in this period of prevocational on-the-job training are usually referred to as ‘Resident Medical Officers’ (RMOs). The term ‘Hospital Medical Officer’ (HMO) is used in Victoria and the term ‘Trainee Medical Officer’ (TMO) in South Australia.
Not all PGY2 and PGY3 doctors will enter vocational specialist training. This is because some are waiting for a place in their selected vocational training specialty, but others will leave the medical workforce, pursue a research career, choose to work as locums or

MTRP 18th Report 51
continue to work in hospital settings in a non-vocational career role, typically as Career Medical Officers (CMOs). Most CMOs work in hospital settings, and a number of CMOs acquire other postgraduate qualifications related to their roles, such as early management of severe trauma, advanced paediatric life support or emergency life support.
When interpreting and analysing these prevocational data, caution is needed. This is because the numbers presented are sometimes estimates, with administration systems often not capturing data in a way that matches the breakdown of information for MTRP reporting purposes. Consequently, the number of trainees, particularly PGY2 doctors, is an underestimate. Also, some states and territories have different prevocational training processes. For instance, in New South Wales, trainees are employed on two year contracts covering both PGY1 and PGY2 training. As a result, the number of PGY2 positions advertised each year and offered does not reflect the total number of PGY2 positions available.
Attempts to capture all training and supervisory activities have continued this year through broadening the specifications, to include supervision and additional training of overseas trained doctors as necessary for recognition of their qualifications within Australia. The degree to which state and territory administration systems have been able to accurately capture this information is unknown.
Postgraduate Year 1
Current Data
In 2014, there were 3,287 trainees commencing PGY1. Of these, over half (51.4%) were females (Table 3.1).
Just over eighty percent (2,651 or 80.7%) of all PGY1 trainees commenced training in the state or territory in which they completed their medical degree. A further 274 trainees (8.3%) were trained in Australia, but commenced their PGY1 training in another state or territory.
International students who graduated from an Australian medical school occupied 277 (8.4%) of the PGY1 positions. The number of PGY1 positions in each state and territory approximately matched the distribution of the population as a whole.
The Commonwealth provided funding for additional medical internship positions in 2014 through the Commonwealth Medical Internships (CMI) initiative. As domestic medical students are guaranteed an internship by states and territories under a 2006 Council of Australian Governments agreement, CMI positions are only available to eligible international full-fee paying medical graduates who completed all of their medical degree in Australia (except for university approved rotations offshore).

MTRP 18th Report 52
Table 3.1: Commencing postgraduate year 1 trainees or supervised training positions: Total, females and proportion of females by doctor category and state/territory, 2014
NSW VIC(a) QLD SA WA TAS NT ACT AUSAll commencing PGY1 trainees
Australian trained local (own state) 812 649 603 201 262 54 0 70 2,651 - Commonwealth-supported 757 na 537 198 262 50 0 70 1,874 - Full-fee paying 55 na 66 3 0 4 0 0 128Australian trained local (interstate) 90 25 56 36 12 5 36 14 274 - Commonwealth-supported 79 na na 29 12 3 0 14 137 - Full-fee paying 11 na na 7 0 2 0 0 20New Zealand medical graduates 2 0 1 0 0 0 0 0 3International students who graduated from an Australian medical school 53 79 34 41 38 12 8 12 277 - Own state 53 (c)78 33 29 25 0 0 8 226 - Interstate 0 1 1 12 13 12 0 4 43Australian Medical Council graduates 0 0 1 0 0 5 0 0 6Total state/territory funded trainees 957 753 695 278 312 76 44 96 3,211Eligible international students who graduated from an onshore Australian medical school and were placed by the Commonwealth(b) .. .. 61 .. 15 .. .. .. 76Total 957 753 756 278 327 76 44 96 3,287Proportion of total trainees (%) 29.1 22.9 23.0 8.5 9.9 2.3 1.3 2.9 100.0
FemalesAustralian trained local (own state) 423 361 294 106 149 29 0 40 1,402 - Commonwealth-supported 402 na 255 106 149 26 0 40 978 - Full-fee paying 21 na 39 0 0 3 0 0 63Australian trained local (interstate) 36 10 36 16 10 4 23 10 145 - Commonwealth-supported 32 na na 12 10 3 0 10 67 - Full-fee paying 4 na na 4 0 1 0 0 9New Zealand medical graduates 0 0 0 0 0 0 0 0 0International students who graduated from an Australian medical school 28 42 19 21 17 5 4 3 139 - Own state 28 (d)42 19 13 10 0 0 0 112 - Interstate 0 0 0 8 7 5 4 3 27Australian Medical Council graduates 0 0 1 0 0 4 0 0 5Total state/territory funded trainees 487 413 350 143 176 42 27 53 1,691Eligible international students who graduated from an onshore Australian medical school and were placed by the Commonwealth(b) .. .. na .. na .. .. .. naTotal 487 413 350 143 176 42 27 53 1,691
Proportion females (%)
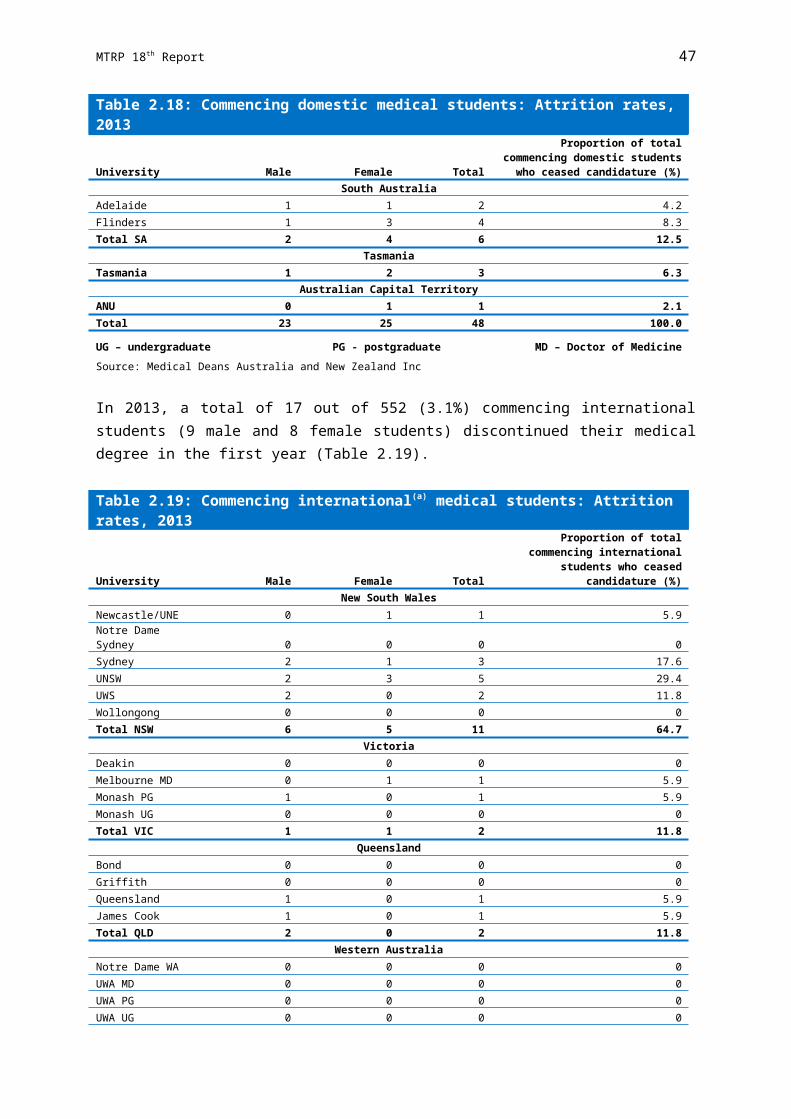
MTRP 18th Report 53
NSW VIC(a) QLD SA WA TAS NT ACT AUSAustralian trained local (own state) 52.1 55.6 48.8 52.7 56.9 53.7 0 57.1 52.9 - Commonwealth-supported 53.1 na 47.5 53.5 56.9 52.0 0 57.1 52.2 - Full-fee paying 38.2 na 59.1 na 0 75.0 0 0 49.2Australian trained local (interstate) 40.0 40.0 64.3 44.4 83.3 80.0 63.9 71.4 52.9 - Commonwealth-supported 40.5 na 0 41.4 83.3 100.0 0 71.4 48.9 - Full-fee paying 36.4 na 0 57.1 0 50.0 0 0 45.0New Zealand medical graduates 0 0 0 na 0 0 0 0 0International students who graduated from an Australian medical school 52.8 53.2 55.9 51.2 44.7 41.7 50.0 25.0 50.2 - Own state 52.8 53.8 57.6 44.8 40.0 0 0 0 49.6 - Interstate 0 0 0 66.7 53.8 41.7 0 75.0 62.8Australian Medical Council graduates 0 0 100.0 na 0 80.0 0 0 83.3Total state/territory funded trainees 50.9 54.8 50.4 51.4 56.4 55.3 61.4 55.2 52.7Eligible international students who graduated from an onshore Australian medical school and were placed by the Commonwealth(b) .. .. na .. na .. .. .. naTotal 50.9 54.8 46.3 51.4 53.8 55.3 61.4 55.2 51.4
(a) Victoria does not collect data regarding the fee status of domestic students studying in Victoria or interstate.(b) Includes PGY1 positions funded by the Commonwealth Government under the Commonwealth Medical Internships Initiative 2014.(c) Includes 10 graduates of an Australian Medical Council Accredited Overseas University (Monash Malaysia).(d) Includes 6 female graduates of an Australian Medical Council Accredited Overseas University (Monash Malaysia).
Source: Australian Government Department of Health and state and territory government health departments
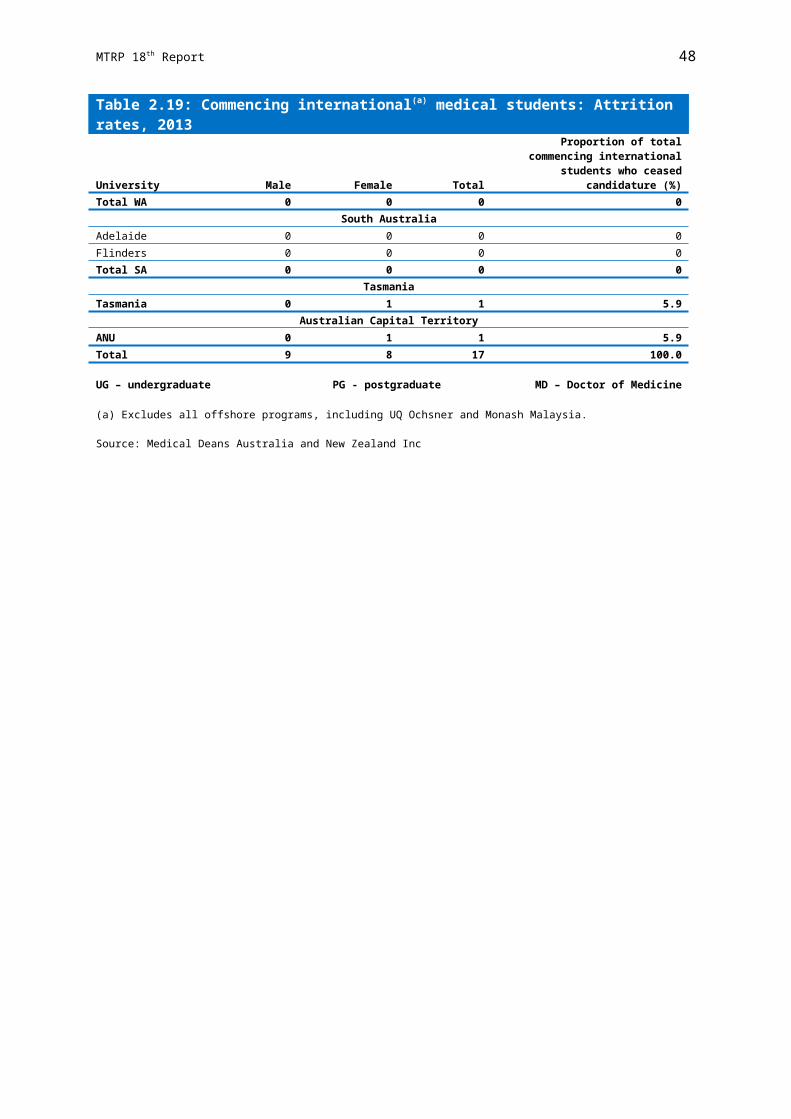
MTRP 18th Report 54
Internship in Rural Location
Rural areas are classified as RA2 to RA5 under the Australian Standard Geographical Classification – Remoteness Areas (ASGC-RA) system.
In 2014, there were 666 rural intern positions (Table 3.2) where PGY1 trainees could undertake the majority of their internship in a rural location. The largest number of positions was 260 in Queensland, followed by Victoria (143) and New South Wales (131).
There were 617 PGY1 trainees undertaking a rural internship - a type of internship when all or majority of it is undertaken in an RA2-RA5 hospital.
In addition to unfilled Rural Preferential Recruitment positions being filled by interns on rotation, in 2014 there were 157 rotational positions in rural hospitals in Australia. The highest number of rural based intern positions filled on rotation by PGY1 trainees from a metropolitan hospital was in Victoria (83), followed by Western Australia (33).
Table 3.2: Commencing postgraduate year 1 trainees or supervised training positions (RA2-RA5)(a) by state/territory, 2014
NSW VIC QLD SA WA TAS NT ACT AUSRural intern positions where postgraduate year 1 trainees can undertake majority of their internship in a rural location (d)131 143 260 6 6 76 44 .. 666Postgraduate year 1 trainees undertaking rural internship (RA2-RA5)(b) (e)82 143 260 6 6 76 44 .. 617Rotational positions (RA2-RA5)(c) (f)17 83 na 19 33 0 na (g)5 157
(a) Rural area classified as RA2 to RA5 under the Australian Standard Geographical Classification - Remoteness Areas (ASGC-RA) system.
(b) Rural internship is a type of internship when all or majority of it is undertaken in an RA2-RA5 hospital.(c) Rotational positions are the rural based intern positions that are filled on rotation by doctors from a metropolitan
hospital.(d) These positions are recruited to Rural Hospitals via the Rural Preferential Recruitment (RPR) Pathway. Maitland and
Tweed Heads Hospitals have RA1 classification but are part of RPR.(e) Number of rural hospital positions filled via RPR pathway. The remaining 32 unfilled RPR positions were filled using
trainees in the network from metropolitan hospitals on rotation to rural hospitals.(f) Rotational positions in rural hospitals are in addition to unfilled RPR positions being filled by interns on rotation.(g) These rotational positions were NSW funded positions in NSW hospitals filled by ACT PGY1 trainees.
Source: State and territory government health departments
Trends
The number of PGY1 commencements continued to increase, with 893 additional interns (37.3% increase) commencing their training in 2014 compared with 2010 (Table 3.3).
The increase in number of trainees commencing their first year of prevocational training appear to be considerably greater in some jurisdictions over the period of 2010 to 2014, in particular the Australian Capital Territory and New South Wales with 54.8% and 45.7% increase in numbers respectively.

MTRP 18th Report 55
Table 3.3: Commencing postgraduate year 1 trainees by state/territory, 2010-2014
2010 2011 2012 2013 2014
Change2010-2014
(%)New South Wales 657 756 (c)849 (d)923 (e)957 45.7Victoria 557 625 698 707 753 35.2Queensland (b)558 (b)644 (b)663 678 695 24.6South Australia 230 247 256 276 278 20.9Western Australia 240 267 282 300 312 30.0Tasmania 58 71 73 75 76 31.0Northern Territory 32 35 41 44 44 37.5Australian Capital Territory 62 78 88 93 96 54.8Commonwealth Funded(a) .. .. .. 22 76 ..Australia 2,394 2,723 2,950 3,118 3,287 37.3Change from previous year (%) 13.7 8.3 5.7 5.4
(a) Includes PGY1 positions funded by the Commonwealth Government under the Additional Medical Internships Initiative 2013 and Commonwealth Medical Internships Initiative 2014.
(b) Approximate numbers only based on acceptances registered in eRecruitment system.(c) Total number of intern positions available for 2012 was 850.(d) Total number of intern positions available for 2013 was 927.(e) Total number of intern positions available for 2014 was 959.
Source: Australian Government Department of Health and state and territory government health departments
Postgraduate Year 2
Current Data
There were 3,107 doctors in postgraduate year 2 (PGY2) training positions in 2014. Over half of these (53.8%) were females. Data on the doctors commencing PGY2 training are provided in Table 3.4.
Just over three quarters (75.4%) of doctors commenced their second year of prevocational medical training in the state or territory in which they were trained previously, compared with 11.3% from interstate.
International students who completed their medical degree in Australia occupied 237 or 7.6% of all PGY2 positions and a further 109 or 3.5% of positions were occupied by Australian Medical Council certificate holders.
Comparison cannot be reliably made across the states and territories due to unique inclusions and limitations on the data that can be extracted from the various systems.

MTRP 18th Report 56
Table 3.4: Commencing doctors in postgraduate year 2 training positions: Total, females and proportion of females by doctor category and state/territory, 2014
NSW VIC QLD SA WA TAS NT ACT AUSAll commencing PGY2 doctors
Australian trained local (own state) 742 584 525 166 237 40 0 49 2,343Australian trained local (interstate) 73 63 64 21 65 8 41 16 351New Zealand medical graduates 1 2 1 4 3 0 1 0 12International students who graduated from an Australian medical school 38 74 59 46 3 0 0 17 237Australian Medical Council graduates 23 7 22 1 25 15 13 3 109Other/unspecified 35 12 0 0 0 8 0 0 55Total 912 (a)742 671 238 333 71 55 85 3,107
FemalesAustralian trained local (own state) 401 299 256 98 141 21 0 35 1,251Australian trained local (interstate) 45 35 33 12 31 4 16 8 184New Zealand medical graduates 0 2 1 2 1 0 1 0 7International students who graduated from an Australian medical school 23 39 29 24 2 0 0 3 120Australian Medical Council graduate 16 7 16 0 14 10 7 3 73Other/unspecified 26 6 0 0 0 6 0 0 38Total 511 388 335 136 189 41 24 49 1,673
Proportion females (%)Australian trained local (own state) 54.0 51.2 48.8 59.0 59.5 52.5 0 71.4 53.4Australian trained local (interstate) 61.6 55.6 51.6 57.1 47.7 50.0 39.0 50.0 52.4New Zealand medical graduates 0 100.0 100.0 50.0 33.3 0 100.0 0 58.3International students who graduated from an Australian medical school 60.5 52.7 49.2 52.2 66.7 0 0 17.6 50.6Australian Medical Council graduates 69.6 100.0 72.7 0 56.0 66.7 53.8 100.0 67.0Other/unspecified 74.3 50.0 0 0 0 75.0 0 0 69.1Total 56.0 52.3 49.9 57.1 56.8 57.7 43.6 57.6 53.8
(a) This figure only reflects the number of PGY2 positions advised by health services to include the Victorian hospital medical offer match. Health services exempted at least 37 positions from the match, so the number is underestimated.
Source: State and territory government health departments
Trends
The number of PGY2 commencements reported has increased by 794 or 34.3% since 2010 (Table 3.5), rising from 2,313 trainees in 2010 to 3,107 in 2014. Comparisons across years and between state and territories should be undertaken with caution due to data quality issues.
The commencements appear to have increased in all states and territories from 2010 to 2014, except for Tasmania, with a decrease of 10.1% during this period. The biggest increases over the period 2010 to 2014 were in Queensland (41.6%), Western Australia (38.2%), Australian Capital Territory (37.1%) and Victoria (36.6%). However, there are a number of problems with the quality of the data provided by states and territories and the ability to extract the data accurately from the various administrative systems.

MTRP 18th Report 57
Table 3.5: Postgraduate year 2 commencements by state/territory, 2010-2014
2010 2011 2012 2013 2014
Change2010-2014
(%)New South Wales (a)686 617 803 881 912 32.9Victoria (b)543 (e)585 (g)644 (i)742 742 36.6Queensland (c)474 (c)575 (c)734 683 671 41.6South Australia 183 (f)189 (h)244 (h)356 238 30.1Western Australia 241 330 469 (j)308 333 38.2Tasmania (d)79 103 87 104 71 -10.1Northern Territory 45 64 47 56 55 22.2Australian Capital Territory 62 58 73 64 85 37.1Australia 2,313 2,521 3,101 3,194 3,107 34.3Change from previous year (%) -1.7 9.0 23.0 3.0 -2.7
(a) Includes 85 IMGs working in PGY2 positions registered under the Competent Authority or Standard Pathways.(b) Although there were 543 HMO2 positions included in the Computer Matching Process (the Match), only 503 were
matched. There were 13 unmatched candidates who accepted vacant positions. Total number of doctors who started their PGY2 training via the Match was 516. The remaining 27 positions could be filled outside the Match (e.g. by IMGs).
(c) Commencement data is approximate and is based upon the total number of acceptances registered in the eRecruitment system.
(d) Actual allocation is not available. Figures based on number of offers made.(e) A total of 632 HMO2 positions were included in the Computer Matching Process and only 581 positions were matched.
From these 15 matched candidates declined their offer and 19 unmatched candidates accepted a position. Total number of doctors who started their PGY2 training via the Match was 585. A further 47 PGY2 posts were directly recruited by health services.
(f) Includes only the number of PGY2 commencing who completed internship in SA.(g) A total of 667 HMO2 positions were included in the computer matching process and 644 positions were matched. Of
the 644 matched positions, 18 candidates declined their Victorian offer. All HMO positions (i.e. 667) were filled either from candidates who participated in the Match (and were unmatched) or via direct recruitment of a health service. This figure is based on incomplete data and only reflects the number of PGY2 positions advised by health services to include in the Victorian HMO match. Health services are able to exempt positions from the matching process so the number is an underestimate.
(h) Data based on number of job offers made to PGY2 doctors via SA MET centralised process. Additional employment occurs outside of this process.
(i) A total of 708 HMO2 positions were included in the HMO Computer Match and of these, 689 positions were matched. 17 of the 689 matched candidates subsequently declined their offer. A further 36 candidates were offered and accepted a HMO2 position. A further 34 positions were directly recruited by health services.
(j) New data checking process has enabled cleaner data and ensures the capture of PGY2 only.
Source: State and territory government health departments

MTRP 18th Report 58
Chapter 4
VOCATIONAL MEDICAL TRAININGThis chapter reports on vocational training. It presents data on the number of vocational medical training places in 2014 and the results of college examinations held in 2013 for each of the specialty areas. All data were current as at July 2014.
The following data have been provided by all of the specialist medical colleges and associated faculties, and General Practice Education and Training Limited (GPET). In December 2014 GPET was abolished and its functions were transferred to the Australian Government Department of Health.
Data for the last five years are presented where applicable. Tables containing data reported for these and earlier years are located in Appendix D.
Vocational Medical Training in AustraliaFollowing completion of university medical education and the intern year, the majority of medical graduates decide to undertake specialist medical practice. In order to do this, they must complete a recognised medical specialty training program.
Training is provided through the specialist medical colleges and, in the case of general practice, through GPET and a network of Regional Training Providers. The training programs are accredited by the Australian Medical Council (AMC).
The AMC is an independent national standards body for medical education and training. The AMC acts as an external accreditation entity for the purposes of the Health Practitioner Regulation National Law. There is no single entry point to vocational training. Specialty training programs start in either the second or third postgraduate year, but not all who enter vocational training do so at the earliest opportunity.
To gain entry into a training program in their chosen specialty, individuals must succeed in a competitive selection process for a fixed number of accredited training positions (posts), or a place in an accredited facility or an accredited training program. The number of trainee positions offered is also dependent on the health services’ capacity to accept trainees.
The management of vocational training varies across the states and territories. The jurisdictions and health services work with the medical colleges to address particular challenges, such as improving trainee supervision in public hospitals, developing statewide training programs and addressing need for generalists or sub/super specialists. They also offer the training posts/facilities to be accredited.
Some specialist medical colleges differentiate their vocational training programs into basic and advanced components. Where required, basic training is the entry point for specialist training and must be completed before progressing to advanced training. Advanced specialist trainees then work in a series of training positions, in which they are supervised

MTRP 18th Report 59
and mentored by appropriately qualified specialists. The combination of these training positions constitutes the individual’s advanced training program.
Supervision of junior trainees (junior registrars) is usually undertaken by a specialist and/or a senior trainee (senior registrar) in association with a specialist. Over time, the registrar takes increasing responsibility for decision making about patient management and learns a wider range of practical skills.
Specialist vocational training was traditionally undertaken in teaching hospitals for most specialties, however, it is now undertaken across all public hospitals. A number of factors, including capacity constraints in the public hospital system and recognition that training needs to better reflect where healthcare is delivered, have seen an expansion over the last few years of specialist training positions to private hospitals and community settings.
All specialist colleges now assess their trainees at multiple time-points during training with a range of assessment techniques. Most colleges use written, oral and/or clinical examinations and the majority have an exit examination. A range of other in-training assessments of both a formative and summative nature are also utilised, so that the full range of knowledge, skills and behaviours, including communication, team work and other forms of professional behaviour, can be assessed.
The time required to complete vocational training programs varies between three to seven full-time years, depending upon the specialty. Further information on the specific requirements for each specialty is outlined in Appendix B.
General Practice Training
The Australian General Practice Training (AGPT) program is a postgraduate vocational training program for doctors wishing to pursue a career in general practice. The AGPT program provides training towards fellowship of the Royal Australian College of General Practitioners (RACGP) and/or fellowship of the Australian College of Rural and Remote Medicine (ACRRM) and is delivered through 17 Regional Training Providers (RTPs) across Australia. Until the end of 2014 the AGPT program was managed by GPET, which was owned and funded by the Australian Government to deliver training to the standards set by the RACGP and the ACRRM. The RACGP and the ACRRM are, in turn, accredited by the Australian Medical Council.
Registrars can choose between the rural pathway and the general pathway of the AGPT program. The general practice training programs usually take three years to complete, if undertaken through the RACGP, and four years, if undertaken through the ACRRM, but may take longer under some circumstances. An additional year is required for doctors taking the Fellowship in Advanced Rural General Practice (FARGP) through the RACGP. Training is primarily completed through a combination of hospital terms and general practice clinics although differences exist between the RACGP and ACRRM endpoints.
Rural pathway registrars undertake their training in rural and remote areas, as defined by the Australian Standard Geographical Classification – Remoteness Area (ASGC-RA) as Remoteness Areas 2 to 5. Metropolitan-based general pathway trainees are also required to undertake at least one placement in a rural and/or outer metropolitan area.

MTRP 18th Report 60
The Remote Vocational Training Scheme (RVTS) provides an alternative route to vocational recognition for medical practitioners working in remote areas who find that leaving their practice to undertake the AGPT program is not viable. RVTS registrars are eligible to sit for fellowship of the RACGP and ACRRM.
More details about these programs are included in Chapter 6.
The ACRRM offers the Independent Pathway as a third AMC accredited training pathway to achieve fellowship of the college (FACRRM). The Independent Pathway is most suited to experienced doctors. It is a self-funded pathway.
Changes to College Training in Australia
College of Intensive Care Medicine of Australia and New Zealand
The College of Intensive Care Medicine of Australia and New Zealand (CICM) introduced a new curriculum and trainee selection policy for trainees who registered from 1 January 2014 onwards. The total training time will remain at 6 years, consisting of a minimum of 42 months spent in accredited intensive care medicine training, 12 months of anaesthesia, 12 months of medicine (including 6 months of emergency or acute medicine) and 6 months in an elective placement. Trainees are also required to complete a term in paediatrics in an approved unit and at least 3 months of training must be undertaken in a rural hospital (paediatric and rural requirements may be completed in a discipline other than intensive care medicine).
Australasian College of Dermatologists
Trainees commencing in 2014 at the Australasian College of Dermatologists (ACD) are required to prepare and have published one major quality publication or three minor publications in one or more of the approved journals as listed on the ACD Website. Trainees who commenced prior to 2014 are only required to prepare and publish two papers of a significant nature on a dermatological subject.
Australasian College for Emergency Medicine
Basic training is in the process of being removed from the Australasian College for Emergency Medicine (ACEM) Training Program. From 20 June 2014 ACEM is no longer processing registrations for basic training. Commencing 1 January 2016, PGY1 and PGY2 will no longer be part of the ACEM Training Program structure. Workplace-based assessments are being used in pilot sites for advanced training in 2014; from 2015, these will be a requirement of training in all Emergency Medicine Terms.
Further information on the individual training programs for each specialty is outlined in Appendix B.
Accredited TrainingTables 4.1 and 4.2 present data on basic and advanced accredited training available in 2014. Medical colleges differ in their approaches to accrediting training. The majority of medical colleges accredit positions or posts. For some of these, all positions or posts will be filled, while for others the number of accredited positions/posts equates with the possible

MTRP 18th Report 61
number of trainees that could occupy the identified places available at the beginning of the year. Some medical colleges accredit facilities, including hospitals, laboratories and other sites, to undertake training, or accredit programs that can be run in a number of sites. For example, the RACP accredits both facilities and posts, depending on specific training programs offered.
Data on the number of positions or posts and facilities or programs that have been accredited to undertake training are reported in Table 4.1 for those colleges where basic training is a requirement.
Table 4.1: Basic training: Positions/posts and facilities/programs by medical specialty, 2014
Medical specialty College Accreditation approach
Positions/Posts Facilities/ProgramsAdult medicine RACP(a) (d)2,699 170Anaesthesia ANZCA .. 96Dermatology ACD 45 44Emergency medicine ACEM .. 123General practice RACGP(b) .. ..
ACRRM(c) 2 ..Intensive care CICM 25 naObstetrics and gynaecology RANZCOG 376 104Ophthalmology RANZCO 54 ..Paediatrics RACP(a) (d)818 102Psychiatry RANZCP .. 19
(a) For basic training RACP accredits hospitals, not positions.(b) RACGP no longer distinguishes between 'Basic' and 'Advanced’ positions. All training posts were identical and referred
to as 'Training posts'.(c) ACRRM accepts posts accredited by State Postgraduate Medical Councils for this stage of training but also has
standards to accredit posts if required. The number of Postgraduate Medical Council accredited posts was not included in this figure, only posts by ACRRM.
(d) The number of approved programs was based on the number of trainees in Australia. It did not include trainees based overseas.
Source: Medical colleges
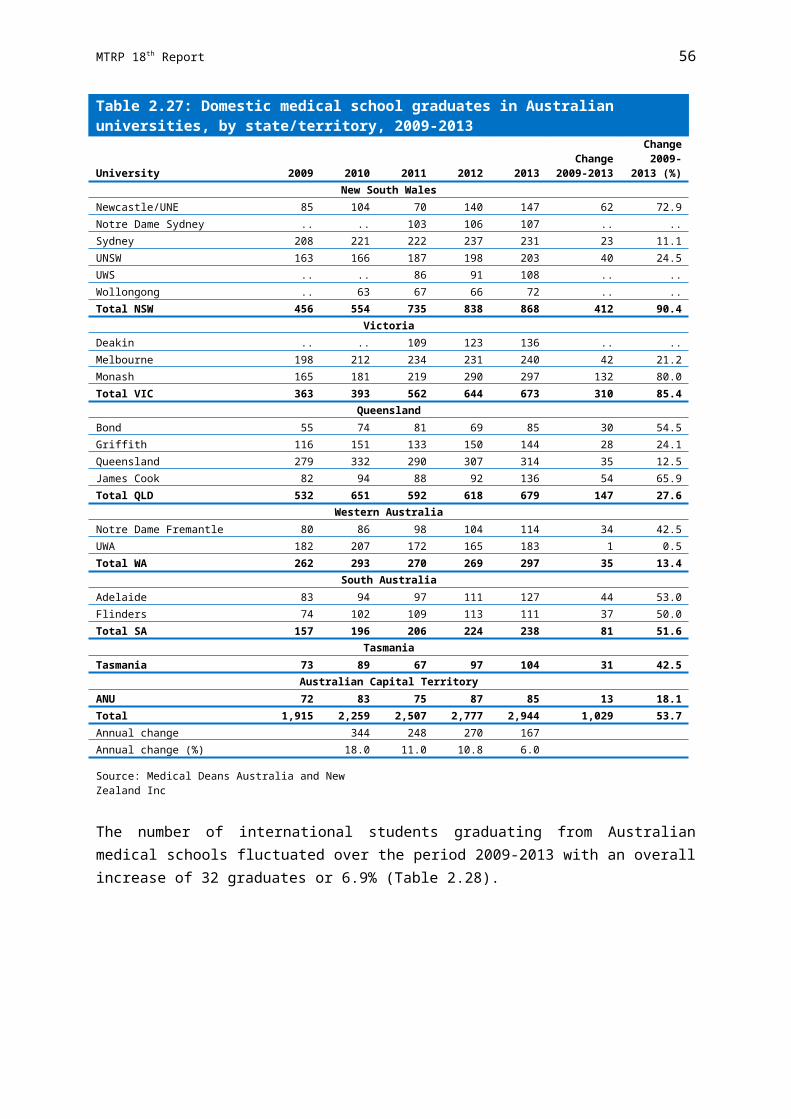
MTRP 18th Report 62
All medical colleges provide some form of accredited advanced training. These data are presented in Table 4.2.
Table 4.2: Advanced training: Positions/posts and facilities/programs by medical specialty, 2014
Medical specialty College Accreditation approach
Positions/Posts Facilities/ProgramsAddiction medicine RACP .. (h)30Adult medicine RACP .. (i)173Anaesthesia ANZCA .. 103Anaesthesia - pain medicine ANZCA .. (j)25Dermatology ACD 54 44Emergency medicine ACEM .. 123General practice RACGP (e)2,001 (e)17
ACRRM 840 ..Intensive care CICM 103 ..Medical administration RACMA (f)92 ..Obstetrics and gynaecology(a) RANZCOG 165 ..Occupational and environmental medicine(b) RACP 92 ..Ophthalmology RANZCO (g)60 ..Oral and maxillofacial surgery RACDS 38 ..Paediatrics RACP .. (k)131Palliative medicine(c) RACP .. ..Pathology(d) RCPA 307 354Pathology and RACP (jointly) RCPA/RACP 236 ..Psychiatry RANZCP .. 61Public health medicine RACP 130 93Radiation oncology RANZCR 117 44Radiodiagnosis RANZCR 410 107Rehabilitation medicine RACP .. 108Sexual health medicine RACP .. 32Sport and exercise medicine ACSP 41 ..Surgery RACS 2,419 504
(a) Advanced training positions were not officially accredited other than prospective approval of the post.(b) Training settings were not formally accredited for occupational and environmental medicine however training positions
were approved prospectively.(c) Palliative medicine sites were included with those from adult medicine.(d) Positions/Posts are the number of trainees. Facilities/Programs are the number of individually accredited laboratories
by discipline within Australia. Please note that some may not have current trainees.(e) RACGP no longer distinguishes between 'Basic' and 'Advanced' positions. All training posts are identical and referred
to as 'Training posts'.(f) Includes only Australian candidates. Excludes 31 Accelerated Pathway (AP) candidates. RACMA had a number of
candidates who were not required to undertake supervised training in an accredited position as they were on the Accelerated Pathway to Fellowship.
(g) Includes year 3 and 4 trainees only who are in accredited posts. Trainees in year 5 (final year) do not have to be in accredited posts, instead they must have an individual program of training approved which is specific to their training needs or interests. This is often a Fellowship position in Australia or overseas.
(h) Number of sites currently accredited. Not all sites have current active trainee(s).(i) Number of individual sites/hospitals accredited. Each site may be accredited for a number of programs.(j) Includes three level 2 units accredited to provide 6 months training.(k) Number of individual sites/hospitals accredited. Each site may be accredited for a number of programs.
Source: Medical colleges

MTRP 18th Report 63
Vocational Training DataIn 2014, there were 19,158 vocational training positions/trainees (Table 4.3). The largest number was in general practice, which across the two colleges had 4,486 training positions/trainees, demonstrating a 9.8% increase from the previous year (4,087 in 2013). The second largest group was in adult medicine (4,398), followed by emergency medicine (2,111), paediatrics (1,480), psychiatry (1,286) and anaesthesia, including anaesthesia - pain medicine (1,273).
Data covers all Australian trainees, as well as international medical graduates who are registered vocational trainees and who are working, being supervised or training in an accredited training position, post, facility or program. A number of medical colleges provide training overseas. Australian trainees within these overseas programs are included in the data, whereas non-Australian trainees are excluded.
It should be noted that numbers reported for some specialties differ sometimes across tables. This is primarily due to variation in what is included in the numbers in respect to New Zealand and other overseas trainees. In addition, there were a number of trainees located in more than one state and territory who could not be allocated to any one particular state/territory. These trainees have been counted in both, but the total number of trainees for that specialty only includes the physical headcount. Differences in inclusions are duly noted in the table footnotes where applicable.

MTRP 18th Report 64
Table 4.3: Vocational training positions/trainees by medical specialty, 2014
Medical specialty Basic trainees Advanced trainees Total college traineesAddiction medicine .. 22 22Adult medicine 2,699 1,699 4,398Anaesthesia 543 664 1,207Anaesthesia - pain medicine .. 66 66Dermatology 45 54 99Emergency medicine(a) 756 1,355 2,111
General practice - GPET(b) .. 4,315 4,315 - ACRRM(c) .. 171 171Intensive care 208 336 544Medical administration .. 115 115Obstetrics and gynaecology 376 165 (h)541Occupational and environmental medicine .. 92 92Ophthalmology 54 (f)90 144Oral and maxillofacial surgery .. 38 38Paediatrics(a) 818 662 1,480Palliative medicine(d) .. 28 28Pathology .. 307 307Pathology and RACP (jointly) .. 236 236Psychiatry (e)868 (g)418 1,286Public health medicine .. 81 81Radiation oncology .. 117 117Radiodiagnosis .. 410 410Rehabilitation medicine .. 202 202Sexual health medicine .. 13 13Sport and exercise medicine .. 41 41Surgery .. 1,094 1,094Total 6,367 12,791 19,158
(a) Paediatric emergency medicine vocational trainees were counted in both emergency medicine and paediatrics. They cannot be attributed to one or the other only due to the possibility that paediatric emergency trainees may also be undertaking another paediatric specialty.
(b) Figures are for those enrolled in the 2014 training year and include those now withdrawn or fellowed.(c) Includes registrars on the Independent Pathway only.(d) Includes Chapter trainees only. Excludes Clinical Diploma Chapter trainees as the training program was not leading to
fellowship of RACP or AChPM.(e) Includes trainees from the 2012 Fellowship Program - 245 in Stage 1 and 104 in Stage 2.(f) Includes 5th year trainees, 10 of which are completing their final year overseas.(g) Includes 215 fellows completing subspecialty training.(h) Excludes overseas trained specialists referred to as Specialist International Medical Graduates (SIMGs) by RANZCOG.
Source: Medical colleges and GPET

MTRP 18th Report 65
Basic Training
Periods of defined basic training prior to an individual commencing the advanced training program are required by nine specialties. Table 4.4 and Table 4.5 provide data on trainees for these specialties.
Some colleges have programs which do not distinguish between basic and advanced trainees. For example, Royal Australasian College of Surgeons (RACS) has an integrated program, the Surgical Education and Training (SET) program, which does not distinguish between basic and advanced trainees. Data on these programs are reported in the sections dealing with advanced training.
It should be noted that ACRRM only has two basic training posts recorded in this section. The reason for this is that the training program for ACRRM has three stages of training: Core Clinical Training (CCT), Primary Rural and Remote Training (PRRT) and Advanced Specialised Training (AST). In the MTRP report CCT is now defined as basic training and PRRT and AST as advanced training. ACRRM accepts posts accredited by state postgraduate medical councils for the CCT stage of training but also has standards to accredit posts if required. The number of state postgraduate medical councils accredited posts is not included in this section, only posts accredited by ACRRM. Therefore, the majority of posts accredited by ACRRM are included in Advanced Training.
There have not been any ACRRM Independent Pathway trainees recorded in Table 4.7 under basic training as doctors on this pathway are experienced and are awarded recognised prior learning for the first year of training. Therefore, all data relating to ACRRM Independent Pathway trainees are reported in the sections dealing with advanced training.
Further information on the training requirements for each specialty is provided in Appendix B.
In total, there were 6,367 basic trainees, representing 33.2% of all vocational trainees in 2014 (Table 4.3). This represents a 5.1% increase on the 6,056 basic vocational trainees from 2013. Growth of almost 140% from the 2,653 trainees undertaking basic vocational training in 2005 was mainly related to the introduction by many colleges of additional basic training as a pre-requisite to entry to advanced training as well as the requirement for RACP trainees in their first year of training to register with the college.
The specialty with the largest number of basic trainees was adult medicine with 2,699 (Table 4.4).
Of the total number of basic trainees, 1,666 were in their first year. Over one-third(662 or 39.7%) of these basic trainees were in their first year of adult medicine. Aboutone-sixth (277 or 16.6%) were commencing their first year of basic training in emergency medicine and 13.0% (216) were commencing in psychiatry.
All current ACEM trainees in basic training are considered in the same year (provisional training year, at least PGY3). This shows trainees who registered with ACEM for this current calendar year.

MTRP 18th Report 66
Table 4.4: Basic trainees and first-year basic trainees by medical specialty and state/territory, 2014
Medical specialty NSW VIC QLD SA WA TAS NT ACT AUSAll basic trainees
Adult medicine 661 810 577 215 299 58 21 58 2,699Anaesthesia 203 117 114 41 35 15 5 13 543Dermatology 11 17 11 3 2 0 0 1 45Emergency medicine 238 140 197 54 84 17 11 15 756Intensive care 61 27 67 15 26 1 6 5 208Obstetrics and gynaecology 120 108 79 21 23 12 1 12 376Ophthalmology 17 15 9 3 4 2 2 2 54Paediatrics 242 199 172 60 98 22 8 17 818Psychiatry(a) 271 217 188 64 73 19 12 24 868Total 1,824 1,650 1,414 476 644 146 66 147 6,367
First-year basic trainees
Adult medicine 93 266 149 58 65 14 3 14 662Anaesthesia 80 47 46 9 5 8 1 5 201Dermatology 6 9 7 3 0 0 0 1 26Emergency medicine 83 54 73 19 29 11 3 5 277Intensive care 2 1 2 0 0 0 0 0 5Obstetrics and gynaecology 30 24 19 4 5 3 0 3 88Ophthalmology 5 8 4 1 2 1 1 1 23Paediatrics 29 40 49 10 27 6 3 4 168Psychiatry(b) 63 56 48 18 20 4 4 3 216Total 391 505 397 122 153 47 15 36 1,666(a) First-year numbers include Stage 1 and Stage 2 trainees that started in the 2012 Fellowship program.(b) Includes Stage 1 trainees that started in 2014 and existing trainees in Stage 1.
Source: Medical colleges
In 2014, just over half (3,433 or 53.9%) of all basic trainees were females (Table 4.5). The specialty with the largest number of females was adult medicine, with 1,327 female basic trainees. However, the proportion of females was much higher in two particular specialties, obstetrics and gynaecology and paediatrics in which 81.6% and 72.9% respectively of all trainees were females.

MTRP 18th Report 67
Table 4.5: Female basic trainees by medical specialty and state/territory, 2014
Medical specialty NSW VIC QLD SA WA TAS NT ACT AUSFemale basic trainees
Adult medicine 328 438 250 111 137 21 14 28 1,327Anaesthesia 94 51 47 15 15 7 4 7 240Dermatology 7 13 5 3 2 0 0 0 30Emergency medicine 113 53 95 23 36 8 7 8 343Intensive care 24 13 22 8 10 0 4 3 84Obstetrics and gynaecology 94 93 62 18 17 11 1 11 307Ophthalmology 5 6 4 1 2 (b)0 (b)0 (b)1 19Paediatrics 171 144 120 53 76 14 7 11 596Psychiatry(a) 137 118 100 41 50 18 5 18 487Total 973 929 705 273 345 79 42 87 3,433
Proportion of all basic trainees (%)
Adult medicine 49.6 54.1 43.3 51.6 45.8 36.2 66.7 48.3 49.2Anaesthesia 46.3 43.6 41.2 36.6 42.9 46.7 80.0 53.8 44.2Dermatology 63.6 76.5 45.5 100.0 100.0 0 0 0 66.7Emergency medicine 47.5 37.9 48.2 42.6 42.9 47.1 63.6 53.3 45.4Intensive care 39.3 48.1 32.8 53.3 38.5 0 66.7 60.0 40.4Obstetrics and gynaecology 78.3 86.1 78.5 85.7 73.9 91.7 100.0 91.7 81.6Ophthalmology 29.4 40.0 44.4 33.3 50.0 0 0 50.0 35.2Paediatrics 70.7 72.4 69.8 88.3 77.6 63.6 87.5 64.7 72.9Psychiatry 50.6 54.4 53.2 64.1 68.5 94.7 41.7 75.0 56.1Total 53.3 56.3 49.9 57.4 53.6 54.1 63.6 59.2 53.9
(a) Includes Stage 1 and Stage 2 trainees that started in the 2012 Fellowship program.(b) The proportion of female trainees in ACT, NT and TAS varies according to rostered rotations.
Source: Medical colleges
Trends in Basic Vocational Training
It can be seen in Table 4.6 the proportion of female basic trainees has increased every year since 2010.
Since 2013, the number of first-year basic trainees has continued to decrease. However, it should be noted that figures for earlier years are not comparable due to training program changes. This includes the introduction of basic training in some specialties prior to commencing advanced training.

MTRP 18th Report 68
Table 4.6: Vocational training positions/trainees: Total, basic, female basic and first-year basic trainees, 2010-2014
Total college
trainees
Basic training positions/
trainees
Femalebasic
trainees
Proportionfemale
(%)
First-year basic
trainees
Proportionfirst-year
(%)2010 14,679 5,040 2,498 49.6 1,244 24.72011 15,478 5,264 2,672 50.8 1,425 27.12012 16,740 5,744 2,962 51.6 1,805 31.42013 17,888 6,056 3,235 53.4 1,669 27.62014 19,158 6,367 3,433 53.9 1,666 26.2Change 2010-2014 (%) 30.5 26.3 37.4 8.8 33.9 6.0
Source: Medical colleges
The total number of basic trainees between 2010 and 2014 has increased by 26.3%(Table 4.7). However, there were medical specialties that have had larger increases than the total, namely paediatrics (47.7%) and adult medicine (42.6%). Anaesthesia, dermatology and ophthalmology remained relatively stable over the past five years.
Table 4.7: Basic training positions/trainees by medical specialty, 2010-2014
Medical specialty 2010 2011 2012 2013 2014
Change 2010-2014
(%)Adult medicine 1,893 1,951 2,197 2,475 2,699 42.6Anaesthesia 504 617 615 555 543 7.7Dermatology 42 44 42 46 45 7.1Emergency medicine 803 785 821 727 756 -5.9
General practice - ACRRM(a) 50 141 0 0 0 -100.0Intensive care 167 152 192 199 208 24.6Obstetrics and gynaecology 295 330 354 356 376 27.5Ophthalmology 55 53 55 53 54 -1.8Paediatrics 554 530 664 812 818 47.7Psychiatry 677 661 804 833 (b)868 28.2Surgery .. .. .. .. .. ..Total 5,040 5,264 5,744 6,056 6,367 26.3
(a) Includes registrars on the Independent Pathway only. In 2010-2011 ACRRM reported those in Primary Rural and Remote Training as basic trainees, now reported as advanced trainees.
(b) Includes Stage 1 and Stage 2 trainees that started in the 2012 Fellowship program.
Source: Medical colleges
The basic trainee numbers by states and territories (Table 4.8) show that numerically the increases in 2014 compared with 2010 were greatest in Victoria (375) and New South Wales (332). As a proportion, the growth was greatest in Western Australia (47.4%), followed by the Australian Capital Territory (40%) and Tasmania (37.7%).

MTRP 18th Report 69
The number of basic trainees in most jurisdictions increased each year between 2010 and 2014, though the size of the increase varies according to jurisdiction size and available training capacity. Some of these increases have been minor, particularly in small jurisdictions, however, these increases are consistent with their size and available training capacity.
Table 4.8: Basic training positions/trainees by state/territory, 2010-2014
NSW VIC QLD SA WA TAS NT ACT AUS2010 1,492 1,275 1,148 424 437 106 53 105 5,0402011 1,508 1,388 1,189 419 481 130 42 107 5,2642012 1,607 1,548 1,285 478 537 134 46 109 5,7442013 1,710 1,603 1,382 469 583 132 53 124 6,0562014 1,824 1,650 1,414 476 644 146 66 147 6,367Change 2010–2014 (%) 22.3 29.4 23.2 12.3 47.4 37.7 24.5 40.0 26.3
Source: Medical colleges
Behind the increases in overall basic trainee numbers are major increases in some specialities’ trainee intake (Table 4.9). The number of first-year basic trainees for paediatrics increased by over a third from 123 in 2010 to 168 in 2014. Adult medicine increased its intake of first-year basic trainees by over a quarter from 522 in 2010 to 662 in 2014.
Table 4.9: First-year basic trainees by medical specialty, 2010-2014
Medical specialty 2010 2011 2012 2013 2014
Change 2010-2014
(%)First-year basic trainees
Adult medicine 522 583 610 585 662 26.8Anaesthesia(a) 240 321 314 215 201 -16.3Dermatology 23 20 26 22 26 13.0Emergency medicine .. .. 240 241 277 ..Intensive care 11 7 9 28 5 -54.5Obstetrics and gynaecology 77 87 83 89 88 14.3Ophthalmology 25 26 28 25 23 -8.0Paediatrics 123 142 181 151 168 36.6Psychiatry(b) 223 239 314 313 216 -3.1Total 1,244 1,425 1,805 1,669 1,666 33.9
(a) Introductory training period is now for a period of 6 months.(b) Includes Stage 1 trainees that started in 2014 and existing trainees in Stage 1. This is a modified definition for the 2012
Fellowship program.
Source: Medical colleges

MTRP 18th Report 70
Table 4.10 shows the numbers of first-year basic trainees in each state and territory for the period 2010 to 2014. Overall, first year basic trainees have increased by over a third from 1,244 in 2010 to 1,666 in 2014, an increase of 33.9%.
Table 4.10: First-year basic trainees by state/territory, 2010-2014
NSW VIC QLD SA WA TAS NT ACT AUSFirst-year basic trainees
2010 350 341 267 124 100 22 16 24 1,2442011 387 410 298 124 130 39 15 22 1,4252012 407 545 420 146 190 50 17 30 1,8052013 397 494 402 132 154 38 15 37 1,6692014 391 505 397 122 153 47 15 36 1,666Change 2010-2014 (%) 11.7 48.1 48.7 -1.6 53.0 113.6 -6.3 50.0 33.9
Source: Medical colleges
Table 4.11 shows the proportion of female basic trainees in each specialty. The table highlights the fluctuations in the number of female basic trainees in specialties from one year to another. The proportion of female basic trainees in obstetrics and gynaecology has increased year on year from 2010 to 2014. The year 2014 was the fourth consecutive year where female basic trainees comprised over half (53.9%) of all basic trainees.
Table 4.11: Proportion of female basic trainees by medical specialty, 2010-2014
Medical specialty 2010 2011 2012 2013 2014
Change 2010-2014
(%)Proportion female (%)
Adult medicine 47.4 49.9 48.9 49.5 49.2 3.7Anaesthesia 45.0 45.9 46.0 45.8 44.2 -1.8Dermatology 64.3 63.6 45.2 56.5 66.7 3.7Emergency medicine 38.2 39.4 42.4 42.9 45.4 18.8
General practice - ACRRM(a) 26.0 16.3 .. .. .. ..Intensive care 33.5 24.3 32.2 40.2 40.4 20.6Obstetrics and gynaecology 69.8 77.6 79.0 80.6 81.6 17.0Ophthalmology 40.0 43.4 41.8 34.0 35.2 -12.0Paediatrics 67.9 70.6 72.7 71.4 72.9 7.3Psychiatry 54.1 55.4 53.4 54.5 (b)56.1 3.7Total 49.6 50.8 51.6 53.4 53.9 8.7Total female trainees 2,498 2,672 2,962 3,235 3,433 37.4
(a) Includes registrars on the Independent Pathway only. In 2010-2011 ACRRM reported those in Primary Rural and Remote Training as basic trainees, now reported as advanced trainees.
(b) Includes Stage 1 and Stage 2 trainees that started in the 2012 Fellowship program.
Source: Medical colleges

MTRP 18th Report 71
Table 4.12 provides data on female basic trainees by state and territories. Greater fluctuations are generally seen in those jurisdictions with smaller basic trainee numbers.
Table 4.12: Proportion of female basic trainees by state/territory, 2010-2014
NSW VIC QLD SA WA TAS NT ACT AUSProportion female (%)
2010 51.3 56.0 42.0 50.0 49.7 29.2 41.5 51.4 49.62011 52.2 56.5 44.5 48.2 49.5 40.8 52.4 53.3 50.82012 51.9 55.6 46.9 51.5 52.0 44.0 52.2 51.4 51.62013 53.6 57.0 48.8 53.9 53.9 45.5 58.5 58.9 53.42014 53.3 56.3 49.9 57.4 53.6 54.1 63.6 59.2 53.9
Source: Medical colleges
Advanced Training
In 2014, there were 12,791 advanced vocational training positions/trainees in programs in Australia (Table 4.13). This constitutes two thirds (66.8%) of the total number of vocational training positions/trainees. General practice had the highest number of advanced trainees (4,486), followed by adult medicine (1,699), emergency medicine (1,355) and surgery (1,094).
Table 4.13 also shows the distribution of advanced training positions/trainees across states and territories.

MTRP 18th Report 72
Table 4.13: Advanced vocational training positions/trainees by medical specialty and state/territory, 2014
Medical specialty NSW VIC QLD SA WA TAS NT ACT AUSAddiction medicine 9 2 5 2 3 1 0 0 22Adult medicine 543 520 296 144 120 28 14 34 1,699Anaesthesia 195 164 168 44 63 12 7 11 664Anaesthesia - pain medicine 25 22 8 3 3 4 0 1 66Dermatology 18 18 8 6 4 0 0 0 54Emergency medicine(a) 380 342 316 97 158 19 22 21 1,355General practice - GPET(b) 1,441 899 948 333 447 134 113 (f).. 4,315 - ACRRM(c) 48 21 68 5 20 2 7 0 171Intensive care 104 94 69 27 22 6 3 11 336Medical administration 33 27 32 1 12 3 4 3 115Obstetrics and gynaecology 46 46 40 15 9 5 2 2 165Occupational and environmental medicine 29 10 22 4 22 2 1 2 92Ophthalmology(d) 42 22 8 7 9 1 1 0 90Oral and maxillofacial surgery 6 11 9 4 4 1 1 2 38Paediatrics(a) 226 159 115 58 82 6 11 5 662Palliative medicine(e) 3 9 6 7 2 1 0 0 28Pathology 108 77 51 20 29 9 5 8 307Pathology and RACP (jointly) 91 67 34 16 19 1 0 8 236Psychiatry 151 130 73 20 30 9 1 4 418Public health medicine 23 16 10 6 8 2 6 10 81Radiation oncology 52 24 24 5 2 3 1 6 117Radiodiagnosis 122 104 84 46 36 6 0 12 410Rehabilitation medicine 91 51 34 14 5 5 0 2 202Sexual health medicine 5 4 0 2 2 0 0 0 13Sport and exercise medicine 17 15 7 0 2 0 0 0 41Surgery 395 306 199 83 92 4 4 11 1,094Total 4,203 3,160 2,634 969 1,205 264 203 153 12,791
(a) Emergency medicine and paediatrics data account for trainees undertaking paediatric emergency medicine.(b) Figures are for those enrolled in the 2014 training year and include those now withdrawn or fellowed.(c) Includes registrars on the Independent Pathway only.(d) Includes 10 trainees who are completing their final year of training overseas.(e) Includes Chapter trainees only. Excludes Clinical Diploma Chapter trainees as the training program was not leading to
fellowship of RACP or AChPM.(f) ACT data included in NSW figures for general practice, GPET.
Source: Medical colleges and GPET

MTRP 18th Report 73
Overall, advanced trainees were reasonably well distributed across states and territories when compared with their relative proportions of the Australian population. For the larger specialties, the proportions of trainees roughly mirrored the relative proportions of the population in each state and territory (Table 4.14).
Table 4.14: Proportion of advanced training positions/trainees by medical specialty and state/territory, 2014
Medical specialty NSW VIC QLD SA WA TAS NT ACTProportion (%)
Addiction medicine 40.9 9.1 22.7 9.1 13.6 4.5 0 0Adult medicine 32.0 30.6 17.4 8.5 7.1 1.6 0.8 2.0Anaesthesia 29.4 24.7 25.3 6.6 9.5 1.8 1.1 1.7Anaesthesia - pain medicine 37.9 33.3 12.1 4.5 4.5 6.1 0 1.5Dermatology 33.3 33.3 14.8 11.1 7.4 0 0 0Emergency medicine 28.0 25.2 23.3 7.2 11.7 1.4 1.6 1.5
General practice - GPET(a) 33.4 20.8 22.0 7.7 10.4 3.1 2.6 (e).. - ACRRM(b) 28.1 12.3 39.8 2.9 11.7 1.2 4.1 0Intensive care 31.0 28.0 20.5 8.0 6.5 1.8 0.9 3.3Medical administration 28.7 23.5 27.8 0.9 10.4 2.6 3.5 2.6Obstetrics and gynaecology 27.9 27.9 24.2 9.1 5.5 3.0 1.2 1.2Occupational and environmental medicine 31.5 10.9 23.9 4.3 23.9 2.2 1.1 2.2Ophthalmology 46.7 24.4 8.9 7.8 10.0 1.1 1.1 0Oral and maxillofacial surgery 15.8 28.9 23.7 10.5 10.5 2.6 2.6 5.3Paediatrics 34.1 24.0 17.4 8.8 12.4 0.9 1.7 0.8Palliative medicine(c) 10.7 32.1 21.4 25.0 7.1 3.6 0 0Pathology 35.2 25.1 16.6 6.5 9.4 2.9 1.6 2.6Pathology and RACP (jointly) 38.6 28.4 14.4 6.8 8.1 0.4 0 3.4Psychiatry 36.1 31.1 17.5 4.8 7.2 2.2 0.2 1.0Public health medicine 28.4 19.8 12.3 7.4 9.9 2.5 7.4 12.3Radiation oncology 44.4 20.5 20.5 4.3 1.7 2.6 0.9 5.1Radiodiagnosis 29.8 25.4 20.5 11.2 8.8 1.5 0 2.9Rehabilitation medicine 45.0 25.2 16.8 6.9 2.5 2.5 0 1.0Sexual health medicine 38.5 30.8 0 15.4 15.4 0 0 0Sport and exercise medicine 41.5 36.6 17.1 0 4.9 0 0 0Surgery 36.1 28.0 18.2 7.6 8.4 0.4 0.4 1.0Total 32.9 24.7 20.6 7.6 9.4 2.1 1.6 1.2Population proportion (%)(d) 32.0 24.8 20.1 7.2 11.0 2.2 1.0 1.7
(a) Figures are for those enrolled in the 2014 training year and include those now withdrawn or fellowed.(b) Includes registrars on the Independent Pathway only.(c) Includes Chapter trainees only.(d) Population data from ABS. 3101.0 - Australian Demographics Statistics, March 2014, released 25/09/2014.(e) ACT data included in NSW figures for general practice, GPET.
Source: Medical colleges and GPET

MTRP 18th Report 74
First–year Advanced Trainees
In 2014, there were 3,556 first-year advanced vocational training positions/trainees (Table 4.15). The specialty with the most first-year advanced vocational training places was general practice (1,222), followed by adult medicine (677), paediatrics (315) and surgery (249).
Table 4.15: First-year advanced positions/trainees by medical specialty and state/territory, 2014
Medical specialty NSW VIC QLD SA WA TAS NT ACT AUSAddiction medicine(a) 3 1 0 1 1 1 0 0 7Adult medicine(a) 214 198 118 57 58 12 5 15 677Anaesthesia 46 45 49 8 18 3 3 2 174Anaesthesia - pain medicine 10 5 6 2 2 3 0 0 28Dermatology 8 13 4 5 2 0 0 0 32Emergency medicine(b) 53 34 45 13 27 1 4 3 180General practice - GPET(c) 395 263 260 99 137 35 33 (f).. 1,222 - ACRRM(d) .. .. .. .. .. .. .. .. ..Intensive care 11 15 15 0 3 0 1 3 48Medical administration 13 2 10 1 3 2 2 0 33Obstetrics and gynaecology 20 25 23 10 4 3 1 1 87Occupational and environmental medicine 8 4 3 0 5 0 1 0 21Ophthalmology 12 5 4 2 4 1 0 0 28Oral and maxillofacial surgery 0 2 2 1 0 0 1 0 6Paediatrics(a) 107 73 50 31 46 4 3 1 315Palliative medicine(a),(e) 1 5 4 4 1 0 0 0 15Pathology 17 11 10 7 6 1 2 3 57Pathology and RACP (jointly) 22 21 8 4 7 0 0 3 65Psychiatry 36 32 27 1 3 4 0 2 105Public health medicine(a) 8 7 4 3 5 1 1 4 33Radiation oncology 8 2 4 2 0 0 1 1 18Radiodiagnosis 23 21 17 10 9 1 0 5 86Rehabilitation medicine(a) 28 16 11 1 3 1 0 1 61Sexual health medicine(a) 0 0 0 0 1 0 0 0 1Sport and exercise medicine 4 2 2 0 0 0 0 0 8Surgery 92 58 46 19 25 3 1 5 249Total 1,139 860 722 281 370 76 59 49 3,556
(a) Includes all trainees who have undertaken less than 12 months certified units.(b) Both emergency medicine and paediatrics account for trainees undertaking paediatric emergency medicine.(c) Figures are for those enrolled in the 2014 training year and include those now withdrawn or fellowed.(d) This applies to Independent Pathway registrars only, figures cannot be provided due to the individual training
requirements for these registrars following recognition of prior learning.(e) Includes Chapter trainees only.(f) ACT data included in NSW figures for general practice, GPET.
Source: Medical colleges and GPET

MTRP 18th Report 75
Female Trainees
Half (6,733 or 52.6%) of all advanced vocational trainees were females (Table 4.16). This proportion was far higher in some specialties, with females comprising three-fifths or more of advanced vocational trainees in obstetrics and gynaecology (74.5%), paediatrics (72.8%), public health medicine (72.8%), sexual health medicine (69.2%), rehabilitation medicine (66.3%) and general practice (63.1%).
Table 4.16: Female advanced trainees by medical specialty and state/territory, 2014
Medical specialty NSW VIC QLD SA WA TAS NT ACT AUSAddiction medicine 3 1 2 2 1 1 0 0 10Adult medicine 270 301 125 70 62 13 5 16 862Anaesthesia 97 87 79 22 20 3 5 3 316Anaesthesia - pain medicine 11 11 2 1 1 2 0 0 28Dermatology 9 10 4 2 2 0 0 0 27Emergency medicine(a) 153 136 135 32 68 6 13 6 549
General practice - GPET(b) 961 571 584 207 316 93 69 (e).. 2,801 - ACRRM(c) 4 4 11 0 7 2 3 0 31Intensive care 34 34 27 5 3 1 1 3 108Medical administration 13 7 10 1 8 1 1 2 43Obstetrics and gynaecology 34 34 31 10 8 4 1 1 123Occupational and environmental medicine 9 4 6 1 6 0 1 2 29Ophthalmology 18 7 4 4 4 0 1 0 38Oral and maxillofacial surgery 0 1 2 0 1 0 0 0 4Paediatrics 170 117 81 43 57 3 7 4 482Palliative medicine(d) 2 6 3 3 1 1 0 0 16Pathology 69 48 28 12 18 5 4 8 192Pathology and RACP (jointly) 51 44 18 11 6 1 0 5 136Psychiatry 77 68 33 11 18 3 0 2 212Public health medicine 17 13 5 6 6 2 6 4 59Radiation oncology 30 10 12 2 2 0 1 3 60Radiodiagnosis 46 44 27 15 13 3 0 6 154Rehabilitation medicine 58 39 24 10 1 2 0 0 134Sexual health medicine 4 1 0 2 2 0 0 0 9Sport and exercise medicine 3 5 1 0 0 0 0 0 9Surgery 128 83 47 21 17 0 1 4 301Total 2,271 1,686 1,301 493 648 146 119 69 6,733(a) Both emergency medicine and paediatrics account for trainees undertaking paediatric emergency medicine.(b) Figures are for those enrolled in the 2014 training year and include those now withdrawn or fellowed.(c) Includes registrars on the Independent Pathway only.(d) Includes Chapter trainees only.(e) ACT data included in NSW figures for general practice, GPET.
Source: Medical colleges and GPET

MTRP 18th Report 76
A few specialties had a relatively low proportion of female trainees, with females comprising less than forty percent of advanced vocational trainees in radiodiagnosis, medical administration, intensive care, occupational and environmental medicine, surgery, sport and exercise medicine, and oral and maxillofacial surgery.
Part–time Training
Some colleges provide the opportunity for trainees to train part-time subject to approval by the employing authority, such as the hospital or laboratory.
In 2014, there were 2,075 part-time advanced trainees across specialties. This represents nearly one-sixth (16.2%) of all advanced trainees (Table 4.17).
Part-time training was most common in sexual health medicine (38.5%), addiction medicine (31.8%), general practice (30.5%) and public health medicine (28.4%) with over one-quarter of advanced vocational trainees undertaking part-time training.
A number of other specialties had relatively small numbers of trainees undertaking part-time training. It should be noted, that the availability of part-time training and interrupted training varies across specialties. Further information on this can be found in Appendix B.

MTRP 18th Report 77
Table 4.17: Advanced trainees undertaking part-time training by medical specialty and state/territory, 2014
Medical specialty NSW VIC QLD SA WA TAS NT ACT AUSAddiction medicine 3 1 1 0 1 1 0 0 7Adult medicine 24 20 8 9 2 0 0 0 63Anaesthesia 9 2 6 1 3 0 0 0 21Anaesthesia - pain medicine 5 2 1 0 1 2 0 0 11Dermatology 1 1 2 0 0 0 0 0 4Emergency medicine(a) 91 72 69 31 26 3 0 3 295
General practice - GPET(b) 526 232 308 94 103 57 48 (e).. 1,368 - ACRRM(c) 0 0 0 0 0 0 0 0 0Intensive care 3 2 1 0 0 0 0 0 6Medical administration 11 1 9 0 1 0 3 0 25Obstetrics and gynaecology 3 2 1 1 1 0 0 0 8
Occupational and environmental medicine 0 0 0 0 0 0 0 0 0Ophthalmology 0 1 1 0 0 0 0 0 2Oral and maxillofacial surgery 0 0 0 0 0 0 0 0 0Paediatrics 39 31 9 9 8 0 1 1 98Palliative medicine(d) 2 1 1 2 0 0 0 0 6Pathology 7 8 2 0 2 1 0 0 20Pathology and RACP (jointly) 4 2 0 1 0 0 0 0 7Psychiatry 18 19 7 6 6 2 0 0 58Public health medicine 6 7 3 3 1 0 2 1 23Radiation oncology 4 0 3 0 0 0 0 1 8Radiodiagnosis 9 1 1 2 0 0 0 1 14Rehabilitation medicine 9 5 3 0 0 0 0 0 17Sexual health medicine 2 1 0 1 1 0 0 0 5Sport and exercise medicine 2 0 1 0 0 0 0 0 3Surgery 2 2 2 0 0 0 0 0 6Total 780 413 439 160 156 66 54 7 2,075
(a) Both emergency medicine and paediatrics account for trainees undertaking paediatric emergency medicine.(b) Figures are for those enrolled in the 2014 training year and include those now withdrawn or fellowed.(c) Includes registrars on the Independent Pathway only.(d) Includes Chapter trainees only.(e) ACT data included in NSW figures for general practice, GPET.
Source: Medical colleges and GPET
Discontinuation of Training
Trainees may discontinue training for a variety of reasons, with either the trainee officially withdrawing from the training program, or the college or training provider terminating or dismissing a trainee in accordance with college regulations or employment conditions.
In 2014, there were 366 advanced trainees who discontinued training (Table 4.18), the highest number of discontinuations for the period 2010-14.

MTRP 18th Report 78
Table 4.18: Advanced trainee discontinuations by state/territory, 2010-2014
NSW VIC QLD SA WA TAS NT ACT AUS2010 72 58 45 10 11 3 3 11 2132011 42 31 22 8 6 3 3 0 1152012 (a)39 21 21 12 6 0 0 4 (b)1032013 (a)63 37 49 12 20 2 3 4 1902014 (a)136 81 73 26 35 4 3 8 (c)366
(a) ACT data included in NSW figures for general practice.(b) Total advanced trainee discontinuations by state/territory, 2010-2012 (excluding one trainee from overseas).(c) GPET figures include both basic and advanced trainees together. Discontinuations include those registrars who
withdrew from training in the 2014 training year and do not include those who withdrew before commencing in the AGPT program.
Source: Medical colleges and GPET
Subspecialty Training
Obstetrics and Gynaecology Subspecialties
In 2014, there were 64 trainees undertaking additional advanced training in the subspecialty of obstetrics and gynaecology, with the most common subspecialties being maternal and fetal medicine (37.5%), and reproductive endocrinology and infertility (21.9%). Over two-thirds of obstetricians and gynaecologists training in a subspecialty were females (Table 4.19).
Table 4.19: Obstetrics and gynaecology advanced trainees: Total, proportion of total and females by subspecialty, 2014
Subspecialty Positions Proportion (%) FemalesObstetrics and gynaecology ultrasound 9 14.1 8Maternal and fetal medicine 24 37.5 18Reproductive endocrinology and infertility 14 21.9 7Gynaecological oncology 11 17.2 7Urogynaecology 6 9.4 5Total 64 100.0 45
Source: Royal Australian and New Zealand College of Obstetricians and Gynaecologists

MTRP 18th Report 79
Pathology Subspecialties
In 2014, there were 543 advanced trainees (Table 4.20) undertaking training with the Royal College of Pathologists of Australasia (RCPA). Nearly half of these (242 or 44.6%) were within the subspecialty of anatomical pathology and almost a third (174 or 32.0%) in haematology.
Table 4.20: Pathology advanced trainees: Total, proportion of total and females by subspecialty, 2014
Subspecialty Positions Proportion (%) FemalesAnatomical pathology 242 44.6 156Chemical pathology 26 4.8 14Forensic pathology 7 1.3 5General pathology 9 1.7 5Genetic pathology 7 1.3 1Haematology 174 32.0 103Immunopathology 23 4.2 11Microbiology 55 10.1 33Oral and maxillofacial pathology 0 0 0Total 543 100.0 328
Source: Royal College of Pathologists of Australasia
Table 4.21 shows the number of training positions in the pathology subspecialties in each of the states and territories. New South Wales had the largest number of advanced trainees in 2014 (199) followed by Victoria (144).
Table 4.21: Pathology advanced trainees by subspecialty and state/territory, 2014
Subspecialty NSW VIC QLD SA WA TAS NT ACT AUSAnatomical pathology 87 60 41 16 23 5 3 7 242Chemical pathology 6 7 5 1 5 1 0 1 26Forensic pathology 3 3 0 0 1 0 0 0 7General pathology 4 2 2 0 0 1 0 0 9Genetic pathology 3 2 0 1 1 0 0 0 7Haematology 66 52 24 14 10 2 1 5 174Immunopathology 8 6 2 2 3 0 0 2 23Microbiology 22 12 11 2 5 1 1 1 55Oral and maxillofacial pathology 0 0 0 0 0 0 0 0 0Total 199 144 85 36 48 10 5 16 543
Source: Royal College of Pathologists of Australasia

MTRP 18th Report 80
Physician Adult Medicine Subspecialties
In 2014, there were 1,699 advanced physician trainees undertaking training with the Royal Australasian College of Physicians (RACP) in adult medicine (Table 4.22).
Of all the subspecialties, general medicine and geriatric medicine had the largest numbers of advanced trainees (487 and 224 respectively).
Table 4.22: Physician adult medicine advanced trainees: Total, proportion of total and females by subspecialty, 2014
Subspecialty Trainees(b) Proportion (%) FemalesCardiology 166 9.8 35Clinical genetics 8 0.5 7Clinical pharmacology 10 0.6 3Endocrinology(a) 140 8.2 97Gastroenterology 118 6.9 45General medicine 487 28.7 218Geriatric medicine 224 13.2 128Haematology(b) 171 10.1 94Immunology and allergy(c) 42 2.5 21Infectious diseases(d) 124 7.3 74Medical oncology 163 9.6 92Nephrology 106 6.2 60Neurology 88 5.2 47Nuclear medicine 15 0.9 4Palliative medicine(e) 71 4.2 47Respiratory and sleep medicine 138 8.1 63Rheumatology 40 2.4 28Total(f) 1,699 100.0 862
(a) Includes trainees in either the Endocrinology or the joint Endocrinology/Chemical Pathology training program.(b) Includes trainees in either the Clinical Haematology or the joint Haematology training program.(c) Includes trainees in either the Clinical Immunology/Allergy or the joint Immunology/Allergy training program.(d) Includes trainees in either the Infectious Diseases or the joint Infectious Diseases/Microbiology training program.(e) Includes only divisional advanced trainees in palliative medicine, does not include Chapter trainees.(f) The totals are not cumulative sums of the figures above as some trainees are enrolled in multiple subspecialties
(i.e. dual trainees).
Source: Royal Australasian College of Physicians

MTRP 18th Report 81
Table 4.23 shows the numbers of advanced training positions in adult medicine subspecialties in each of the states and territories.
Table 4.23: Physician adult medicine advanced trainees by subspecialty and state/territory, 2014
Subspecialty NSW VIC QLD SA WA TAS NT ACT AUSCardiology 65 43 31 11 9 3 1 3 166Clinical genetics 5 1 2 0 0 0 0 0 8Clinical pharmacology 2 1 3 4 0 0 0 0 10Endocrinology(a) 48 47 28 7 7 1 1 1 140Gastroenterology 43 36 18 12 8 0 0 1 118General medicine 72 168 120 49 43 19 9 7 487Geriatric medicine 60 74 36 20 26 4 1 3 224Haematology(b) 62 50 25 13 9 4 0 8 171Immunology and allergy(c) 16 9 4 6 7 0 0 0 42Infectious diseases(d) 35 39 26 7 6 5 4 2 124Medical oncology 61 51 26 11 7 1 0 6 163Nephrology 35 35 17 7 7 1 2 2 106Neurology 35 32 9 6 3 1 1 1 88Nuclear medicine 8 3 2 0 1 0 0 1 15Palliative medicine(e) 26 17 12 8 8 0 0 0 71Respiratory and sleep medicine 44 37 25 15 9 1 2 5 138Rheumatology 12 14 5 5 2 0 0 2 40Total(f) 543 520 296 144 120 28 14 34 1,699(a) Includes trainees in either the Endocrinology or the joint Endocrinology/Chemical Pathology training program.(b) Includes trainees in either the Clinical Haematology or the joint Haematology training program.(c) Includes trainees in either the Clinical Immunology/Allergy or the joint Immunology/Allergy training program.(d) Includes trainees in either the Infectious Diseases or the joint Infectious Diseases/Microbiology training program.(e) Includes only divisional advanced trainees in palliative medicine, does not include Chapter trainees.(f) The totals are not cumulative sums of the figures above as some trainees are enrolled in multiple subspecialties
(i.e. dual trainees).
Source: Royal Australasian College of Physicians

MTRP 18th Report 82
Physician Paediatric Subspecialties
In 2014, there were 662 advanced paediatric and child health trainees with the RACP’s Paediatrics and Child Health Division (Table 4.24). Over two-thirds (482 or 72.8%) of these trainees were females.
The majority (545 or 82.3%) of all trainees were in general paediatrics.
Table 4.24: Physician paediatric and child health advanced trainees: Total, proportion of total and females by subspecialty, 2014
Subspecialty Trainees Proportion (%) FemalesCardiology 17 2.6 5Clinical genetics 15 2.3 10Clinical pharmacology 3 0.5 2Community child health 83 12.5 77Endocrinology 25 3.8 18Gastroenterology 11 1.7 7General paediatrics 545 82.3 403Haematology 13 2.0 10Immunology and allergy(a) 23 3.5 19Infectious diseases(b) 28 4.2 20Medical oncology 20 3.0 17Neonatal/perinatal medicine 94 14.2 48Nephrology 9 1.4 6Neurology 14 2.1 11Nuclear medicine 0 0 0Paediatric emergency medicine 54 8.2 34Palliative medicine(c) 7 1.1 7Respiratory and sleep medicine 22 3.3 16Rheumatology 3 0.5 3Total(d) 662 100.0 482
(a) Includes trainees in either the Clinical Immunology/Allergy or the joint Immunology/Allergy training program.(b) Includes trainees in either the Infectious Diseases or the joint Infectious Diseases/Microbiology training program.(c) Includes only divisional advanced trainees in palliative medicine, does not include Chapter trainees.(d) The totals are not cumulative sums of the figures above as some trainees are enrolled in multiple subspecialties
(i.e. dual trainees).
Source: Royal Australasian College of Physicians

MTRP 18th Report 83
Table 4.25 shows the numbers of training positions in paediatric subspecialties in each of the states and territories.
Table 4.25: Physician paediatric and child health advanced trainees by subspecialty and state/territory, 2014
Subspecialty NSW VIC QLD SA WA TAS NT ACT AUSCardiology 3 5 3 2 4 0 0 0 17Clinical genetics 6 5 0 3 1 0 0 0 15Clinical pharmacology 0 2 1 0 0 0 0 0 3Community child health 34 13 16 3 17 0 0 0 83Endocrinology 7 5 5 3 5 0 0 0 25Gastroenterology 2 3 4 0 2 0 0 0 11General paediatrics 193 129 91 38 74 5 11 4 545Haematology 6 3 2 2 0 0 0 0 13Immunology and allergy(a) 5 4 3 6 4 0 0 1 23Infectious diseases(b) 9 7 1 4 5 0 2 0 28Medical oncology 7 2 4 5 2 0 0 0 20Neonatal/perinatal medicine 26 20 21 11 10 2 1 3 94Nephrology 3 4 1 0 1 0 0 0 9Neurology 7 1 2 1 3 0 0 0 14Nuclear medicine 0 0 0 0 0 0 0 0 0Paediatric emergency medicine 17 13 14 5 3 0 2 0 54Palliative medicine(c) 2 3 1 0 1 0 0 0 7Respiratory and sleep medicine 9 5 3 2 2 1 0 0 22Rheumatology 0 2 0 0 1 0 0 0 3Total(d) 226 159 115 58 82 6 11 5 662
(a) Includes trainees in either the Clinical Immunology/Allergy or the joint Immunology/Allergy training program.(b) Includes trainees in either the Infectious Diseases or the joint Infectious Diseases/Microbiology training program.(c) Includes only divisional advanced trainees in palliative medicine, does not include Chapter trainees.(d) The totals are not cumulative sums of the figures above as some trainees are enrolled in multiple subspecialties
(i.e. dual trainees).
Source: Royal Australasian College of Physicians

MTRP 18th Report 84
Surgical Subspecialties
In 2014, there were 1,094 advanced surgical trainees undertaking training with the RACS (Table 4.26). Of these, over one-quarter (301 or 27.5%) were females.
Of the nine subspecialties, general surgery and orthopaedic surgery had the highest numbers of trainees (444 and 225 respectively).
Table 4.26: Surgical advanced trainees: Total, proportion of total and females by subspecialty, 2014
Subspecialty Trainees Proportion (%) FemalesCardiothoracic surgery 37 3.4 4General surgery 444 40.6 160Neurosurgery 57 5.2 15Orthopaedic surgery 225 20.6 20Otolaryngology, head and neck surgery 71 6.5 25Paediatric surgery 28 2.6 16Plastic and reconstructive surgery 78 7.1 24Urology 114 10.4 28Vascular surgery 40 3.7 9Total 1,094 100.0 301Source: Royal Australasian College of Surgeons
Table 4.27 shows the numbers of training positions in surgical subspecialties in each of the states and territories.
Table 4.27: Surgical advanced trainees by subspecialty and state/territory, 2014
Subspecialty NSW VIC QLD SA WA TAS NT ACT AUSCardiothoracic surgery 14 13 5 3 1 1 0 0 37General surgery 175 126 78 26 33 0 3 3 444Neurosurgery 19 12 10 7 4 3 0 2 57Orthopaedic surgery 81 51 44 20 27 0 0 2 225
Otolaryngology, head and neck surgery 23 20 10 8 7 0 0 3 71Paediatric surgery 4 9 5 1 1 0 1 7 28Plastic and reconstructive surgery 24 24 13 7 10 0 0 0 78Urology 37 36 26 7 8 0 0 0 114Vascular surgery 11 15 8 4 1 0 0 1 40Total 388 306 199 83 92 4 4 18 1,094
Source: Royal Australasian College of Surgeons

MTRP 18th Report 85
Trends in Advanced Training
The total number of advanced training positions/trainees increased by over 35% between 2010 and 2014 (Table 4.28). The proportion of female advanced trainees increased slightly across the five years to its highest level of 52.6% in 2014. Similarly, the number and proportion of part-time advanced trainees reached its highest levels of 2,075 and 16.2% respectively.
Table 4.28: Vocational training positions/trainees: Total, advanced, female advanced and part-time advanced trainees, 2010-2014
Total college trainees
Advanced training
positions/ trainees
Female advanced
trainees
Proportionfemale
(%)
Part-time advanced
trainees
Proportion part-time
(%)2010 14,679 9,432 4,494 47.6 971 10.32011 15,478 10,214 5,116 50.1 1,416 13.92012 16,740 10,996 5,536 50.3 1,220 11.12013 17,888 11,832 6,160 52.1 1,576 13.32014 19,158 12,791 6,733 52.6 2,075 16.2Change 2010-2014 (%) 30.5 35.6 49.8 10.6 113.7 57.5
Source: Medical colleges and GPET
Over the five years from 2010 to 2014, a number of medical colleges increased training numbers (Table 4.29). The ACRRM showed the largest increase of 144.3% between 2010 and 2014. This was followed by addiction medicine and ophthalmology, showing increases of 100% and 83.7% respectively. Palliative medicine and sexual health medicine were the only specialities that did not show an increase in total advanced trainees between 2010 and 2014.

MTRP 18th Report 86
Table 4.29: Advanced training positions/trainees by medical specialty, 2010-2014
Medical specialty 2010 2011 2012 2013 2014
Change 2010-2014
(%)Addiction medicine 11 13 18 24 22 100.0Adult medicine 1,406 1,469 1,468 1,513 1,699 20.8Anaesthesia 612 566 609 657 664 8.5Anaesthesia - pain medicine 51 58 59 65 66 29.4Dermatology 45 54 57 49 54 20.0Emergency medicine(a) 881 1,090 1,204 1,339 1,355 53.8General practice - GPET 2,572 2,948 3,289 3,932 (q)4,315 67.8 - ACRRM(b) 70 6 (i)156 155 171 144.3Intensive care 332 312 302 281 336 1.2Medical administration 105 86 98 (m)107 (m)115 9.5Obstetrics and gynaecology (d)123 143 (d)133 (d)159 (d)165 34.1Occupational and environmental medicine 87 80 84 102 92 5.7Ophthalmology (e)49 (f)86 (j)80 (n)90 (r)90 83.7Oral and maxillofacial surgery .. .. 38 38 38 ..Paediatrics(a) 583 640 593 556 662 13.6Palliative medicine 58 71 24 80 (s)28 -51.7Pathology 301 314 314 301 307 2.0Pathology and RACP (jointly) 131 173 208 213 236 80.2Psychiatry 350 (g)368 (k)417 (o)418 (t)418 19.4Public health medicine 60 72 61 81 81 35.0Radiation oncology 110 137 141 122 117 6.4Radiodiagnosis 333 366 372 364 410 23.1Rehabilitation medicine 143 162 177 191 202 41.3Sexual health medicine 19 7 10 20 13 -31.6Sport and exercise medicine .. 27 28 (p)30 41 ..Surgery(c) 1,000 (h)966 (l)1,094 983 1,094 9.4Total 9,432 10,214 11,034 11,870 12,791 35.6
(a) Emergency medicine and paediatrics both account for trainees undertaking paediatric emergency medicine.(b) Includes registrars on the Independent Pathway only.(c) RACS does not differentiate between basic and advanced surgical trainees as the surgical program is an integrated
program (SET).(d) Includes advanced Australian trainees who are undertaking FRANZCOG training only and not overseas trained
specialists (referred to by the College as SIMG) who are also undertaking RANZCOG advanced training as a requirement to obtain college fellowship.
(e) Includes 3rd and 4th years only, not 5th year.(f) Includes 6 trainees who are completing their final year of training overseas.(g) Includes 170 fellows undertaking subspecialty training.(h) Total number of surgical trainees in 2011 was 1,167, including 966 Australian, 180 New Zealand and 21 overseas
trainees.(i) Excludes 4 trainees living overseas. The definition of what counted as advanced training changed in 2012, hence the
significant change in the number of posts.(j) Includes 11 trainees who are completing their final year of training overseas.(k) Includes 229 fellows in subspecialty training.(l) Includes 183 New Zealand, 7 overseas accredited training posts and 7 New Zealand and 2 overseas SET trainees on
approved extended leave.(m) Excludes New Zealand and Hong Kong advanced trainees.(n) Includes 15 trainees who are currently completing their final year overseas.(o) Includes fellows completing advanced training certificates.(p) Excludes 9 trainees based overseas.(q) Figures for 2014 are for those enrolled in the 2014 training year and include those now withdrawn or fellowed.(r) Includes 10 trainees who are completing their final year of training overseas.(s) Includes chapter trainees only. Excludes Clinical Diploma chapter trainees as the training program is not leading to
fellowship of RACP or AChPM.(t) Includes 215 fellows in subspecialty training.
Source: Medical colleges and GPET

MTRP 18th Report 87
Advanced vocational training activity increased in most states and territories from 2010 to 2014 (Table 4.30).
However, the Australian Capital Territory had a decrease and showed considerable fluctuations across the five years. It should be noted that the true picture of increases in training in the Australian Capital Territory is distorted by the fact data for some specialties were previously reported within New South Wales data and general practice numbers continue to be reported together.
Table 4.30: Advanced training positions/trainees by state/territory, 2010-2014
NSW VIC QLD SA WA TAS NT ACT AUS(a)
2010 3,033 2,448 1,780 740 700 170 176 252 9,2772011 3,314 2,596 2,042 852 912 207 151 139 10,1942012 3,580 2,769 2,244 888 983 239 178 151 10,9962013 3,859 2,916 2,476 914 1,052 250 208 143 11,8322014 4,203 3,160 2,634 969 1,205 264 203 153 12,791Change 2010–2014 (%) 38.6 29.1 48.0 30.9 72.1 55.3 15.3 -39.3 37.9
(a) Australian total differs from the sum of state/territory totals in some years because it includes trainees in overseas placements.
Source: Medical colleges and GPET
Overall, the proportion of advanced vocational trainees who are females has shown small increases every year from 2010 to 2014. In 2014, over half (52.6%) of all advanced vocational trainees were females (Table 4.31).
The proportion of female advanced trainees has fluctuated over the years in most specialties, particularly those with smaller numbers of trainees. In spite of this variation, there were specialties that consistently had lower proportions of female trainees, such as oral and maxillofacial surgery, sport and exercise medicine, surgery, occupational and environmental medicine and intensive care medicine. In contrast, obstetrics and gynaecology, paediatrics, public health medicine, rehabilitation medicine and general practice have maintained higher proportions of female advanced trainees, which were around three-fifths most years.

MTRP 18th Report 88
Table 4.31: Proportion of female advanced trainees by medical specialty, 2010-2014
Medical specialty 2010 2011 2012 2013 2014
Change 2010-2014
(%)Proportion female (%)
Addiction medicine 36.4 30.8 44.4 46.0 45.5 24.9Adult medicine 42.3 43.0 45.6 48.0 50.7 19.9Anaesthesia 39.9 43.1 44.0 44.9 47.6 19.3Anaesthesia - pain medicine 29.4 27.6 38.9 52.3 42.4 44.3Dermatology 55.6 61.1 73.7 63.3 50.0 -10.1Emergency medicine 38.6 41.1 40.9 41.4 40.5 5.0General practice 64.9 .. .. .. .. .. - GPET .. 65.8 64.9 64.9 64.9 .. - ACRRM .. 33.3 27.5 25.0 18.1 ..Intensive care 27.1 26.9 30.5 32.7 32.1 18.6Medical administration 27.6 41.9 39.8 40.2 37.4 35.5Obstetrics and gynaecology 65.0 60.1 65.4 69.2 74.5 14.7Occupational and environmental medicine 14.9 21.3 20.2 24.5 31.5 111.6Ophthalmology 38.8 38.4 23.8 40.0 42.2 8.8Oral and maxillofacial surgery na na 7.9 7.9 10.5 ..Paediatrics 61.4 65.9 65.3 67.0 72.8 18.6Palliative medicine 53.4 63.8 60.0 67.5 57.1 7.0Pathology (a)80.1 59.2 64.3 58.8 62.5 ..Pathology and RACP (jointly) .. 47.4 35.7 56.3 57.6 ..Psychiatry 55.1 63.0 55.6 55.0 50.7 -8.0Public health medicine 61.7 52.8 67.0 65.0 72.8 18.1Radiation oncology 58.2 51.8 56.7 53.2 51.3 -11.9Radiodiagnosis 31.8 31.4 46.5 34.0 37.6 18.2Rehabilitation medicine 61.5 64.8 68.9 69.0 66.3 7.9Sexual health medicine 52.6 28.6 80.0 70.0 69.2 31.6Sport and exercise medicine .. 22.2 25.0 20.5 22.0 ..Surgery 22.8 (b)23.8 25.5 28.1 27.5 20.7Total (%) 47.6 49.9 50.4 52.0 52.6 10.6Total female trainees 4,494 5,116 5,536 6,160 6,733 49.8
(a) In 2010 the proportion was calculated for pathology medical specialty only. The percentage for both pathology and RACP (jointly) was 53.4.
(b) The total proportion of female surgical trainees including Australian, New Zealand and overseas was 24.4%.
Source: Medical colleges and GPET

MTRP 18th Report 89
The proportion of female advanced trainees (Table 4.32) remains fairly constant across states, approximately in the range of 40% to 60% each year. However, the Northern Territory has consistently had the highest proportion of female trainees each year (fluctuating between a low of 52.3% in 2010 and peaking at 61.6% in 2011).
Table 4.32: Proportion of female advanced trainees by state/territory, 2010-2014
NSW VIC QLD SA WA TAS NT ACT AUSProportion female (%)
2010 50.0 48.8 46.1 46.4 48.9 57.6 52.3 40.1 47.62011 53.8 49.9 47.3 48.2 47.3 51.2 61.6 34.5 50.22012 52.7 50.8 46.8 50.2 50.9 52.7 60.1 35.8 50.32013 53.4 52.5 48.8 52.2 54.2 53.6 57.7 39.9 52.12014 54.0 53.4 49.4 50.9 53.8 55.3 58.6 45.1 52.6
Source: Medical colleges and GPET
The number of part-time advanced trainees increased by 31.7% between 2013 and 2014 (Table 4.33). It is difficult to distinguish any discernible trends in part-time training due to fluctuations in part-time advanced trainee numbers from year to year.

MTRP 18th Report 90
Table 4.33: Advanced trainees undertaking part-time training by medical specialty, 2010-2014Medical specialty 2010 2011 2012 2013 2014Addiction medicine 5 3 4 5 7Adult medicine 59 63 55 48 63Anaesthesia 24 25 45 24 21Anaesthesia - Pain medicine 6 6 8 10 11Dermatology 5 2 7 6 4Emergency medicine(a),(b) (e)23 44 105 193 295General practice 631 .. .. .. .. - GPET(c) .. 991 (f)715 1,020 (h)1,368 - ACRRM .. 0 0 0 0Intensive care 1 3 5 4 6Medical administration 1 5 4 (g)9 25Obstetrics and gynaecology 3 7 6 8 8Occupational and environmental medicine 0 0 0 0 0Ophthalmology 1 0 3 4 2Oral and maxillofacial surgery na na na na naPaediatrics(a) 76 154 74 75 98Palliative medicine 6 2 4 11 6Pathology 11 18 28 15 20Pathology and RACP (jointly) .. 1 5 9 7Psychiatry 64 29 82 78 58Public health medicine 11 17 16 7 23Radiation oncology 4 2 5 5 8Radiodiagnosis 7 13 8 11 14Rehabilitation medicine 26 24 31 25 17Sexual health medicine 11 4 5 7 5Sport and exercise medicine 1 0 3 2 3Surgery(d) 1 3 2 0 6Total 977 1,416 1,220 1,576 2,075
(a) Emergency medicine and paediatrics data account for trainees undertaking paediatric emergency medicine.(b) Numbers reflect trainees who have undertaken part-time training at any time during the first half of the year. This does
not mean they have been in part-time training for the whole year.(c) Registrars are part-time if their training time fell below 89% of a full-time equivalent registrar in either of the semesters
for that training year.(d) RACS does not differentiate between basic and advanced surgical trainees as the surgical program is an integrated
program (SET).(e) 2010 data is year to date of posts credentialed.(f) Due to a different methodology being used to calculate part-time trainees in the 17th report this figure was changed to
715 from 874 published in the 16th report.(g) Excludes the New Zealand and Hong Kong advanced trainees.(h) Figures for 2014 are for those enrolled in the 2014 training year and include those now withdrawn or fellowed.
Source: Medical colleges and GPET

MTRP 18th Report 91
General Practice
General practitioners’ training under the AGPT program is provided through 17 regional training providers. Data from these providers are presented in Table 4.34. A total of 1,222 trainees or 28.3% were in their first year of a three or four year full-time program.
Almost two-thirds (64.9%) of all general practice trainees were females.
Table 4.34: General practice trainees: Registrars, first-year registrars and female registrars by state/territory and training consortium, 2014(a),(b)
Regional training provider Registrars
Proportion registrars
(%)First-year registrars
Female registrars
Proportion female
(%)New South Wales and Australian Capital Territory
Beyond Medical Education (NSW)(c) 116 8.0 34 79 68.1CoastCityCountry Training Inc(d) 308 21.4 86 197 64.0General Practice Training - Valley to Coast 218 15.1 55 152 69.7GP Synergy 426 29.6 128 284 66.7North Coast NSW General Practice Training Ltd 167 11.6 37 103 61.7WentWest Ltd 206 14.3 55 146 70.9
Total NSW and ACT 1,441 395 961 66.7Victoria
Beyond Medical Education (VIC)(c) 161 17.9 45 105 65.2Bogong Regional Training Network 113 12.6 36 62 54.9Southern GP Training Ltd 237 26.4 71 151 63.7Victorian Metropolitan Alliance 388 43.2 111 253 65.2
Total VIC 899 263 571 63.5Queensland
General Practice Training Queensland 504 53.2 140 323 64.1Queensland Rural Medical Education 214 22.6 54 118 55.1Tropical Medical Training 230 24.3 66 143 62.2
Total QLD 948 260 584 61.6South Australia
Adelaide to Outback Training Program 169 50.8 51 108 63.9Sturt Fleurieu General Practice Education and Training 164 49.2 48 99 60.4
Total SA 333 99 207 62.2Western Australia
WAGPET Ltd 447 100.0 137 316 70.7
Total WA 447 137 316 70.7Tasmania
General Practice Training Tasmania 134 100.0 35 93 69.4
Total TAS 134 35 93 69.4Northern Territory
Northern Territory General Practice Education Ltd 113 100.0 33 69 61.1
Total NT 113 33 69 61.1
Australia 4,315 1,222 2,801 64.9
(a) Registrars may train within more than one regional training provider or state. The totals may not sum to the state totals and the state totals may not sum to the national total.
(b) Figures are for those enrolled in the 2014 training year and include those now withdrawn or fellowed.(c) Beyond Medical Education serves an area that crosses over part of New South Wales and part of Victoria.(d) All training in ACT is included in the totals for CoastCityCountry Training Inc.
Source: GPET

MTRP 18th Report 92
Rural Pathway
In 2014, there were 2,137 registrars undertaking general practice training through the rural pathway.
The number of rural pathway registrars for each state and territory is shown in Table 4.35. The table also shows the percentage of all rural pathway registrars training in each jurisdiction. In 2014, a total of 26.1% of rural pathway registrars were trained in Queensland, 25.6% in New South Wales/Australian Capital Territory and 22.2% in Victoria.
Table 4.35: General practice rural pathway trainees by state/territory, 2014(a)
NSW/ACT VIC QLD SA WA TAS NT AUS(b)
Number 547 475 558 173 180 125 79 2,137Proportion of total (%) 25.6 22.2 26.1 8.1 8.4 5.8 3.7 100.0
(a) Figures are for those enrolled in the 2014 training year and include those now withdrawn or fellowed.(b) Includes both basic and advanced trainees together.
Source: GPET
Medical College ExaminationsThis section provides information on the number of Australian vocational trainees who sat college or faculty examinations in 2013 and the number of trainees who successfully passed.
Current Data
Table 4.36 presents data on the number of trainees sitting their final or fellowship examinations and highlights the considerable variation in the pass rate across medical specialties and even for different examinations required by colleges for a particular specialty.
Further information on the requirements of each college is provided under the heading ‘Training Assessment’ in Appendix B.
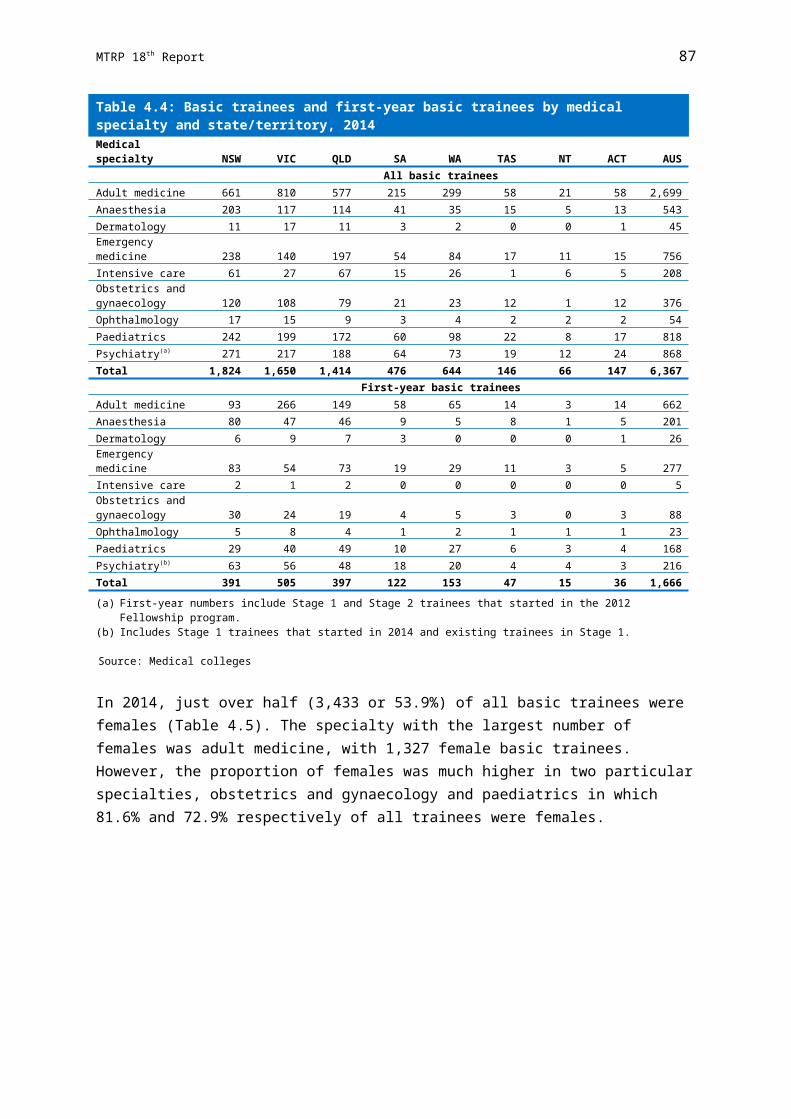
MTRP 18th Report 93
Table 4.36: Vocational trainees sitting a final or fellowship examination: Trainees sitting and proportion passing by medical specialty, 2013
Medical specialty ExaminationTrainees
sittingTrainees passing
Proportion passing
(%)Addiction Medicine .. na na naAdult medicine .. na na naAnaesthesia Fellowship 260 212 81.5Anaesthesia - pain medicine Fellowship 33 27 81.8Dermatology Fellowship Written 34 30 88.2
Fellowship Clinical 29 25 86.2
Emergency medicine 275 131 47.6General practice RACGP Fellowship Exam
AKT 880 743 84.4KFP 869 725 83.4
OSCE 813 754 92.7ACRRM Fellowship Exam
MSF 89 84 94.4MiniCEX 111 97 87.4
MCQ 95 71 74.7StAMPS 106 64 60.4
Intensive care General Fellowship exam 98 41 41.8Paediatric Fellowship exam 4 2 50.0
Medical administration Oral Examination 16 12 75.0Obstetrics and gynaecology Written 148 118 79.7
Oral 174 117 67.2Occupational and environmental Written 17 10 58.8medicine Practical 17 14 82.4Ophthalmology RANZCO Advanced Clinical Exam
(Written) 30 19 63.3RANZCO Advanced Clinical Exam
(Clinical) 30 26 86.7Oral and maxillofacial surgery OMS Final Examination 12 11 91.7Paediatrics .. na na naPalliative medicine .. na na naPathology Part II Examinations 107 93 86.9Psychiatry .. na na naPublic health medicine Final Program Assessment 20 15 75.0Radiation oncology Part II Written and Clinical Vivas 24 16 66.7Radiodiagnosis Part II FRANZCR Examination
Written and Vivas 87 58 66.7Rehabilitation medicine Written Short-Answer 33 28 84.8
Written MCQ 33 22 66.7Clinical 50 20 40.0
Sexual health medicine Exit Assessment Interview 0 0 0Sport and exercise medicine Written 21 8 38.1
Clinical 4 4 100.0Surgery Fellowship 335 (a)221 66.0
Total 4,854 3,818 78.7
(a) Includes 32 New Zealand trainees and 1 overseas trainee who also passed final or fellowship examination.
Source: Medical colleges

MTRP 18th Report 94
Table 4.37 presents the examination outcomes for the additional examinations that are required as part of some college training programs. The data covers Australian trainees only.
Table 4.37: Vocational trainees undertaking additional examinations: Numbers and proportions passing by medical specialty, 2013
Medical specialty Examination Time heldTrainees
sittingTrainees passing
Proportion passing
(%)Addiction medicine .. .. .. .. ..Adult medicine Written February 760 529 69.6
Clinical July 732 516 70.5
Anaesthesia (a)Part I Pharmacology February/May andwritten July/September 111
(a)Part I Pharmacology oral 102 95 85.6(a)Physiology written 25
(a)Physiology oral 19 14 56.0New Format Primary
Written 179New Format Primary Oral 111 100 55.9
Dermatology (b)Clinical sciences May .. .. ..Pharmacology May 18 17 94.4
(b)Clinical sciences November .. .. ..Pharmacology November 2 2 100.0
Emergency medicine Primary - Anatomy 457 144 31.5Primary - Pathology 430 216 50.2
Primary - Physiology 443 142 32.1Primary - Pharmacology 445 191 42.9
General practice - RACGP 0 0 0 0 0 - ACRRM .. .. .. .. ..Intensive care Part I May and November 48 25 52.1Medical administration .. .. .. .. ..Obstetrics and gynaecology na na na na naOccupational and environmental medicine .. .. .. .. ..Ophthalmology (c)Ophthalmic sciences 2 45 43 95.6
Ophthalmic BasicCompetencies and
Knowledge (OBCK) 2 30 27 90.0Ophthalmic pathology 2 22 22 100.0
Oral and maxillofacial The Surgical Sciences and
surgeryTraining (SST)
Examination May 14 11 78.6Paediatrics Written February 239 173 72.4
Clinical July 245 164 66.9Palliative medicine .. .. .. .. ..Pathology Basic pathology sciences April 51 47 92.2
Part 1 May/August 135 101 74.8
Psychiatry: Case Histories 282 227 80.5Basic training Written 206 143 69.4
(d)Clinical (OSCE only) 150 123 82.0
Public health medicine Part 1 (e)na (e)na (e)naRadiation oncology Part 1 Once 31 25 80.6Radiodiagnosis Part 1 Twice Yearly 107 94 87.9Rehabilitation medicine .. .. .. .. ..

MTRP 18th Report 95
Medical specialty Examination Time heldTrainees
sittingTrainees passing
Proportion passing
(%)Sexual health medicine .. .. 0 0 ..Sport and exercisemedicine na na 0 0 ..
Surgery Clinical ExamMay and
September 293 264 90.1Surgical Science Exam
(Generic)May and
September 341 257 75.4Surgical Science
(Specialty Specific)May and
September 429 244 56.9
(a) This format for the primary exam was replaced in 2013 with a new consolidated primary exam format. Both exams were run at the first exam sitting in 2013. This was the last sitting of the previous primary exam format.
(b) Please note that Clinical sciences are no longer run as an exam. It is now online modules that must be completed satisfactorily within one year.
(c) Trainees passing are those who sat at least one of the five Ophthalmic sciences exams in 2013 and passed.(d) A changed exam format was introduced by RANZCP in 2012 and these results reflect the Observed Structured Clinical
Examination (OSCE) pass rates only.(e) Public health medicine no longer has a Part 1 Exam.
Source: Medical colleges
Trends
Tables 4.38 and 4.39 provide data on the numbers passing their final or fellowship examinations and how these vary as a proportion of the total sitting each year from 2009 to 2013. Some specialties show considerable variation from one year to the next in the numbers and proportions passing each year.
This data should be interpreted cautiously, due to various college training requirements and changes to these across the years, and also due to relatively small numbers sitting examinations in some specialties.

MTRP 18th Report 96
Table 4.38: Vocational trainees who passed final or fellowship examination by medical specialty, 2009-2013
Medical specialty Examination 2009 2010 2011 2012 2013Anaesthesia Fellowship 189 169 176 229 212Anaesthesia - Pain medicine Fellowship 20 15 23 22 27Dermatology Fellowship Written 20 18 20 17 30
Fellowship Clinical 20 16 19 17 25
Emergency medicine 73 76 83 116 131General practice (b)RACGP Fellowship Exam 407 439 553 .. ..
AKT .. .. .. 672 743KFP .. .. .. 664 725
OSCE .. .. .. 651 754ACRRM Fellowship Exam .. .. .. .. 0
MSF 36 54 55 54 84MiniCEX 37 34 57 77 97
MCQ 22 44 74 70 71StAMPS 11 47 35 63 64
Intensive care General Fellowship exam 64 62 61 51 41Paediatric Fellowship exam 5 7 5 11 2
Medical administration Oral Examination 8 25 8 16 12Obstetrics and gynaecology Written 84 95 61 129 118
Oral 69 77 77 78 117Occupational and environmental Written 4 3 5 10 10medicine Practical 5 5 5 8 14Ophthalmology RANZCO Advanced Clinical
Exam 34 17 30 (d)23 (e)19Oral and maxillofacial surgery OMS Final Examination 9 7 4 8 11Pathology Part II Examinations 98 87 93 92 93Public health medicine Final Program Assessment 16 9 7 7 15Radiation oncology Part II Written and Clinical Vivas 19 22 19 19 16
RadiodiagnosisPart II FRANZCR Examination
Written and Vivas 70 61 64 58 58Rehabilitation medicine Written 16 21 15 36 na
Written Short-Answer .. .. .. .. 28Written MCQ .. .. .. .. 22
Clinical 16 20 20 19 20
Sexual health medicine .. .. 2 0 0
Sport and exercise medicine 1 4 4 4 4Surgery(a) Fellowship 197 (c)165 178 190 (f)188
(a) Excludes international medical graduates.(b) These figures were for the Training Program route only.(c) In addition there were 27 New Zealand trainees and 1 overseas trainee who also passed final or fellowship
examination.(d) There are two components to this examination and both must be passed to progress. The figure of 23 represents those
that passed both components.(e) There are two components to this examination and both must be passed to progress. This figure represents those that
passed both components within the 2013 calendar year.(f) In addition, there were 32 New Zealand trainees and 1 overseas trainee who also passed final or fellowship
examination.
Source: Medical colleges

MTRP 18th Report 97
Table 4.39: Proportion of vocational trainees sitting a final or fellowship examination who passed by medical specialty, 2009-2013
Medical specialty Examination 2009 2010 2011 2012 2013Proportion passing (%)
Adult medicine(a) Written 66.8 68.2 68.7 69.9 69.6Clinical 76.9 69.7 70.4 69.5 70.5
Anaesthesia 78.4 84.9 76.9 81.8 81.5
Anaesthesia - pain medicine 83.3 78.9 82.0 78.6 81.8Dermatology Written 83.3 85.7 83.3 81.0 88.2
Clinical 95.2 88.9 95.0 94.4 86.2Emergency medicine 65.8 66.1 62.9 60.7 47.6
General practice .. .. .. .. ..(c)RACGP Fellowship Exam 87.9 92.6 87.2 .. ..
AKT .. .. .. 90.0 84.4KFP .. .. .. 89.5 83.4
OSCE .. .. .. 92.5 92.7ACRRM Fellowship Exam .. .. .. .. ..
MSF 80.0 80.6 62.5 100.0 94.4MiniCEX 97.4 77.3 87.6 92.0 87.4
MCQ 64.7 62.9 77.0 81.0 74.7StAMPS 64.7 78.3 43.2 58.0 60.4
Intensive care General 55.0 56.4 56.0 60.7 41.8Paediatric 83.0 53.8 50.0 84.6 50.0
Medical administration 70.0 86.2 36.0 61.5 75.0Obstetrics and gynaecology Written 64.1 64.2 44.5 78.2 79.7
Oral 82.1 86.5 76.2 74.3 67.2Occupational and Written 40.0 33.3 38.5 76.9 58.8environmental medicine Practical 45.6 55.6 45.5 72.7 82.4Ophthalmology Written .. 84.0 78.9 76.5 63.3
Clinical 70.0 76.0 81.6 82.4 86.7Oral and maxillofacial surgery OMS Final Examination 100.0 87.5 66.6 72.7 91.7Paediatrics(a) Written 69.8 65.0 71.2 70.3 72.3
Clinical 72.2 67.3 67.5 65.8 66.9
Pathology 97.0 89.7 90.0 89.3 86.9
Psychiatry na na na na na
Public health medicine 70.0 69.2 54.0 63.6 75.0
Radiation oncology 76.0 78.6 76.0 63.3 66.7
Radiodiagnosis 76.0 67.0 76.2 63.7 66.7Rehabilitation medicine Written 66.6 72.4 58.0 92.3 na
Written Short-Answer na na na na 84.8Written MCQ na na na na 66.7
Clinical 62.5 66.7 69.0 47.5 40.0
Sexual health medicine .. 2.0 66.0 na naSport and exercise medicine Written 100.0 44.4 66.7 80.0 38.1
Clinical 100.0 100.0 100.0 100.0 100.0
Surgery(b) 91.6 80.9 65.7 61.1 66.0
(a) Exam results for adult and paediatric medicine refer to the basic training written and clinical exams.(b) Excludes international medical graduates.(c) These figures are for the Training Program route only.
Source: Medical colleges

MTRP 18th Report 98
New College Fellows
Current Data
There were 2,954 new fellows of medical colleges in 2013. Of these, 1,341 or 45.4% were females (Table 4.40). Nearly one-quarter (710 or 24%) were overseas trained specialists who were assessed as having qualifications substantially comparable with specialists trained by the medical college in Australia and awarded fellowship of that college.
Table 4.40: New fellows: Total, females and overseas trained specialists by medical specialty, 2013
Medical specialty Total
Proportion all new fellows
(%) Female
Proportion
female (%)
Overseastrained
specialists
Proportion
overseastrained (%)
Addiction medicine 3 0.1 1 33.3 0 0Adult medicine 438 14.8 187 42.7 59 13.5Anaesthesia 256 8.7 108 42.2 56 21.9Anaesthesia - pain medicine 14 0.5 5 35.7 0 0Dermatology 23 0.8 12 52.2 6 26.1Emergency medicine 115 3.9 44 38.3 23 20.0
General practice - RACGP (b)1,096 37.1 (f)576 52.6 361 32.9 - ACRRM 85 2.9 28 32.9 12 14.1Intensive care (c)52 1.8 (g)16 30.8 5 9.6Medical administration 13 0.4 6 46.2 0 0Obstetrics and gynaecology 68 2.3 41 60.3 19 27.9Occupational and environmental medicine 8 0.3 0 0 1 12.5Ophthalmology (d)36 1.2 (h)11 30.6 12 33.3Oral and maxillofacial surgery 11 0.4 0 0 0 0Paediatrics 134 4.5 76 56.7 24 17.9Palliative medicine 15 0.5 13 86.7 1 6.7Pathology 55 1.9 28 50.9 10 18.2Pathology and RACP (jointly) 43 1.5 19 44.2 0 0Psychiatry 141 4.8 64 45.4 56 39.7Public health medicine 7 0.2 5 71.4 1 14.3Radiation oncology 23 0.8 15 65.2 3 13.0Radiodiagnosis 100 3.4 32 32.0 17 17.0Rehabilitation medicine 20 0.7 14 70.0 2 10.0Sexual health medicine 3 0.1 1 33.3 1 33.3Sport and exercise medicine (e)2 0.1 2 100.0 0 0Surgery(a) 193 6.5 37 19.2 41 21.2Total 2,954 100.0 1,341 45.4 710 24.0
(a) Includes new fellows through SET program and overseas trained specialists that have been awarded fellowship.(b) Excludes 99 new fellows who live overseas.(c) Excludes 17 new fellows who live overseas.(d) Excludes 6 new fellows who live overseas.(e) Excludes 1 New Zealand new fellow.(f) Excludes 38 female new fellows who live overseas.(g) Excludes 9 new fellows who live overseas.(h) Excludes 1 female new fellow who lives overseas.
Source: Medical colleges

MTRP 18th Report 99
Data on the state or territory in which new fellows resided are shown in Table 4.41.
Table 4.41: New fellows by medical specialty and state/territory, 2013
Medical specialty NSW VIC QLD SA WA TAS NT ACT AUSAddiction medicine 0 0 0 1 1 0 1 0 3Adult medicine 125 148 79 37 37 3 4 5 438Anaesthesia 71 63 50 15 40 4 8 5 256Anaesthesia - pain medicine 6 5 2 1 0 0 0 0 14Dermatology 5 9 4 1 4 0 0 0 23Emergency medicine 24 25 37 8 16 3 1 1 115General practice - RACGP 331 225 247 82 152 31 9 19 (a)1,096 - ACRRM 12 9 43 4 9 1 7 0 85Intensive care 13 16 12 2 6 0 1 2 52Medical administration 1 3 5 1 2 0 0 1 13Obstetrics and gynaecology 19 23 13 2 6 3 1 1 68Occupational and environmental medicine 1 2 4 0 1 0 0 0 8Ophthalmology 12 8 11 1 2 1 1 0 (b)36Oral and maxillofacial surgery 1 1 3 1 3 1 1 0 11Paediatrics 43 36 25 6 19 2 3 0 134Palliative medicine 5 7 1 2 0 0 0 0 15Pathology 14 13 14 5 8 0 1 0 55Pathology and RACP (jointly) 18 9 9 1 4 1 0 1 43Psychiatry 38 36 32 10 18 5 1 1 141Public health medicine 0 1 0 2 1 1 0 2 7Radiation oncology 9 4 6 1 1 0 1 1 23Radiodiagnosis 22 35 19 4 15 3 0 2 100Rehabilitation medicine 6 3 4 4 3 0 0 0 20Sexual health medicine 2 0 0 1 0 0 0 0 3Sport and exercise medicine 0 0 0 0 1 0 0 1 2Surgery 54 66 40 12 15 2 4 0 193Total 832 747 660 204 364 61 44 42 2,954
(a) Excludes 99 new fellows who live overseas.(b) Excludes 6 new fellows who live overseas.
Source: Medical colleges

MTRP 18th Report 100
The distribution across states and territories of female new fellows followed a similar pattern to the distribution of all new fellows (Table 4.42).
Table 4.42: Female new fellows by medical specialty and state/territory, 2013
Medical specialty NSW VIC QLD SA WA TAS NT ACT AUSAddiction medicine 0 0 0 0 0 0 1 0 1Adult medicine 68 63 24 13 17 1 0 1 187Anaesthesia 33 26 14 9 19 3 2 2 108Anaesthesia - pain medicine 2 3 0 0 0 0 0 0 5Dermatology 3 7 1 0 1 0 0 0 12Emergency medicine 8 10 8 6 9 2 1 0 44General practice - RACGP(a) 183 116 132 42 70 17 8 8 576 - ACRRM 4 3 17 0 1 1 2 28Intensive care 6 5 3 0 1 0 1 0 16Medical administration 0 1 4 1 0 0 0 0 6Obstetrics and gynaecology 11 16 6 2 4 1 1 0 41Occupational and environmental medicine 0 0 0 0 0 0 0 0 0Ophthalmology 2 4 2 1 1 0 1 0 (b)11Oral and maxillofacial surgery 0 0 0 0 0 0 0 0 0Paediatrics 23 22 13 6 10 1 1 0 76Palliative medicine 5 6 0 2 0 0 0 0 13Pathology 8 5 7 2 5 0 1 0 28Pathology and RACP (jointly) 8 4 3 0 2 1 0 1 19Psychiatry 18 20 16 5 5 0 0 0 64Public health medicine 0 1 0 1 1 0 0 2 5Radiation oncology 8 2 3 0 0 0 1 1 15Radiodiagnosis 7 13 3 2 4 1 0 2 32Rehabilitation medicine 4 3 1 4 2 0 0 0 14Sexual health medicine 0 0 0 1 0 0 0 0 1Sport and exercise medicine 0 0 0 0 1 0 0 1 2Surgery 10 14 9 2 2 0 0 0 37Total 411 344 266 99 155 28 20 18 1,341
(a) Excludes 38 female new fellows who live overseas.(b) Excludes 1 female new fellow who lives overseas.
Source: Medical colleges

MTRP 18th Report 101
Trends
Table 4.43 shows that the number of new fellows increased by 23.3% between 2009 (2,396) and 2013 (2,954). The number of new fellows reported in 2013 slightly decreased from 2012, as new fellows who live overseas have been excluded from the total.
General practice had the largest increase in terms of absolute number over the five years, with 213 more new fellows in 2013 than 2009. In terms of proportional increases, the number of new fellows in ophthalmology was over three times (227.3%) higher than in 2009.
Table 4.43: New fellows by medical specialty, 2009-2013
Medical specialty 2009 2010 2011 2012 2013Change
2009-2013 (%)Addiction medicine 6 3 1 4 3 -50.0Adult medicine 397 346 362 456 438 10.3Anaesthesia 197 243 223 229 256 29.9Anaesthesia - pain medicine 9 17 12 19 14 55.6Dermatology 11 26 21 20 23 109.1Emergency medicine 82 77 78 135 115 40.2General practice - RACGP 928 (b)835 (c)1,037 (h)1,216 (j)1,096 18.1 - ACRRM 40 28 (d)38 63 85 112.5Intensive care 63 60 50 63 (k)52 -17.5Medical administration 9 18 (e)14 19 13 44.4Obstetrics and gynaecology 56 82 90 81 68 21.4Occupational and environmental medicine 11 5 2 4 8 -27.3Ophthalmology 11 26 (f)29 (i)38 (l)36 227.3Oral and maxillofacial surgery na na 4 8 11 ..Paediatrics 116 91 102 146 134 15.5Palliative medicine 8 6 7 16 15 87.5Pathology 64 94 88 99 (m)98 53.1Psychiatry 125 154 131 136 141 12.8Public health medicine 12 15 4 7 7 -41.7Radiation oncology 18 13 22 20 23 27.8Radiodiagnosis 44 54 77 115 100 127.3Rehabilitation medicine 13 22 23 26 20 53.8Sexual health medicine 1 0 3 3 3 200.0Sport and exercise medicine 1 1 3 2 (n)2 100.0Surgery(a) 174 184 212 217 193 10.9Total 2,396 2,400 (g)2,633 (g)3,142 2,954 23.3
(a) Includes new fellows through SET program and overseas trained specialists that have been awarded fellowship.(b) An additional 151 new fellows who live overseas joined the college in 2010.(c) Excludes 96 new fellows awarded fellowship who live overseas.(d) Excludes 2 new fellows who live overseas.(e) Includes 5 New Zealand and Hong Kong new fellows.(f) Includes 10 new fellows trained overseas.(g) Oral and maxillofacial surgery was a new medical specialty added in 2014. The numbers of new fellows for 2012 and
2013 have been amended accordingly.(h) Excludes 107 new fellows awarded fellowship but living overseas.(i) Includes 13 overseas trained specialists.(j) Excludes 99 new fellows who live overseas.(k) Excludes 17 new fellows who live overseas.(l) Excludes 6 new fellows who live overseas.(m) Includes new fellows from pathology, and pathology and RACP (jointly).(n) Excludes 1 New Zealand new fellow.
Source: Medical colleges

MTRP 18th Report 102
Table 4.44 shows the states and territories in which new fellows resided.
Table 4.44: New fellows by state/territory, 2009-2013
NSW VIC QLD SA WA TAS NT ACT AUS(a)
2009 620 548 471 196 225 47 25 41 2,2852010 734 603 479 179 272 52 29 40 2,3882011 744 713 603 198 242 45 31 41 2,6172012 863 759 702 241 328 89 43 64 3,1032013 832 747 660 204 364 61 44 42 2,954Change 2009–2013 (%) 34.2 36.3 40.1 4.1 61.8 29.8 76.0 2.4 29.3
(a) Australian totals for 2009 and 2012 differ from the sum of state/territory numbers due to the inclusion of new fellows who completed their training overseas.
Source: Medical colleges
Table 4.45 shows that occupational and environmental medicine, surgery, intensive care, ophthalmology, medical administration, ophthalmology and radiodiagnosis generally have a lower proportion of female new fellows each year.
Between 2009 and 2013 the proportion of female new fellows varied year to year, particularly with smaller specialties.

MTRP 18th Report 103
Table 4.45: Proportion of female new fellows by medical specialty, 2009-2013
Medical specialty 2009 2010 2011 2012 2013Proportion female (%)
Addiction medicine 50.0 33.3 .. 25.0 33.3Adult medicine 35.8 37.6 37.0 39.9 42.7Anaesthesia 29.4 32.5 31.8 41.5 42.2Anaesthesia - pain medicine 33.3 29.4 33.3 15.8 35.7Dermatology 90.9 53.8 57.1 65.0 52.2Emergency medicine 36.6 44.2 34.6 45.2 38.3
General practice - RACGP 43.3 56.0 52.6 50.8 52.6 - ACRRM 27.5 39.3 23.7 31.7 32.9Intensive care 23.8 23.3 24.0 11.1 30.8Medical administration 11.1 27.8 7.1 42.1 46.2Obstetrics and gynaecology 62.5 56.6 63.3 54.3 60.3
Occupational and environmental medicine 9.1 20.0 0 50.0 0Ophthalmology 36.4 30.8 10.3 28.9 30.6Oral and maxillofacial surgery na na na na 0Paediatrics 47.4 57.1 63.7 64.4 56.7Palliative medicine 62.5 66.7 85.7 56.3 86.7Pathology 46.9 47.6 59.3 55.7 50.9Pathology and RACP (jointly) .. 48.4 37.9 51.7 44.2Psychiatry 42.4 46.8 45.0 52.9 45.4Public health medicine 58.3 53.3 75.0 57.1 71.4Radiation oncology 44.4 53.8 50.0 45.0 65.2Radiodiagnosis 40.9 24.1 29.9 31.3 32.0Rehabilitation medicine 69.2 59.1 60.9 57.7 70.0Sexual health medicine 100.0 0 100.0 33.3 33.3Sport and exercise medicine .. 0 33.3 50.0 100.0Surgery 19.5 14.1 15.1 19.4 19.2Total 39.0 44.0 43.7 44.7 45.4Female new fellows 935 1,057 1,149 1,402 1,341
Source: Medical colleges
While the proportion of female new fellows remained relatively stable over the period 2009 to 2013, the picture varied more at the state/territory level (Table 4.46). Most of this variation is due to fluctuations in relatively smaller numbers seen in some jurisdictions. The proportion of female new fellows for NSW increased every year over the five year period and in 2013 reached its highest level of 49.4%.

MTRP 18th Report 104
Table 4.46: Proportion of female new fellows by state/territory, 2009-2013
NSW VIC QLD SA WA TAS NT ACT AUSProportion female (%)
2009 41.3 42.7 37.8 42.3 40.0 61.7 44.0 34.1 39.22010 42.9 47.9 42.0 36.9 44.5 46.2 65.5 42.5 44.12011 44.4 47.7 41.1 41.9 35.5 60.0 29.0 53.7 43.82012 45.8 46.2 42.2 42.7 45.1 42.7 44.2 54.7 44.82013 49.4 46.1 40.3 48.5 42.6 45.9 45.5 42.9 45.4
Source: Medical colleges
New Fellows by Subspecialty – Selected Colleges
A number of the larger medical colleges have also provided data on new fellows, detailed by subspecialty. Obstetrics and gynaecology, pathology, physician (adult and paediatrics and child health) and surgical subspecialties are presented in Table 4.47 to Table 4.51.
Obstetrics and Gynaecology Subspecialties
Table 4.47: Obstetrics and gynaecology subspecialties: New fellows, females and proportion of females by subspecialty, 2013
Subspecialty New fellows(a) Female new fellows Proportion female (%)Obstetrics and gynaecology ultrasound 2 2 100.0Maternal and fetal medicine 5 5 100.0Reproductive endocrinology and infertility 3 3 100.0Gynaecological oncology 2 1 50.0Urogynaecology 1 1 100.0Total 13 12 92.3
(a) Does not include new fellows who are still training in the subspecialty, see Table 4.19. Includes only those that completed their subspecialty training in 2013.
Source: Royal Australian and New Zealand College of Obstetricians and Gynaecologists
Pathology Subspecialties
Table 4.48: Pathology subspecialties: New fellows, females and proportion of females by subspecialty, 2013
Subspecialty New fellows Female new fellows Proportion female (%)Anatomical pathology 45 24 53.3Chemical pathology 2 0 0Forensic pathology 2 2 100.0Genetics pathology 0 0 0Haematology 33 13 39.4Immunopathology 6 3 50.0Microbiology 10 5 50.0Total 98 47 48.0
Source: Royal College of Pathologists of Australasia
Physician Adult Medicine Subspecialties

MTRP 18th Report 105
Table 4.49: Physician adult medicine subspecialties: New fellows, females and proportion of females by subspecialty(a), 2013
Subspecialty New fellows(b) Female new fellows(b) Proportion female (%)Cardiology 54 8 14.8Clinical genetics 0 0 0Clinical Haematology 1 1 100.0Clinical Immunology and Allergy 1 0 0Clinical pharmacology 2 2 100.0Endocrinology 29 21 72.4Endocrinology and chemical pathology 0 0 0Gastroenterology 39 15 38.5General medicine 67 19 28.4Geriatric medicine 40 17 42.5Haematology 19 8 42.1Immunology and allergy 5 2 40.0Infectious diseases 19 5 26.3Infectious diseases and microbiology 9 7 77.8Intensive care medicine 0 0 0Medical oncology 54 28 51.9Nephrology 36 20 55.6Neurology 27 14 51.9Nuclear medicine 2 0 0Palliative medicine 11 9 81.8Respiratory and sleep medicine(c) 45 15 33.3Rheumatology 8 6 75.0Total(d) 438 187 42.7
(a) Numbers reflect fellows within a sub-specialty. Due to fellows holding multiple sub-specialties this is not a one-to-one relationship.
(b) Includes those that were admitted as an overseas trained physician.(c) Includes fellows who completed training in thoracic medicine and thoracic and sleep medicine, Sleep I and II.(d) The totals listed are not cumulative totals of the numbers presented above, as the list of specialties is not exhaustive.
Source: Royal Australasian College of Physicians

MTRP 18th Report 106
Physician Paediatric Subspecialties
Table 4.50: Physician paediatric and child health subspecialties: New fellows, females and proportion of females by subspecialty(a), 2013
Subspecialty New fellows(b) Female new fellows(b) Proportion female (%)Cardiology 1 0 0Clinical genetics 4 4 100.0Clinical pharmacology 0 0 0Community child health 7 5 71.4Endocrinology 3 2 66.7Endocrinology and chemical pathology 0 0 0Gastroenterology 1 1 100.0General paediatrics 72 43 59.7Haematology 1 1 100.0Immunology and allergy 0 0 0Infectious diseases 4 2 50.0Intensive care medicine 0 0 0Medical oncology 3 1 33.3Neonatal/perinatal medicine 28 12 42.9Nephrology 1 1 100.0Neurology 3 1 33.3Nuclear medicine 0 0 0Paediatric emergency medicine 6 3 50.0Palliative medicine 0 0 0Respiratory and sleep medicine(c) 4 1 25.0Rheumatology 0 0 0Total(d) 134 76 56.7
(a) Numbers reflect fellows within a sub-specialty. Due to fellows holding multiple sub-specialties, this is not a one-to-one relationship.
(b) Includes those that were admitted as an overseas trained physician.(c) Includes fellows who completed training in thoracic medicine and thoracic and sleep medicine, Sleep I and II.(d) The totals listed are not cumulative totals of the numbers presented above, as the list of specialties is not exhaustive.
Source: Royal Australasian College of Physicians

MTRP 18th Report 107
Surgical Subspecialties
Table 4.51: Surgical subspecialties: New fellows, females and proportion of females by subspecialty, 2013
Subspecialty New fellows Female new fellows Proportion female (%)Cardiothoracic surgery 13 0 0General surgery 60 15 25.0Neurosurgery 8 3 37.5Orthopaedic surgery 50 3 6.0Otolaryngology, head and neck surgery 17 6 35.3Paediatric surgery 3 1 33.3Plastic and reconstructive surgery 14 3 21.4Urology 22 4 18.2Vascular surgery 6 2 33.3Total 193 37 19.2
Source: Royal Australasian College of Surgeons
College FellowsIn 2013, there were 50,704 medical practitioners who were fellows of medical colleges (Table 4.52). Just over one-third (17,783 or 35.1%) were females.
Overall, new fellows represented 5.8% of all college fellows. This proportion varied across specialties, with the largest proportions of new fellows in pathology and RACP (jointly) (8.6%), emergency medicine (7.9%) and intensive care (7.3%).

MTRP 18th Report 108
Table 4.52: Fellows: Total, number and proportion of females, and new fellows and proportion of all fellows by medical specialty, 2013
Medical specialty Fellow Female
Proportion female
(%)New fellow
2013
New fellows as a
proportion of all fellows (%)
Addiction medicine (a)155 (a)40 25.8 3 1.9Adult medicine (a)6,823 (a)2,034 29.8 438 6.4Anaesthesia 4,043 1,126 27.9 256 6.3Anaesthesia - pain medicine 252 54 21.4 14 5.6Dermatology (b)495 (f)200 40.4 23 4.6Emergency medicine 1,453 455 31.3 115 7.9General practice - RACGP (c)17,261 (g)8,068 46.7 (k)1,096 6.3 - ACRRM (d)1,459 (h)311 21.3 85 5.8Intensive care (e)713 (i)120 16.8 (l)52 7.3Medical administration 411 111 27.0 13 3.2Obstetrics and gynaecology 1,586 632 39.8 68 4.3Occupational and environmental medicine (a)240 (a)46 19.2 8 3.3Ophthalmology 827 161 19.5 (m)36 4.4Oral and maxillofacial surgery 172 16 9.3 11 6.4Paediatrics (a)1,984 (a)937 47.2 134 6.8Palliative medicine (a)220 (a)114 51.8 15 6.8Pathology 1,241 518 41.7 55 4.4Pathology and RACP (jointly) 501 185 36.9 43 8.6Psychiatry 3,154 1,185 37.6 141 4.5Public health medicine (a)402 (a)169 42.0 7 1.7Radiation oncology 327 135 41.3 23 7.0Radiodiagnosis 1,786 457 25.6 100 5.6Rehabilitation medicine 400 176 44.0 20 5.0Sexual health medicine (a)111 (a)60 54.1 3 2.7Sport and exercise medicine 70 (j)26 37.1 (n)2 2.9Surgery 4,618 447 9.7 (o)193 4.2Total 50,704 17,783 35.1 2,954 5.8
(a) Numbers are down from 2012 due mainly to the inclusion in 2012 of 'Retired' and 'Life' fellows (i.e. fellows aged 70+). These fellows have been excluded from the count in 2013.
(b) Excludes 17 fellows who live overseas.(c) Excludes 1,729 fellows who live overseas.(d) Excludes 19 fellows who live overseas.(e) Excludes 197 fellows who live overseas.(f) Excludes 5 female fellows who live overseas.(g) Excludes 703 female fellows who live overseas.(h) Excludes 2 female fellows who live overseas.(i) Excludes 52 fellows who live overseas.(j) Excludes 5 female fellows who live overseas.(k) Excludes 99 fellows who live overseas.(l) Excludes 17 new fellows who live overseas.(m) Excludes 6 new fellows who live overseas.(n) Excludes 1 New Zealand new fellow.(o) Includes new fellows through SET program and overseas trained specialists that have been awarded fellowship.
Source: Medical colleges

MTRP 18th Report 109
Overall, the distribution of fellows across states and territories was proportionate to the population as a whole (Table 4.53).
Table 4.53: Fellows by medical specialty and state/territory, 2013
Medical specialty NSW VIC QLD SA WA TAS NT ACT AUSAddiction medicine(a) 65 28 25 14 13 7 2 1 155Adult medicine(a) 2,213 2,008 1,148 558 570 138 53 135 6,823Anaesthesia 1,248 999 830 336 422 107 34 65 (c)4,043Anaesthesia - pain medicine 88 50 47 30 28 8 0 1 252Dermatology 194 132 85 39 45 0 0 0 495Emergency medicine 370 392 332 98 176 39 20 26 1,453General practice - RACGP 5,026 4,205 3,828 1,405 1,826 469 175 327 17,261 - ACRRM 411 233 425 183 120 34 31 22 1,459Intensive care 221 165 162 58 66 15 7 19 713Medical administration 117 97 99 26 33 7 6 26 411Obstetrics and gynaecology 497 443 311 116 146 34 13 26 1,586Occupational and environmental medicine(a) 74 55 34 25 32 7 0 13 240Ophthalmology 320 207 140 63 66 16 4 11 827Oral and maxillofacial surgery 39 54 38 12 19 2 2 6 172Paediatrics(a) 664 519 346 148 223 31 23 30 1,984Palliative medicine(a) 84 50 38 17 16 11 1 3 220Pathology 427 268 241 104 139 29 5 28 1,241Pathology and RACP (jointly) 193 112 82 35 53 9 2 15 501Psychiatry 966 910 585 279 289 57 14 54 3,154Public health medicine(a) 130 71 66 29 37 13 22 34 402Radiation oncology 119 82 66 20 22 7 2 9 327Radiodiagnosis 547 478 336 142 202 42 4 35 1,786Rehabilitation medicine(a) 194 111 43 28 12 5 3 4 400Sexual health medicine(a) 53 23 16 7 5 1 1 5 111Sport and exercise medicine 28 21 6 3 4 1 0 7 70Surgery 1,528 1,235 859 395 407 89 30 75 4,618Total 15,816 12,948 10,188 4,170 4,971 1,178 454 977 50,704Proportion of total (%) 31.2 25.5 20.1 8.2 9.8 2.3 0.9 1.9 100.0Population proportion (%)(b) 32.0 24.8 20.1 7.2 11.0 2.2 1.0 1.7 100.0
(a) Numbers are down from 2012 due mainly to the inclusion in 2012 of 'Retired' and 'Life' fellows (i.e. fellows aged 70+). These fellows have been excluded from the count in 2013. In addition, as a result of data cleansing exercises some fellows' status have changed from 'Active' to 'Retired' which also affects the statistics reported.
(b) Population data from ABS. 3101.0 - Australian Demographics Statistics, March 2014, released 25/09/2014.(c) No state/territory data available for 2 fellows.
Source: Medical colleges
The distribution of female fellows by states and territories followed a similar pattern to the distribution of all fellows (Table 4.54).

MTRP 18th Report 110
Table 4.54: Female fellows by medical specialty and state/territory, 2013
Medical specialty NSW VIC QLD SA WA TAS NT ACT AUSAddiction medicine 20 4 7 2 4 1 2 0 40Adult medicine 675 657 311 150 143 38 16 44 2,034Anaesthesia 345 280 229 84 129 30 9 20 1,126Anaesthesia - pain medicine 22 12 8 6 4 2 0 0 54Dermatology 83 57 31 19 10 0 0 0 200Emergency medicine 119 127 94 33 51 16 9 6 455General practice - RACGP 2,362 1,986 1,732 619 836 243 110 180 8,068 - ACRRM 77 44 102 41 20 10 12 5 311Intensive care 47 30 21 4 10 1 3 4 120Medical administration 37 26 20 7 6 1 4 10 111Obstetrics and gynaecology 181 199 114 48 57 13 9 11 632Occupational and environmental medicine 20 14 4 2 5 1 0 0 46Ophthalmology 64 54 17 14 8 1 1 2 161Oral and maxillofacial surgery 2 6 4 0 4 0 0 0 16Paediatrics 304 270 152 63 111 10 12 15 937Palliative medicine 51 22 16 11 8 5 1 0 114Pathology 197 103 93 42 55 13 1 14 518Pathology and RACP (jointly) 76 45 24 9 17 5 1 8 185Psychiatry 348 342 219 111 111 19 9 26 1,185Public health medicine 50 30 29 10 19 3 12 16 169Radiation oncology 56 31 29 5 6 2 1 5 135Radiodiagnosis 138 126 75 45 54 11 2 6 457Rehabilitation medicine 85 51 18 12 8 2 0 0 176Sexual health medicine 26 14 7 4 4 1 0 4 60Sport and exercise medicine 11 7 2 1 3 0 0 2 26Surgery 138 143 77 40 36 7 1 5 447Total 5,534 4,680 3,435 1,382 1,719 435 215 383 17,783Proportion of female fellows (%) 31.1 26.3 19.3 7.8 9.7 2.4 1.2 2.2 100.0
Source: Medical colleges

MTRP 18th Report 111
Fellows by Subspecialty – Selected Colleges
Data on fellows for pathology, physician (adult medicine and paediatric and child health) and surgical subspecialties are presented in Table 4.55 to Table 4.58.
Pathology Subspecialties
Table 4.55: Pathology fellows: Total, females and proportion of females by subspecialty, 2013Subspecialty Fellow Female fellow Proportion female (%)Anatomical pathology 772 356 46.1Chemical pathology 77 25 32.5Forensic pathology 43 17 39.5General pathology 81 16 19.8Genetic pathology 17 6 35.3Haematology 448 171 38.2Immunopathology 102 31 30.4Microbiology 196 80 40.8Oral and maxillofacial pathology 6 1 16.7Total 1,742 703 40.4
Source: Royal College of Pathologists of Australasia

MTRP 18th Report 112
Physician Adult Medicine Subspecialties
Table 4.56: Physician adult medicine fellows: Total, females and proportion of females by subspecialty(a), 2013
Subspecialty Fellow Female fellow Proportion female (%)Cardiology 935 139 14.9Clinical genetics 9 6 66.7Clinical haematology 8 3 37.5Clinical immunology and allergy 16 5 31.3Clinical pharmacology 50 12 24.0Endocrinology 452 242 53.5Endocrinology/Chemical pathology 5 5 100.0Gastroenterology 593 139 23.4General medicine 713 164 23.0Geriatric medicine 494 236 47.8Haematology 337 119 35.3Immunology and allergy 72 25 34.7Infectious diseases 271 112 41.3Infectious diseases and microbiology 35 18 51.4Intensive care medicine 68 9 13.2Medical oncology 483 218 45.1Nephrology 389 130 33.4Neurology 378 100 26.5Nuclear medicine 167 44 26.3Palliative medicine 80 58 72.5Respiratory and sleep medicine(b) 824 211 25.6Rheumatology 252 110 43.7Total(c) 6,823 2,034 29.8
(a) Numbers reflect fellows within a sub-specialty. Due to fellows holding multiple sub-specialties, this is not a one-to-one relationship.
(b) Includes fellows who completed training in thoracic medicine and thoracic and sleep medicine, Sleep I and II.(c) The totals listed are not cumulative totals of the numbers presented above, as the list of specialties is not exhaustive,
and there are several fellows who were admitted to fellowship when record-keeping practices did not denote a specialty.
Source: Royal Australasian College of Physicians

MTRP 18th Report 113
Physician Paediatric Subspecialties
Table 4.57: Physician paediatrics and child health fellows: Total, females and proportion of females by subspecialty(a), 2013
Subspecialty Fellow Female fellow Proportion female (%)Cardiology 27 3 11.1Clinical genetics 55 31 56.4Clinical haematology 2 0 0Clinical immunology and allergy 8 5 62.5Clinical pharmacology 3 2 66.7Community child health 80 69 86.3Endocrinology 40 26 65.0Endocrinology/Chemical pathology 0 0 0General paediatrics 696 379 54.5Gastroenterology 21 7 33.3Haematology 18 10 55.6Immunology and allergy 12 6 50.0Infectious diseases 22 12 54.5Infectious diseases and microbiology 3 0 0Intensive care medicine 8 1 12.5Medical oncology 40 17 42.5Neonatal/Perinatal medicine 157 73 46.5Nephrology 18 7 38.9Neurology 45 19 42.2Nuclear medicine 14 3 21.4Paediatric child and adolescent psychiatry 6 4 66.7Paediatric emergency medicine 81 47 58.0Palliative medicine 4 3 75.0Respiratory and sleep medicine(b) 87 42 48.3Rheumatology 15 5 33.3Total(c) 1,984 937 47.2
(a) Numbers reflect fellows within a sub-specialty. Due to fellows holding multiple sub-specialties, this is not a one-to-one relationship.
(b) Includes fellows who completed training in thoracic medicine and thoracic and sleep medicine, Sleep I and II.(c) The totals listed are not cumulative totals of the numbers presented above, as the list of specialties is not exhaustive,
and there are several fellows who were admitted to fellowship when record-keeping practices did not denote a specialty.
Source: Royal Australasian College of Physicians

MTRP 18th Report 114
Surgical Subspecialties
Table 4.58: Surgical fellows: Total, females and proportion of females by subspecialty, 2013
Subspecialty Fellow Female fellow Proportion female (%)Cardiothoracic surgery 175 10 5.7General surgery 1,539 204 13.3Neurosurgery 218 25 11.5Orthopaedic surgery 1,211 40 3.3Otolaryngology, head and neck surgery 429 48 11.2Paediatric surgery 89 22 24.7Plastic and reconstructive surgery 402 50 12.4Urology 378 31 8.2Vascular surgery 177 17 9.6Total 4,618 447 9.7
Source: Royal Australasian College of Surgeons

MTRP 18th Report 115
Chapter 5
INTERNATIONAL SUPPLYOverseas trained doctors are a key part of the medical workforce, not only in rural and remote areas, but metropolitan and regional areas as well. They may work in Australia on a temporary basis and many will go on to become permanent residents of Australia.
This chapter brings together the available data on medical practitioners who have trained overseas - their assessment by the Australian Medical Council and those with approved working visas issued by the Australian Government Department of Immigration and Border Protection.
International medical graduates must first apply to the Australian Government Department of Immigration and Border Protection for a visa under which they may work or continue their training in Australia. They are usually overseas when applying, but others who have already entered Australia can also apply. Applicants are then assessed by the Australian Medical Council as to whether they are eligible to seek registration to practise medicine in Australia. Prior to July 2010, they then had to apply to the relevant medical board to register to practise in a given state or territory. From July 2010, applicants must apply through the Australian Health Practitioner Regulation Agency (AHPRA) to be registered to practise nationally.
As part of their Medicare Provider Number applications to the Australian Government Department of Human Services – Medicare, overseas trained doctors must apply for an exemption under section 19AB of the Act in order to access Medicare benefits for the services they provide.
Further information is available at:
www.doctorconnect.gov.au
More details on these processes and the numbers entering Australia and being assessed are provided in this chapter.
Australian Government Department of Immigration and Border Protection Entry ProcessesThere are a number of visa classes and processes through which non-Australians can apply to work in Australia. Temporary visas range in duration from one day up to four years.
Until 30 June 2010, there were three subclasses of visas under which most medical practitioners entered Australia, namely subclasses 457, 422 and 442.
Temporary Work (Skilled) visa (subclass 457)
The Temporary Work (Skilled) visa (subclass 457) is the most commonly used program for employers to sponsor overseas workers to work on a temporary basis in Australia.

MTRP 18th Report 116
Recipients may remain in Australia for up to four years and can bring eligible family members with them. They can work full-time, but only for their sponsor or, in some circumstances, an associated entity of the sponsor. Doctors are able to work for multiple and/or unrelated entities, but their sponsor retains obligations in relation to them.
Applicants must comply with the following conditions:
be sponsored by an approved employer; have skills, qualifications, experience and an employment background that match
those required for the position; have a job with their approved sponsor; meet the English language requirement unless eligible for a waiver; be eligible to hold a licence or registration for the position (if required); and be paid the rate of guaranteed salary specified in the relevant nomination, based on
the market salary rate for the position.
Further information is available at:
http://www.immi.gov.au/Visas/Pages/457.aspx
Medical Practitioner (Temporary) visa (subclass 422)
Following the creation of flexible working arrangements for international medical graduates under the subclass 457 visa, the subclass 422 visa has not been available for new primary visa applicants since 1 July 2010.
These arrangements do not mean that all subclass 422 visas expired on 1 July 2010. All international medical graduates holding a subclass 422 visas on or after 1 July 2010 are able to remain on that visa until:
the end of the visa validity period; they change their employer sponsor; or they are granted a new visa subclass.
The Medical Practitioner (Temporary) visa (subclass 422) was only open to medical practitioners and permitted them to work in Australia for a sponsoring employer for a period of three months to four years. Applicants worked in Australia for their sponsoring employer, as an independent contractor or for multiple unrelated employers. There were special arrangements available if applicants wanted to work in rural or regional Australia. Applicants could bring eligible family members with them to Australia, who were able to work and study.
Applicants were to comply with the following conditions:
be eligible for at least conditional registration through the medical board to practise as a medical practitioner in the state or territory where they were to be employed;
have an offer of full-time employment with an Australian employer, such as a hospital, medical practice or area health service;
salary may include fees charged and Medicare rebates; comply with the required health examinations for their family;

MTRP 18th Report 117
have police clearances, for themselves and any family members over 16 years, if their stay exceeded 12 months; and
ensure that they and their family held adequate private medical and hospital health insurance cover for the entire time they were in Australia.
Further information is available at:
http://www.immi.gov.au/Visas/Pages/422.aspx
Occupational Trainee visa (subclass 442)
From 24 November 2012 the Occupational Trainee visa (subclass 442) was no longer open to new applicants. After this date people who wanted to come to Australia on a temporary basis to undertake work based training, research activities or a professional development program were required to apply for the new Training and Research visa (subclass 402).
The Occupational Trainee visa (subclass 442) allowed people to complete workplace-based training in Australia on a temporary basis in an approved training program. The training must have provided the visa holder with additional or enhanced skills in the nominated occupations, tertiary studies or fields of expertise. This visa was valid for up to two years (subject to the length of the approved training program).
People may have been nominated for this visa if the proposed occupational training was one of the following:
training or practical experience in the workplace required for the person to obtain registration for employment in their occupation in Australia or in their home country;
a structured workplace training program to enhance the person’s existing skills in an eligible occupation; or
structured workplace training to enhance the person’s skills and promote capacity building overseas.
Further information is available at:
http://www.immi.gov.au/Visas/Pages/442.aspx
Training and Research visa (subclass 402)
The Training and Research visa (subclass 402) is for people who want to come to Australia on a temporary basis to participate in occupational training, observe or participate in research as a visiting academic, or participate in a professional development program. There are three streams in the Training and Research visa (subclass 402):
Occupational Trainee stream; Research stream; and Professional Development stream.
The Occupational Trainee stream is for people who require structured workplace-based training to enhance their skills in their current occupation, area of tertiary study, or field of expertise.

MTRP 18th Report 118
The Research stream enables professional academics to visit Australia on a temporary basis, to observe or participate in an Australian research project at an Australian tertiary or research institution.
The Professional Development stream is for professionals, managers or government officials invited to participate in a professional development training program in Australia that has been arranged by an employer outside Australia and which usually lasts up to 18 months.
Further information is available at:
http://www.immi.gov.au/Visas/Pages/402.aspx
Current Data
In 2013-14, there were 2,650 visas granted to medical practitioners across the main subclasses – 457, 422 and 442/402 (Table 5.1).
The overall number of visas granted to medical practitioners in 2013-14 dropped to the lowest level for the past decade. The overall number of visas was 16.9% less than in2009-10 (3,190), just five years earlier.
The trend in the types of visas issued over this period has altered dramatically. The bulk of those (2,440 or 92.1%) being granted are now under subclass 457. This reflects the phasing out of visa subclass 422, with the numbers decreasing to zero from 2011-12 from a high of 1,380 visas issued in 2005-06.
Table 5.1: Major classes of primary visa granted to medical practitioners(a),(b), 2009-2010 to 2013-2014
Visa subclass 2009-10 2010-11 2011-12 2012-13 2013-14
2013-14 Proportion
of total(%)
Change 2012-13 to
2013-14(%)
Change 2009-10 to
2013-14(%)
457 2,670 2,930 3,300 2,860 2,440 92.1 -14.5 -8.7422(c) 260 40 0 0 0 na na na442/402 250 260 260 230 210 7.9 -10.7 -17.1
Total 3,190 3,220 3,560 3,090 2,650 100.0 -14.2 -16.9
(a) Figures are rounded to the nearest 10.(b) For Subclass 442/402 and 457, nominated occupations include Australian Standard Classification of Occupations 231
Medical Practitioner.(c) Subclass 422 is not available for new primary visa applicants from 1 July 2010.
Source: Australian Government Department of Immigration and Border Protection administrative data, 2014
As in previous years, in 2013-14 primary visa applications were granted to medical practitioners from all over the world (Table 5.2).
Many of those who applied to work in Australia came from countries, namely the United Kingdom, Republic of Ireland and Canada, which have very similar medical training and have been major sources of medical practitioners immigrating to Australia for decades. Almost half (44.1%) of visas under the three main classes were granted to applicants from the United Kingdom and Republic of Ireland. Just 5.1% and 2.2% of the medical practitioners granted visas came from Canada and the United States of America respectively.

MTRP 18th Report 119
More recently, larger numbers of international recruits have come from a number of Asian countries. In 2013-14 almost a third (28.5%) of all applications were granted to medical practitioners from Malaysia, India, Sri Lanka, Singapore, Iran and Pakistan (8.2%, 6.9%, 4.6%, 3.2%, 3.2% and 2.4% respectively of all visas under subclasses 457 and 442/402).
Medical practitioners from New Zealand do not require any of these visas to work in Australia.
Table 5.2: Primary visa applications granted to medical practitioners by visa subclass: Top 10 citizenship countries(a),(b), 2013-14
Citizenship country
Visa subclass
TotalProportion of total
(%)457 442/402United Kingdom 960 30 990 37.3Malaysia 200 20 220 8.2India 160 20 180 6.9Ireland, Republic of 180 < 5 180 6.8Canada 130 10 130 5.1Sri Lanka 110 20 120 4.6Singapore 70 20 90 3.2Iran 80 0 80 3.2Pakistan 60 0 60 2.4United States of America 50 10 60 2.2Other countries 440 90 530 20.1
Total 2,440 210 2,650 100.0
(a) Figures are rounded to the nearest 10.(b) Subclass 457 and 442/402, nominated occupations include Australian Standard Classification of Occupations 231
Medical Practitioners.
Source: Australian Government Department of Immigration and Border Protection administrative data, 2014
Table 5.3 shows the total number of medical practitioners who held each of the main subclasses of visa at the end of the 2012-13 and 2013-14 financial years, with 4,300 medical practitioners holding visas in these subclasses at 30 June 2014. There was a decrease of 10.7% on the 4,810 visa holders in the previous year. This suggests continuation of the downward trend in migration.
Table 5.3: Primary visa holders where the occupation is medical practitioner by visa subclass(a), 2012-13 and 2013-14
Visa type Visa holders at 30/06/2013 Visa holders at 30/06/2014Change 2012-13 to 2013-14
(%)457 4,600 4,140 -10.0422 40 <5 -94.3442/402 180 160 -13.3
Total 4,810 4,300 -10.7
(a) Figures are rounded to the nearest 10.
Source: Australian Government Department of Immigration and Border Protection administrative data, 2014

MTRP 18th Report 120
Requirements for Practicing Medicine in Australia Although national examinations for non-specialist international medical graduates have existed in Australia since 1978, states and territories had adopted different approaches to the assessment of some categories of Area of Need practitioners and specialists.
In July 2006 the Council of Australian Governments (COAG) agreed to the introduction of a nationally consistent assessment process for international medical graduates and overseas trained specialists. COAG gave Health Ministers the responsibility for implementation of this decision, and a model for a national process was developed and submitted to Health Ministers on 12 December 2006. The final report on the agreed pathways was presented to the Australian Health Ministers’ Advisory Committee (AHMAC) in October 2008.
This model outlines three main assessment pathways:
Competent Authority Pathway; Standard Pathway (including the current Australian Medical Council examination and
a workplace-based assessment pathway); and Specialist pathways for all specialties, including general practice:
- Standard specialist assessment;- Area of Need assessment; and- Overseas trained specialist in specified training position.
The Competent Authority Pathway was implemented from 1 July 2007 and the first stage of the Standard Pathway (workplace-based assessment) for general practitioners and non-specialist hospital doctors was implemented the following year, from 1 July 2008.
The Australian Medical Council (AMC) is an independent national standards body which is responsible for processing all initial inquiries regarding assessment of international medical graduates and overseas trained specialists. It was established by Australian Health Ministers as a legal entity in 1985 and became a Company Limited by Guarantee in 2008.
With implementation of the National Registration and Accreditation Scheme (NRAS) in July 2010, the AMC responsibilities were expanded to cover the following:
acting as an external accreditation entity for the purposes of the Health Practitioner Regulation National Law;
developing accreditation standards, policies and procedures for medical programs of study based predominantly in Australia and New Zealand and for assessment of international medical graduates for registration in Australia;
assessing, using the approved accreditation standards, medical programs and the institutions that provide them – both those leading to general registration and those leading to specialist registration of the graduates to practice medicine in Australia;
assessing other countries’ examining and accrediting authorities to decide whether persons who successfully complete the examinations or programs of study conducted or accredited by those authorities have the knowledge, clinical skills and professional attributes to practice medicine in Australia;

MTRP 18th Report 121
assessing the knowledge, clinical skills and professional attributes of overseas qualified medical practitioners seeking registration to practice medicine in Australia; and
assessing the case for recognition of medical specialties.
Further details on assessment requirements that are common to each of the pathways and the specific requirements of each are provided below.
Common Assessment Requirements
Each of the pathways includes some (or all) of the following steps:
assessment of English language proficiency at a nationally agreed level; primary source verification of qualifications; assessment against a position description with the level of assessment according to
level of risk (for Area of Need positions); orientation within three months of starting employment and evidence of satisfactory
completion of this submitted to the relevant medical board with the supervisor’s three-month report; and
access to continuing professional development.
Competent Authority Pathway
Competent Authorities are designated overseas accredited medical training and licensing examination authorities that have been reviewed and approved against criteria developed by the AMC as competent to undertake a basic assessment of medical knowledge and clinical skills for the purposes of registration in Australia. One of the criteria used to recognise a Competent Authority is the extent to which the clinical context of the country in which it operates is consistent with the Australian context of health care. This is defined in terms of the pattern of disease, level of medical technology, delivery of medical education and professional ethics. The AMC has approved four examination authorities in:
the United Kingdom (PLAB examination or for graduates of GMC-accredited medical courses);
the United States of America (the USMLE examination); Canada (the MCC Licensing Examination); and New Zealand (the NZREX examination).
Graduates of medical courses in Ireland are accredited by the Medical Council of Ireland.
International medical graduates undergo a pre-employment assessment of suitability for a position if required by the Medical Board of Australia (MBA). Where the board determines a Pre-Employment Structured Clinical Interview (PESCI) is required, it is carried out by anAMC-accredited provider against the position description. This may be carried out if required for more senior hospital-based positions and is included as a matter of course for general practice positions.
Doctors eligible for the Competent Authority Pathway are granted advanced standing towards the AMC Certificate and undergo up to 12 months workplace-based assessment to

MTRP 18th Report 122
ensure satisfactory adjustment to the Australian health care system before they are eligible to receive the AMC Certificate and apply for general registration.
Table 5.4 shows that a total of 1,123 applicants were assessed through this pathway in 2013. Of these, 1,054 applicants qualified for advanced standing. While these are primarily applicants who applied in 2013, the figures also include a number of 2012 applicants who were required to submit additional documentation to confirm their eligibility.
In 2013, a total of 662 AMC Certificates were granted, making the applicants eligible to apply for general registration. This is a 27.3% increase from 520 Certificates granted in 2012.
Two-thirds of those granted advanced standing in 2013 were international medical graduates from the United Kingdom.
Almost one-fifth of certificates were issued to international medical graduates from Ireland. A total of 30 certificates were issued to international medical graduates from India. Six certificates were received by international medical graduates from each of the United States of America and Canada.
Table 5.4: International medical graduates: Applications assessment through Competent Authority Pathway, 2013(a)
Country of training PLAB(c)
MCC(d) USMLE(e) NZREX(f) GMCUK(g) MCI(h) Total
Advanced
standing Issued
Certificate issued
Canada 0 24 0 0 0 0 25 22 6India 33 3 4 4 1 0 54 51 30Ireland 0 0 0 0 0 111 125 114 102South Africa 1 1 0 0 0 0 3 4 3United Kingdom 0 0 0 0 677 0 757 729 461United States of America 0 0 15 0 0 0 20 17 6Other(b) 37 48 14 6 1 0 139 117 54Total 71 76 33 10 679 111 1,123 1,054 662
(a) Data covers the period 1 January 2013 to 31 December 2013.(b) Other includes: Afghanistan, Albania, Algeria, Antigua and Barbuda, Argentina, Armenia, Austria, Bahrain, Bangladesh,
Belarus, Belize, Bolivia, Bulgaria, Chile, China, Colombia, Croatia, Czech Republic, Democratic Republic of the Congo, Dominica, Dominican Republic, Egypt, Ethiopia, Fiji, France, Georgia, Germany, Ghana, Greece, Grenada, Guyana, Hong Kong, Hungary, Indonesia, Iran, Iraq, Israel, Italy, Jamaica, Jordan, Kenya, Kuwait, Latvia, Lebanon, Libya, Lithuania, Macedonia, Malaysia, Mexico, Moldova, Myanmar, Nepal, Netherlands Antilles, Netherlands, Nigeria, Oman, Pakistan, Peru, Philippines, Poland, Romania, Russia, Saba, Saint Kitts and Nevis, Saint Lucia, Samoa, Saudi Arabia, Serbia, Sierra Leone, Singapore, Sint Eustatius, Sint Maarten, Slovakia, Somalia, South Korea, Spain, Sri Lanka, Sudan, Sweden, Syria, Tanzania, Thailand, Trinidad and Tobago, Turkey, Uganda, Ukraine, United Arab Emirates, Uzbekistan, Venezuela, Vietnam, Yemen, Zambia and Zimbabwe.
(c) Professional Linguistic Assessments Board Exam.(d) Medical Council of Canada Exam.(e) United States Medical Licensing Exam.(f) New Zealand Registration Exam.(g) General Medical Council of the United Kingdom Accreditation.(h) Medical Council of Ireland Accreditation.
Source: Australian Medical Council administrative data, 2014

MTRP 18th Report 123
Standard Pathway
Doctors who are not eligible for either the Competent Authority or Specialist pathways are assessed through the Standard Pathway. The Standard Pathway has two alternative processes leading to the Australian Medical Council (AMC) Certificate.
Standard Pathway (AMC examinations). Assessment is by examination only – the AMC Multiple Choice Questionnaire (MCQ) and the AMC clinical examination; and
Standard Pathway (workplace-based assessment). Assessment is by examination and workplace-based assessment – the AMC MCQ examination and workplace-based assessment of clinical skills and knowledge by an AMC-accredited authority.
A Pre-Employment Structured Clinical Interview (PESCI) is also required for all international medical graduates applying for general practice positions and for some international medical graduates in hospital positions.
Successful completion of the assessment requirements leads to the awarding of the AMC Certificate.
In 2013, there were 1,508 international medical graduates (Table 5.5) who passed the MCQ (52.9% of attempts), a decrease from 57.5% in 2012.
The number of international medical graduates who passed the clinical examinations increased from 964 in 2012 to 1,055 in 2013. This was 40.5% of attempts.
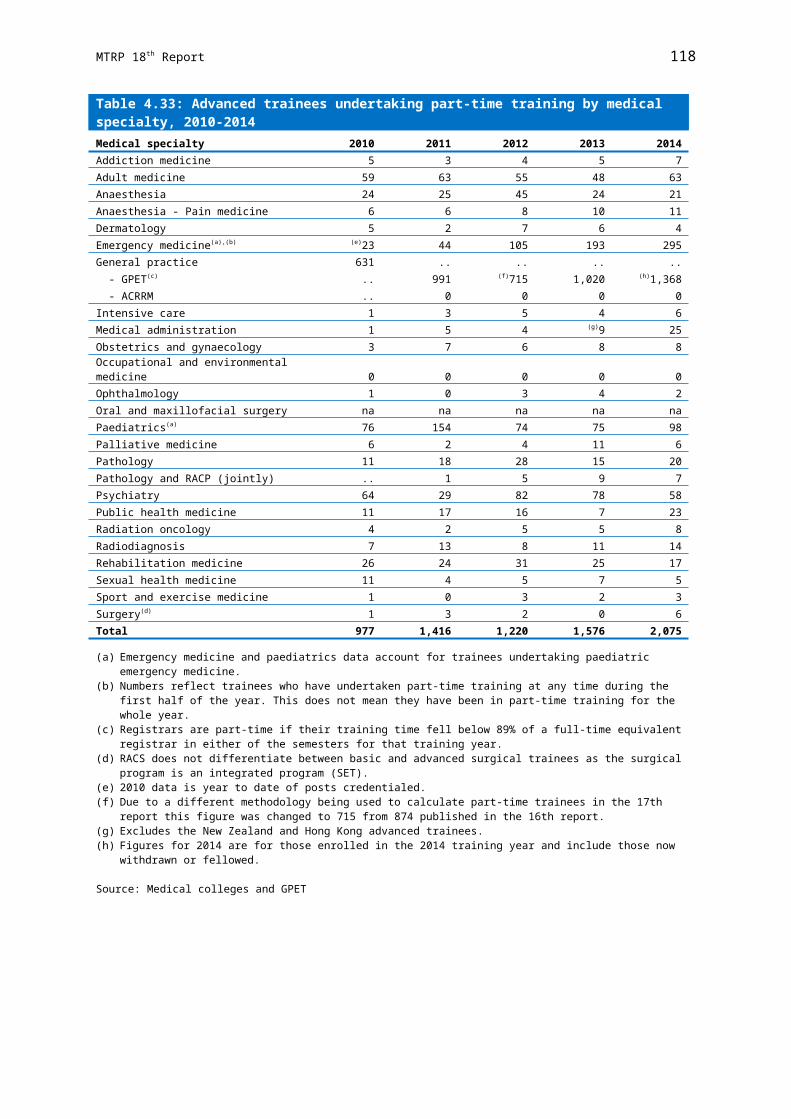
MTRP 18th Report 124
Table 5.5: International medical graduates: Applications assessed through Standard Pathway AMC examination, 2013(a)
Country of trainingMCQ exam
attemptsMCQ exam
passesClinical exam
attemptsClinical exam
passesBangladesh 207 104 204 72China 128 38 113 48Colombia 26 11 22 11Egypt 129 59 63 29Fiji 17 6 12 5India 448 233 508 202Indonesia 20 7 23 9Iran 217 131 133 54Iraq 66 39 64 30Jordan 30 24 17 7Malaysia 45 29 43 22Myanmar 112 75 196 86Nepal 45 21 33 17Nigeria 121 59 57 20Pakistan 279 153 272 111Papua New Guinea 5 3 13 2Philippines 137 41 151 39Romania 10 1 12 2Russia 98 42 84 29Saudi Arabia 4 4 9 2South Africa 33 24 36 23Sri Lanka 245 190 195 98Ukraine 45 18 40 16Vietnam 10 5 10 2Zimbabwe 12 8 16 9Other(b),(c) 360 183 281 110Total 2,849 1,508 2,607 1,055
(a) Data covers the period 1 January 2013 to 31 December 2013.(b) Other in MCQ Exam includes: Afghanistan, Albania, Argentina, Armenia, Austria, Bahrain, Barbados, Belarus, Belgium,
Bolivia, Bosnia and Herzegovina, Brazil, Bulgaria, Canada, Cayman Islands, Chile, Cuba, Czech Republic, Democratic Republic Of The Congo, Denmark, Dominica, Dominican Republic, Ecuador, Ethiopia, Finland, France, Georgia, Germany, Ghana, Greece, Grenada, Hungary, Ireland, Israel, Italy, Jamaica, Japan, Kazakhstan, Kenya, Kosovo, Kyrgyzstan, Laos, Latvia, Lebanon, Libya, Lithuania, Macedonia, Malawi, Mauritius, Mexico, Moldova, Mozambique, Netherlands, Norway, Oman, Palestinian Authority, Peru, Poland, Rwanda, Saba, Saint Kitts and Nevis, Saint Lucia, Samoa, Serbia, Seychelles, Singapore, Sint Maarten, Slovakia, South Korea, Sudan, Sweden, Switzerland, Syria, Taiwan, Tajikistan, Tanzania, Thailand, Trinidad and Tobago, Turkey, Uganda, United Arab Emirates, United Kingdom, United States of America, Uzbekistan, Venezuela, Yemen and Zambia.
(c) Other in Clinical Exam includes: Afghanistan, Algeria, Argentina, Armenia, Austria, Azerbaijan, Belarus, Belgium, Bolivia, Bosnia and Herzegovina, Brazil, Bulgaria, Canada, Croatia, Cuba, Czech Republic, Democratic Republic Of The Congo, Ecuador, El Salvador, Ethiopia, Finland, France, Germany, Ghana, Greece, Grenada, Hungary, Ireland, Jamaica, Japan, Kazakhstan, Kenya, Kosovo, Kyrgyzstan, Latvia, Lebanon, Libya, Lithuania, Macedonia, Malta, Mauritius, Mexico, Moldova, Netherlands, Norway, Oman, Palestinian Authority, Paraguay, Peru, Poland, Rwanda, Saint Kitts and Nevis, Samoa, Serbia, Seychelles, Singapore, Slovakia, Slovenia, South Korea, Spain, Sudan, Switzerland, Syria, Taiwan, Tanzania, Thailand, Trinidad And Tobago, Turkey, Uganda, United Arab Emirates, United Kingdom, United States of America, Union of Soviet Socialist Republics, Uzbekistan, Venezuela, Yemen and Zambia.
Source: Australian Medical Council administrative data, 2014
Table 5.6 presents information on workplace-based assessment through the Standard Pathway.
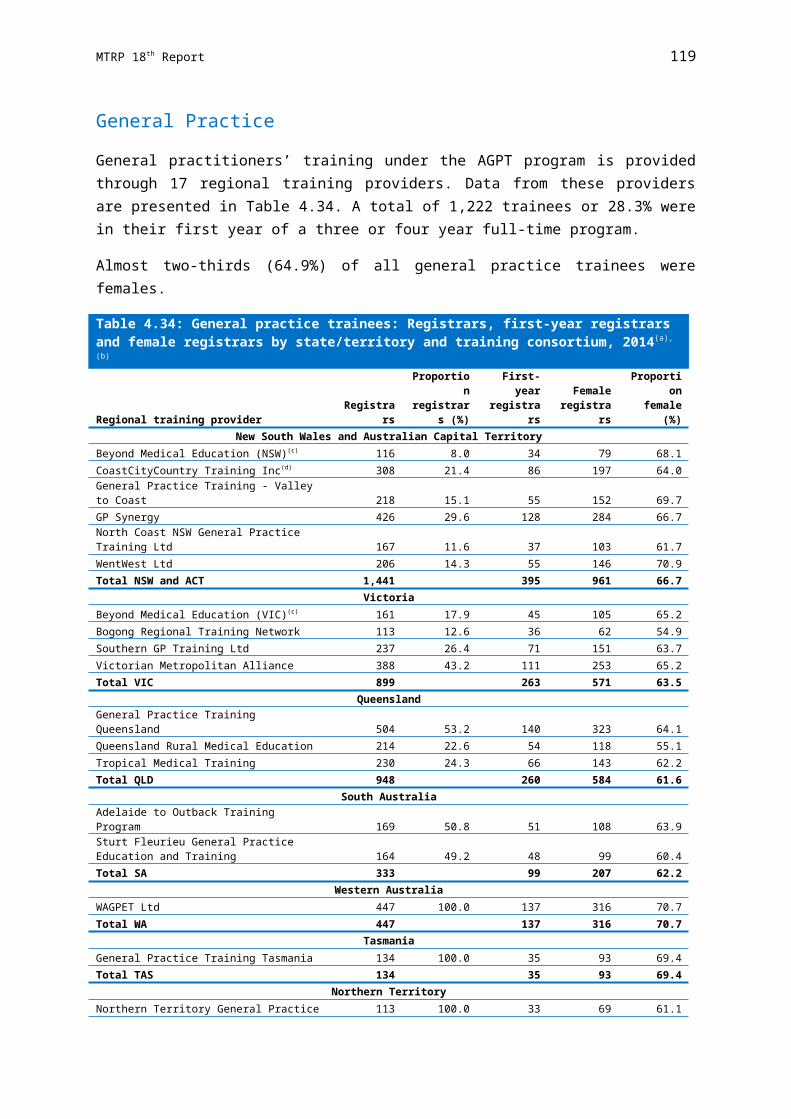
MTRP 18th Report 125
Table 5.6: International medical graduates: Workplace-based assessment through Standard Pathway, 2013
AuthorityCountry of training
Workplace-based assessment
attempts
Workplace-based assessment
passesAustralian College of Rural and Remote Medicine Argentina 1 1
Bangladesh 2 1Serbia 1 1Sri Lanka 2 1Zimbabwe 1 0
Total Australian College of Rural and Remote Medicine 7 4Hunter New England Area Health Services Bangladesh 1 0
China 1 1Fiji 2 2India 7 7Indonesia 1 1Iran 3 3Jordan 1 1Pakistan 6 5Sudan 1 1Ukraine 1 1
Total Hunter New England Area Health Services 24 22Launceston General Hospital Germany 1 1
India 5 3Iran 1 1Iceland 1 1Myanmar 1 0Nepal 3 2Pakistan 5 4Russia 1 1Sri Lanka 1 0Uzbekistan 1 1
Total Launceston General Hospital 20 14Rural and Outer Metro United Alliance Guatemala 1 0
Nigeria 2 2Pakistan 3 3Romania 1 1
Total Rural and Outer Metro United Alliance 7 6Southern Health Colombia 1 0
Egypt 1 1India 4 1Iran 1 1Pakistan 3 3Philippines 3 1Russia 2 2
Total Southern Health 15 9WA Health Bangladesh 1 1
Colombia 1 1Germany 1 1India 3 2Iran 2 2Nepal 1 1Pakistan 10 10Philippines 2 2South Africa 1 1
Total WA Health 22 21Total 95 76
Source: Australian Medical Council administrative data, 2014
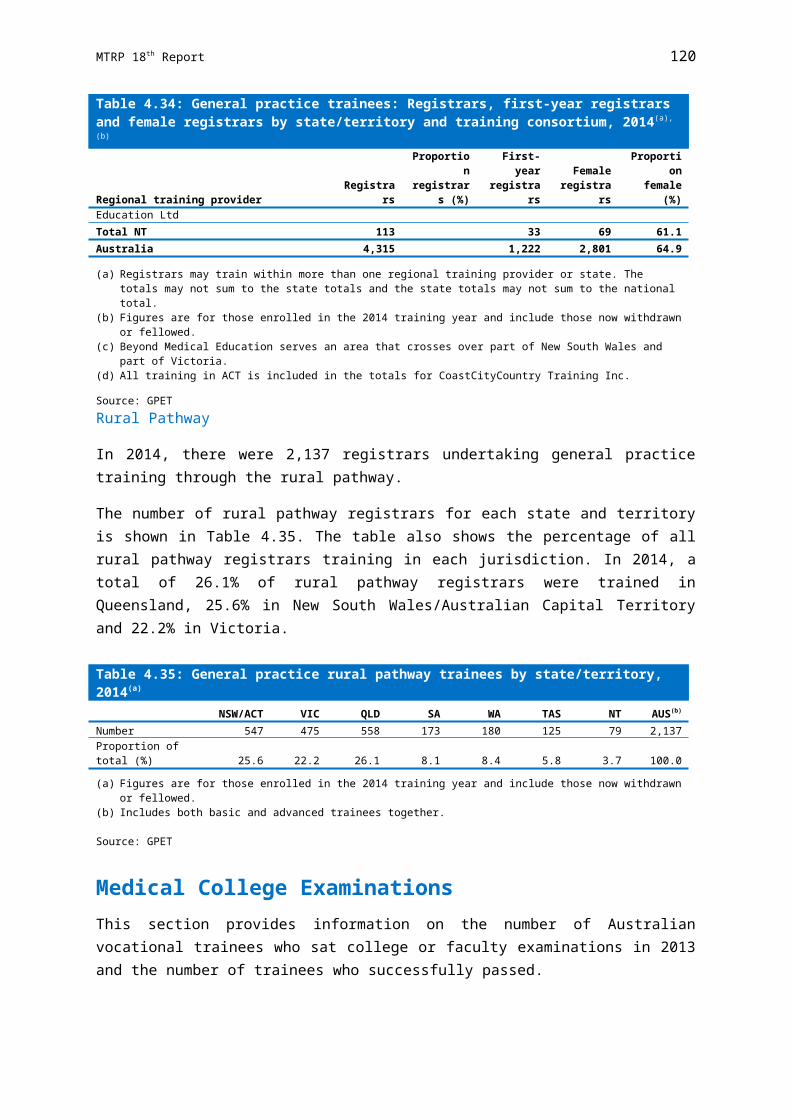
MTRP 18th Report 126
Assessment of Overseas Trained Specialists
Prior to 1990, all overseas trained specialists seeking registration in Australia who did not hold a recognised primary medical qualification were obliged to pass the AMC examination and obtain general registration before they could be registered to practise as a specialist. In addition, before 1990 only two states (Queensland and South Australia) had separate specialist registers.
In 1991, the Australian Health Ministers’ Conference (AHMC), in anticipation of the implementation of the mutual recognition scheme, approved a process for overseas trained specialists to be assessed by the relevant specialist medical college in Australia against the standards for an Australian trained specialist in the same field of specialist practice. If the qualifications and relevant experience of the applicant were assessed as substantially comparable to an Australian trained specialist, he/she could apply for registration limited to the field of specialty.
In consultation with the former state and territory medical boards and colleges, it was subsequently agreed that the specialist assessment process should not be seen as a backdoor to specialist training in Australia. For this reason it was resolved that any overseas trained specialist who required more than two years of further supervised training to meet the required standard for substantial comparability (equivalence to an Australian trained specialist) would be assessed as ‘not comparable’ and would be required to sit the AMC examination and obtain general registration.
A national assessment process for Area of Need specialists was not resolved until 2002, when agreement was reached on a separate pathway for the assessment and registration of overseas trained specialists in Area of Need positions. This involves an assessment against a position description that defines the levels of clinical responsibility, supervision and specific clinical skills required for a particular position. The relevant specialist college assesses the individual against the position description, rather than against the standards required by the medical college for a (fully recognised) specialist.
A number of colleges have agreed to combine their Area of Need and full comparability assessments, so that the applicant (and the Medical Board of Australia) can be advised of the additional steps required to achieve substantial comparability at the same time as he or she is being assessed for the Area of Need position. To date some nine colleges (RANZCOG, RACP, RCPA, ACD, RACS, RANZCO, RANZCP, ACRRM and RANZCR) have agreed to undertake the combined assessments of overseas trained specialists.
All specialist applications are administered through the AMC and assessment of comparability to Australian standards is carried out by the relevant specialist college. Applicants who do not meet the requirements for specialist assessment are required to undergo assessment through one of the non-specialist pathways.
Standard Specialist Assessment
Overseas trained specialists applying for comparability to an Australian trained specialist must have completed all training requirements and be recognised as a specialist in their country of training before applying under the specialist pathway for assessment of comparability.

MTRP 18th Report 127
There are three possible outcomes of assessment:
substantially comparable; partially comparable, requiring up to two years up skilling to reach comparability; and not comparable.
The majority of medical colleges will allow applicants who are considered substantially comparable to Australian trained specialists to gain fellowship without requiring an additional examination, although most require a period of practice under oversight.
International medical graduates with specialist qualifications or specialists-in-training are eligible to apply for general registration under the Competent Authority Pathway (if eligible), in addition to applying for specialist registration through the Specialist Pathway.
In total, there were 2,234 overseas trained specialists whose applications to be recognised as a specialist in Australia were being processed in 2013. While these are primarily applicants who applied the previous year, this figure also includes a number of applicants who were required to submit additional documentation or undergo further training to confirm their eligibility.
Table 5.7 shows that 349 overseas trained specialists had their applications approved (that is, they were deemed to be substantially comparable) and a further 335 were deemed as requiring further training and/or examinations (that is, partially comparable).
Total number of overseas trained specialists with approved applications has slightly decreased from 2,346 in 2012 to 2,234 in 2013 (4.8%).
Table 5.8 presents data on the countries in which approved applicants were trained. More than half (179 or 51.3%) of all overseas trained specialists, who have had their applications approved in 2013, were trained in the United Kingdom and Ireland. The next largest number of specialists in 2013 came from India (50 or 14.3% of all approved applicants). Two other cohorts of overseas trained specialists with qualifications substantially comparable to Australia came from South Africa and the United States of America (25 or 7.1% each).

MTRP 18th Report 128
Table 5.7: Specialist assessment process by medical specialty, 2013
Medical specialtyInitial
processingCollege
processingSubstantially
comparablePartially
comparableNot
comparable Withdrawn Total
Proportion of total(%)
Adult medicine 102 29 69 65 15 58 338 15.1Anaesthesia 33 44 44 30 13 22 186 8.3Dermatology 8 6 1 1 1 1 18 0.8Emergency medicine 14 3 21 16 6 13 73 3.3General practice 451 60 11 33 8 15 578 25.9Intensive care 5 10 8 4 4 3 34 1.5Medical administration 0 0 1 0 0 1 2 0.1Obstetrics and gynaecology 59 3 34 12 11 7 126 5.6Occupational and environmental medicine 1 0 2 2 0 0 5 0.2Ophthalmology 27 5 8 12 7 4 63 2.8Oral and maxillofacial surgery 0 0 0 1 0 0 1 0Paediatrics and child health 60 7 17 36 4 29 153 6.8Pain medicine 4 1 0 0 0 1 6 0.3Palliative medicine 0 0 1 1 0 2 4 0.2Pathology 40 5 15 22 3 8 93 4.2Psychiatry 33 9 43 22 3 0 110 4.9Public health medicine 5 0 2 0 0 0 7 0.3Radiology 35 6 37 40 2 2 122 5.5Rehabilitation medicine 1 0 2 4 1 0 8 0.4Sexual health medicine 3 0 0 1 0 0 4 0.2Sport and exercise medicine 1 0 0 0 0 0 1 0Surgery 62 116 33 33 19 39 302 13.5Total 944 304 349 335 97 205 2,234 100.0
Source: Australian Medical Council administrative data, 2014
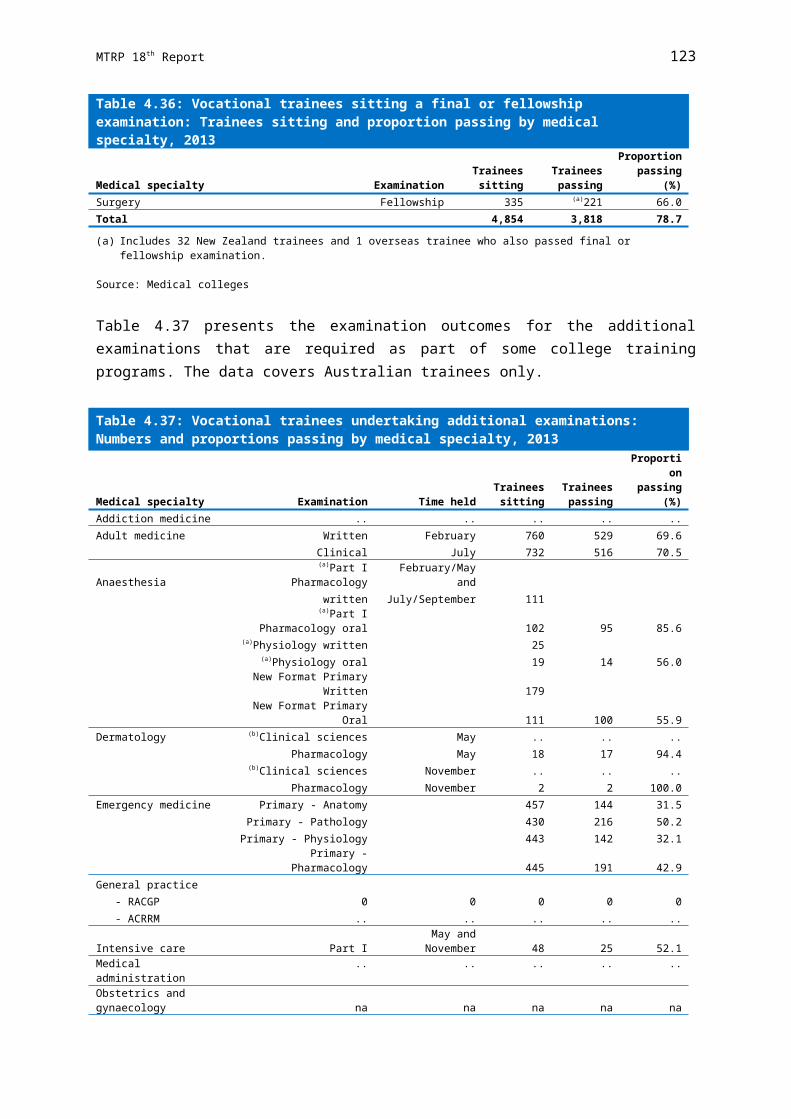
MTRP 18th Report 129
Table 5.8: Substantially comparable specialist applications by country of training and medical speciality, 2013
Medical specialty Canada India New Zealand South Africa
United Kingdom and
IrelandUnited States
of America Other(a) Total
Proportion of total
(%)Adult medicine 0 6 0 3 41 3 16 69 19.8Anaesthesia 0 10 0 1 25 1 7 44 12.6Dermatology 0 0 0 1 0 0 0 1 0.3Emergency medicine 1 0 0 0 11 9 0 21 6.0General practice 0 0 1 4 2 4 0 11 3.2Intensive care 0 0 0 1 2 1 4 8 2.3Medical administration 0 0 0 1 0 0 0 1 0.3Obstetrics and gynaecology 1 3 0 1 19 1 9 34 9.7
Occupational and environmental medicine 0 0 0 0 2 0 0 2 0.6Ophthalmology 0 0 0 1 7 0 0 8 2.3Paediatrics and child health 3 3 0 1 9 0 1 17 4.9Palliative medicine 0 0 0 0 1 0 0 1 0.3Pathology 0 4 0 2 5 1 3 15 4.3Psychiatry 0 10 0 2 21 2 8 43 12.3Public health medicine 0 0 0 1 1 0 0 2 0.6Radiology 0 8 0 2 18 1 8 37 10.6Rehabilitation medicine 0 0 0 0 0 1 1 2 0.6Surgery 1 6 0 4 15 1 6 33 9.5
Total 6 50 1 25 179 25 63 349 100.0
(a) Other includes: Austria, Belgium, Brazil, Egypt, Germany, Hong Kong, Hungary, Iran, Israel, Italy, Jordan, Kenya, Nepal, Netherlands, Pakistan, Singapore, Spain, Sri Lanka, Sweden, Switzerland and Zimbabwe.
Source: Australian Medical Council administrative data, 2014

MTRP 18th Report 130
Area of Need Specialist Assessment
Overseas trained specialists applying for an Area of Need assessment must also have completed all training requirements and be recognised as a specialist in their country of training. When assessing applicants for suitability for Area of Need positions, medical colleges will determine at the same time (or soon thereafter) what is required to meet standards for fellowship.
An Area of Need applicant is always assessed against a position description. This allows an overseas trained specialist to work in a designated specialty position, provided conditions imposed by the Medical Board of Australia are met. The position description together with the qualifications, training and experience of the applicant will determine the level of risk and the level of supervision or further assessment required.
Specified Specialist Training
Applicants who wish to enter Australia for specified specialist training will require registration by the Medical Board of Australia (through the medical boards in each state and territory) following advice from the relevant specialist medical college. This limited registration allows applicants to undertake training or to obtain experience in Australia not available in their country of training for a short period (normally up to one year), but can in exceptional circumstances be extended to three years.
Medicare Provider Number RestrictionsIn 1996, the Australian Government introduced Medicare provider number restrictions to improve the quality of Australia’s medical workforce over the longer term and to address growing concerns about the maldistribution of the medical workforce. Since 1997, doctors who obtained their primary medical qualification overseas have been required to gain an exemption under section 19AB of the Act in order to access Medicare benefits for the services they provide. Exemptions under the Act are generally only granted if the medical practitioner works in a recognised area of workforce shortage, as defined by the Australian Government.
Restrictions of Practice
Section 19AB of the Act restricts access to Medicare provider numbers and requires overseas trained doctors and ‘foreign graduates of an accredited medical school’ (FGAMS) from April 2010 to work in a District of Workforce Shortage (DWS) for a period of generally ten years in order to access the Medicare benefits arrangements. This is referred to as the ‘ten year moratorium’.
A DWS is an area in which the general population’s need for health care is considered not to be met. These areas are identified as those that have less access to medical services than the national average. They are determined on the basis of a full-time equivalent measure, which takes into account latest Medicare billing in the area, irrespective of whether or not local doctors are working in a part-time or a full-time capacity. Districts are defined on a quarterly basis for general practice and annually for the other medical specialties.

MTRP 18th Report 131
The DWS status of each area in Australia for the specialty of General Practice is available on the Doctor Connect map located at:
www.doctorconnect.gov.au
On 1 July 2010 the Australian Government introduced the scaling initiative as part of the Rural Health Workforce Strategy (RHWS). The scaling initiative allows overseas trained doctors and FGAMS to receive significant reductions in their restriction period under the ten year moratorium if they practice privately within an eligible regional, rural or remote area. The greatest discounts are available to medical practitioners who practise within the most remote locations in Australia. Further advice regarding the scaling initiative is available from the Doctor Connect website.
Table 5.9 shows the cumulative number of overseas trained doctors granted exemptions under Section 19AB of the Act. As at 30 June 2014, there were a total of 11,138 exemptions issued to overseas trained doctors.
Table 5.9: Overseas trained doctors with Section 19AB exemptions, 20142002 2003 2004 2005 2006 2007 2008 2009 2010 2011 2012 2013 2014(a)
Total 1,303 1,722 2,290 2,878 3,634
4,476
5,483
5,914
6,892
7,785
9,053
10,459
11,138
(a) 2014 figure calculated to 30 June 2014.
Source: Australian Government Department of Health administrative data, 2014
Current Distribution of Overseas Trained Doctors
The intake of overseas trained doctors by all states and territories increased from 2013.
Table 5.10 shows which jurisdictions were relatively more reliant on overseas trained doctors to provide services in 2014. The largest number of overseas trained doctors (3,189) was in Queensland, followed by New South Wales (2,997) and Victoria (2,861).
Table 5.10: Overseas trained doctors by state/territory, 2014
General practitioners(a) Specialists(a) TotalNew South Wales 1,792 1,216 2,997Victoria 1,930 923 2,861Queensland 1,909 1,289 3,189South Australia 600 369 959Western Australia 1,003 550 1,543Tasmania 211 197 406Northern Territory 179 100 273
Australian Capital Territory 96 115 212
Australia(b) 7,130 4,056 11,138
(a) General practitioners include section 3GA (under the Health Insurance Act 1973) placements and Specialists include assistant specialists.
(b) Overseas trained doctors may work in more than one location across different states/territories.
Source: Australian Government Department of Health administrative data as at 30 June 2014

MTRP 18th Report 132
There is marked variation in the reliance on overseas trained doctors across jurisdictions and by remoteness.
The following figures show the distribution of overseas trained doctors across states and territories and by remoteness (Figure 5.1 to Figure 5.4). These figures highlight the variation between jurisdictions in the overall and relative number of overseas trained doctors, as well as where they are working.
Although overseas trained doctors constitute a far higher proportion of the medical workforce in more remote areas of Australia, the majority work in Major cities and Inner regional areas. More specifically, nearly half of overseas trained general practitioners and overseas trained specialists worked in Major cities (Figure 5.1), where just over two-thirds of the population reside. More than one-third of both overseas trained general practitioners and specialists worked in Inner regional areas (Figure 5.2), where one-fifth of the population resides.
Queensland has relatively high numbers of overseas trained doctors across all Remoteness Areas, while Western Australia stands out for the relatively higher numbers in Remote and Very remote areas (Figure 5.4).
Figure 5.1: Overseas trained doctors in Major cities by state/territory, 2014
NSW VIC QLD SA WA ACT0
100200300400500600700800900
1,0001,1001,200
General practitioners
Specialists
State/Territory
Ove
rsea
s tr
aine
d do
ctor
s
Source: Medicare data, Australian Government Department of Health administrative data, 2014

MTRP 18th Report 133
Figure 5.2: Overseas trained doctors in Inner regional areas by state/territory, 2014
NSW VIC QLD SA WA TAS0
100200300400500600700800900
1,0001,100
General practitioners
Specialists
State/Territory
Ove
rsea
s tr
aine
d do
ctor
s
Source: Medicare data, Australian Government Department of Health administrative data, 2014
Figure 5.3 Overseas trained doctors in Outer regional areas by state/territory, 2014
NSW VIC QLD SA WA TAS NT0
50
100
150
200
250
300
350
400
450
500General practitioners
Specialists
State/Territory
Ove
rsea
s tr
aine
d do
ctor
s
Source: Medicare data, Australian Government Department of Health administrative data, 2014

MTRP 18th Report 134
Figure 5.4: Overseas trained doctors in Remote and Very remote areas by state/territory(a), 2014
NSW VIC QLD SA WA TAS NT0
50
100
150
200
250
300
350
400
450
500
General practitioners
Specialists
State/Territory
Ove
rsea
s tr
aine
d do
ctor
s
(a) Data for Remote, Very Remote and Migratory classes have been combined.
Source: Medicare data, Australian Government Department of Health administrative data, 2014

MTRP 18th Report 135
Chapter 6
SPECIAL PURPOSE TRAINING PROGRAMS This chapter reports on the Special Purpose Training Programs established under section 3GA of the Act. Section 3GA programs target particular workforce requirements. These include vocational training, vocational recognition and other training needs.
Special Purpose Training Programs also provide for those doctors seeking vocational recognition, but who are not involved in a specialist training program. Many of the Special Purpose Training Programs offer a range of incentives to doctors. The two most common incentives are access to a Medicare provider number and access to the higher A1 Medicare rebate. Other incentives may involve access to an alternative vocational training pathway, the opportunity to broaden the range of clinical experience within an existing training pathway or special support in achieving vocational recognition.
Some of these programs specifically cover doctors who have trained overseas to assist with their integration into the Australian workforce and to promote them working in areas of workforce shortage.
BackgroundSection 19AA of the Act was introduced in 1996 to recognise and support general practice as a vocational specialty, as well as to provide a framework for achieving long term improvements in the quality of doctors working in Australia.
Section 19AA of the Act applies to all medical practitioners who:
held medical registration by an Australian Medical Board on or after 1 November 1996;
are Australian permanent residents or Australian citizens; and do not hold continued recognition by the RACGP or the ACRRM and/or recognition
from a specialist medical college.
The Medicare provider number restrictions introduced in 1996 in section 19AA of the Act apply to doctors who were first recognised as Australian medical practitioners on or after 1 November 1996 and who are neither vocationally recognised nor hold fellowship of a recognised medical college. Section 19AA of the Act restricts the accessing of Medicare benefits to doctors who are:
Australian citizens or permanent residents; or temporary residents who have completed their commitment under section 19AB of
the Act.
Section 19AA of the Act ensures that all doctors receiving medical education and training in Australia possess the appropriate qualifications to practise medicine. These qualifications

MTRP 18th Report 136
require Australian-trained doctors, as well as permanent residents and Australian citizens who trained overseas, to complete a program of postgraduate vocational medical training before being eligible to receive a Medicare provider number with access to the Medicare benefits arrangements.
There are exemptions from section 19AA restrictions for certain training and workforce programs. Section 3GA of the Act allows medical practitioners undertaking postgraduate education or training placements on approved workforce training programs to provide professional medical services that are eligible to attract Medicare benefits. Exemptions to section 19AA of the Act apply to most medical college training and workforce programs, including the Australian General Practice Training (AGPT) Program and the Rural Locum Relief Program (RLRP).
3GA Programs ProvidersTable 6.1 summarises the number of providers, as a headcount, on workforce programs and some specialised training programs under section 3GA of the Act from 2004-05 to 2013-14. Providers are identified where they have rendered a service on a fee-for-service basis for which claims were processed by the Australian Government Department of Human Services - Medicare. Those only providing services to public patients in hospitals and through other publicly funded programs within the specified periods are not covered.
Further information on each of the programs is provided below.

MTRP 18th Report 137
Table 6.1: Providers on approved 3GA programs placements(a),(b), 2004-05 to 2013-14
Program 2004-05 2005-06 2006-07 2007-08(c) 2008-09 2009-2010 2010-11 2011-12 2012-13 2013-14194 - Approved Medical Deputising Services Program 108 141 165 206 215 272 363 446 586 830197 - Approved Private Emergency Department Program 8 6 19 14 18 21 15 34 51 61187 - Approved Placements for Sports Physicians Program
(discontinued)(d),(e) 8 8 7 8 14 13 13 - - -414 - Sports Physician Trainees Program - 16 22 21 27 21 29 28 35 38617 - Metropolitan Workforce Support Program (discontinued) 8 8 4 1 - - - - - -178 - Prevocational General Practice Placement Program 21 56 81 134 182 238 400 647 779 765177 - Queensland Country Relieving Doctors Program 161 260 301 293 340 368 354 403 393 357190 - Rural Locum Relief Program 660 554 551 583 657 767 890 999 1,127 1,340179 - Special Approved Placement Program 7 13 14 37 49 90 159 217 265 359198 - Temporary Resident Other Medical PractitionersProgram(d),(f) 70 84 98 106 105 109 109 119 118 115176 - Remote Vocational Training Scheme 10 10 13 16 26 30 36 40 46 70AGPT - Australian General Practice Training Program(g) na na na na na na na na na 3,670
(a) Providers have claimed through Medicare for at least one service on a valid date for the program in question.(b) Providers may be counted against multiple programs and therefore programs are not additive, apart from within the AGP grouping referred to.(c) Statistics for 2007-08 had regard to claims processed up to the end of September. Statistics for all other financial years had regard to claims processed up to the end of October.(d) The Temporary Resident Other Medical Practitioner Program (198) and the Approved Placements for Sports Physician Trainees Program (187) were not location specific. All other
programs were location specific.(e) Based on advice from Medicare Australia, providers on Approved Placements for Sports Physicians Program (187) were only counted if they had an end date of 30 June 2011. Also
Medicare Australia used code 187 for 3GA and non-3GA providers.(f) The number of providers registered against the Temporary Resident Other Medical Practitioner Program who provided at least one service during 2010-11 has been revised from 93 as
in the MTRP 15th report to 109.(g) AGPT groups programs 134, 430, 431, 432, 433, 434, 435, 436, 437, 438, 439, 440, 441, 442, 443, 444, 445, 446, 447, 448, 449, 450, 451, 452, 453, 454, 455 and 456. Providers
registered against more than one of these GPET/GPTRAINEE programs in the financial year shown are only counted once. Provider counts on the basis referred to in note (b) are not available for years before 2013-14.
Source: Australian Government Department of Health administrative data, 2014

MTRP 18th Report 138
Section 3GA Programs
Approved Medical Deputising Services Program
The purpose of the Approved Medical Deputising Services Program (AMDSP) is to expand the pool of available medical practitioners who may work for after-hours deputising services. This program allows otherwise ineligible medical practitioners to provide a range of restricted professional services, for which Medicare benefits will be payable, where the medical practitioner works for an approved medical deputising service.
The AMDSP was established under section 3GA of the Act in 1999 in response to concerns about the shortage of medical practitioners providing after-hours home visit services in metropolitan areas. The Australian Government Department of Health administers the program.
Approved Private Emergency Department Program
The Approved Private Emergency Department Program (APEDP) allows advanced specialist trainees undertaking emergency medicine training to work under supervision in accredited private hospital emergency departments. The program was established to enhance public access to private emergency departments by expanding the pool of doctors able to work in private hospital emergency departments.
Approved Placements for Sports Physicians Program
The Approved Placements for Sports Physicians Program (APSPP) was introduced in April 2004. At the time, sports medicine was not recognised as a medical specialty.
This 3GA program was specified in Schedule 5 of the Health Insurance Regulations as an interim measure to allow medical practitioners who gained fellowship of the Australasian College of Sports Physicians (ACSP) after 1 January 2004, and who were subject to the provisions of section 19AA of the Act, to gain access to a Medicare provider number. Once the placement has been approved, the Australian Government Department of Human Services - Medicare registers the placements using specification code 187. Providers are then able to access attendance items from Group A2 of the Medicare Benefits Schedule (MBS), as well as from relevant procedural items, for the nominated period of the placement.
‘Sports and exercise medicine’ was recognised as a specialty under the Act inNovember 2009. In 2012, the APSPP was discontinued as all sports medicine physicians are now recognised specialists and can access the relevant Medicare item numbers without requiring a 3GA program.
Sports Physician Trainees Program
Practitioners in the Sports Physician Trainees program are eligible to be registered under section 3GA of the Act as an ACSP Trainee for specific practice locations using specification code 414. These placements entitle the practitioner to access Group A2 attendance items in the Medicare Benefits Schedule, including relevant procedural items for the period of

MTRP 18th Report 139
registration and at approved locations. The Australian Government Department of Human Services - Medicare receives advice on placements directly from the ACSP and registers the placements for Medicare purposes.
Australian General Practice Training Program
The Australian General Practice Training (AGPT) program is a postgraduate vocational training program for medical graduates wishing to pursue a career in general practice. The program provides training towards fellowship of the Royal Australian College of General Practitioners (RACGP) and the Australian College of Rural and Remote Medicine (ACRRM) offered through 17 Regional Training Providers (RTPs) across Australia. Training places are available in all locations; however, there is a requirement that 50% of training activity is undertaken in rural and remote areas classified using the ASGC-RA index as Remoteness Areas (RA) 2 to 5.
The AGPT program commenced in January 2002 with 450 places available. There has been a gradual increase of training placements since this time. In 2004, the number of places was increased to 600 and further increased in 2009 to 675, and 700 in 2010. A greater expansion of the program commenced in 2011 with 900 training places, 1,000 in 2012, 1,108 in 2013 and 1,192 in 2014.
In the 2014-15 Federal Budget, the Australian Government announced additional training places to meet the significant demand for places under the AGPT program in recent years. From 2015, a total of 1,500 annual commencing AGPT training places will be funded.
Prevocational General Practice Placements Program
The Prevocational General Practice Placements Program (PGPPP) encouraged junior doctors at all levels to take up general practice as a career and enhanced their understanding of the integration between primary and secondary care.
Placements were available in all locations, however, there was a requirement that 50% of placements occur in rural and remote areas classified using the ASGC-RA index as Remoteness Areas (RA) 2 to 5. Placements were generally for a period of 12 weeks.
General practice placements in this program commenced in January 2005. The number of completed supervised placements has increased each year from 111 in 2005–06, 173 in 2006–07, 248 in 2007–08 and then to 338 in 2008–09. After 2008–09, data on the number of completed supervised general practice placements was collected on a calendar year basis. In 2009, there were 353 placements. A total of 400 completed the 12-week placements in 2010.
The number of placements available increased from 380 in 2010, to 910 in 2011, and 975 placements in 2012 onwards. For the 2011 training year, 692 of the 910 available were filled.
In 2012, 918 out of 975 placements were filled. The shortfalls in 2011 and 2012 were predominantly due to the significant growth in the number of placements (from 380 in 2010 up to 975 in 2012).
In order to fund intern places in private hospitals in 2013, the target for the 2013 training year was reduced to 961. The target remained 975 placements for 2014.

MTRP 18th Report 140
The Prevocational General Practice Placements Program was ceased on 31 December 2014, as announced in the 2014-15 Federal Budget.
Queensland Country Relieving Doctors Program
The Queensland Country Relieving Doctors (QCRD) program provides relieving services to Queensland Health’s rural medical practitioners by drawing on a pool of junior medical staff employed within the state’s public hospitals. The role of these junior doctors is limited to that of a junior doctor without vocational qualification.
The 3GA exemptions are only necessary for practitioners relieving in medical superintendent or medical officer positions with rights to private practice. The exceptions, however, are where a hospital based position attracts Medicare benefits in which case a 3GA exemption is still required. Therefore, not all practitioners in the program require the 3GA exemptions. These positions with rights to private practice are specific to Queensland and do not exist in other jurisdictions. These positions are generally in small rural locations, where the hospital doctor also fulfils a general practitioner role. The 3GA component of the QCRD program enables medical practitioners to provide services that attract Medicare benefits.
The QCRD program currently provides relief to over 100 rural medical practitioners throughout Queensland. Many of these are solo medical practitioners, who would have limited opportunities for relief if they were reliant upon the recruitment of private locums. The QCRD program contributes towards maintaining a medical service to rural and remote communities in the absence of the community’s permanent doctor.
Rural Locum Relief Program
The Rural Locum Relief Program (RLRP) was introduced in 1998. It enables doctors who are not otherwise eligible to access the Medicare Benefits Schedule to have temporary access when providing services through approved placements in rural areas.
Rural Health Workforce Australia through the Rural Workforce Agencies (RWAs) in each state and the Northern Territory administer the program on behalf of the Australian Government. Doctors without postgraduate qualifications who fall within the scope of the restrictions under section 19AA of the Act are eligible to make an application to their respective state or territory RWAs for a placement on the program. For overseas trained doctors who are subject to the restrictions under section 19AB of the Act, practice locations must be within a DWS.
Locations eligible to receive approved placements through the program are:
rural and remote areas, Rural, Remote and Metropolitan Areas (RRMAs) 3-7; Areas of Consideration, as determined by the Australian Government Minister for
Health; and/or all Aboriginal medical services, including those in RRMA 1 and 2 locations.
Doctors who are registered to practise in a particular state or territory and have been assessed as having suitable experience and skills to practise in the particular location may fill these placements.

MTRP 18th Report 141
Special Approved Placements Program
The Special Approved Placements Program (SAPP) was established under section 3GA of the Act in December 2003. The program allows medical practitioners to access Medicare benefits in metropolitan areas if they can demonstrate exceptional circumstances that make them unable to participate on any other workforce or training program under Section 3GA of the Act.
Exceptional circumstances that would normally be considered are:
where it can be demonstrated that there is substantial hardship, due to a particular family circumstance, resulting in the medical practitioner not being able to access the Medicare benefits in other suitable locations under section 3GA of the Act;
where serious illness relating to the medical practitioner, or his or her immediate family members can be demonstrated, including where the treatment for the condition is limited to a particular location(s); or
other exceptional circumstances peculiar to the individual case.
Temporary Resident Other Medical Practitioners Program
The Temporary Resident Other Medical Practitioners (TROMPs) program was established in 2001. The program was introduced to overcome an unintended consequence of amendments to the 1996 Medicare provider number legislation, which would have resulted in a number of long-term temporary resident medical practitioners losing access to Medicare benefits. This affected temporary resident medical practitioners who had entered medical practice in Australia prior to 1 January 1997 and who were not vocationally recognised.
The TROMPs program provides access to Medicare benefits at the A2 rate for these eligible medical practitioners.
Remote Vocational Training Scheme
The Remote Vocational Training Scheme (RVTS) was introduced in 1999 to address health service needs in Australia’s remote communities. The Scheme allows registrars to remain in one location for the period of their training, supported by distance education and remote supervision. The RVTS provides an alternative route to vocational recognition for remote practitioners who are in solo doctor towns or where their departure would otherwise have a detrimental impact on the local community. RVTS registrars are eligible to sit for fellowship of the RACGP and/or the ACRRM.
Up until 28 February 2007, the RVTS was a 3GA program under the auspices of the RACGP. Since 1 March 2007, legislative changes and the incorporation of the RVTS have enabled the Scheme to be recognised as a 3GA program in its own right.
The Australian Government announced an increase in the annual intake of RVTS registrars from 15 to 22, which commenced from 2011. Since the inception of the pilot program in 1999, a total of 80 registrars have completed the RVTS. As at 30 June 2013, 79 registrars are training on the RVTS.

MTRP 18th Report 142
In August 2013, the Australian Government approved the annual intake of an additional 10 RVTS registrars to train in Aboriginal and Community Controlled Health Services (ACCHSs). The first cohort of registrars under the new scheme commenced in 2014, taking the total annual intake to 32.

MTRP 18th Report 143