medical products sector review: publicly-traded medical ... · market indices sector 1 sources:...
TRANSCRIPT
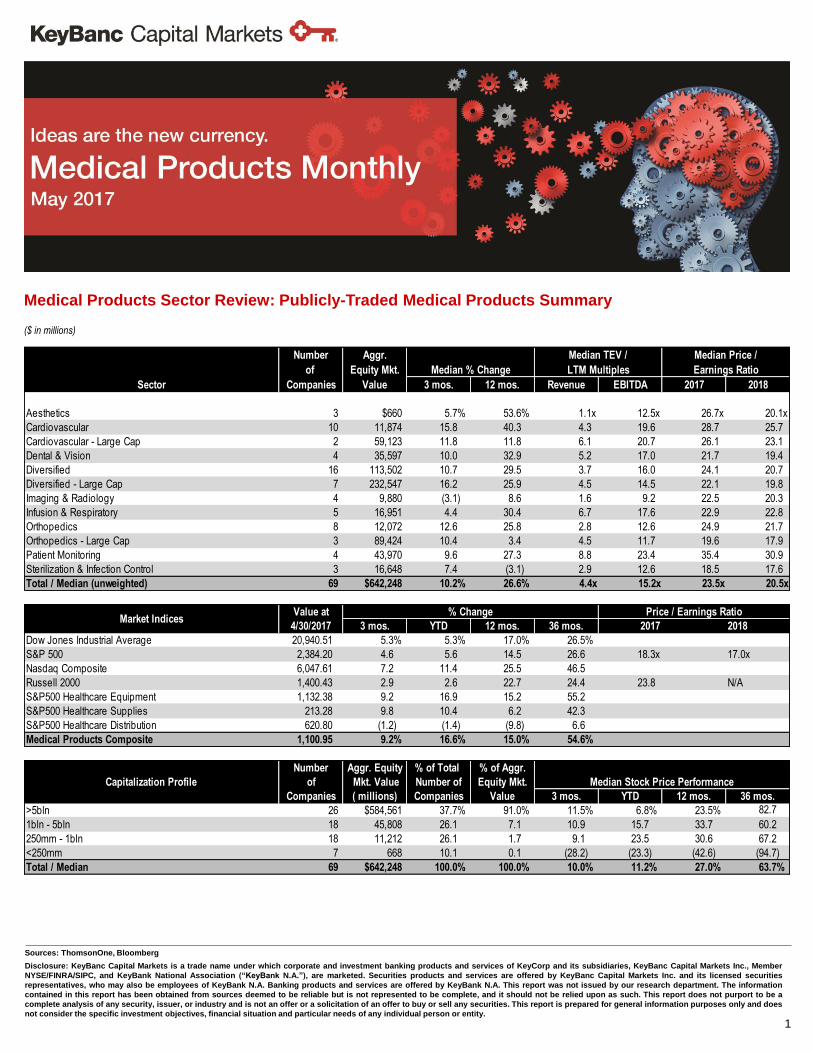
Number Aggr. Median TEV / Median Price /
of Equity Mkt. Median % Change LTM Multiples Earnings Ratio
Companies Value 3 mos. 12 mos. Revenue EBITDA 2017 2018
Aesthetics 3 $660 5.7% 53.6% 1.1x 12.5x 26.7x 20.1x
Cardiovascular 10 11,874 15.8 40.3 4.3 19.6 28.7 25.7
Cardiovascular - Large Cap 2 59,123 11.8 11.8 6.1 20.7 26.1 23.1
Dental & Vision 4 35,597 10.0 32.9 5.2 17.0 21.7 19.4
Diversified 16 113,502 10.7 29.5 3.7 16.0 24.1 20.7
Diversified - Large Cap 7 232,547 16.2 25.9 4.5 14.5 22.1 19.8
Imaging & Radiology 4 9,880 (3.1) 8.6 1.6 9.2 22.5 20.3
Infusion & Respiratory 5 16,951 4.4 30.4 6.7 17.6 22.9 22.8
Orthopedics 8 12,072 12.6 25.8 2.8 12.6 24.9 21.7
Orthopedics - Large Cap 3 89,424 10.4 3.4 4.5 11.7 19.6 17.9
Patient Monitoring 4 43,970 9.6 27.3 8.8 23.4 35.4 30.9
Sterilization & Infection Control 3 16,648 7.4 (3.1) 2.9 12.6 18.5 17.6
Total / Median (unweighted) 69 $642,248 10.2% 26.6% 4.4x 15.2x 23.5x 20.5x
FY2017 FY2018
Value at % Change Price / Earnings Ratio
4/30/2017 3 mos. YTD 12 mos. 36 mos. 2017 2018
Dow Jones Industrial Average 20,940.51 5.3% 5.3% 17.0% 26.5%
S&P 500 2,384.20 4.6 5.6 14.5 26.6 18.3x 17.0x
Nasdaq Composite 6,047.61 7.2 11.4 25.5 46.5
Russell 2000 1,400.43 2.9 2.6 22.7 24.4 23.8 N/A
S&P500 Healthcare Equipment 1,132.38 9.2 16.9 15.2 55.2
S&P500 Healthcare Supplies 213.28 9.8 10.4 6.2 42.3
S&P500 Healthcare Distribution 620.80 (1.2) (1.4) (9.8) 6.6
Medical Products Composite 1,100.95 9.2% 16.6% 15.0% 54.6%
Number Aggr. Equity % of Total % of Aggr.
of Mkt. Value Number of Equity Mkt. Median Stock Price Performance
Companies ( millions) Companies Value 3 mos. YTD 12 mos. 36 mos.
>5bln 26 $584,561 37.7% 91.0% 11.5% 6.8% 23.5% 82.7
1bln - 5bln 18 45,808 26.1 7.1 10.9 15.7 33.7 60.2
250mm - 1bln 18 11,212 26.1 1.7 9.1 23.5 30.6 67.2
<250mm 7 668 10.1 0.1 (28.2) (23.3) (42.6) (94.7)
Total / Median 69 $642,248 100.0% 100.0% 10.0% 11.2% 27.0% 63.7%
Capitalization Profile
Market Indices
Sector
1
Sources: ThomsonOne, Bloomberg
Disclosure: KeyBanc Capital Markets is a trade name under which corporate and investment banking products and services of KeyCorp and its subsidiaries, KeyBanc Capital Markets Inc., Member
NYSE/FINRA/SIPC, and KeyBank National Association (“KeyBank N.A.”), are marketed. Securities products and services are offered by KeyBanc Capital Markets Inc. and its licensed securities
representatives, who may also be employees of KeyBank N.A. Banking products and services are offered by KeyBank N.A. This report was not issued by our research department. The information
contained in this report has been obtained from sources deemed to be reliable but is not represented to be complete, and it should not be relied upon as such. This report does not purport to be a
complete analysis of any security, issuer, or industry and is not an offer or a solicitation of an offer to buy or sell any securities. This report is prepared for general information purposes only and does
not consider the specific investment objectives, financial situation and particular needs of any individual person or entity.
($ in millions)
Medical Products Sector Review: Publicly-Traded Medical Products Summary
2
Source: ThomsonOne
Medical Products Sector Review: Publicly-Traded Medical Products Summary
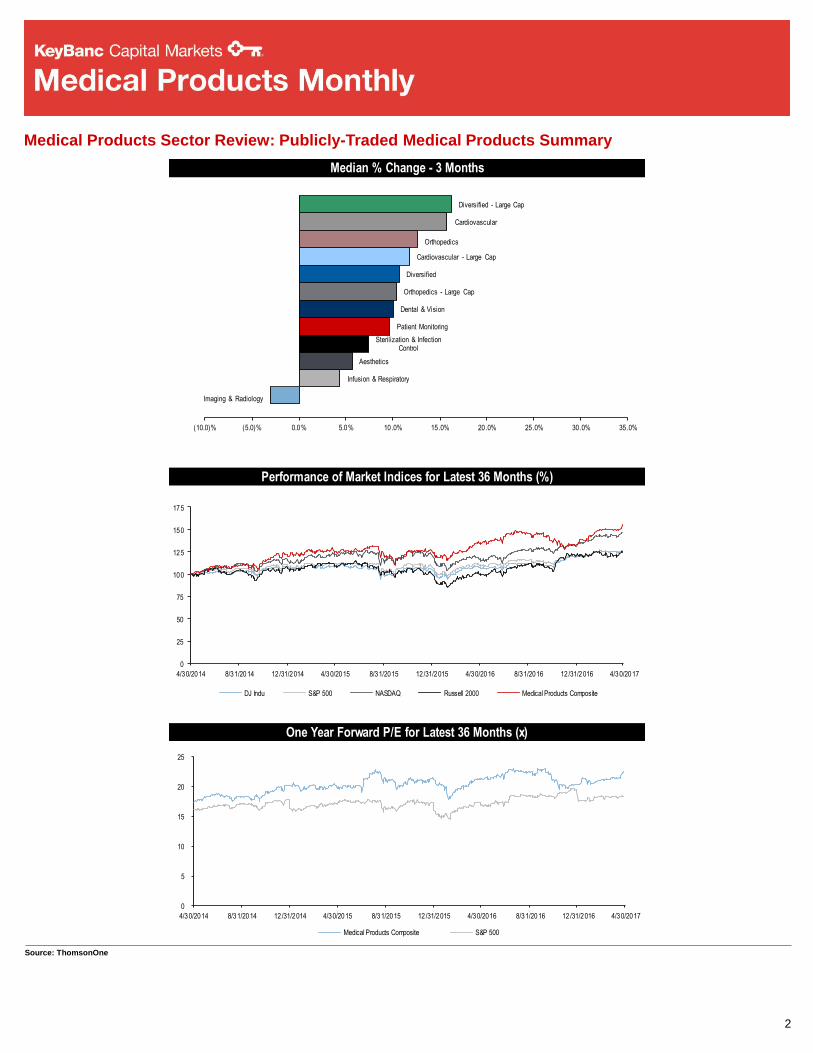
Performance of Market Indices for Latest 36 Months (%)
Median % Change - 3 Months
One Year Forward P/E for Latest 36 Months (x)
Imaging & Radiology
Infusion & Respiratory
Aesthetics
Sterilization & Infection Control
Patient Monitoring
Dental & Vision
Orthopedics - Large Cap
Diversified
Cardiovascular - Large Cap
Orthopedics
Cardiovascular
Diversified - Large Cap
(10.0)% (5.0)% 0.0% 5.0% 10.0% 15.0% 20.0% 25.0% 30.0% 35.0%
0
25
50
75
100
125
150
175
4/30/2014 8/31/2014 12/31/2014 4/30/2015 8/31/2015 12/31/2015 4/30/2016 8/31/2016 12/31/2016 4/30/2017
DJ Indu S&P 500 NASDAQ Russell 2000 Medical Products Composite
0
5
10
15
20
25
4/30/2014 8/31/2014 12/31/2014 4/30/2015 8/31/2015 12/31/2015 4/30/2016 8/31/2016 12/31/2016 4/30/2017
Medical Products Composite S&P 500
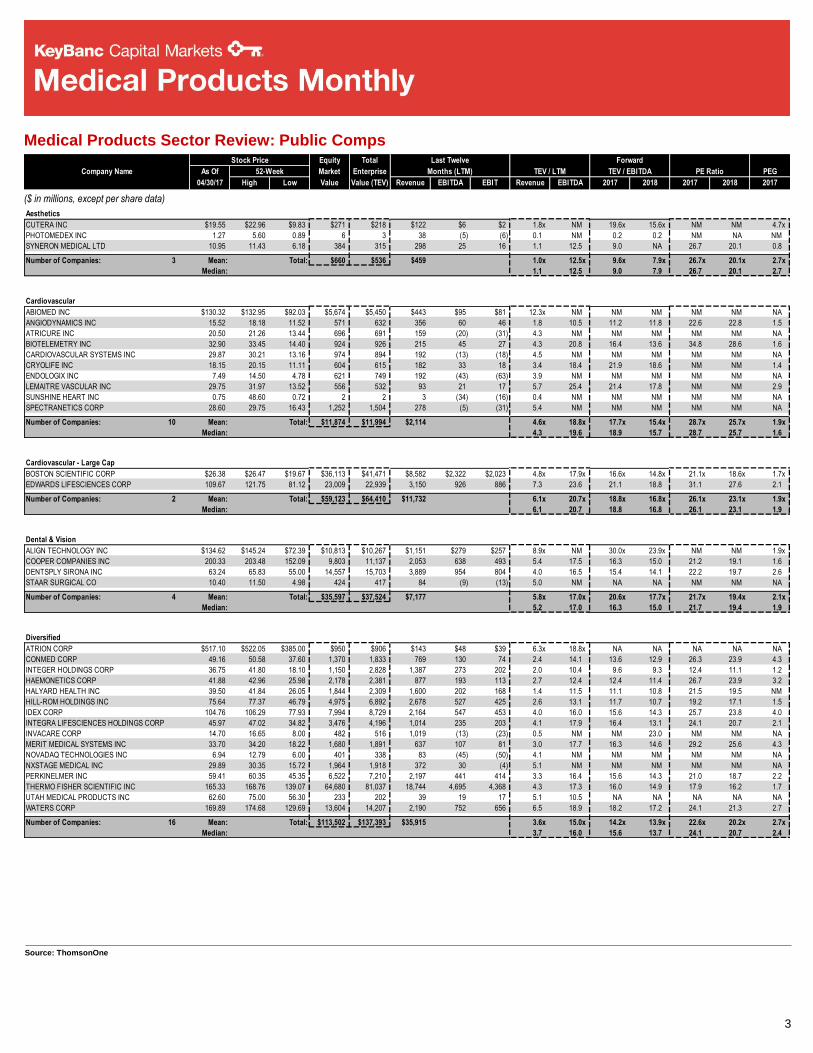
Stock Price Equity Total Last Twelve Forward
Company Name As Of 52-Week Market Enterprise Months (LTM) TEV / LTM TEV / EBITDA PE Ratio PEG
04/30/17 High Low Value Value (TEV) Revenue EBITDA EBIT Revenue EBITDA 2017 2018 2017 2018 2017
Aesthetics
CUTERA INC $19.55 $22.96 $9.83 $271 $218 $122 $6 $2 1.8x NM 19.6x 15.6x NM NM 4.7x
PHOTOMEDEX INC 1.27 5.60 0.89 6 3 38 (5) (6) 0.1 NM 0.2 0.2 NM NA NM
SYNERON MEDICAL LTD 10.95 11.43 6.18 384 315 298 25 16 1.1 12.5 9.0 NA 26.7 20.1 0.8
3Number of Companies: Mean: Total: $660 $536 $459 1.0x 12.5x 9.6x 7.9x 26.7x 20.1x 2.7x
Median: 1.1 12.5 9.0 7.9 26.7 20.1 2.7
Cardiovascular
ABIOMED INC $130.32 $132.95 $92.03 $5,674 $5,450 $443 $95 $81 12.3x NM NM NM NM NM NA
ANGIODYNAMICS INC 15.52 18.18 11.52 571 632 356 60 46 1.8 10.5 11.2 11.8 22.6 22.8 1.5
ATRICURE INC 20.50 21.26 13.44 696 691 159 (20) (31) 4.3 NM NM NM NM NM NA
BIOTELEMETRY INC 32.90 33.45 14.40 924 926 215 45 27 4.3 20.8 16.4 13.6 34.8 28.6 1.6
CARDIOVASCULAR SYSTEMS INC 29.87 30.21 13.16 974 894 192 (13) (18) 4.5 NM NM NM NM NM NA
CRYOLIFE INC 18.15 20.15 11.11 604 615 182 33 18 3.4 18.4 21.9 18.6 NM NM 1.4
ENDOLOGIX INC 7.49 14.50 4.78 621 749 192 (43) (63) 3.9 NM NM NM NM NM NA
LEMAITRE VASCULAR INC 29.75 31.97 13.52 556 532 93 21 17 5.7 25.4 21.4 17.8 NM NM 2.9
SUNSHINE HEART INC 0.75 48.60 0.72 2 2 3 (34) (16) 0.4 NM NM NM NM NM NA
SPECTRANETICS CORP 28.60 29.75 16.43 1,252 1,504 278 (5) (31) 5.4 NM NM NM NM NM NA
10Number of Companies: Mean: Total: $11,874 $11,994 $2,114 4.6x 18.8x 17.7x 15.4x 28.7x 25.7x 1.9x
Median: 4.3 19.6 18.9 15.7 28.7 25.7 1.6
Cardiovascular - Large Cap
BOSTON SCIENTIFIC CORP $26.38 $26.47 $19.67 $36,113 $41,471 $8,582 $2,322 $2,023 4.8x 17.9x 16.6x 14.8x 21.1x 18.6x 1.7x
EDWARDS LIFESCIENCES CORP 109.67 121.75 81.12 23,009 22,939 3,150 926 886 7.3 23.6 21.1 18.8 31.1 27.6 2.1
2Number of Companies: Mean: Total: $59,123 $64,410 $11,732 6.1x 20.7x 18.8x 16.8x 26.1x 23.1x 1.9x
Median: 6.1 20.7 18.8 16.8 26.1 23.1 1.9
Dental & Vision
ALIGN TECHNOLOGY INC $134.62 $145.24 $72.39 $10,813 $10,267 $1,151 $279 $257 8.9x NM 30.0x 23.9x NM NM 1.9x
COOPER COMPANIES INC 200.33 203.48 152.09 9,803 11,137 2,053 638 493 5.4 17.5 16.3 15.0 21.2 19.1 1.6
DENTSPLY SIRONA INC 63.24 65.83 55.00 14,557 15,703 3,889 954 804 4.0 16.5 15.4 14.1 22.2 19.7 2.6
STAAR SURGICAL CO 10.40 11.50 4.98 424 417 84 (9) (13) 5.0 NM NA NA NM NM NA
4Number of Companies: Mean: Total: $35,597 $37,524 $7,177 5.8x 17.0x 20.6x 17.7x 21.7x 19.4x 2.1x
Median: 5.2 17.0 16.3 15.0 21.7 19.4 1.9
Diversified
ATRION CORP $517.10 $522.05 $385.00 $950 $906 $143 $48 $39 6.3x 18.8x NA NA NA NA NA
CONMED CORP 49.16 50.58 37.60 1,370 1,833 769 130 74 2.4 14.1 13.6 12.9 26.3 23.9 4.3
INTEGER HOLDINGS CORP 36.75 41.80 18.10 1,150 2,828 1,387 273 202 2.0 10.4 9.6 9.3 12.4 11.1 1.2
HAEMONETICS CORP 41.88 42.96 25.98 2,178 2,381 877 193 113 2.7 12.4 12.4 11.4 26.7 23.9 3.2
HALYARD HEALTH INC 39.50 41.84 26.05 1,844 2,309 1,600 202 168 1.4 11.5 11.1 10.8 21.5 19.5 NM
HILL-ROM HOLDINGS INC 75.64 77.37 46.79 4,975 6,892 2,678 527 425 2.6 13.1 11.7 10.7 19.2 17.1 1.5
IDEX CORP 104.76 106.29 77.93 7,994 8,729 2,164 547 453 4.0 16.0 15.6 14.3 25.7 23.8 4.0
INTEGRA LIFESCIENCES HOLDINGS CORP 45.97 47.02 34.82 3,476 4,196 1,014 235 203 4.1 17.9 16.4 13.1 24.1 20.7 2.1
INVACARE CORP 14.70 16.65 8.00 482 516 1,019 (13) (23) 0.5 NM NM 23.0 NM NM NA
MERIT MEDICAL SYSTEMS INC 33.70 34.20 18.22 1,680 1,891 637 107 81 3.0 17.7 16.3 14.6 29.2 25.6 4.3
NOVADAQ TECHNOLOGIES INC 6.94 12.79 6.00 401 338 83 (45) (50) 4.1 NM NM NM NM NM NA
NXSTAGE MEDICAL INC 29.89 30.35 15.72 1,964 1,918 372 30 (4) 5.1 NM NM NM NM NM NA
PERKINELMER INC 59.41 60.35 45.35 6,522 7,210 2,197 441 414 3.3 16.4 15.6 14.3 21.0 18.7 2.2
THERMO FISHER SCIENTIFIC INC 165.33 168.76 139.07 64,680 81,037 18,744 4,695 4,368 4.3 17.3 16.0 14.9 17.9 16.2 1.7
UTAH MEDICAL PRODUCTS INC 62.60 75.00 56.30 233 202 39 19 17 5.1 10.5 NA NA NA NA NA
WATERS CORP 169.89 174.68 129.69 13,604 14,207 2,190 752 656 6.5 18.9 18.2 17.2 24.1 21.3 2.7
16Number of Companies: Mean: Total: $113,502 $137,393 $35,915 3.6x 15.0x 14.2x 13.9x 22.6x 20.2x 2.7x
Median: 3.7 16.0 15.6 13.7 24.1 20.7 2.4
3
Source: ThomsonOne
($ in millions, except per share data)
Medical Products Sector Review: Public Comps Stock Price Equity Total Last Twelve Forward
Company Name As Of 52-Week Market Enterprise Months (LTM) TEV / LTM TEV / EBITDA PE Ratio PEG
04/30/17 High Low Value Value (TEV) Revenue EBITDA EBIT Revenue EBITDA 2017 2018 2017 2018 2017
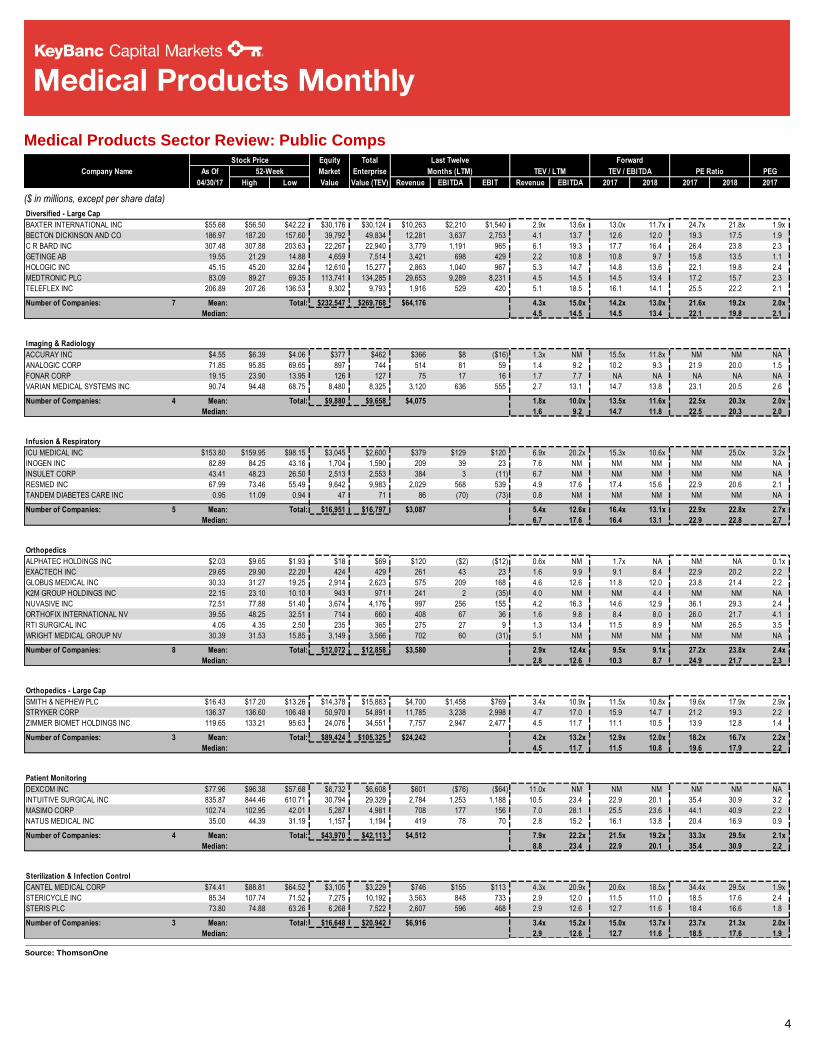
Diversified - Large Cap
BAXTER INTERNATIONAL INC $55.68 $56.50 $42.22 $30,176 $30,124 $10,263 $2,210 $1,540 2.9x 13.6x 13.0x 11.7x 24.7x 21.8x 1.9x
BECTON DICKINSON AND CO 186.97 187.20 157.60 39,792 49,834 12,281 3,637 2,753 4.1 13.7 12.6 12.0 19.3 17.5 1.9
C R BARD INC 307.48 307.88 203.63 22,267 22,940 3,779 1,191 965 6.1 19.3 17.7 16.4 26.4 23.8 2.3
GETINGE AB 19.55 21.29 14.88 4,659 7,514 3,421 698 429 2.2 10.8 10.8 9.7 15.8 13.5 1.1
HOLOGIC INC 45.15 45.20 32.64 12,610 15,277 2,863 1,040 967 5.3 14.7 14.8 13.6 22.1 19.8 2.4
MEDTRONIC PLC 83.09 89.27 69.35 113,741 134,285 29,653 9,289 8,231 4.5 14.5 14.5 13.4 17.2 15.7 2.3
TELEFLEX INC 206.89 207.26 136.53 9,302 9,793 1,916 529 420 5.1 18.5 16.1 14.1 25.5 22.2 2.1
7Number of Companies: Mean: Total: $232,547 $269,768 $64,176 4.3x 15.0x 14.2x 13.0x 21.6x 19.2x 2.0x
Median: 4.5 14.5 14.5 13.4 22.1 19.8 2.1
Imaging & Radiology
ACCURAY INC $4.55 $6.39 $4.06 $377 $462 $366 $8 ($16) 1.3x NM 15.5x 11.8x NM NM NA
ANALOGIC CORP 71.85 95.85 69.65 897 744 514 81 59 1.4 9.2 10.2 9.3 21.9 20.0 1.5
FONAR CORP 19.15 23.90 13.95 126 127 75 17 16 1.7 7.7 NA NA NA NA NA
VARIAN MEDICAL SYSTEMS INC 90.74 94.48 68.75 8,480 8,325 3,120 636 555 2.7 13.1 14.7 13.8 23.1 20.5 2.6
4Number of Companies: Mean: Total: $9,880 $9,658 $4,075 1.8x 10.0x 13.5x 11.6x 22.5x 20.3x 2.0x
Median: 1.6 9.2 14.7 11.8 22.5 20.3 2.0
Infusion & Respiratory
ICU MEDICAL INC $153.80 $159.95 $98.15 $3,045 $2,600 $379 $129 $120 6.9x 20.2x 15.3x 10.6x NM 25.0x 3.2x
INOGEN INC 82.89 84.25 43.16 1,704 1,590 209 39 23 7.6 NM NM NM NM NM NA
INSULET CORP 43.41 48.23 26.50 2,513 2,553 384 3 (11) 6.7 NM NM NM NM NM NA
RESMED INC 67.99 73.46 55.49 9,642 9,983 2,029 568 539 4.9 17.6 17.4 15.6 22.9 20.6 2.1
TANDEM DIABETES CARE INC 0.95 11.09 0.94 47 71 86 (70) (73) 0.8 NM NM NM NM NM NA
5Number of Companies: Mean: Total: $16,951 $16,797 $3,087 5.4x 12.6x 16.4x 13.1x 22.9x 22.8x 2.7x
Median: 6.7 17.6 16.4 13.1 22.9 22.8 2.7
Orthopedics
ALPHATEC HOLDINGS INC $2.03 $9.65 $1.93 $18 $69 $120 ($2) ($12) 0.6x NM 1.7x NA NM NA 0.1x
EXACTECH INC 29.65 29.90 22.20 424 429 261 43 23 1.6 9.9 9.1 8.4 22.9 20.2 2.2
GLOBUS MEDICAL INC 30.33 31.27 19.25 2,914 2,623 575 209 168 4.6 12.6 11.8 12.0 23.8 21.4 2.2
K2M GROUP HOLDINGS INC 22.15 23.10 10.10 943 971 241 2 (35) 4.0 NM NM 4.4 NM NM NA
NUVASIVE INC 72.51 77.88 51.40 3,674 4,176 997 256 155 4.2 16.3 14.6 12.9 36.1 29.3 2.4
ORTHOFIX INTERNATIONAL NV 39.55 48.25 32.51 714 660 408 67 36 1.6 9.8 8.4 8.0 26.0 21.7 4.1
RTI SURGICAL INC 4.05 4.35 2.50 235 365 275 27 9 1.3 13.4 11.5 8.9 NM 26.5 3.5
WRIGHT MEDICAL GROUP NV 30.39 31.53 15.85 3,149 3,566 702 60 (31) 5.1 NM NM NM NM NM NA
8Number of Companies: Mean: Total: $12,072 $12,858 $3,580 2.9x 12.4x 9.5x 9.1x 27.2x 23.8x 2.4x
Median: 2.8 12.6 10.3 8.7 24.9 21.7 2.3
Orthopedics - Large Cap
SMITH & NEPHEW PLC $16.43 $17.20 $13.26 $14,378 $15,883 $4,700 $1,458 $769 3.4x 10.9x 11.5x 10.8x 19.6x 17.9x 2.9x
STRYKER CORP 136.37 136.60 106.48 50,970 54,891 11,785 3,238 2,998 4.7 17.0 15.9 14.7 21.2 19.3 2.2
ZIMMER BIOMET HOLDINGS INC 119.65 133.21 95.63 24,076 34,551 7,757 2,947 2,477 4.5 11.7 11.1 10.5 13.9 12.8 1.4
3Number of Companies: Mean: Total: $89,424 $105,325 $24,242 4.2x 13.2x 12.9x 12.0x 18.2x 16.7x 2.2x
Median: 4.5 11.7 11.5 10.8 19.6 17.9 2.2
Patient Monitoring
DEXCOM INC $77.96 $96.38 $57.68 $6,732 $6,608 $601 ($76) ($64) 11.0x NM NM NM NM NM NA
INTUITIVE SURGICAL INC 835.87 844.46 610.71 30,794 29,329 2,784 1,253 1,188 10.5 23.4 22.9 20.1 35.4 30.9 3.2
MASIMO CORP 102.74 102.95 42.01 5,287 4,981 708 177 156 7.0 28.1 25.5 23.6 44.1 40.9 2.2
NATUS MEDICAL INC 35.00 44.39 31.19 1,157 1,194 419 78 70 2.8 15.2 16.1 13.8 20.4 16.9 0.9
4Number of Companies: Mean: Total: $43,970 $42,113 $4,512 7.9x 22.2x 21.5x 19.2x 33.3x 29.5x 2.1x
Median: 8.8 23.4 22.9 20.1 35.4 30.9 2.2
Sterilization & Infection Control
CANTEL MEDICAL CORP $74.41 $88.81 $64.52 $3,105 $3,229 $746 $155 $113 4.3x 20.9x 20.6x 18.5x 34.4x 29.5x 1.9x
STERICYCLE INC 85.34 107.74 71.52 7,275 10,192 3,563 848 733 2.9 12.0 11.5 11.0 18.5 17.6 2.4
STERIS PLC 73.80 74.88 63.26 6,268 7,522 2,607 596 468 2.9 12.6 12.7 11.6 18.4 16.6 1.8
3Number of Companies: Mean: Total: $16,648 $20,942 $6,916 3.4x 15.2x 15.0x 13.7x 23.7x 21.3x 2.0x
Median: 2.9 12.6 12.7 11.6 18.5 17.6 1.9
4
Source: ThomsonOne
($ in millions, except per share data)
Medical Products Sector Review: Public Comps Stock Price Equity Total Last Twelve Forward
Company Name As Of 52-Week Market Enterprise Months (LTM) TEV / LTM TEV / EBITDA PE Ratio PEG
04/30/17 High Low Value Value (TEV) Revenue EBITDA EBIT Revenue EBITDA 2017 2018 2017 2018 2017
5
Sources: Morgan Markets, Bloomberg
As of April 30, 2017
High Yield New Issue Volume
Debt Capital Markets Overview
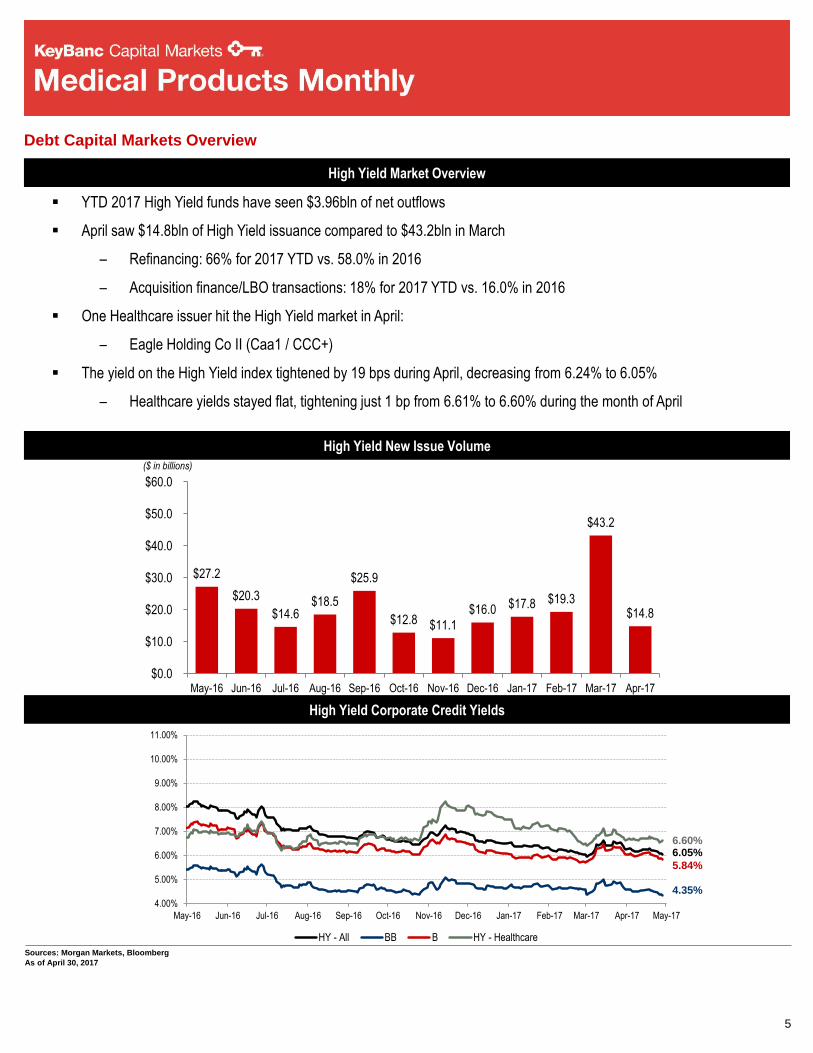
High Yield Market Overview
High Yield Corporate Credit Yields
6.05%
5.84%
6.60%
4.35%
($ in billions)
YTD 2017 High Yield funds have seen $3.96bln of net outflows
April saw $14.8bln of High Yield issuance compared to $43.2bln in March
– Refinancing: 66% for 2017 YTD vs. 58.0% in 2016
– Acquisition finance/LBO transactions: 18% for 2017 YTD vs. 16.0% in 2016
One Healthcare issuer hit the High Yield market in April:
– Eagle Holding Co II (Caa1 / CCC+)
The yield on the High Yield index tightened by 19 bps during April, decreasing from 6.24% to 6.05%
– Healthcare yields stayed flat, tightening just 1 bp from 6.61% to 6.60% during the month of April
$27.2
$20.3
$14.6 $18.5
$25.9
$12.8 $11.1
$16.0 $17.8 $19.3
$43.2
$14.8
$0.0
$10.0
$20.0
$30.0
$40.0
$50.0
$60.0
May-16 Jun-16 Jul-16 Aug-16 Sep-16 Oct-16 Nov-16 Dec-16 Jan-17 Feb-17 Mar-17 Apr-17
4.00%
5.00%
6.00%
7.00%
8.00%
9.00%
10.00%
11.00%
May-16 Jun-16 Jul-16 Aug-16 Sep-16 Oct-16 Nov-16 Dec-16 Jan-17 Feb-17 Mar-17 Apr-17 May-17
HY - All BB B HY - Healthcare
6
Sources: Morgan Markets, Bloomberg
As of April 30, 2017
Debt Capital Markets Overview
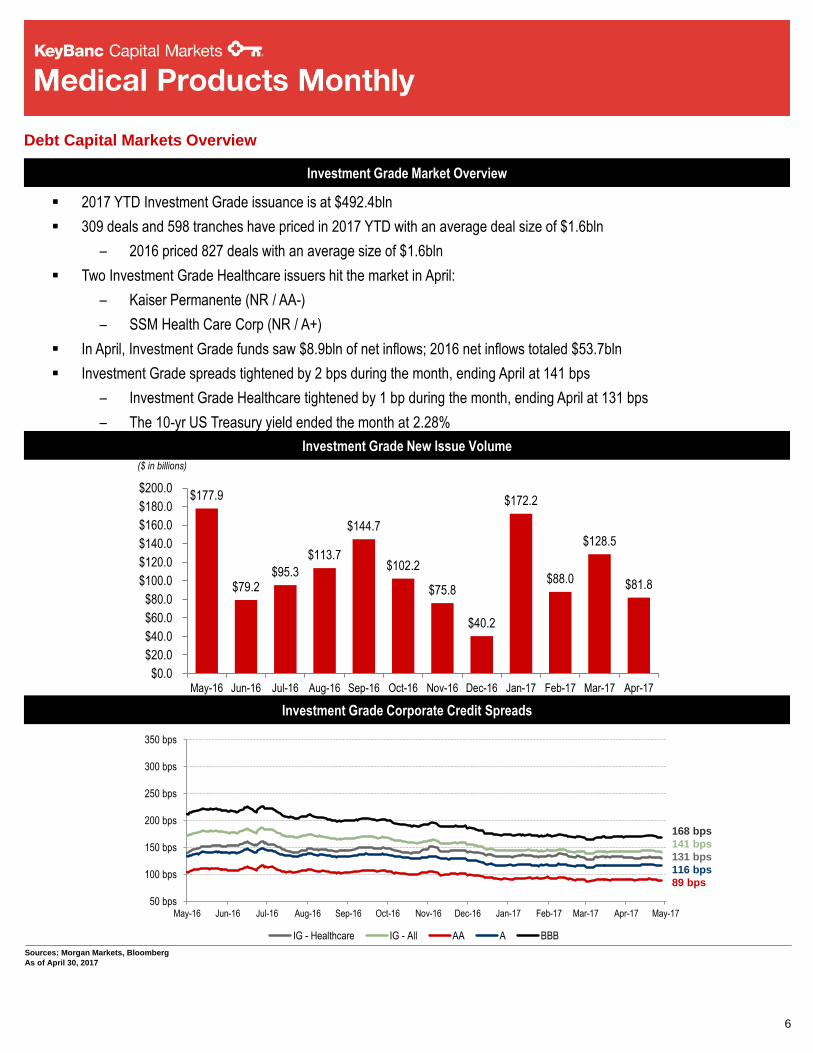
Investment Grade Market Overview
Investment Grade New Issue Volume
Investment Grade Corporate Credit Spreads
89 bps
116 bps
131 bps
168 bps
141 bps
($ in billions)
$177.9
$79.2 $95.3
$113.7
$144.7
$102.2
$75.8
$40.2
$172.2
$88.0
$128.5
$81.8
$0.0
$20.0
$40.0
$60.0
$80.0
$100.0
$120.0
$140.0
$160.0
$180.0
$200.0
May-16 Jun-16 Jul-16 Aug-16 Sep-16 Oct-16 Nov-16 Dec-16 Jan-17 Feb-17 Mar-17 Apr-17
50 bps
100 bps
150 bps
200 bps
250 bps
300 bps
350 bps
May-16 Jun-16 Jul-16 Aug-16 Sep-16 Oct-16 Nov-16 Dec-16 Jan-17 Feb-17 Mar-17 Apr-17 May-17
IG - Healthcare IG - All AA A BBB
2017 YTD Investment Grade issuance is at $492.4bln
309 deals and 598 tranches have priced in 2017 YTD with an average deal size of $1.6bln
– 2016 priced 827 deals with an average size of $1.6bln
Two Investment Grade Healthcare issuers hit the market in April:
– Kaiser Permanente (NR / AA-)
– SSM Health Care Corp (NR / A+)
In April, Investment Grade funds saw $8.9bln of net inflows; 2016 net inflows totaled $53.7bln
Investment Grade spreads tightened by 2 bps during the month, ending April at 141 bps
– Investment Grade Healthcare tightened by 1 bp during the month, ending April at 131 bps
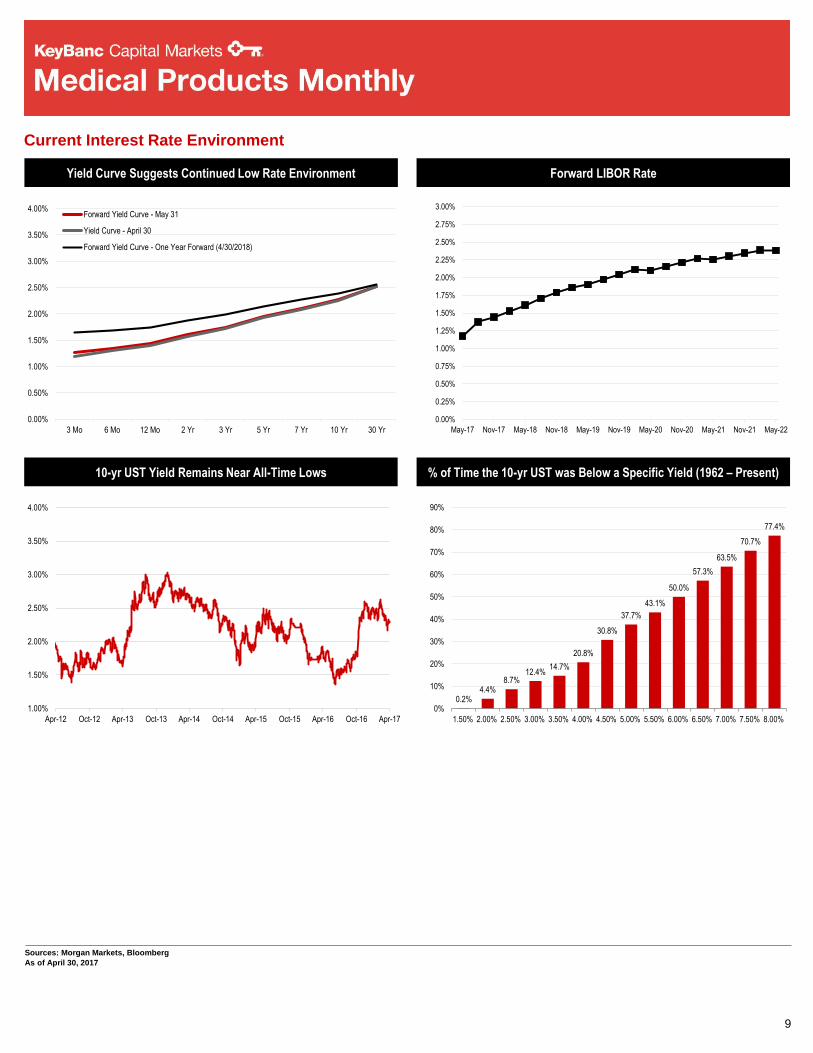
– The 10-yr US Treasury yield ended the month at 2.28%
Amount Rating
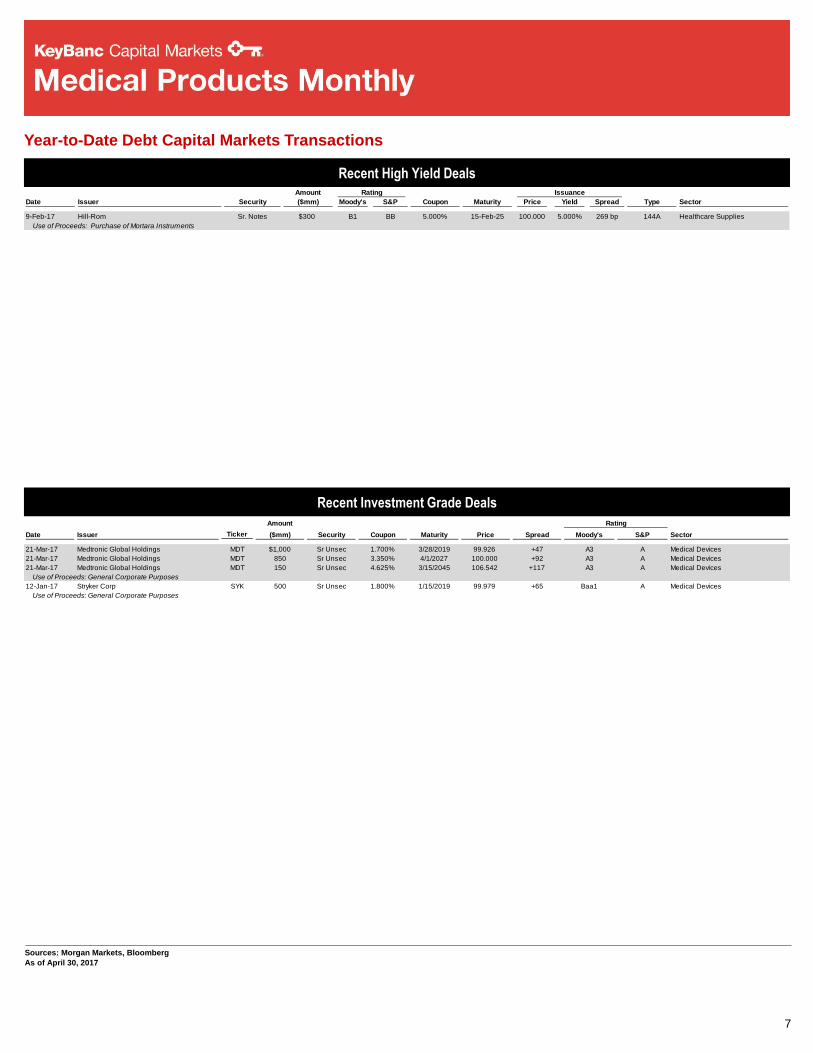
Date Issuer Ticker ($mm) Security Coupon Maturity Price Spread Moody's S&P Sector
21-Mar-17 Medtronic Global Holdings MDT $1,000 Sr Unsec 1.700% 3/28/2019 99.926 +47 A3 A Medical Devices
21-Mar-17 Medtronic Global Holdings MDT 850 Sr Unsec 3.350% 4/1/2027 100.000 +92 A3 A Medical Devices
21-Mar-17 Medtronic Global Holdings MDT 150 Sr Unsec 4.625% 3/15/2045 106.542 +117 A3 A Medical Devices
Use of Proceeds: General Corporate Purposes
12-Jan-17 Stryker Corp SYK 500 Sr Unsec 1.800% 1/15/2019 99.979 +65 Baa1 A Medical Devices
Use of Proceeds: General Corporate Purposes
7
Sources: Morgan Markets, Bloomberg
As of April 30, 2017
Recent High Yield Deals
Recent Investment Grade Deals
Year-to-Date Debt Capital Markets Transactions
Amount Rating Issuance
Date Issuer Security ($mm) Moody's S&P Coupon Maturity Price Yield Spread Type Sector
9-Feb-17 Hill-Rom Sr. Notes $300 B1 BB 5.000% 15-Feb-25 100.000 5.000% 269 bp 144A Healthcare Supplies
Use of Proceeds: Purchase of Mortara Instruments
Tranche LIBOR Upfront
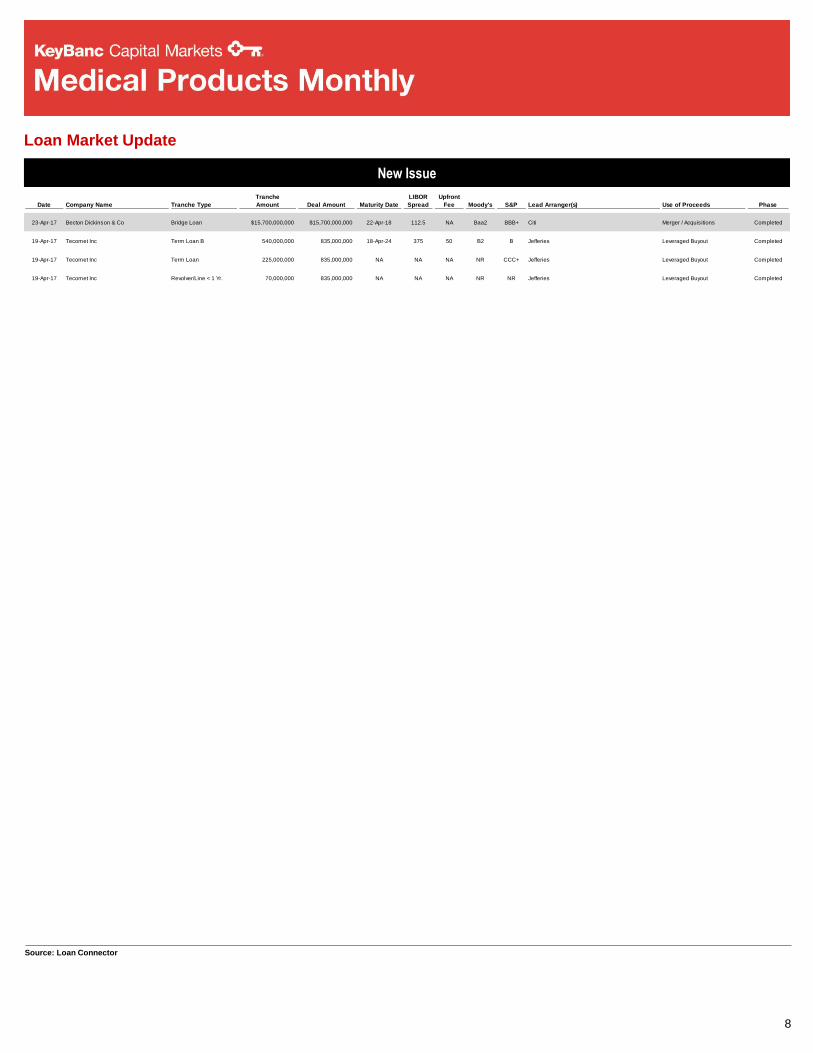
Date Company Name Tranche Type Amount Deal Amount Maturity Date Spread Fee Moody's S&P Lead Arranger(s) Use of Proceeds Phase
23-Apr-17 Becton Dickinson & Co Bridge Loan $15,700,000,000 $15,700,000,000 22-Apr-18 112.5 NA Baa2 BBB+ Citi Merger / Acquisitions Completed
19-Apr-17 Tecomet Inc Term Loan B 540,000,000 835,000,000 18-Apr-24 375 50 B2 B Jefferies Leveraged Buyout Completed
19-Apr-17 Tecomet Inc Term Loan 225,000,000 835,000,000 NA NA NA NR CCC+ Jefferies Leveraged Buyout Completed
19-Apr-17 Tecomet Inc Revolver/Line < 1 Yr. 70,000,000 835,000,000 NA NA NA NR NR Jefferies Leveraged Buyout Completed
8
Source: Loan Connector
New Issue
Loan Market Update
9
Sources: Morgan Markets, Bloomberg
As of April 30, 2017
Current Interest Rate Environment
Yield Curve Suggests Continued Low Rate Environment Forward LIBOR Rate
10-yr UST Yield Remains Near All-Time Lows % of Time the 10-yr UST was Below a Specific Yield (1962 – Present)
0.00%
0.50%
1.00%
1.50%
2.00%
2.50%
3.00%
3.50%
4.00%
3 Mo 6 Mo 12 Mo 2 Yr 3 Yr 5 Yr 7 Yr 10 Yr 30 Yr
Forward Yield Curve - May 31
Yield Curve - April 30
Forward Yield Curve - One Year Forward (4/30/2018)
0.00%
0.25%
0.50%
0.75%
1.00%
1.25%
1.50%
1.75%
2.00%
2.25%
2.50%
2.75%
3.00%
May-17 Nov-17 May-18 Nov-18 May-19 Nov-19 May-20 Nov-20 May-21 Nov-21 May-22
1.00%
1.50%
2.00%
2.50%
3.00%
3.50%
4.00%
Apr-12 Oct-12 Apr-13 Oct-13 Apr-14 Oct-14 Apr-15 Oct-15 Apr-16 Oct-16 Apr-17
0.2%4.4%
8.7%12.4%
14.7%
20.8%
30.8%
37.7%
43.1%
50.0%
57.3%
63.5%
70.7%
77.4%
0%
10%
20%
30%
40%
50%
60%
70%
80%
90%
1.50% 2.00% 2.50% 3.00% 3.50% 4.00% 4.50% 5.00% 5.50% 6.00% 6.50% 7.00% 7.50% 8.00%
10
Sources: Capital IQ, Dealogic, Lipper
As of April 30, 2017
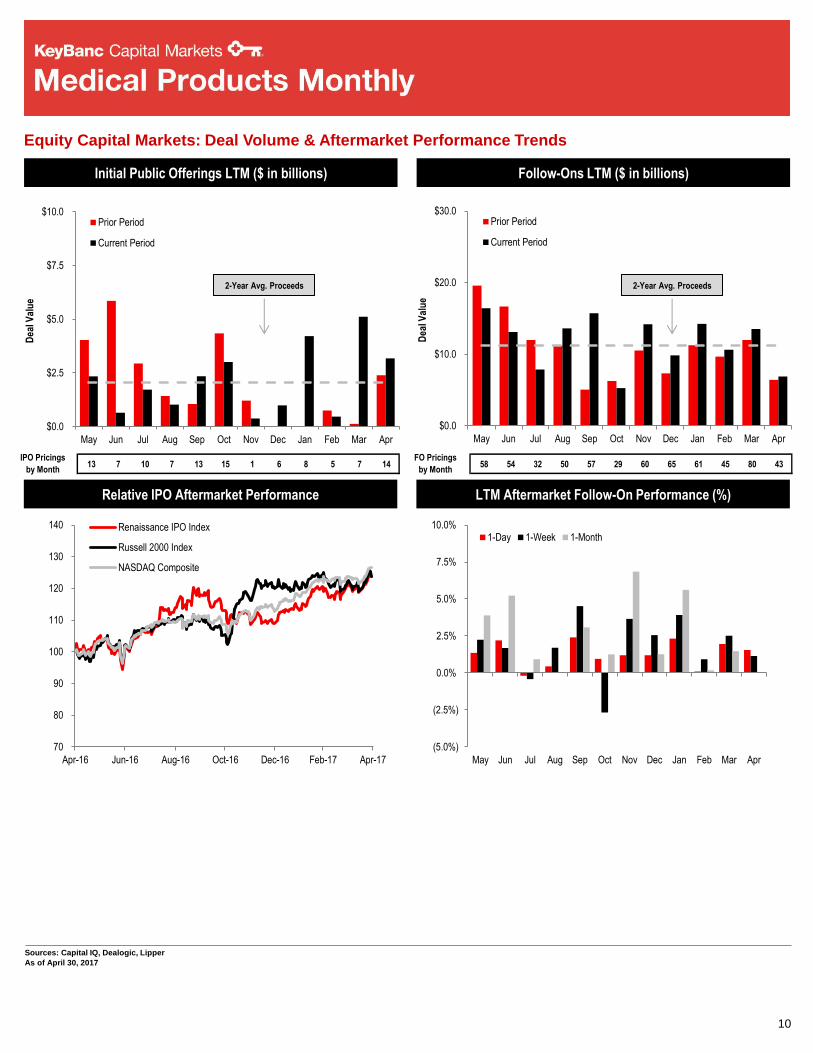
58 54 32 50 57 29 60 65 61 45 80 43FO Pricings
by Month
$0.0
$10.0
$20.0
$30.0
May Jun Jul Aug Sep Oct Nov Dec Jan Feb Mar Apr
Dea
l Val
ue
Prior Period
Current Period
13 7 10 7 13 15 1 6 8 5 7 14IPO Pricings
by Month
$0.0
$2.5
$5.0
$7.5
$10.0
May Jun Jul Aug Sep Oct Nov Dec Jan Feb Mar Apr
Dea
l Val
ue
Prior Period
Current Period
Equity Capital Markets: Deal Volume & Aftermarket Performance Trends
Follow-Ons LTM ($ in billions) Initial Public Offerings LTM ($ in billions)
LTM Aftermarket Follow-On Performance (%) Relative IPO Aftermarket Performance
2-Year Avg. Proceeds 2-Year Avg. Proceeds
(5.0%)
(2.5%)
0.0%
2.5%
5.0%
7.5%
10.0%
May Jun Jul Aug Sep Oct Nov Dec Jan Feb Mar Apr
1-Day 1-Week 1-Month
70
80
90
100
110
120
130
140
Apr-16 Jun-16 Aug-16 Oct-16 Dec-16 Feb-17 Apr-17
Renaissance IPO Index
Russell 2000 Index
NASDAQ Composite
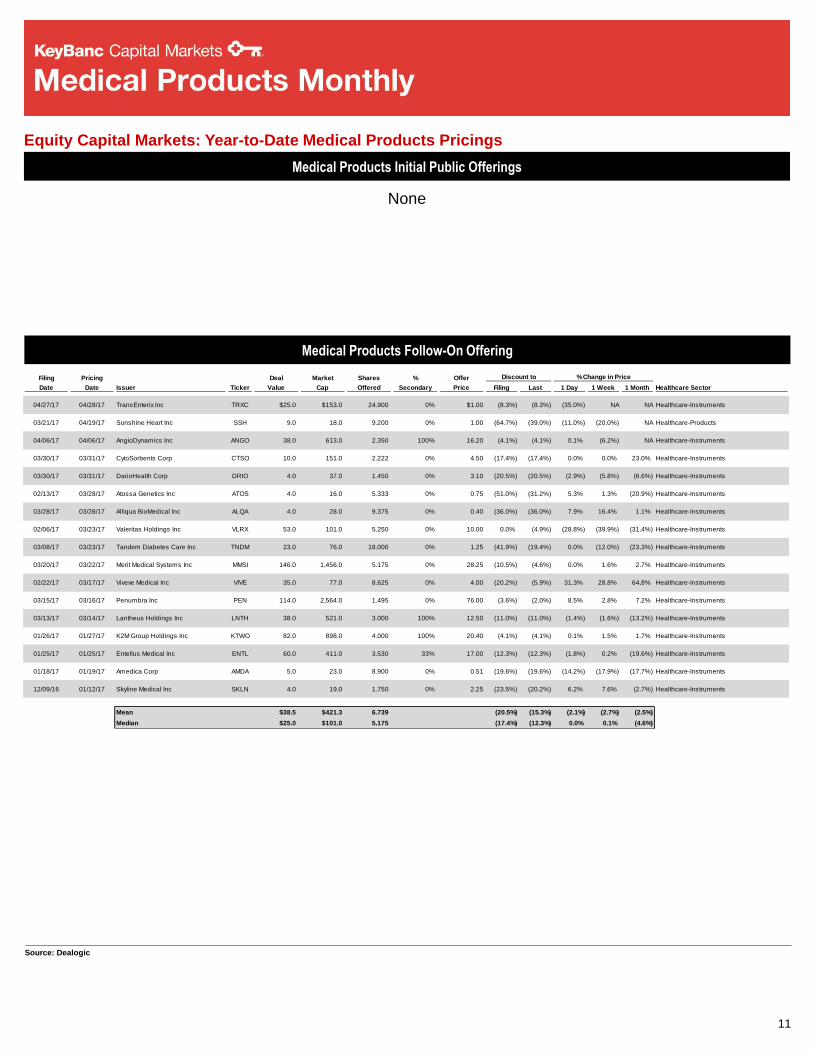
Filing Pricing Deal Market Shares % Offer Discount to % Change in Price
Date Date Issuer Ticker Value Cap Offered Secondary Price Filing Last 1 Day 1 Week 1 Month Healthcare Sector
04/27/17 04/28/17 TransEnterix Inc TRXC $25.0 $153.0 24.900 0% $1.00 (8.3%) (8.3%) (35.0%) NA NA Healthcare-Instruments
03/21/17 04/19/17 Sunshine Heart Inc SSH 9.0 18.0 9.200 0% 1.00 (64.7%) (39.0%) (11.0%) (20.0%) NA Healthcare-Products
04/06/17 04/06/17 AngioDynamics Inc ANGO 38.0 613.0 2.350 100% 16.20 (4.1%) (4.1%) 0.1% (6.2%) NA Healthcare-Instruments
03/30/17 03/31/17 CytoSorbents Corp CTSO 10.0 151.0 2.222 0% 4.50 (17.4%) (17.4%) 0.0% 0.0% 23.0% Healthcare-Instruments
03/30/17 03/31/17 DarioHealth Corp DRIO 4.0 37.0 1.450 0% 3.10 (20.5%) (20.5%) (2.9%) (5.8%) (6.6%) Healthcare-Instruments
02/13/17 03/28/17 Atossa Genetics Inc ATOS 4.0 16.0 5.333 0% 0.75 (51.0%) (31.2%) 5.3% 1.3% (20.9%) Healthcare-Instruments
03/28/17 03/28/17 Alliqua BioMedical Inc ALQA 4.0 28.0 9.375 0% 0.40 (36.0%) (36.0%) 7.9% 16.4% 1.1% Healthcare-Instruments
02/06/17 03/23/17 Valeritas Holdings Inc VLRX 53.0 101.0 5.250 0% 10.00 0.0% (4.9%) (28.8%) (39.9%) (31.4%) Healthcare-Instruments
03/08/17 03/23/17 Tandem Diabetes Care Inc TNDM 23.0 76.0 18.000 0% 1.25 (41.9%) (19.4%) 0.0% (12.0%) (23.3%) Healthcare-Instruments
03/20/17 03/22/17 Merit Medical Systems Inc MMSI 146.0 1,456.0 5.175 0% 28.25 (10.5%) (4.6%) 0.0% 1.6% 2.7% Healthcare-Instruments
02/22/17 03/17/17 Viveve Medical Inc VIVE 35.0 77.0 8.625 0% 4.00 (20.2%) (5.9%) 31.3% 28.8% 64.8% Healthcare-Instruments
03/15/17 03/16/17 Penumbra Inc PEN 114.0 2,564.0 1.495 0% 76.00 (3.6%) (2.0%) 8.5% 2.8% 7.2% Healthcare-Instruments
03/13/17 03/14/17 Lantheus Holdings Inc LNTH 38.0 521.0 3.000 100% 12.50 (11.0%) (11.0%) (1.4%) (1.6%) (13.2%) Healthcare-Instruments
01/26/17 01/27/17 K2M Group Holdings Inc KTWO 82.0 898.0 4.000 100% 20.40 (4.1%) (4.1%) 0.1% 1.5% 1.7% Healthcare-Instruments
01/25/17 01/25/17 Entellus Medical Inc ENTL 60.0 411.0 3.530 33% 17.00 (12.3%) (12.3%) (1.8%) 0.2% (19.6%) Healthcare-Instruments
01/18/17 01/19/17 Amedica Corp AMDA 5.0 23.0 8.900 0% 0.51 (19.6%) (19.6%) (14.2%) (17.9%) (17.7%) Healthcare-Instruments
12/09/16 01/12/17 Skyline Medical Inc SKLN 4.0 19.0 1.750 0% 2.25 (23.5%) (20.2%) 6.2% 7.6% (2.7%) Healthcare-Instruments
Mean $38.5 $421.3 6.739 (20.5%) (15.3%) (2.1%) (2.7%) (2.5%)
Median $25.0 $101.0 5.175 (17.4%) (12.3%) 0.0% 0.1% (4.6%)
11
Source: Dealogic
Medical Products Follow-On Offering
Equity Capital Markets: Year-to-Date Medical Products Pricings
Medical Products Initial Public Offerings
None
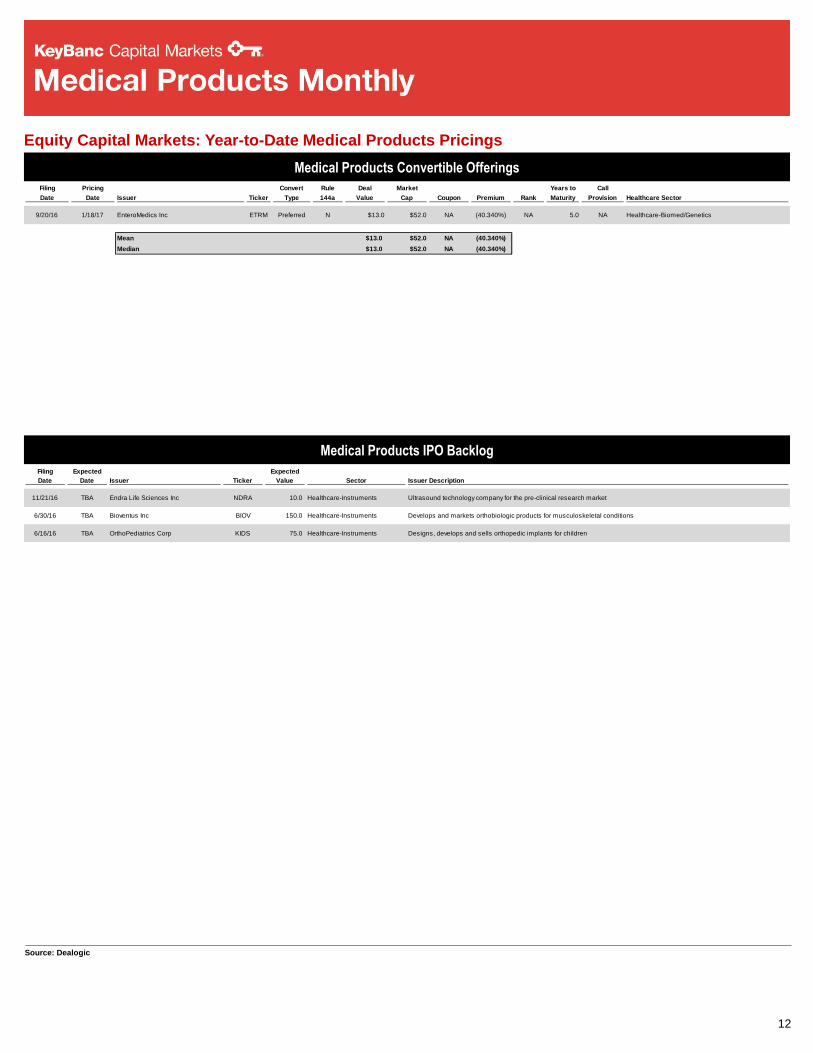
Filing Pricing Convert Rule Deal Market Years to Call
Date Date Issuer Ticker Type 144a Value Cap Coupon Premium Rank Maturity Provision Healthcare Sector
9/20/16 1/18/17 EnteroMedics Inc ETRM Preferred N $13.0 $52.0 NA (40.340%) NA 5.0 NA Healthcare-Biomed/Genetics
Mean $13.0 $52.0 NA (40.340%)
Median $13.0 $52.0 NA (40.340%)
Medical Products Convertible Offerings
12
Source: Dealogic
Equity Capital Markets: Year-to-Date Medical Products Pricings
Medical Products IPO Backlog
Filing Expected Expected
Date Date Issuer Ticker Value Sector Issuer Description
11/21/16 TBA Endra Life Sciences Inc NDRA 10.0 Healthcare-Instruments Ultrasound technology company for the pre-clinical research market
6/30/16 TBA Bioventus Inc BIOV 150.0 Healthcare-Instruments Develops and markets orthobiologic products for musculoskeletal conditions
6/16/16 TBA OrthoPediatrics Corp KIDS 75.0 Healthcare-Instruments Designs, develops and sells orthopedic implants for children
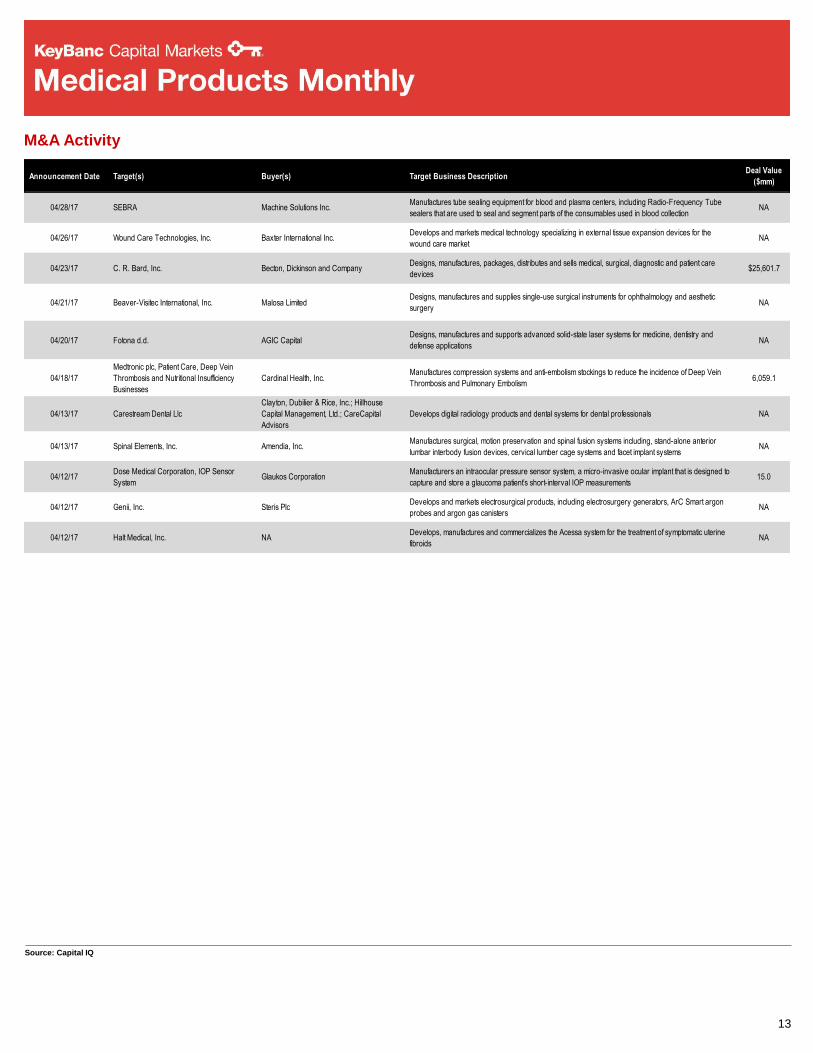
Announcement Date Target(s) Buyer(s) Target Business DescriptionDeal Value
($mm)
04/28/17 SEBRA Machine Solutions Inc.Manufactures tube sealing equipment for blood and plasma centers, including Radio-Frequency Tube
sealers that are used to seal and segment parts of the consumables used in blood collectionNA
04/26/17 Wound Care Technologies, Inc. Baxter International Inc. Develops and markets medical technology specializing in external tissue expansion devices for the
wound care marketNA
04/23/17 C. R. Bard, Inc. Becton, Dickinson and Company Designs, manufactures, packages, distributes and sells medical, surgical, diagnostic and patient care
devices $25,601.7
04/21/17 Beaver-Visitec International, Inc. Malosa LimitedDesigns, manufactures and supplies single-use surgical instruments for ophthalmology and aesthetic
surgeryNA
04/20/17 Fotona d.d. AGIC CapitalDesigns, manufactures and supports advanced solid-state laser systems for medicine, dentistry and
defense applicationsNA
04/18/17
Medtronic plc, Patient Care, Deep Vein
Thrombosis and Nutritional Insufficiency
Businesses
Cardinal Health, Inc.Manufactures compression systems and anti-embolism stockings to reduce the incidence of Deep Vein
Thrombosis and Pulmonary Embolism6,059.1
04/13/17 Carestream Dental Llc
Clayton, Dubilier & Rice, Inc.; Hillhouse
Capital Management, Ltd.; CareCapital
Advisors
Develops digital radiology products and dental systems for dental professionals NA
04/13/17 Spinal Elements, Inc. Amendia, Inc.Manufactures surgical, motion preservation and spinal fusion systems including, stand-alone anterior
lumbar interbody fusion devices, cervical lumber cage systems and facet implant systemsNA
04/12/17Dose Medical Corporation, IOP Sensor
SystemGlaukos Corporation
Manufacturers an intraocular pressure sensor system, a micro-invasive ocular implant that is designed to
capture and store a glaucoma patient’s short-interval IOP measurements15.0
04/12/17 Genii, Inc. Steris Plc Develops and markets electrosurgical products, including electrosurgery generators, ArC Smart argon
probes and argon gas canistersNA
04/12/17 Halt Medical, Inc. NADevelops, manufactures and commercializes the Acessa system for the treatment of symptomatic uterine
fibroidsNA
13
Source: Capital IQ
M&A Activity
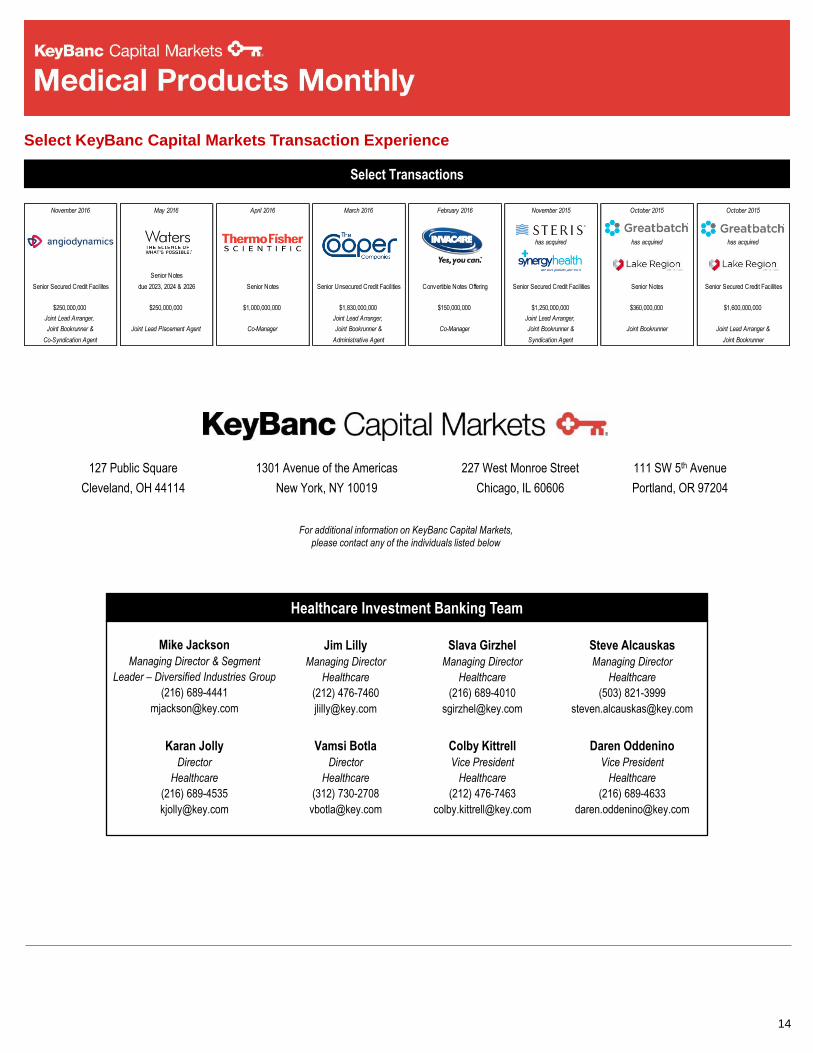
November 2016 May 2016 April 2016 March 2016 February 2016 November 2015 October 2015 October 2015
has acquired has acquired has acquired
Senior Notes
Senior Secured Credit Facilites due 2023, 2024 & 2026 Senior Notes Senior Unsecured Credit Facilities Convertible Notes Offering Senior Secured Credit Facilities Senior Notes Senior Secured Credit Facilities
$250,000,000 $250,000,000 $1,000,000,000 $1,830,000,000 $150,000,000 $1,250,000,000 $360,000,000 $1,600,000,000
Joint Lead Arranger, Joint Lead Arranger, Joint Lead Arranger,
Joint Bookrunner & Joint Lead Placement Agent Co-Manager Joint Bookrunner & Co-Manager Joint Bookrunner & Joint Bookrunner Joint Lead Arranger &
Co-Syndication Agent Administrative Agent Syndication Agent Joint Bookrunner
14
Select Transactions
Select KeyBanc Capital Markets Transaction Experience
Vamsi Botla
Director
Healthcare
(312) 730-2708
Healthcare Investment Banking Team
Karan Jolly
Director
Healthcare
(216) 689-4535
Colby Kittrell
Vice President
Healthcare
(212) 476-7463
Mike Jackson
Managing Director & Segment
Leader – Diversified Industries Group
(216) 689-4441
Jim Lilly
Managing Director
Healthcare
(212) 476-7460
Slava Girzhel
Managing Director
Healthcare
(216) 689-4010
Steve Alcauskas
Managing Director
Healthcare
(503) 821-3999
Daren Oddenino
Vice President
Healthcare
(216) 689-4633
For additional information on KeyBanc Capital Markets,
please contact any of the individuals listed below
127 Public Square
Cleveland, OH 44114
1301 Avenue of the Americas
New York, NY 10019
227 West Monroe Street
Chicago, IL 60606
111 SW 5th Avenue
Portland, OR 97204