medical data analysis in excel part...
TRANSCRIPT

Department of Computer Information Systems
King Abdullah II School for Information Technology
The University of Jordan
CIS 1902103: Computer Skills for Medical Students
By:
Dr. Raja Alomari, Tamara Almarabeh and Lama Rajab
Dept of Computer Information Systems
King Abdullah II School for Information Technology
The University Of Jordan
Medical Data Analysis in Excel Part I
1
Central Tendency MeasurementsCentral Tendency MeasurementsCentral Tendency MeasurementsCentral Tendency Measurements
Central Tendency: mean, median, and mode� The mean is the average of data values
�� Example: Example: The mean for 5 values: 4,36,45,50,75 is
�� In Excel:In Excel:= average(range of cells)
425
210
5
755045364==
++++
n
xxx
n
xmean
nn +++
==∑ ...
21
2
Department of Computer Information Systems
King Abdullah II School for Information Technology
The University of Jordan
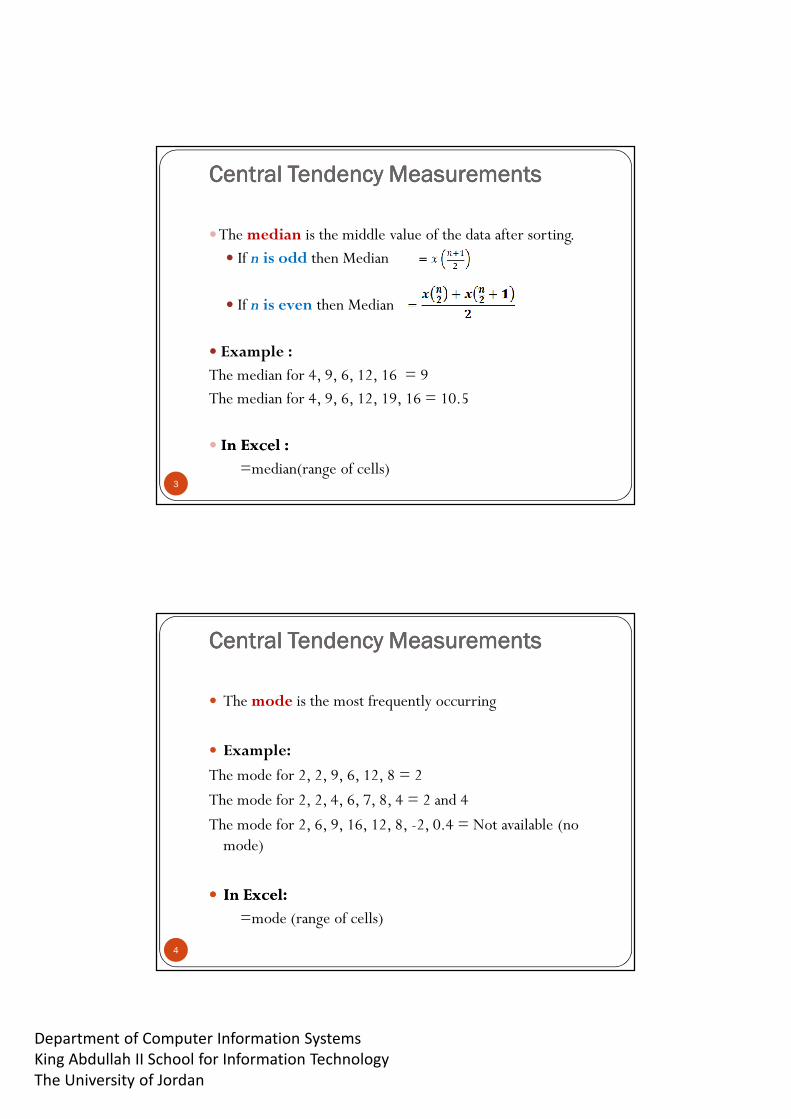
�The median is the middle value of the data after sorting.
� If n is odd then Median
� If n is even then Median
� Example :
The median for 4, 9, 6, 12, 16 = 9
The median for 4, 9, 6, 12, 19, 16 = 10.5
� In Excel :In Excel :
=median(range of cells)
Central Tendency MeasurementsCentral Tendency MeasurementsCentral Tendency MeasurementsCentral Tendency Measurements
3
� The mode is the most frequently occurring
� Example:
The mode for 2, 2, 9, 6, 12, 8 = 2
The mode for 2, 2, 4, 6, 7, 8, 4 = 2 and 4
The mode for 2, 6, 9, 16, 12, 8, -2, 0.4 = Not available (no mode)
�� In Excel: In Excel:
=mode (range of cells)
Central Tendency MeasurementsCentral Tendency MeasurementsCentral Tendency MeasurementsCentral Tendency Measurements
4

Department of Computer Information Systems
King Abdullah II School for Information Technology
The University of Jordan
Dispersion MeasurementsDispersion MeasurementsDispersion MeasurementsDispersion Measurements
Dispersion: Range, variance, and standard deviation
� Range : Max – Min
� Example:
The range for 2, 6, 8, 9, 12 = 12-2=10
�� In Excel:In Excel:
=max(range of cells) - min(range of cells)
5
�The variance is given by: variance
�� Example:
The variance for 5, 6, 2, 8, 9 = 7.5
�� In Excel:In Excel:
=var(range of cells)
x 2 5 6 8 9 Total sum
-4 -1 0 2 3 0 = sum of residuals
16 1 0 4 9 305.7
4
30=
Dispersion MeasurementsDispersion MeasurementsDispersion MeasurementsDispersion Measurements
6
Department of Computer Information Systems
King Abdullah II School for Information Technology
The University of Jordan
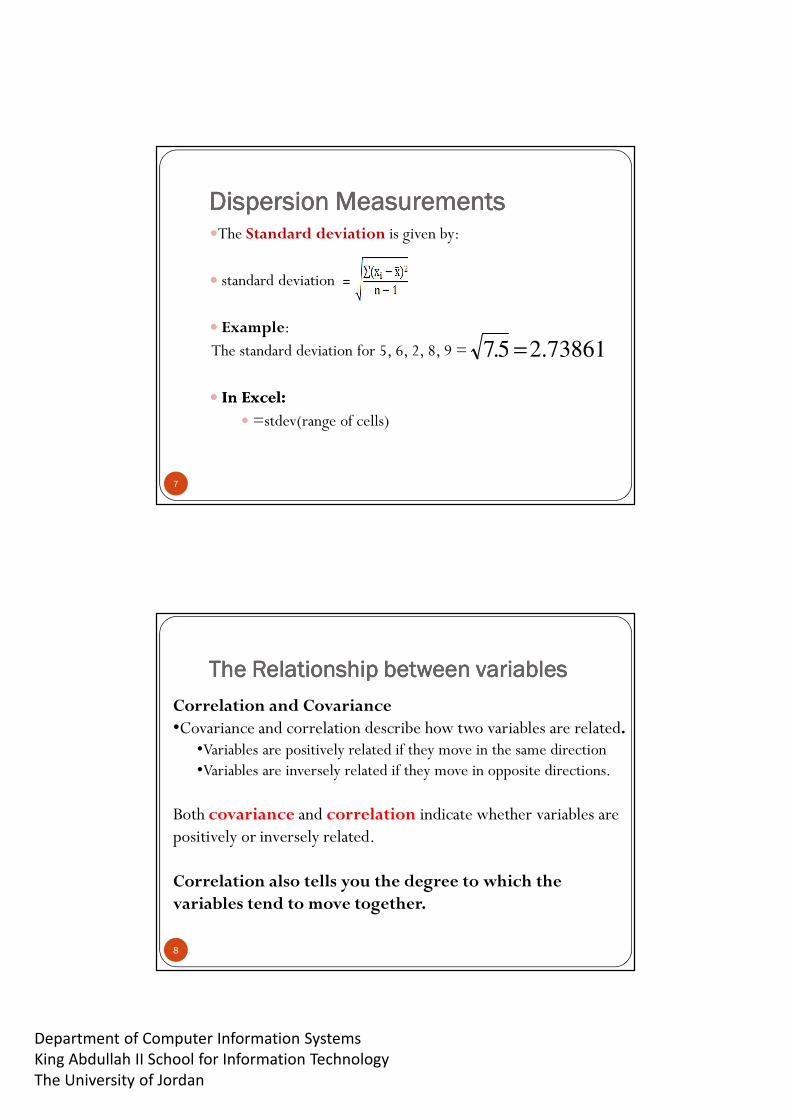
�The Standard deviation is given by:
�� standard deviation
�� Example:
The standard deviation for 5, 6, 2, 8, 9 =
�� In Excel:In Excel:
� =stdev(range of cells)
2.7386135.7 =
Dispersion MeasurementsDispersion MeasurementsDispersion MeasurementsDispersion Measurements
7
The Relationship between variablesThe Relationship between variablesThe Relationship between variablesThe Relationship between variables
Correlation and Covariance •Covariance and correlation describe how two variables are related.
•Variables are positively related if they move in the same direction•Variables are inversely related if they move in opposite directions.
Both covariance and correlation indicate whether variables are positively or inversely related.
Correlation also tells you the degree to which the variables tend to move together.
8

Department of Computer Information Systems
King Abdullah II School for Information Technology
The University of Jordan
CovarianceCovarianceCovarianceCovariance
� Covariance determines:�How two variables are related.
�Whether variables are positively or inversely related.A positive covariance means the variables are positively related, while a negative covariance means the variables are inversely related.
� For example: The covariance between market returns and economic growth is 1.53. Since the covariance is positive, the variables are positively related—they move together in the same direction
9
CorrelationCorrelationCorrelationCorrelation� Correlation determines:
�How two variables are related.
�Whether variables are positively or inversely related.
�The degree to which the variables tend to move together.
� Correlation standardizes the measure of interdependence between two variables and, consequently, tells you how closely the two variables move.
10
Department of Computer Information Systems
King Abdullah II School for Information Technology
The University of Jordan
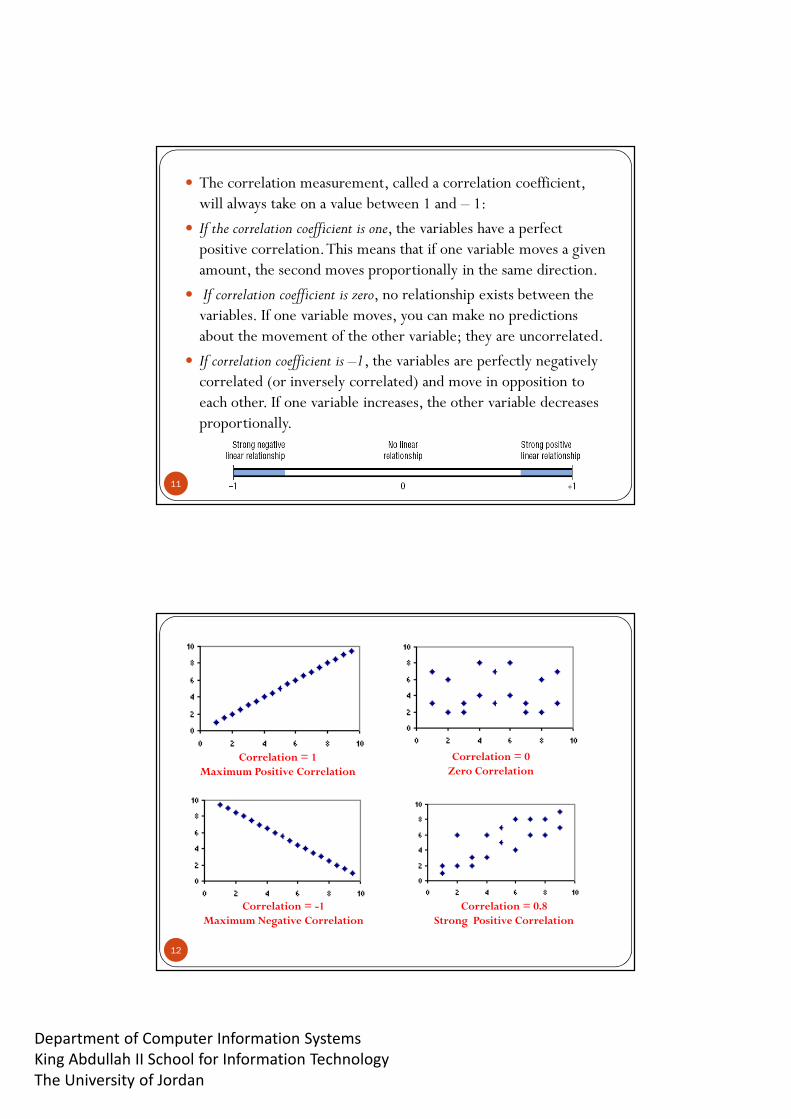
� The correlation measurement, called a correlation coefficient, will always take on a value between 1 and – 1:
� If the correlation coefficient is one, the variables have a perfect positive correlation. This means that if one variable moves a given amount, the second moves proportionally in the same direction.
� If correlation coefficient is zero, no relationship exists between the variables. If one variable moves, you can make no predictions about the movement of the other variable; they are uncorrelated.
� If correlation coefficient is –1, the variables are perfectly negatively correlated (or inversely correlated) and move in opposition to each other. If one variable increases, the other variable decreases proportionally.
11
Correlation = -1Maximum Negative Correlation
Correlation = 1Maximum Positive Correlation
Correlation = 0.8Strong Positive Correlation
Correlation = 0Zero Correlation
12

Department of Computer Information Systems
King Abdullah II School for Information Technology
The University of Jordan
For example:
� The correlation between market returns and economic growth is 0.66.
A correlation coefficient of .66 tells you two important things:
� Because the correlation coefficient is a positive number, market returns and economic growth are positively related.
� Because .66 is relatively far from indicating no correlation, the strength of the correlation be is strong.
13
�To find the correlation , you can use the Correl function
=Correl (range of x-variable, range of y-variable)
�To find the covariance , you can use the Covar function
=Covar(range of x-variable, range of y-variable)
Correlation and Covariance in Excel
14

Department of Computer Information Systems
King Abdullah II School for Information Technology
The University of Jordan
Test MeasurementsTest MeasurementsTest MeasurementsTest Measurements
15
True Positive (TP)
� Number of cases where the patient tests positive on a disease when he/she actually has the disease.
i.e.,� Patient has the disease. � The test gives positive result for the disease (test says patients have the disease).
Example : If the patient “has an allergy “ and the test is positive ����True positive.
16

Department of Computer Information Systems
King Abdullah II School for Information Technology
The University of Jordan
False Positive (FP)
� Number of cases where the patient tests positive on a disease when he/she actually does not have the disease.
i.e.,� Patient does not have the disease. � The test gives positive result for the disease (test says patients have the disease).
Example : If the patient “doesn’t have an allergy “ and the test says “yes”.
17
True Negative (TN)
� Number of cases where the patient tests negative on a disease when he/she actually does not have the disease.
i.e.,� Patient does not have the disease. � The test gives negative result for the disease (test says patients does not have the disease).
Example : If the patient “doesn’t have an allergy “ and the test says “No”.
18

Department of Computer Information Systems
King Abdullah II School for Information Technology
The University of Jordan
False Negative (FN)
� Number of cases where the patient tests negative on a disease when he/she actually has the disease.
i.e.,� Patient has the disease. � The test gives negative result for the disease (test says patients does not have the disease).
Example : If the patient “has an allergy “ and the test says “No”.
19
Medical Screening V.S. Testing
� Relatively cheap diagnostic tools for large population to detect abnormalities.
� If positive, leads to more testing.� False positives are acceptable. False
negatives are not.Types :-- Universal screening involves screening
of all individuals in a certain category (for example, all children of a certain age).
-- Case finding involves screening a smaller group of people based on the presence of risk factors (for example, because a family member has been diagnosed with a hereditary disease).
� Relatively more expensive diagnostic tools.
� Testing tend to prove the elimination of both FP and FN.
� A False Negatives are dangerous at the testing stage.
� False Positives are dangerous if this test of the final stage of testing to determine treatment.
Medical Screening Medical Testing
20

Department of Computer Information Systems
King Abdullah II School for Information Technology
The University of Jordan
Medical Screening: ExampleExample :
Mammography: is utilizing a low-energy X-ray radiographs for Breast cancer screening.
The ideal Mammography test should:
1. Cheap
2. Zero False Negatives
3. Relatively small False positives.
21
Ground Truth & Gold Standard
“Ground truth:” The objective data of a test.e.g., patient x has liver cancer.In practice, the Ground truth is hard to get inmedical domain due to the inter-observervariability.
22
Department of Computer Information Systems
King Abdullah II School for Information Technology
The University of Jordan
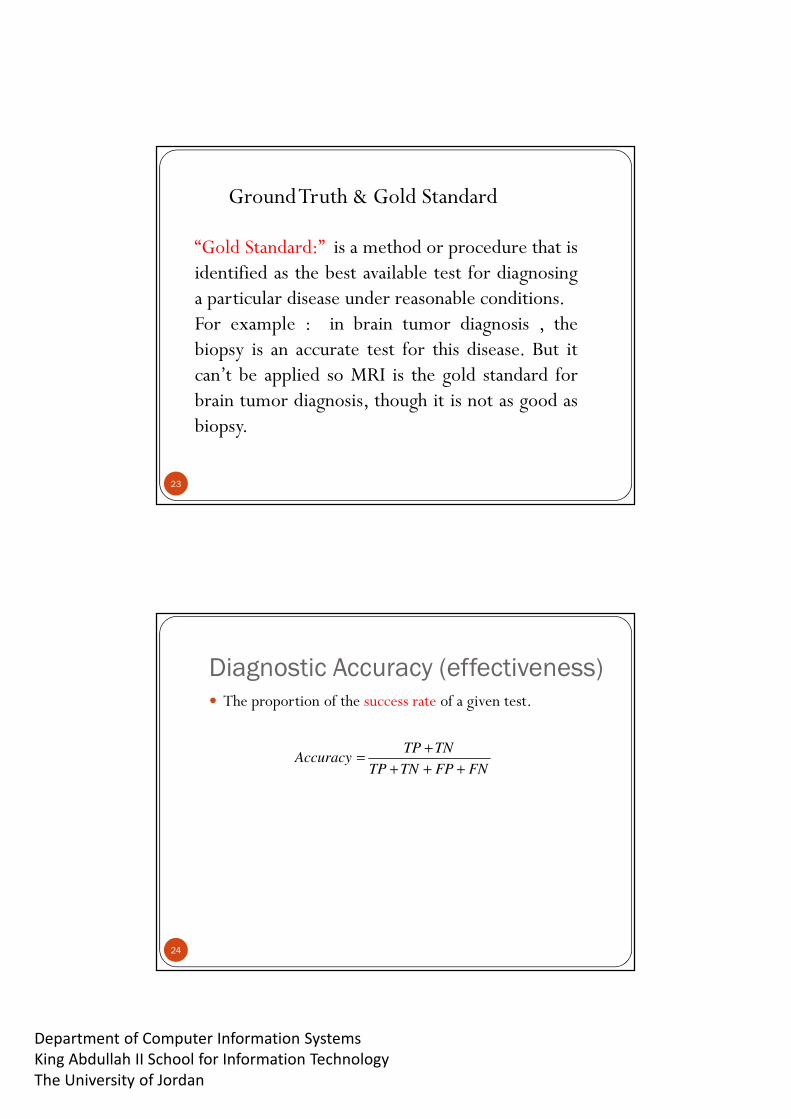
Ground Truth & Gold Standard
“Gold Standard:” is a method or procedure that isidentified as the best available test for diagnosinga particular disease under reasonable conditions.For example : in brain tumor diagnosis , thebiopsy is an accurate test for this disease. But itcan’t be applied so MRI is the gold standard forbrain tumor diagnosis, though it is not as good asbiopsy.
23
Diagnostic Accuracy (effectiveness)� The proportion of the success rate of a given test.
FNFPTNTP
TNTPAccuracy
+++
+=
24
Department of Computer Information Systems
King Abdullah II School for Information Technology
The University of Jordan
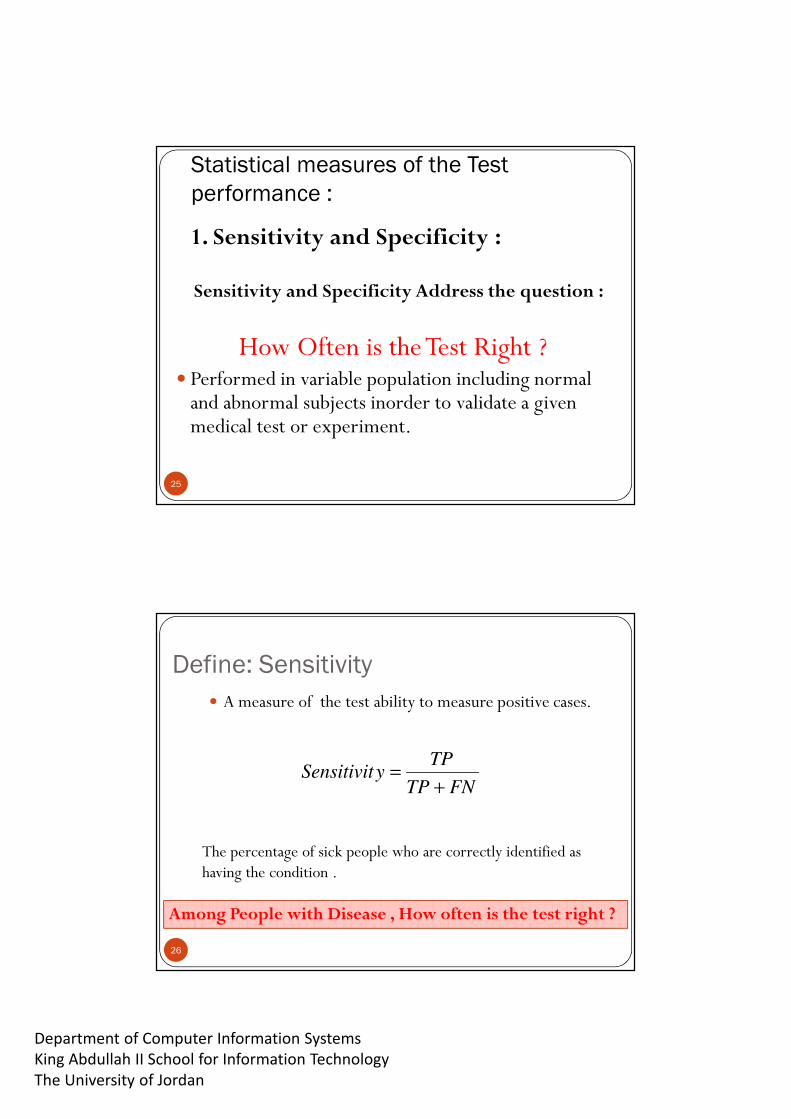
Statistical measures of the Test
performance :
1. Sensitivity and Specificity :
Sensitivity and Specificity Address the question :
How Often is the Test Right ? � Performed in variable population including normal and abnormal subjects inorder to validate a given medical test or experiment.
25
Define: Sensitivity
� A measure of the test ability to measure positive cases.
FNTP
TPySensitivit
+
=
The percentage of sick people who are correctly identified as having the condition .
Among People with Disease , How often is the test right ? Among People with Disease , How often is the test right ?
26
Department of Computer Information Systems
King Abdullah II School for Information Technology
The University of Jordan
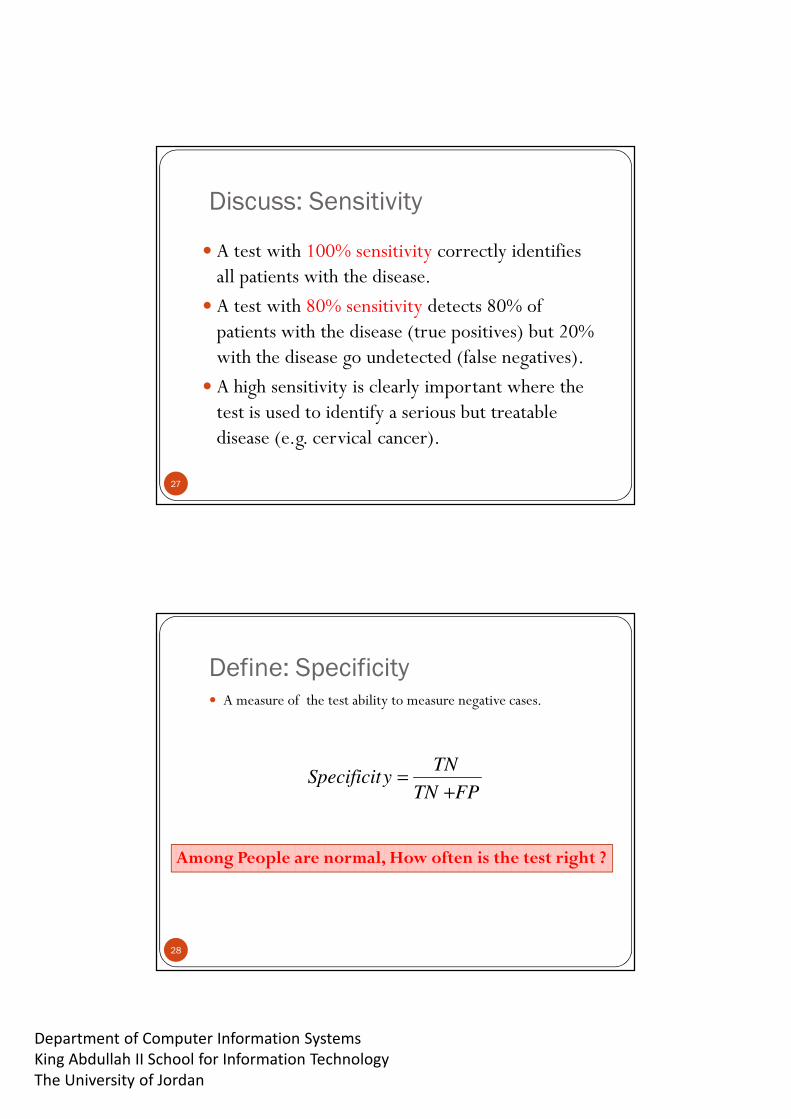
Discuss: Sensitivity
� A test with 100% sensitivity correctly identifies all patients with the disease.
� A test with 80% sensitivity detects 80% of patients with the disease (true positives) but 20% with the disease go undetected (false negatives).
� A high sensitivity is clearly important where the test is used to identify a serious but treatable disease (e.g. cervical cancer).
27
Define: Specificity� A measure of the test ability to measure negative cases.
FPTN
TNySpecificit
+
=
Among People are normal, How often is the test right ? Among People are normal, How often is the test right ?
28

Department of Computer Information Systems
King Abdullah II School for Information Technology
The University of Jordan
Discuss: Specificity
� A test with 100% specificity correctly identifies all normal patients.
�A test with 80% specificity correctly reports 80% of normal patients as test negative (true negatives) but 20% normal patients are incorrectly identified as abnormal (false positives).
29
Example 1 : Sensitivity
TP = 80 FP= 5
FN = 20 TN = 95
Influenza No Influenza
Positive
Negative
Sensitivity = 80 / (80 + 20 ) = 0.80 (or 80%)
Test
Gold Standard
30

Department of Computer Information Systems
King Abdullah II School for Information Technology
The University of Jordan
Example 1 : Specificity
TP = 80 FP= 5
FN = 20 TN = 95
Influenza No Influenza
Positive
Negative
Specificity = 95/ (95 + 5 ) = 0.95 (or 95%)
Test
Gold Standard
31
Positive Predictive Value (PPV)
� The proportion of positive test results that are true positives.
� Also known as Precision Rate
� PPV of a test answers the question:
“How likely is it that this patient has the disease given that the test result is positive?”
FPTP
TPPPV
+
=
32

Department of Computer Information Systems
King Abdullah II School for Information Technology
The University of Jordan
Negative Predictive Value (NPV)
� The proportion of negative test results that are true negatives.
� NPV of a test answers the question:
‘How likely is it that this patient is normal (does not have the disease) given that the test result is
negative?’
FNTN
TNNPV
+
=
33
Discuss: PPV v.s. NPV� PPV:
� High value for a test indicates that when a test gives a positive outcome, it is more likely correct.
� Low value for a test indicates that when a test gives a positive outcome, it is less likely correct.
� NPVHigh value for a test indicates that when a test gives a negative outcome, it is more likely correct.
Low value for a test indicates that when a test gives a negative outcome, it is less likely correct.
34

Department of Computer Information Systems
King Abdullah II School for Information Technology
The University of Jordan
Summary: Test Measurements
35
Example 2 : Sensitivity & Specificity
90 200
10 800
Disease No Disease
Positive Test
Negative Test
2 x 2 table for Diagnostic Test Performance
What is the value of Sensitivity ?
What is the value of Specificity ? 36

Department of Computer Information Systems
King Abdullah II School for Information Technology
The University of Jordan
Example 2 : Sensitivity & Specificity
True Positive
True Negative
Disease No Disease
Positive Test
Negative Test
2 x 2 table for Diagnostic Test Performance
Correctly Classified Diagonal 37
Example 2 : Sensitivity & Specificity
True Positive False Positive
False Negative True Negative
Disease No Disease
Positive Test
Negative Test
2 x 2 table for Diagnostic Test Performance
Incorrectly classified Diagonal
38

Department of Computer Information Systems
King Abdullah II School for Information Technology
The University of Jordan
Example 2 : Sensitivity & Specificity
90 200
10 800
Disease No Disease
Positive Test
Negative Test
2 x 2 table for Diagnostic Test Performance
Specificity = 800/ (200 + 800 ) = 80%
Sensitivity = 90/ (90 + 10 ) = 90%
39
Example 2 : Sensitivity & Specificity
90 200
10 800
Disease No Disease
Positive Test
Negative Test
NPV = 800/ (10 + 800 ) = 0.987
PPV = 90/ (290) = 0.31
40

Department of Computer Information Systems
King Abdullah II School for Information Technology
The University of Jordan
Definition: Inter-rater reliability
� Also Known as inter-rater agreement, concordance, inter-observer agreement (-reliability).
� A Measure of the degree of agreement (homogeneity) between judges (raters, observers) for rating a given task.
� E.g., Diagnosis of a disease may vary among several clinicians.
41
Measures: Inter-rater reliability
� Joint-probability of agreement
� Kappa statistics:�Cohen's kappa
�Fleiss' kappa
�Correlation coefficients
� Intra-class correlation coefficient
�Limits of agreement
42

Department of Computer Information Systems
King Abdullah II School for Information Technology
The University of Jordan
Kappa Statistics
� Kappa is a statistical measure of agreement in ratings between two raters.
� For example, if two doctors evaluate a patient as either "sick" or "healthy" then kappa measures the extent of their agreement.
43
Cohen’s Kappa
� It is a measurements to formulate agreement between the coders.
)Pr(1
)Pr()Pr(
e
eak
−
−=
Pr(a) : Observed agreement among coders .
Pr(a)=
Pr(e) : is the probability of random agreement.
Pr(e)=Pr(yes coder1) * pr( yes coder 2) + pr(no coder1)* pr(no coder 2).
FNFPTNTP
TNTP
+++
+ )(
44

Department of Computer Information Systems
King Abdullah II School for Information Technology
The University of Jordan
Kappa Statistics Interpretation
Chance
Agreement
Poor Slight Fair Moderate Substantial Almost Perfect
< 0.0 0.0 .20 .40 .60 .80 1.0
Kappa Scale
45
Cohen’s Kappa (Example)
20 5
10 15
Coder 2
Coder 1
Pr(a) = (20+15)/50 = 0.70 Pr(e) [Probability of Random Agreement]: Coder 1 : said “YES” to 25 and “No” to 25 . Thus coder 1 says “YES” 50% of the time.Coder 2 : said “ YES” to 30 and “No” to 20 . Thus coder 2 said “yes” 60% of the time.
Yes No
Yes
No
46

Department of Computer Information Systems
King Abdullah II School for Information Technology
The University of Jordan
Cohen’s Kappa (Example)
20 5
10 15
Coder 2
Coder 1
Pr(a) = (20+15)/50 = 0.70 Pr(e) = 0.5 * 0.6 + 0.5 *0.4 = 0.3 + 0.2 = 0.5 Kappa= (0.7 – 0.5 )/ (1-0.5) = 0.4 (Cohen’s Kappa)
47