medical assistance for children with disabilities 2009...
TRANSCRIPT

MEDICAL ASSISTANCE
FOR CHILDREN WITH DISABILITIES
2009 REPORT
Commonwealth of Pennsylvania Department of Public Welfare
Gary D. Alexander Secretary of Public Welfare
March 2012

TABLE OF CONTENTS
INTRODUCTION
Background ......................................................................................................... 1 Methodology ........................................................................................................ 1 Limitations ........................................................................................................... 2 Description of Report Format ............................................................................... 3 Key Facts on Medical Assistance for Children with Disabilities, 2009 .................. 5
ANALYSIS OF CHILDREN WITH DISABILITIES ON MEDICAL ASSISTANCE
Part I. Demographic Profile
County of Residence ............................................................................... 6 Age Group ............................................................................................. 9 Household Income, Third Party Liability (TPL) Insurance, Family Size
and Length of Residency in Pennsylvania .................................... 9 Health Service Delivery System ............................................................ 12 Diagnoses ............................................................................................. 13
Part II: MA Expenditures and Fee-for-Service (FFS) Profile
Total MA Expenditure ........................................................................... 19 Average Cost per Member per Month ................................................... 20 FFS Expenditures by Service Category ................................................ 21 FFS Expenditures by Age Group .......................................................... 23 FFS Expenditures by Service Category by Age Group .......................... 23 Managed Care Capitation Payments ..................................................... 27 MA Expenditures on FFS and Capitation Payments by Income Group ........................................................................ 28 FFS Drug Utilization ............................................................................. 29
Part III: Managed Care Service Profile
Managed Care Expenditures by Service Category ................................ 35 Managed Care Expenditures by Age Group .......................................... 37 Managed Care Expenditures by Service Category by Age Group ......... 38 Managed Care Drug Utilization ............................................................ 42
I. Top 10 Diagnoses of Medical Assistance Enrolled Children with Disabilities
based on Disability Diagnosis ................................................................... 47 II. Top 25 Diagnoses of Medical Assistance Enrolled Children with Disabilities
based on ICD-9 Diagnosis Subcategory (4 Digits), 2009 .......................... 50 III. Average Cost per Member per Month Calculations ......................................... 51 IV. Definitions of Service Categories and Capitation Payments ............................ 52 V. Examples of Drugs by Drug Type (GC3) ......................................................... 55 VI. Acronyms ........................................................................................................ 57
ACKNOWLEDGEMENTS

- 1 -
INTRODUCTION This report provides certain committees of the Pennsylvania Senate, House of Representatives, and other interested members of the general public with the information requested in Act 1A of 2005 regarding children with disabilities enrolled in the Medical Assistance (MA) Programs. These are disabled children enrolled in the eligibility group with category and program status code PH-95. The parental income for children in this eligibility category was not considered in determining their MA eligibility. Following the similar formatting of previously released reports, this report analyzes the demographic information of certain MA children with disabilities, their services utilization, and the cost of services provided under both the Fee-for-Service (FFS), including ACCESS Plus, and MA managed care delivery systems during calendar year 2009. Background Act 1A of 2005, the Appropriations Act of 2005, requires the Department of Public Welfare (the Department) to submit an annual report to the Legislature on certain children with disabilities enrolled in the MA Programs as follows: “The Department shall submit to the Public Health and Welfare Committee of the Senate and the Health and Human Services Committee of the House of Representatives an annual report including, but not limited to, the following data: family size, household income, county of residence, length of residence in Pennsylvania, third-party insurance information, diagnosis and the type and cost of services paid for by the medical assistance programs on behalf of each eligible and enrolled child that has an SSI (Supplemental Security Income) level of disability and where parental income is not currently considered in the eligibility determination process.” This is the seventh report released by the Department since 2005 on certain MA children with disabilities in response to the legislative mandates. Methodology The data for the analysis was collected from two offices within the Department. The Office of Income Maintenance (OIM) provided information on eligible children’s household income, family size, length of residency in Pennsylvania, and the disability diagnoses information. This information is collected at County Assistance Offices (CAOs), where caseworkers determine eligibility for MA. Eligible children with SSI-level of disability whose parents’ income is not considered in the eligibility determination process are enrolled in eligibility category PH-95. The information documenting the disability of most children assigned to this category is sent to a contracted Medical Review Team (MRT), which certifies the child’s disability using the Social Security Administration’s (SSA) rules and regulations. The MRT, then, reports the results of their determination to the CAOs. Children receiving SSI at the time of MA application

- 2 -
are not referred to the MRT because it is assumed that the SSA has already verified their disability. After Act 7A of 2002 of the State Fiscal Year 2002-2003 budget was passed, the Department was granted authority to require that all families submit information about their household income, family size and length of residency in Pennsylvania. CAOs began collecting this information after January 1, 2003 for new applications received and also began collecting income information from families who reached their annual re-determination date. The Office of Medical Assistance Programs (OMAP) stores information about MA eligibility dates, demographic information of eligible recipients, third party insurance information, types and cost of medical services provided to the recipients and the diagnoses associated with the services in the Department’s Enterprise Data Warehouse (EDW) and/or the Fraud and Abuse Detection System (FADS), which loads the information from the Department’s claim processing system, PA PROMISe™ and the Client Information System (CIS). Physical health services are provided through two delivery systems: Fee-for-Service (FFS), including ACCESS Plus, and Managed Care (MC). Behavioral health services are provided through two delivery systems: FFS and MC. Data on eligibility dates and demographic information on children were extracted from the Eligibility File; data on types and costs of services provided in the FFS delivery system and the diagnoses associated with the services were extracted from the Paid Claims History; and the data on capitation payments made on behalf of managed care members were extracted from the Capitation History, all available in the EDW. Data on the services provided in the Managed Care delivery system and data on third party insurance availability were extracted from FADS. Limitations The records of services provided in the FFS delivery system include the latest claim records adjudicated through February 2011 for services rendered during calendar year 2009. The records of services provided in the managed care delivery system include the latest service records that were submitted and approved in PA PROMISe™ as of February 2011. Any data limitations resulting from the data collection process were noted in the document.

- 3 -
Description of Report Format The report provides information in three parts. Part I provides demographic information on the MA eligible children with disabilities. Analysis of eligibility data available through EDW provides information on any children who were in the eligibility category anytime during the year 2009, and who were younger than age 21 as of December 31, 2009. Information on Third Party Liability (TPL) was available through FADS. Analysis of information on household income, family size, and length of residency in Pennsylvania of the eligible children is based on data provided by OIM. Data provided by OIM was based on any children with disabilities in eligibility category PH-95 for whom the data was available. The numbers of children for whom the analysis is based are noted within each table and figure. Analysis of diagnosis has been conducted based on the disability diagnosis provided by OIM in the previous reports; however, such diagnosis data were limited to those children who were referred to MRT for disability determination. For that reason, diagnosis analysis in Part I is based on the diagnoses reported in the MA paid service records for this report (by the first three digits of the ICD-9 diagnosis codes). The diagnosis information for Part I analysis may not directly reflect the primary diagnosis of these children. The analysis based on disability diagnosis reported by MRT is presented in Appendix I. In addition, the Top 25 diagnoses based on the first four digits of ICD-9 diagnosis codes provided in the paid service records, which identifies more specific health conditions, are presented in Appendix II. The analysis of demographic information of eligible children was based on county of residence, age group, household income group, length of residency in Pennsylvania, as well as health service delivery system (FFS vs. Managed Care). The age group analysis was conducted in the following four age groups:
• Between 0 and 5 • Between 6 and 12 • Between 13 and 17 • Between 18 and 20

- 4 -
The analysis by household income group was conducted for the following ten groups based on annual household income and TPL availability:
• Income less than $50,000 with TPL • Income between $50,000 and $75,000 with TPL • Income over $75,000 but less than $100,000 with TPL • Income between $100,000 and $200,000 with TPL • Income greater than $200,000 with TPL • Income less than $50,000 without TPL • Income between $50,000 and $75,000 without TPL • Income over $75,000 but less than $100,000 without TPL • Income between $100,000 and $200,000 without TPL • Income greater than $200,000 without TPL
Part II provides information on MA expenditures for the children identified under Part I. MA expenditures consist of payments made to MA enrolled providers for services rendered to children with disabilities in the Fee-for-Service (FFS) delivery system, including Access Plus, capitation payments made for disease management services for FFS children enrolled under ACCESS Plus, and capitation payments made to MA Managed Care Organizations (MCOs) for services provided to managed care members identified under Part I. The average cost per member per month for the entire program and by delivery system was calculated as presented in Appendix III. To analyze the information on types and cost of services rendered under the FFS delivery system, services were grouped into the following fourteen service categories:
• Home and Community-Based Waiver Services • Hospice Services • Inpatient Behavioral Health Services • Inpatient Physical Health Services • Institutional Care Services • Outpatient Behavioral Health Facility Services • Outpatient Behavioral Health Services • Outpatient Physical Health Facility Services • Outpatient Physical Health Services • Pharmacy Services • Private Duty Nursing Services • Residential Treatment Facility Services • School-Based Services • Skilled Nursing Facility Services
The definitions for these service categories are provided in Appendix IV.

- 5 -
Part III provides information on services rendered by MCOs to the children identified under Part I. The MCO service analysis was provided for the same service categories utilized under the FFS service analysis, with exception of Home and Community-Based Waiver and School-Based Services, which are only paid under the FFS delivery system. Key Facts on Medical Assistance for Children with Disabilities, 2009
• Total Number of Children with Disabilities 52,945 • Managed Care (MC) Enrollment* Physical Health 37,597 Behavioral Health 49,953 Physical and Behavioral Health 37,574 • Fee-for-Service Enrollment** Physical Health 15,348 Behavioral Health 2,992 • Total DPW Expenditure*** $612,737,256.62
Federal Share $391,162,358.68 State Share $221,574,897.94
• Total Amount Paid by Managed Care **** $304,179,002.97 * The numbers include the distinct count of children with at least one managed care capitation
payment as PH-95 eligible. Some children who were enrolled in a Physical Health managed care were not enrolled in a Behavioral Health managed care, due to eligibility changes that occurred during the enrollment period.
** The numbers include the distinct count of children with no managed care capitation payment throughout the year.
*** The DPW Expenditure includes the payments made through February 2011 for the services provided during CY 2009 under the FFS delivery system, the capitation payments made for the recipients enrolled in ACCESS Plus, and the capitation payments made to the managed care organizations for the recipients enrolled in managed care.
**** The Department did not pay this amount. This was the total amount that MCOs paid to their providers, based on the approved MCOs’ service records according to the PROMISe edits.
- 6 -
ANALYSIS OF CHILDREN WITH DISABILITIES ON MEDICAL ASSISTANCE
PART I: Demographic Profile
County of Residence
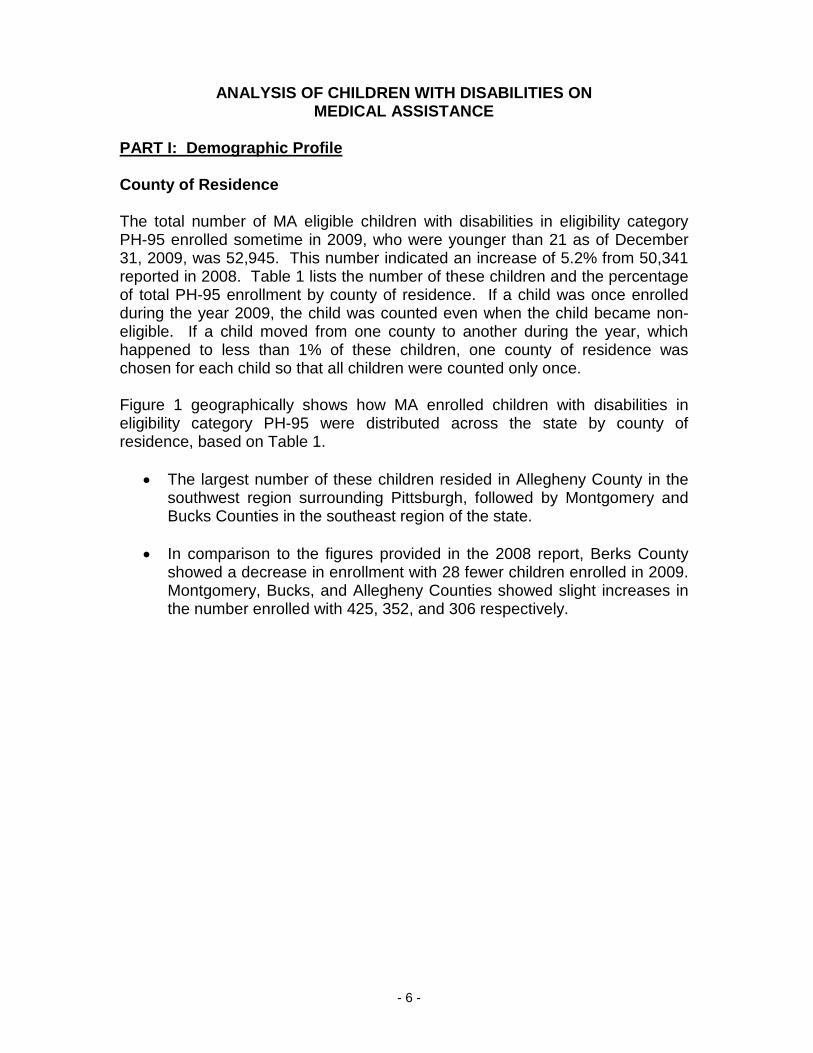
The total number of MA eligible children with disabilities in eligibility category PH-95 enrolled sometime in 2009, who were younger than 21 as of December 31, 2009, was 52,945. This number indicated an increase of 5.2% from 50,341 reported in 2008. Table 1 lists the number of these children and the percentage of total PH-95 enrollment by county of residence. If a child was once enrolled during the year 2009, the child was counted even when the child became non-eligible. If a child moved from one county to another during the year, which happened to less than 1% of these children, one county of residence was chosen for each child so that all children were counted only once.
Figure 1 geographically shows how MA enrolled children with disabilities in eligibility category PH-95 were distributed across the state by county of residence, based on Table 1.
• The largest number of these children resided in Allegheny County in the southwest region surrounding Pittsburgh, followed by Montgomery and Bucks Counties in the southeast region of the state.
• In comparison to the figures provided in the 2008 report, Berks County showed a decrease in enrollment with 28 fewer children enrolled in 2009. Montgomery, Bucks, and Allegheny Counties showed slight increases in the number enrolled with 425, 352, and 306 respectively.

- 7 -
Demographic Profile (Continued) Table 1: Number of MA Enrolled Children with Disabilities in Eligibility Category PH-95 and Percent of Total MA Enrolled Children with Disabilities by County of
Residence, 2009 County Enrolled Percent of Total
Adams 527 1.00% Allegheny 5018 9.48% Armstrong 342 0.65% Beaver 671 1.27% Bedford 183 0.35% Berks 1687 3.19% Blair 677 1.28% Bradford 204 0.39% Bucks 3700 6.99% Butler 1095 2.07% Cambria 418 0.79% Cameron 43 0.08% Carbon 257 0.49% Centre 536 1.01% Chester 2758 5.21% Clarion 190 0.36% Clearfield 467 0.88% Clinton 156 0.29% Columbia 273 0.52% Crawford 410 0.77% Cumberland 1048 1.98% Dauphin 954 1.80% Delaware 2573 4.86% Elk 389 0.73% Erie 1184 2.24% Fayette 271 0.51% Forest 20 0.04% Franklin 466 0.88% Fulton 62 0.12% Greene 82 0.15% Huntingdon 236 0.45% Indiana 298 0.56% Jefferson 260 0.49% Juniata 87 0.16% Lackawanna 925 1.75% Lancaster 2807 5.30% Lawrence 342 0.65% Lebanon 688 1.30% Lehigh 1599 3.02% Luzerne 1217 2.30% Lycoming 398 0.75% McKean 229 0.43% Mercer 658 1.24% Mifflin 204 0.39% Monroe 810 1.53% Montgomery 4216 7.96% Montour 111 0.21% Northampton 1307 2.47% Northumberland 301 0.57% Perry 238 0.45% Philadelphia 1782 3.37% Pike 371 0.70% Potter 66 0.12% Schuylkill 510 0.96% Snyder 176 0.33% Somerset 207 0.39% Sullivan 18 0.03% Susquehanna 144 0.27% Tioga 84 0.16% Union 197 0.37% Venango 165 0.31% Warren 214 0.40% Washington 1073 2.03% Wayne 243 0.46% Westmoreland 1522 2.87% Wyoming 119 0.22% York 2462 4.65% Total 52,945 100.00% Source: DPW Enterprise Data Warehouse

- 8 -
Demographic Profile (Continued)
Figure 1: Distribution of MA Enrolled Children with Disabilities in Pennsylvania by County of Residence, 2009
Source: DPW Enterprise Data Warehouse
3000 or more
PIKE
Less than 500 500 - 999 1500 - 1999 1000 - 1499 2500 - 2999 2000 - 2499
ERIE
CRAWFORD
MERCER
WARREN MCKEAN POTTER TIOGA BRADFORD
VENANGO FOREST
SUSQUEHANNA
ELK CAMERON
CLARION JEFFERSON
LAWRENCE
BUTLER ARMSTRONG
INDIANA
CLEARFIELD
BEAVER
WASHINGTON
GREENE FAYETTE
WESTMORELAND
SOMERSET
CAMBRIA
CLINTON
CENTRE
BLAIR
LYCOMING SULLIVAN
WAYNE
WYOMING LACKAWANNA
UNION
LUZERNE
MONROE COLUMBIA
MONTOUR
HUNTINGDON
BEDFORD
FULTON
FRANKLIN
MIFFLIN
JUNIATA
PERRY
CUMBERLAND
ADAMS YORK
SNYDER NORTHUMBERLAND
DAUPHIN
LANCASTER
CARBON
LEBANON
BERKS
LEHIGH
BUCKS
CHESTER DELAWARE
ALLEGHENY
MONTGOMERY
SCHUYLKILL
PIKE
NORTHAMPTON
PHILADELPHIA

- 9 -
Demographic Profile (Continued) Age Group
• As presented in Figure 2, approximately 43% of the MA children with disabilities in eligibility category PH-95 enrolled in 2009 were in the age group between 6 and 12 and about 32% were in the age group between 13 and 17.
Figure 2: Number and Percent of MA Enrolled Children with Disabilities in Eligibility Category PH-95
by Age Group, 2009*
0 to 59,50818.0%
6 to 1222,96343.4%
13 to 1716,99432.1%
18 to 203,4806.6%
* Age was determined as of December 31, 2009.
Percentages may not equal 100% due to rounding.
Source: DPW Enterprise Data Warehouse Household Income, Third Party Liability (TPL) Insurance, Family Size and Length of Residency in Pennsylvania Information on household income, family size and length of residency in Pennsylvania for MA children with disabilities in eligibility category PH-95 was provided by OIM for 38,725 children. Information on Third Party Liability (TPL) insurance was extracted from FADS within OMAP. This analysis was based on the information available for these 38,725 children. The information for the remaining 14,220 children was not available for analysis.
- 10 -
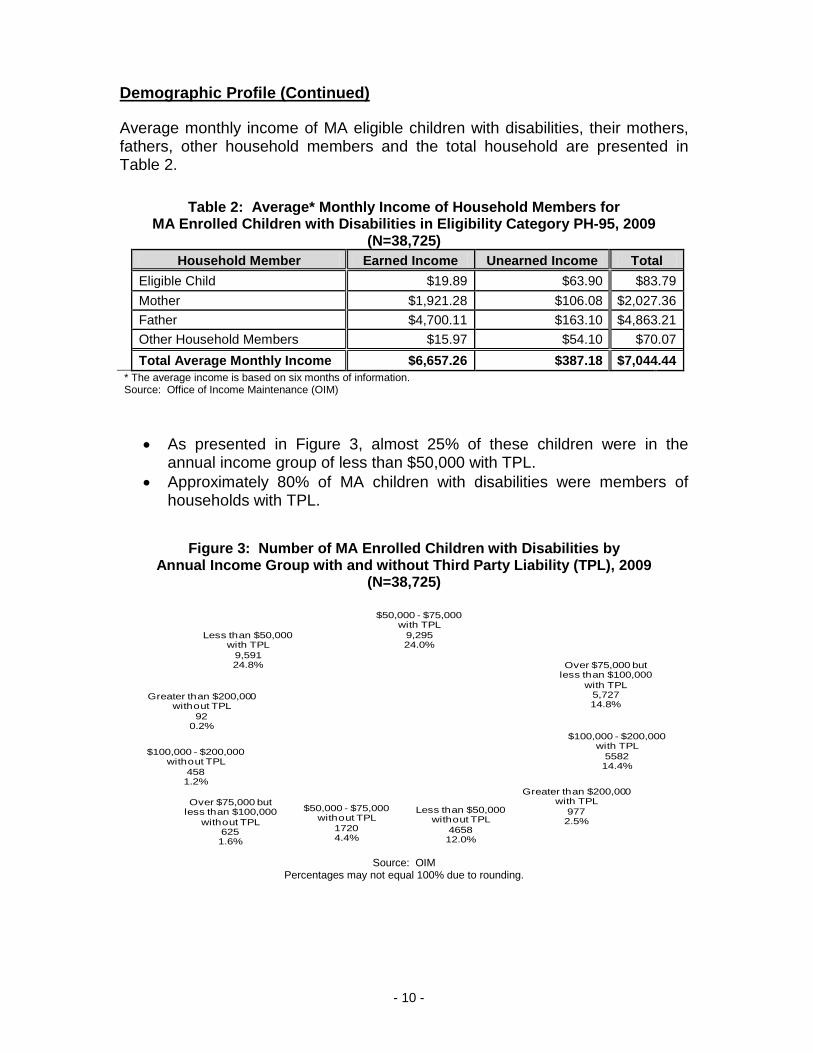
Demographic Profile (Continued) Average monthly income of MA eligible children with disabilities, their mothers, fathers, other household members and the total household are presented in Table 2.
Table 2: Average* Monthly Income of Household Members for
MA Enrolled Children with Disabilities in Eligibility Category PH-95, 2009 (N=38,725)
Household Member Earned Income Unearned Income Total Eligible Child $19.89 $63.90 $83.79 Mother $1,921.28 $106.08 $2,027.36 Father $4,700.11 $163.10 $4,863.21 Other Household Members $15.97 $54.10 $70.07 Total Average Monthly Income $6,657.26 $387.18 $7,044.44
* The average income is based on six months of information. Source: Office of Income Maintenance (OIM)
• As presented in Figure 3, almost 25% of these children were in the annual income group of less than $50,000 with TPL.
• Approximately 80% of MA children with disabilities were members of households with TPL.
Figure 3: Number of MA Enrolled Children with Disabilities by Annual Income Group with and without Third Party Liability (TPL), 2009
(N=38,725)
Less than $50,000 without TPL
465812.0%
$50,000 - $75,000 without TPL
17204.4%
Over $75,000 but less than $100,000
without TPL6251.6%
$100,000 - $200,000 without TPL
4581.2%
Greater than $200,000 without TPL
920.2%
Less than $50,000 with TPL
9,59124.8%
$50,000 - $75,000 with TPL
9,29524.0%
Over $75,000 but less than $100,000
with TPL5,72714.8%
$100,000 - $200,000 with TPL
558214.4%
Greater than $200,000 with TPL
9772.5%
Source: OIM Percentages may not equal 100% due to rounding.

- 11 -
Demographic Profile (Continued) Table 3 shows the number of MA children with disabilities in eligibility category PH-95, the total number of household members, and average number of household members by annual income group.
Table 3: Number and Percent of MA Enrolled Children with Disabilities and Total and Average Number of Household Members
by Annual Income Group*, 2009 (N=38,725)
Income Group
Number of Unique
Children Percent
Total Number of Household Members
Average Number of
Members per Household**
With TPL Less than $50,000 9,591 24.8% 36,326 3.8 Between $50,000 and $75,000 9,295 24.0% 38,372 4.1 Over $75,000 but less than $100,000 5,727 14.8% 24,355 4.3 Between $100,000 and $200,000 5,582 14.4% 24,144 4.3 Greater than $200,000 977 2.5% 4,282 4.4
Without TPL Less than $50,000 4,658 12.0% 16,266 3.5 Between $50,000 and $75,000 1,720 4.4% 7,121 4.1 Over $75,000 but less than $100,000 625 1.6% 2,626 4.2 Between $100,000 and $200,000 458 1.2% 2,022 4.4 Greater than $200,000 92 0.2% 375 4.1
Total 38,725 100% 155,889 4.0 * The annual income group is based on the average of six months. ** The number of children was used as number of households. It is possible that some eligible children live in the same household, so that the actual number of households might be slightly less than the actual number of children. Source: OIM
Table 4 shows the number and percent of MA children with disabilities by the length of residency in Pennsylvania.
• Over 86% of the eligible children who were re-determined to be MA eligible in 2009 lived in Pennsylvania for over five years.
Table 4: Number and Percent of MA Enrolled Children with Disabilities
by Length of Residency in Pennsylvania, 2009 (N=38,725) Length of Residency Number of
Unique Children Percent
Over 5 Years 33,452 86.4% 1 Year to 5 Years 4,630 12.0% 6 Months to under 1 Year 247 0.6% Less than 6 Months 396 1.0% Total 38,725 100.0% Source: OIM

- 12 -
Demographic Profile (Continued) Health Service Delivery System MA services are provided through two delivery systems: Fee-for-Service (FFS), including ACCESS Plus, and Managed Care (MC). When a child becomes MA eligible in a county where managed care is available, either under the HealthChoices mandatory managed care program, or under a voluntary managed care plan, physical health MCO enrollment occurs 30 – 45 days after the eligibility determination is made in order to allow children to choose their physical health MCO and primary care physician. During this period, MA covered physical health services are paid under the FFS delivery system. In addition, there are certain services which are not paid by managed care and continue to be paid under the FFS delivery system; these include:
• School Based Services, • Home and Community Based Services, and • Institutional Care Services after thirty (30) days.
In these cases, the services provided for the managed care members are paid under the FFS delivery system. For these reasons, there are occasions when children identified as MCO members receive services paid for through the FFS program. Since the statewide implementation of the HealthChoices Behavioral Health managed care program in July 2007, the Department provides behavioral health services mainly under the Managed Care delivery system for MA recipients in all 67 counties. Table 5 shows the numbers of MA eligible children with disabilities in 2009 enrolled in each delivery system for physical health and behavioral health. As children move from a managed care county to a FFS county, the delivery system in which they receive their physical health care services often changes. If children had a record of managed care capitation payments with the total amount greater than $0 for a managed care organization during the year, these children were counted in the Managed Care delivery system; if children had a record of ACCESS Plus capitation payments with the total amount greater than $0 for physical health services, these children were counted in the ACCESS Plus delivery system; and the remaining children were counted in the FFS delivery system.
Table 5: Numbers of Children with Disabilities by Health Care Delivery System Enrollment, 2009 (N=52,945)
Enrollment Managed Care ACCESS Plus FFS Physical Health 37,597 11,463 3,885 Behavioral Health 49,953 N/A 2,992
Source: DPW Enterprise Data Warehouse

- 13 -
Demographic Profile (Continued) Diagnoses When available, diagnosis analysis of children with disabilities was based on the primary and secondary diagnoses reported in the MA paid medical service records. These exclude dental and drug service records, which do not provide diagnosis information, and any other paid service records without ICD-9 diagnosis codes. The diagnosis information was available for 42,686 eligible children with disabilities in 2009. Since multiple diagnoses may be reported on service records through the year for each child, the counts for each diagnosis cannot be summed due to duplication, and each child was counted only once in each diagnosis. An analysis of disability diagnoses reported by Medical Review Team as described under Introduction is provided in Appendix I. Table 6 shows the ten most frequently reported diagnoses for children with disabilities based on the first three digits of the ICD-9 diagnosis codes, the number of unique children with the diagnosis, and examples of the most prevalent health conditions of each diagnosis. Tables 7 through 10 present the ten most frequently reported diagnoses based on the first three digits of the ICD-9 diagnosis codes for these children by age group. The diagnosis subcategories with the highest numbers of children based on the 4th digit of ICD-9 codes are provided under Appendix II.

- 14 -
Demographic Profile (Continued)
• Among the 42,686 MA children with disabilities who had diagnosis information reported in at least one paid medical service record in 2009, the largest number of children (10,272) were diagnosed with a Pervasive Developmental Disorder (ICD-9 Diagnosis Category 299). Examples of the conditions prevalent within the category are Asperger's Disorder, Atypical Childhood Psychosis, and Autistic Disorders.
• In 2009, a total of 9,632 MA children with disabilities had at least one paid
medical service record with a diagnosis of Hyperkinetic Syndrome of Childhood, which included Attention Deficit Disorder with and without Hyperactivity.
Table 6: Top 10 Diagnoses in Paid Medical Service Records of
MA Enrolled Children with Disabilities, Dates of Service 2009 (N=42,686)
Rank ICD-9 Diagnosis (3 Digits)
Number of
Unique Children* Examples of the Most Prevalent Conditions
1 Pervasive Developmental Disorders (299) 10,272 Asperger's Disorder, Atypical Childhood Psychosis,
Autistic Disorders
2 Hyperkinetic Syndrome of Childhood NEC (314) 9,632 Attention Deficit Disorder With Hyperactivity,
Attention Deficit Disorder Without Hyperactivity
3 Acute Upper Respiratory Infections of Multiple or Unspecified Sites (465) 5,470 Acute Upper Respiratory Infections
4 Acute Pharyngitis (462) 5,340 Viral Pharyngitis, Acute Sore Throat NOS
5 General Symptoms (780) 4,752 Fever and Other Disturbances of Temperature Regulation, Convulsions
6 Specific Delays in Development (315) 4,564 Unspecified Developmental Disorders, Unspecified Learning Disorders, Dyslalia, Phonological Disorders, Developmental Aphagia
7 Suppurative & Unspecified Otitis Media Disorders (382) 4,515 Unspecified Otitis Media Disorders, Sudden/Severe
Inflammation of Middle Ear
8 Abnormalities Involving Chest and Respiratory Symptoms (786) 4,102 Cough, Respiratory Distress, Wheezing, Shortness of
Breath
9 Symptoms Concerning Nutrition, Metabolism, and Development (783) 3,981
Unspecified Lack of Normal Physiological Development, Feeding Difficulties and Mismanagement
10 Acute Sinusitis (461) 3,875 Unspecified Acute Sinusitis
• The number of unique children identified are unique for each diagnosis category. Most (77%) of the MA children with disabilities who had diagnosis information reported received a diagnosis within more than one 3-digit ICD-9 classification during 2009.
Sources: DPW Enterprise Data Warehouse and FADS

- 15 -
Demographic Profile (Continued)
• Among 7,622 MA children with disabilities in the age group 0 through 5 who had diagnosis information reported in at least one paid medical service record in 2009, the largest number of them (2,561) had a diagnosis within the Specific Delays in Development category (ICD-9 Diagnosis Category 315). Examples of the conditions included in this category are Developmental Disorders, Learning Disorders, Dyslalia and Phonological Disorders.
• There were 1,762 MA children with disabilities in the age group 0 through
5 who had at least one paid medical service record in 2009 with a diagnosis within the Pervasive Developmental Disorders category (ICD-9 Diagnosis Category 299), such as Asperger's Disorder, Atypical Childhood Psychosis, and Autistic Disorders. Table 7: Top 10 Diagnoses in Paid Medical Service Records of
MA Enrolled Children with Disabilities between the Ages of 0 and 5 Years Old, Dates of Service 2009 (N=7,622)
Rank ICD-9 Diagnosis (3 Digits)
Number of Unique
Children* Examples of the Most Prevalent Conditions
1 Specific Delays in Development (315) 2,561 Unspecified Developmental Disorders, Unspecified Learning Disorders, Developmental Aphagia, Dyslalia, Phonological Disorders
2 Pervasive Developmental Disorders (299) 1,762 Asperger's Disorder, Atypical Childhood Psychosis, Autistic Disorders
3 Suppurative & Unspecified Otitis Media Disorders (382) 1,555 Unspecified Otitis Media Disorders,
Sudden/Severe Inflammation of Middle Ear
4 Symptoms Concerning Nutrition, Metabolism, and Development (783) 1,542 Unspecified Lack of Normal Physiological
Development
5 Acute Upper Respiratory Infections of Multiple or Unspecified Sites (465) 1,454 Acute Upper Respiratory Infections
6 General Symptoms (780) 945 Fever and Other Disturbances of Temperature Regulation, Convulsions
7 Abnormalities Involving Chest and Respiratory Symptoms (786) 915 Cough, Respiratory Distress, Wheezing,
Shortness of Breath
8 Symptoms Involving Head and Neck (784) 886 Dysarthria, Dysphasia, Slurred Speech, Acalculia, Agraphia NOS, Agnosia, Apraxia
9 Acute Sinusitis (461) 758 Unspecified Acute Sinusitis
10 Viral & Chlamydial Infection in Conditions Classified Elsewhere or Unspecified Sites (079)
748 Unspecified Viral Infections
• The number of unique children identified are unique for each diagnosis category. Most of the MA children with disabilities who had diagnosis information reported received a diagnosis within more than one 3-digit ICD-9 classification during 2009.
Sources: DPW Enterprise Data Warehouse and FADS

- 16 -
Demographic Profile (Continued)
• In 2009, 31%, or 5,888 of the 18,940 MA children with disabilities in the age group 6 through 12 who had diagnosis information reported in at least one paid service record were diagnosed with a Pervasive Developmental Disorder (ICD-9 Diagnosis Category 299). Examples of the most prevalent conditions included in the category are Asperger's Disorder, Atypical Childhood Psychosis, and Autistic Disorders.
• The Hyperkinetic Syndrome of Childhood classification (ICD-9 Diagnosis
Category 314) was the second most prevalent diagnosis category in 2009 for MA children in the age group 6 through 12 who had at least one paid medical service record. Approximately 27% of the 18,940 MA children with diagnosis information in this age group (5,199 children) had a diagnosis within the category. Examples of the most prevalent conditions within the category are Attention Deficit Disorder with and without Hyperactivity.
Table 8: Top 10 Diagnoses in Paid Medical Service Records of
MA Enrolled Children with Disabilities between the Ages of 6 and 12 Years Old, Dates of Service 2009 (N=18,940)
Rank ICD-9 Diagnosis (3 Digits)
Number of Unique Children* Examples of the Most Prevalent Conditions
1 Pervasive Developmental Disorders (299) 5,888 Asperger's Disorder, Atypical Childhood Psychosis, Autistic Disorders
2 Hyperkinetic Syndrome of Childhood NEC (314) 5,199 Attention Deficit Disorder With Hyperactivity,
Attention Deficit Disorder Without Hyperactivity
3 Acute Pharyngitis (462) 2,622 Viral Pharyngitis, Acute Sore Throat NOS
4 Acute Upper Respiratory Infections of Multiple or Unspecified Sites (465) 2,456 Acute Upper Respiratory Infections
5 Suppurative & Unspecified Otitis Media Disorders (382) 2,080 Unspecified Otitis Media Disorders, Sudden/Severe
Inflammation of Middle Ear
6 General Symptoms (780) 1,984 Fever and Other Disturbances of Temperature Regulation, Convulsions
7 Abnormalities Involving Chest and Respiratory Symptoms (786) 1,825 Cough, Respiratory Distress, Wheezing, Shortness
of Breath
8 Acute Sinusitis (461) 1,755 Unspecified Acute Sinusitis
9 Symptoms Concerning Nutrition, Metabolism, and Development (783) 1,722
Unspecified Lack of Normal Physiological Development, Feeding Difficulties and Mismanagement
10 Disorders of Refraction and Accommodation (367) 1,650 Near-sightedness, Far-sightedness
• The number of unique children identified are unique for each diagnosis category. Most of the MA children with disabilities who had diagnosis information reported received a diagnosis within more than one 3-digit ICD-9 classification during 2009.
Sources: DPW Enterprise Data Warehouse and FADS

- 17 -
Demographic Profile (Continued)
• In 2009, approximately 26% of the 13,659 MA children with disabilities in the age group 13 through 17 (3,575 children) who had diagnosis information reported in at least one paid service record had a diagnosis within the Hyperkinetic Syndrome of Childhood category (ICD-9 Diagnosis Category 314). Examples of conditions included in the category are Attention Deficit Disorder with and without Hyperactivity.
• Pervasive Developmental Disorders and Episodic Mood Disorders are two
of the other more prevalent diagnostic categories among children in the age group 13 through 17. Some examples of the Pervasive Developmental Disorders diagnosis category affecting 2,356 children are Asperger's Disorder, Atypical Childhood Psychosis, and Autistic Disorders.
Table 9: Top 10 Diagnoses in Paid Medical Service Records of MA Enrolled Children with Disabilities between the Ages of 13 and 17 Years Old,
Dates of Service 2009 (N=13,659)
Rank ICD-9 Diagnosis (3 Digits)
Number of Unique Children* Examples of the Most Prevalent Conditions
1 Hyperkinetic Syndrome of Childhood NEC (314) 3,575 Attention Deficit Disorder With Hyperactivity
Attention Deficit Disorder Without Hyperactivity
2 Pervasive Developmental Disorders (299) 2,356 Asperger's Disorder, Atypical Childhood Psychosis,
Autistic Disorders
3 Episodic Mood Disorders (296) 2,314 Mood Disorders NOS, Melancholia NOS, Unspecified Bipolar Disorders, Major Recurrent Episodes of Depression
4 Acute Pharyngitis (462) 1,766 Viral Pharyngitis, Acute Sore Throat NOS
5 Disorders of Refraction and Accommodation (367) 1,671 Near-sightedness, Astigmatism, Far-sightedness
6 General Symptoms (780) 1,567 Fever and Other Disturbances of Temperature Regulation, Malaise, Fatigue, Lethargy, Convulsions
7 Anxiety, Dissociative and Somatoform Disorders (300) 1,371 Anxiety Disorders, Obsessive-Compulsive Disorders,
Dysthymic Disorders, Depression With Anxiety
8 Acute Upper Respiratory Infections of Multiple or Unspecified Sites (465) 1,359 Acute Upper Respiratory Infections
9 Acute Sinusitis (461) 1,183 Unspecified Acute Sinusitis
10 Abnormalities Involving Chest and Respiratory Symptoms (786) 1,164 Cough, Chest Pain, Respiratory Distress, Wheezing,
Shortness of Breath • The number of unique children identified are unique for each diagnosis category. Most of the MA children with
disabilities who had diagnosis information reported received a diagnosis within more than one 3-digit ICD-9 classification during 2009.
Sources: DPW Enterprise Data Warehouse and FADS

- 18 -
Demographic Profile (Continued)
• In 2009, approximately 22% of the 2,465 MA children with disabilities in the age group 18 through 20 (530 children) who had diagnosis information reported in at least one paid service record had a diagnosis within the Episodic Mood Disorders category (ICD-9 Diagnosis Category 296). Examples of conditions included in the category are Major Recurrent Episodes of Depression, Unspecified Bipolar Disorders, Mood Disorders, and Melancholia.
• Approximately 17%, or 426, of the 2,465 MA children with disabilities in
the age group 18 through 20 who had diagnosis information reported in at least one paid medical service record had a diagnosis within the Hyperkinetic Syndrome of Childhood category (ICD-9 Diagnosis Category 314). Examples of diagnoses included in the category are Attention Deficit Disorders with and without Hyperactivity.
Table 10: Top 10 Diagnoses in Paid Medical Service Records of MA Enrolled Children with Disabilities between the Ages of 18 and 20 Years Old,
Dates of Service 2009 (N=2,465)
Rank ICD-9 Diagnosis (3 Digits)
Number of Unique
Children* Examples of the Most Prevalent Conditions
1 Episodic Mood Disorders (296) 530 Major Recurrent Episodes of Depression, Unspecified Bipolar Disorders, Mood Disorders NOS, Melancholia NOS
2 Hyperkinetic Syndrome of Childhood NEC (314) 426 Attention Deficit Disorder With Hyperactivity
Attention Deficit Disorder Without Hyperactivity
3 Pervasive Developmental Disorders (299) 266 Asperger's Disorder, Atypical Childhood Psychosis,
Autistic Disorders
4 Acute Pharyngitis (462) 262 Viral Pharyngitis, Acute Sore Throat NOS
5 General Symptoms (780) 256 Malaise, Fatigue, Lethargy, Convulsions, Fever and Other Disturbances of Temperature Regulation
6 Disorders of Refraction and Accommodation (367) 225 Near-sightedness, Far-sightedness
7 Anxiety, Dissociative and Somatoform Disorders (300) 220
Anxiety Disorders, Dysthymic Disorders, Depression With Anxiety, Obsessive-Compulsive Disorders
8 Depressive Disorders, Not Elsewhere Classified (311) 213 Depression and Depressive Disorders NOS
9 Acute Upper Respiratory Infections of Multiple or Unspecified Sites (465) 201 Acute Upper Respiratory Infections
10 Abnormalities Involving Chest and Respiratory Symptoms (786) 198 Cough, Chest Pain, Respiratory Distress,
Wheezing, Shortness of Breath • The number of unique children identified are unique for each diagnosis category. Most of the MA children with
disabilities who had diagnosis information reported received a diagnosis within more than one 3-digit ICD-9 classification during 2009.
Sources: DPW Enterprise Data Warehouse and FADS

- 19 -
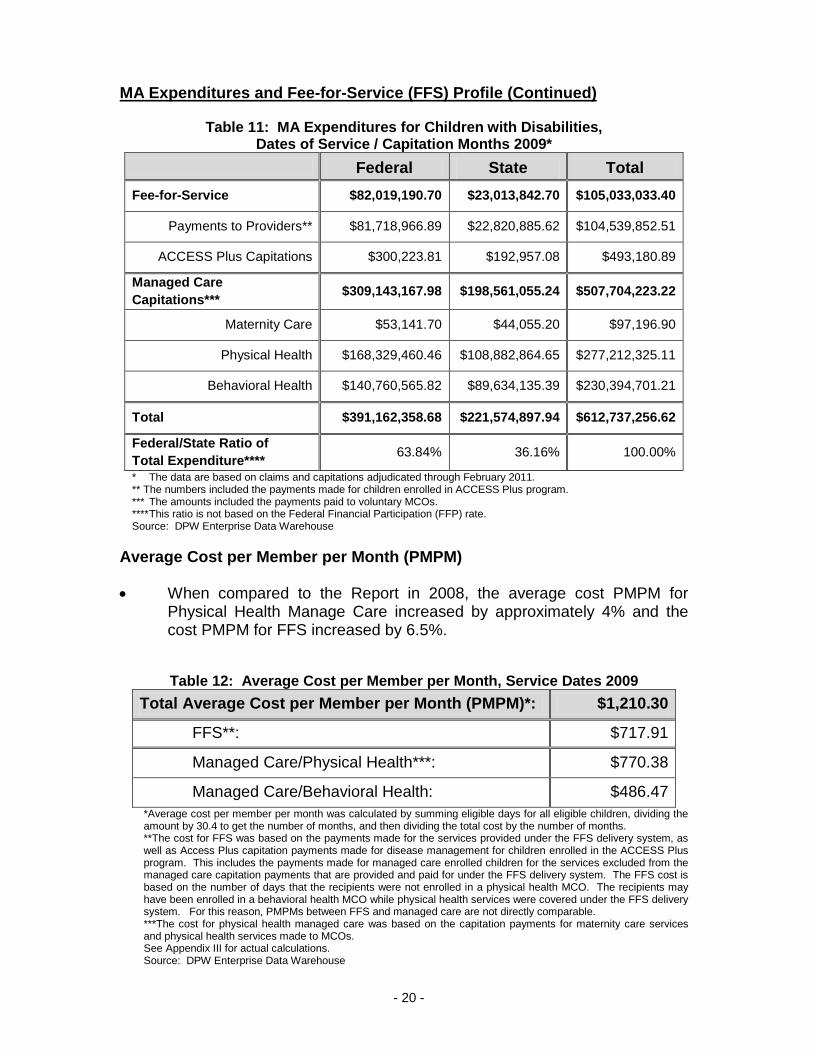
PART II: MA Expenditures and Fee-for-Service (FFS) Profile Total MA Expenditure The total MA expenditure for children with disabilities consisted of FFS payments made to MA enrolled and participating providers and capitation payments made to voluntary and mandatory (HealthChoices) MCOs for managed care enrolled children. In addition, the primary care case management system, ACCESS Plus, requires FFS enrolled children to choose a primary care physician (PCP) who manages physical health services for children. The Department makes capitation payments for disease management services for FFS children enrolled in the ACCESS Plus Program. Table 11 shows MA expenditures for children with disabilities grouped by federal and state share amounts and total amounts paid. The FFS expenditures represent payments made directly to FFS providers for services rendered and ACCESS Plus capitation payments made for the service months in year 2009. The capitation payments made to MCOs consisted of three types of medical services: maternity care, physical health and behavioral health. The managed care capitation figures in Table 11 represent the payments made for the capitation months in year 2009. • Approximately 83% of the total MA expenditures for children with
disabilities were paid for managed care capitation payments.
• The total DPW expenditures for children with disabilities increased in 2009 by over $128 million, or 27%, from $483.9 million in 2008.
• The FFS expenditure paid to service providers for children with
disabilities in 2009 increased by $8.7 million from $96.3 million 2008. Under managed care, however, total capitation payments in 2009 for behavioral health services increased by over $87.3 million from $143.1 million in 2008 and payments for physical health services increased by over $32.9 million from $244.3 million in 2008.
- 20 -
MA Expenditures and Fee-for-Service (FFS) Profile (Continued)
Table 11: MA Expenditures for Children with Disabilities, Dates of Service / Capitation Months 2009*
Federal State Total Fee-for-Service $82,019,190.70 $23,013,842.70 $105,033,033.40
Payments to Providers** $81,718,966.89 $22,820,885.62 $104,539,852.51
ACCESS Plus Capitations $300,223.81 $192,957.08 $493,180.89
Managed Care Capitations*** $309,143,167.98 $198,561,055.24 $507,704,223.22
Maternity Care $53,141.70 $44,055.20 $97,196.90
Physical Health $168,329,460.46 $108,882,864.65 $277,212,325.11
Behavioral Health $140,760,565.82 $89,634,135.39 $230,394,701.21
Total $391,162,358.68 $221,574,897.94 $612,737,256.62
Federal/State Ratio of Total Expenditure**** 63.84% 36.16% 100.00%
* The data are based on claims and capitations adjudicated through February 2011. ** The numbers included the payments made for children enrolled in ACCESS Plus program. *** The amounts included the payments paid to voluntary MCOs. **** This ratio is not based on the Federal Financial Participation (FFP) rate. Source: DPW Enterprise Data Warehouse
Average Cost per Member per Month (PMPM) • When compared to the Report in 2008, the average cost PMPM for
Physical Health Manage Care increased by approximately 4% and the cost PMPM for FFS increased by 6.5%.
Table 12: Average Cost per Member per Month, Service Dates 2009 Total Average Cost per Member per Month (PMPM)*: $1,210.30
FFS**: $717.91
Managed Care/Physical Health***: $770.38
Managed Care/Behavioral Health: $486.47 *Average cost per member per month was calculated by summing eligible days for all eligible children, dividing the amount by 30.4 to get the number of months, and then dividing the total cost by the number of months. **The cost for FFS was based on the payments made for the services provided under the FFS delivery system, as well as Access Plus capitation payments made for disease management for children enrolled in the ACCESS Plus program. This includes the payments made for managed care enrolled children for the services excluded from the managed care capitation payments that are provided and paid for under the FFS delivery system. The FFS cost is based on the number of days that the recipients were not enrolled in a physical health MCO. The recipients may have been enrolled in a behavioral health MCO while physical health services were covered under the FFS delivery system. For this reason, PMPMs between FFS and managed care are not directly comparable. ***The cost for physical health managed care was based on the capitation payments for maternity care services and physical health services made to MCOs. See Appendix III for actual calculations. Source: DPW Enterprise Data Warehouse

- 21 -
MA Expenditures and Fee-for-Service (FFS) Profile (Continued) FFS Expenditures by Service Category Table 13 presents the claim counts, MA expenditures, the numbers of unique children who received services under the FFS delivery system and the average MA expenditure per child for children with disabilities in the year 2009 by service category. FFS claims originating from MCO members for services provided during the 30 – 45 day MCO enrollment waiting period, claims for non-MCO covered school-based services, home and community based waiver services, and claims for institutional care after thirty (30) days are all included in the figures reported in Table 13.
Table 13: FFS Claim Counts, MA Expenditures, Numbers of Unique Children (N =30,874) and Average Expenditure per Child for
Children with Disabilities by Service Category, Dates of Service 2009*
Service Category Claim
Count** MA
Expenditure
Number of Unique
Children***
Average Expenditure
per Child School Based Services 1,213,739 $46,894,695.54 18,481 $2,537.45
Private Duty Nursing Services 5,345 $14,831,725.86 234 $63,383.44
Outpatient Physical Health Services 156,060 $13,135,251.68 12,727 $1,032.08
Pharmacy Services 188,491 $11,924,312.26 11,906 $1,001.54
Outpatient Behavioral Health Services 85,088 $10,971,785.13 4,405 $2,490.76
Inpatient Physical Health Services 275 $3,376,136.28 236 $14,305.66
Outpatient Physical Health Facility Services 50,522 $1,709,461.25 5,278 $323.88
Inpatient Behavioral Health Services 184 $583,483.31 163 $3,579.65
Residential Treatment Facility Services 57 $442,633.49 13 $34,048.73
Outpatient Behavioral Health Facility Services 4,541 $405,258.06 655 $618.71
Institutional Care Services 22 $251,152.17 6 $41,858.70
Home and Community Based Waivers 70 $13,324.98 15 $888.33
Hospice 2 $632.50 1 $632.50
Total**** 1,704,396 $104,539,852.51 N/A N/A
* The data are based on claims adjudicated through February 2011. ** Claim count is the count of paid header claims for inpatient, institutional care, residential treatment facility services provided by inpatient facilities, and pharmacy services. For other services, the claim count is the count of detail claims. *** The table shows the number of unique children for each service category, and the numbers cannot be summed due to duplications among the categories. The numbers include MCO members who received services in the FFS delivery system. **** The analysis excludes the ACCSS Plus capitation payments presented in Table 11.

- 22 -
MA Expenditures and Fee-for-Service (FFS) Profile (Continued)
• School Based Services was the most frequently provided service category for MA children with disabilities in 2009 under the FFS delivery system. This service category was also the largest expenditure for the MA children with disabilities under the FFS delivery system in 2009, followed by the Private Duty Nursing Services and the Outpatient Physical Health Services categories.
• Based on the average statistics on expenditures, the Private Duty
Nursing Services category was the most costly service category for MA children with disabilities under the FFS delivery system.
Figure 4 presents the FFS expenditures for MA children with disabilities in 2009 by service category by percentage.
Figure 4: FFS Expenditures for MA Enrolled Children with Disabilities by Service Category, Dates of Service 2009
Home and Community-Based Waiver Services
$13,324.98Less than 0.1%
Hospice Services$632.50
Less than 0.1%
Inpatient Behavioral Health
Services$583,483.31
0.6%
Inpatient Physical Health Services$3,376,136.28
3.2%
Institutional Care Services
$251,152.170.2%
Outpatient Behavioral Health Facility Services
$405,258.06 0.4%
Outpatient Behavioral Health
Services$10,971,785.13
10.5%
Outpatient Physical Health Facility
Services$1,709,461.25
1.6%
Outpatient Physical Health Services$13,135,251.68
12.6%
Pharmacy Services$11,924,312.26
11.4%
Private Duty Nursing Services$14,831,725.86
14.2%
Residential Treatment Facility
Services$442,633.49
0.4%
School Based Services
$46,894,695.5444.9%
Percentages may not equal 100% due to rounding. The analysis excludes the ACCESS Plus capitation payments presented in Table 11. Source: DPW Enterprise Data Warehouse

- 23 -
MA Expenditures and Fee-for-Service (FFS) Profile (Continued)
FFS Expenditures by Age Group
• MA children with disabilities in eligibility category PH-95 between the ages of 6 - 12 years old make up approximately 45% of the PH-95 children receiving benefits under the FFS delivery system and accounted for over 50% of the total FFS expenditures.
Figure 5: MA Children with Disabilities Receiving Benefits under FFS and FFS Expenditures
by Age Group, Dates of Service 2009
The number of FFS recipients includes MCO members who also received services in the FFS delivery system. The analysis excludes the ACCESS Plus capitation payments presented in Table 11. Percentages may not equal 100% due to rounding. Source: DPW Enterprise Data Warehouse
FFS Expenditures by Service Category by Age Group
Tables 14a through 14d present the FFS expenditures and number of claims for MA children with disabilities in 2009 by age group and service category. The data are based on claims adjudicated through February 2011, include MCO members who received services in the FFS delivery system, exclude the Access Plus capitation payments presented in Table 11, and age was determined as of the date of service.
Age 0 - 5 21.4%
Age 0 - 5 23.5%
Age 6 - 12 45.2%
Age 6 - 12 50.6%
Age 13 - 17 28.7%
Age 13 - 17 25.1%
Age 18 - 20 4.8%
Age 18 - 20 0.9%
0%
10%
20%
30%
40%
50%
60%
70%
80%
90%
100%
FFS Recipients(30,874)
FFS Expenditures($104,539,852.51)

- 24 -
MA Expenditures and Fee-for-Service (FFS) Profile (Continued)
• MA children with disabilities in eligibility category PH-95 between the ages of 0 - 5 years old make up over 23% of the total FFS MA expenditures for PH-95 children in 2009. School Based Services accounted for over 40% of the expenditures for the PH-95 children within the age group and Outpatient Physical Health Services accounted for approximately 27%.
Table 14a: FFS MA Expenditures and Claim Counts by Service Category for
MA Enrolled Children with Disabilities between the Ages of 0 and 5 Years Old, Dates of Service 2009
Service Category Expenditure Claim Count
School Based Services $9,892,410.91 240,908
Outpatient Physical Health Services $6,672,828.38 67,588
Private Duty Nursing $4,492,644.84 1,681
Outpatient Behavioral Health Services $1,116,743.65 7,855
Pharmacy $1,084,099.72 19,683
Inpatient Physical Health Services $561,497.12 89
Outpatient Physical Health Facility Services $482,308.52 13,235
Institutional Care Services $200,961.75 16
Outpatient Behavioral Health Facility Services $14,128.93 187
Hospice Services $632.50 2
Home and Community-Based Waiver Services $357.12 2
Total*** $24,518,613.44 351,246 Source: DPW Enterprise Data Warehouse
• The largest expenditure in 2009 for children with disabilities in eligibility category PH-95 receiving benefits under the FFS delivery system was for children between the ages of 6 - 12 years old. The PH-95 children within the age group accounted for over 50% of the total FFS MA expenditures for PH-95 children for the year. School Based Services accounted for over 49% of the MA expenditures for the PH-95 children within the age group and Private Duty Nursing accounted for over 14%.
• The children with disabilities in eligibility category PH-95 between the
ages of 13 - 17 years old receiving benefits under the FFS delivery system accounted for over 25% of the total FFS MA expenditures for PH-95 children for the year. School Based Services accounted for nearly 40% of the MA expenditure for the PH-95 children within the age group and Pharmacy accounted for over 19%.

- 25 -
MA Expenditures and Fee-for-Service (FFS) Profile (Continued)
Table 14b: FFS MA Expenditures and Claim Counts by Service Category for MA Enrolled Children with Disabilities between the Ages of 6 and 12 Years Old,
Dates of Service 2009
Service Category Expenditure Claim Count
School Based Services $26,078,726.77 706,380
Private Duty Nursing $7,499,306.78 2,643
Outpatient Behavioral Health Services $6,241,571.57 43,835
Pharmacy $5,641,615.05 86,192
Outpatient Physical Health Services $3,948,286.25 50,717
Inpatient Physical Health Services $2,104,519.78 86
Outpatient Physical Health Facility Services $741,420.13 21,518
Residential Treatment Facility $305,515.75 35
Outpatient Behavioral Health Facility Services $171,272.08 1,787
Inpatient Behavioral Health Services $134,211.72 38
Institutional Care Services $36,939.60 4
Home and Community-Based Waiver Services $7,143.14 46
Total*** $52,910,528.62 913,281 Source: DPW Enterprise Data Warehouse
Table 14c: FFS MA Expenditures and Claim Counts by Service Category for MA Enrolled Children with Disabilities between the Ages of 13 and 17 Years Old,
Dates of Service 2009
Service Category Expenditure Claim Count
School Based Services $10,390,631.68 254,436
Pharmacy $5,047,983.98 79,900
Outpatient Behavioral Health Services $3,501,460.44 32,092
Private Duty Nursing $2,808,464.24 1,016
Outpatient Physical Health Services $2,469,634.23 36,735
Inpatient Physical Health Services $696,242.94 95
Outpatient Physical Health Facility Services $466,483.83 15,263
Inpatient Behavioral Health Services $449,271.59 146
Outpatient Behavioral Health Facility Services $204,175.05 2,392
Residential Treatment Facility $137,117.74 22
Institutional Care Services $13,250.82 2
Home and Community-Based Waiver Services $2,971.69 15
Total*** $26,187,688.23 422,114 Source: DPW Enterprise Data Warehouse

- 26 -
MA Expenditures and Fee-for-Service (FFS) Profile (Continued)
• The children with disabilities in eligibility category PH-95 between the ages of 18 - 20 years old receiving benefits under the FFS delivery system accounted for approximately 1% of the total FFS MA expenditures for PH-95 children in 2009. School Based Services accounted for nearly 58% of the MA expenditure for the PH-95 children within the age group and Pharmacy accounted for over 16%.
Table 14d: FFS MA Expenditures and Claim Counts by Service Category for MA Enrolled Children with Disabilities between the Ages of 18 and 20 Years Old,
Dates of Service 2009
Service Category Expenditure Claim Count
School Based Services $532,926.18 12,015
Pharmacy $150,613.51 2,716
Outpatient Behavioral Health Services $112,009.47 1,306
Outpatient Physical Health Services $44,502.82 1,020
Private Duty Nursing $31,310.00 5
Outpatient Physical Health Facility Services $19,248.77 506
Outpatient Behavioral Health Facility Services $15,682.00 175
Inpatient Physical Health Services $13,876.44 5
Home and Community-Based Waiver Services $2,853.03 7
Total $923,022.22 17,755 Source: DPW Enterprise Data Warehouse

- 27 -
MA Expenditures and Fee-for-Service (FFS) Profile (Continued) Managed Care Capitation Payments Figure 6 presents the amounts of managed care capitation payments made for MA children with disabilities for three types of health services for capitation months in 2009.
• Approximately 55% of the total managed care capitation payments made on behalf of MA children with disabilities in 2009 were for physical health services.
Figure 6: Managed Care Capitation Payments for MA Children with Disabilities by Service Type [Capitation Months in 2009]
Maternity Care$97,196.90
Less than 0.1%
Physical Health$277,212,325.11
54.6%
Behavioral Health
$230,394,701.2145.4%
Source: DPW Enterprise Data Warehouse
Percentages may not equal 100% due to rounding.

- 28 -
MA Expenditures and Fee-for-Service (FFS) Profile (Continued) MA Expenditures on FFS and Capitation Payments by Income Group Figure 7 presents the FFS expenditures, capitation payments and the number of MA children with disabilities that received services in 2009 by five annual household income groups. Among the 52,945 MA children with disabilities, OIM provided income information on 38,725 children. Among these children, 38,518 recipients had records of paid medical services under the FFS or managed care delivery system. This section of the analysis is based on the children for whom income information was available and who had at least one paid medical service or capitation payment record during 2009, and it included approximately 80% of the total expenditures.
Figure 7: FFS Expenditures*, Managed Care Capitation Payments** And Numbers of Children with Disabilities *** (N=38,518)
by Annual Income Group with and without TPL, Dates of Service/Capitation Months in 2009
* The FFS expenditures included capitation payments for disease management programs under the ACCESS Plus program adjudicated through February 2011.
** The Managed Care Capitation Payments included payments made to the MCOs to provide physical health, behavioral health and maternity care services for managed care enrolled children adjudicated through February 2011.
*** The numbers of children are unique in each of the FFS and capitation categories, but there were many children in both delivery systems. Thus, if a child received services under the FFS delivery system and had capitation records under the managed care system during the year, the child was counted both in the FFS and Capitation categories. Therefore, adding the numbers together will not sum to 38,518. Sources: OIM for income data, Enterprise Data Warehouse for expenditure data
$18,493,470.53 (N=6,139)
$23,007,990.07 (N=5,925)
$14,496,232.84, (N=3,560)
$14,805,593.05 (N=3,408)
$2,100,291.29 (N=579)
$9,263,042.95 (N=2,676)
$4,258,135.56 (N=1,009)
$1,676,546.43 (N=349)
$1,213,616.43 (N=264)
$117,794.15 (N=49)
$83,605,315.90 (N=9,020)
$97,101,577.06 (N=8,751)
$65,039,851.46 (N=5,455)
$69,381,163.41 (N=5,359)
$12,407,148.54 (N=950)
$41,125,814.83 (N=4,565)
$17,301,110.59 (N=1,693)
$6,920,931.52 (N=609)
$5,484,394.52 (N=452)
$1,105,915.69 (N=91)
$0 $20,000,000 $40,000,000 $60,000,000 $80,000,000 $100,000,000 $120,000,000
Less than $50,000
Between $50,000 and $75,000
Over $75,000 but less than $100,000
Between $100,000 and $200,000
Greater than $200,000
Less than $50,000
Between $50,000 and $75,000
Over $75,000 but less than $100,000
Between $100,000 and $200,000
Greater than $200,000
Without TPL
With TPL
FFS Managed Care Capitation

- 29 -
MA Expenditures and Fee-for-Service (FFS) Profile (Continued) FFS Drug Utilization The Department paid over $11.9 million for pharmacy services for MA children with disabilities under the FFS delivery system in 2009. This was approximately 11% of the total FFS expenditures paid to providers for these children. Figure 8 shows the ratio of the pharmacy expenditures in physical health drugs and behavioral health drugs.
• More than half of the FFS pharmacy expenditures in 2009 for MA children with disabilities were for physical health drugs.
Figure 8: FFS Pharmacy Expenditures on MA Children with Disabilities by Physical Health (PH) and Behavioral Health (BH), Dates of Service 2009*
Behavioral Health$5,462,767.30
46.2%Physical Health$6,356,278.32
53.8%
* Drugs were categorized by GC3 therapeutic class code of valid National Drug Codes (NDCs)
indicated on single drug claims. The amounts exclude any claims for compound drugs and the claims without valid NDCs, and represents approximately 99% of the total FFS drug expenditures presented in Tables 13 and 14.
Source: DPW Enterprise Data Warehouse

- 30 -
MA Expenditures and Fee-for-Service (FFS) Profile (Continued) FFS Physical Health Drugs In year 2009, a total of 10,272 MA children with disabilities received physical health drug services in the FFS delivery system. Table 15 presents the top 10 physical health drug types that were paid for these children in the FFS delivery system, the total MA expenditures, the claim count, the numbers of unique children who received one of the top 10 physical health drugs and the average cost per child, in the order of total expenditure. Examples of drugs for these drug types, which are based on GC3 therapeutic class, are presented in Appendix V.
• Based on the average cost per child, Antihemophilic Factors were the highest cost physical health drug type under the FFS delivery system for MA children with disabilities in 2009, followed by Growth Hormones.
Table 15: FFS Top 10 Physical Health Drug Types Paid for
MA Children with Disabilities by Total Expenditure, Dates of Service 2009*
Rank Drug Type MA
Expenditure Claim Count
Number of Unique
Children**
Average Cost per
Child 1 Antihemophilic Factors $619,055.42 101 13 $47,619.65
2 Growth Hormones $546,587.76 505 68 $8,038.06
3 Insulins $532,051.95 6,533 671 $792.92
4 Leukotriene Receptor Antagonists $343,143.76 5,757 1,063 $322.81
5 Proton-Pump Inhibitors $328,541.03 4,936 991 $331.52
6 Blood Sugar Diagnostics $310,813.28 3,821 618 $502.93
7 Glucocorticoids $256,803.58 5,307 1,938 $132.51
8 Drugs to Treat Hereditary Tyrosinemia $228,180.99 20 1 $228,180.99
9 Mucolytics $219,001.89 591 97 $2,257.75
10 Pancreatic Enzymes $199,524.82 710 111 $1,797.52 * The data are based on claims adjudicated through February 2011. ** The table shows the number of unique children for each drug type. Drugs were categorized by GC3 therapeutic class code of valid National Drug Codes (NDCs) indicated on single drug claims. The amounts exclude any claims for compound drugs and claims without valid NDCs, and represent approximately 99% of the total FFS drug expenditures presented in Tables 13 and 14. Examples of drug names for drug types are presented in Appendix V. Source: DPW Enterprise Data Warehouse

- 31 -
MA Expenditures and Fee-for-Service (FFS) Profile (Continued) Table 16 presents the top 10 physical health drug types that were paid for MA children with disabilities in the FFS delivery system, the claim count, total MA expenditures and the number of unique children who received one of the top 10 physical health drugs, in the order of claim count.
• Penicillins were the most highly dispensed physical health drug type for MA children with disabilities under the FFS delivery system in 2009, with the total claim count of 6,881, followed by Insulins.
• Penicillin was the physical health drug type provided to the largest number of MA children with disabilities under the FFS delivery system (3,962 children).
Table 16: FFS Top 10 Physical Health Drug Types Paid for MA Children with Disabilities by Claim Count, Dates of Service 2009*
Rank Drug Type Claim Count
MA Expenditure
Number of Unique
Children** 1 Penicillins 6,881 $83,991.51 3,962
2 Insulins 6,533 $532,051.95 671
3 Leukotriene Receptor Antagonists 5,757 $343,143.76 1,063
4 Glucocorticoids 5,307 $256,803.58 1,938
5 Antyhypertensives, Sympatholytic 5,101 $37,476.79 791
6 Beta-Adrenergic Agents 5,070 $137,026.61 2,135
7 Proton-Pump Inhibitors 4,936 $328,541.03 991
8 Antihistamines - 2nd Generation 4,785 $73,539.55 1,166
9 Macrolides 4,275 $83,912.24 2,635
10 Blood Sugar Diagnostics 3,821 $310,813.28 618 * The data are based on claims adjudicated through February 2011. ** The table shows the number of unique children for each drug type. Drugs were categorized by GC3 therapeutic class code of valid National Drug Codes (NDCs) indicated on single drug claims. The amounts exclude any claims for compound drugs and the claims without valid NDCs, and represent approximately 99% of the total FFS drug expenditures presented in Tables 13 and 14. Examples of drug names for drug types are presented in Appendix V. Source: DPW Enterprise Data Warehouse

- 32 -
MA Expenditures and Fee-for-Service (FFS) Profile (Continued) FFS Behavioral Health Drugs In calendar year 2009, a total of 6,429 MA children with disabilities received behavioral health drug services under the FFS delivery system. Table 17 presents the top 10 behavioral health drug types that were paid for these children under the FFS delivery system, the total MA expenditures, the claim count, the number of unique children who received one of the top 10 behavioral health drugs and the average cost per child, in the order of total expenditures.
• Anticonvulsants were the behavioral health drug type with the highest amount paid for MA children with disabilities under the FFS delivery system in 2009.
• According to Table 17, Antipsychotics, which include such drugs as Abilify, were the most expensive behavioral health drug type for MA children with disabilities with an average cost of $1,214.10 per child.
Table 17: FFS Top 10 Behavioral Health Drug Types Paid for MA Children with Disabilities by Total Expenditure, Dates of Service 2009*
Rank Drug Type MA
Expenditure Claim Count
Number of Unique
Children**
Average Cost per
Child 1 Anticonvulsants $1,307,463.94 13,448 1,423 $918.81
2 Antipsychotics, Atypical, D2 Partial Agonist/5HT Mixed $991,923.68 4,629 817 $1,214.10
3 Treatment for Attention Deficit-Hyperactivity (ADHD)/Narcolepsy $943,775.14 15,276 2,042 $462.18
4 Antipsychotics, Atypical, Dopamine & Seratonin Antagonist
$809,288.92 10,708 1,441 $561.62
5 Adrenergics, Aromatic, Non-Catecholamine $689,377.47 9,029 1,408 $489.61
6 Treatment for Attention Deficit-Hyperactivity (ADHD)/NRI-Type $437,287.89 4,705 740 $590.93
7 Selective Serotonin Reuptake Inhibitors (SSRIS) $101,513.84 8,704 1,454 $69.82
8 Norepinephrine and Dopamine Reuptake Inhibitors (NDRIS) $37,867.47 1,164 221 $171.35
9 Serotonin-Nonrepinephrine Reuptake- Inhibitors (SNRIS) $31,750.11 508 97 $327.32
10 Analgesics, Narcotics $22,245.03 1,040 572 $38.89 * The data are based on claims adjudicated through February 2011. ** The table shows the number of unique children for each drug type. Drugs were categorized by GC3 therapeutic class code of valid National Drug Codes (NDCs) indicated on single drug claims. The amounts exclude any claims for compound drugs and the claims without valid NDCs, and represent approximately 99% of the total FFS drug expenditures presented in Tables 13 and 14. Examples of drug names for drug types are presented in Appendix V. Source: DPW Enterprise Data Warehouse

- 33 -
MA Expenditures and Fee-for-Service (FFS) Profile (Continued) Table 18 presents the top 10 behavioral health drug types that were paid for MA children with disabilities in the FFS delivery system, the claim count, total expenditures and the number of unique children who received one of the top 10 behavioral health drugs, in the order of claim count.
• Drugs for the treatment of Attention Deficit – Hyperactivity (ADHD) / Narcolepsy were the most highly dispensed behavioral health drug type for MA children with disabilities under the FFS delivery system in 2009, with a total of 15,276 claims.
• Drugs for the treatment of Attention Deficit – Hyperactivity (ADHD) / Narcolepsy were also the behavioral health drug type provided to the greatest number of MA children with disabilities (2,042) under the FFS delivery system in 2009.
Table 18: FFS Top 10 Behavioral Health Drug Types Paid for MA Children with Disabilities by Claim Count, Dates of Service 2009*
Rank Drug Type Claim Count
MA Expenditure
Number of Unique
Children**
1 Treatment for Attention Deficit-Hyperactivity (ADHD)/Narcolepsy 15,276 $943,775.14 2,042
2 Anticonvulsants 13,448 $1,307,463.94 1,423
3 Antipsychotics, Atypical, Dopamine & Seratonin Antagonists 10,708 $809,288.92 1,441
4 Adrenergics, Aromatic, Non-Catecholamine 9,029 $689,377.47 1,408
5 Selective Serotonin Reuptake Inhibitors (SSRIS) 8,704 $101,513.84 1,454
6 Treatment for Attention Deficit-Hyperactivity (ADHD)/NRI-Type 4,705 $437,287.89 740
7 Antipsychotics, Atypical, D2 Partial Agonist/5HT Mixed 4,629 $991,923.68 817
8 Anti-Anxiety Drugs 1,366 $17,447.41 357
9 Norepinephrine and Dopamine Reuptake Inhibitors (NDRIS) 1,164 $37,867.47 221
10 Serotonin-2 Antagonist/Reuptake Inhibitors (SARIS) 1,098 $5,528.87 248
* The data are based on claims adjudicated through February 2011. ** The table shows the number of unique children for each drug type. Drugs were categorized by GC3 therapeutic class code of valid National Drug Codes (NDCs) indicated on single drug claims. The amounts exclude any claims for compound drugs and the claims without valid NDCs, and represent approximately 99% of the total FFS drug expenditures presented in Tables 13 and 14. Examples of drug names for drug types are presented in Appendix V. Source: DPW Enterprise Data Warehouse
- 34 -
PART III: Managed Care Service Profile The Medical Assistance (MA) Program provides physical health services under a mandatory managed care program (known as HealthChoices) in 25 counties in the Southeast, Southwest and Lehigh/Capital Regions, and a voluntary managed care program in some counties of Pennsylvania where a mandatory managed care program is not available. In July 2007, the Department completed the statewide implementation of the HealthChoices behavioral health managed care program. Thus, behavioral health services have been provided to eligible recipients under the Managed Care delivery system in all 67 counties. The Department makes capitation payments on a per-member per-month basis to participating MCOs on behalf of MA eligible members enrolled in one of the MCO plans. The analysis of capitation payments was presented in Part II. As discussed in Part I, the services provided to MCO members during the 30 – 45 day physical health MCO enrollment waiting period are paid in the FFS delivery system. In addition, non-MCO covered services, such as school based services and long term care services after 30 days are also paid in the FFS delivery system for MA eligible children enrolled in managed care. Part III presents the analysis of services rendered by the managed care service providers for MA children with disabilities. The analysis included the number of children with disabilities who received the services, the number of service records, the types of services, and the expenditures by MCOs for the services rendered for these children. The MCO expenditures did not denote the amount the Department paid the MCOs. The service records of MCOs were submitted by the MCOs and processed in PA PROMISe™. The latest service records that were approved by the PROMISe™ edits were analyzed. The analysis excludes service records that were adjusted or voided in order to avoid duplication of service counts. The analysis also excludes the service records that may have been paid by the MCOs but not approved by the PROMISe™ edits, which are based on the Department’s payment policy.

- 35 -
Managed Care Service Profile (Continued) Managed Care Expenditures by Service Category Table 19 presents the MCO service record counts, MCO expenditures, the number of unique children with disabilities with service records, and the average MCO expenditure per child by service category.
• The most frequently provided service category for MA children with disabilities under the Managed Care delivery system in 2009 was Outpatient Behavioral Health Services, followed by Pharmacy Services.
• The highest cost service category for MA children with disabilities in 2009
based on the average MCO expenditure per child was Private Duty Nursing Services.
Table 19: Service Record Counts, Managed Care Organization (MCO) Expenditures, Numbers of Unique Children (N =39,161), and
Average MCO Expenditure per Child for MA Children with Disabilities by Service Category, Dates of Service 2009
Service Category
Service Record Count* MCO Expenditure
Number of Unique Children**
Average MCO Expenditure
per Child Outpatient Behavioral Health Services 1,439,436 $171,182,051.10 15,935 $10,742.52
Private Duty Nursing Services 61,351 $28,738,372.63 457 $62,884.84
Pharmacy Services 493,484 $27,884,180.42 26,927 $1,035.55
Outpatient Physical Health Services 410,213 $25,875,620.66 28,300 $914.33
Residential Treatment Facility Services 9,993 $19,355,449.09 480 $40,323.85 Outpatient Behavioral Health Facility Services 135,541 $12,100,410.15 11,469 $1,055.05
Outpatient Physical Health Facility Services 187,730 $7,883,627.60 13,231 $595.85
Inpatient Behavioral Health Services 1,109 $6,169,334.47 534 $11,553.06
Inpatient Physical Health Service 642 $4,883,389.63 462 $10,570.11
Institutional Care Services 11 $57,442.50 1 $57,442.50
Skilled Nursing Facility Services 537 $35,481.90 63 $563.20
Hospice 32 $13,642.82 4 $3,410.71
Total 2,740,079 $304,179,002.97 N/A N/A * Service Record Count is the count of encounter records provided by MCOs for each service category. ** The table shows the number of unique children for each service category, and the numbers cannot be summed due to duplications among the categories. Sources: DPW FADS

- 36 -
Managed Care Service Profile (Continued)
• Over 56% of the total MCO expenditures for MA children with disabilities in 2009 were paid for Outpatient Behavioral Health Services.
Figure 9: Managed Care Organization (MCO) Expenditures on MA Children with Disabilities by Service Category, Dates of Service 2009
Hospice Services$13,642.82
Less than 0.1%
Inpatient Behavioral Health Services $6,169,334.47
2.0%
Inpatient Physical Health Service$4,883,389.63
1.6%
Institutional Care Services
$57,442.50Less than 0.1%
Outpatient Behavioral Health Facility
Services $12,100,410.15
4.0%
Outpatient Behavioral Health Services
$171,182,051.1056.3%
Outpatient Physical Health Facility Services
$7,883,627.602.6%
Outpatient Physical Health Services $25,875,620.66
8.5%
Pharmacy Services$27,884,180.42
9.2%
Private Duty Nursing Services
$28,738,372.639.5%
Residential Treatment Facility Services $19,355,449.09
6.4%
Skilled Nursing Facility Services
$35,481.90Less than 0.1%
Percentages may not equal 100% due to rounding. Sources: DPW FADS
- 37 -
Managed Care Service Profile (Continued) Managed Care Expenditures by Age Group
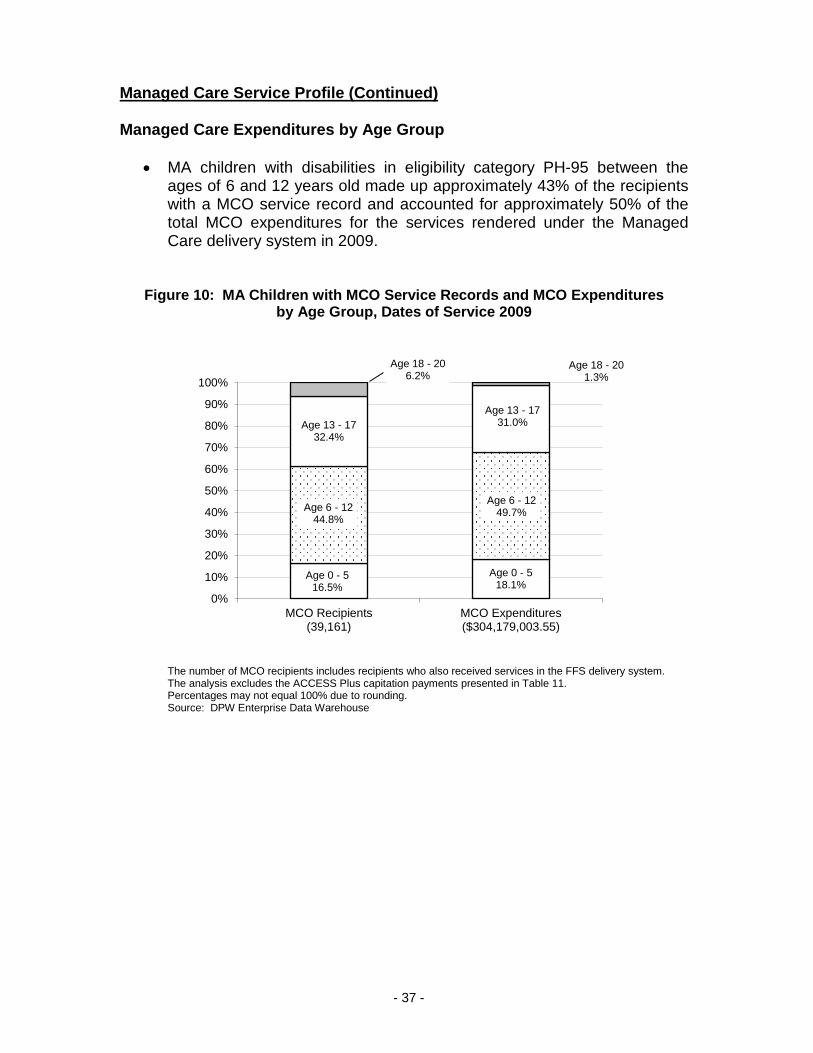
• MA children with disabilities in eligibility category PH-95 between the ages of 6 and 12 years old made up approximately 43% of the recipients with a MCO service record and accounted for approximately 50% of the total MCO expenditures for the services rendered under the Managed Care delivery system in 2009.
Figure 10: MA Children with MCO Service Records and MCO Expenditures by Age Group, Dates of Service 2009
The number of MCO recipients includes recipients who also received services in the FFS delivery system. The analysis excludes the ACCESS Plus capitation payments presented in Table 11. Percentages may not equal 100% due to rounding. Source: DPW Enterprise Data Warehouse
Age 0 - 5 16.5%
Age 0 - 5 18.1%
Age 6 - 12 44.8%
Age 6 - 12 49.7%
Age 13 - 17 32.4%
Age 13 - 17 31.0%
Age 18 - 20 6.2%
Age 18 - 20 1.3%
0%
10%
20%
30%
40%
50%
60%
70%
80%
90%
100%
MCO Recipients(39,161)
MCO Expenditures($304,179,003.55)

- 38 -
Managed Care Service Profile (Continued) Managed Care Expenditures by Service Category by Age Group Tables 20a through 20d present the MCO expenditures for the services rendered in 2009 under the Managed Care delivery system and number of MCO service records for MA children with disabilities by age group and service category. Age was determined as of the date of service and the service record counts are the count of encounter records provided by MCOs for each service category.
• MA children with disabilities in eligibility category PH-95 between the ages of 0 and 5 years old accounted for over 18% of the total MCO expenditures for the year. Outpatient Behavioral Health Services accounted for approximately 56% of the MA expenditure within the age group and Private Duty Nursing Services accounted for almost 18%.
Table 20a: MCO Expenditures and Service Records by Service Category for
MA Enrolled Children with Disabilities between the Ages of 0 and 5 Years Old, Dates of Service 2009
Service Category MCO
Expenditure
Service Record Count
Outpatient Behavioral Health Services $30,960,558.67 282,966
Private Duty Nursing Services $9,787,842.51 20,544
Outpatient Physical Health Services $6,049,820.91 97,273
Pharmacy Services $2,829,455.00 65,780
Outpatient Physical Health Facility Services $2,662,551.00 63,231
Outpatient Behavioral Health Facility Services $1,605,703.64 10,054
Inpatient Physical Health Service $1,033,628.11 126
Inpatient Behavioral Health Services $37,448.58 10
Skilled Nursing Facility Services $19,884.96 284
Hospice Services $496.00 1 Total $54,987,389.38 540,269
Source: DPW Enterprise Data Warehouse

- 39 -
Managed Care Service Profile (Continued)
• The largest expenditure in 2009 for MA children with disabilities in eligibility category PH-95 receiving managed care benefits was for children in the age group between 6 and 12 years old. The children within the age group accounted for over 50% of the total MCO expenditures for the year. Outpatient Behavioral Health Services accounted for approximately 66% of the MA expenditure within the age group.
Table 20b: MCO Expenditures and Service Records by Service Category for MA Enrolled Children with Disabilities between the Ages of 6 and 12 Years Old,
Dates of Service 2009
Service Category MCO
Expenditure
Service Record Count
Outpatient Behavioral Health Services $100,039,793.69 849,970
Private Duty Nursing Services $12,325,702.42 26,463
Pharmacy Services $12,289,420.00 221,215
Outpatient Physical Health Services $11,360,101.27 183,458
Outpatient Behavioral Health Facility Services $4,764,049.08 57,426
Residential Treatment Facility Services $4,097,661.20 2,380
Outpatient Physical Health Facility Services $2,993,897.82 72,993
Inpatient Behavioral Health Services $1,872,461.07 292
Inpatient Physical Health Service $1,326,101.53 194
Skilled Nursing Facility Services $14,663.14 225
Hospice Services $12,120.62 24 Total $151,095,971.84 1,414,640
Source: DPW Enterprise Data Warehouse
• MA children with disabilities in eligibility category PH-95 between the ages of 13 and 17 years old accounted for 31% of the total MCO expenditures for the year. Outpatient Behavioral Health Services accounted for approximately 42% of the MA expenditure within the age group and Residential Treatment Facility Services accounted for over 15%.

- 40 -
Managed Care Service Profile (Continued)
Table 20c: MCO Expenditures and Service Records by Service Category for MA Enrolled Children with Disabilities between the Ages of 13 and 17 Years Old,
Dates of Service 2009
Service Category MCO
Expenditure
Service Record Count
Outpatient Behavioral Health Services $39,328,545.33 299,196
Residential Treatment Facility Services $14,517,434.08 7,484
Pharmacy Services $12,100,883.00 194,380
Outpatient Physical Health Services $8,095,044.03 122,414
Private Duty Nursing Services $6,227,508.94 13,273
Outpatient Behavioral Health Facility Services $5,449,803.75 64,547
Inpatient Behavioral Health Services $4,029,488.46 771
Inpatient Physical Health Service $2,360,395.30 297
Outpatient Physical Health Facility Services $2,102,393.16 48,204
Institutional Care Services $57,442.50 11
Hospice Services $1,026.20 7
Skilled Nursing Facility Services $933.80 28 Total $94,270,898.55 750,612
Source: DPW Enterprise Data Warehouse
• Children between the ages of 18 and 20 years old accounted for approximately 1% of the total MCO expenditures for the year. Outpatient Behavioral Health Services accounted for approximately 22% of the MA expenditure within the age group and Residential Treatment Facility Services accounted for over 19%.

- 41 -
Managed Care Service Profile (Continued)
Table 20d: MCO Expenditures and Service Records by Service Category for MA Enrolled Children with Disabilities between the Ages of 18 and 20 Years Old,
Dates of Service 2009
Service Category
MCO Expenditure
Service Record Count
Outpatient Behavioral Health Services $853,153.41 7,304
Residential Treatment Facility Services $740,353.81 129
Pharmacy Services $664,423.00 12,109
Private Duty Nursing Services $397,318.76 1071
Outpatient Physical Health Services $370,654.45 7,068
Outpatient Behavioral Health Facility Services $280,853.68 3,514
Inpatient Behavioral Health Services $229,936.36 36
Inpatient Physical Health Service $163,264.69 25
Outpatient Physical Health Facility Services $124,785.62 3,302 Total $3,824,743.78 34,558
Source: DPW Enterprise Data Warehouse

- 42 -
Managed Care Service Profile (Continued) Managed Care Drug Utilization Managed care organizations spent almost $28 million in 2009 for pharmacy services for MA children with disabilities. This was a little over 9% of the total MCO expenditures for these children. Figure 11 shows the ratio of the pharmacy expenditures for the children with disabilities in physical health drugs and behavioral health drugs.
• More than half of MCO pharmacy expenditures for MA children with disabilities in 2009 were paid for physical health drugs.
Figure 11: Managed Care Organization (MCO) Pharmacy Expenditures for MA Children with Disabilities by
Physical Health (PH) and Behavioral Health (BH), Dates of Service 2009*
Behavioral Health$13,073,498.64
47.3%Physical Health$14,572,472.93
52.7%
* Drugs were categorized by GC3 therapeutic class code of valid National Drug Codes (NDCs) indicated
on single drug encounter records. The amounts exclude any claims for compound drugs and the claims without valid NDCs, and represent approximately 99.2% of the total MCO drug expenditures presented in Tables 19 and 20.
Source: DPW FADS
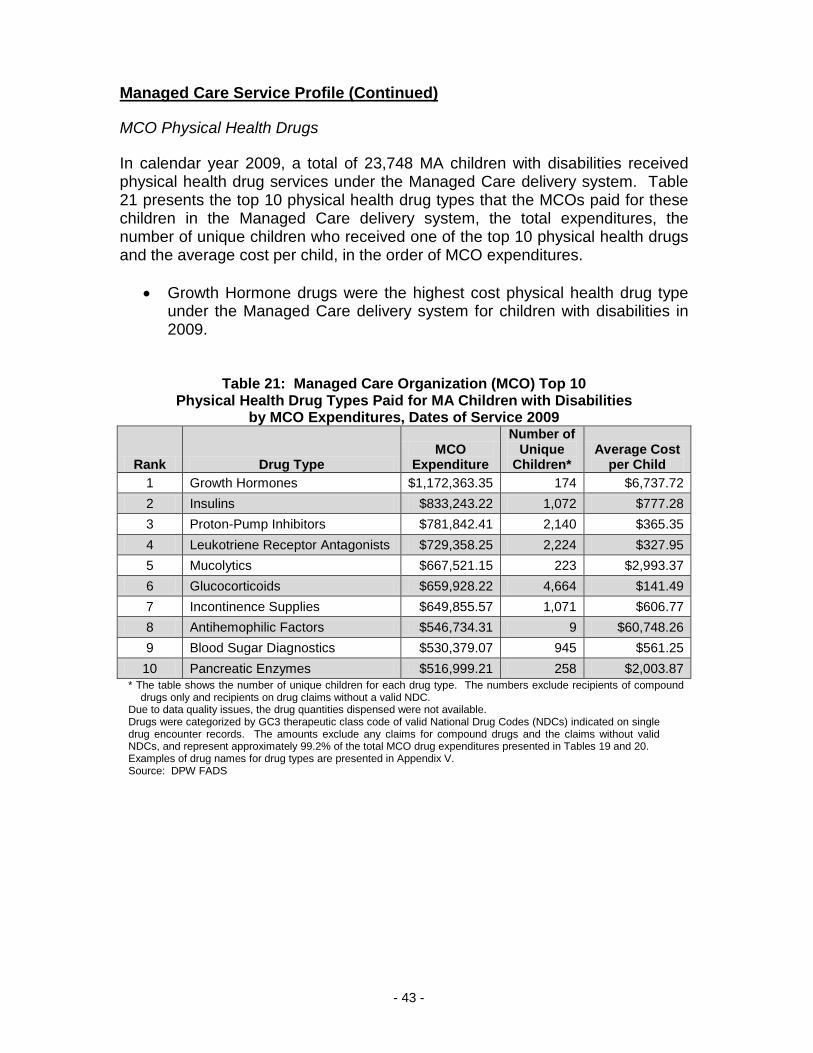
- 43 -
Managed Care Service Profile (Continued) MCO Physical Health Drugs In calendar year 2009, a total of 23,748 MA children with disabilities received physical health drug services under the Managed Care delivery system. Table 21 presents the top 10 physical health drug types that the MCOs paid for these children in the Managed Care delivery system, the total expenditures, the number of unique children who received one of the top 10 physical health drugs and the average cost per child, in the order of MCO expenditures.
• Growth Hormone drugs were the highest cost physical health drug type under the Managed Care delivery system for children with disabilities in 2009.
Table 21: Managed Care Organization (MCO) Top 10
Physical Health Drug Types Paid for MA Children with Disabilities by MCO Expenditures, Dates of Service 2009
Rank Drug Type MCO
Expenditure
Number of Unique
Children* Average Cost
per Child 1 Growth Hormones $1,172,363.35 174 $6,737.72 2 Insulins $833,243.22 1,072 $777.28 3 Proton-Pump Inhibitors $781,842.41 2,140 $365.35 4 Leukotriene Receptor Antagonists $729,358.25 2,224 $327.95 5 Mucolytics $667,521.15 223 $2,993.37 6 Glucocorticoids $659,928.22 4,664 $141.49 7 Incontinence Supplies $649,855.57 1,071 $606.77 8 Antihemophilic Factors $546,734.31 9 $60,748.26 9 Blood Sugar Diagnostics $530,379.07 945 $561.25
10 Pancreatic Enzymes $516,999.21 258 $2,003.87 * The table shows the number of unique children for each drug type. The numbers exclude recipients of compound
drugs only and recipients on drug claims without a valid NDC. Due to data quality issues, the drug quantities dispensed were not available. Drugs were categorized by GC3 therapeutic class code of valid National Drug Codes (NDCs) indicated on single drug encounter records. The amounts exclude any claims for compound drugs and the claims without valid NDCs, and represent approximately 99.2% of the total MCO drug expenditures presented in Tables 19 and 20. Examples of drug names for drug types are presented in Appendix V. Source: DPW FADS

- 44 -
Managed Care Service Profile (Continued) Table 22 presents the top 10 physical health drug types that were paid for MA children with disabilities under the Managed Care delivery system, the total MCO expenditures, and the number of unique children who received one of the top 10 physical health drugs, in the order of service record count.
• Penicillin was the physical health drug type with the highest service record counts (17,195) for the children with disabilities under the Managed Care delivery system in 2009.
• Penicillin was the physical health drug type provided to the largest number of children (9,581) with disabilities in the Managed Care delivery system in 2009.
Table 22: Managed Care Organization (MCO) Top 10 Physical Health Drug Types Paid for MA Children with Disabilities
by Service Record Count, Dates of Service 2009
Rank Drug Description
Service Record Count*
MCO Expenditure
Number of Unique
Children** 1 Penicillin 17,195 $235,241.73 9,581 2 Glucocorticoids 14,743 $659,928.22 4,664 3 Antihypertensives, Sympatholytic 13,973 $128,058.90 2,142 4 Beta-Adrenergic Agents 13,945 $372,977.59 5,247 5 Leukotriene Receptor Antagonists 12,748 $729,358.25 2,224 6 Proton-Pump Inhibitors 12,496 $781,842.41 2,140 7 Insulins 12,464 $833,243.22 1,072 8 Antihistamines – 2nd Generation 12,244 $215,973.55 2,706 9 Macrolides 8,654 $144,717.23 5,155
10 Incontinence Supplies 7,711 $649,855.57 1,071 * Service Record Count is the count of encounter records provided by MCOs for each service category ** The table shows the number of unique children for each drug type. The numbers exclude recipients of
compound drugs only and recipients on drug claims without a valid NDC. Due to data quality issues, the drug quantities dispensed are not available. Drugs were categorized by GC3 therapeutic class code of valid National Drug Codes (NDCs) indicated on single drug encounter records. The amounts exclude any claims for compound drugs and the claims without valid NDCs, and represent approximately 99.2% of the total MCO drug expenditures presented in Tables 19 and 20. Examples of drug names for drug types are presented in Appendix V. Source: DPW FADS

- 45 -
Managed Care Service Profile (Continued)
MCO Behavioral Health Drugs In calendar year 2009, a total of 15,078 MA children with disabilities received behavioral health drug services under the Managed Care delivery system. Table 23 presents the top 10 behavioral health drug types that were paid for these children in the Managed Care delivery system, the total expenditures, the number of unique children who received the drug services and the average cost per child, in the order of MCO expenditure.
• Treatment For Attention Deficit-Hyperactivity (ADHD) / Narcolepsy was the behavioral health drug type with the highest costs to MCOs for MA children with disabilities, followed by antipsychotics, which included Risperdal, Seroquel, and Geodon.
• Antipsychotics, which include Abilify, were the most expensive behavioral health drug type based on the average cost per child with a cost of $1,236.95 per child.
Table 23: Managed Care Organization (MCO) Top 10 Behavioral Health Drug Types Paid for MA Children with Disabilities
by MCO Expenditures, Dates of Service 2009 (N=15,078)
Rank Drug Type MCO
Expenditure
Number of Unique
Children*
Average Cost per
Child
1 Treatment For Attention Deficit-Hyperactivity (ADHD) / Narcolepsy $2,828,907.74 5,232 $540.69
2 Antipsychotics, Atypical, Dopamine & Serotonin Antagonists $2,276,154.37 3,526 $645.53
3 Antipsychotics, Atypical, D2 Partial Antagonist / 5HT Mixed $2,257,428.78 1,825 $1,236.95
4 Anticonvulsants $2,207,451.67 3,324 $664.09
5 Adrenergics, Aromatic, Non-Catecholamine $1,537,206.62 3,023 $508.50
6 Treatment For Attention Deficit-Hyperactivity (ADHD), NRI-Type $1,040,772.57 1,681 $619.14
7 Selective Serotonin Reuptake Inhibitors (SSRIS) $416,308.28 4,124 $100.95
8 Serotonin and Norepinephrine Reuptake Inhibitors (SNRIS) $124,325.87 268 $463.90
9 Norepinephrine and Dopamine Reuptake Inhibitors (NDRIS) $99,284.91 582 $170.59
10 Anti-Anxiety Drugs $51,835.76 1,094 $47.38 * The table shows the number of unique children for each drug type. Due to data quality issues, the drug quantities dispensed are not available. Drugs were categorized by GC3 therapeutic class code of valid National Drug Codes (NDCs) indicated on single drug encounter records. The amounts exclude any claims for compound drugs and the claims without valid NDCs, and represent approximately 99.2% of the total MCO drug expenditures presented in Tables 19 and 20. Examples of drug names for drug types are presented in Appendix V. Source: DPW FADS

- 46 -
Managed Care Service Profile (Continued) Table 24 presents the top 10 behavioral health drug types that were paid for MA children with disabilities in the Managed Care delivery system, the total MCO expenditures, and the number of unique children who received one of the top 10 behavioral health drugs, in the order of service record count.
• Treatment for Attention Deficit-Hyperactivity Disorder (ADHD)/ Narcolepsy was the behavioral health drug type with the highest service record counts (43,149) for MA children with disabilities under the Managed Care delivery system in 2009.
• Treatment for Attention Deficit-Hyperactivity Disorder (ADHD)/
Narcolepsy was also the behavioral health drug type provided to the largest number of MA children with disabilities, 5,232, under the Managed Care delivery system in 2009.
Table 24: Managed Care Organization (MCO) Top 10 Behavioral Health Drug Types Paid for MA Children with Disabilities
by Service Record Count, Dates of Service 2009 (N=15,078)
Rank Drug Description
Service Record Count*
MCO Expenditure
Number of Unique
Children**
1 Treatment for Attention Deficit-Hyperactivity (ADHD)/Narcolepsy 43,149 $2,828,907.74 5,232
2 Anticonvulsants 35,226 $2,207,451.67 3,324
3 Antipsychotics, Atypical, Dopamine, & Serotonin Antagonists 27,967 $2,276,154.37 3,526
4 Selective Serotonin Reuptake Inhibitors (SSRIS) 27,747 $416,308.28 4,124
5 Adrenergics, Aromatic, Non-Catecholamine 21,597 $1,537,206.62 3,023
6 Treatment for Attention Deficit-Hyperactivity (ADHD), NRI-Type 11,929 $1,040,772.57 1,681
7 Antipsychotics, Atypical, D2 Partial Agonist/5HT Mixed 11,674 $2,257,428.78 1,825
8 Anti-Anxiety Drugs 4,501 $51,835.76 1,094
9 Anti-Mania Drugs 3,161 $46,279.11 425
10 Norepinephrine and Dopamine Reuptake Inhibitors (NDRIS) 3,131 $99,284.91 582
* Service Record Count is the count of encounter records provided by MCOs for each service category. ** The table shows the number of unique children for each drug type. Due to data quality issues, the drug quantities dispensed were not available. Drugs were categorized by GC3 therapeutic class code of valid National Drug Codes (NDCs) indicated on single drug encounter records. The amounts exclude any claims for compound drugs and the claims without valid NDCs, and represent approximately 99.2% of the total MCO drug expenditures presented in Tables 19 and 20. Examples of drug names for drug types are presented in Appendix V. Source: DPW FADS

- 47 -
APPENDIXES
APPENDIX I: TOP 10 DIAGNOSES OF MEDICAL ASSISTANCE ENROLLED CHILDREN WITH DISABILITIES BASED ON DISABILITY DIAGNOSIS
In the eligibility determination process, the Department refers potentially eligible children to a contracted Medical Review Team (MRT), which certifies the child’s disability based on the Social Security Administration’s (SSA) rules and regulations. If the child was receiving SSI at the time of MA application, however, it is assumed that the SSA has already verified the disability; therefore, no MRT disability diagnosis data are available. Valid diagnosis information was provided through MRT for 20,096 children who were eligible in 2009. This analysis was based on these 20,096 children with disability diagnosis information made available through MRT. Table A shows the ten most frequently reported diagnoses for the children with disabilities based on 2009 MRT. Tables B through E present the ten most frequently reported diagnoses for these children by age group.
Table A: Top 10 Diagnoses of MA Enrolled Children with Disabilities
Rank Diagnosis* Number of Children Percent**
1 Attention Deficit Hyperactivity Disorder 3,013 15.0%
2 Autistic Disorder and Other Pervasive Developmental Disorders 2,957 14.7%
3 Communication Impairment Associated with Documented Neurological Disorder 2,256 11.2%
4 Mood Disorders 2,200 10.9%
5 Organic Mental Disorders 1,347 6.7%
6 Category of Impairments, Impairments That Affect Multiple Body Systems 1,051 5.2%
7 Juvenile Diabetes Mellitus 775 3.9%
8 Anxiety Disorders 721 3.6%
9 Special Senses and Speech - Childhood 670 3.3%
10 Personality Disorders 627 3.1% * Diagnoses are based on the Disability Evaluation under Social Security. ** Percentages are based on 20,096 eligible children for whom the diagnoses information was available and provided for
the top ten diagnoses. Source: OIM

- 48 -
Table B: Top 10 Diagnoses of MA Enrolled Children with Disabilities Between the Ages of 0 and 5 Years Old
Rank Diagnosis* Number of Children Percent**
1 Communication Impairment Associated with Documented Neurological Disorder 1,343 22.2%
2 Autistic Disorder and Other Pervasive Developmental Disorders 1,023 16.9%
3 Category of Impairments, Impairments That Affect Multiple Body Systems 748 12.3%
4 Organic Mental Disorders 684 11.3%
5 Special Senses and Speech - Childhood 217 3.6%
6 Category of Impairments, Neurological 203 3.4%
7 Non-mosaic Down Syndrome 169 2.8%
8 Congenital Heart Disease 132 2.2%
9 Attention Deficit Hyperactivity Disorder 120 2.0%
10 Motor Dysfunction 111 1.8% * Diagnoses are based on the Disability Evaluation under Social Security. ** Percentages are based on 6,057 eligible children between the ages of 0 and 5 years old and provided for the top ten
diagnoses. Source: OIM
Table C: Top 10 Diagnoses of MA Enrolled Children with Disabilities Between the Ages of 6 and 12 Years Old
Rank Diagnosis*
Number of
Children Percent** 1 Attention Deficit Hyperactivity Disorder 1,884 23.2%
2 Autistic Disorder and Other Pervasive Developmental Disorders 1,521 18.7%
3 Communication Impairment Associated with Documented Neurological Disorder 838 10.3%
4 Organic Mental Disorders 466 5.7%
5 Mood Disorders 403 5.0%
6 Juvenile Diabetes Mellitus 386 4.8%
7 Anxiety Disorders 349 4.3%
8 Special Senses and Speech - Childhood 300 3.7%
9 Personality Disorders 290 3.6%
10 Category of Impairments, Impairments That Affect Multiple Body Systems 203 2.5%
* Diagnoses are based on the Disability Evaluation under Social Security. ** Percentages are based on 8,125 eligible children between the ages of 6 and 12 years old and provided for the top ten
diagnoses. Source: OIM

- 49 -
Table D: Top 10 Diagnoses of MA Enrolled Children with Disabilities Between the Ages of 13 and 17 Years Old
Rank Diagnosis* Number of Children Percent**
1 Mood Disorders 1,417 28.1%
2 Attention Deficit Hyperactivity Disorder 914 18.1%
3 Autistic Disorder and Other Pervasive Developmental Disorders 374 7.4%
4 Anxiety Disorders 290 5.8%
5 Juvenile Diabetes Mellitus 259 5.1%
6 Personality Disorders 233 4.6%
7 Organic Mental Disorders 172 3.4%
8 Special Senses and Speech - Childhood 134 2.7%
9 Category of Impairments, Impairments That Affect Multiple Body Systems 87 1.7%
10 Major Motor Seizure Disorder 79 1.6% * Diagnoses are based on the Disability Evaluation under Social Security. ** Percentages are based on 5,040 eligible children between the ages of 13 and 17 years old and provided for the top ten
diagnoses. Source: OIM
Table E: Top 10 Diagnoses of MA Enrolled Children with Disabilities Between the Ages of 18 and 20 Years Old
Rank Diagnosis* Number of Children Percent**
1 Mood Disorders 370 42.3%
2 Attention Deficit Hyperactivity Disorder 95 10.9%
3 Anxiety Disorders 52 5.9%
4 Juvenile Diabetes Mellitus 41 4.7%
5 Autistic Disorder and Other Pervasive Developmental Disorders 39 4.5%
6 Personality Disorders 30 3.4%
7 Organic Mental Disorders 25 2.9%
8 Special Senses and Speech - Childhood 19 2.2%
9 Category of Impairments, Impairments That Affect Multiple Body Systems 13 1.5%
10 Somatoform, Eating, and Tic Disorders 12 1.4% * Diagnoses are based on the Disability Evaluation under Social Security. ** Percentages are based on 874 eligible children between the ages of 18 and 20 years old and provided for the top ten
diagnoses. Source: OIM

- 50 -
APPENDIX II: TOP 25 DIAGNOSES OF MEDICAL ASSISTANCE ENROLLED CHILDREN WITH DISABILITIES BASED ON ICD-9 DIAGNOSIS SUBCATEGORY (4 DIGITS), 2009
Rank ICD-9 ICD-9 Diagnosis Category (4 Digits)
Number of
Unique Children Examples of the Most Prevalent Conditions
1 3140 Attention Deficit Disorders 9,289 Attention Deficit Disorder With Hyperactivity, Attention Deficit Disorder Without Hyperactivity
2 2998 Other Specified Pervasive Development Disorders 7,616 Asperger's Disorder, Atypical Childhood
Psychosis 3 462 Acute Pharyngitis 5,340 Viral Pharyngitis, Acute Sore Throat NOS
4 4659 Acute Upper Respiratory Infections of Unspecified Sites 5,264 Acute Upper Respiratory Infections
5 2990 Autistic Disorders 4,623 Childhood Autism, Infantile Psychosis, Kanner's Syndrome
6 4619 Acute Unspecified Sinusitis 3,525 Unspecified Acute Sinusitis
7 7834 Lack of Expected Normal Physiological Development in Childhood 3,080 Inadequate or Lack of Development, Late
Walker, Late Talker
8 0799 Unspecified Viral and Chlamydial Infections 3,028 Chlamydia Infections NOS, Viral Infections NOS
9 7862 Cough 2,704 Cough
10 3829 Unspecified Otitis Media 2,681 Unspecified Otitis Media Disorders
11 4939 Unspecified Asthma 2,619 Allergic and Asthmatic Bronchitis
12 3138 Other or Mixed Emotional Disturbances of Childhood/Adolescence 2,559 Oppositional Defiant Disorder, Pervasive
Opposition/Defiance of Authority 13 3671 Myopia 2,175 Near-sightedness
14 7806 Fever and Other Physiological Disturbances of Temperature Regulation
2,152 Chills With Fever, Fever of Unknown Origin, Hyperpyrexia NOS, Pyrexia NOS
15 3820 Acute Suppurative Otitis Media 2,091 Sudden, Severe Inflammation of Middle Ear With Pus
16 3159 Unspecified Delay in Development 2,030 Unspecified Developmental Disorders, Unspecified Learning Disorders
17 3153 Developmental Speech or Language Disorders 1,876
Dyslalia, Developmental Articulation Disorder, Phonological Disorder, Central Auditory Processing Disorder, Aphagia
18 3000 Anxiety States 1,856 Atypical Anxiety Disorder, Neurotic Anxiety State, Anxiety Reactions
19 2969 Other and Unspecified Episodic Mood Disorders 1,785 Mood Disorders NOS, Melancholia NOS,
Affective Psychosis NOS 20 4779 Cause Unspecified Allergic Rhinitis 1,774 Unspecified Allergic Rhinitis
21 7194 Pain in Joint 1,761 Pain in Lower Leg, Pain in Ankle and Foot, Pain in Pelvic Region and Thigh, Pain in Forearm
22 7890 Abdominal Pain 1,755 Abdominal Pain in Unspecified Site, Abdominal Cramps, Generalized Abdominal Pain
23 3891 Sensorineural Hearing Loss 1,683 Perceptive Hearing Loss or Deafness, Sensory and Neural Hearing Loss
24 311 Depressive Disorders NEC 1,573 Depressive Disorder or Depressive State NOS
25 7845 Other Speech Disturbances 1,468 Dysphasia, Slurred Speech, Speech Disturbance NOS

- 51 -
APPENDIX III: AVERAGE COST PER MEMBER PER MONTH (PMPM) CALCULATIONS
I: Total Average Cost per Member per Month (PMPM)
1. 15,390,583 total eligible days / 30.4 = 506,269.18 total eligible months 2. $612,737,256.62/ 506,269.18 total eligible months = $1,210.30
II: FFS Average Cost per Member per Month
1. 4,447,615 total eligible days / 30.4 = 146,303.13 total eligible months 2. $105,033,033.40/ 146,303.13 = $717.91
III: Managed Care Average Cost per Member per Month Physical Health
1. 10,942,968 total eligible days / 30.4 = 359,966.05 total eligible months 2. $277,309,522.01/ 359,966.05 total eligible months = $770.38
Behavioral Health 1. 14,397,542 total eligible days / 30.4 = 473,603.36 total eligible months 2. $230,394,701.21/ 473,603.36 total eligible months = $486.47

- 52 -
APPENDIX IV: DEFINITIONS OF SERVICE CATEGORIES AND CAPITATION PAYMENTS
SERVICE CATEGORIES Home and Community-Based Waiver – Supportive services provided to qualified individuals who wish to remain in their home and/or community rather than enter an institution, such as a nursing home or intermediate care facility. Hospice Services - Services that are reasonable and necessary for the palliation or management of the recipient’s terminal illness and related conditions. Inpatient Behavioral Health Services – Inpatient mental health and drug and alcohol services furnished by a public or private psychiatric hospital or unit, or a drug and alcohol rehabilitation hospital or unit. Inpatient Physical Health Services – Inpatient medical services furnished in an acute care general hospital or a rehabilitation hospital. Institutional Care Services – Inpatient services furnished by state intellectual disability centers and private intermediate care facilities for persons with intellectual disabilities or other related conditions. Individuals in public intermediate care facilities for those with intellectual disabilities and for other related conditions are excluded from managed care. Outpatient Behavioral Health Facility Services – Mental health outpatient services furnished by an outpatient psychiatric, drug and alcohol clinic, or psychiatric partial-hospitalization facility. Outpatient Behavioral Health Services – Outpatient therapeutic staff support, mobile therapy, mobile mental health treatment, peer support, crisis intervention or behavioral specialist consultant services furnished by psychiatrists, mental health/intellectual disability case managers, psychologists, family based mental health providers, licensed social workers, clinical social workers, and other behavioral health therapists. Includes Summer Therapeutic Activities Program. Outpatient Physical Health Facility Services – Physical health outpatient services furnished by an outpatient hospital clinic, as well as any services provided by short procedure unit, ambulatory surgical center, birth center, independent medical/surgical clinic, renal dialysis, family planning clinic, comprehensive outpatient rehabilitation facility, or all services of Rural Health Clinic and Federally Qualified Health Center except Behavioral Health Services. Outpatient Physical Health Services – Outpatient services furnished by a physician, dentist, podiatrist, chiropractor, optometrist, ambulance company, portable X-ray provider, home health agency, nurse midwife, occupational, physical or speech therapist, audiologist, certified registered nurse anesthetist,

- 53 -
certified registered nurse practitioner, MA case manager, nutritionist, smoking cessation provider, a medical supplier, laboratory, or certified rehabilitation agency. Pharmacy Services – Pharmaceutical products dispensed by a pharmacy, a dispensing physician, certified registered nurse practitioner, or Certified Nurse Midwife. Private Duty Nursing Services – Services furnished by a registered nurse or a licensed practical nurse employed by a home health agency or a nursing agency. Residential Treatment Facility Services – Mental health services furnished by a facility which provides comprehensive mental health treatment and/or substance abuse services for children with severe emotional disturbances, substance abuse or mental illness. School-Based Services – Medically necessary services that enable an MA-eligible child to participate in public education. Services, which are authorized on an Individual Education Plan, may be medical or mental-health related. These services are paid in the FFS delivery system only. Skilled Nursing Facility Services – Inpatient nursing home services furnished by state restoration centers, long term care units located at state mental hospitals, county nursing facilities and private nursing facilities.

- 54 -
CAPITATION PAYMENTS Behavioral Health Capitation Payment – Payments provided to each Behavioral Health Managed Care Organization (BH-MCO) on a per member per month basis. The amount of the capitation payments is negotiated with each contracted BH-MCO. Behavioral Health capitation payments include behavioral health pharmacy costs. Maternity Care Capitation Payment – Payments provided to Physical Health Managed Care Organization (PH-MCOs) for each trimester of a member’s pregnancy. Each capitation payment covers the cost of all services (e.g. prenatal check-ups, ultrasounds) provided during that trimester. Physical Health Capitation Payment – Payments provided to each Physical Health Managed Care Organization (PH-MCO) on a per member per month basis. The amount of the capitation payments is risk-adjusted and negotiated with each contracted PH-MCO. Physical Health capitation payments include physical health pharmacy costs.

- 55 -
APPENDIX V: EXAMPLES OF DRUGS BY DRUG TYPE (GC3) Drug Type Examples of Drugs
ABSORBABLE SULFONAMIDES SULFAME THOXAZOLE, SULFATRIM SUSPENSION
ADRENERGICS, AROMATIC, NON-CATECHOLAMINE ADDERALL, DEXTROAMP AMPHETAMINE, VYVANSE, AMPHETAMINE SALTS
ANALGESICS, NARCOTICS HYDROCODON-ACETAMINOPHEN, OXYCODONE-ACETAMINOPHEN, OXYCODONE HCL, ROXICET
ANTI-ANXIETY DRUGS BUSPIRONE HCL, DIAZEPAM, CLORAZEPATE, LORAZEPAM
ANTICONVULSANTS TRILEPTAL, LAMOTRIGENE, DIAZEPAM, KEPPRA, DIVALPROEX, DEPAKOTE
ANTIHEMOPHILIC FACTORS RECOMBINATE, ADVATE, KOGENATE, HELIXATE
ANTIHISTAMINES - 1ST GENERATION HYDROXYZINE, CYPROHEPTADINE, PROMETHAZINE, DIPHENHYDRAMINE
ANTIHISTAMINES - 2ND GENERATION CLARITIN, ZYRTEC, ALLEGRA, XYZAL, CLARINEX
ANTIHYPERTENSIVES, SYMPATHOLYTIC CLONIDINE, GUANFACINE, CATAPRES
ANTIPSYCHOTICS, ATYPICAL, D2 PARTIAL AGONIST/5HT MIXED ABILIFY
ANTIPSYCHOTICS, ATYPICAL, DOPAMINE & SEROTONIN ANTAGONISTS SEROQUEL, RISPERIDONE, GEODON, ZYPREXA
BETA-ADRENERGIC AGENTS VENTOLIN INHALER, PROAIR INHALER, ALBUTEROL, XOPENEX
BLOOD SUGAR DIAGNOSTICS ONE TOUCH ULTRA TEST STRIPS, CONTOUR TEST STRIPS, FREESTYLE TEST STRIPS, FREESTYLE LITE TEST STRIPS, ACCU-CHEK AVIVA TEST STRIPS, NOVA MAX GLUCOUSE TEST STRIPs
CEPHALOSPORINS - 3RD GENERATION CEFDINIR, SUPRAX
CONTRACEPTIVES, ORAL YAZ, LOESTRIN, TRI-SPRINTEC, OCELLA, ORTHO TRI-CYCLEN, AVIANE, LOW-OGESTREL
FLUORIDE PREPARATIONS SODIUM FLUORIDE, ETHEDENT, SF 5000 PLUS, FLUORITAB
GLUCOCORTICOIDS FLOVENT, PULMICORT, PREDNISOLONE, BUDESONIDE
GROWTH HORMONES NORDITROPIN, NUTROPIN, GENOTROPIN, SOMATROPIN
HISTAMINE H2-RECEPTOR INHIBITORS RANITIDINE, PEPCID, AXID, FAMOTIDINE, GASTER
INCONTINENCE SUPPLIES SIMPLICITY BRIEFS, HUGGIES, TENA CLASSIC BRIEFS, RA BRIEFS, PROTECTION PLUS UNDERWEAR
INSULINS HUMALOG, NOVOLOG, LANTUS, HUMULIN, LEVEMIR
LAXATIVES AND CATHARTICS POLYETHYLENE GLYCOL, SENNA SYRUP, MIRALAX, LACTULOSE, GLYCOLAX
LEUKOTRIENE RECEPTOR ANTAGONISTS SINGULAIR, ACCOLATE
MACROLIDES AZITHROMYCIN, ZITHROMAX, ERYTHROMYCIN
MUCOLYTICS PULMOZYME, ACETYLCYSTEINE
NASAL ANTI-INFLAMMATORY STEROIDS NASONEX, ADVAIR, FLONASE, FLOVENT, RHINOCORT AQUA NASAL SPRAY, VERAMYST
NOREPINEPHRINE AND DOPAMINE REUPTAKE INHIB (NDRIS) BUDEPRION, BUPROPION,
PANCREATIC ENZYMES CREON, ULTRASE, PANCRECARB
PEDIATRIC VITAMIN PREPARATIONS MULTI-VITAMIN FLOURIDE, POLY-VITAMIN FLOURIDE, TRI-VITAMIN FLOURIDE, SOURCECF
PENICILLINS AMOXICILLIN, AMOXICILLIN TR-K CLV, PENICILLIN VK
PROTON-PUMP INHIBITORS PREVACID, PRILOSEC, NEXIUM, OMEPRAZOLE

- 56 -
Drug Type Examples of Drugs SELECTIVE SEROTONIN REUPTAKE INHIBITORS (SSRIS) SERTRALINE, LEXAPRO, FLUOXITINE, CITALOPRAM
SEROTONIN-2 ANTAGONIST/REUPTAKE INHIBITORS (SARIS) TRAZODONE
SEROTONIN-NOREPINEPHRINE REUPTAKE-INHIB (SNRIS) EFFEXOR, CYMBALTA, VENLAFAXINE
THYROID HORMONES LEVOTHYROXINE, SYNTHROID, LEVOXYL
TOPICAL ANTI-INFLAMMATORY STEROIDAL HYDROCORTIZONE, TRIAMCINOLONE, MOMETASONE FUROATE, DESONIDE
TREATMENT FOR ATTENTION DEFICIT-HYPERACTIVITY (ADHD), NRI-TYPE STRATTERA
TREATMENT FOR ATTENTION DEFICIT-HYPERACTIVITY (ADHD)/NARCOLEPSY CONCERTA, FOCALIN, METHYLIN, METADATE
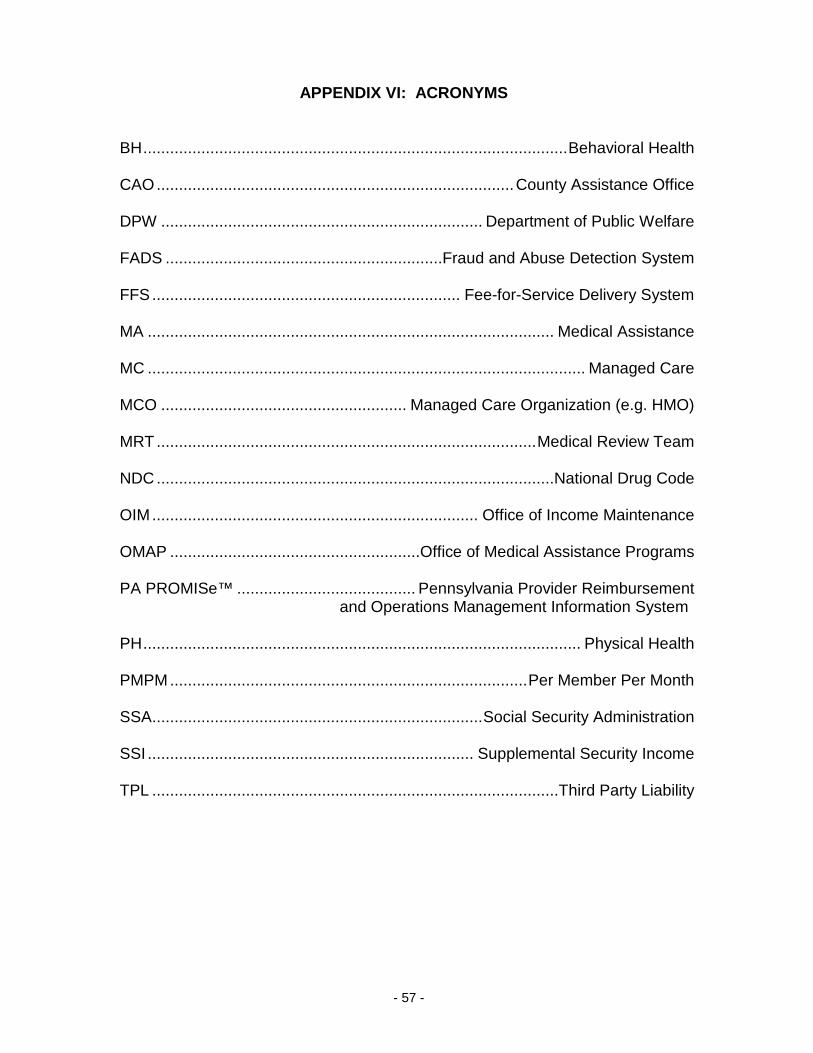
- 57 -
APPENDIX VI: ACRONYMS BH ............................................................................................... Behavioral Health CAO ................................................................................ County Assistance Office DPW ........................................................................ Department of Public Welfare FADS ..............................................................Fraud and Abuse Detection System FFS ..................................................................... Fee-for-Service Delivery System MA ........................................................................................... Medical Assistance MC .................................................................................................. Managed Care MCO ....................................................... Managed Care Organization (e.g. HMO) MRT ..................................................................................... Medical Review Team NDC .........................................................................................National Drug Code OIM ......................................................................... Office of Income Maintenance OMAP ........................................................Office of Medical Assistance Programs PA PROMISe™ ........................................ Pennsylvania Provider Reimbursement
and Operations Management Information System PH .................................................................................................. Physical Health PMPM ................................................................................ Per Member Per Month SSA .......................................................................... Social Security Administration SSI ......................................................................... Supplemental Security Income TPL ...........................................................................................Third Party Liability

ACKNOWLEDGEMENTS PENNSYLVANIA DEPARTMENT OF PUBLIC WELFARE Office of Medical Assistance Programs Bureau of Policy, Analysis and Planning DGS Annex Complex 116 East Azalea Drive Harrisburg, Pennsylvania 17110-3587 Office of Income Maintenance Bureau of Policy Health & Welfare Building, 4th Floor Harrisburg, Pennsylvania 17105