medicaid expansion in alaska and some related points … · evergreenecon.com medicaid expansion in...
TRANSCRIPT
EvergreenEcon.com
Medicaid Expansion in Alaska and Some Related Points to Ponder
March 19, 2015
Ted Helvoigt, Ph.D.
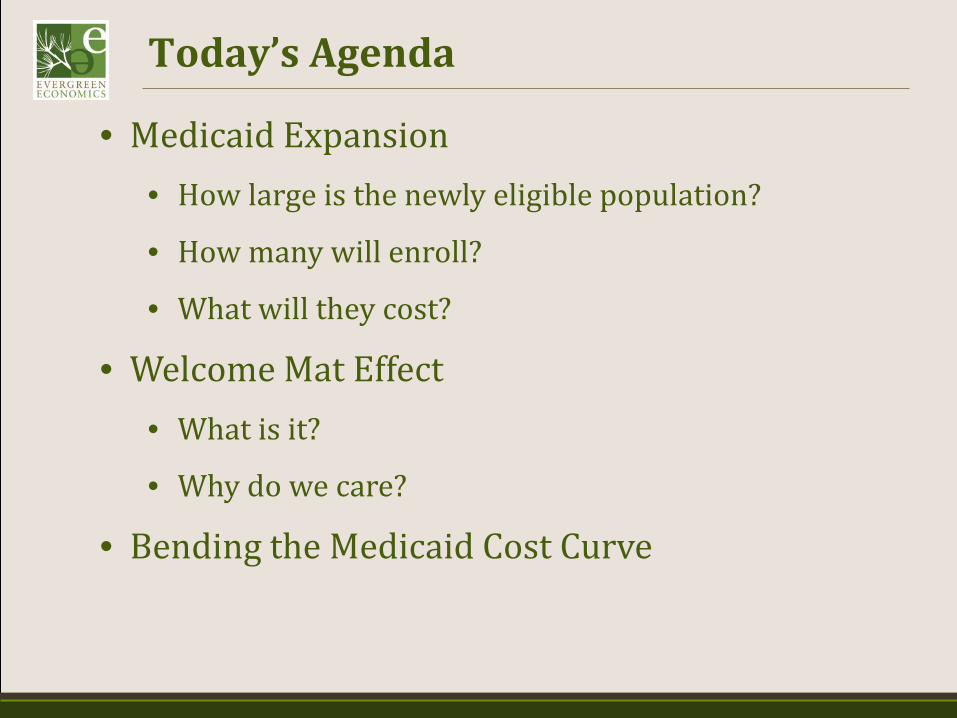
Today’s Agenda
• Medicaid Expansion • How large is the newly eligible population?
• How many will enroll?
• What will they cost?
• Welcome Mat Effect • What is it?
• Why do we care?
• Bending the Medicaid Cost Curve
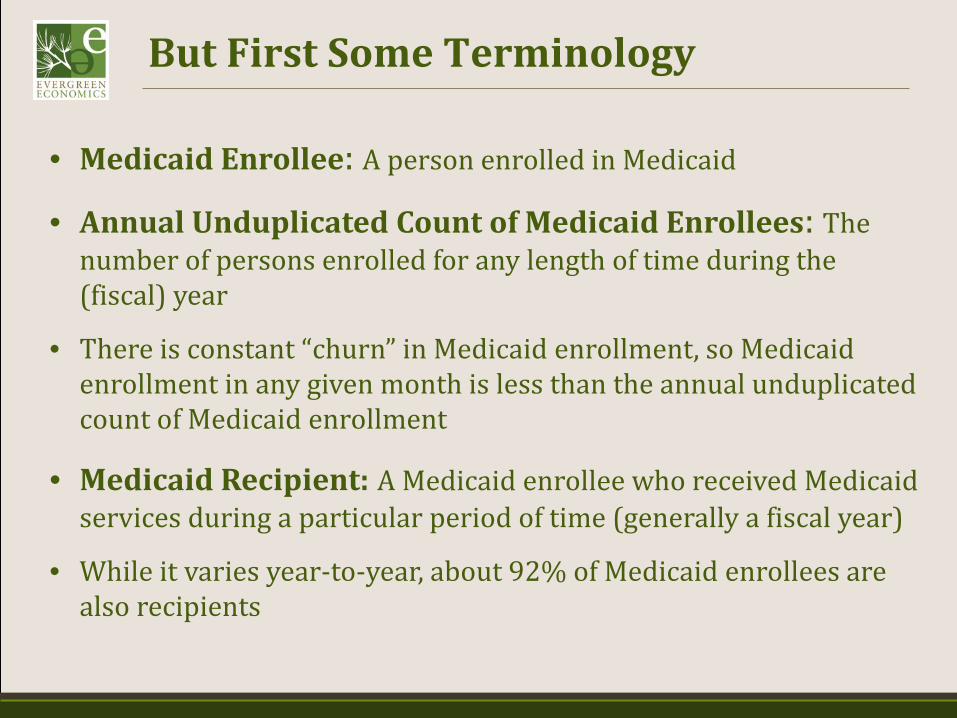
But First Some Terminology
• Medicaid Enrollee: A person enrolled in Medicaid
• Annual Unduplicated Count of Medicaid Enrollees: The number of persons enrolled for any length of time during the (fiscal) year
• There is constant “churn” in Medicaid enrollment, so Medicaid enrollment in any given month is less than the annual unduplicated count of Medicaid enrollment
• Medicaid Recipient: A Medicaid enrollee who received Medicaid services during a particular period of time (generally a fiscal year)
• While it varies year-to-year, about 92% of Medicaid enrollees are also recipients
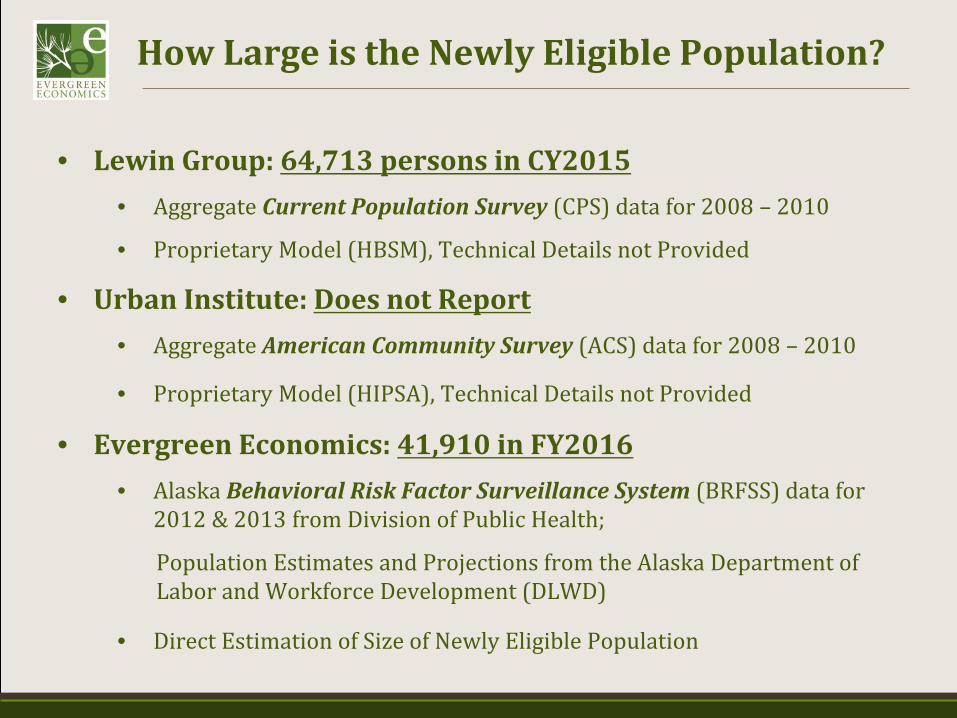
How Large is the Newly Eligible Population?
• Lewin Group: 64,713 persons in CY2015 • Aggregate Current Population Survey (CPS) data for 2008 – 2010
• Proprietary Model (HBSM), Technical Details not Provided
• Urban Institute: Does not Report • Aggregate American Community Survey (ACS) data for 2008 – 2010
• Proprietary Model (HIPSA), Technical Details not Provided
• Evergreen Economics: 41,910 in FY2016 • Alaska Behavioral Risk Factor Surveillance System (BRFSS) data for
2012 & 2013 from Division of Public Health;
Population Estimates and Projections from the Alaska Department of Labor and Workforce Development (DLWD)
• Direct Estimation of Size of Newly Eligible Population
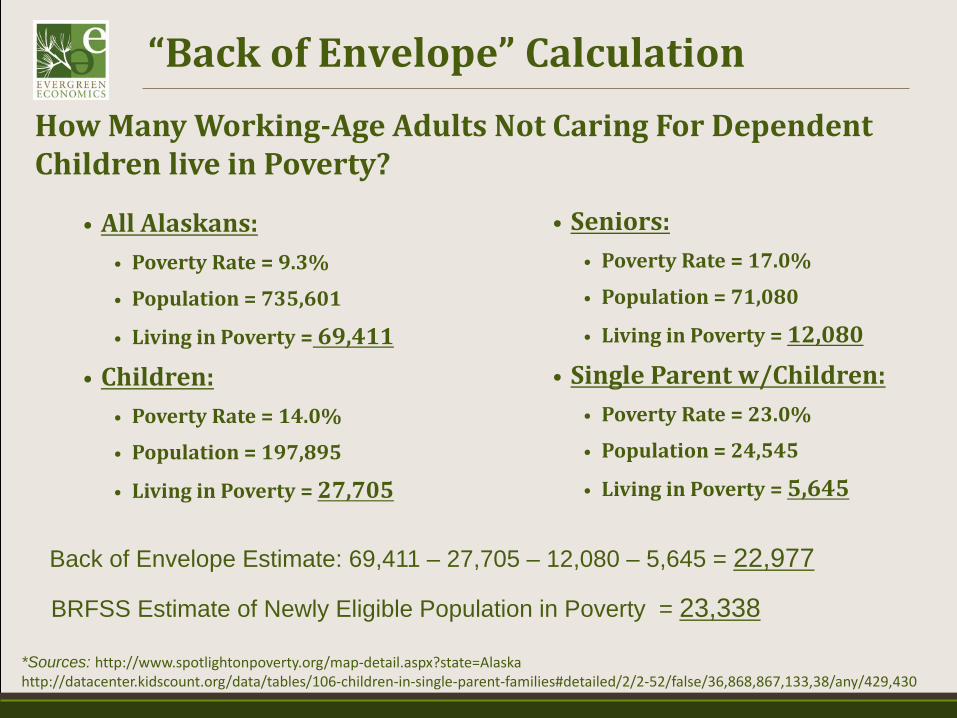
“Back of Envelope” Calculation How Many Working-Age Adults Not Caring For Dependent Children live in Poverty?
*Sources: http://www.spotlightonpoverty.org/map-detail.aspx?state=Alaska http://datacenter.kidscount.org/data/tables/106-children-in-single-parent-families#detailed/2/2-52/false/36,868,867,133,38/any/429,430
• All Alaskans: • Poverty Rate = 9.3%
• Population = 735,601
• Living in Poverty = 69,411
• Children: • Poverty Rate = 14.0%
• Population = 197,895
• Living in Poverty = 27,705
• Seniors: • Poverty Rate = 17.0%
• Population = 71,080
• Living in Poverty = 12,080
• Single Parent w/Children: • Poverty Rate = 23.0%
• Population = 24,545
• Living in Poverty = 5,645
Back of Envelope Estimate: 69,411 – 27,705 – 12,080 – 5,645 = 22,977
BRFSS Estimate of Newly Eligible Population in Poverty = 23,338
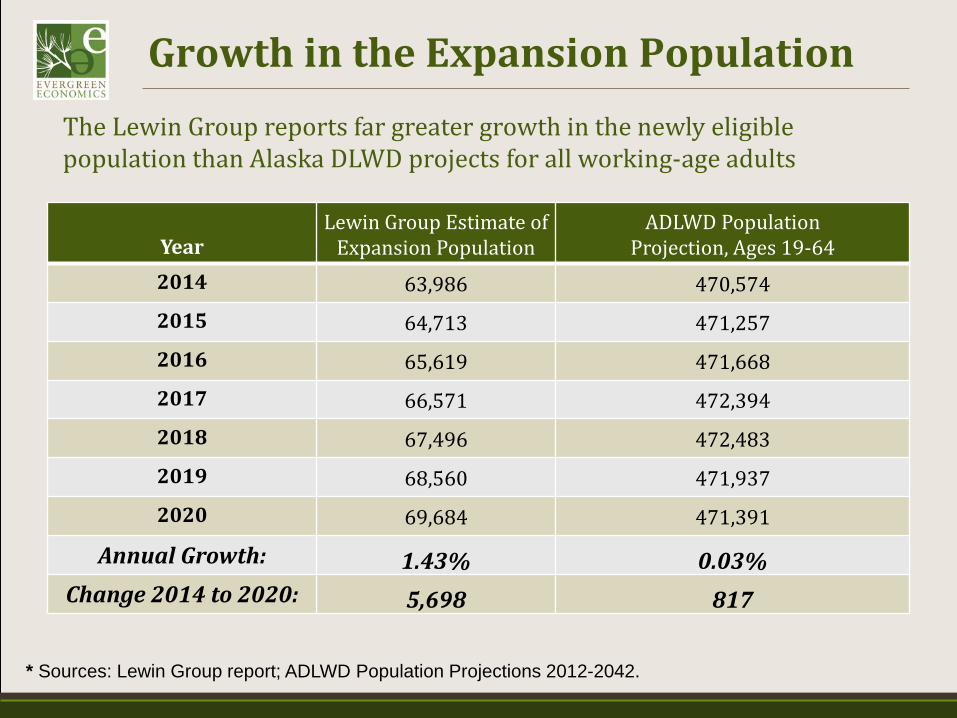
Growth in the Expansion Population
* Sources: Lewin Group report; ADLWD Population Projections 2012-2042.
Year
Lewin Group Estimate of Expansion Population
ADLWD Population Projection, Ages 19-64
2014 63,986 470,574
2015 64,713 471,257
2016 65,619 471,668
2017 66,571 472,394
2018 67,496 472,483
2019 68,560 471,937
2020 69,684 471,391
Annual Growth: 1.43% 0.03% Change 2014 to 2020: 5,698 817
The Lewin Group reports far greater growth in the newly eligible population than Alaska DLWD projects for all working-age adults
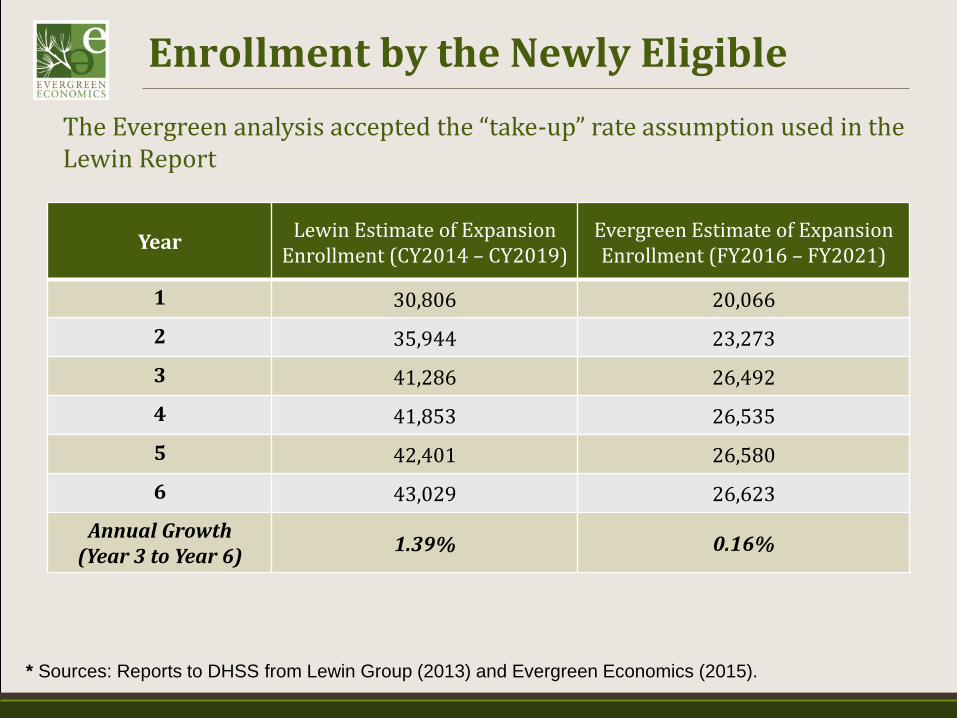
Enrollment by the Newly Eligible
* Sources: Reports to DHSS from Lewin Group (2013) and Evergreen Economics (2015).
Year Lewin Estimate of Expansion Enrollment (CY2014 – CY2019)
Evergreen Estimate of Expansion Enrollment (FY2016 – FY2021)
1 30,806 20,066
2 35,944 23,273
3 41,286 26,492
4 41,853 26,535
5 42,401 26,580
6 43,029 26,623
Annual Growth (Year 3 to Year 6) 1.39% 0.16%
The Evergreen analysis accepted the “take-up” rate assumption used in the Lewin Report
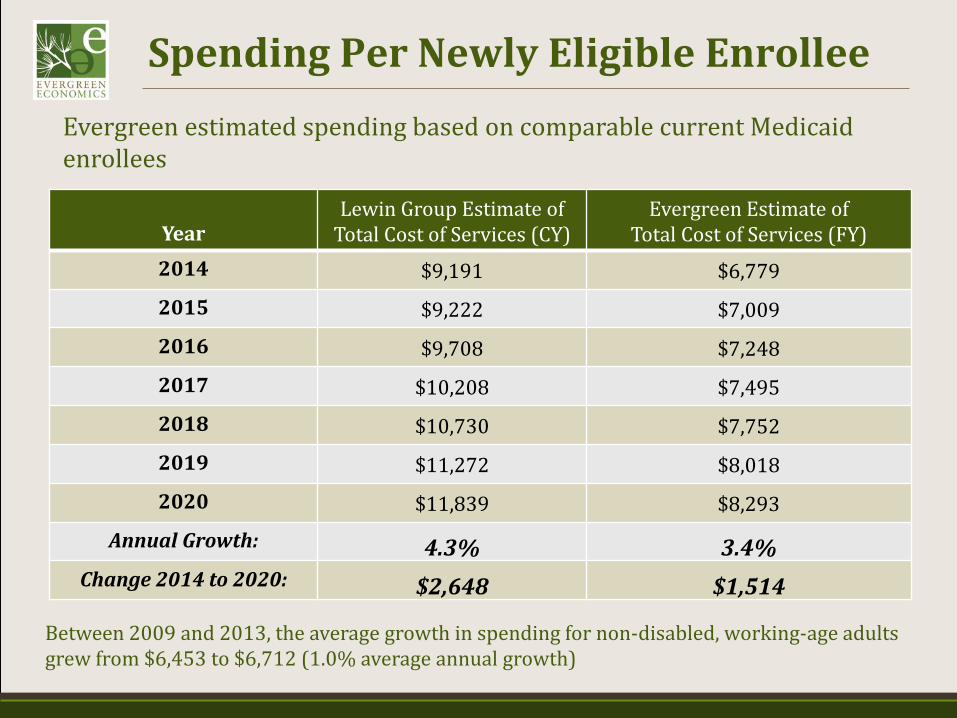
Spending Per Newly Eligible Enrollee
Year
Lewin Group Estimate of Total Cost of Services (CY)
Evergreen Estimate of Total Cost of Services (FY)
2014 $9,191 $6,779
2015 $9,222 $7,009
2016 $9,708 $7,248
2017 $10,208 $7,495
2018 $10,730 $7,752
2019 $11,272 $8,018
2020 $11,839 $8,293
Annual Growth: 4.3% 3.4% Change 2014 to 2020: $2,648 $1,514
Evergreen estimated spending based on comparable current Medicaid enrollees
Between 2009 and 2013, the average growth in spending for non-disabled, working-age adults grew from $6,453 to $6,712 (1.0% average annual growth)
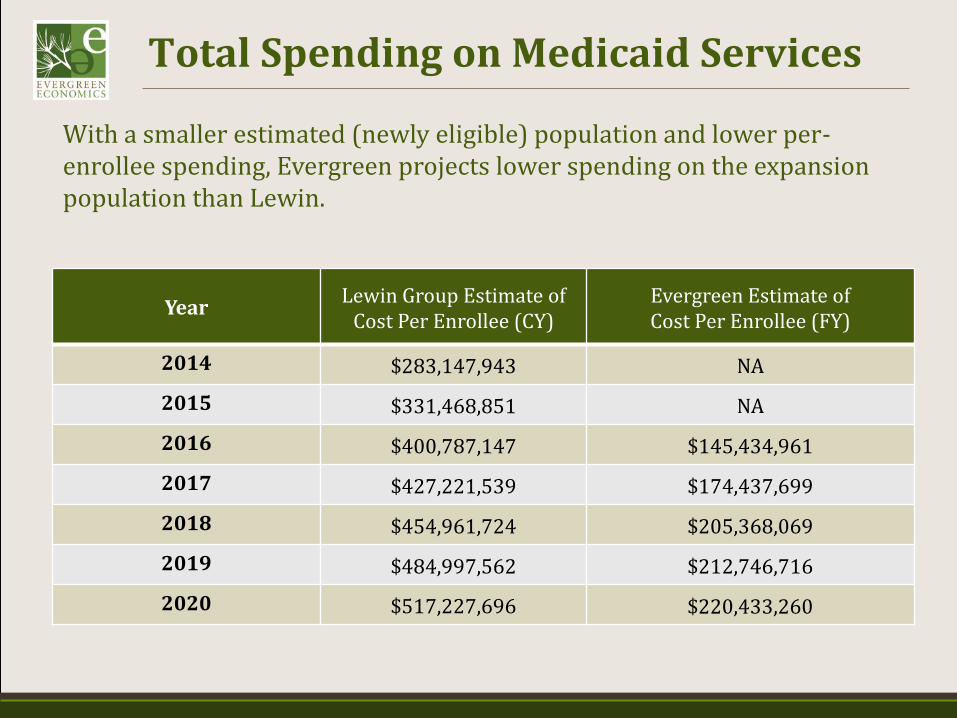
Total Spending on Medicaid Services
Year Lewin Group Estimate of Cost Per Enrollee (CY)
Evergreen Estimate of Cost Per Enrollee (FY)
2014 $283,147,943 NA
2015 $331,468,851 NA
2016 $400,787,147 $145,434,961
2017 $427,221,539 $174,437,699
2018 $454,961,724 $205,368,069
2019 $484,997,562 $212,746,716
2020 $517,227,696 $220,433,260
With a smaller estimated (newly eligible) population and lower per-enrollee spending, Evergreen projects lower spending on the expansion population than Lewin.
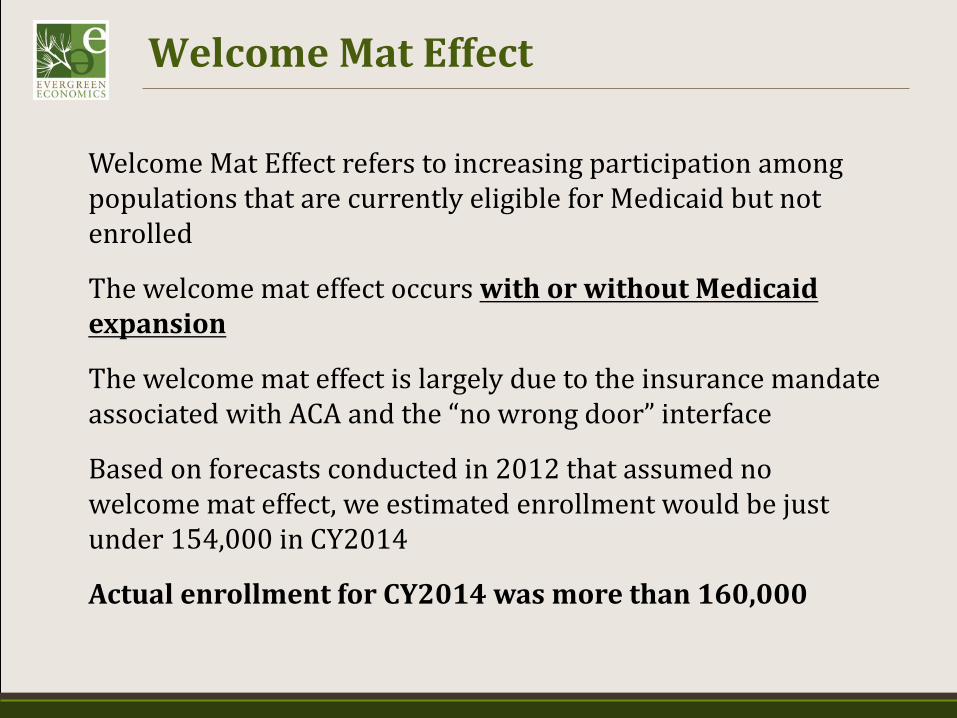
Welcome Mat Effect
Welcome Mat Effect refers to increasing participation among populations that are currently eligible for Medicaid but not enrolled
The welcome mat effect occurs with or without Medicaid expansion
The welcome mat effect is largely due to the insurance mandate associated with ACA and the “no wrong door” interface
Based on forecasts conducted in 2012 that assumed no welcome mat effect, we estimated enrollment would be just under 154,000 in CY2014
Actual enrollment for CY2014 was more than 160,000
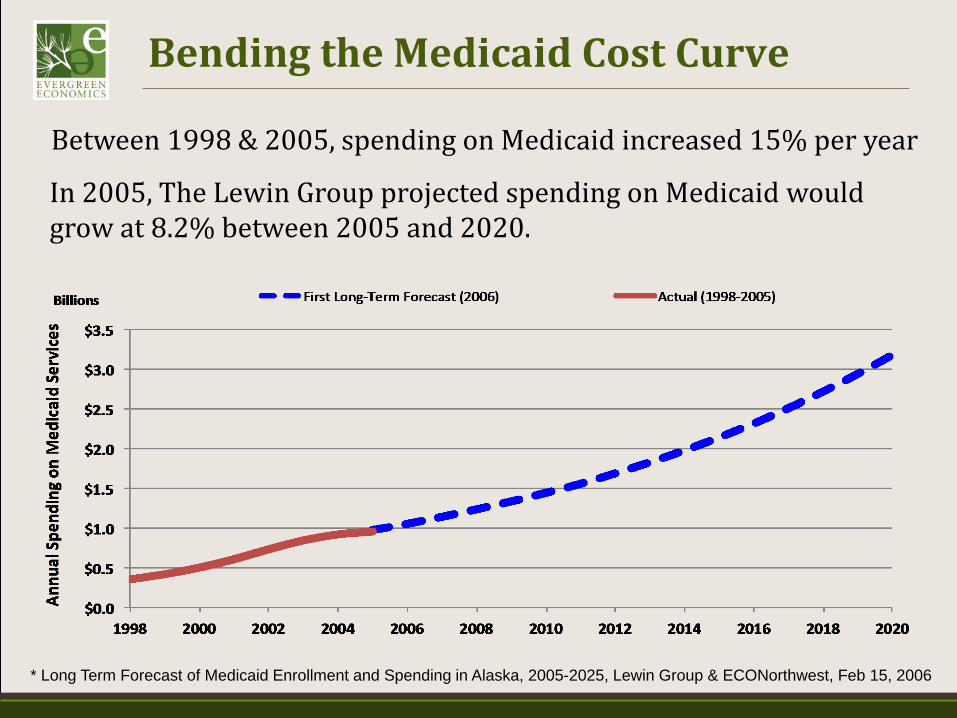
Bending the Medicaid Cost Curve
Between 1998 & 2005, spending on Medicaid increased 15% per year
In 2005, The Lewin Group projected spending on Medicaid would grow at 8.2% between 2005 and 2020.
* Long Term Forecast of Medicaid Enrollment and Spending in Alaska, 2005-2025, Lewin Group & ECONorthwest, Feb 15, 2006
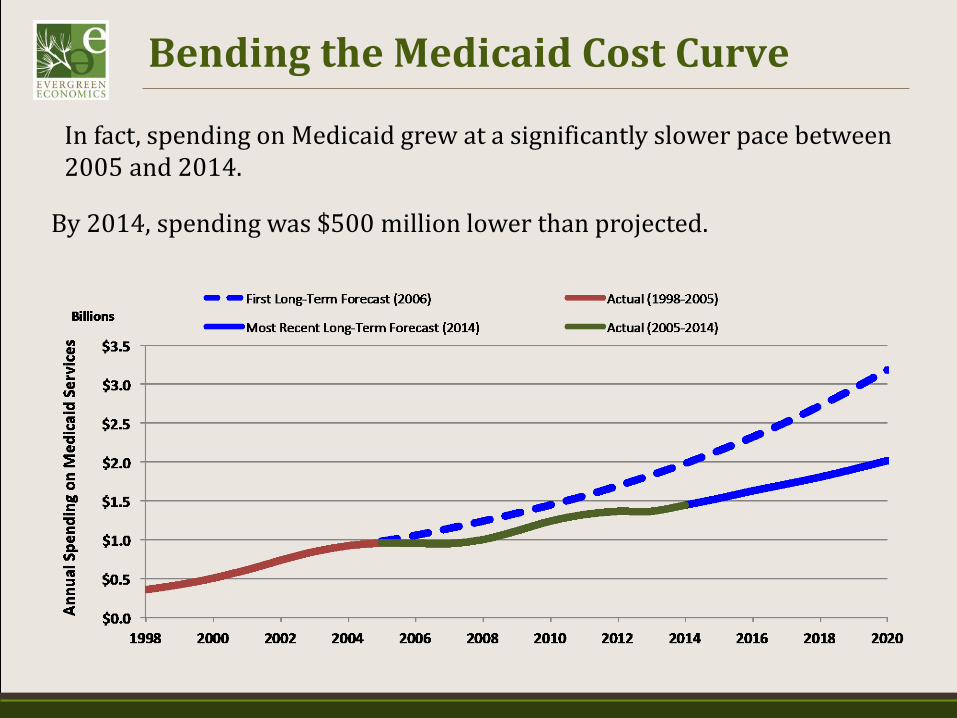
Bending the Medicaid Cost Curve
In fact, spending on Medicaid grew at a significantly slower pace between 2005 and 2014.
By 2014, spending was $500 million lower than projected.
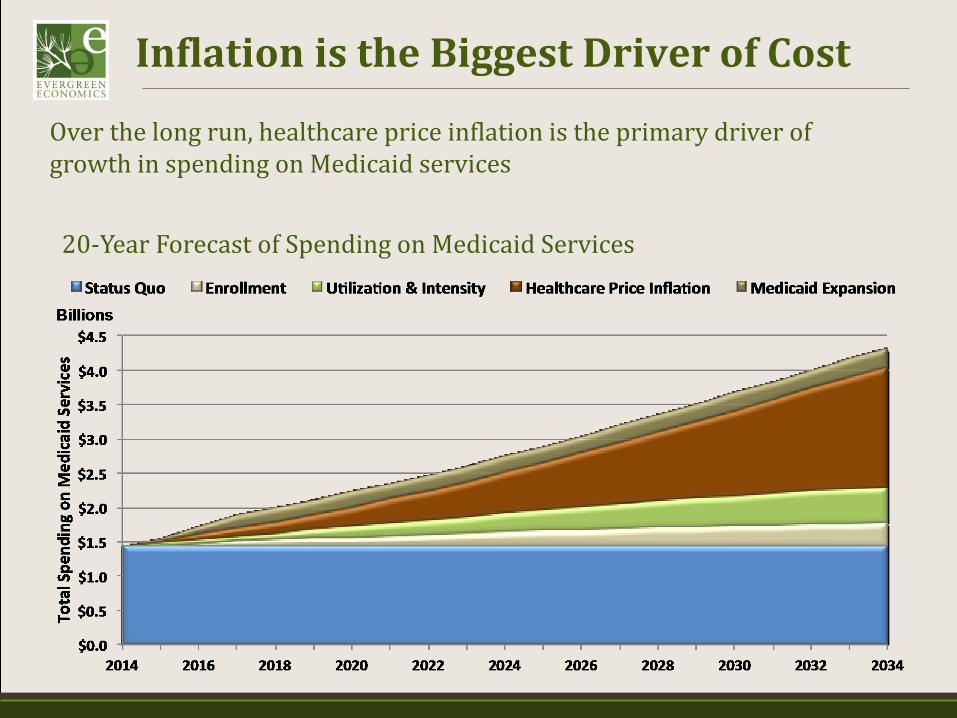
Inflation is the Biggest Driver of Cost
Over the long run, healthcare price inflation is the primary driver of growth in spending on Medicaid services
20-Year Forecast of Spending on Medicaid Services
Medicaid Expansion in Alaska
Ted Helvoigt, Ph.D. Evergreen Economics [email protected]
For more information, please contact:

Additional Slides
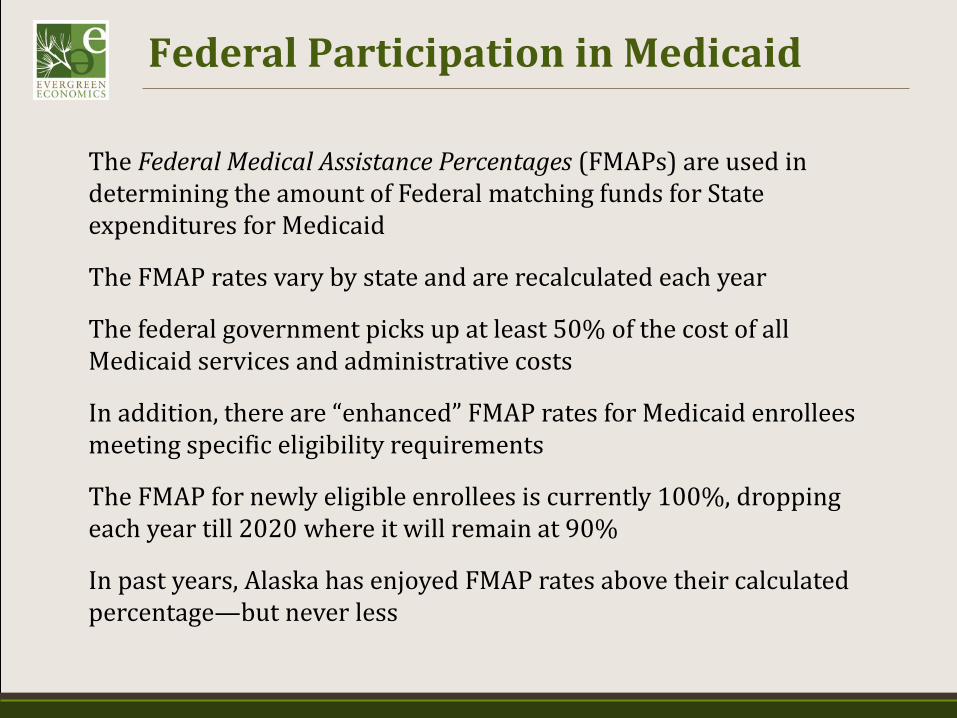
Federal Participation in Medicaid
The Federal Medical Assistance Percentages (FMAPs) are used in determining the amount of Federal matching funds for State expenditures for Medicaid
The FMAP rates vary by state and are recalculated each year
The federal government picks up at least 50% of the cost of all Medicaid services and administrative costs
In addition, there are “enhanced” FMAP rates for Medicaid enrollees meeting specific eligibility requirements
The FMAP for newly eligible enrollees is currently 100%, dropping each year till 2020 where it will remain at 90%
In past years, Alaska has enjoyed FMAP rates above their calculated percentage—but never less
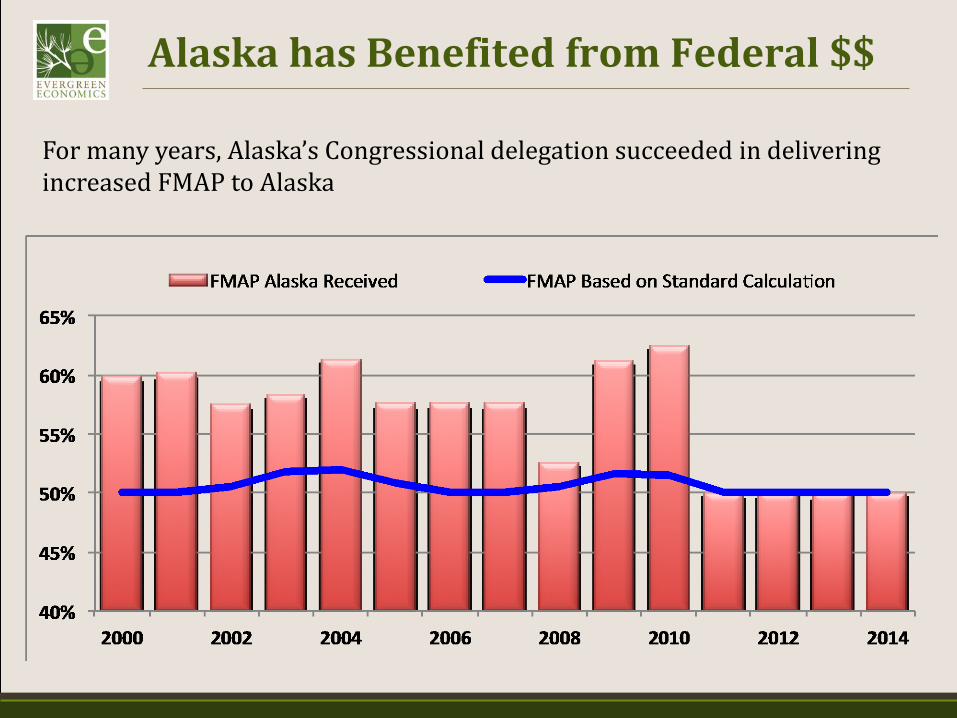
Alaska has Benefited from Federal $$
For many years, Alaska’s Congressional delegation succeeded in delivering increased FMAP to Alaska
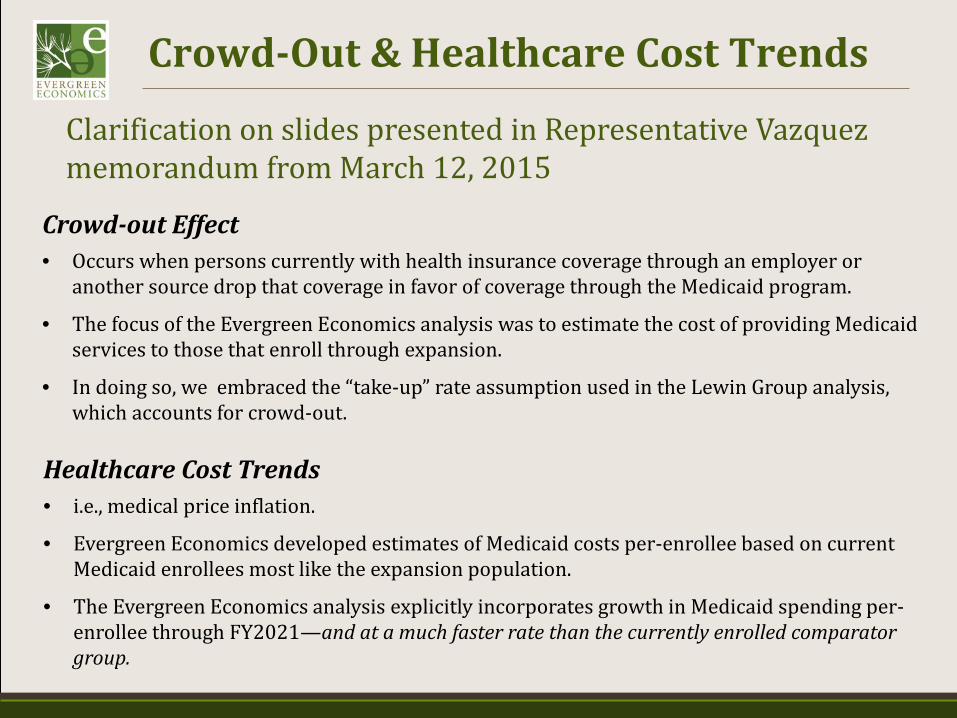
Crowd-Out & Healthcare Cost Trends
Clarification on slides presented in Representative Vazquez memorandum from March 12, 2015
Crowd-out Effect • Occurs when persons currently with health insurance coverage through an employer or
another source drop that coverage in favor of coverage through the Medicaid program.
• The focus of the Evergreen Economics analysis was to estimate the cost of providing Medicaid services to those that enroll through expansion.
• In doing so, we embraced the “take-up” rate assumption used in the Lewin Group analysis, which accounts for crowd-out.
Healthcare Cost Trends • i.e., medical price inflation.
• Evergreen Economics developed estimates of Medicaid costs per-enrollee based on current Medicaid enrollees most like the expansion population.
• The Evergreen Economics analysis explicitly incorporates growth in Medicaid spending per-enrollee through FY2021—and at a much faster rate than the currently enrolled comparator group.
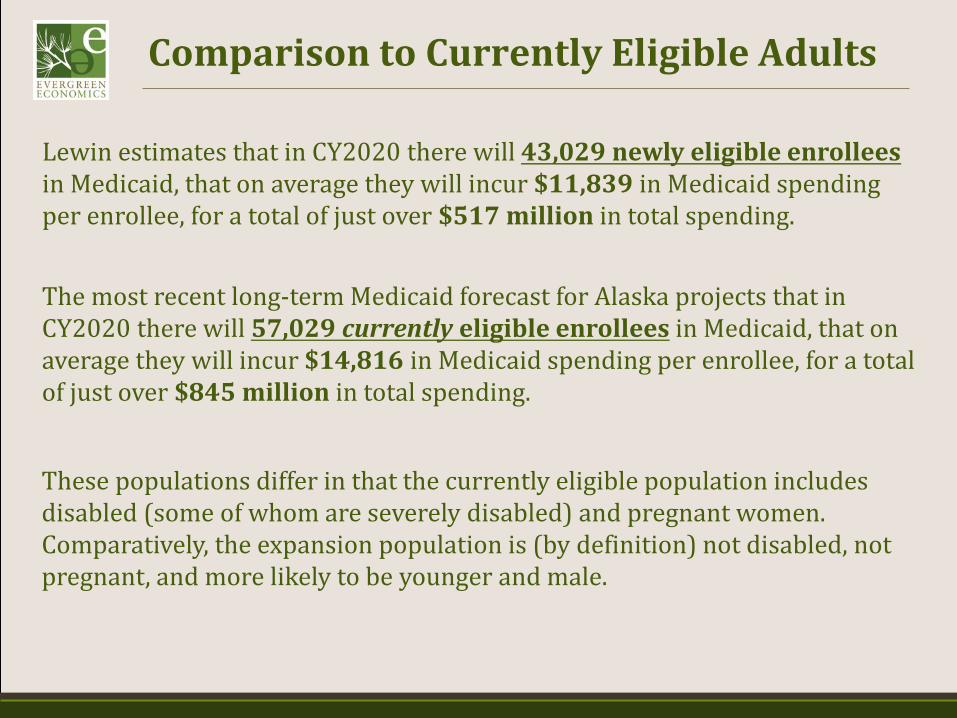
Comparison to Currently Eligible Adults
Lewin estimates that in CY2020 there will 43,029 newly eligible enrollees in Medicaid, that on average they will incur $11,839 in Medicaid spending per enrollee, for a total of just over $517 million in total spending.
The most recent long-term Medicaid forecast for Alaska projects that in CY2020 there will 57,029 currently eligible enrollees in Medicaid, that on average they will incur $14,816 in Medicaid spending per enrollee, for a total of just over $845 million in total spending.
These populations differ in that the currently eligible population includes disabled (some of whom are severely disabled) and pregnant women. Comparatively, the expansion population is (by definition) not disabled, not pregnant, and more likely to be younger and male.