median barrier guidelines for texas barrier guidelines for texas by roger bligh, ph.d., p.e....
TRANSCRIPT

Technical Report Documentation Page 1. Report No. FHWA/TX-06/0-4254-1
2. Government Accession No.
3. Recipient's Catalog No. 5. Report Date January 2006 Resubmitted: May 2006 Published: August 2006
4. Title and Subtitle MEDIAN BARRIER GUIDELINES FOR TEXAS
6. Performing Organization Code
7. Author(s) Roger Bligh, Shaw-Pin Miaou, Dominique Lord, and Scott Cooner
8. Performing Organization Report No. Report 0-4254-1 10. Work Unit No. (TRAIS)
9. Performing Organization Name and Address Texas Transportation Institute The Texas A&M University System College Station, Texas 77843-3135
11. Contract or Grant No. Project 0-4254 13. Type of Report and Period Covered Technical Report: March 2002 – January 2006
12. Sponsoring Agency Name and Address Texas Department of Transportation Research and Technology Implementation Office P.O. Box 5080 Austin, Texas 78763-5080
14. Sponsoring Agency Code
15. Supplementary Notes Project performed in cooperation with the Texas Department of Transportation and the Federal Highway Administration. Project Title: Evaluation of Median Barrier Guidelines URL: http://tti.tamu.edu/documents/0-4254-1.pdf 16. Abstract
Cross-median crashes are typically violent collisions with a high probability of multiple serious injuries and deaths. Previous research has shown that while cross-median crashes are not as common as other types of median-related crashes, they have a fatality rate that is disproportionately high. Many of these severe cross-median crashes can be prevented with adequate barrier protection. However, the decision of whether or not to use a median barrier should take into account the overall changes in the characteristics of median-related crashes that will result, including the frequency and severity of barrier impacts. There is a need for an analysis of the characteristics of median-related crashes and an investigation into the use of median barriers to identify changes to current standards, specifications, and procedures for median barrier need, selection, and placement that will result in the highest practical level of safety. Under this project, new guidelines were developed to assist highway engineers with the evaluation of median barrier need such that the highest practical level of median safety can be achieved. The recommended guidelines are based on analysis of median-related crashes in Texas. The crash data were used to develop crash statistical models for the various types of median-related crashes. Based on the estimates derived from the frequency and severity models and crash costs used by the Texas Department of Transportation (TxDOT), an economic analysis of median barrier need was performed. Guidelines for installing median barriers on divided, access-controlled freeways were developed as a function of average annual daily traffic (AADT) and median width. Guidance based on mean cross-median crash rate was also developed to assist engineers with evaluation of median barrier need on existing highway facilities. 17. Key Words Median Barrier, Cable Barrier, Benefit/Cost Analysis.
18. Distribution Statement No restrictions. This document is available to the public through NTIS: National Technical Information Service Springfield, Virginia 22161 http://www.ntis.gov
19. Security Classif.(of this report) Unclassified
20. Security Classif.(of this page) Unclassified
21. No. of Pages
106
22. Price
Form DOT F 1700.7 (8-72) Reproduction of completed page authorized


MEDIAN BARRIER GUIDELINES FOR TEXAS
by
Roger Bligh, Ph.D., P.E. Associate Research Engineer Texas Transportation Institute
Shaw-Pin Miaou, Ph.D.
Research Scientist Texas Transportation Institute
Dominique Lord, Ph.D., P.Eng.
Associate Research Scientist Texas Transportation Institute
and
Scott Cooner, P.E.
Associate Research Engineer Texas Transportation Institute
Report 0-4254-1 Project 0-4254
Project Title: Evaluation of Median Barrier Guidelines
Performed in cooperation with the Texas Department of Transportation
and the Federal Highway Administration
January 2006 Resubmitted: May 2006
TEXAS TRANSPORTATION INSTITUTE The Texas A&M University System College Station, Texas 77843-3135


v
DISCLAIMER
The contents of this report reflect the views of the authors, who are responsible for the facts and the accuracy of the data, and the opinions, findings, and conclusions presented herein. The contents do not necessarily reflect the official view or policies of the Texas Department of Transportation (TxDOT), Federal Highway Administration (FHWA), The Texas A&M University System, or the Texas Transportation Institute. This report does not constitute a standard, specification, or regulation, and its contents are not intended for construction, bidding, or permit purposes. In addition, the above listed agencies assume no liability for its contents or use thereof. The names of specific products or manufacturers listed herein do not imply endorsement of those products or manufacturers. The engineer in charge of this project was Roger P. Bligh, P.E. (Texas, #78550).
vi
ACKNOWLEDGMENTS
This research project was conducted under a cooperative program between the Texas Transportation Institute, the Texas Department of Transportation, and the Federal Highway Administration. The TxDOT project director for this research was Mr. William C. Riley, P.E. (FTW), and the project coordinator was Mr. Mark A. Marek, P.E. (DES). The authors acknowledge and appreciate their guidance and assistance.

vii
TABLE OF CONTENTS
Page LIST OF FIGURES ....................................................................................................................... ix LIST OF TABLES......................................................................................................................... xi CHAPTER 1. INTRODUCTION .................................................................................................. 1
BACKGROUND AND SIGNIFICANCE OF RESEARCH...................................................... 1 Discussion of Median Function .............................................................................................. 1
RESEARCH APPROACH ......................................................................................................... 2 REPORT ORGANIZATION...................................................................................................... 3
CHAPTER 2. STATE-OF-THE-PRACTICE LITERATURE REVIEW ..................................... 5
CURRENT PRACTICE IN TEXAS .......................................................................................... 5 TxDOT’s Roadway Design Manual ....................................................................................... 5 AASHTO Roadside Design Guide ......................................................................................... 7
CURRENT MEDIAN CRASH PROBLEM............................................................................... 8 The Texas Experience............................................................................................................. 8 Defining Median-Related Crashes.......................................................................................... 9 Cross-Median Crash Statistics in Texas ................................................................................. 9 Median-Barrier and Other Median-Related Crashes in Texas.............................................. 10
EXPERIENCES OF OTHER STATES.................................................................................... 11 California Department of Transportation Median Barrier Studies ....................................... 11 North Carolina Department of Transportation Median Barrier Studies ............................... 13
Preliminary Evaluation of Median Barrier Program......................................................... 13 Use of Cable Barrier ......................................................................................................... 15
NCHRP Project 17-14 “Improved Guidelines for Median Safety” ...................................... 15 Pennsylvania Department of Transportation ........................................................................ 16 Arizona and Missouri Departments of Transportation ......................................................... 17 NCHRP Project 22-12 “Guidelines for the Selection, Installation, and Maintenance of Highway Safety Features” ............................................................................................ 17
CHAPTER 3. EXPLORATORY ANALYSIS OF MEDIAN BARRIER CRASHES IN TEXAS ......................................................................................................... 19
INTRODUCTION .................................................................................................................... 19 DESCRIPTION OF VARIABLES........................................................................................... 19
Median-Related Crashes ....................................................................................................... 19 Possible Cross-Median Crashes............................................................................................ 20
CHARACTERISTICS OF MEDIAN CRASHES.................................................................... 20 Characteristics of Median-Related Crashes .......................................................................... 22 Characteristics of Cross-Median Crashes ............................................................................. 25
ANALYSIS OF VALIDATED CROSS-MEDIAN CRASHES............................................... 30 CHARACTERISTICS OF MEDIAN CRASHES IN DALLAS-FT. WORTH AREA ........... 34
viii
TABLE OF CONTENTS (CONTINUED)
Page CHAPTER 4. MEDIAN BARRIER TYPES AND PLACEMENT ISSUES.............................. 37
TESTING REQUIREMENTS.................................................................................................. 37 BARRIER CLASSIFICATION................................................................................................ 38 BARRIER SELECTION .......................................................................................................... 39
Concrete Barrier.................................................................................................................... 40 BARRIER PLACEMENT ........................................................................................................ 41
CHAPTER 5. STATISTICAL MODELING............................................................................... 45
CHARACTERISTICS OF INPUT DATA ............................................................................... 45 STATISTICAL MODELS........................................................................................................ 56
CHAPTER 6. ECONOMIC ANALYSIS .................................................................................... 69
BENEFIT/COST ANALYSIS.................................................................................................. 69 PRELIMINARY MEDIAN BARRIER DESIGN GUIDELINES ........................................... 77
CHAPTER 7. MEDIAN BARRIER GUIDELINES ................................................................... 81
RECOMMENDED GUIDELINES FOR TEXAS.................................................................... 81 EXISTING AASHTO AND STATE DOT GUIDELINES...................................................... 83
CHAPTER 8. CONCLUSIONS AND IMPLEMENTATION RECOMMENDATIONS .......... 87
SUMMARY AND CONCLUSIONS ....................................................................................... 87 IMPLEMENTATION RECOMMENDATIONS ..................................................................... 88
REFERENCES ............................................................................................................................. 91

ix
LIST OF FIGURES Figure Page Figure 2-1. Typical Freeway Section – Figure 3-12 from the Roadway Design Manual (4). ........ 6 Figure 2-2. Median Barrier Warrant from AASHTO Roadside Design Guide (1). ....................... 8 Figure 2-3. California Freeway Median Barrier Study Warrants (8)............................................ 12 Figure 3-1. Number of Median-Related Crashes per Year (1997–1999). .................................... 21 Figure 3-2. Number of Possible Cross-Median Crashes per Year (1997–1999). ......................... 22 Figure 3-3. Number of Median-Related Crashes by County (1997–1999). ................................. 23 Figure 3-4. Number of Median-Related Crashes
by TxDOT Administrative District (1997–1999). ................................................................ 24 Figure 3-5. Number of Possible Cross-Median Crashes by County (1997–1999). ...................... 26 Figure 3-6. Number of Possible Cross-Median Crashes by TxDOT Administrative District
(1997–1999).......................................................................................................................... 27 Figure 3-7. Number of Possible Cross-Median Crashes in Selected Counties
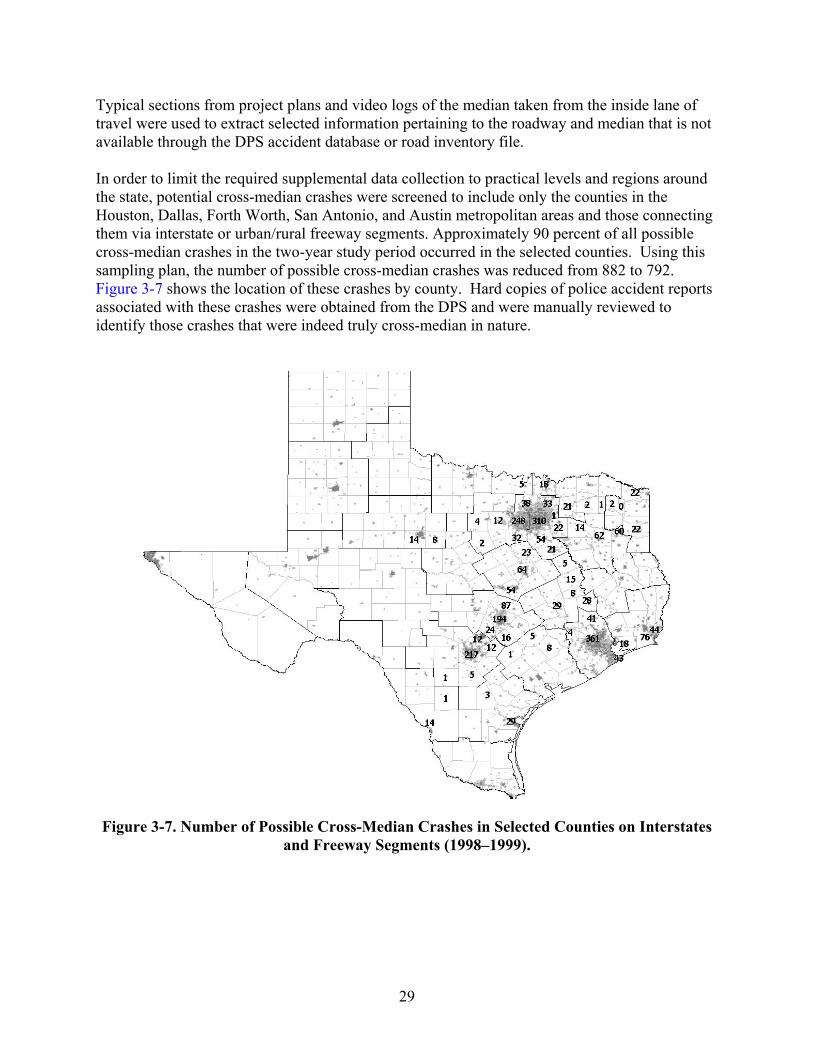
on Interstates and Freeway Segments (1998–1999). ............................................................ 29 Figure 3-8. Crashes by Type of Roadway Alignment (1998–1999)............................................. 31 Figure 3-9. Crashes by Type of Weather. ..................................................................................... 32 Figure 3-10. Number of Crashes by Time of Day. ....................................................................... 32 Figure 3-11. Number of Vehicles Involved in Cross-Median Collisions. .................................... 33 Figure 3-12. Number of Crashes by Median Width (Including Shoulders). ................................ 33 Figure 3-13. Number of Crashes by Speed Limit. ........................................................................ 34 Figure 4-1. Design Parameters for Vehicle Encroachments on Slopes (18)................................. 42 Figure 4-2. Typical Median Configurations. ................................................................................ 44 Figure 5-1. Anatomy of Traffic Crashes Involving the Median:
An Illustration (Not to Scale)................................................................................................ 46 Figure 5-2. Histograms and Bivariate Plots of Crash Frequencies, AADT,
Posted Speed Limit, Median Width, and Number of Lanes: Road Sections with No Median Barrier. ....................................................................................................... 50
Figure 5-3. Histograms and Bivariate Plots of Crash Frequencies, AADT, Posted Speed Limit, Median Width, and Number of Lanes: Road Sections with Median Barrier...................................................................................... 51
Figure 5-4. Distribution of Sampled Road Sections by Posted Speed.......................................... 52 Figure 5-5. Distribution of Sampled Road Sections by Number of Travel Lanes........................ 53 Figure 5-6. Distribution of Sampled Cross-Median Crashes (CMC) by Median Width. ............. 54 Figure 5-7. Estimated Number of Cross-Median Crashes per Mile per Year
on Sections with No Median Barrier – 2.5th Percentile Estimate. ....................................... 59 Figure 5-8. Estimated Number of Cross-Median Crashes per Mile per Year
on Sections with No Median Barrier – Mean Estimate. ....................................................... 59 Figure 5-9. Estimated Number of Cross-Median Crashes per Mile per Year
on Sections with No Median Barrier – 97.5th Percentile Estimate. ..................................... 60 Figure 5-10. Estimated Number of Median-Related Crashes per Mile per Year
on Sections with No Median Barrier – 2.5th Percentile Estimate. ....................................... 60 Figure 5-11. Estimated Number of Median-Related Crashes per Mile per Year
on Sections with No Median Barrier – Mean Estimate. ....................................................... 61
x
LIST OF FIGURES (CONTINUED) Figure Page Figure 5-12. Estimated Number of Median-Related Crashes per Mile per Year
on Sections with No Median Barrier – 97.5th Percentile Estimate. ..................................... 61 Figure 5-13. Estimated Number of Median-Related Crashes per Mile per Year
on Sections with a Median Barrier – 2.5th Percentile Estimate. .......................................... 63 Figure 5-14. Estimated Number of Median-Related Crashes per Mile per Year
on Sections with a Median Barrier – Mean Estimate. .......................................................... 63 Figure 5-15. Estimated Number of Median-Related Crashes per Mile per Year
on Sections with a Median Barrier – 97.5th Percentile Estimate. ........................................ 64 Figure 5-16. Estimated Number of Hit-Median-Barrier Crashes per Mile per Year
on Sections with a Median Barrier – 2.5th Percentile Estimate. .......................................... 64 Figure 5-17. Estimated Number of Hit-Median-Barrier Crashes per Mile per Year
on Sections with a Median Barrier – Mean Estimate. .......................................................... 65 Figure 5-18. Estimated Number of Hit-Median-Barrier Crashes per Mile per Year
on Sections with a Median Barrier – 97.5th Percentile Estimate. ........................................ 65 Figure 5-19. Estimated Probability for a Median-Related Crash to be a KAB Crash
on Sections with No Barriers: Mean Estimates. ................................................................... 67 Figure 5-20. Estimated Probability for a Median-Related Crash to be a KAB Crash
on Sections with Barriers: Mean Estimates. ......................................................................... 67 Figure 5-21. Estimated Probability for a Hit-Median-Barrier Crash
to be a KAB Crash: Mean Estimates. ................................................................................... 68 Figure 7-1. Graphical Summary of Existing Median Barrier Guidelines
from AASHTO and Selected State DOTs. ........................................................................... 85
xi
LIST OF TABLES Table Page Table 2-1. Number of Possible Cross-Median KAB Crashes from 1996 to 1998 in Texas. ........ 10 Table 2-2. Number of KAB Crashes on Main Lanes of 4+ Lane, Divided, On-system from 1996
to 1998 in Texas.................................................................................................................... 10 Table 2-3. Single-Vehicle Crashes in Texas by Object Struck..................................................... 11 Table 2-4. Fatalities on Phase I and II Median Barrier Projects in North Carolina...................... 14 Table 2-5. Preliminary Results for the Average North Carolina Median Barrier Project. ........... 14 Table 3-1. Crashes by Severity (1997–1999). .............................................................................. 21 Table 3-2. Number of Median-Related Crashes for Freeway, Expressway,
and Principal Arterial Roads (1997–1999). .......................................................................... 25 Table 3-3. Number of Median-Related Crashes for Freeway
and Expressway Only (1997–1999)...................................................................................... 25 Table 3-4. Number of Possible Cross-Median Crashes for Freeway, Expressway
and Principal Arterial Roads (1997–1999). .......................................................................... 28 Table 3-5. Number of Possible Cross-Median Crashes for Freeway
and Expressway Only (1997–1999)...................................................................................... 28 Table 3-6. Number of Cross-Median Crashes for the Selected Counties (1998–1999). ............. 30 Table 3-7. Number of Median-Related Crashes for Freeway, Expressway
and Principal Arterial Roads in Dallas and Tarrant Counties (1997–1999). ........................ 35 Table 3-8. Number of Median-Related Crashes for Freeway and Expressway
Only in Dallas and Tarrant Counties (1997–1999)............................................................... 35 Table 5-1. Center-Line Miles, Lane-Miles, and Overall Crash Rates by Median Type
and Crash Type: 1998–99, 52 Texas Counties, Interstate, Freeway, and Expressway........ 47 Table 5-2. Number and Distribution of Crashes by Severity........................................................ 47 Table 5-3. Summary Statistics of the Sample Road Sections....................................................... 48 Table 5-4. Estimates of Crash Costs for Cross-Median and Other Median-Related Crashes
by Median Type. ................................................................................................................... 55 Table 5-5. Posterior Mean and Standard Error of the Estimated Parameters
of Crash Frequency Models and Some Goodness-of-Fit Statistics. .................................... 58 Table 5-6. Posterior Mean and Standard Error of the Estimated Parameters
of Crash Severity Models and Some Goodness-of-Fit Statistics. ........................................ 66 Table 6-1. Main Assumptions Employed for the B/C Analysis. .................................................. 70 Table 6-2. Benefit/Cost Ratios for Installing Concrete Barriers: Mean Estimates....................... 71 Table 6-3. Marginal Changes in Benefit/Cost Ratios as Median-Width Increases by One Foot. 72 Table 6-4. Benefit/Cost Ratios for Installing Concrete Barriers: Low Estimates......................... 74 Table 6-5. Benefit/Cost Ratios for Installing High-Tension Cable Barriers: Mean Estimates..... 75 Table 6-6. Benefit/Cost Ratios for Installing High-Tension Cable Barriers: Low Estimates. ..... 76 Table 6-7. Benefit/Cost Ratios for Installing High-Tension Cable Barriers over Concrete
Barriers: Favorability. ........................................................................................................... 78 Table 6-8. A Potential Guideline for Installing Median Barriers – Based on a Priority Zone
Concept and Cross-Median Crash History (Five-Year Period). ........................................... 79 Table 7-1. Recommended Guideline for Installing Median Barriers on Texas Interstates and
Freeways. .............................................................................................................................. 82

1
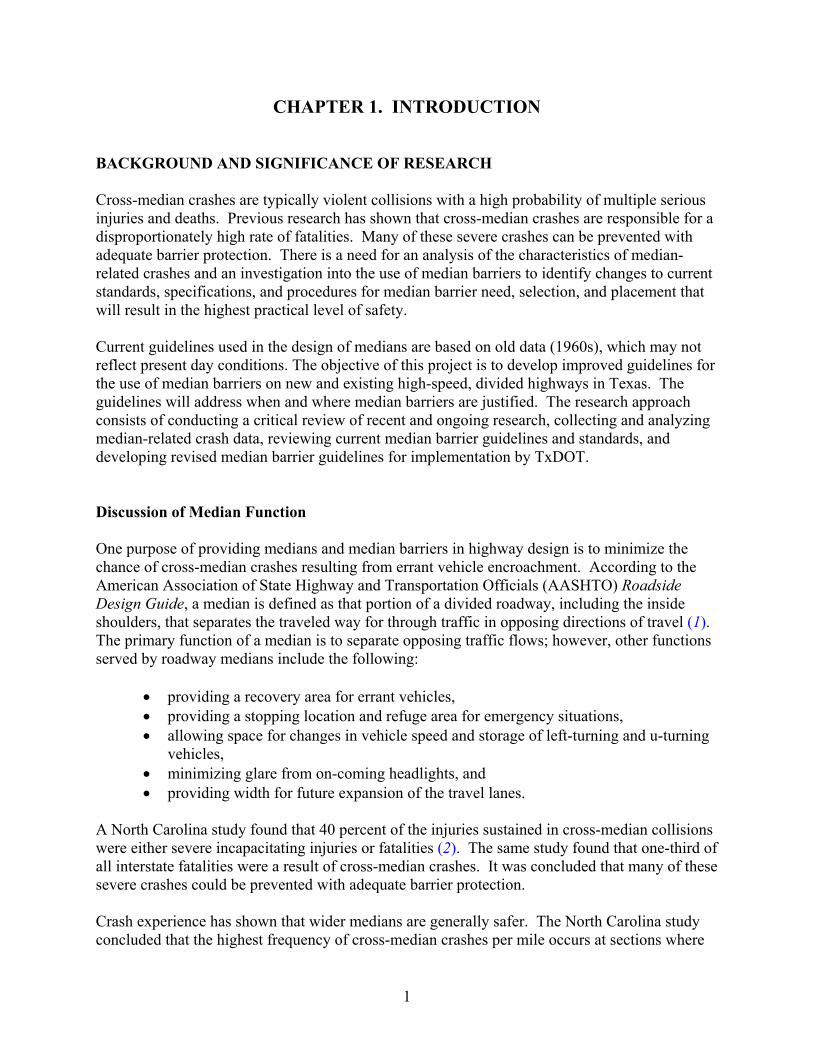
CHAPTER 1. INTRODUCTION BACKGROUND AND SIGNIFICANCE OF RESEARCH Cross-median crashes are typically violent collisions with a high probability of multiple serious injuries and deaths. Previous research has shown that cross-median crashes are responsible for a disproportionately high rate of fatalities. Many of these severe crashes can be prevented with adequate barrier protection. There is a need for an analysis of the characteristics of median-related crashes and an investigation into the use of median barriers to identify changes to current standards, specifications, and procedures for median barrier need, selection, and placement that will result in the highest practical level of safety. Current guidelines used in the design of medians are based on old data (1960s), which may not reflect present day conditions. The objective of this project is to develop improved guidelines for the use of median barriers on new and existing high-speed, divided highways in Texas. The guidelines will address when and where median barriers are justified. The research approach consists of conducting a critical review of recent and ongoing research, collecting and analyzing median-related crash data, reviewing current median barrier guidelines and standards, and developing revised median barrier guidelines for implementation by TxDOT. Discussion of Median Function One purpose of providing medians and median barriers in highway design is to minimize the chance of cross-median crashes resulting from errant vehicle encroachment. According to the American Association of State Highway and Transportation Officials (AASHTO) Roadside Design Guide, a median is defined as that portion of a divided roadway, including the inside shoulders, that separates the traveled way for through traffic in opposing directions of travel (1). The primary function of a median is to separate opposing traffic flows; however, other functions served by roadway medians include the following:
• providing a recovery area for errant vehicles, • providing a stopping location and refuge area for emergency situations, • allowing space for changes in vehicle speed and storage of left-turning and u-turning
vehicles, • minimizing glare from on-coming headlights, and • providing width for future expansion of the travel lanes.
A North Carolina study found that 40 percent of the injuries sustained in cross-median collisions were either severe incapacitating injuries or fatalities (2). The same study found that one-third of all interstate fatalities were a result of cross-median crashes. It was concluded that many of these severe crashes could be prevented with adequate barrier protection. Crash experience has shown that wider medians are generally safer. The North Carolina study concluded that the highest frequency of cross-median crashes per mile occurs at sections where
2
the median width is between 20 and 39 ft (2). However, some locations, despite median width, continue to have cross-median crashes. Several factors may affect historical trends upon which current median barrier guidelines are based. With increasing numbers of motorists traveling on the Texas highway system and decreased median widths resulting from widening projects, it should come as no surprise that the frequency of cross-median crashes is increasing. Further complicating the issue are a changing driving population, a changing vehicle fleet, and the increase in freeway speed limits to 65 or 70 mph. Several state studies have independently arrived at the conclusion that the construction of median barriers can be justified in wider medians than are indicated by current national guidelines contained in the AASHTO Roadside Design Guide (1). The California Department of Transportation (Caltrans) recently adopted a new freeway volume/median width warrant that addresses the need for median barriers for median widths up to 75 ft (3). Many research studies have been performed to investigate the effects of median width, median barrier, and median cross-slope on cross-median crashes and overall safety. For most divided highways, the median width is already established or constrained by right-of-way restrictions. Designers often consider narrowing the median to reduce the right-of-way required for widening projects. Such decisions can result in facilities with reduced median widths that do not require median barrier protection. This median width reduction results in an increased frequency of cross-median crashes. An analysis of the characteristics of median-related crashes and an investigation into the use of median barriers is needed to identify changes to current standards, specifications and procedures for median barrier need, selection, and placement that will result in the highest practical level of safety. It should be noted that the presence of a median barrier does not eliminate crashes occurring in medians but alters the character of those crashes. The construction of median barriers may actually result in an increase in total median crashes at a given location. However, a reasonable set of median barrier guidelines to help identify locations to be evaluated by an engineer for median barrier application should reduce the number of cross-median crashes. With a substantial reduction in cross-median crashes, the overall severity of median-related crashes can be significantly reduced. RESEARCH APPROACH The research team developed a work plan for this project based on the overall objective to develop improved guidelines for the use of median barriers on new and existing high-speed, divided highways in Texas. Based on this objective, the research approach consists of the following steps:
• conducting a critical review of recent research pertaining to median-related crashes; • identifying and collecting median-related crashes on Texas highways; • collecting supplemental roadway and median characteristic data; • analyzing the combined accident, traffic, roadway, and median data; • conducting a review of current median barrier guidelines and standards;

3
• developing revised median barrier guidelines for implementation by TxDOT; and • reporting the project findings, conclusions, and recommendations.
A key function of a median barrier is to prevent cross-median crashes. However, the installation of median barriers brings up the dilemma of related KAB crashes (i.e., K = fatal, A = incapacitating and B = nonincapacitating) that might otherwise not occur. This dilemma points out the key issue of this research project: when to install or not install a median barrier. If a median barrier is justified, what types of barriers should be considered and where in the median area should the barrier be installed? Two different analysis approaches were used for the guideline development. First, median barrier guidelines were developed based on a benefit/cost approach. The benefit/cost analysis requires determination of a typical project life, discount rate, direct cost of various treatment options (i.e., installation, maintenance, and repair costs of median barrier), and the benefits associated with those treatments. The benefits are typically defined as reductions in crash cost, which are a function of crash severity. Consideration was given to the total median-related crash picture including fatal, injury, and property damage only (PDO) crashes. The results of the benefit/cost analyses were used to formulate median barrier guidelines for divided freeways as a function of median width and average daily traffic (ADT). Second, guidelines based on median crossover crash history were developed. While current guidelines mention “accident history” as a justification for consideration of a median barrier, these guidelines provide no threshold or magnitude of cross-median crashes to aid in this decision-making process. The engineering clinical analysis provides guidance in regard to crash rates and site characteristics that warrant safety treatment of the median. REPORT ORGANIZATION This report is divided into eight chapters. Chapter 1 contains the background and significance of this research and the summary of the primary research approach. Chapter 2 (State-of-the-Practice Literature Review) documents the review of literature associated with median-related issues. This chapter concentrates on studies and ongoing activities that have significance to the overall project objective, particularly on other state departments’ of transportation policies that are proactive in median safety measures. Chapter 3 (Exploratory Analysis of Median Barrier Crashes in Texas) documents a preliminary exploratory analysis of the Texas crash data. The analysis was conducted to:
• understand the scope and magnitude of the cross-median crash problem across Texas, • examine available data sources, and • develop a sampling, data collection, and analysis plan in support of the development of
median barrier guidelines for Texas.
4
Chapter 4 (Median Barrier Types and Placement Issues) presents some basic information on the types of barriers used for median protection and the guidelines for their placement based on desired performance. Chapter 5 (Statistical Modeling) describes the characteristics of the predictive models developed for median crashes in Texas and summarizes the resulting relationships derived from the crash data. Chapter 6 (Economic Analysis) contains the results of the benefit/cost analysis and describes how these results were used in establishing improved median barrier guidelines. Chapter 7 (Median Barrier Guidelines) presents the guidelines for the application of median barrier on divided highways in Texas based on the findings from the benefit/cost and engineering analyses. Chapter 8 (Conclusions and Implementation Recommendations) provides conclusions and presents recommendations for implementing the median barrier guidelines derived from the research.

5
CHAPTER 2. STATE-OF-THE-PRACTICE LITERATURE REVIEW This chapter documents a review of recent literature and ongoing research pertaining to median-related crashes and median barrier guidelines in the United States. The literature review was used to evaluate different analysis methodologies and identify key variables that influence the need for median barrier protection. The literature review revealed that there are a significant number of published studies on median-related issues within the scope of this project. In the interest of being concise, researchers decided that the information contained in this report would concentrate on studies and ongoing activities that have significance to the overall project objective, particularly on other state departments’ of transportation policies that are proactive in median safety measures. Based on this focus, the remainder of this chapter is organized into the following subsections:
• current practice in Texas, • current median crash problem in Texas, and • experiences of other states.
CURRENT PRACTICE IN TEXAS TxDOT’s Roadway Design Manual According to TxDOT’s Roadway Design Manual (4), longitudinal concrete barriers are provided to prevent:
• “unlawful turns, • out-of-control vehicles from entering the opposing traffic lanes, and • in some cases unlawful crossing of medians by pedestrians.”
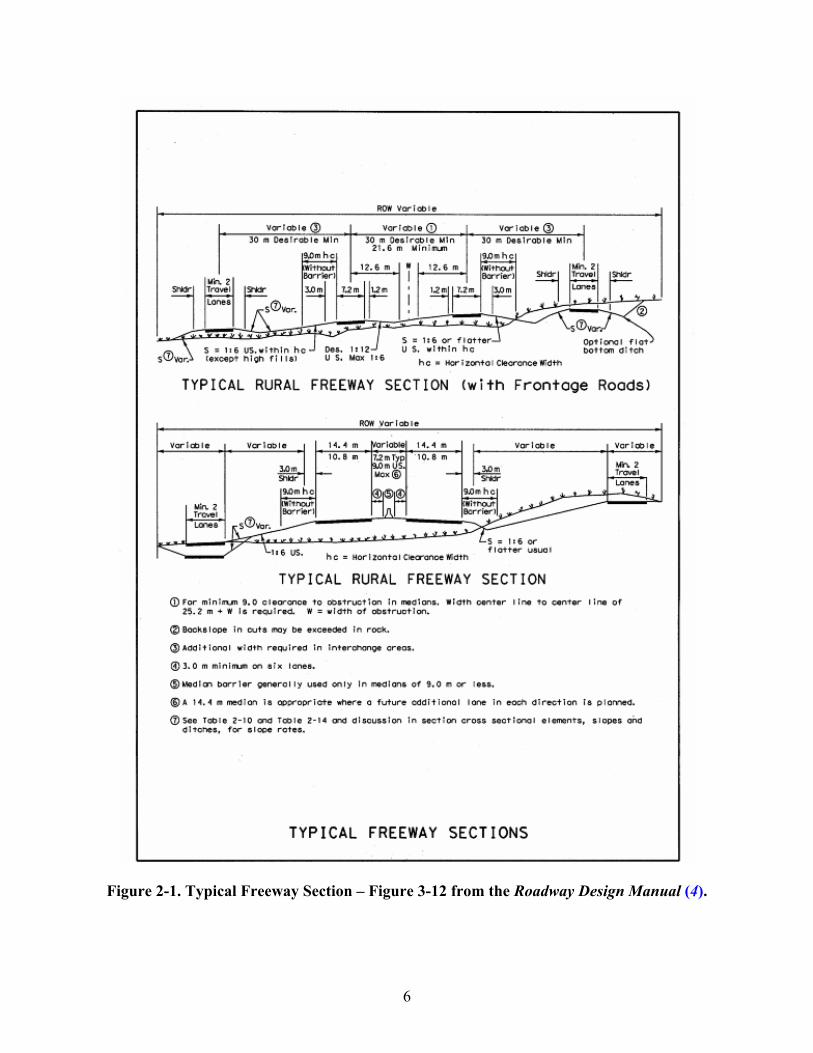
Guidance for median barriers is differentiated on the basis of access control and median width. Median barriers are generally provided for controlled access highways with median widths of 9 m (30 ft) or less. Median barriers may be provided for non-controlled access highways with similar medians, but their use should generally “be restricted to areas with potential safety concerns such as railroad separations or through areas where median constriction occurs.”(4) If justified through an operational analysis, median barriers may be provided for medians with widths greater than 9 m (30 ft). Typical freeway sections indicating median barrier placement for freeways with median widths less than or equal to 9 m (30 ft) are shown in Figure 2-1. Other uses for concrete median barriers include preventing vehicles from striking hazardous obstacles or encountering steep slopes. Guidance for this application would be derived from design charts and tables in Appendix A of the Roadway Design Manual (4). Other sections of the Roadway Design Manual (4) discuss design considerations for median barriers such as the potential for introducing a sight restriction on horizontal curves, the need for periodic openings
6
Figure 2-1. Typical Freeway Section – Figure 3-12 from the Roadway Design Manual (4).
7
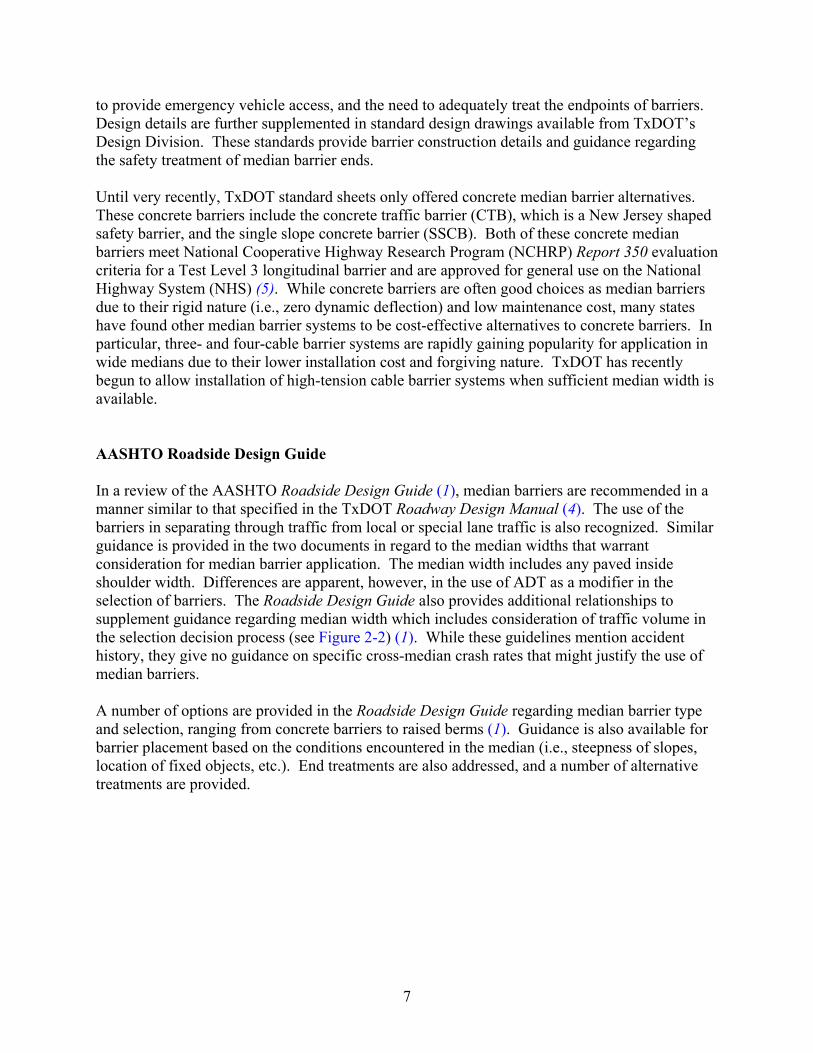
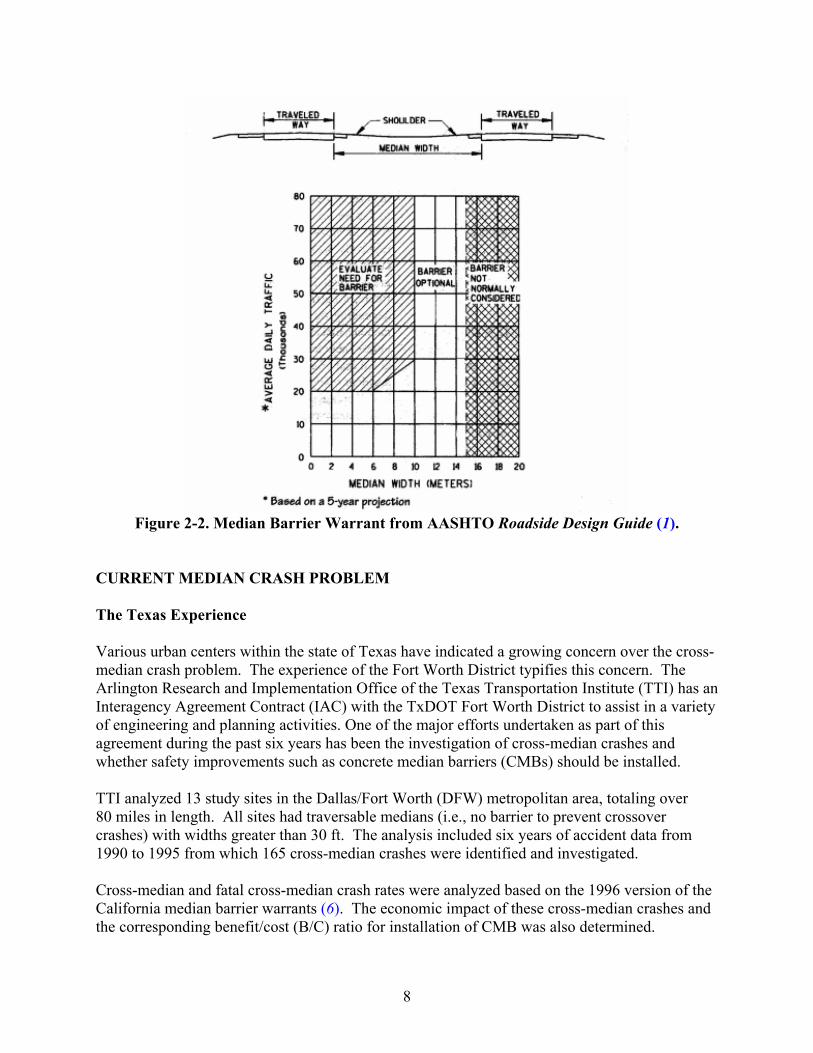
to provide emergency vehicle access, and the need to adequately treat the endpoints of barriers. Design details are further supplemented in standard design drawings available from TxDOT’s Design Division. These standards provide barrier construction details and guidance regarding the safety treatment of median barrier ends. Until very recently, TxDOT standard sheets only offered concrete median barrier alternatives. These concrete barriers include the concrete traffic barrier (CTB), which is a New Jersey shaped safety barrier, and the single slope concrete barrier (SSCB). Both of these concrete median barriers meet National Cooperative Highway Research Program (NCHRP) Report 350 evaluation criteria for a Test Level 3 longitudinal barrier and are approved for general use on the National Highway System (NHS) (5). While concrete barriers are often good choices as median barriers due to their rigid nature (i.e., zero dynamic deflection) and low maintenance cost, many states have found other median barrier systems to be cost-effective alternatives to concrete barriers. In particular, three- and four-cable barrier systems are rapidly gaining popularity for application in wide medians due to their lower installation cost and forgiving nature. TxDOT has recently begun to allow installation of high-tension cable barrier systems when sufficient median width is available. AASHTO Roadside Design Guide In a review of the AASHTO Roadside Design Guide (1), median barriers are recommended in a manner similar to that specified in the TxDOT Roadway Design Manual (4). The use of the barriers in separating through traffic from local or special lane traffic is also recognized. Similar guidance is provided in the two documents in regard to the median widths that warrant consideration for median barrier application. The median width includes any paved inside shoulder width. Differences are apparent, however, in the use of ADT as a modifier in the selection of barriers. The Roadside Design Guide also provides additional relationships to supplement guidance regarding median width which includes consideration of traffic volume in the selection decision process (see Figure 2-2) (1). While these guidelines mention accident history, they give no guidance on specific cross-median crash rates that might justify the use of median barriers. A number of options are provided in the Roadside Design Guide regarding median barrier type and selection, ranging from concrete barriers to raised berms (1). Guidance is also available for barrier placement based on the conditions encountered in the median (i.e., steepness of slopes, location of fixed objects, etc.). End treatments are also addressed, and a number of alternative treatments are provided.
8
Figure 2-2. Median Barrier Warrant from AASHTO Roadside Design Guide (1). CURRENT MEDIAN CRASH PROBLEM The Texas Experience Various urban centers within the state of Texas have indicated a growing concern over the cross-median crash problem. The experience of the Fort Worth District typifies this concern. The Arlington Research and Implementation Office of the Texas Transportation Institute (TTI) has an Interagency Agreement Contract (IAC) with the TxDOT Fort Worth District to assist in a variety of engineering and planning activities. One of the major efforts undertaken as part of this agreement during the past six years has been the investigation of cross-median crashes and whether safety improvements such as concrete median barriers (CMBs) should be installed. TTI analyzed 13 study sites in the Dallas/Fort Worth (DFW) metropolitan area, totaling over 80 miles in length. All sites had traversable medians (i.e., no barrier to prevent crossover crashes) with widths greater than 30 ft. The analysis included six years of accident data from 1990 to 1995 from which 165 cross-median crashes were identified and investigated. Cross-median and fatal cross-median crash rates were analyzed based on the 1996 version of the California median barrier warrants (6). The economic impact of these cross-median crashes and the corresponding benefit/cost (B/C) ratio for installation of CMB was also determined.

9
Defining Median-Related Crashes For the purpose of this study, median-related crashes were categorized into three types:
• Type 1: crashes that involve crossing the median (cross-median crashes); • Type 2: crashes that involve striking the median barrier (median-barrier crashes); and • Type 3: crashes reported to occur in the median that did not involve striking a median
barrier, regardless of whether median barriers were installed at the site or not (other median-related crashes).
Cross-median crashes occur when a vehicle crosses the median area of a divided roadway, enters the opposing traffic lanes, and then collides with vehicle(s) traveling in the opposing lanes. Additionally, the vehicle that crosses the median can cause vehicles in the opposing lanes to collide with each other or run off the road. Because relative vehicle speeds at the time of impact are high in head-on collisions, this type of crash is typically violent and results in multiple injuries and fatalities. For this reason, much research has focused on reducing the frequency of cross-median crashes. The fact that the presence of median barriers can change the characteristics of median crashes should not be overlooked, however. Depending on the type of barrier, its location, and the impact conditions, impacts with median barriers can be severe in their own right. Therefore, when developing median barrier guidelines, researchers must understand and consider the entire median accident picture. Cross-Median Crash Statistics in Texas In the current Texas Department of Public Safety (DPS) crash database, “cross-median” is not included as a crash type. Therefore, these crash records cannot be directly extracted from the database for analysis. To get some idea of the extent of the cross-median crash problem in Texas at the beginning of this project, cross-median crashes were roughly estimated from the DPS database using “non-intersection crashes that involved multiple vehicles and occurred on the main lanes of divided roadways with vehicles going straight and in opposite directions.” The resulting statistics for KAB crashes are shown in Table 2-1. For comparison, the number of KAB crashes on the main lanes of divided, on-system highways with four or more lanes were also obtained and are shown in Table 2-2.
10
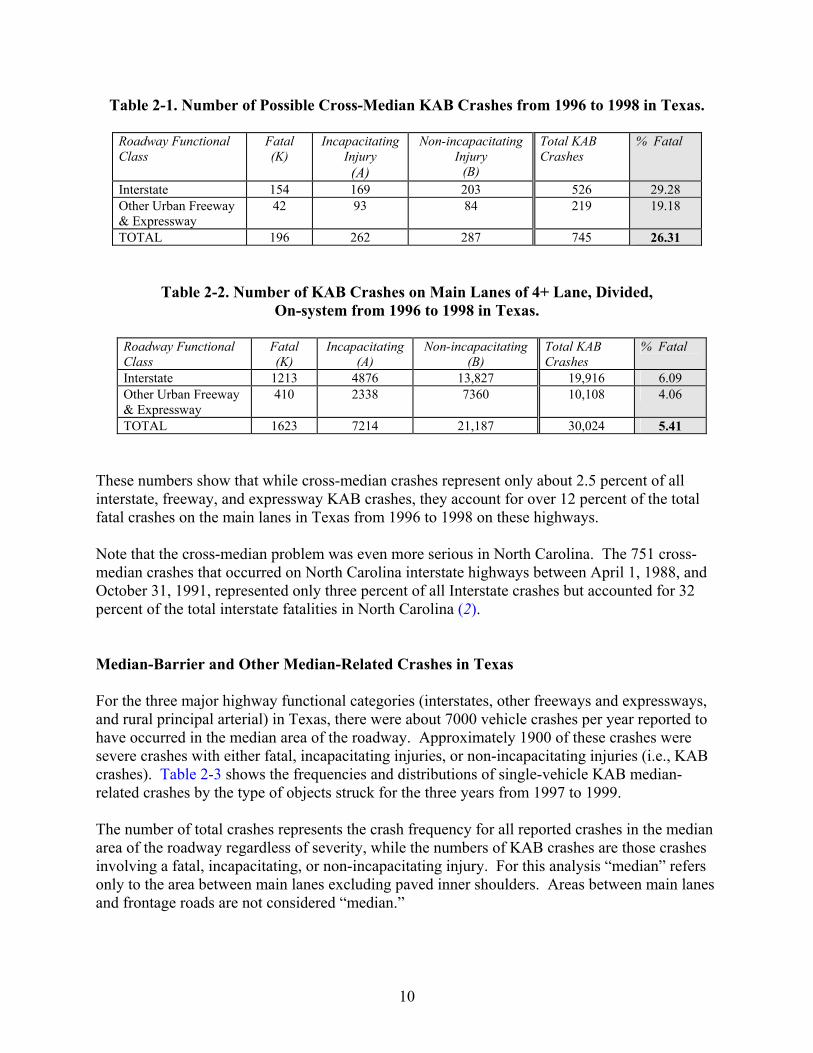
Table 2-1. Number of Possible Cross-Median KAB Crashes from 1996 to 1998 in Texas.
Roadway Functional Class
Fatal (K)
Incapacitating Injury (A)
Non-incapacitating Injury
(B)
Total KAB Crashes
% Fatal
Interstate 154 169 203 526 29.28 Other Urban Freeway & Expressway
42 93 84 219 19.18
TOTAL 196 262 287 745 26.31
Table 2-2. Number of KAB Crashes on Main Lanes of 4+ Lane, Divided, On-system from 1996 to 1998 in Texas.
Roadway Functional Class
Fatal (K)
Incapacitating (A)
Non-incapacitating (B)
Total KAB Crashes
% Fatal
Interstate 1213 4876 13,827 19,916 6.09 Other Urban Freeway & Expressway
410 2338 7360 10,108 4.06
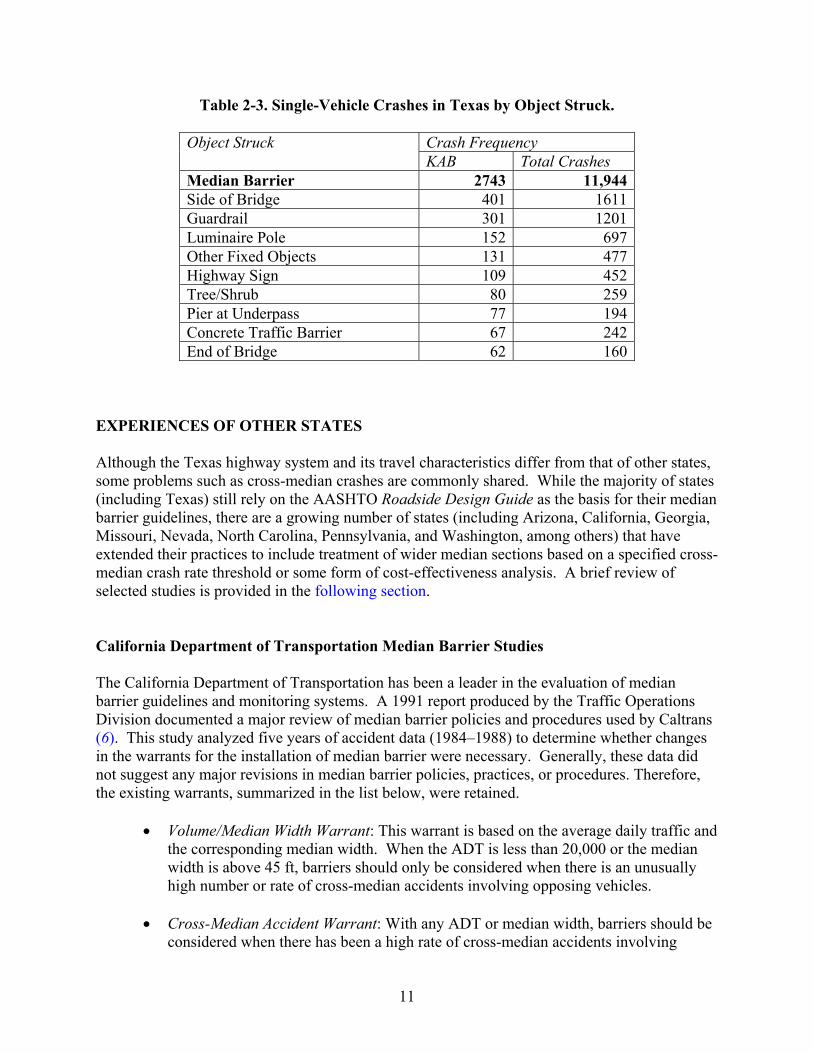
TOTAL 1623 7214 21,187 30,024 5.41 These numbers show that while cross-median crashes represent only about 2.5 percent of all interstate, freeway, and expressway KAB crashes, they account for over 12 percent of the total fatal crashes on the main lanes in Texas from 1996 to 1998 on these highways. Note that the cross-median problem was even more serious in North Carolina. The 751 cross-median crashes that occurred on North Carolina interstate highways between April 1, 1988, and October 31, 1991, represented only three percent of all Interstate crashes but accounted for 32 percent of the total interstate fatalities in North Carolina (2). Median-Barrier and Other Median-Related Crashes in Texas For the three major highway functional categories (interstates, other freeways and expressways, and rural principal arterial) in Texas, there were about 7000 vehicle crashes per year reported to have occurred in the median area of the roadway. Approximately 1900 of these crashes were severe crashes with either fatal, incapacitating injuries, or non-incapacitating injuries (i.e., KAB crashes). Table 2-3 shows the frequencies and distributions of single-vehicle KAB median-related crashes by the type of objects struck for the three years from 1997 to 1999. The number of total crashes represents the crash frequency for all reported crashes in the median area of the roadway regardless of severity, while the numbers of KAB crashes are those crashes involving a fatal, incapacitating, or non-incapacitating injury. For this analysis “median” refers only to the area between main lanes excluding paved inner shoulders. Areas between main lanes and frontage roads are not considered “median.”
11
Table 2-3. Single-Vehicle Crashes in Texas by Object Struck.
Crash Frequency Object Struck KAB Total Crashes
Median Barrier 2743 11,944 Side of Bridge 401 1611 Guardrail 301 1201 Luminaire Pole 152 697 Other Fixed Objects 131 477 Highway Sign 109 452 Tree/Shrub 80 259 Pier at Underpass 77 194 Concrete Traffic Barrier 67 242 End of Bridge 62 160
EXPERIENCES OF OTHER STATES Although the Texas highway system and its travel characteristics differ from that of other states, some problems such as cross-median crashes are commonly shared. While the majority of states (including Texas) still rely on the AASHTO Roadside Design Guide as the basis for their median barrier guidelines, there are a growing number of states (including Arizona, California, Georgia, Missouri, Nevada, North Carolina, Pennsylvania, and Washington, among others) that have extended their practices to include treatment of wider median sections based on a specified cross-median crash rate threshold or some form of cost-effectiveness analysis. A brief review of selected studies is provided in the following section. California Department of Transportation Median Barrier Studies The California Department of Transportation has been a leader in the evaluation of median barrier guidelines and monitoring systems. A 1991 report produced by the Traffic Operations Division documented a major review of median barrier policies and procedures used by Caltrans (6). This study analyzed five years of accident data (1984–1988) to determine whether changes in the warrants for the installation of median barrier were necessary. Generally, these data did not suggest any major revisions in median barrier policies, practices, or procedures. Therefore, the existing warrants, summarized in the list below, were retained.
• Volume/Median Width Warrant: This warrant is based on the average daily traffic and the corresponding median width. When the ADT is less than 20,000 or the median width is above 45 ft, barriers should only be considered when there is an unusually high number or rate of cross-median accidents involving opposing vehicles.
• Cross-Median Accident Warrant: With any ADT or median width, barriers should be
considered when there has been a high rate of cross-median accidents involving
12
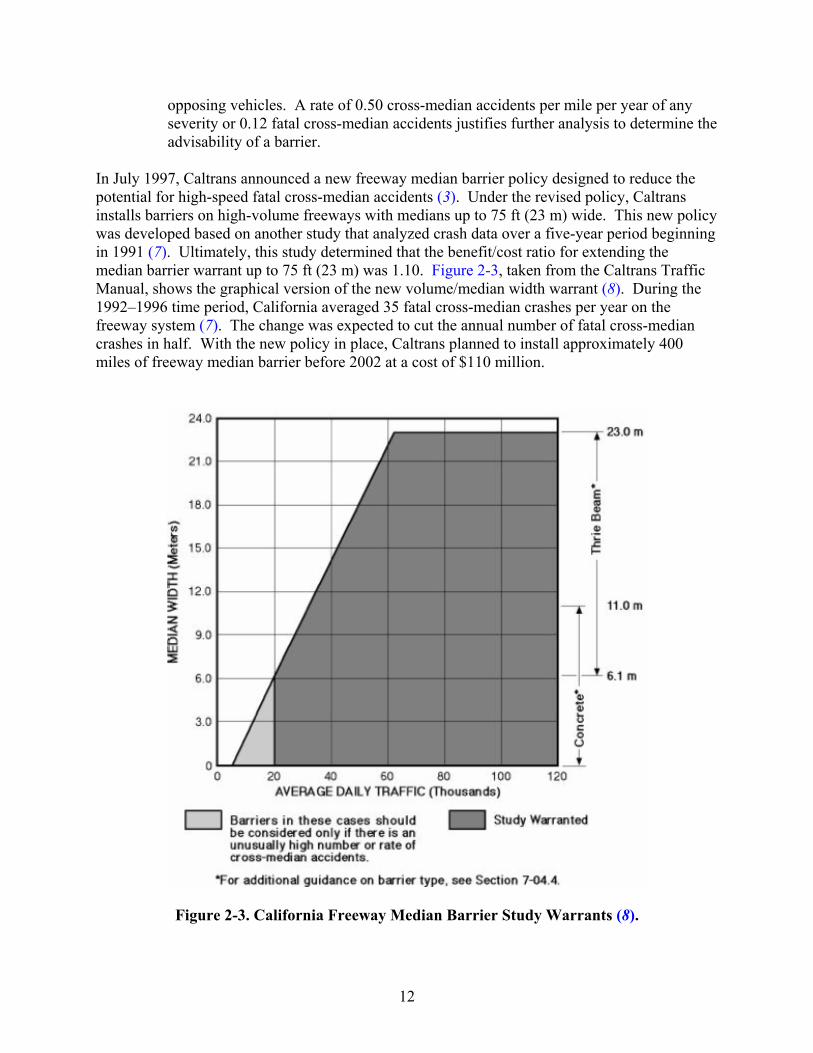
opposing vehicles. A rate of 0.50 cross-median accidents per mile per year of any severity or 0.12 fatal cross-median accidents justifies further analysis to determine the advisability of a barrier.
In July 1997, Caltrans announced a new freeway median barrier policy designed to reduce the potential for high-speed fatal cross-median accidents (3). Under the revised policy, Caltrans installs barriers on high-volume freeways with medians up to 75 ft (23 m) wide. This new policy was developed based on another study that analyzed crash data over a five-year period beginning in 1991 (7). Ultimately, this study determined that the benefit/cost ratio for extending the median barrier warrant up to 75 ft (23 m) was 1.10. Figure 2-3, taken from the Caltrans Traffic Manual, shows the graphical version of the new volume/median width warrant (8). During the 1992–1996 time period, California averaged 35 fatal cross-median crashes per year on the freeway system (7). The change was expected to cut the annual number of fatal cross-median crashes in half. With the new policy in place, Caltrans planned to install approximately 400 miles of freeway median barrier before 2002 at a cost of $110 million.
Figure 2-3. California Freeway Median Barrier Study Warrants (8).
13
North Carolina Department of Transportation Median Barrier Studies In the period between April 1, 1988, and October 31, 1991, a total of 751 cross-median crashes took place in North Carolina, resulting in 105 fatalities. These crashes represented three percent of all interstate crashes and 32 percent of interstate fatalities during the study period. A North Carolina Department of Transportation (NCDOT) study entitled Saving Lives by Preventing Across Median Crashes in North Carolina recommended that median barriers be constructed in 24 sections of interstate highway throughout the state (2). In 1998, the NCDOT began a three-pronged approach to prevent and reduce the severity of across median crashes on freeways:
1. Phase I: add median protection to freeways with historical crash problems; 2. Phase II: systematically protect all freeways with median widths of 70 ft or less; and 3. Phase III: revise design policy to protect all future freeways with median widths of 70 ft
or less. Based on this approach, the 2000–2006 Transportation Improvement Program (TIP) included 62 median barrier projects. As of July 2005, the following progress had been made on these projects (9):
• 400 miles of median barrier installed and all projects have been let or completed, and • Over $120 million dollar invested, not including recurring maintenance costs.
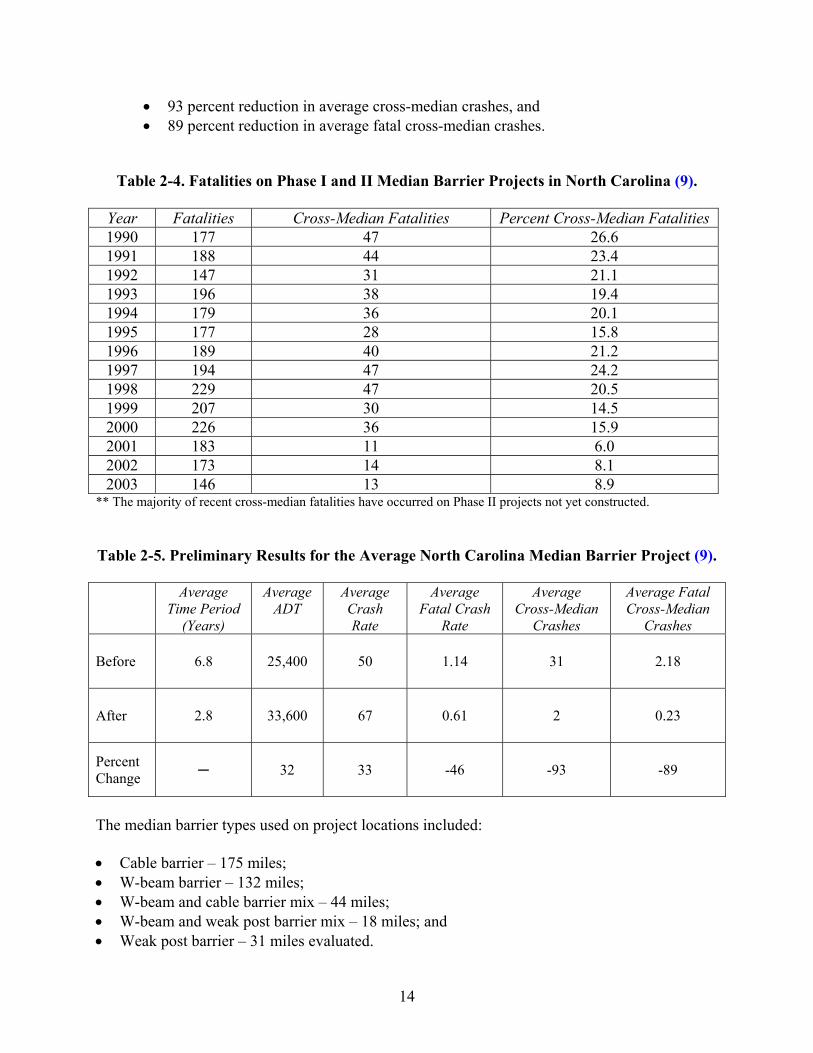
Preliminary Evaluation of Median Barrier Program As part of the median barrier program, NCDOT is performing a long-term median barrier evaluation using a before and after study approach. Results of a preliminary evaluation of the 400 miles of median barrier installed as part of the program were reported at the July 2005 AASHTO Technology Implementation Group Initiative for Cable Median Barrier meeting in Raleigh, North Carolina (9). Table 2-4 provides an overview of the effect on fatalities on Phase I and II median barrier project locations included in the preliminary evaluation results. It is apparent from this data that cross median fatalities have been substantially reduced in frequency since the inception of the median barrier program. This evaluation estimated that 59 fatal across median crashes have been avoided and 96 lives saved from January 1999 to December 2003, which results in a crash cost savings of more than $205 million considering fatal crash costs alone. Furthermore, unpublished data provided by the NCDOT Traffic Safety Unit for the period January 1999 to December 2005 showed that more than 95 fatal cross median crashes have been avoided and 145 lives saved resulting in a crash cost savings of more than $350 million, considering fatal crash costs alone. Table 2-5 includes results for the average project. The preliminary results for the average median barrier program project revealed the following:
• 33 percent increase in average crash rate, • 46 percent reduction in average fatal crash rate,
14
• 93 percent reduction in average cross-median crashes, and • 89 percent reduction in average fatal cross-median crashes.
Table 2-4. Fatalities on Phase I and II Median Barrier Projects in North Carolina (9).
Year Fatalities Cross-Median Fatalities Percent Cross-Median Fatalities 1990 177 47 26.6 1991 188 44 23.4 1992 147 31 21.1 1993 196 38 19.4 1994 179 36 20.1 1995 177 28 15.8 1996 189 40 21.2 1997 194 47 24.2 1998 229 47 20.5 1999 207 30 14.5 2000 226 36 15.9 2001 183 11 6.0 2002 173 14 8.1 2003 146 13 8.9
** The majority of recent cross-median fatalities have occurred on Phase II projects not yet constructed. Table 2-5. Preliminary Results for the Average North Carolina Median Barrier Project (9).
Average Time Period
(Years)
Average ADT
Average Crash Rate
Average Fatal Crash
Rate
Average Cross-Median
Crashes
Average Fatal Cross-Median
Crashes
Before 6.8 25,400 50 1.14 31 2.18
After 2.8 33,600 67 0.61 2 0.23
Percent Change ─ 32 33 -46 -93 -89
The median barrier types used on project locations included: • Cable barrier – 175 miles; • W-beam barrier – 132 miles; • W-beam and cable barrier mix – 44 miles; • W-beam and weak post barrier mix – 18 miles; and • Weak post barrier – 31 miles evaluated.

15
Use of Cable Barrier While a median barrier has traditionally been either a metal guardrail or concrete barrier, North Carolina was one of the first states to use cable guardrail in an attempt to decrease the number of serious and fatal cross-median crashes. A paper presented at the 2001 Transportation Research Board (TRB) Annual Meeting (10) detailed the results of an in-service evaluation of a three-strand cable median barrier. University of North Carolina (UNC) researchers developed a number of regression models to estimate the effects of the installation of cable median barrier on crash rates for several crash types. An analysis of interstate crashes between 1990 and 1997 indicated a significant increase in total crashes from pre- to post-treatment with a cable median barrier, but only to a level equivalent to that of the rest of the interstate system. The sections treated with cable median barrier showed improved overall safety due to fewer serious and fatal crashes, as well as fewer cross-median crashes. The Overall Severity Index values (a formula used by NCDOT to calculate the average severity of crashes at a location) were greatly reduced after cable barrier installation. NCHRP Project 17-14 “Improved Guidelines for Median Safety” The National Highway Cooperative Research Program sponsored Project 17-14, “Improved Guidelines for Median Safety.” This study, which was conducted by BMI and the UNC Highway Safety Research Center (HSRC), was not completed during the course of this project. An interim report published in October 1997 (11) summarized some preliminary findings of the study including:
• literature review; • existing median design standards and practices; • survey of state departments of transportation about participation in Phase II (data
collection, analysis, and validation) of the project; and • experimental plan for Phase II.
This study was funded because the major documents (i.e., the Roadside Design Guide and Policy on Geometric Design of Highways and Streets) used in the design and redesign of medians are based on old data, which may not reflect present day conditions. The objective of the NCHRP 17-14 research was to determine what design configurations and operational characteristics justify the consideration of a median barrier. Guidelines for appropriate combinations of median slope and width were to be developed for sections where median barrier is not justified. The guidelines developed during the study will be considered by AASHTO for inclusion in the next editions of the Roadside Design Guide and/or Policy on Geometric Design of Highways and Streets. The states selected for the Phase II investigation included California, North Carolina, and Ohio.
16
The NCHRP Project 17-14 produced a draft final report in July 2004 (12). This report concentrated on providing updated information on current practices, procedures, and policies of state transportation agencies with respect to median barrier warrants and usage of barriers. It is available for loan from NCHRP. The overall objective of the NCHRP Project 17-14 was to develop improved median barrier guidelines, for high-speed roadways, suitable for adoption in AASHTO’s Roadside Design Guide. Unfortunately, collection of data needed for Project 17-14 proved to be very expensive, and the data limitation hampered the strength of the recommendations. The project recommendations have not been implemented but should be very beneficial in future research. To avoid some of the obstacles that NCHRP Project 17-14 faced, NCHRP Project 22-21, Median Cross-Section Design for Rural Divided Highways, will focus on typical cross-section designs selected for a construction or reconstruction project rather than the exact cross-section design at a particular point (13). The typical cross-section designs are determined fairly early in the design process before adjustments are made to account for variations that occur along the alignment (e.g., horizontal and vertical curves, interchanges and intersections, and special drainage requirements). Project 22-21 started in January 2006 and has a scheduled completion of January 2009. A related project, NCHRP Project 22-22, Placement of Traffic Barriers on Roadside and Median Slopes, will begin near the same time as Project 22-21 (14). Both projects are expected to benefit from collaboration between the research teams, and the results of Project 22-22 will be incorporated into the final product of Project 22-21. As of March 2006, Project 22-22 had not started. Pennsylvania Department of Transportation The Pennsylvania Department of Transportation’s (PennDOT) Design Manual, Part 2, Chapter 12 offers guidelines for evaluating the need for median barrier on interstates and expressways. These guidelines, which are similar to those contained in the AASHTO Roadside Design Guide, take into account both median width and average daily traffic. Unless there is a significant history of cross-median crashes along a highway section, a barrier is not warranted if the median width exceeds 10 m (33 ft) or the ADT is less than 20,000. From 1994 to1998, under application of these guidelines, there were 267 crossover crashes on Pennsylvania’s interstates and expressways resulting in 55 deaths (15). In an effort to improve overall median safety, PennDOT contracted with the Pennsylvania Transportation Institute (PTI) at Pennsylvania State University to evaluate overall median safety within the state, including the relationship between cross-median crashes, median widths and traffic volumes on interstates and expressways (15). One unique aspect of this study involved the gathering of expert input/opinion regarding median safety and cross-median crashes. A Delphi survey technique was used for gathering information from selected experts from around the country.
17
The survey process involves a series of blind feedback loops through which participants have the opportunity to rethink their responses until a consensus is reached. Questions pertained to factors influencing cross-median crashes, evaluation of different median configurations, and the selection and placement of median barrier. Approximately 50 percent of respondents believed that roadway cross-sectional elements can influence cross-median accidents. This and other input received from the survey were used in combination with analytical data results to provide a more comprehensive investigation of median safety issues in Pennsylvania. Arizona and Missouri Departments of Transportation In response to some highly publicized cross-median crashes, the Arizona and Missouri Departments of Transportation sponsored research studies to investigate median safety issues. Both studies were performed by the University of Nebraska and were similar in scope and nature (16). Many of the highways analyzed were designed in the 1960s and 1970s with 30 to 40 ft medians and currently had 30,000 to 70,000 ADT. In many instances, there were future plans to widen the highway. Due to right-of-way restrictions, this was generally intended to be accomplished by paving the median and providing a concrete median barrier to separate traffic. Thus, the project life for any median barrier improvements is limited by future widening plans. Since the project life was typically only 5 to 10 years, a cable median barrier was found to be the only cost-effective alternative due to its low installation cost. The median crash rates for divided highway sections throughout each state were computed. The highest rates occurred near interchanges and on horizontal curves of 2.5 degrees or more. A rate of eight cross-median crashes per 100 million vehicle miles was used as the threshold for investigation of median barrier application. The analysis justified the installation of a significant amount of cable median barrier on existing highways. Since not all medians have gentle slopes, it is not always appropriate to place the barrier in the center of the median. Barrier placement procedures were developed for different slope conditions based on computer simulation of vehicle encroachments. For steeper slopes (i.e., 4:1 or steeper), there exists a high potential for vehicle underride or override of the barrier. Therefore, for these conditions, the placement procedures require the installation of barrier on both sides of the median. A detailed review of crashes occurring after the median barrier installation indicated that the cable barrier exhibited good performance. In the more than 60 collisions judged to have a likelihood of resulting in a cross-median crash in the absence of the median barrier, there was only one vehicle penetration of the cable barrier system. NCHRP Project 22-12 “Guidelines for the Selection, Installation, and Maintenance of Highway Safety Features” Under NCHRP Project 22-12 “Guidelines for the Selection, Installation, and Maintenance of Highway Safety Features,” selection and installation guidelines for roadside safety features are
18
being developed. The NCHRP research team recognized that median barrier requires a different analysis approach than other types of roadside barriers such as guardfence and bridge rails. The difference lies in the fact that a cross-median crash involves not only the encroaching vehicles but also traffic in the opposing direction of travel. The current Roadside Safety Analysis Program (RSAP) is designed to handle only single-vehicle, ran-off-road crashes and not multi-vehicle crashes. Thus, it is necessary to revise the methodology used in RSAP to estimate the frequency and severity of cross-median crashes. The NCHRP research team developed three cross-median crash prediction models following the encroachment-based probability approach adopted in the RSAP: one model each for rural 4-lane, urban 4-lane, and urban 6-lane highways (17). The use of these models requires very detailed accident and traffic data, some of which are generally not available. For example,
• the percentages for encroachment angle and encroachment speed are based on the impact speed and angle distribution for freeways,
• since there is no existing information on the hourly distribution of encroachments, the hourly distribution of single-vehicle, ran-off-road, fixed-object crashes are used as a proxy, and
• the probability that the encroaching vehicle will impact with another vehicle in the opposing direction of travel is modeled as a function of the available gap, the vehicle size, the encroachment angle and speed; a uniform traffic distribution is typically assumed for each opposing lane.
The cross-median models are currently being evaluated for various traffic and median scenarios. It was indicated in a white paper that sensitivity analysis to assess the effects of various parameters on cross-median accident frequencies and associated costs will be conducted as the next step in the process to develop selection guidelines for median barriers. These guidelines are not intended to be site specific but rather are based on functional class and general roadway characteristics.

19
CHAPTER 3. EXPLORATORY ANALYSIS OF MEDIAN BARRIER CRASHES IN TEXAS
INTRODUCTION This chapter documents an exploratory analysis of Texas crash data for the evaluation of median barrier guidelines. The scope of this analysis consists of investigating the characteristics of crashes occurring in the median section of Interstate highways, urban freeways and rural arterial roads in Texas. The exploratory analysis was carried out with crash statistics maintained by the Department of Public Safety for the years 1997 to 1999. The crash data were analyzed for the following two events:
• median-related crashes and • possible cross-median crashes.
The current DPS database does not contain a specific variable that adequately describes a cross-median or median-related crash. Thus, appropriate data screening criteria had to be developed and employed to extract the crashes of interest. The process is described in the next section. It should be noted that there is no information in the DPS database regarding whether a given highway is divided or undivided. It is expected, however, that interstate and urban freeways are divided. The chapter is divided into five sections. The next section describes the initial screening criteria used to extract median-related and possible cross-median crashes. The third section summarizes the characteristics of median crashes for the entire state of Texas. The fourth section summarizes an analysis of validated cross-median crashes occurring in selected counties in Texas. The last section summarizes the characteristics of median-related crashes for the Dallas-Fort Worth metropolitan area. DESCRIPTION OF VARIABLES This section describes the fields used to extract possible cross-median and median-related crashes from the DPS database. Median-Related Crashes The criteria used to extract median-related crashes are the following:
1. Functional Classes: Urban/Rural Interstate, Other Urban Freeway and Expressway, and Rural/Urban Principal Arterial Roads (FUNCT_CL=‘1’, ‘2’, AND ‘3’)
2. Non-Intersection Related Crashes Only: (INTRSECT=‘4’) 3. Number of Lanes: 4+ Lanes (NUMB_LN = ‘04’, ‘05’, …, ‘16’)

20
4. Crash Severity: ALL 5. Number of Vehicles Involved: Single (TOTALVEH=1) and Multi-Vehicle Crashes
(TOTALVEH > 1) 6. Area/Position of Impact: Area between Main Lanes (POSIMPCT=‘63’) 7. First Harmful Event: Fixed Object, Other Object, and Overturned (_1STHARM= ‘7’, ‘8’,
and ‘0’) Possible Cross-Median Crashes The criteria used to select possible cross-median crashes are the following:
1. Functional Classes: Urban/Rural Interstate, Other Urban Freeway and Expressway, and Rural/Urban Principal Arterial Roads (FUNCT_CL=‘1’, ‘2’, and ‘3’)
2. Non-Intersection Related Crashes Only: (INTRSECT=‘4’) 3. Number of Lanes: 4+ Lanes (NUMB_LN = ‘04’, ‘05’, …, ‘16’) 4. Crash Severity: ALL 5. Number of Vehicles Involved: Multi-Vehicle Crashes (TOTALVEH > 1) 6. Part of Roads Where Crash Occurred: Main Lanes (ROADPART=‘1’) 7. Vehicle Movement/Manner of Collision:
(a) Two Vehicles in Opposite Direction and Both Going Straight (COLISION=30) (b) Two Vehicles in Opposite Direction and One Straight and Another One Left Turn
(COLISION=34) (c) Vehicle Swerved or Veered from Intended Courses Avoiding Vehicle from
Opposite Direction in Wrong Lane (OTHERFAC=‘38’) (d) Vehicle Slowing, Stopping, or Stopped on Road to Avoid Vehicle from Opposite
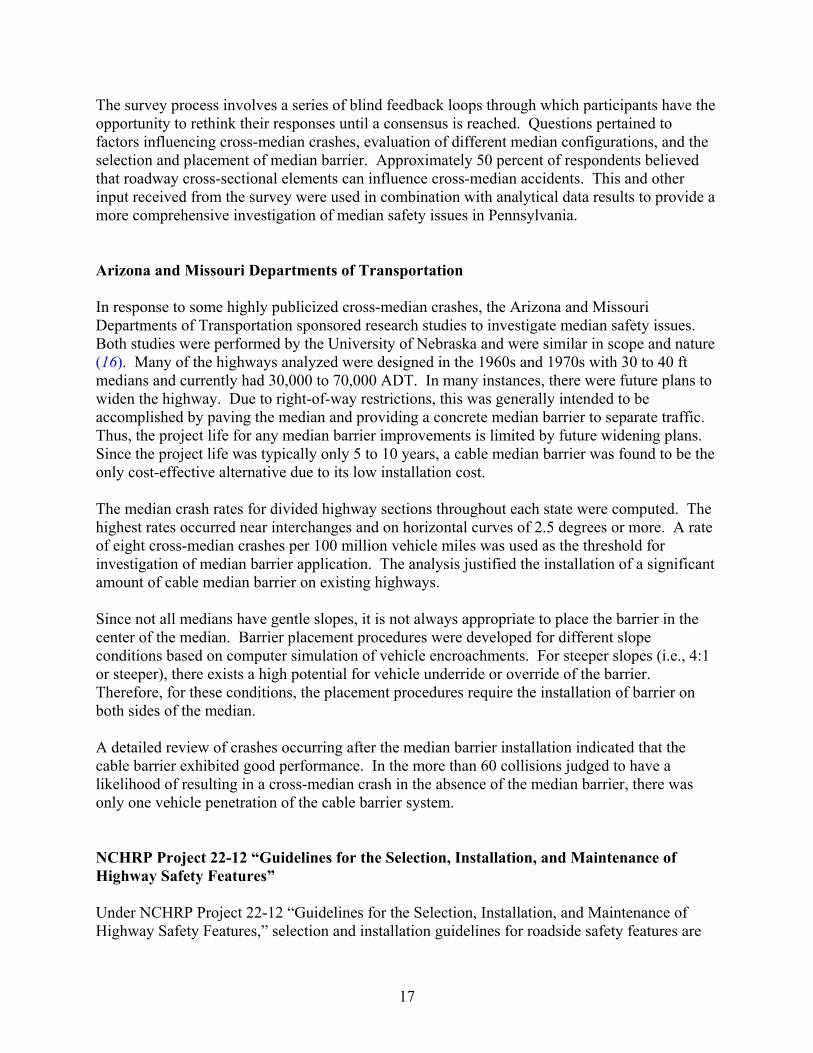
Direction in Wrong Lane (OTHERFAC=‘48’) CHARACTERISTICS OF MEDIAN CRASHES This section summarizes the important characteristics for both types of crash events. Table 3-1 summarizes the number of median-related and possible cross-median crashes by severity between 1997 and 1999. The total number of crashes for the state of Texas over this same period is also shown for reference. Median-related and possible cross-median events account for less than three percent of all reported crashes in Texas. However, the injury level associated with these crashes tends to be severe. As shown in Table 3-1, 48 percent of possible cross-median crashes result in serious or fatal injury (KAB). When all types of crashes are considered, the percentage of KAB crashes falls to 25 percent. Figures 3-1 and 3-2 illustrate the number of median-related and possible cross-median crashes by year, respectively. Although a small decrease can be seen over the three-year study period, the figures show that the number of these crashes does not vary substantially from year to year.
21
Table 3-1. Crashes by Severity (1997–1999).
Severity Median-related Possible Cross-Median
State of Texas
Fatal 360 351 9345 Injury A 1623 544 52,223 Injury B 4494 780 169,614 Injury C 6411 932 389,201 PDO 10,114 866 305,422 Total 23,002 3473 925,805
Figure 3-1. Number of Median-Related Crashes per Year (1997–1999).
0
1 0 0 0
2 0 0 0
3 0 0 0
4 0 0 0
5 0 0 0
6 0 0 0
7 0 0 0
8 0 0 0
9 0 0 0
Cra
shes
per
Yea
r
Y e a r
F a ta l In ju ry (A ) In ju ry (B ) In ju ry (C ) P D O
P D O 3 5 6 3 3 4 4 7 3 1 0 4
In ju ry (C ) 2 3 9 0 2 1 0 3 1 9 1 8
In ju ry (B ) 1 5 4 8 1 4 8 5 1 4 6 1
In ju ry (A ) 5 5 4 5 4 4 5 2 5
F a ta l 1 1 8 1 2 7 1 1 5
1 9 9 7 1 9 9 8 1 9 9 9

22
Figure 3-2. Number of Possible Cross-Median Crashes per Year (1997–1999).
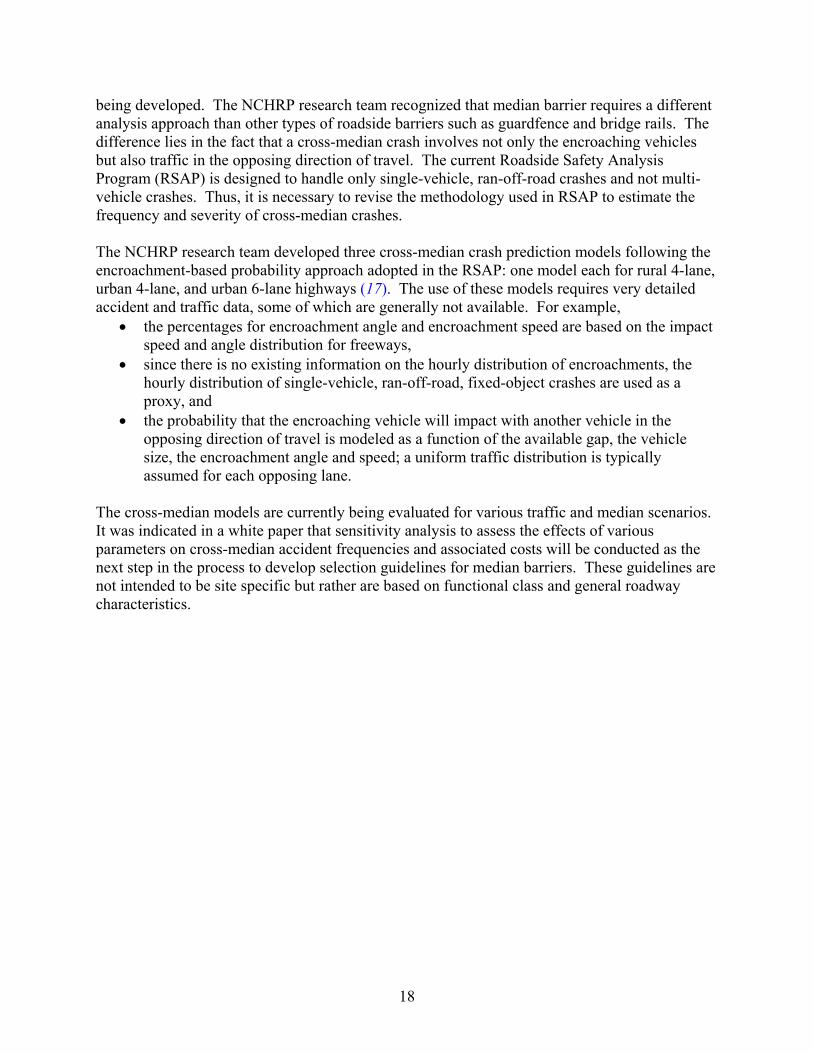
Characteristics of Median-Related Crashes This section presents some characteristics specific to median-related crashes. Figures 3-3 and 3-4 show the number of crashes by county and by TxDOT administrative district, respectively. The figures reveal that more than two-thirds of all median-related crashes occur in the largest TxDOT districts: Houston, Dallas, Fort Worth, San Antonio, and Austin. Many counties in west Texas have fewer than five median-related crashes in the three-year period analyzed. Tables 3-2 and 3-3 summarize the number of median-related crashes by highway functional class and severity. Table 3-2 presents data for freeways, expressways, and principal arterial roads. Table 3-3 excludes principal arterials and is only for freeways and expressways. These tables show that most median-related crashes (85 percent) occur on freeways and interstate highways.
0
2 0 0
4 0 0
6 0 0
8 0 0
1 0 0 0
1 2 0 0C
rash
es p
er Y
ear
Y e a r
F a ta l In ju ry (A ) In ju ry (B ) In ju ry (C ) P D O
P D O 2 7 3 2 9 8 2 9 5
In ju ry (C ) 3 2 4 3 0 6 3 0 2
In ju ry (B ) 2 6 6 2 8 5 2 2 9
In ju ry (A ) 1 9 9 1 7 5 1 7 0
F a ta l 1 3 0 1 0 0 1 2 1
1 9 9 7 1 9 9 8 1 9 9 9
23
Figure 3-3. Number of Median-Related Crashes by County (1997–1999).

24
2201805
286604
482250
191325
674302275
5772290
11342616
932370
3745188
831549
122115
83490
0 1000 2000 3000 4000 5000 6000 7000
Paris
Fort Worth
Wichita Falls
Amarillo
Lubbock
Odessa
San Angelo
Abilene
Waco
Tyler
Lufkin
Houston
Yoakum
Austin
San Antonio
Corpus Christi
Bryan
Dallas
Atlanta
Beaumont
Pharr
Laredo
Brownwood
El Paso
Childress
TxD
OT
Adm
inis
trat
ive
Dis
tric
t
Number of Crashes
Figure 3-4. Number of Median-Related Crashes by TxDOT Administrative District (1997–1999).
25
Table 3-2. Number of Median-Related Crashes for Freeway, Expressway, and Principal Arterial Roads (1997–1999).
1999
1998
1997
TOTAL
SEVERITY Single Veh Multi-Veh Single Veh Multi-Veh Single Veh Multi-Veh Single Veh Multi-Veh All-Veh
Fatal (K) 100 15 108 19 107 11 315 45 360 Injury (A) 480 45 494 50 496 58 1470 153 1623 Injury (B) 1317 144 1332 153 1404 144 4053 441 4494 Injury (C) 1671 247 1868 235 2073 317 5612 799 6411
Non-Injury 2890 214 3231 216 3335 228 9456 658 10,114
TOTAL 6458 665 7033 673 7415 758 20,906 2096 23,002
Table 3-3. Number of Median-Related Crashes for Freeway and Expressway Only (1997–1999).
1999
1998
1997
TOTAL
SEVERITY Single Veh Multi-Veh Single Veh Multi-Veh Single Veh Multi-Veh Single Veh Multi-Veh All-Veh
Fatal (K) 76 10 82 18 80 10 238 38 276 Injury (A) 382 41 375 48 399 54 1156 143 1299 Injury (B) 1076 133 1086 141 1132 137 3294 411 3705 Injury (C) 1453 234 1611 226 1817 302 4881 762 5643
Non-Injury 2433 198 2751 201 2833 215 8017 614 8631
TOTAL 5420 616 5905 634 6261 718 17,586 1968 19,554
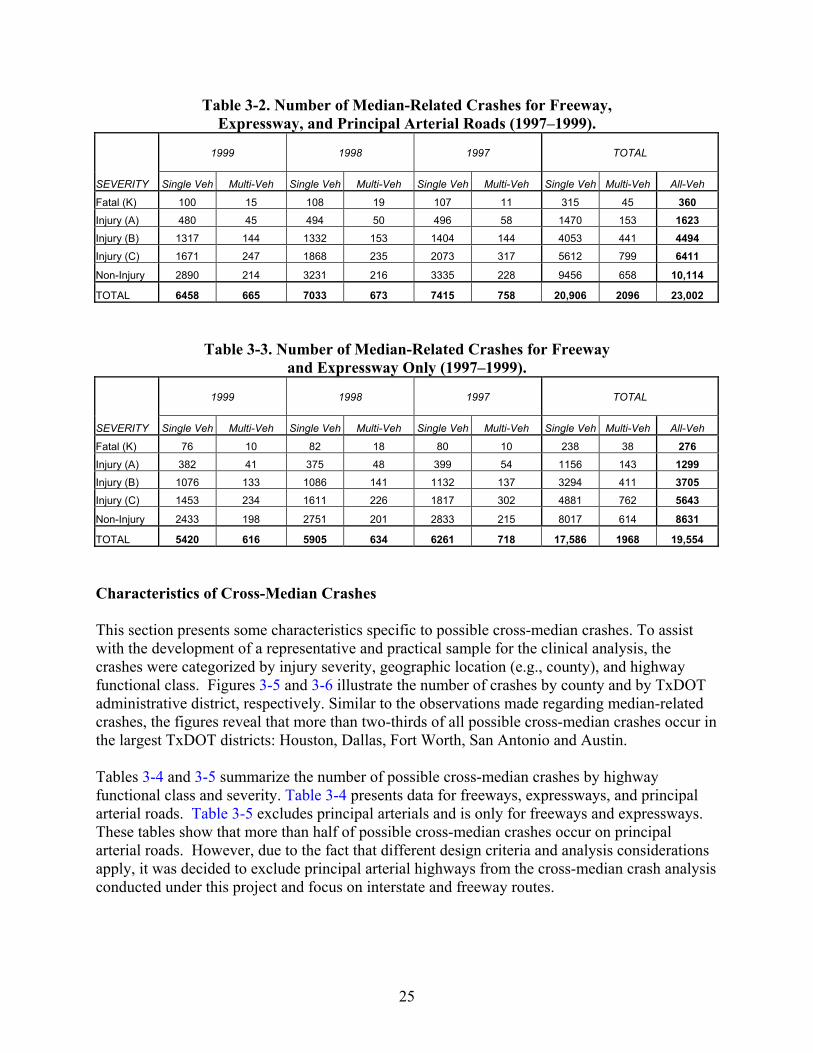
Characteristics of Cross-Median Crashes This section presents some characteristics specific to possible cross-median crashes. To assist with the development of a representative and practical sample for the clinical analysis, the crashes were categorized by injury severity, geographic location (e.g., county), and highway functional class. Figures 3-5 and 3-6 illustrate the number of crashes by county and by TxDOT administrative district, respectively. Similar to the observations made regarding median-related crashes, the figures reveal that more than two-thirds of all possible cross-median crashes occur in the largest TxDOT districts: Houston, Dallas, Fort Worth, San Antonio and Austin. Tables 3-4 and 3-5 summarize the number of possible cross-median crashes by highway functional class and severity. Table 3-4 presents data for freeways, expressways, and principal arterial roads. Table 3-5 excludes principal arterials and is only for freeways and expressways. These tables show that more than half of possible cross-median crashes occur on principal arterial roads. However, due to the fact that different design criteria and analysis considerations apply, it was decided to exclude principal arterial highways from the cross-median crash analysis conducted under this project and focus on interstate and freeway routes.

26
Figure 3-5. Number of Possible Cross-Median Crashes by County (1997–1999).

27
50315
3878
6344
1842
148174
100539
57387
26650
115479
72156
1082525
11113
0 100 200 300 400 500 600
Paris
Fort Worth
Wichita Falls
Amarillo
Lubbock
Odessa
San Angelo
Abilene
Waco
Tyler
Lufkin
Houston
Yoakum
Austin
San Antonio
Corpus Christi
Bryan
Dallas
Atlanta
Beaumont
Pharr
Laredo
Brownwood
El Paso
ChildressTx
DT
Adm
inis
trat
ive
Dis
tric
t
Number of Crashes
Figure 3-6. Number of Possible Cross-Median Crashes by TxDOT Administrative District (1997–1999).
28
Table 3-4. Number of Possible Cross-Median Crashes for Freeway, Expressway and Principal Arterial Roads (1997–1999).
SEVERITY 1999 1998 1997 TOTAL Fatal (K) 121 100 130 351 Injury (A) 170 175 199 544 Injury (B) 229 285 266 780 Injury (C) 302 306 324 932 Non-Injury 295 298 273 866 TOTAL 1117 1,164 1,192 3,473
Table 3-5. Number of Possible Cross-Median Crashes for Freeway and Expressway Only (1997–1999).
SEVERITY 1999 1998 1997 TOTAL Fatal (K) 60 59 75 194 Injury (A) 81 83 100 264 Injury (B) 75 111 103 289 Injury (C) 97 91 112 300 Non-Injury 115 110 116 341 TOTAL 428 454 506 1388
In order to reduce the number of crashes to a feasible level for clinical analysis, the possible cross-median crash sample was limited to the two most recent years of data available at the time of the study: 1998 and 1999. As shown in Table 3-5, this included a total of 882 possible cross-median crashes. The collection of supplemental data to support the analyses of median crashes is an important aspect of the project. The traffic and highway variables considered for this study include:
• highway functional classification and access control, • AADT, • posted speed limit, • various roadway characteristics (e.g., number of lanes, horizontal curvature, presence
and width of inside shoulder, etc.), and • various median characteristics (e.g., median width, cross slope, presence and type of
longitudinal barrier, etc.).
29
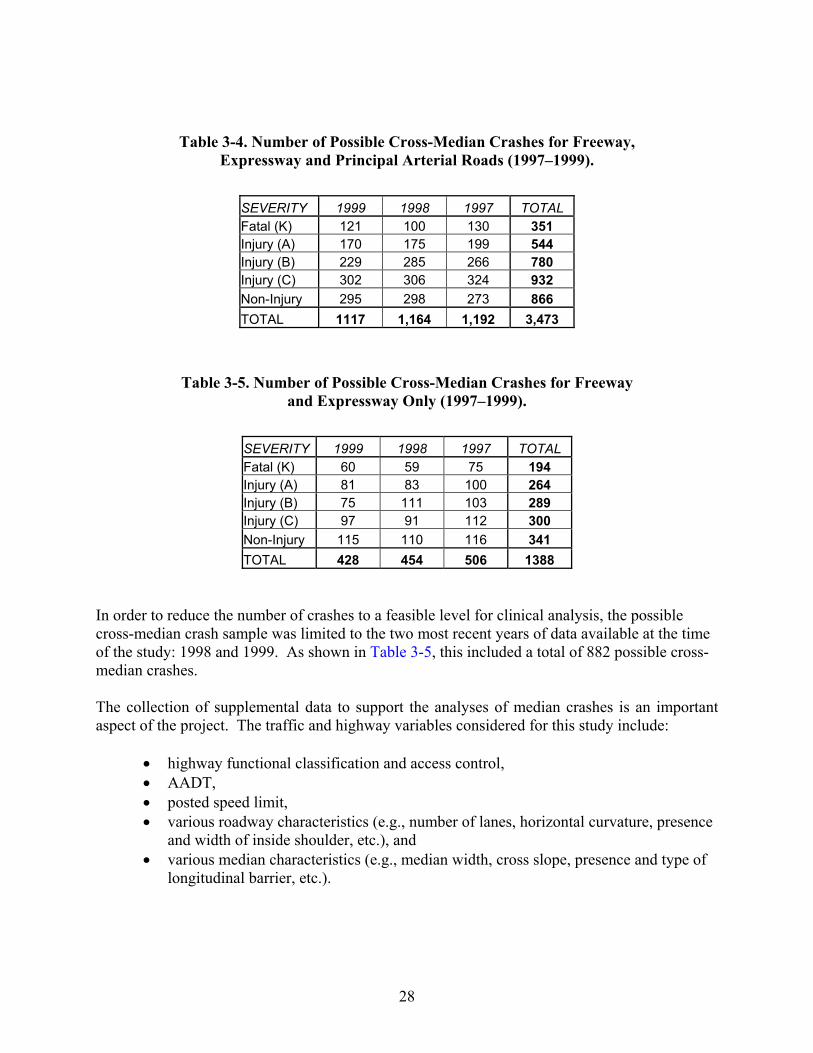
Typical sections from project plans and video logs of the median taken from the inside lane of travel were used to extract selected information pertaining to the roadway and median that is not available through the DPS accident database or road inventory file. In order to limit the required supplemental data collection to practical levels and regions around the state, potential cross-median crashes were screened to include only the counties in the Houston, Dallas, Forth Worth, San Antonio, and Austin metropolitan areas and those connecting them via interstate or urban/rural freeway segments. Approximately 90 percent of all possible cross-median crashes in the two-year study period occurred in the selected counties. Using this sampling plan, the number of possible cross-median crashes was reduced from 882 to 792. Figure 3-7 shows the location of these crashes by county. Hard copies of police accident reports associated with these crashes were obtained from the DPS and were manually reviewed to identify those crashes that were indeed truly cross-median in nature.
Figure 3-7. Number of Possible Cross-Median Crashes in Selected Counties on Interstates and Freeway Segments (1998–1999).

30
ANALYSIS OF VALIDATED CROSS-MEDIAN CRASHES This section summarizes the characteristics of validated cross-median crashes occurring in the selected counties with interstate or urban/rural freeway segments for the years 1998 and 1999. As explained above, each crash report was manually reviewed and evaluated to ensure that a crash involved a vehicle crossing a median and colliding with another vehicle traveling in the opposite direction. From 792 crashes identified by the original screening criteria, 443 were actual cross-median crashes. Another 137 crashes involved a vehicle part that crossed the median and hit a vehicle traveling in the opposite direction. Most often, the object consisted of a wheel coming off a vehicle or trailer. In some instances, a vehicle ran-off-the-road, hit a fixed object and a vehicle part became detached and landed in the opposing lane, striking an on-coming vehicle. These types of crashes were subsequently removed from the analysis. During the validation process, it was determined that 359 out of the 443 cross-median crashes could be matched with the Texas Reference Marker (TRM) system/database. That left 84 cases for which the width of the median could not be determined. It is believed that coding errors are present in the TRM system/database. Each cross-median crash case was reviewed a second time to verify that they were indeed cross-median collisions. In the end, 359 crashes were identified as cross-median crashes that could be mapped onto the road network between 1998 and 1999 in the selected counties. Table 3-6 shows the number of possible and validated cross-median crashes by severity for the selected counties in Texas. As seen in this table, a little more than 50 percent of the possible cross-median crashes identified by the screening criteria were truly cross-median crashes.
Table 3-6. Number of Cross-Median Crashes for the Selected Counties (1998–1999). SEVERITY Possible Validated
Fatal (K) 108 76 Injury (A) 145 82 Injury (B) 170 61 Injury (C) 158 76 Non-Injury 211 64 TOTAL 792 359
Figure 3-8 illustrates the number of crashes by roadway alignment. As shown in this graph, most cross-median crashes occurred on tangent roadway sections. Insufficient data exists to determine if the crashes occurring on freeway curves are over-represented or are more than what one should expect given the exposure. Figure 3-9 shows the number of crashes by type of weather. This figure shows that approximately one-third of cross-median crashes occur in rainy weather. Figure 3-10 illustrates the number of crashes by time of day. A large portion of cross-median crashes occur in the afternoon and evening.

31
Figure 3-11 shows the number of vehicles per collision. The majority of collisions involve only two vehicles. Figure 3-12 summarizes the number of crashes by severity for different median widths. As seen in this figure, most (85 percent) cross-median crashes occur on highway segments have median widths between 30 and 90 ft with the majority (63.5 percent) occurring in medians ranging from 60 to 90 ft in width. Interestingly, there are still many cross-median crashes occurring with median widths greater than 90 ft. Figure 3-13 shows the number of crashes by posted speed limit. About two-thirds of cross-median crashes occur on sections with speed limits of 65 mph and above. This figure shows the proportion of the total network for each speed limit.
346
13
0
50
100
150
200
250
300
350
400
Tangent Curve
Alignment
Cra
shes
(199
8-19
99)
Figure 3-8. Crashes by Type of Roadway Alignment (1998–1999).

32
215
137
7
0
50
100
150
200
250
Clear Raining Other
Weather
Cra
shes
(199
8-19
99)
Figure 3-9. Crashes by Type of Weather.
9
5
2 2
0
4
12
2425
10
16
14
19
25
23
34
28
24
19
16
18
9
15
6
0
5
10
15
20
25
30
35
40
1 2 3 4 5 6 7 8 9 10 11 12 13 14 15 16 17 18 19 20 21 22 23 24
Time of Day
Cra
shes
(199
8-19
99)
Figure 3-10. Number of Crashes by Time of Day.

33
267
70
12 10
0
50
100
150
200
250
300
2 3 4 5+
Number of Vehicles in Collision
Cra
shes
(199
8-19
99)
Figure 3-11. Number of Vehicles Involved in Cross-Median Collisions.
9
78
228
2011 13
0
50
100
150
200
250
<30 30 - 60 60 - 90 90 - 120 120 - 150 >=150
Median Width (ft)
Cra
shes
(199
8-19
99)
Figure 3-12. Number of Crashes by Median Width (Including Shoulders).
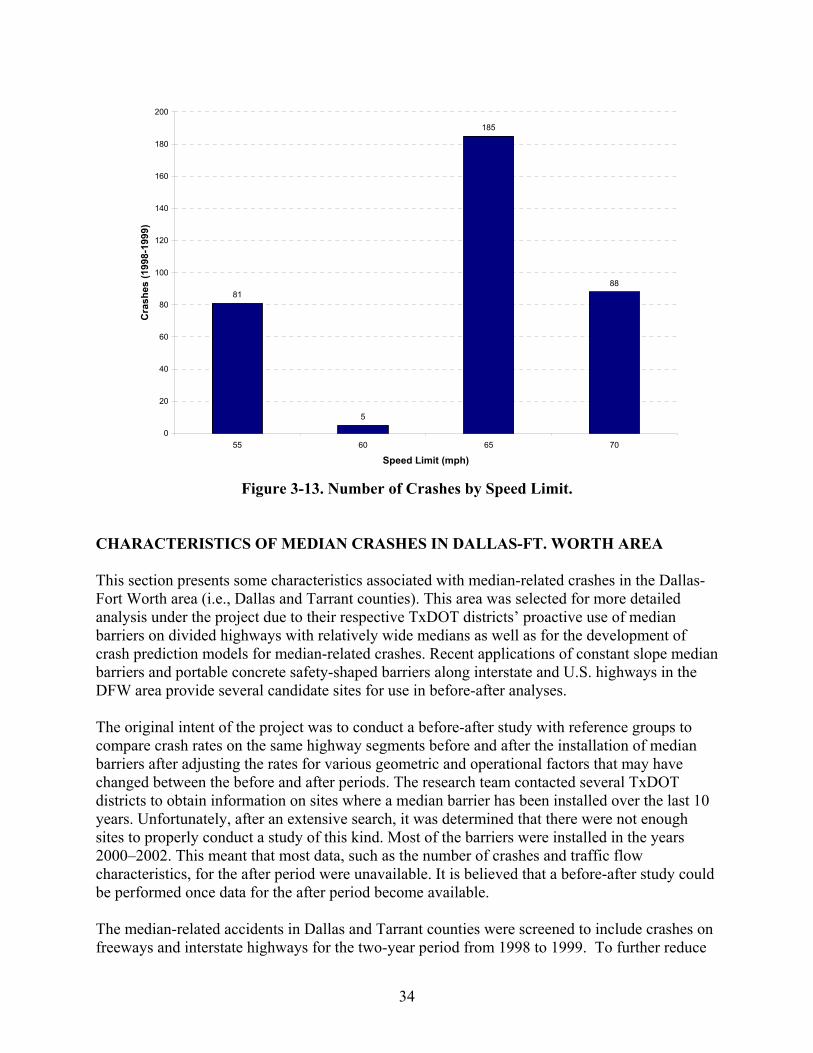
34
81
5
185
88
0
20
40
60
80
100
120
140
160
180
200
55 60 65 70
Speed Limit (mph)
Cra
shes
(199
8-19
99)
Figure 3-13. Number of Crashes by Speed Limit.
CHARACTERISTICS OF MEDIAN CRASHES IN DALLAS-FT. WORTH AREA This section presents some characteristics associated with median-related crashes in the Dallas-Fort Worth area (i.e., Dallas and Tarrant counties). This area was selected for more detailed analysis under the project due to their respective TxDOT districts’ proactive use of median barriers on divided highways with relatively wide medians as well as for the development of crash prediction models for median-related crashes. Recent applications of constant slope median barriers and portable concrete safety-shaped barriers along interstate and U.S. highways in the DFW area provide several candidate sites for use in before-after analyses. The original intent of the project was to conduct a before-after study with reference groups to compare crash rates on the same highway segments before and after the installation of median barriers after adjusting the rates for various geometric and operational factors that may have changed between the before and after periods. The research team contacted several TxDOT districts to obtain information on sites where a median barrier has been installed over the last 10 years. Unfortunately, after an extensive search, it was determined that there were not enough sites to properly conduct a study of this kind. Most of the barriers were installed in the years 2000–2002. This meant that most data, such as the number of crashes and traffic flow characteristics, for the after period were unavailable. It is believed that a before-after study could be performed once data for the after period become available. The median-related accidents in Dallas and Tarrant counties were screened to include crashes on freeways and interstate highways for the two-year period from 1998 to 1999. To further reduce

35
the size of the sample, these crashes were sampled by injury severity with a sampling bias toward the more severe crashes. Crashes resulting in fatal or incapacitating injury were sampled at 100 percent while those resulting in non-incapacitating injury, possible injury, or no-injury were sampled at 25 percent. This reduced the number of median-related crashes in the selected study period from 2618 to 825. Hardcopies of the police reports for the selected median-related crashes in the Dallas-Fort Worth area were requested from the DPS. A total of 825 crash reports were obtained. These reports were manually reviewed as a quality control check on the coding of the crashes in the electronic DPS crash database. The manual verification showed that most crashes were coded correctly with regard to information on median-related crashes. Thus, the DPS electronic database was deemed adequate to be used for further analysis. Tables 3-7 and 3-8 summarize the number of median-related crashes in Dallas and Tarrant counties by year and injury severity. Table 3-7 presents data for freeways, expressways, and principal arterial roads. Table 3-8 excludes principal arterials and includes only freeways and expressways. These tables show that similar to the statewide data, most median-related crashes (90 percent) in Dallas and Tarrant counties occur on freeways and interstate highways.
Table 3-7. Number of Median-Related Crashes for Freeway, Expressway and Principal Arterial Roads in Dallas and Tarrant Counties (1997–1999).
1999
1998
1997
TOTAL
SEVERITY Single Veh Multi-Veh Single Veh Multi-Veh Single Veh Multi-Veh Single Veh Multi-Veh All-Veh
Fatal (K) 11 4 21 7 20 1 52 12 64
Injury (A) 88 14 98 16 101 15 287 45 332
Injury (B) 275 60 260 55 277 48 812 163 975
Injury (C) 323 59 391 65 432 82 1146 206 1352
Non-Injury 523 46 543 43 553 46 1619 135 1754
TOTAL 1220 183 1313 186 1383 192 3916 561 4477
Table 3-8. Number of Median-Related Crashes for Freeway and Expressway Only in Dallas and Tarrant Counties (1997–1999).
1999
1998
1997
TOTAL
SEVERITY Single Veh Multi-Veh Single Veh Multi-Veh Single Veh Multi-Veh Single Veh Multi-Veh All-Veh
Fatal (K) 8 2 20 6 16 1 44 9 53
Injury (A) 80 14 82 15 91 13 253 42 295
Injury (B) 243 56 233 51 248 44 724 151 875
Injury (C) 304 57 356 64 393 75 1053 196 1249
Non-Injury 465 41 481 40 501 44 1447 125 1572
TOTAL 1100 170 1172 176 1249 177 3521 523 4044


37
CHAPTER 4. MEDIAN BARRIER TYPES AND PLACEMENT ISSUES “Median barriers are longitudinal barriers that are most commonly used to separate opposing traffic on a divided highway” (18). While most median barriers are similar to roadside barriers, they are designed to redirect vehicles striking from either side of the barrier. The primary purpose of a median barrier is to prevent a vehicle from crossing the median and becoming involved in a head-on crash with opposing traffic. The barrier functions by containing and either capturing or redirecting errant vehicles. A barrier is typically warranted when the consequences of encroaching into or across the median are judged to be more severe than striking the barrier. This chapter describes various median barrier topics. The chapter is divided into four sections. The first section reviews the testing requirements for median barriers. The second section describes the characteristics of the various median barrier classes. Considerations for selecting a particular median barrier class or type are presented in the third section. Section four discusses barrier placement issues. TESTING REQUIREMENTS The most definitive means of demonstrating the adequacy of the barrier for this purpose is with full-scale crash tests. Guidelines for testing roadside appurtenances originated in 1962 with a one-page document – Highway Research Circular 482 entitled “Proposed Full-Scale Testing Procedures for Guardrails” (19). This document included four specifications on test article installation, one test vehicle, six test conditions, and three evaluation criteria. NCHRP Report 350, “Recommended Procedures for the Safety Performance Evaluation of Highway Features,” which was published in 1993, is the latest in a series of documents aimed at providing guidance on testing and evaluating roadside safety features (5). This 132-page document represented a comprehensive update to crash test and evaluation procedures. It incorporated significant changes and additions to procedures for safety-performance evaluation, and updates reflecting the changing character of the highway network and the vehicles using it. Report 350 uses a 2000 kg pickup truck as the standard test vehicle to reflect the fact that over one-half of new passenger vehicles sales in the U.S. are in this “light truck” category. This change to a light truck was made recognizing the differences in wheel base, bumper height, body stiffness and structure, front overhang, and other vehicular design factors associated with light trucks. Report 350 further defines other supplemental test vehicles including an 8000 kg single-unit cargo truck and a 36,000 kg tractor-trailer to provide the basis for optional testing to meet higher performance levels.
Six test levels are defined for longitudinal barriers (e.g., bridge rails, median barriers, guardrails) that place an increasing level of demand on the structural capacity of a barrier system. The basic test level is Test Level 3 (TL-3). The structural adequacy test for this test level consists of a 2000-kg pickup truck (2000P) impacting a barrier at 100 km/h (62 mph) and 25 degrees. The severity test consists of an 820 kg (1800 lb) passenger car impacting the barrier at 100 km/h

38
(62 mph) and 20 degrees. At a minimum, all barriers on high-speed roadways on the National Highway System are required to meet TL-3 requirements.
Due to the severe consequences of cross-median crashes, some state DOTs elect to use barriers that are designed to restrain various sizes of trucks. Most standard 810 mm (32 inches) tall concrete barriers meet NCHRP Report 350 Test Level 4 (TL-4). The matrix for this test level includes test 4-12, which involves an 8000 kg (18,000 lb) single unit truck impacting the barrier at 80 km/h (50 mph) and 15 degrees. Higher containment barriers are sometimes used when conditions such as a high percentage of truck traffic warrant. Higher test levels (e.g., TL-5 and TL-6) include evaluation with 36,000 kg (80,000 lb) tractor-van trailers and tractor-tank trailers. Barriers designed for these test levels are necessarily taller, stronger, and more expensive to construct. BARRIER CLASSIFICATION Median barriers can be classified into three general categories: weak post systems, strong post systems, and rigid concrete barriers. Weak post systems are the most flexible and have the greatest dynamic deflection. The “weak” posts serve primarily to support the rail elements at their proper elevation for contact with an impacting vehicle. The posts are readily detached from the rail element(s) and dissipate little energy as they yield to the impacting vehicle and are pushed to the ground. Provided there is adequate space to accommodate the deflection, these barriers impose lower deceleration on an impacting vehicle and are, therefore, more forgiving and less likely to cause injury. Examples of weak-post barrier systems include cable, box beam, and weak-post W-beam. S3x5.7 steel posts are common to all three of these generic guardrail systems. Other types of “weak” posts are used in the proprietary high-tension cable barrier systems. In contrast, strong-post barriers incorporate larger, stronger posts that absorb significant energy as they rotate through the soil during an impact. The increased post stiffness results in reduced dynamic deflection and increased deceleration rates. Spacer blocks are used to offset the rail element from the posts to minimize vehicle snagging on the posts, which can impart high decelerations to the vehicle and/or cause the vehicle to become unstable. Examples of strong-post median barriers include the strong post W-beam and thrie beam. These barrier systems incorporate dual rail elements symmetrically blocked out from the sides of centrally positioned support posts. Both of these barrier systems have wood (e.g., 6 in. x 8 in.) and steel (e.g., W6x9) post variations. Due to the inherent severity of crossover crashes, the height of strong-post median barriers is sometimes increased beyond the height-post roadside barriers to provide additional containment capacity. In such designs a rubrail may be used to minimize potential post snagging problems associated with the increased ground clearance of the rail elements. Various types of concrete barrier are frequently used in median applications. The rigid nature of these concrete barriers results in essentially no dynamic deflection. Thus, vehicle deceleration rates and probability of injury are greater for concrete barriers than for more flexible systems. Common concrete barrier profiles that meet NCHRP Report 350 criteria include the New Jersey safety shape, F shape, constant or single slope, and vertical wall. When adequately designed and reinforced, these shapes are considered to meet TL-4 criteria when installed at a height of 32 inches and TL-5 when installed at a height of 42 inches and higher (18). While the New Jersey
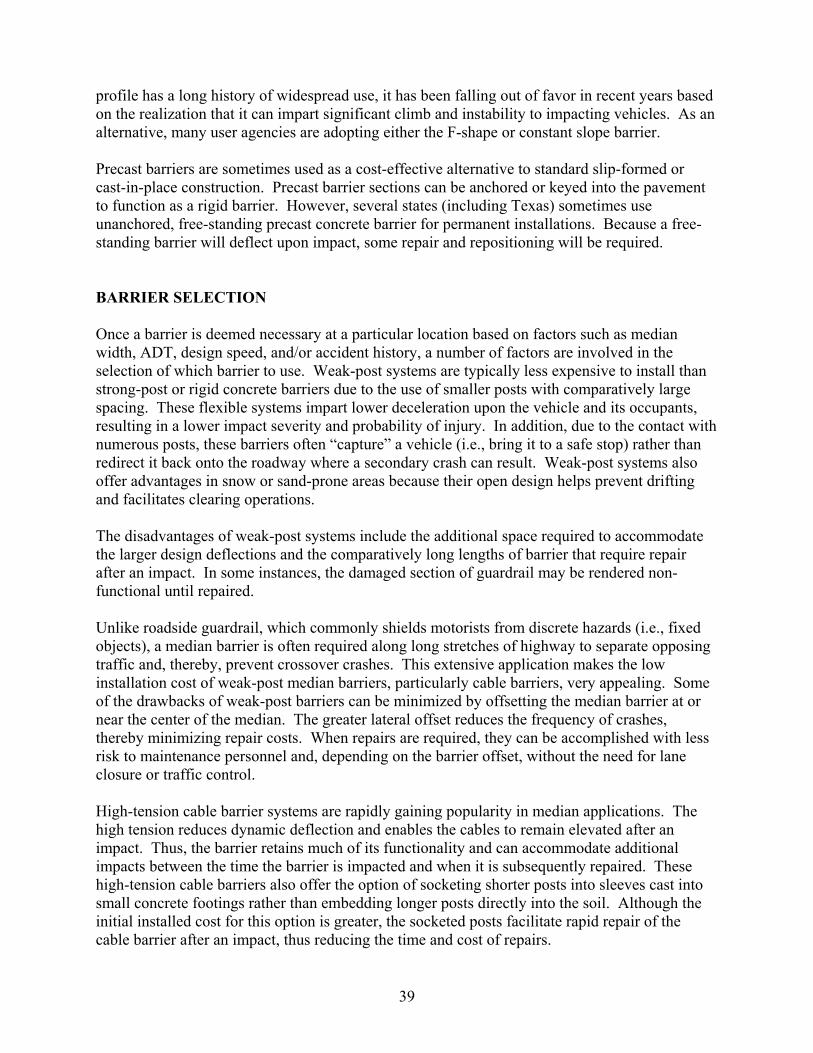
39
profile has a long history of widespread use, it has been falling out of favor in recent years based on the realization that it can impart significant climb and instability to impacting vehicles. As an alternative, many user agencies are adopting either the F-shape or constant slope barrier. Precast barriers are sometimes used as a cost-effective alternative to standard slip-formed or cast-in-place construction. Precast barrier sections can be anchored or keyed into the pavement to function as a rigid barrier. However, several states (including Texas) sometimes use unanchored, free-standing precast concrete barrier for permanent installations. Because a free-standing barrier will deflect upon impact, some repair and repositioning will be required. BARRIER SELECTION Once a barrier is deemed necessary at a particular location based on factors such as median width, ADT, design speed, and/or accident history, a number of factors are involved in the selection of which barrier to use. Weak-post systems are typically less expensive to install than strong-post or rigid concrete barriers due to the use of smaller posts with comparatively large spacing. These flexible systems impart lower deceleration upon the vehicle and its occupants, resulting in a lower impact severity and probability of injury. In addition, due to the contact with numerous posts, these barriers often “capture” a vehicle (i.e., bring it to a safe stop) rather than redirect it back onto the roadway where a secondary crash can result. Weak-post systems also offer advantages in snow or sand-prone areas because their open design helps prevent drifting and facilitates clearing operations. The disadvantages of weak-post systems include the additional space required to accommodate the larger design deflections and the comparatively long lengths of barrier that require repair after an impact. In some instances, the damaged section of guardrail may be rendered non-functional until repaired. Unlike roadside guardrail, which commonly shields motorists from discrete hazards (i.e., fixed objects), a median barrier is often required along long stretches of highway to separate opposing traffic and, thereby, prevent crossover crashes. This extensive application makes the low installation cost of weak-post median barriers, particularly cable barriers, very appealing. Some of the drawbacks of weak-post barriers can be minimized by offsetting the median barrier at or near the center of the median. The greater lateral offset reduces the frequency of crashes, thereby minimizing repair costs. When repairs are required, they can be accomplished with less risk to maintenance personnel and, depending on the barrier offset, without the need for lane closure or traffic control.
High-tension cable barrier systems are rapidly gaining popularity in median applications. The high tension reduces dynamic deflection and enables the cables to remain elevated after an impact. Thus, the barrier retains much of its functionality and can accommodate additional impacts between the time the barrier is impacted and when it is subsequently repaired. These high-tension cable barriers also offer the option of socketing shorter posts into sleeves cast into small concrete footings rather than embedding longer posts directly into the soil. Although the initial installed cost for this option is greater, the socketed posts facilitate rapid repair of the cable barrier after an impact, thus reducing the time and cost of repairs.

40
The high-tension cable barriers typically utilize three or four cables or wire ropes to contain, redirect, and often capture errant vehicles. The dynamic deflection is controlled by the amount of cable tension, strength and spacing of support posts, and the connection between the support posts and cables. Depending on the system and its configuration, deflections typically range from 6 to 10 ft. The height of the cables can be configured to provide containment for vehicles ranging from small passenger cars to single-unit trucks (SUTs). Several systems have been successfully tested and approved for TL-4 of NCHRP Report 350, which includes an impact by an 18,000-lb SUT. A review of seven successful bid prices across six states and of additional information gleaned from the literature (20, 21, 22) indicates that the cost to install high-tension cable barrier systems ranges from $63,000 to $112,000 per mile. The large range is likely attributable to several factors. Initially, due to contractors’ unfamiliarity with these relatively new systems, the bids will be higher until more experience is gained with their installation. This inexperience accounts for the higher end of the bid range. As competition in the marketplace increases, the cost of high-tension cable barriers is driven down, thereby influencing the lower end of the bid range. Whereas initially only one product was available, there are now at least five different high-tension systems competing against one another in the market. Another contributing factor to the wide bid range is the variation in installation costs between different systems and for different configurations of the same system (e.g., different post spacings to achieve a desired deflection, different post installation details — posts socketed in concrete footings versus direct embedment in soil, etc.). Information gleaned from the literature (20, 21, 23), state DOTs, and cable barrier manufacturers/suppliers indicates that the average repair cost after an impact is between $200 and $500 per impact. The repair cost is a function of the severity of the impact, the specific system being repaired, and the configuration of that system (e.g., concrete footings versus direct embedment of posts). Whereas the initial cost of posts socketed in concrete footings is higher than for posts directly embedded in the ground, the socketed posts can significantly reduce repair costs of the system. The reduced deflections of strong-post systems afford them a wider range of application than weak-post systems. Since the design deflections for these systems is typically in the range of 2 to 4 ft, they can be used in medians that are 10 ft or greater in width. Their higher installation cost (compared to weak-post systems) may be at least partially offset by lower repair cost that results from reduced lengths of barrier contact and damage. Unlike some weak-post systems, strong-post systems often do not require immediate repair to remain functional except after very severe impacts. However, the decelerations imposed by strong-post systems are greater than those imparted by weak-post systems, thus increasing the potential for injury. Strong-post barrier systems are also more sensitive to placement on slopes, and interaction with strong-post systems is more likely to result in vehicle instability. Concrete Barrier Concrete barrier is one of the most common types of median barrier in use today. Until the recent acceptance of high-tension cable barriers, TxDOT relied almost exclusively on concrete barriers for separating opposing lanes of traffic. Concrete barriers are well suited for

41
applications where there is little or no room for barrier deflection or when the consequences of barrier penetration demand positive containment. Concrete barriers are frequently used in narrow medians along high-speed, high-volume roadways due to their negligible deflection, low life-cycle cost, and maintenance-free characteristics. Although the installation cost is relatively high, concrete barriers require little or no maintenance or repair after an impact. This reduces the risk to maintenance personnel on high-volume, high-speed roadways, and eliminates the congestion and safety concerns associated with a lane closure when conducting barrier repairs. However, rigid barriers impose greater decelerations than more flexible systems. Depending on the impact conditions, so-called “safety shape” profiles can impart significant climb, pitch, and roll to an impacting vehicle. A vertical wall of proper height eliminates issues of vehicle instability, but will impart slightly higher decelerations and cause more damage. The cost of a concrete median barrier will depend on the method of construction and location of placement. Installation of a concrete median barrier at the center of a grassy median typically requires placement of a foundation or leveling pad and modification of drainage. These items can significantly increase the cost of concrete barrier placement. While cost will vary depending on the amount of site preparation required, documented costs for cast-in-place concrete median barriers are as high as $500,000 per mile. (22, 24) A less expensive option is to install free-standing, precast concrete barrier on the edge of a paved shoulder. However, to avoid safety concerns associated with loss of shoulder width, the paved shoulder is sometimes extended to accommodate the width of the barrier. Depending on the amount of site preparation required, type of barrier being installed, etc., documented costs for installation of precast concrete median barrier ranges from $130,000 to $290,000 per mile (24, 25). It should be noted that when a barrier is installed near the edge of a wide median, the frequency of barrier impacts will increase due to the proximity of the barrier to traffic lanes compared with a barrier that is placed at or near the center of the median. Whereas rigid, cast-in-place barriers are nearly maintenance free, free-standing precast barriers will deflect when hit. Thus, use of precast barriers necessitates repositioning of the barriers after impact, and may require repair or replacement of some sections after severe impacts. BARRIER PLACEMENT Having determined that a median barrier is needed and subsequently the type of barrier to be used, proper placement of the barrier must be determined. As a general rule, a barrier should be placed as far from the traveled way as possible while maintaining the proper operation and performance of the system. Although it is a safety feature, a median barrier does represent a hazard to motorists (albeit a less severe hazard than if a vehicle was to cross a median into oncoming traffic). The more lateral offset afforded a driver, the better the opportunity for the driver to regain control of the vehicle in the traversable median and avoid a barrier crash. However, as mentioned above, the clear space between the back side of the barrier and opposing traffic lanes should not be less than the design deflection of the barrier.
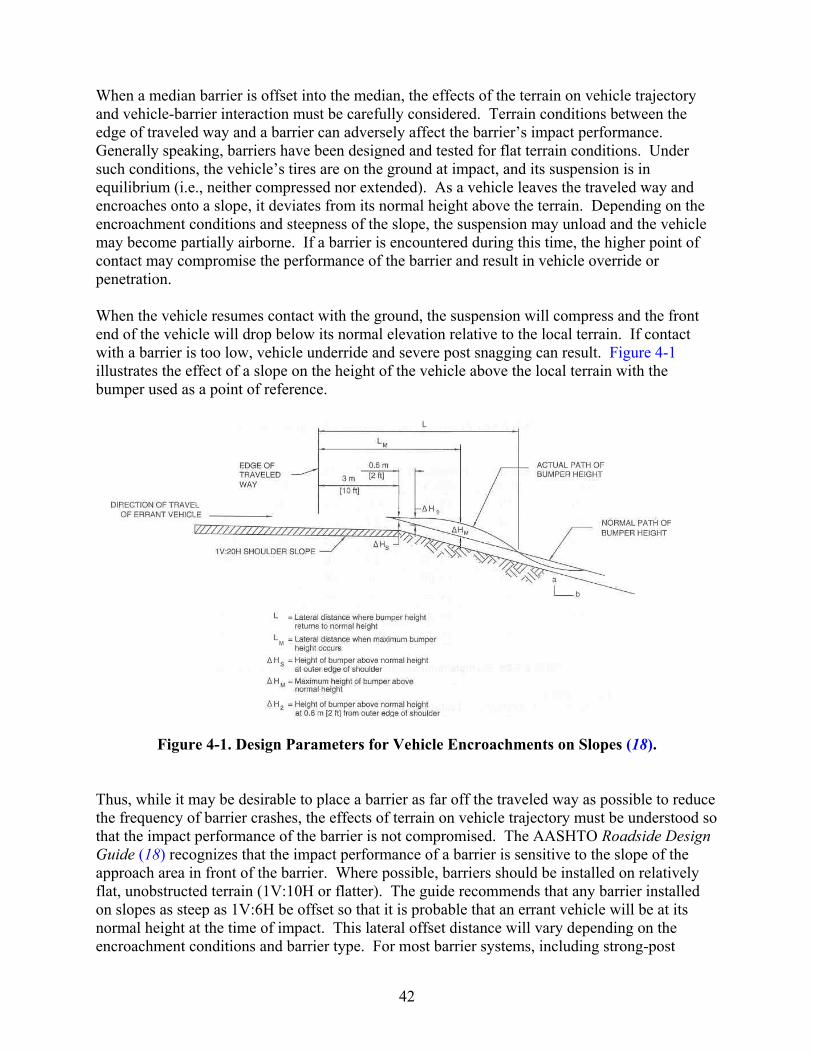
42
When a median barrier is offset into the median, the effects of the terrain on vehicle trajectory and vehicle-barrier interaction must be carefully considered. Terrain conditions between the edge of traveled way and a barrier can adversely affect the barrier’s impact performance. Generally speaking, barriers have been designed and tested for flat terrain conditions. Under such conditions, the vehicle’s tires are on the ground at impact, and its suspension is in equilibrium (i.e., neither compressed nor extended). As a vehicle leaves the traveled way and encroaches onto a slope, it deviates from its normal height above the terrain. Depending on the encroachment conditions and steepness of the slope, the suspension may unload and the vehicle may become partially airborne. If a barrier is encountered during this time, the higher point of contact may compromise the performance of the barrier and result in vehicle override or penetration. When the vehicle resumes contact with the ground, the suspension will compress and the front end of the vehicle will drop below its normal elevation relative to the local terrain. If contact with a barrier is too low, vehicle underride and severe post snagging can result. Figure 4-1 illustrates the effect of a slope on the height of the vehicle above the local terrain with the bumper used as a point of reference.
Figure 4-1. Design Parameters for Vehicle Encroachments on Slopes (18).
Thus, while it may be desirable to place a barrier as far off the traveled way as possible to reduce the frequency of barrier crashes, the effects of terrain on vehicle trajectory must be understood so that the impact performance of the barrier is not compromised. The AASHTO Roadside Design Guide (18) recognizes that the impact performance of a barrier is sensitive to the slope of the approach area in front of the barrier. Where possible, barriers should be installed on relatively flat, unobstructed terrain (1V:10H or flatter). The guide recommends that any barrier installed on slopes as steep as 1V:6H be offset so that it is probable that an errant vehicle will be at its normal height at the time of impact. This lateral offset distance will vary depending on the encroachment conditions and barrier type. For most barrier systems, including strong-post
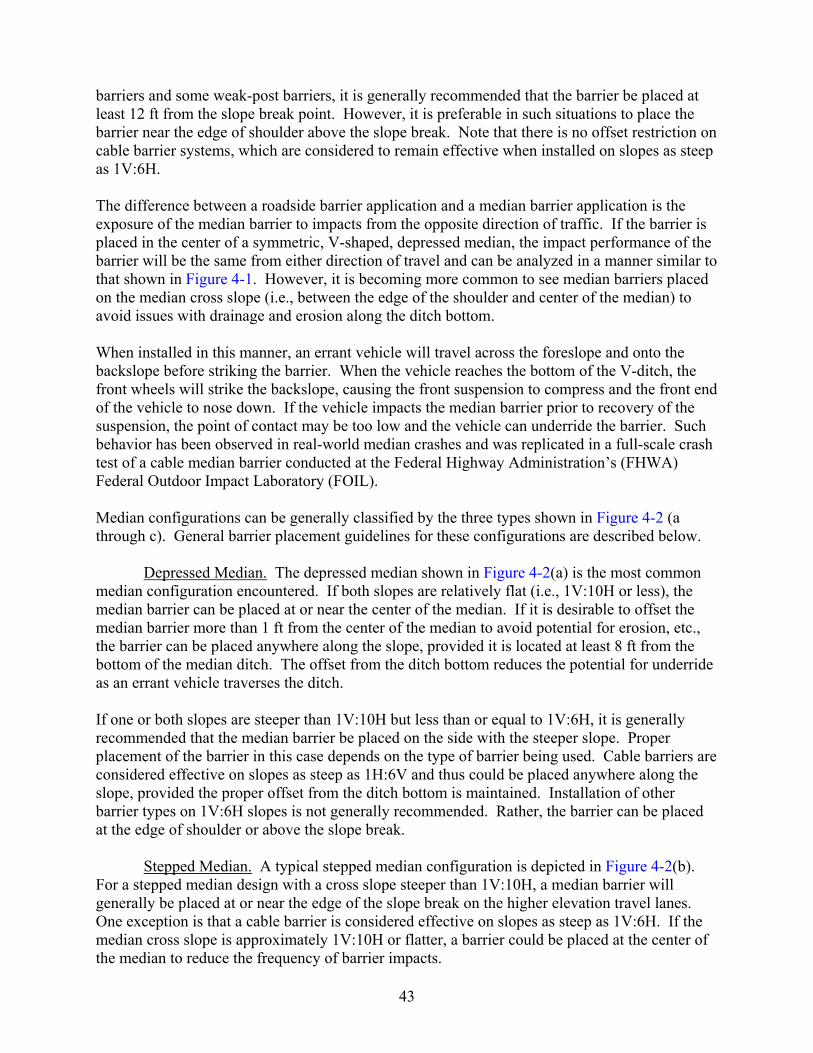
43
barriers and some weak-post barriers, it is generally recommended that the barrier be placed at least 12 ft from the slope break point. However, it is preferable in such situations to place the barrier near the edge of shoulder above the slope break. Note that there is no offset restriction on cable barrier systems, which are considered to remain effective when installed on slopes as steep as 1V:6H. The difference between a roadside barrier application and a median barrier application is the exposure of the median barrier to impacts from the opposite direction of traffic. If the barrier is placed in the center of a symmetric, V-shaped, depressed median, the impact performance of the barrier will be the same from either direction of travel and can be analyzed in a manner similar to that shown in Figure 4-1. However, it is becoming more common to see median barriers placed on the median cross slope (i.e., between the edge of the shoulder and center of the median) to avoid issues with drainage and erosion along the ditch bottom. When installed in this manner, an errant vehicle will travel across the foreslope and onto the backslope before striking the barrier. When the vehicle reaches the bottom of the V-ditch, the front wheels will strike the backslope, causing the front suspension to compress and the front end of the vehicle to nose down. If the vehicle impacts the median barrier prior to recovery of the suspension, the point of contact may be too low and the vehicle can underride the barrier. Such behavior has been observed in real-world median crashes and was replicated in a full-scale crash test of a cable median barrier conducted at the Federal Highway Administration’s (FHWA) Federal Outdoor Impact Laboratory (FOIL). Median configurations can be generally classified by the three types shown in Figure 4-2 (a through c). General barrier placement guidelines for these configurations are described below.
Depressed Median. The depressed median shown in Figure 4-2(a) is the most common median configuration encountered. If both slopes are relatively flat (i.e., 1V:10H or less), the median barrier can be placed at or near the center of the median. If it is desirable to offset the median barrier more than 1 ft from the center of the median to avoid potential for erosion, etc., the barrier can be placed anywhere along the slope, provided it is located at least 8 ft from the bottom of the median ditch. The offset from the ditch bottom reduces the potential for underride as an errant vehicle traverses the ditch.
If one or both slopes are steeper than 1V:10H but less than or equal to 1V:6H, it is generally recommended that the median barrier be placed on the side with the steeper slope. Proper placement of the barrier in this case depends on the type of barrier being used. Cable barriers are considered effective on slopes as steep as 1H:6V and thus could be placed anywhere along the slope, provided the proper offset from the ditch bottom is maintained. Installation of other barrier types on 1V:6H slopes is not generally recommended. Rather, the barrier can be placed at the edge of shoulder or above the slope break.
Stepped Median. A typical stepped median configuration is depicted in Figure 4-2(b).
For a stepped median design with a cross slope steeper than 1V:10H, a median barrier will generally be placed at or near the edge of the slope break on the higher elevation travel lanes. One exception is that a cable barrier is considered effective on slopes as steep as 1V:6H. If the median cross slope is approximately 1V:10H or flatter, a barrier could be placed at the center of the median to reduce the frequency of barrier impacts.
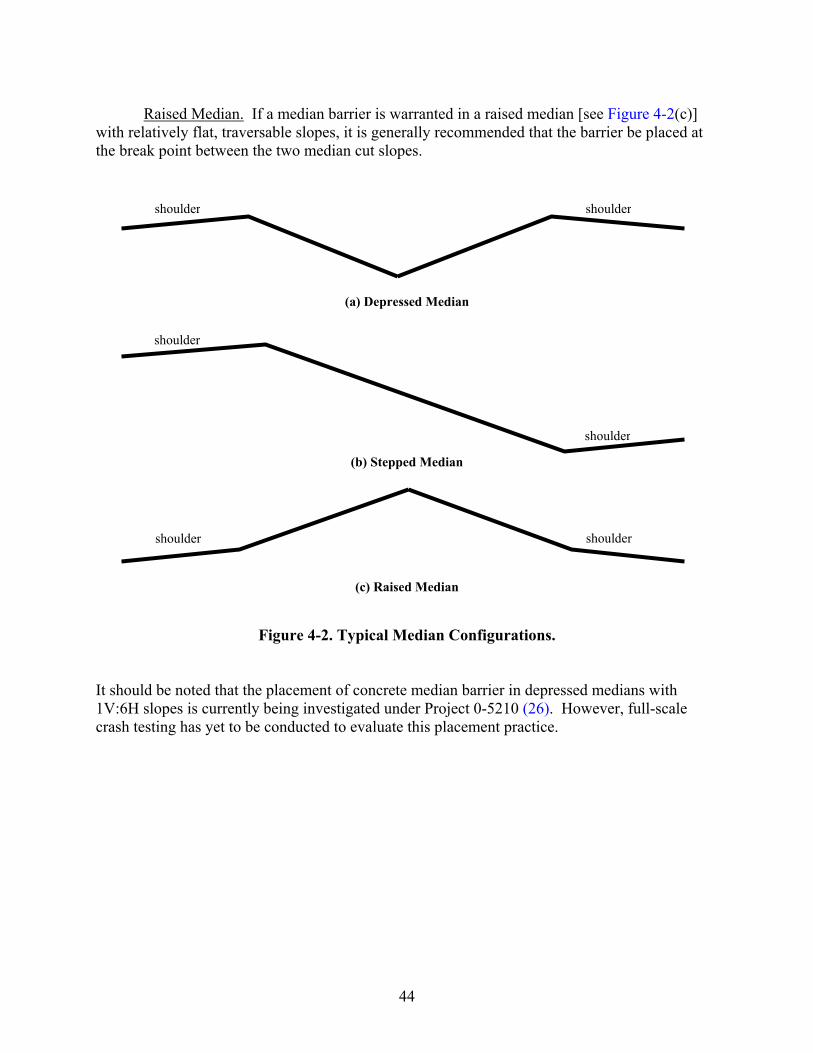
44
Raised Median. If a median barrier is warranted in a raised median [see Figure 4-2(c)]
with relatively flat, traversable slopes, it is generally recommended that the barrier be placed at the break point between the two median cut slopes.
(a) Depressed Median
(b) Stepped Median
(c) Raised Median
Figure 4-2. Typical Median Configurations. It should be noted that the placement of concrete median barrier in depressed medians with 1V:6H slopes is currently being investigated under Project 0-5210 (26). However, full-scale crash testing has yet to be conducted to evaluate this placement practice.
shoulder shoulder
shoulder
shoulder
shoulder shoulder
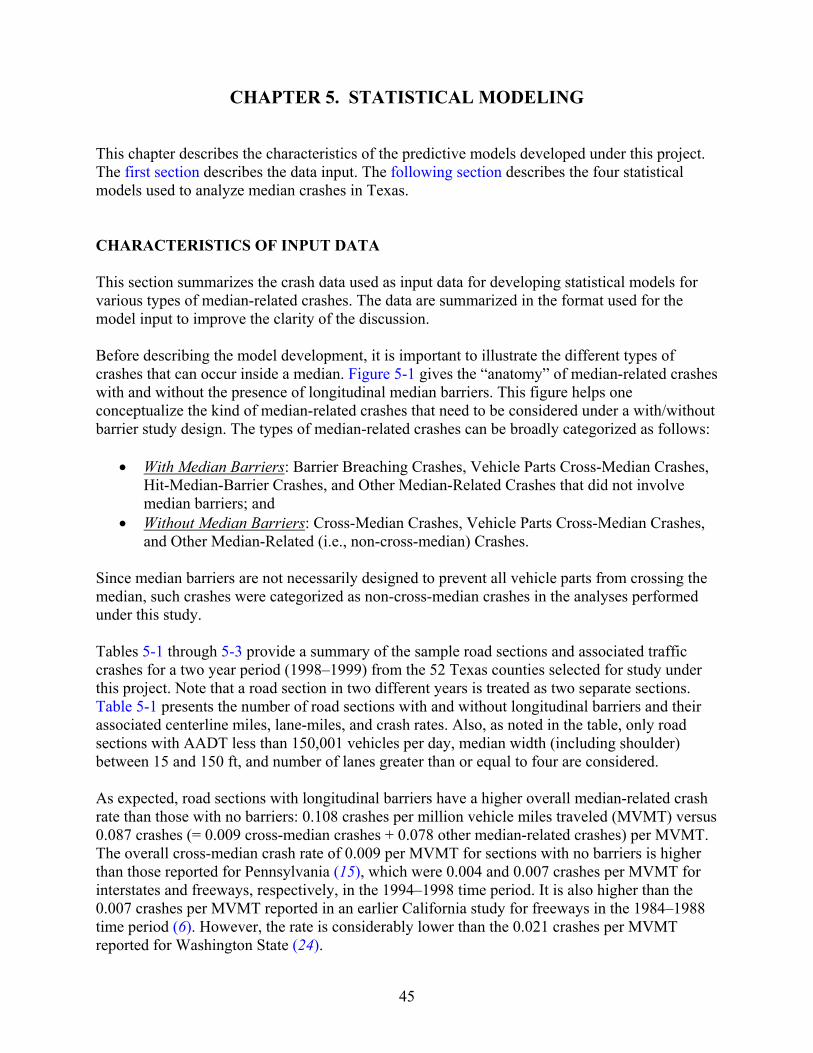
45
CHAPTER 5. STATISTICAL MODELING This chapter describes the characteristics of the predictive models developed under this project. The first section describes the data input. The following section describes the four statistical models used to analyze median crashes in Texas. CHARACTERISTICS OF INPUT DATA This section summarizes the crash data used as input data for developing statistical models for various types of median-related crashes. The data are summarized in the format used for the model input to improve the clarity of the discussion. Before describing the model development, it is important to illustrate the different types of crashes that can occur inside a median. Figure 5-1 gives the “anatomy” of median-related crashes with and without the presence of longitudinal median barriers. This figure helps one conceptualize the kind of median-related crashes that need to be considered under a with/without barrier study design. The types of median-related crashes can be broadly categorized as follows:
• With Median Barriers: Barrier Breaching Crashes, Vehicle Parts Cross-Median Crashes, Hit-Median-Barrier Crashes, and Other Median-Related Crashes that did not involve median barriers; and
• Without Median Barriers: Cross-Median Crashes, Vehicle Parts Cross-Median Crashes, and Other Median-Related (i.e., non-cross-median) Crashes.
Since median barriers are not necessarily designed to prevent all vehicle parts from crossing the median, such crashes were categorized as non-cross-median crashes in the analyses performed under this study. Tables 5-1 through 5-3 provide a summary of the sample road sections and associated traffic crashes for a two year period (1998–1999) from the 52 Texas counties selected for study under this project. Note that a road section in two different years is treated as two separate sections. Table 5-1 presents the number of road sections with and without longitudinal barriers and their associated centerline miles, lane-miles, and crash rates. Also, as noted in the table, only road sections with AADT less than 150,001 vehicles per day, median width (including shoulder) between 15 and 150 ft, and number of lanes greater than or equal to four are considered. As expected, road sections with longitudinal barriers have a higher overall median-related crash rate than those with no barriers: 0.108 crashes per million vehicle miles traveled (MVMT) versus 0.087 crashes (= 0.009 cross-median crashes + 0.078 other median-related crashes) per MVMT. The overall cross-median crash rate of 0.009 per MVMT for sections with no barriers is higher than those reported for Pennsylvania (15), which were 0.004 and 0.007 crashes per MVMT for interstates and freeways, respectively, in the 1994–1998 time period. It is also higher than the 0.007 crashes per MVMT reported in an earlier California study for freeways in the 1984–1988 time period (6). However, the rate is considerably lower than the 0.021 crashes per MVMT reported for Washington State (24).
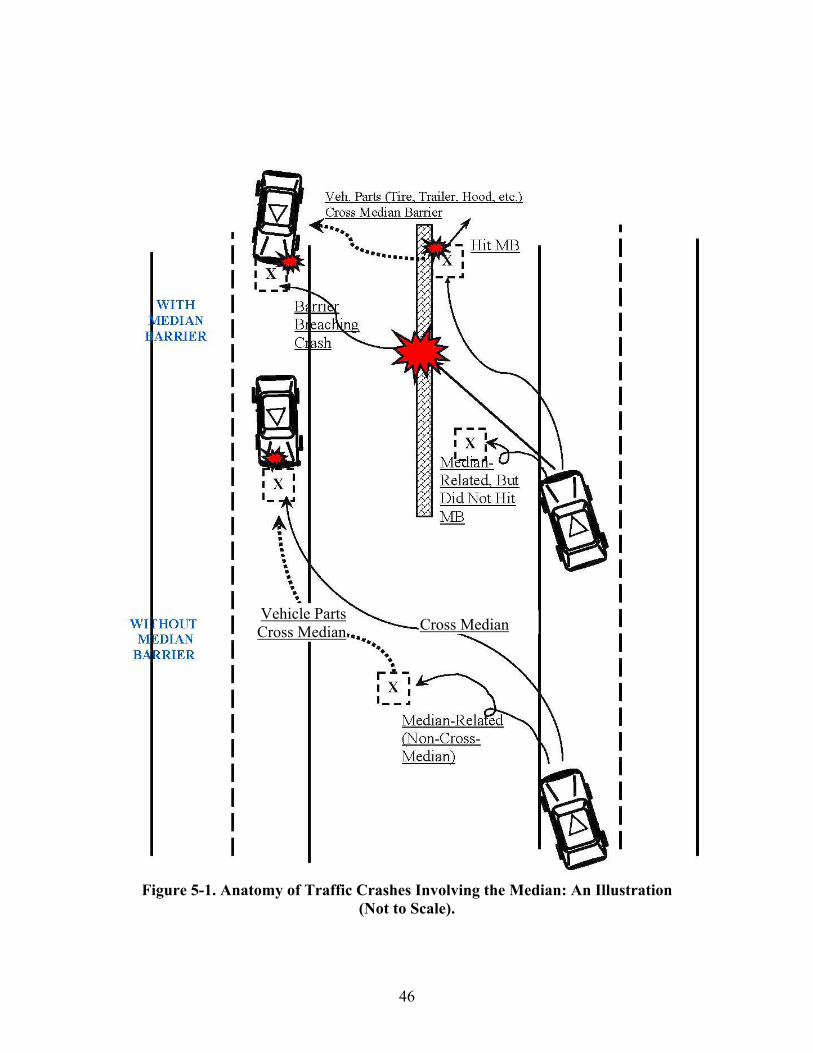
46
Figure 5-1. Anatomy of Traffic Crashes Involving the Median: An Illustration
(Not to Scale).
Cross MedianVehicle PartsCross Median
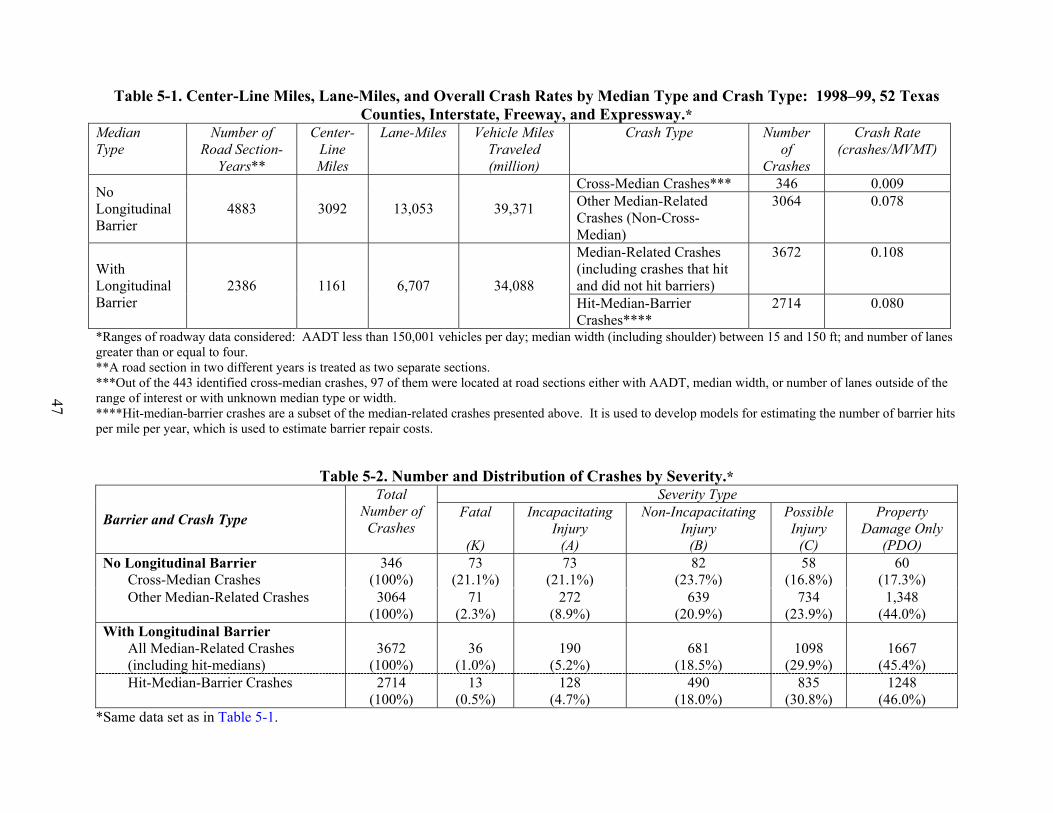
47
Table 5-1. Center-Line Miles, Lane-Miles, and Overall Crash Rates by Median Type and Crash Type: 1998–99, 52 Texas Counties, Interstate, Freeway, and Expressway.*
Median Type
Number of Road Section-
Years**
Center- Line Miles
Lane-Miles Vehicle Miles Traveled (million)
Crash Type Number of
Crashes
Crash Rate (crashes/MVMT)
Cross-Median Crashes*** 346 0.009 No Longitudinal Barrier
4883 3092 13,053 39,371 Other Median-Related Crashes (Non-Cross-Median)
3064 0.078
Median-Related Crashes (including crashes that hit and did not hit barriers)
3672 0.108 With Longitudinal Barrier
2386 1161 6,707 34,088 Hit-Median-Barrier Crashes****
2714 0.080
*Ranges of roadway data considered: AADT less than 150,001 vehicles per day; median width (including shoulder) between 15 and 150 ft; and number of lanes greater than or equal to four. **A road section in two different years is treated as two separate sections. ***Out of the 443 identified cross-median crashes, 97 of them were located at road sections either with AADT, median width, or number of lanes outside of the range of interest or with unknown median type or width. ****Hit-median-barrier crashes are a subset of the median-related crashes presented above. It is used to develop models for estimating the number of barrier hits per mile per year, which is used to estimate barrier repair costs.
Table 5-2. Number and Distribution of Crashes by Severity.* Severity Type
Barrier and Crash Type
Total Number of Crashes
Fatal
(K)
Incapacitating Injury
(A)
Non-Incapacitating Injury
(B)
Possible Injury
(C)
Property Damage Only
(PDO) No Longitudinal Barrier
Cross-Median Crashes 346
(100%) 73
(21.1%) 73
(21.1%) 82
(23.7%) 58
(16.8%) 60
(17.3%) Other Median-Related Crashes 3064
(100%) 71
(2.3%) 272
(8.9%) 639
(20.9%) 734
(23.9%) 1,348
(44.0%) With Longitudinal Barrier
All Median-Related Crashes (including hit-medians)
3672 (100%)
36 (1.0%)
190 (5.2%)
681 (18.5%)
1098 (29.9%)
1667 (45.4%)
Hit-Median-Barrier Crashes 2714 (100%)
13 (0.5%)
128 (4.7%)
490 (18.0%)
835 (30.8%)
1248 (46.0%)
*Same data set as in Table 5-1.

48
Table 5-3. Summary Statistics of the Sample Road Sections.* Sections with No Median Barrier
(4883 Section-Years) Barrier-Separated Sections
(2386 Section-Years) Mean Standard
Deviation Min Max Distribution Mean Standard
Deviation Min Max Distribution
Number of Crashes ----- ----- ----- ----- ----- ----- No Median Barrier
Cross-Median 0 6 ----- ----- Other Median-Related 0 19 ----- -----
With Median Barrier All Median-Related ----- ----- 0 23 Hit-Barrier ----- ----- 0 20
Exposure (in MVMT) (v=365*AADT*Segment Length/1,000,000)
8.1 11.1 0.01 208.5 ----- 14.3 20.7 0.01 181.7 -----
Year (1998 or 1999) ----- ----- ----- ----- 1998 = 49% 1999 = 51%
----- ----- ----- ----- 1998 = 40% 1999 = 60%
Median Width (ft) 67.9 24.8 15.0 148.0 46.7 21.0 16.0 150.0 ----- AADT (in 1000s) 39.9 27.6 6.6 149.5 83.7 40.0 11.2 149.8 ----- Number of Lanes ----- ----- ----- ----- 4 Ln = 84.3%
5 Ln = 2.6% 6 Ln = 10.1% 7 Ln = 0.5% 8 Ln = 1.5% 9 Ln = 0.5% 10 Ln = 0.3% >10 Ln = 0.2%
----- ----- ----- ----- 4 Ln = 29.8% 5 Ln = 3.4% 6 Ln = 43.2% 7 Ln = 1.6% 8 Ln = 20.1% 9 Ln = 0.3% 10 Ln = 1.6% >10 Ln = 0.1%
Posted Speed Limit (mph) ----- ----- ----- ----- 55 mph = 31.8% 60 mph = 2.4% 65 mph = 40.9% 70 mph = 24.9%
----- ----- ----- ----- 55 mph = 54.0% 60 mph = 13.5% 65 mph = 16.1% 70 mph = 16.4%
Cross-Median Crash Frequency by Median Width (ft)
15-20 ft=1 (0.3%) 21-30 ft=11 (3.2%) 31-50 ft=38 (11.0%) 51-74 ft=234 (67.6%) >75 ft=62 (17.9%) All width=346 (100%)
*Same data set as in Tables 5-1 and 5-2.

49
Table 5-2 shows the number and distribution of crashes by injury severity. By comparison, considerably higher proportions of cross-median crashes were involved in fatal (Type K) and incapacitating injury (Type A) crashes than those of other types of median-related crashes:
• Cross-median crashes (no barrier): 21.1% Type K + 21.1% Type A = 42.2%; • Other median-related crashes (no barrier): 2.3% Type K + 8.9% Type A = 11.2%; • Median-related crashes (with barrier): 1.0% Type K + 5.2% Type A = 6.2%.
No barrier-breaching crashes were found in the 792 potential cross-median and 825 other median-related crashes reviewed. This absence is probably because concrete barriers are the predominant type of median barriers used in Texas, and these barriers have very good containment capability. For lack of better data, the economic analysis to be presented in the next chapter assumes a three percent breaching rate (breaching crashes/reported barrier hits) for cable barriers as reported in the North Carolina study (9). For the New Jersey-profile concrete barrier, Martin and Quincy (27) reported a breaching rate (barrier-breaching crashes/all hit-barrier crashes) of 0.3 percent for high-speed roadways (with a posted speed limit of 80 mph or 130 km/hr) with narrow medians (10–16 ft or 3–5 m). These breaches were incurred mainly by large trucks. This low breaching rate for concrete barriers was used in the economic analysis. Table 5-3 contains summary statistics of the sample road sections, including number of crashes per road section by crash and median type, total vehicle miles incurred, AADT, number of lanes, and posted speed limit. Histograms (on the diagonals) and bivariate plots of some of these variables are presented in Figures 5-2 and 5-3 for sections with and without median barriers, respectively. Distributions of the sampled road sections by posted speed and number of lanes of travel are shown in Figures 5-4 and 5-5, respectively. On average, road sections with no median barrier have lower AADT, wider median width, fewer number of lanes, and higher posted speed limit than those sections with median barrier. The most typical road sections with no median barrier have four lanes and a posted speed limit of 65 mph, while a typical barrier-separated section has six lanes and a 55 mph posted speed. Despite this difference, it should be noted from the table that there is still considerable overlap in the range of key variables for the two groups of road sections, including their median width, AADT, and posted speed limit. Note that:
• The majority of the road sections have a rather flat median with sideslopes of 6:1 (horizontal:vertical) or flatter.
• Only a small fraction of road sections (less than 2 percent) contain subsections with horizontal curves with curvatures of 4 degrees (radius=435 m) or higher.
Also, one limitation of the data for barrier-separated sections is that, even though the median width is known, the exact placement (or offset) of the barrier from each side of the travel lane is not available. This limitation prevented further analysis of the data at the directional level.

50
Y (# Cross-Median Crashes)
Y (# Other Median-Related Crashes)
AADT (in 1000s)
Speed Limit (mph)
Median Width (ft)
# of Lanes
Y (# Cross-Median Crashes)
Y (# Other Median-Related Crashes)
AADT (in 1000s)
Speed Limit (mph)
Median Width (ft)
# of Lanes
Figure 5-2. Histograms and Bivariate Plots of Crash Frequencies, AADT, Posted Speed Limit, Median Width, and Number of Lanes: Road Sections with No Median Barrier.
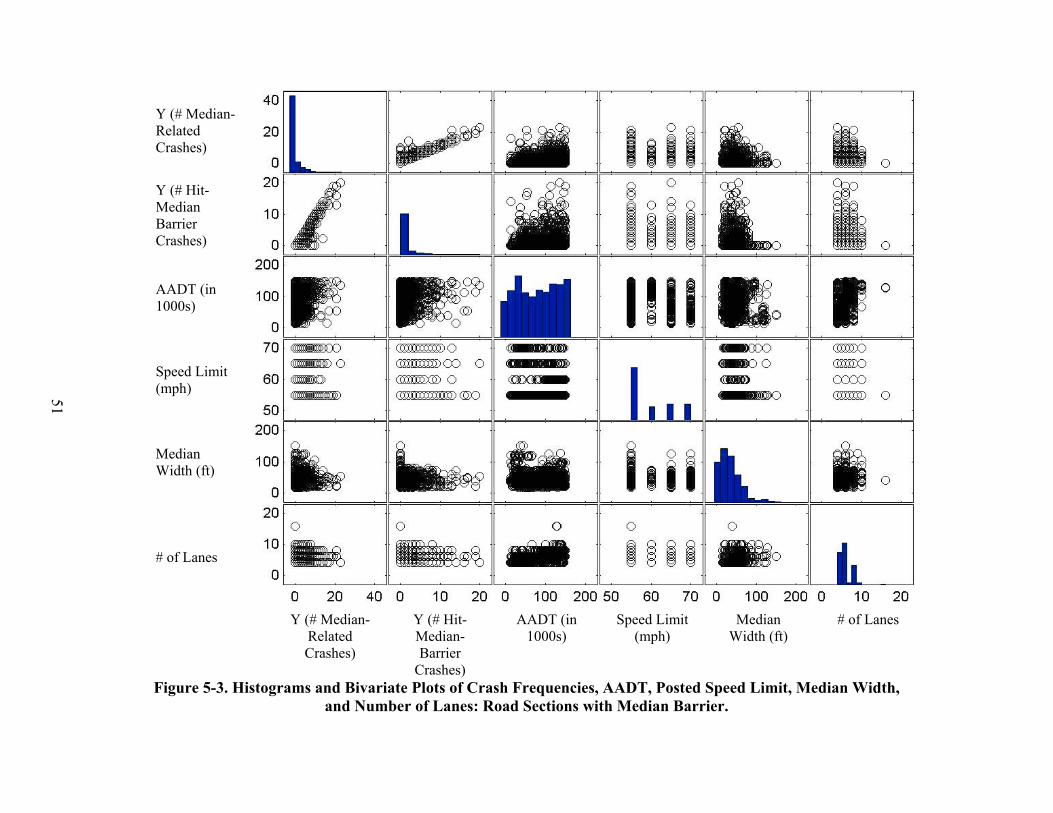
51
Y (# Median- Related Crashes)
Y (# Hit-Median Barrier Crashes)
AADT (in 1000s)
Speed Limit (mph)
Median Width (ft)
# of Lanes
Y (# Median- Related Crashes)
Y (# Hit-Median-Barrier
Crashes)
AADT (in 1000s)
Speed Limit (mph)
Median Width (ft)
# of Lanes
Figure 5-3. Histograms and Bivariate Plots of Crash Frequencies, AADT, Posted Speed Limit, Median Width, and Number of Lanes: Road Sections with Median Barrier.

52
31.8
54.0
2.4
13.5
40.9
16.1
24.9
16.4
0
10
20
30
40
50
60
Perc
enta
ge
55 60 65 70Posted Speed Limit (mph)
No Barrier(4,883 sec-yr)
Barrier-Separated(2,386 sec-yr)
Figure 5-4. Distribution of Sampled Road Sections by Posted Speed.
(4883 sec-yr) (2386 sec-yr)
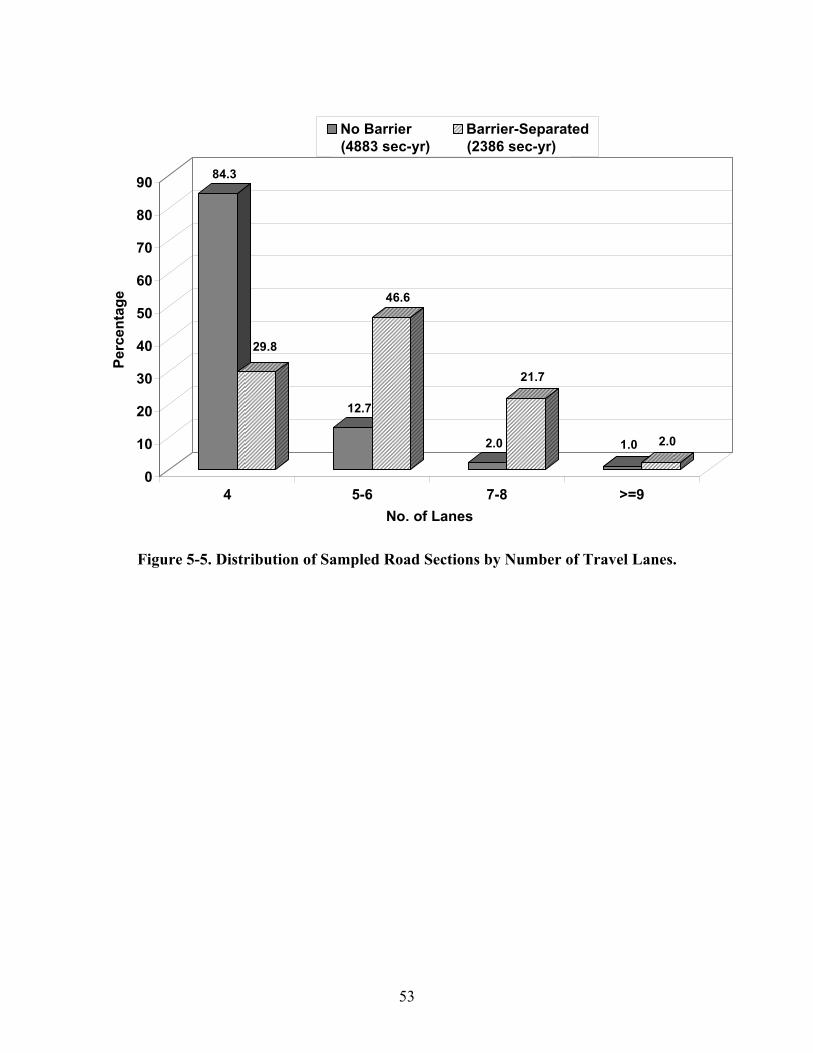
53
84.3
29.8
12.7
46.6
2.0
21.7
1.0 2.0
0
10
20
30
40
50
60
70
80
90
Perc
enta
ge
4 5-6 7-8 >=9No. of Lanes
No Barrier(4,883 sec-yr)
Barrier-Separated(2,386 sec-yr)
Figure 5-5. Distribution of Sampled Road Sections by Number of Travel Lanes.
(4883 sec-yr) (2386 sec-yr)

54
The distribution of cross-median crashes by several median width categories is also provided in Table 5-3 and is shown graphically in Figure 5-6. It is worthy to note that the majority of cross-median crashes (234 crashes, 67.6 percent) occurred on roads with median width between 51 and 74 ft. In addition, there were 62 crashes (about 18 percent) that occurred on roads with a median width of 75 ft or greater. Table 5-4 shows the estimates of crash costs for cross-median and other median-related crashes by median type, i.e., with and without median barrier. Data sources and examples of how estimates were derived are provided with the table. Using the current valuation system adopted by TxDOT in evaluating crash cost for safety-related projects, a cross-median fatal crash is estimated to cost society about $1.5 million on average. This is 24 percent higher than the value estimated for other median-related fatal crashes (with no barrier), which is about $1.16 million dollars.
111
38
234
62
0
50
100
150
200
250
No.
of C
MC
15-20 21-30 31-50 51-74 75-150Median Width (ft)
Total = 346
Figure 5-6. Distribution of Sampled Cross-Median Crashes (CMC) by Median Width.

55
Table 5-4. Estimates of Crash Costs for Cross-Median and Other Median-Related Crashes by Median Type.
Number of Persons or Vehicles Involved with the Maximum Severity Incurred per Crash, 1998-99**
Adjusted Crash Costs (Year 2000 $)***
No Median Barrier With Median
Barrier No Median Barrier With Median
Barrier CRASH SEVERITY TYPE
Estimated Crash Cost
For All State
Highways (Yr 2000 $)*
All State Highways
Cross-Median Crashes
Other Median- Related Crashes
All Median- Related Crashes
Cross-Median Crashes
Other Median- Related Crashes
All Median- Related Crashes
Fatal (K) 1,191,887 1.15 1.43 1.12 1.17 1,482,086 1,160,794 1,212,615 Incapacitating (A) 69,199 1.31 1.57 1.32 1.21 82,933 69,727 63,917 Non-Incapacitating (B) 25,218 1.39 1.79 1.26 1.21 32,475 22,859 21,952 Possible Injury (C) 14,198 1.57 1.88 1.36 1.36 17,001 12,299 12,299 Property Damage Only (PDO) 1,969 1.78 2.18 1.10 1.13 2,411 1,217 1,250 Notes: *The cost was estimated by TxDOT Traffic Operations Division, based on the National Safety Council’s estimate of societal cost (not the comprehensive cost) for crashes which occurred on all state-maintained highways. The estimated crash costs will roughly triple if comprehensive costs are used. **Obtained from Texas electronic traffic crash records. For example, on average, for fatal crashes, 1.15 persons were killed per crash in all state system fatal crashes; while 1.43 persons were killed in a fatal cross-median crash. For PDO crashes, 1.78 vehicles were involved in each PDO crash for all state highways; while 1.1 vehicles were involved, on average, in a PDO median-related (non-cross-median) crash with no longitudinal barrier present. ***These adjusted costs were developed by the authors of this study. For example, the adjusted cost for a cross-median fatal crash is calculated as $1,191,887*(1.43/1.15)=$1,482,086 and as $69,199*(1.57/1.31)=$82,933 for cross-median incapacitating crashes.

56
STATISTICAL MODELS In this project, we developed four crash frequency models, one each for:
• cross-median crashes on sections with no barrier; • other median-related crashes on sections with no barrier; • all median-related crashes on sections with barrier; and • hit-median-barrier-only crashes on sections with barrier.
Statistical relationships between traffic crash and traffic flow and other geometric variables for road sections have been extensively modeled and evaluated in recent years. The Poisson-gamma model with the following functional and probabilistic structures is particularly favored (28, 29): The number of crashes at the i-th section, iY , when conditional on its mean iµ , is assumed to be Poisson distributed and independent over all sections as:
( )| ~ind
i i iY Poµ µ where 1, 2, ,i n= K (Eq. 5-1) The mean of the Poisson is structured as:
( ) ( )~
0 1exp exp J
ii i i i ij ij ije x eµ ν λ ν β β
== = + +∑ (Eq. 5-2)
where:
iν an offset term indicating total vehicle miles of travel incurred on section i , which basically quantifies the amount of vehicle exposure (or opportunity) for crash risk at the section.
Other covariates as shown in Table 5-3 are indicated by: ijx vector for the j-th covariate.
0β an unknown “fixed effect” intercept term,
jβ unknown “fixed effect” parameters, and
ie an unstructured random effect independent of all covariates which has a typical assumption that exp( )ie is independent and gamma distributed with mean equal to 1 and variance 1 ψ for all i (with 0ψ > ).
This particular formulation provides flexible and attractive statistical properties. For example, conditional on iµ and ψ , iY can be shown to be distributed as a negative binomial (NB) random
variable with mean and variance of ~ ~
1i i i iν λ ν λ ψ⎛ ⎞+⎜ ⎟⎝ ⎠
, respectively. Also, exp( )ie can be viewed
as unmodeled (or unmeasured) heterogeneities due to omitted exogenous variables and intrinsic randomness.
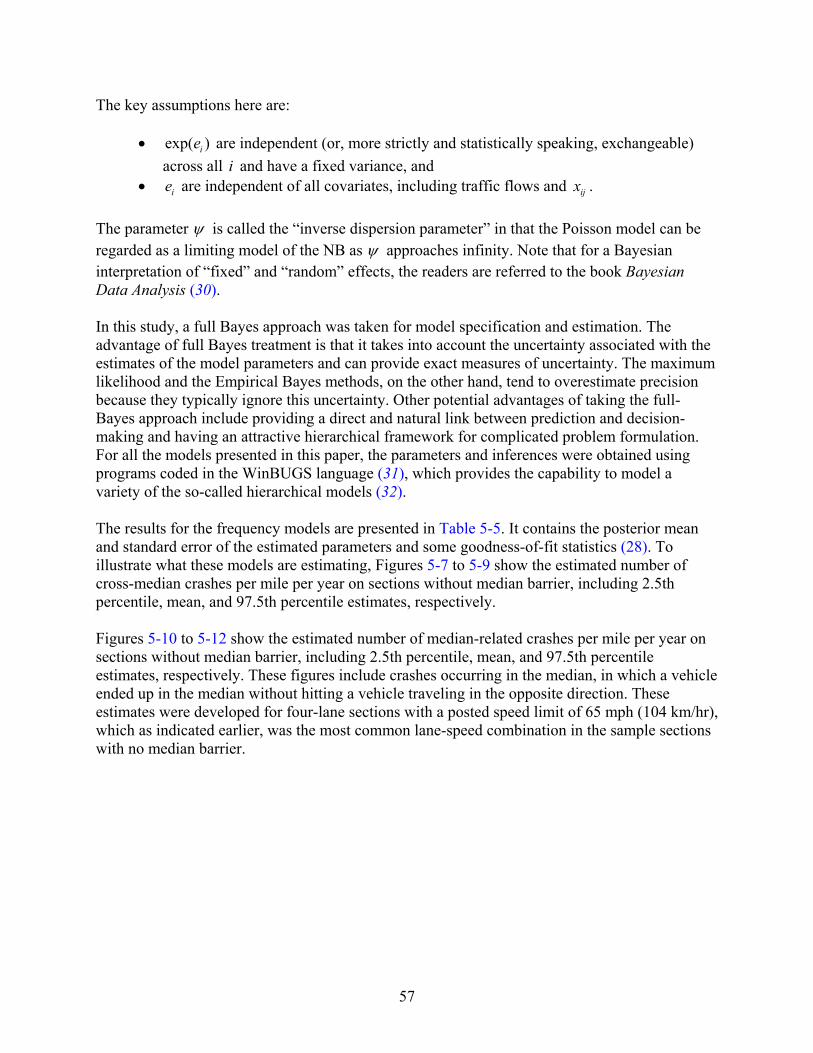
57
The key assumptions here are:
• exp( )ie are independent (or, more strictly and statistically speaking, exchangeable) across all i and have a fixed variance, and
• ie are independent of all covariates, including traffic flows and ijx . The parameter ψ is called the “inverse dispersion parameter” in that the Poisson model can be regarded as a limiting model of the NB as ψ approaches infinity. Note that for a Bayesian interpretation of “fixed” and “random” effects, the readers are referred to the book Bayesian Data Analysis (30). In this study, a full Bayes approach was taken for model specification and estimation. The advantage of full Bayes treatment is that it takes into account the uncertainty associated with the estimates of the model parameters and can provide exact measures of uncertainty. The maximum likelihood and the Empirical Bayes methods, on the other hand, tend to overestimate precision because they typically ignore this uncertainty. Other potential advantages of taking the full-Bayes approach include providing a direct and natural link between prediction and decision-making and having an attractive hierarchical framework for complicated problem formulation. For all the models presented in this paper, the parameters and inferences were obtained using programs coded in the WinBUGS language (31), which provides the capability to model a variety of the so-called hierarchical models (32). The results for the frequency models are presented in Table 5-5. It contains the posterior mean and standard error of the estimated parameters and some goodness-of-fit statistics (28). To illustrate what these models are estimating, Figures 5-7 to 5-9 show the estimated number of cross-median crashes per mile per year on sections without median barrier, including 2.5th percentile, mean, and 97.5th percentile estimates, respectively. Figures 5-10 to 5-12 show the estimated number of median-related crashes per mile per year on sections without median barrier, including 2.5th percentile, mean, and 97.5th percentile estimates, respectively. These figures include crashes occurring in the median, in which a vehicle ended up in the median without hitting a vehicle traveling in the opposite direction. These estimates were developed for four-lane sections with a posted speed limit of 65 mph (104 km/hr), which as indicated earlier, was the most common lane-speed combination in the sample sections with no median barrier.

58
Table 5-5. Posterior Mean and Standard Error of the Estimated Parameters of Crash Frequency Models and Some Goodness-of-Fit Statistics.
Crash Frequency Model No Barrier With Barrier
Covariate (Coefficient) Cross-Median
Crashes Other Median-
Related Crashes All Median-Related
Crashes Hit-Median-
Barrier Crashes Offset = Exposure (in MVMT) = vi (=365*AADT*Segment Length/1,000,000)
----- ----- ----- -----
Intercept Term Overall Intercept (β0) -3.779 (±0.48) -2.239 (±0.07) -1.771 (±0.07) -1.740 (±0.09) Dummy Variable for 1999: 1 if 1999 and 0 if 1998 (β1) 1.163 (±0.14) -0.068 (±0.05) -0.031 (±0.05) -0.018 (±0.06)
Median Width (in ft) (β2) -0.011 (±0.003) -0.002 (±0.001) -0.006 (±0.001) -0.013 (±0.002) Log(AADT) (β3) (AADT in 1000s)
----- ----- ----- -----
Number of Lanes (= β4) -0.293 (±0.09) ----- ----- ----- Posted Speed Limit (mph)
Dummy Variable for 60 mph (=1 if 60 mph; =0 otherwise) (β5) -0.139 (±0.54) -0.342 (±0.17) -0.575 (±0.08) -0.663 (±0.10) Dummy Variable for 65 mph (=1 if 65 mph; =0 otherwise) (β6) 0.500 (±0.16) -0.126 (±0.06) -0.075 (±0.07) -0.188 (±0.09) Dummy Variable for 70 mph (=1 if 70 mph; =0 otherwise) (β7) 0.284 (±0.18) -0.079 (±0.07) -0.007 (±0.07) 0.004 (±0.09)
Inverse Dispersion Parameter Inverse Dispersion Parameter for This Model (Ψ) 0.727 (±0.17) 1.388 (±0.12) 1.956 (±0.16) 1.464 (±0.13) Inverse Dispersion Parameter for Worst Possible Model of Crash Frequency (Ψ0
freq) 0.158 (±0.02) 0.429 (±0.02) 0.466 (±0.02) 0.367 (±0.02) Goodness-of-Fit Measures
Deviance Information Criterion/Sample Size (DIC/n) 0.39 1.71 2.54 2.14 R2
Ψ,freq = 1 – (1/ Ψ)/(1/ Ψ0freq) 0.78 0.69 0.76 0.75
Notes: *All models were structured using the full-Bayes framework with non-informative priors (or hyper-priors) **Parameters (β’s and Ψ) were estimated using Markov chain Monte Carlo (MCMC) techniques and the values shown in the table are their posterior means ***Values in parentheses are the estimated one standard error of parameters to its left based on the posterior density of the parameter **** ----- indicates not statistically significant at a 10% significance level
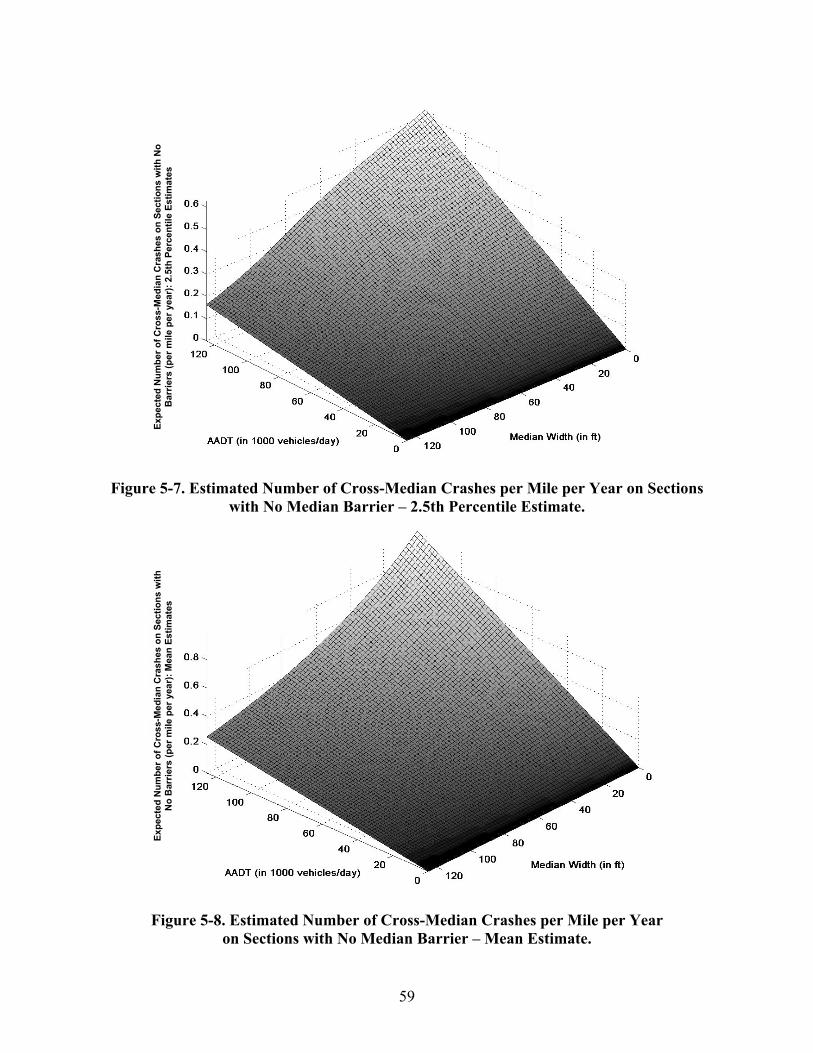
59
Figure 5-7. Estimated Number of Cross-Median Crashes per Mile per Year on Sections with No Median Barrier – 2.5th Percentile Estimate.
Figure 5-8. Estimated Number of Cross-Median Crashes per Mile per Year on Sections with No Median Barrier – Mean Estimate.
Expe
cted
Num
ber o
f Cro
ss-M
edia
n C
rash
es o
n Se
ctio
ns w
ith N
o B
arrie
rs (p
er m
ile p
er y
ear)
: 2.5
th P
erce
ntile
Est
imat
es
Expe
cted
Num
ber o
f Cro
ss-M
edia
n C
rash
es o
n Se
ctio
ns w
ith
No
Bar
riers
(per
mile
per
yea
r): M
ean
Estim
ates

60
Figure 5-9. Estimated Number of Cross-Median Crashes per Mile per Year on Sections
with No Median Barrier – 97.5th Percentile Estimate.
Figure 5-10. Estimated Number of Median-Related Crashes per Mile per Year on Sections
with No Median Barrier – 2.5th Percentile Estimate.
Expe
cted
Num
ber o
f Cro
ss-M
edia
n C
rash
es o
n Se
ctio
ns w
ith
No
Bar
riers
(per
mile
per
yea
r): 9
7.5t
h Pe
rcen
tile
Estim
ates
Ex
pect
ed N
umbe
r of M
edia
n-R
elat
ed C
rash
es o
n Se
ctio
ns w
ith
No
Bar
riers
(per
mile
per
yea
r): 2
.5th
Per
cent
ile E
stim
ates

61
Figure 5-11. Estimated Number of Median-Related Crashes per Mile per Year on Sections with No Median Barrier – Mean Estimate.
Figure 5-12. Estimated Number of Median-Related Crashes per Mile per Year on Sections
with No Median Barrier – 97.5th Percentile Estimate.
Expe
cted
Num
ber o
f Med
ian-
Rel
ated
Cra
shes
on
Sect
ions
with
N
o B
arrie
rs (p
er m
ile p
er y
ear)
: Mea
n Es
timat
es
Expe
cted
Num
ber o
f Med
ian-
Rel
ated
Cra
shes
on
Sect
ions
with
N
o B
arrie
rs (p
er m
ile p
er y
ear)
: 97.
5th
Perc
entil
e Es
timat
es
62
Figures 5-13 to 5-15 show the estimated number of median-related crashes per mile per year on sections with a median barrier, including 2.5th percentile, mean, and 97.5th percentile estimates, respectively. The figures include all crashes occurring in the median, whether the vehicle hit the barrier or not. Figures 5-16 to 5-18 show the number of vehicles hitting a median barrier per mile per year for the 2.5th percentile, mean, and 97.5th percentile estimates, respectively. Using an ordered multinomial logit model framework (the proportional odds version), crash severity models were also developed for each of the four barrier-crash type combinations listed earlier. All five crash severity types (i.e., K, A, B, C, and PDO) were considered in the model. Detailed statistical description of the models can be found in Section 4.12 of the book Bayesian Statistical Modeling (33). More complicated non-parallel versions of the model framework were also tested but were not found to be warranted based on some goodness-of-fit test criteria. Final modeling results are presented in Table 5-6. The models were formulated to ensure that larger and positive values of β regression parameter and covariates lead to an increased chance of belonging to the higher severity levels (33). To illustrate these estimated models, Figures 5-19 to 5-21 show the mean estimates of probabilities by AADT and median width for a median-related crash to end up as a Type K, A, or B crash for median-related crashes on sections with and without barriers and for a vehicle hitting a median barrier. Note that none of the explanatory variables were found to be statistically significant in the severity model for cross-median crashes (due most likely to a small sample size), and the raw severity distribution as shown in Table 5-2 was adopted in the economic analysis.

63
Figure 5-13. Estimated Number of Median-Related Crashes per Mile per Year on Sections
with a Median Barrier – 2.5th Percentile Estimate.
Figure 5-14. Estimated Number of Median-Related Crashes per Mile per Year on Sections
with a Median Barrier – Mean Estimate.
Expe
cted
Num
ber o
f Med
ian-
Rel
ated
Cra
shes
on
Bar
rier-
Sepa
rate
d Se
ctio
ns
(per
mile
per
yea
r): 2
.5th
Per
cent
ile E
stim
ates
Ex
pect
ed N
umbe
r of M
edia
n-R
elat
ed C
rash
es o
n
Bar
rier-
Sepa
rate
d Se
ctio
ns (p
er m
ile p
er y
ear)
: Mea
n Es
timat
es
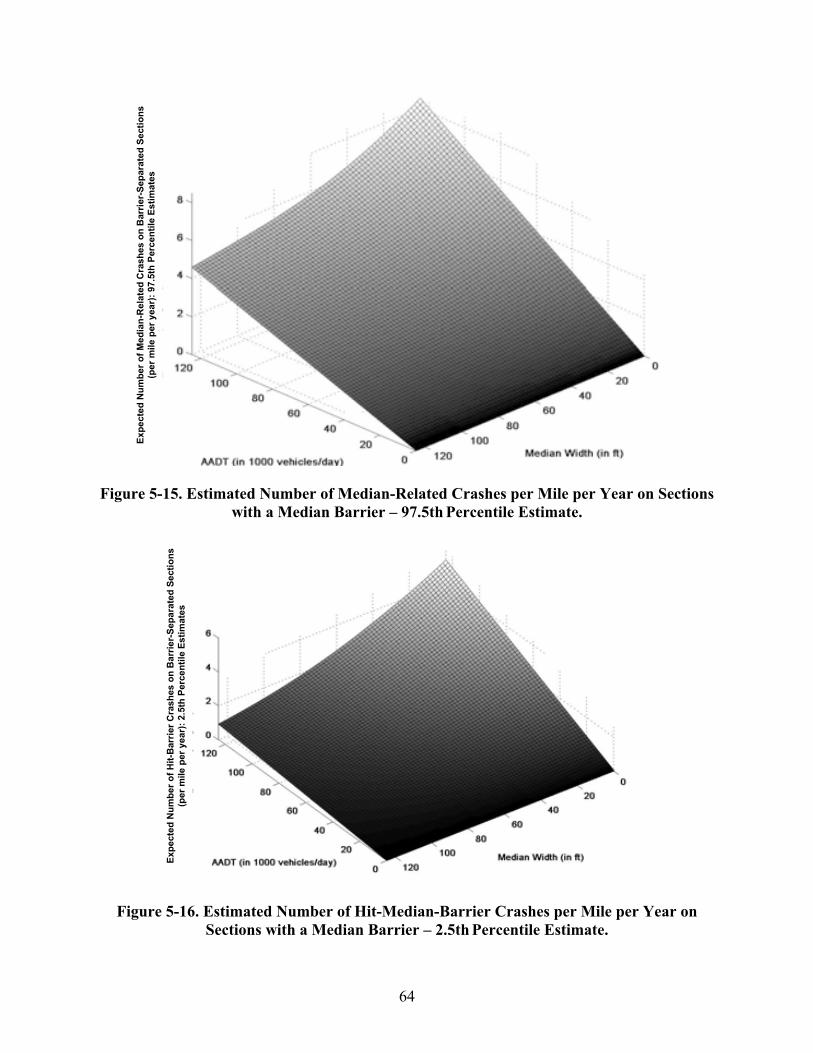
64
Figure 5-15. Estimated Number of Median-Related Crashes per Mile per Year on Sections
with a Median Barrier – 97.5th Percentile Estimate.
Figure 5-16. Estimated Number of Hit-Median-Barrier Crashes per Mile per Year on Sections with a Median Barrier – 2.5th Percentile Estimate.
Expe
cted
Num
ber o
f Med
ian-
Rel
ated
Cra
shes
on
Bar
rier-
Sepa
rate
d Se
ctio
ns
(per
mile
per
yea
r): 9
7.5t
h Pe
rcen
tile
Estim
ates
Expe
cted
Num
ber o
f Hit-
Bar
rier C
rash
es o
n B
arrie
r-Se
para
ted
Sect
ions
(p
er m
ile p
er y
ear)
: 2.5
th P
erce
ntile
Est
imat
es

65
Figure 5-17. Estimated Number of Hit-Median-Barrier Crashes per Mile per Year on
Sections with a Median Barrier – Mean Estimate.
Figure 5-18. Estimated Number of Hit-Median-Barrier Crashes per Mile per Year on
Sections with a Median Barrier – 97.5th Percentile Estimate.
Expe
cted
Num
ber o
f Hit-
Bar
rier C
rash
es o
n B
arrie
r-Se
para
ted
Sect
ions
(p
er m
ile p
er y
ear)
: Mea
n Es
timat
es
Expe
cted
Num
ber o
f Hit-
Bar
rier C
rash
es o
n B
arrie
r-Se
para
ted
Sect
ions
(p
er m
ile p
er y
ear)
: 97
.5th
Per
cent
ile E
stim
ates

66
Table 5-6. Posterior Mean and Standard Error of the Estimated Parameters of Crash Severity Models and Some Goodness-of-Fit Statistics.
Crash Frequency Model No Barrier With Barrier
Covariate (Coefficient) Cross-Median
Crashes Other Median-
Related Crashes All Median-Related
Crashes Hit-Median-
Barrier Crashes Cutpoints (to represent 5 levels of crash severities) -----
θ1 0.139 (±0.11) 0.070 (±0.37) 0.608 (±0.34) θ2 1.138 (±0.11) 1.381 (±0.37) 1.979 (±0.34) θ3 2.464 (±0.12) 2.998 (±0.68) 3.697 (±0.35) θ4 4.144 (±0.16) 4.926 (±0.16) 6.169 (±0.45)
Dummy Variable for 1999: 1 if 1999 and 0 if 1998 (β1) ----- 0.1085 (±0.07) 0.038 (±0.07) 0.016 (±0.07) Median Width (in ft) (β2) ----- 0.0032 (±0.001) -0.0032 (±0.002) -0.0031 (±0.002) Log(AADT) (β3) (AADT in 1000s)
----- ----- 0.1626 (±0.08) 0.293 (±0.08)
Number of Lanes (= β4) ----- ----- -0.060 (±0.026) -0.066 (±0.03) Posted Speed Limit (mph)
Dummy Variable for 60 mph (=1 if 60 mph; =0 otherwise) (β5) ----- 0.377 (±0.22) 0.298 (±0.10) 0.257 (±0.12) Dummy Variable for 65 mph (=1 if 65 mph; =0 otherwise) (β6) ----- 0.159 (±0.08) -0.243 (±0.10) -0.423 (±0.12) Dummy Variable for 70 mph (=1 if 70 mph; =0 otherwise) (β7) ----- 0.183 (±0.09) -0.025 (±0.09) 0.007 (±0.09)
Goodness-of-Fit Measures Deviance Information Criterion/Sample Size (DIC/n) ----- 8180/3064 8773/3672 6504/3672 Worst Possible DIC Value/n 9834/3064 11,438/3672 10,118/3672
Notes: * All models were structured using the full-Bayes framework with non-informative priors (or hyper-priors) ** Parameters (θ and β’s) were estimated using Markov chain Monte Carlo (MCMC) techniques and the values shown in the table are their posterior means *** Values in parentheses are the estimated 1 standard error of parameters to its left based on the posterior density of the parameter **** ----- indicates not statistically significant at a 10% level

67
Figure 5-19. Estimated Probability for a Median-Related Crash to be a KAB Crash on Sections with No Barriers: Mean Estimates.
Figure 5-20. Estimated Probability for a Median-Related Crash to be a KAB Crash on Sections with Barriers: Mean Estimates.
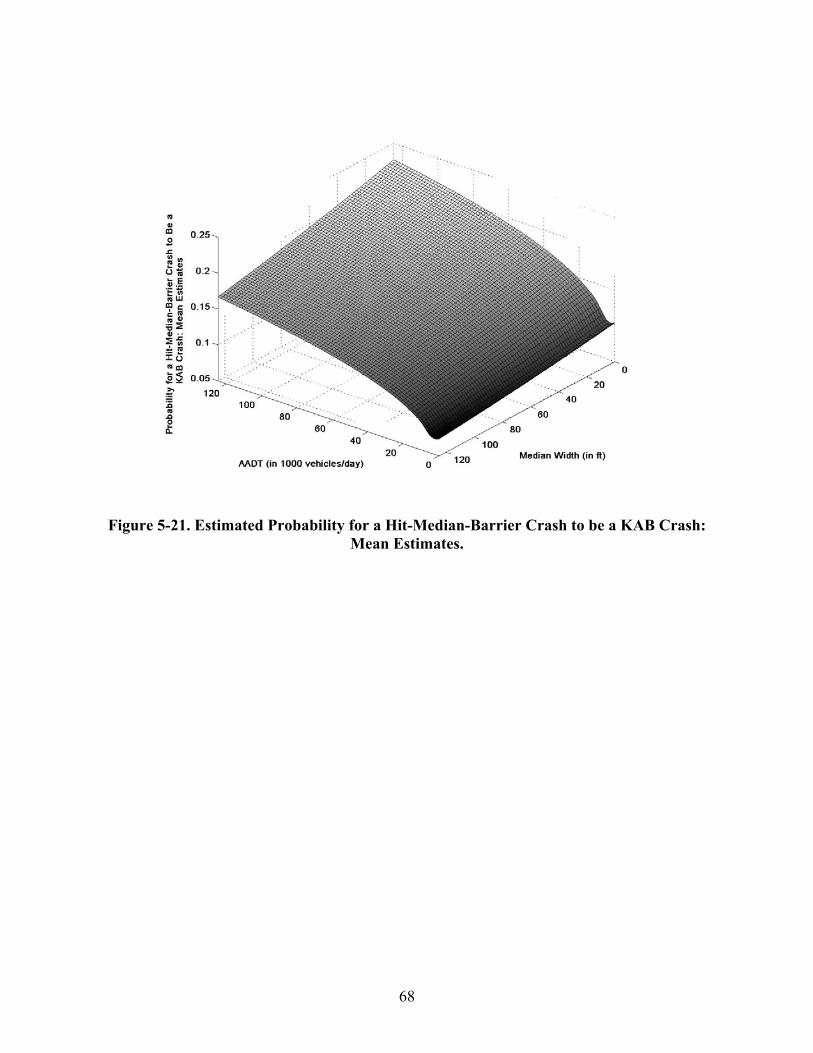
68
Figure 5-21. Estimated Probability for a Hit-Median-Barrier Crash to be a KAB Crash: Mean Estimates.
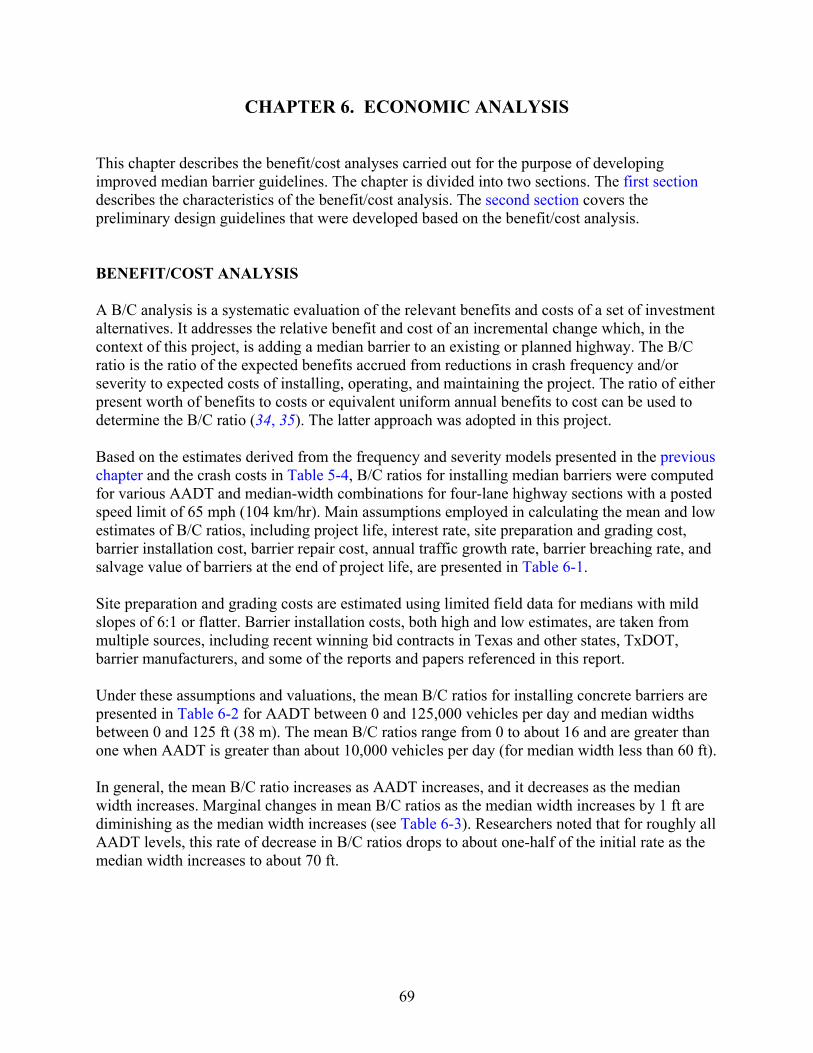
69
CHAPTER 6. ECONOMIC ANALYSIS This chapter describes the benefit/cost analyses carried out for the purpose of developing improved median barrier guidelines. The chapter is divided into two sections. The first section describes the characteristics of the benefit/cost analysis. The second section covers the preliminary design guidelines that were developed based on the benefit/cost analysis. BENEFIT/COST ANALYSIS A B/C analysis is a systematic evaluation of the relevant benefits and costs of a set of investment alternatives. It addresses the relative benefit and cost of an incremental change which, in the context of this project, is adding a median barrier to an existing or planned highway. The B/C ratio is the ratio of the expected benefits accrued from reductions in crash frequency and/or severity to expected costs of installing, operating, and maintaining the project. The ratio of either present worth of benefits to costs or equivalent uniform annual benefits to cost can be used to determine the B/C ratio (34, 35). The latter approach was adopted in this project. Based on the estimates derived from the frequency and severity models presented in the previous chapter and the crash costs in Table 5-4, B/C ratios for installing median barriers were computed for various AADT and median-width combinations for four-lane highway sections with a posted speed limit of 65 mph (104 km/hr). Main assumptions employed in calculating the mean and low estimates of B/C ratios, including project life, interest rate, site preparation and grading cost, barrier installation cost, barrier repair cost, annual traffic growth rate, barrier breaching rate, and salvage value of barriers at the end of project life, are presented in Table 6-1. Site preparation and grading costs are estimated using limited field data for medians with mild slopes of 6:1 or flatter. Barrier installation costs, both high and low estimates, are taken from multiple sources, including recent winning bid contracts in Texas and other states, TxDOT, barrier manufacturers, and some of the reports and papers referenced in this report. Under these assumptions and valuations, the mean B/C ratios for installing concrete barriers are presented in Table 6-2 for AADT between 0 and 125,000 vehicles per day and median widths between 0 and 125 ft (38 m). The mean B/C ratios range from 0 to about 16 and are greater than one when AADT is greater than about 10,000 vehicles per day (for median width less than 60 ft). In general, the mean B/C ratio increases as AADT increases, and it decreases as the median width increases. Marginal changes in mean B/C ratios as the median width increases by 1 ft are diminishing as the median width increases (see Table 6-3). Researchers noted that for roughly all AADT levels, this rate of decrease in B/C ratios drops to about one-half of the initial rate as the median width increases to about 70 ft.

70
Table 6-1. Main Assumptions Employed for the B/C Analysis. Mean B/C Estimate Low B/C Estimate Concrete Barrier Cable Barrier
(High-Tension) Concrete Barrier Cable Barrier
(High-Tension) Project Lift (yrs) – Does not consider future widening plan
20 20 20 20
Interest Rate (%) 5 5 5 5 AADT Annual Growth Rate (%) 3 3 1 1 Estimate of Cross-Median Crash Frequency Mean Mean 2.5th Percentile 2.5th Percentile Installation Cost per Mile* ($1000) (190+370)/2 (65+100)/2 370 100 Site Preparation and Grading Cost* ($1000) (Median Width in ft
- 20)*100/80 0 (Median Width in ft
- 20)*100/80 0
Barrier Breaching Crash Rate as a Percent of Estimated Barrier-Hits** or Crashes
0.3% (of estimated
number of reported crashes)
3% (of estimated
number of barrier-hits)**
0.3% (of estimated
number of reported crashes)
3% (of estimated
number of barrier-hits)
Repair Cost per Hit** ($1000) 0 (0.35+0.70)/2 0 0.70 Salvage Value at End of Project Lift ($1000) 0 0 0 0 *It is assumed that barriers are placed near the center of the median. Installation costs include material, labor, and equipment costs. The site preparation cost for concrete barriers is assumed to be a linear function of median width (excluding existing shoulder width of 20 ft), with an estimate of $100,000 at a median width of 100 ft. This assumes a relatively mild slope of 6:1 or flatter without a lot of earthwork to flatten the slope to a 10:1. These costs do not include user costs due to travel delay, and traffic control and engineering costs during constructions. **To estimate the number of hits on cable barriers that require repair, the estimated number of hit-barrier crashes from the model is multiplied by a factor of two to account for unreported crashes and crashes that do not meet the reporting and coding threshold. Since July 1, 1995, Texas DPS stopped coding those PDO crashes for which vehicles did not have to be towed away.

71
Table 6-2. Benefit/Cost Ratios for Installing Concrete Barriers: Mean Estimates. AADT (in 1000) Median
Width (ft) 0 5 10 15 20 25 30 35 40 45 50 55 60 65 70 75 80 85 90 95 100 105 110 115 120 1250 0 0.8 1.6 2.3 3.0 3.7 4.4 5.0 5.7 6.3 7.0 7.6 8.2 8.8 9.5 10.1 10.7 11.3 12.0 12.6 13.2 13.9 14.5 15.2 15.8 16.55 0 0.8 1.5 2.2 2.9 3.6 4.2 4.9 5.5 6.1 6.7 7.3 8.0 8.6 9.1 9.7 10.3 11.0 11.6 12.2 12.8 13.4 14.1 14.7 15.3 16.0
10 0 0.8 1.5 2.1 2.8 3.4 4.1 4.7 5.3 5.9 6.5 7.1 7.7 8.3 8.9 9.4 10.0 10.6 11.2 11.8 12.4 13.0 13.6 14.2 14.8 15.415 0 0.7 1.4 2.1 2.7 3.3 4.0 4.6 5.2 5.7 6.3 6.9 7.5 8.0 8.6 9.2 9.7 10.3 10.9 11.4 12.0 12.6 13.2 13.8 14.4 15.020 0 0.7 1.4 2.0 2.6 3.2 3.8 4.4 5.0 5.6 6.2 6.7 7.3 7.8 8.4 8.9 9.5 10.0 10.6 11.1 11.7 12.3 12.8 13.4 14.0 14.625 0 0.7 1.3 1.9 2.5 3.1 3.7 4.2 4.8 5.3 5.8 6.4 6.9 7.4 8.0 8.5 9.0 9.5 10.1 10.6 11.2 11.7 12.2 12.8 13.3 13.930 0 0.6 1.2 1.8 2.4 2.9 3.5 4.0 4.5 5.1 5.6 6.1 6.6 7.1 7.6 8.1 8.6 9.1 9.6 10.1 10.6 11.1 11.6 12.2 12.7 13.235 0 0.6 1.2 1.7 2.3 2.8 3.3 3.8 4.3 4.8 5.3 5.8 6.3 6.8 7.2 7.7 8.2 8.7 9.2 9.7 10.1 10.6 11.1 11.6 12.1 12.640 0 0.6 1.1 1.7 2.2 2.7 3.2 3.7 4.2 4.6 5.1 5.6 6.0 6.5 6.9 7.4 7.9 8.3 8.8 9.3 9.7 10.2 10.7 11.2 11.6 12.145 0 0.6 1.1 1.6 2.1 2.6 3.0 3.5 4.0 4.4 4.9 5.3 5.8 6.2 6.6 7.1 7.5 8.0 8.4 8.9 9.3 9.8 10.2 10.7 11.2 11.650 0 0.5 1.0 1.5 2.0 2.5 2.9 3.4 3.8 4.3 4.7 5.1 5.5 6.0 6.4 6.8 7.2 7.7 8.1 8.5 9.0 9.4 9.9 10.3 10.7 11.255 0 0.5 1.0 1.5 1.9 2.4 2.8 3.2 3.7 4.1 4.5 4.9 5.3 5.7 6.2 6.6 7.0 7.4 7.8 8.2 8.6 9.1 9.5 9.9 10.4 10.860 0 0.5 1.0 1.4 1.8 2.3 2.7 3.1 3.5 3.9 4.3 4.7 5.1 5.5 5.9 6.3 6.7 7.1 7.5 7.9 8.3 8.7 9.1 9.5 9.9 10.465 0 0.5 0.9 1.4 1.8 2.2 2.6 3.0 3.4 3.8 4.2 4.6 5.0 5.3 5.7 6.1 6.5 6.9 7.3 7.6 8.0 8.4 8.8 9.2 9.6 10.070 0 0.5 0.9 1.3 1.7 2.1 2.5 2.9 3.3 3.7 4.1 4.4 4.8 5.2 5.5 5.9 6.3 6.6 7.0 7.4 7.8 8.2 8.5 8.9 9.3 9.775 0 0.4 0.9 1.3 1.7 2.1 2.4 2.8 3.2 3.6 3.9 4.3 4.6 5.0 5.4 5.7 6.1 6.4 6.8 7.2 7.5 7.9 8.3 8.6 9.0 9.480 0 0.4 0.8 1.2 1.6 2.0 2.4 2.7 3.1 3.4 3.8 4.2 4.5 4.8 5.2 5.5 5.9 6.2 6.6 7.0 7.3 7.7 8.0 8.4 8.8 9.185 0 0.4 0.8 1.2 1.6 1.9 2.3 2.6 3.0 3.3 3.7 4.0 4.4 4.7 5.1 5.4 5.7 6.1 6.4 6.8 7.1 7.5 7.8 8.2 8.5 8.990 0 0.4 0.8 1.2 1.5 1.9 2.2 2.6 2.9 3.3 3.6 3.9 4.3 4.6 4.9 5.2 5.6 5.9 6.2 6.6 6.9 7.3 7.6 7.9 8.3 8.695 0 0.4 0.8 1.1 1.5 1.8 2.2 2.5 2.8 3.2 3.5 3.8 4.1 4.5 4.8 5.1 5.4 5.7 6.1 6.4 6.7 7.1 7.4 7.7 8.1 8.4
100 0 0.4 0.7 1.1 1.4 1.8 2.1 2.4 2.8 3.1 3.4 3.7 4.0 4.3 4.7 5.0 5.3 5.6 5.9 6.2 6.6 6.9 7.2 7.5 7.9 8.2105 0 0.4 0.7 1.1 1.4 1.7 2.0 2.4 2.7 3.0 3.3 3.6 3.9 4.2 4.5 4.9 5.2 5.5 5.8 6.1 6.4 6.7 7.0 7.4 7.7 8.0110 0 0.4 0.7 1.0 1.4 1.7 2.0 2.3 2.6 2.9 3.2 3.5 3.8 4.2 4.4 4.7 5.1 5.4 5.7 6.0 6.3 6.6 6.9 7.2 7.5 7.8115 0 0.4 0.7 1.0 1.3 1.6 2.0 2.3 2.6 2.9 3.2 3.5 3.8 4.1 4.3 4.6 4.9 5.2 5.5 5.8 6.1 6.4 6.7 7.0 7.4 7.7120 0 0.3 0.7 1.0 1.3 1.6 1.9 2.2 2.5 2.8 3.1 3.4 3.7 4.0 4.3 4.5 4.8 5.1 5.4 5.7 6.0 6.3 6.6 6.9 7.2 7.5125 0 0.3 0.7 1.0 1.3 1.6 1.9 2.2 2.5 2.7 3.0 3.3 3.6 3.9 4.2 4.5 4.7 5.0 5.3 5.6 5.9 6.2 6.5 6.8 7.1 7.4
Note: Based on a four-lane highway with a posted speed limit of 65 mph (104 km/hr) scenario.

72
Table 6-3. Marginal Changes in Benefit/Cost Ratios as Median-Width Increases by One Foot. AADT (in 1000) Median
Width (ft)
0 5 10 15 20 25 30 35 40 45 50 55 60 65 70 75 80 85 90 95 100 105 110 115 120 125
0 5 0 -0.005 -0.010 -0.014 -0.018 -0.022 -0.026 -0.029 -0.033 -0.037 -0.041 -0.044 -0.048 -0.051 -0.054 -0.058 -0.062 -0.065 -0.069 -0.072 -0.076 -0.080 -0.084 -0.088 -0.092 -0.096
10 0 -0.004 -0.009 -0.013 -0.016 -0.020 -0.024 -0.027 -0.031 -0.034 -0.038 -0.041 -0.044 -0.047 -0.050 -0.054 -0.057 -0.060 -0.064 -0.067 -0.071 -0.074 -0.078 -0.081 -0.084 -0.08815 0 -0.005 -0.008 -0.012 -0.016 -0.019 -0.022 -0.025 -0.028 -0.032 -0.035 -0.038 -0.041 -0.044 -0.047 -0.050 -0.053 -0.056 -0.059 -0.062 -0.065 -0.068 -0.072 -0.075 -0.078 -0.08120 0 -0.004 -0.007 -0.010 -0.013 -0.017 -0.019 -0.022 -0.025 -0.027 -0.030 -0.032 -0.035 -0.037 -0.040 -0.042 -0.045 -0.047 -0.050 -0.053 -0.055 -0.058 -0.061 -0.064 -0.066 -0.06925 0 -0.004 -0.007 -0.010 -0.013 -0.016 -0.019 -0.022 -0.025 -0.027 -0.030 -0.032 -0.035 -0.037 -0.039 -0.041 -0.043 -0.044 -0.046 -0.048 -0.050 -0.052 -0.054 -0.056 -0.058 -0.06030 0 -0.004 -0.007 -0.011 -0.014 -0.016 -0.018 -0.020 -0.023 -0.025 -0.027 -0.030 -0.033 -0.035 -0.037 -0.040 -0.043 -0.047 -0.050 -0.053 -0.056 -0.059 -0.062 -0.065 -0.069 -0.07235 0 -0.003 -0.005 -0.006 -0.009 -0.013 -0.015 -0.018 -0.020 -0.022 -0.024 -0.025 -0.027 -0.029 -0.031 -0.033 -0.035 -0.036 -0.038 -0.040 -0.042 -0.044 -0.046 -0.048 -0.050 -0.05240 0 -0.003 -0.006 -0.009 -0.010 -0.012 -0.014 -0.016 -0.018 -0.020 -0.022 -0.023 -0.025 -0.027 -0.029 -0.030 -0.032 -0.034 -0.035 -0.037 -0.039 -0.041 -0.043 -0.044 -0.046 -0.04845 0 -0.003 -0.005 -0.008 -0.011 -0.012 -0.014 -0.016 -0.018 -0.020 -0.022 -0.024 -0.026 -0.027 -0.029 -0.031 -0.032 -0.034 -0.036 -0.038 -0.039 -0.041 -0.043 -0.044 -0.046 -0.04850 0 -0.003 -0.005 -0.006 -0.008 -0.010 -0.012 -0.014 -0.015 -0.017 -0.018 -0.020 -0.021 -0.023 -0.024 -0.025 -0.026 -0.028 -0.029 -0.030 -0.032 -0.033 -0.034 -0.036 -0.037 -0.03955 0 -0.002 -0.004 -0.006 -0.009 -0.010 -0.011 -0.012 -0.014 -0.015 -0.017 -0.018 -0.019 -0.021 -0.022 -0.023 -0.024 -0.025 -0.027 -0.028 -0.030 -0.031 -0.032 -0.033 -0.035 -0.03660 0 -0.002 -0.004 -0.006 -0.007 -0.009 -0.011 -0.013 -0.015 -0.016 -0.018 -0.019 -0.021 -0.022 -0.023 -0.025 -0.027 -0.029 -0.031 -0.032 -0.034 -0.036 -0.038 -0.040 -0.042 -0.04465 0 -0.002 -0.004 -0.005 -0.007 -0.008 -0.009 -0.010 -0.012 -0.013 -0.014 -0.015 -0.016 -0.017 -0.018 -0.019 -0.020 -0.021 -0.022 -0.023 -0.024 -0.025 -0.026 -0.027 -0.028 -0.02970 0 -0.002 -0.004 -0.005 -0.006 -0.007 -0.009 -0.010 -0.011 -0.012 -0.013 -0.014 -0.015 -0.016 -0.017 -0.018 -0.018 -0.019 -0.020 -0.021 -0.021 -0.022 -0.023 -0.024 -0.025 -0.02675 0 -0.002 -0.003 -0.004 -0.006 -0.007 -0.008 -0.009 -0.010 -0.011 -0.012 -0.013 -0.013 -0.014 -0.015 -0.017 -0.018 -0.019 -0.020 -0.022 -0.023 -0.024 -0.026 -0.027 -0.028 -0.03080 0 -0.002 -0.003 -0.004 -0.005 -0.006 -0.007 -0.008 -0.009 -0.010 -0.011 -0.012 -0.013 -0.014 -0.014 -0.015 -0.015 -0.016 -0.016 -0.017 -0.017 -0.018 -0.019 -0.019 -0.020 -0.02185 0 -0.001 -0.002 -0.003 -0.004 -0.005 -0.006 -0.006 -0.007 -0.008 -0.008 -0.009 -0.009 -0.010 -0.010 -0.011 -0.012 -0.013 -0.014 -0.014 -0.015 -0.016 -0.017 -0.018 -0.019 -0.02090 0 -0.001 -0.002 -0.003 -0.004 -0.005 -0.006 -0.007 -0.008 -0.008 -0.009 -0.010 -0.010 -0.011 -0.011 -0.012 -0.012 -0.013 -0.013 -0.014 -0.014 -0.015 -0.015 -0.016 -0.016 -0.01795 0 -0.001 -0.002 -0.003 -0.004 -0.005 -0.006 -0.006 -0.007 -0.008 -0.008 -0.009 -0.009 -0.010 -0.011 -0.011 -0012 -0.013 -0.014 -0.015 -0.016 -0.017 -0.017 -0.018 -0.019 -0.020
100 0 -0.001 -0.002 -0.003 -0.004 -0.004 -0.005 -0.006 -0.006 -0.007 -0.008 -0.008 -0.009 -0.009 -0.010 -0.010 -0.010 -0.010 -0.011 -0.011 -0.011 -0.011 -0.012 -0.012 -0.012 -0.013105 0 -0.001 -0.002 -0.002 -0.003 -0.003 -0.004 -0.004 -0.005 -0.005 -0.005 -0.006 -0.006 -0.006 -0.006 -0.007 -0.007 -0.008 -0.008 -0.009 -0.009 -0.010 -0.010 -0.011 -0.012 -0.012110 0 -0.001 -0.001 -0.002 -0.002 -0.003 -0.003 -0.004 -0.004 -0.004 -0.005 -0.005 -0.005 -0.005 -0.005 -0.006 -0.006 -0.007 -0.007 -0.007 -0.008 -0.008 -0.009 -0.009 -0.010 -0.010115 0 -0.001 -0.002 -0.002 -0.003 -0.003 -0.004 -0.004 -0.005 -0.005 -0.006 -0.006 -0.007 -0.007 -0.007 -0.007 -0.007 -0.007 -0.007 -0.007 -0.007 -0.008 -0.008 -0.008 -0.008 -0.008120 0 -0.001 -0.001 -0.002 -0.002 -0.002 -0.003 -0.003 -0.003 -0.003 -0.003 -0.004 -0.004 -0.004 -0.004 -0.004 -0.004 -0.005 -0.005 -0.005 -0.006 -0.006 -0.006 -0.007 -0.007 -0.007125 0 -0.001 -0.001 -0.001 -0.002 -0.002 -0.002 -0.003 -0.003 -0.003 -0.003 -0.003 -0.003 -0.004 -0.004 -0.004 -0.004 -0.004 -0.005 -0.005 -0.005 -0.006 -0.006 -0.006 -0.007 -0.007

73
Given the stochastic nature of traffic crashes, the uncertainty associated with the main assumptions above, and individual site differences (e.g., site preparation costs), a mean B/C ratio greater than one does not necessarily lead to a net benefit for a specific project. Thus, some sensitivity analyses to understand the variations of B/C ratios when some assumptions are inaccurate or when the “mean prediction” is not realized are important for guideline development. With limited resources, it also seems advisable that one should select a mean B/C ratio at a break point, where there is not a great likelihood that any error in the assumptions or deviation from the predictions made in developing the guideline will result in inefficient or even wasteful expenditures. Following this advice, the greater the uncertainties one has about the data, models, and assumptions, the higher the B/C ratios one needs to select as break points to ensure that net benefits would be realized with a high probability when the guideline is implemented. As part of the sensitivity analyses, Table 6-4 shows low estimates of B/C ratios, which are based on the 2.5th percentile estimates of cross-median crash frequency, a one percent annual traffic growth rate, and other assumptions presented earlier in Table 6-1. Choosing a B/C ratio of one as a break point from this table would (in the researchers’ judgment) ensure that, even under a very unexpected future condition, the benefits associated with installing a median barrier in accordance with the guideline would most probably outweigh the cost. This analysis helps to establish a median width-AADT combination zone, where installing concrete median barriers may not be beneficial. It is noted that this zone corresponds quite well to a zone selected from the mean B/C ratios (in Table 6-2) using a value of 2.0 as the break point. As indicated earlier, TxDOT has recently begun to install and evaluate high-tension cable median barriers. Experience with these systems in Texas and other states has so far been limited. Other states that have installed one or more variations of high-tension cable median barrier include Arizona, Colorado, Iowa, Oklahoma, and Utah among others. Some articles and reports have presented the potential advantages of this system relative to concrete barriers and provided some promising, though limited, field experience, including the Center for Transportation Research and Education (CTRE) (36), Outcalt (20), and Sharp and Stewart (23). In-service performance evaluation data for these barrier systems are still rather limited, especially regarding breaching rates and injury severity distributions when compared to concrete and other median barrier types. Several issues related to this type of cable barrier that need more research include:
• placement of the barrier on slopes and sharp horizontal curves, • at what truck volume the system should not be installed, and • whether a concrete or other type of mow strip are cost-effective.
These issues have potentially significant safety and cost implications and could change the B/C analysis as more data and research results become available. Using the assumptions described in Table 6-1, the B/C ratios for high-tension cable barriers were estimated. The results for the mean and 2.5th percentile are shown in Tables 6-5 and 6-6, respectively. The ratios were computed for the same range of AADTs and median widths as for the concrete barriers. However, high-tension cable barriers are generally not recommended for
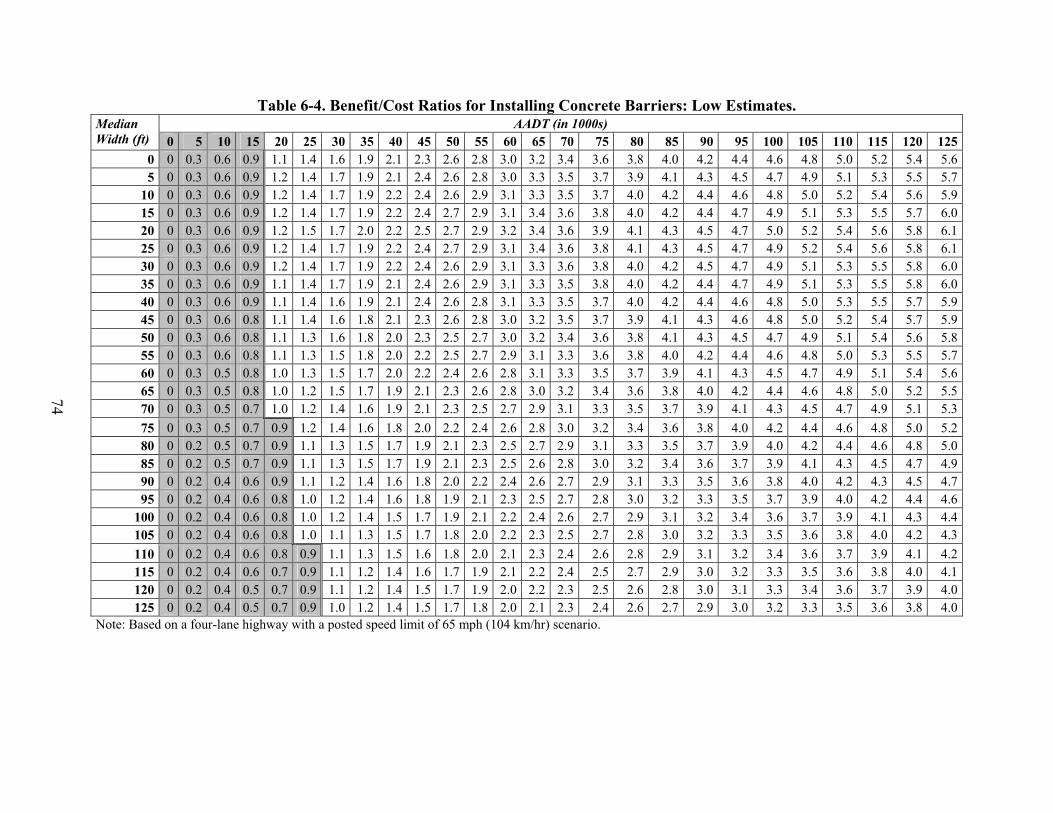
74
Table 6-4. Benefit/Cost Ratios for Installing Concrete Barriers: Low Estimates. AADT (in 1000s) Median
Width (ft) 0 5 10 15 20 25 30 35 40 45 50 55 60 65 70 75 80 85 90 95 100 105 110 115 120 1250 0 0.3 0.6 0.9 1.1 1.4 1.6 1.9 2.1 2.3 2.6 2.8 3.0 3.2 3.4 3.6 3.8 4.0 4.2 4.4 4.6 4.8 5.0 5.2 5.4 5.65 0 0.3 0.6 0.9 1.2 1.4 1.7 1.9 2.1 2.4 2.6 2.8 3.0 3.3 3.5 3.7 3.9 4.1 4.3 4.5 4.7 4.9 5.1 5.3 5.5 5.7
10 0 0.3 0.6 0.9 1.2 1.4 1.7 1.9 2.2 2.4 2.6 2.9 3.1 3.3 3.5 3.7 4.0 4.2 4.4 4.6 4.8 5.0 5.2 5.4 5.6 5.915 0 0.3 0.6 0.9 1.2 1.4 1.7 1.9 2.2 2.4 2.7 2.9 3.1 3.4 3.6 3.8 4.0 4.2 4.4 4.7 4.9 5.1 5.3 5.5 5.7 6.020 0 0.3 0.6 0.9 1.2 1.5 1.7 2.0 2.2 2.5 2.7 2.9 3.2 3.4 3.6 3.9 4.1 4.3 4.5 4.7 5.0 5.2 5.4 5.6 5.8 6.125 0 0.3 0.6 0.9 1.2 1.4 1.7 1.9 2.2 2.4 2.7 2.9 3.1 3.4 3.6 3.8 4.1 4.3 4.5 4.7 4.9 5.2 5.4 5.6 5.8 6.130 0 0.3 0.6 0.9 1.2 1.4 1.7 1.9 2.2 2.4 2.6 2.9 3.1 3.3 3.6 3.8 4.0 4.2 4.5 4.7 4.9 5.1 5.3 5.5 5.8 6.035 0 0.3 0.6 0.9 1.1 1.4 1.7 1.9 2.1 2.4 2.6 2.9 3.1 3.3 3.5 3.8 4.0 4.2 4.4 4.7 4.9 5.1 5.3 5.5 5.8 6.040 0 0.3 0.6 0.9 1.1 1.4 1.6 1.9 2.1 2.4 2.6 2.8 3.1 3.3 3.5 3.7 4.0 4.2 4.4 4.6 4.8 5.0 5.3 5.5 5.7 5.945 0 0.3 0.6 0.8 1.1 1.4 1.6 1.8 2.1 2.3 2.6 2.8 3.0 3.2 3.5 3.7 3.9 4.1 4.3 4.6 4.8 5.0 5.2 5.4 5.7 5.950 0 0.3 0.6 0.8 1.1 1.3 1.6 1.8 2.0 2.3 2.5 2.7 3.0 3.2 3.4 3.6 3.8 4.1 4.3 4.5 4.7 4.9 5.1 5.4 5.6 5.855 0 0.3 0.6 0.8 1.1 1.3 1.5 1.8 2.0 2.2 2.5 2.7 2.9 3.1 3.3 3.6 3.8 4.0 4.2 4.4 4.6 4.8 5.0 5.3 5.5 5.760 0 0.3 0.5 0.8 1.0 1.3 1.5 1.7 2.0 2.2 2.4 2.6 2.8 3.1 3.3 3.5 3.7 3.9 4.1 4.3 4.5 4.7 4.9 5.1 5.4 5.665 0 0.3 0.5 0.8 1.0 1.2 1.5 1.7 1.9 2.1 2.3 2.6 2.8 3.0 3.2 3.4 3.6 3.8 4.0 4.2 4.4 4.6 4.8 5.0 5.2 5.570 0 0.3 0.5 0.7 1.0 1.2 1.4 1.6 1.9 2.1 2.3 2.5 2.7 2.9 3.1 3.3 3.5 3.7 3.9 4.1 4.3 4.5 4.7 4.9 5.1 5.375 0 0.3 0.5 0.7 0.9 1.2 1.4 1.6 1.8 2.0 2.2 2.4 2.6 2.8 3.0 3.2 3.4 3.6 3.8 4.0 4.2 4.4 4.6 4.8 5.0 5.280 0 0.2 0.5 0.7 0.9 1.1 1.3 1.5 1.7 1.9 2.1 2.3 2.5 2.7 2.9 3.1 3.3 3.5 3.7 3.9 4.0 4.2 4.4 4.6 4.8 5.085 0 0.2 0.5 0.7 0.9 1.1 1.3 1.5 1.7 1.9 2.1 2.3 2.5 2.6 2.8 3.0 3.2 3.4 3.6 3.7 3.9 4.1 4.3 4.5 4.7 4.990 0 0.2 0.4 0.6 0.9 1.1 1.2 1.4 1.6 1.8 2.0 2.2 2.4 2.6 2.7 2.9 3.1 3.3 3.5 3.6 3.8 4.0 4.2 4.3 4.5 4.795 0 0.2 0.4 0.6 0.8 1.0 1.2 1.4 1.6 1.8 1.9 2.1 2.3 2.5 2.7 2.8 3.0 3.2 3.3 3.5 3.7 3.9 4.0 4.2 4.4 4.6
100 0 0.2 0.4 0.6 0.8 1.0 1.2 1.4 1.5 1.7 1.9 2.1 2.2 2.4 2.6 2.7 2.9 3.1 3.2 3.4 3.6 3.7 3.9 4.1 4.3 4.4105 0 0.2 0.4 0.6 0.8 1.0 1.1 1.3 1.5 1.7 1.8 2.0 2.2 2.3 2.5 2.7 2.8 3.0 3.2 3.3 3.5 3.6 3.8 4.0 4.2 4.3110 0 0.2 0.4 0.6 0.8 0.9 1.1 1.3 1.5 1.6 1.8 2.0 2.1 2.3 2.4 2.6 2.8 2.9 3.1 3.2 3.4 3.6 3.7 3.9 4.1 4.2115 0 0.2 0.4 0.6 0.7 0.9 1.1 1.2 1.4 1.6 1.7 1.9 2.1 2.2 2.4 2.5 2.7 2.9 3.0 3.2 3.3 3.5 3.6 3.8 4.0 4.1120 0 0.2 0.4 0.5 0.7 0.9 1.1 1.2 1.4 1.5 1.7 1.9 2.0 2.2 2.3 2.5 2.6 2.8 3.0 3.1 3.3 3.4 3.6 3.7 3.9 4.0125 0 0.2 0.4 0.5 0.7 0.9 1.0 1.2 1.4 1.5 1.7 1.8 2.0 2.1 2.3 2.4 2.6 2.7 2.9 3.0 3.2 3.3 3.5 3.6 3.8 4.0
Note: Based on a four-lane highway with a posted speed limit of 65 mph (104 km/hr) scenario.
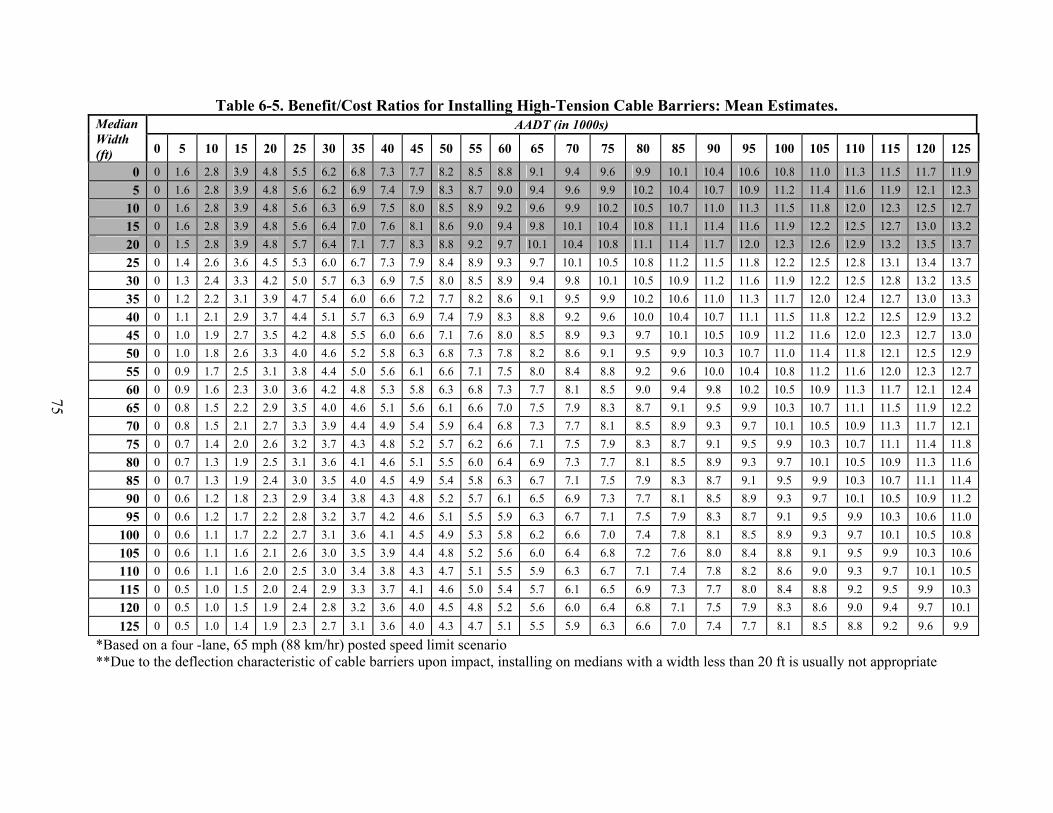
75
Table 6-5. Benefit/Cost Ratios for Installing High-Tension Cable Barriers: Mean Estimates. AADT (in 1000s) Median
Width (ft) 0 5 10 15 20 25 30 35 40 45 50 55 60 65 70 75 80 85 90 95 100 105 110 115 120 125
0 0 1.6 2.8 3.9 4.8 5.5 6.2 6.8 7.3 7.7 8.2 8.5 8.8 9.1 9.4 9.6 9.9 10.1 10.4 10.6 10.8 11.0 11.3 11.5 11.7 11.9 5 0 1.6 2.8 3.9 4.8 5.6 6.2 6.9 7.4 7.9 8.3 8.7 9.0 9.4 9.6 9.9 10.2 10.4 10.7 10.9 11.2 11.4 11.6 11.9 12.1 12.3
10 0 1.6 2.8 3.9 4.8 5.6 6.3 6.9 7.5 8.0 8.5 8.9 9.2 9.6 9.9 10.2 10.5 10.7 11.0 11.3 11.5 11.8 12.0 12.3 12.5 12.7 15 0 1.6 2.8 3.9 4.8 5.6 6.4 7.0 7.6 8.1 8.6 9.0 9.4 9.8 10.1 10.4 10.8 11.1 11.4 11.6 11.9 12.2 12.5 12.7 13.0 13.2 20 0 1.5 2.8 3.9 4.8 5.7 6.4 7.1 7.7 8.3 8.8 9.2 9.7 10.1 10.4 10.8 11.1 11.4 11.7 12.0 12.3 12.6 12.9 13.2 13.5 13.7 25 0 1.4 2.6 3.6 4.5 5.3 6.0 6.7 7.3 7.9 8.4 8.9 9.3 9.7 10.1 10.5 10.8 11.2 11.5 11.8 12.2 12.5 12.8 13.1 13.4 13.7 30 0 1.3 2.4 3.3 4.2 5.0 5.7 6.3 6.9 7.5 8.0 8.5 8.9 9.4 9.8 10.1 10.5 10.9 11.2 11.6 11.9 12.2 12.5 12.8 13.2 13.5 35 0 1.2 2.2 3.1 3.9 4.7 5.4 6.0 6.6 7.2 7.7 8.2 8.6 9.1 9.5 9.9 10.2 10.6 11.0 11.3 11.7 12.0 12.4 12.7 13.0 13.3 40 0 1.1 2.1 2.9 3.7 4.4 5.1 5.7 6.3 6.9 7.4 7.9 8.3 8.8 9.2 9.6 10.0 10.4 10.7 11.1 11.5 11.8 12.2 12.5 12.9 13.2 45 0 1.0 1.9 2.7 3.5 4.2 4.8 5.5 6.0 6.6 7.1 7.6 8.0 8.5 8.9 9.3 9.7 10.1 10.5 10.9 11.2 11.6 12.0 12.3 12.7 13.0 50 0 1.0 1.8 2.6 3.3 4.0 4.6 5.2 5.8 6.3 6.8 7.3 7.8 8.2 8.6 9.1 9.5 9.9 10.3 10.7 11.0 11.4 11.8 12.1 12.5 12.9 55 0 0.9 1.7 2.5 3.1 3.8 4.4 5.0 5.6 6.1 6.6 7.1 7.5 8.0 8.4 8.8 9.2 9.6 10.0 10.4 10.8 11.2 11.6 12.0 12.3 12.7 60 0 0.9 1.6 2.3 3.0 3.6 4.2 4.8 5.3 5.8 6.3 6.8 7.3 7.7 8.1 8.5 9.0 9.4 9.8 10.2 10.5 10.9 11.3 11.7 12.1 12.4 65 0 0.8 1.5 2.2 2.9 3.5 4.0 4.6 5.1 5.6 6.1 6.6 7.0 7.5 7.9 8.3 8.7 9.1 9.5 9.9 10.3 10.7 11.1 11.5 11.9 12.2 70 0 0.8 1.5 2.1 2.7 3.3 3.9 4.4 4.9 5.4 5.9 6.4 6.8 7.3 7.7 8.1 8.5 8.9 9.3 9.7 10.1 10.5 10.9 11.3 11.7 12.1 75 0 0.7 1.4 2.0 2.6 3.2 3.7 4.3 4.8 5.2 5.7 6.2 6.6 7.1 7.5 7.9 8.3 8.7 9.1 9.5 9.9 10.3 10.7 11.1 11.4 11.8 80 0 0.7 1.3 1.9 2.5 3.1 3.6 4.1 4.6 5.1 5.5 6.0 6.4 6.9 7.3 7.7 8.1 8.5 8.9 9.3 9.7 10.1 10.5 10.9 11.3 11.6 85 0 0.7 1.3 1.9 2.4 3.0 3.5 4.0 4.5 4.9 5.4 5.8 6.3 6.7 7.1 7.5 7.9 8.3 8.7 9.1 9.5 9.9 10.3 10.7 11.1 11.4 90 0 0.6 1.2 1.8 2.3 2.9 3.4 3.8 4.3 4.8 5.2 5.7 6.1 6.5 6.9 7.3 7.7 8.1 8.5 8.9 9.3 9.7 10.1 10.5 10.9 11.2 95 0 0.6 1.2 1.7 2.2 2.8 3.2 3.7 4.2 4.6 5.1 5.5 5.9 6.3 6.7 7.1 7.5 7.9 8.3 8.7 9.1 9.5 9.9 10.3 10.6 11.0
100 0 0.6 1.1 1.7 2.2 2.7 3.1 3.6 4.1 4.5 4.9 5.3 5.8 6.2 6.6 7.0 7.4 7.8 8.1 8.5 8.9 9.3 9.7 10.1 10.5 10.8 105 0 0.6 1.1 1.6 2.1 2.6 3.0 3.5 3.9 4.4 4.8 5.2 5.6 6.0 6.4 6.8 7.2 7.6 8.0 8.4 8.8 9.1 9.5 9.9 10.3 10.6 110 0 0.6 1.1 1.6 2.0 2.5 3.0 3.4 3.8 4.3 4.7 5.1 5.5 5.9 6.3 6.7 7.1 7.4 7.8 8.2 8.6 9.0 9.3 9.7 10.1 10.5 115 0 0.5 1.0 1.5 2.0 2.4 2.9 3.3 3.7 4.1 4.6 5.0 5.4 5.7 6.1 6.5 6.9 7.3 7.7 8.0 8.4 8.8 9.2 9.5 9.9 10.3 120 0 0.5 1.0 1.5 1.9 2.4 2.8 3.2 3.6 4.0 4.5 4.8 5.2 5.6 6.0 6.4 6.8 7.1 7.5 7.9 8.3 8.6 9.0 9.4 9.7 10.1 125 0 0.5 1.0 1.4 1.9 2.3 2.7 3.1 3.6 4.0 4.3 4.7 5.1 5.5 5.9 6.3 6.6 7.0 7.4 7.7 8.1 8.5 8.8 9.2 9.6 9.9
*Based on a four -lane, 65 mph (88 km/hr) posted speed limit scenario **Due to the deflection characteristic of cable barriers upon impact, installing on medians with a width less than 20 ft is usually not appropriate
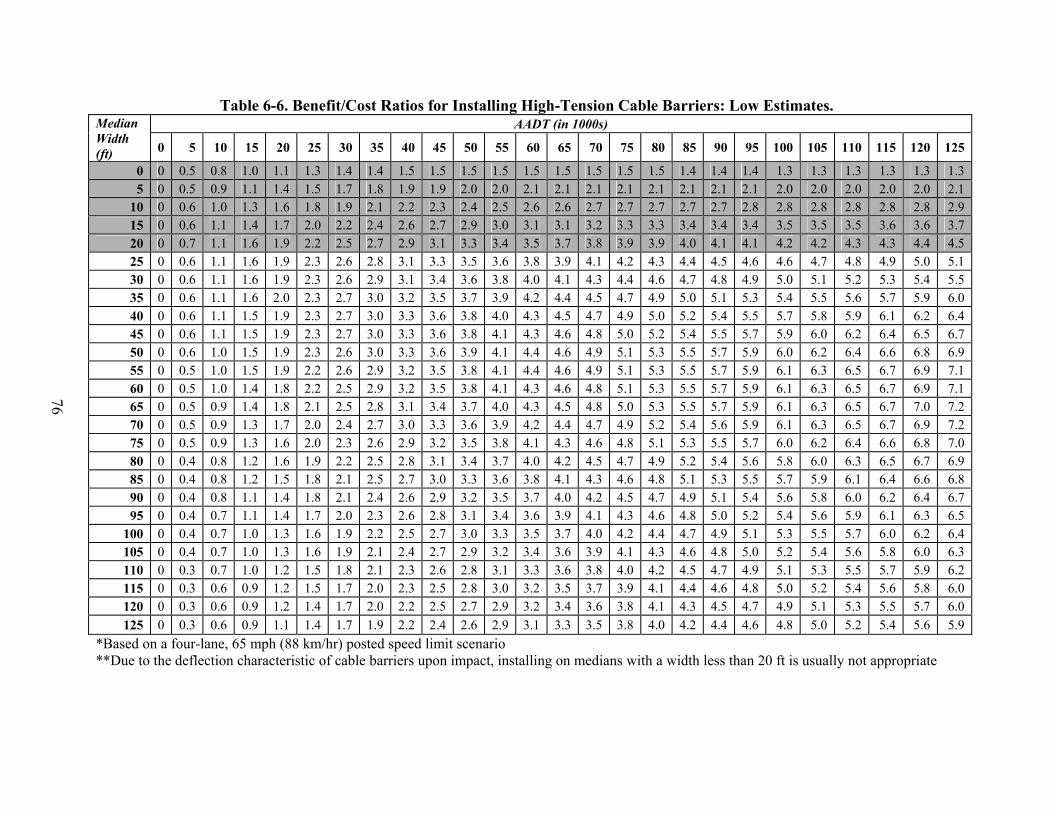
76
Table 6-6. Benefit/Cost Ratios for Installing High-Tension Cable Barriers: Low Estimates. AADT (in 1000s) Median
Width (ft) 0 5 10 15 20 25 30 35 40 45 50 55 60 65 70 75 80 85 90 95 100 105 110 115 120 125
0 0 0.5 0.8 1.0 1.1 1.3 1.4 1.4 1.5 1.5 1.5 1.5 1.5 1.5 1.5 1.5 1.5 1.4 1.4 1.4 1.3 1.3 1.3 1.3 1.3 1.3 5 0 0.5 0.9 1.1 1.4 1.5 1.7 1.8 1.9 1.9 2.0 2.0 2.1 2.1 2.1 2.1 2.1 2.1 2.1 2.1 2.0 2.0 2.0 2.0 2.0 2.1
10 0 0.6 1.0 1.3 1.6 1.8 1.9 2.1 2.2 2.3 2.4 2.5 2.6 2.6 2.7 2.7 2.7 2.7 2.7 2.8 2.8 2.8 2.8 2.8 2.8 2.9 15 0 0.6 1.1 1.4 1.7 2.0 2.2 2.4 2.6 2.7 2.9 3.0 3.1 3.1 3.2 3.3 3.3 3.4 3.4 3.4 3.5 3.5 3.5 3.6 3.6 3.7 20 0 0.7 1.1 1.6 1.9 2.2 2.5 2.7 2.9 3.1 3.3 3.4 3.5 3.7 3.8 3.9 3.9 4.0 4.1 4.1 4.2 4.2 4.3 4.3 4.4 4.5 25 0 0.6 1.1 1.6 1.9 2.3 2.6 2.8 3.1 3.3 3.5 3.6 3.8 3.9 4.1 4.2 4.3 4.4 4.5 4.6 4.6 4.7 4.8 4.9 5.0 5.1 30 0 0.6 1.1 1.6 1.9 2.3 2.6 2.9 3.1 3.4 3.6 3.8 4.0 4.1 4.3 4.4 4.6 4.7 4.8 4.9 5.0 5.1 5.2 5.3 5.4 5.5 35 0 0.6 1.1 1.6 2.0 2.3 2.7 3.0 3.2 3.5 3.7 3.9 4.2 4.4 4.5 4.7 4.9 5.0 5.1 5.3 5.4 5.5 5.6 5.7 5.9 6.0 40 0 0.6 1.1 1.5 1.9 2.3 2.7 3.0 3.3 3.6 3.8 4.0 4.3 4.5 4.7 4.9 5.0 5.2 5.4 5.5 5.7 5.8 5.9 6.1 6.2 6.4 45 0 0.6 1.1 1.5 1.9 2.3 2.7 3.0 3.3 3.6 3.8 4.1 4.3 4.6 4.8 5.0 5.2 5.4 5.5 5.7 5.9 6.0 6.2 6.4 6.5 6.7 50 0 0.6 1.0 1.5 1.9 2.3 2.6 3.0 3.3 3.6 3.9 4.1 4.4 4.6 4.9 5.1 5.3 5.5 5.7 5.9 6.0 6.2 6.4 6.6 6.8 6.9 55 0 0.5 1.0 1.5 1.9 2.2 2.6 2.9 3.2 3.5 3.8 4.1 4.4 4.6 4.9 5.1 5.3 5.5 5.7 5.9 6.1 6.3 6.5 6.7 6.9 7.1 60 0 0.5 1.0 1.4 1.8 2.2 2.5 2.9 3.2 3.5 3.8 4.1 4.3 4.6 4.8 5.1 5.3 5.5 5.7 5.9 6.1 6.3 6.5 6.7 6.9 7.1 65 0 0.5 0.9 1.4 1.8 2.1 2.5 2.8 3.1 3.4 3.7 4.0 4.3 4.5 4.8 5.0 5.3 5.5 5.7 5.9 6.1 6.3 6.5 6.7 7.0 7.2 70 0 0.5 0.9 1.3 1.7 2.0 2.4 2.7 3.0 3.3 3.6 3.9 4.2 4.4 4.7 4.9 5.2 5.4 5.6 5.9 6.1 6.3 6.5 6.7 6.9 7.2 75 0 0.5 0.9 1.3 1.6 2.0 2.3 2.6 2.9 3.2 3.5 3.8 4.1 4.3 4.6 4.8 5.1 5.3 5.5 5.7 6.0 6.2 6.4 6.6 6.8 7.0 80 0 0.4 0.8 1.2 1.6 1.9 2.2 2.5 2.8 3.1 3.4 3.7 4.0 4.2 4.5 4.7 4.9 5.2 5.4 5.6 5.8 6.0 6.3 6.5 6.7 6.9 85 0 0.4 0.8 1.2 1.5 1.8 2.1 2.5 2.7 3.0 3.3 3.6 3.8 4.1 4.3 4.6 4.8 5.1 5.3 5.5 5.7 5.9 6.1 6.4 6.6 6.8 90 0 0.4 0.8 1.1 1.4 1.8 2.1 2.4 2.6 2.9 3.2 3.5 3.7 4.0 4.2 4.5 4.7 4.9 5.1 5.4 5.6 5.8 6.0 6.2 6.4 6.7 95 0 0.4 0.7 1.1 1.4 1.7 2.0 2.3 2.6 2.8 3.1 3.4 3.6 3.9 4.1 4.3 4.6 4.8 5.0 5.2 5.4 5.6 5.9 6.1 6.3 6.5
100 0 0.4 0.7 1.0 1.3 1.6 1.9 2.2 2.5 2.7 3.0 3.3 3.5 3.7 4.0 4.2 4.4 4.7 4.9 5.1 5.3 5.5 5.7 6.0 6.2 6.4 105 0 0.4 0.7 1.0 1.3 1.6 1.9 2.1 2.4 2.7 2.9 3.2 3.4 3.6 3.9 4.1 4.3 4.6 4.8 5.0 5.2 5.4 5.6 5.8 6.0 6.3 110 0 0.3 0.7 1.0 1.2 1.5 1.8 2.1 2.3 2.6 2.8 3.1 3.3 3.6 3.8 4.0 4.2 4.5 4.7 4.9 5.1 5.3 5.5 5.7 5.9 6.2 115 0 0.3 0.6 0.9 1.2 1.5 1.7 2.0 2.3 2.5 2.8 3.0 3.2 3.5 3.7 3.9 4.1 4.4 4.6 4.8 5.0 5.2 5.4 5.6 5.8 6.0 120 0 0.3 0.6 0.9 1.2 1.4 1.7 2.0 2.2 2.5 2.7 2.9 3.2 3.4 3.6 3.8 4.1 4.3 4.5 4.7 4.9 5.1 5.3 5.5 5.7 6.0 125 0 0.3 0.6 0.9 1.1 1.4 1.7 1.9 2.2 2.4 2.6 2.9 3.1 3.3 3.5 3.8 4.0 4.2 4.4 4.6 4.8 5.0 5.2 5.4 5.6 5.9
*Based on a four-lane, 65 mph (88 km/hr) posted speed limit scenario **Due to the deflection characteristic of cable barriers upon impact, installing on medians with a width less than 20 ft is usually not appropriate

77
median widths below 20 ft. Depending on the configuration (e.g., number of cables, post spacing, tension, etc.), the lateral deflection for this type of barrier can be as high as 10 ft. Thus, depending on the design deflection established through full-scale crash testing, it may not be appropriate to install high-tension cable barriers in medians that are 20 ft or less in width. The mean B/C ratios range from 0 to about 23 and are greater than one when AADT is greater than about 5000 vehicles per day (for median widths less than 60 ft). Similar to concrete barriers, the mean B/C ratio increases as AADT increases but decreases as the median width increases. Overall, high-tension cable barriers are more cost-effective than concrete barriers for the entire range of median widths and AADTs for which they are applicable. Table 6-7 summarizes the ratio for installing high-tension cable barriers over the mean ratios for concrete barriers. Higher ratios suggest increased favorability of installing the high-tension cable barrier over the concrete barrier, in terms of their mean B/C ratios. Thus, we call this ratio the “favorability ratio” of installing high-tension cable barrier over the concrete barrier. As shown in Table 6-8, this favorability ratio ranges from one to about four from the upper right corner to the lower left corner, indicating that: (a) when the deflection distance is available, high-tension cable barrier is more cost-effective than concrete barrier for a given AADT and median width, and (b) the favorability of high-tension cable barrier increases as AADT decreases and as median width increases. Given the limitation of the state of data indicated above, one possible recommendation at this time is to consider using high-tension cable barriers (instead of concrete barriers) when the favorability ratio in Table 6-7 exceeds 1.5. However, the final decision about the appropriate favorability ratio to use for deciding when high-tension cable barriers should be used in lieu of concrete barrier is more of a policy matter left with TxDOT. PRELIMINARY MEDIAN BARRIER DESIGN GUIDELINES Based on the analyses presented above and the developed cross-median crash frequency models, one possible and rather simple option developed for installing median barriers is presented in Table 6-8. We note that many other alternative guidelines are possible. Under this option, the mean B/C ratio table is divided into four priority zones having mean B/C ratios greater than 10, between six and 10, between two and six, and below two. Highway sections that fall into Zone #1, which has a mean B/C ratio greater than 10, should be given the highest priority when considering the installation of median barriers. Those highway sections with an AADT and median width combination that fall into Zone #2 should be given the second highest priority, etc. Based on the developed cross-median crash frequency model, the mean expected number of cross-median crashes for all the cells that fall in each priority zone is also provided in Table 6-8; namely, 0.7, 0.4, and 0.2 cross-median crashes per mile per year for Zones #1, #2, and #3, respectively. These values were estimated as the average cross-median crash rates (using the posterior mean) taken over all the cells in that zone.

78
Table 6-7. Benefit/Cost Ratios for Installing High-Tension Cable Barriers over Concrete Barriers: Favorability.
AADT (in 1000s) Median Width (ft) 0 5 10 15 20 25 30 35 40 45 50 55 60 65 70 75 80 85 90 95 100 105 110 115 120 125
0 0 2.0 1.8 1.7 1.6 1.5 1.4 1.3 1.3 1.2 1.2 1.1 1.1 1.0 1.0 1.0 0.9 0.9 0.9 0.8 0.8 0.8 0.8 0.8 0.7 0.7 5 0 2.0 1.9 1.7 1.6 1.6 1.5 1.4 1.3 1.3 1.2 1.2 1.1 1.1 1.1 1.0 1.0 1.0 0.9 0.9 0.9 0.9 0.8 0.8 0.8 0.8
10 0 2.1 1.9 1.8 1.7 1.6 1.5 1.5 1.4 1.3 1.3 1.2 1.2 1.2 1.1 1.1 1.0 1.0 1.0 1.0 0.9 0.9 0.9 0.9 0.8 0.8 15 0 2.1 2.0 1.9 1.8 1.7 1.6 1.5 1.5 1.4 1.4 1.3 1.3 1.2 1.2 1.1 1.1 1.1 1.0 1.0 1.0 1.0 0.9 0.9 0.9 0.9 20 0 2.2 2.0 1.9 1.8 1.7 1.7 1.6 1.5 1.5 1.4 1.4 1.3 1.3 1.2 1.2 1.2 1.1 1.1 1.1 1.1 1.0 1.0 1.0 1.0 0.9 25 0 2.1 2.0 1.9 1.8 1.7 1.7 1.6 1.5 1.5 1.4 1.4 1.4 1.3 1.3 1.2 1.2 1.2 1.1 1.1 1.1 1.1 1.0 1.0 1.0 1.0 30 0 2.0 1.9 1.8 1.8 1.7 1.6 1.6 1.5 1.5 1.5 1.4 1.4 1.3 1.3 1.3 1.2 1.2 1.2 1.2 1.1 1.1 1.1 1.1 1.0 1.0 35 0 2.0 1.9 1.8 1.7 1.7 1.6 1.6 1.5 1.5 1.5 1.4 1.4 1.4 1.3 1.3 1.3 1.2 1.2 1.2 1.2 1.1 1.1 1.1 1.1 1.1 40 0 1.9 1.8 1.8 1.7 1.7 1.6 1.6 1.5 1.5 1.5 1.4 1.4 1.4 1.3 1.3 1.3 1.3 1.2 1.2 1.2 1.2 1.2 1.1 1.1 1.1 45 0 1.9 1.8 1.8 1.7 1.7 1.6 1.6 1.5 1.5 1.5 1.5 1.4 1.4 1.4 1.3 1.3 1.3 1.3 1.2 1.2 1.2 1.2 1.2 1.2 1.1 50 0 1.8 1.8 1.7 1.7 1.7 1.6 1.6 1.6 1.5 1.5 1.5 1.4 1.4 1.4 1.4 1.3 1.3 1.3 1.3 1.3 1.2 1.2 1.2 1.2 1.2 55 0 1.8 1.8 1.7 1.7 1.6 1.6 1.6 1.6 1.5 1.5 1.5 1.4 1.4 1.4 1.4 1.4 1.3 1.3 1.3 1.3 1.3 1.3 1.2 1.2 1.2 60 0 1.8 1.7 1.7 1.7 1.6 1.6 1.6 1.6 1.5 1.5 1.5 1.5 1.4 1.4 1.4 1.4 1.4 1.3 1.3 1.3 1.3 1.3 1.3 1.2 1.2 65 0 1.8 1.7 1.7 1.7 1.6 1.6 1.6 1.6 1.5 1.5 1.5 1.5 1.4 1.4 1.4 1.4 1.4 1.4 1.3 1.3 1.3 1.3 1.3 1.3 1.3 70 0 1.7 1.7 1.7 1.6 1.6 1.6 1.6 1.6 1.5 1.5 1.5 1.5 1.5 1.4 1.4 1.4 1.4 1.4 1.4 1.3 1.3 1.3 1.3 1.3 1.3 75 0 1.7 1.7 1.7 1.6 1.6 1.6 1.6 1.6 1.5 1.5 1.5 1.5 1.5 1.5 1.4 1.4 1.4 1.4 1.4 1.4 1.4 1.3 1.3 1.3 1.3 80 0 1.7 1.7 1.7 1.6 1.6 1.6 1.6 1.6 1.5 1.5 1.5 1.5 1.5 1.5 1.4 1.4 1.4 1.4 1.4 1.4 1.4 1.4 1.4 1.3 1.3 85 0 1.7 1.7 1.6 1.6 1.6 1.6 1.6 1.6 1.5 1.5 1.5 1.5 1.5 1.5 1.5 1.4 1.4 1.4 1.4 1.4 1.4 1.4 1.4 1.4 1.3 90 0 1.7 1.7 1.6 1.6 1.6 1.6 1.6 1.6 1.5 1.5 1.5 1.5 1.5 1.5 1.5 1.5 1.4 1.4 1.4 1.4 1.4 1.4 1.4 1.4 1.4 95 0 1.7 1.6 1.6 1.6 1.6 1.6 1.6 1.6 1.5 1.5 1.5 1.5 1.5 1.5 1.5 1.5 1.4 1.4 1.4 1.4 1.4 1.4 1.4 1.4 1.4
100 0 1.6 1.6 1.6 1.6 1.6 1.6 1.6 1.5 1.5 1.5 1.5 1.5 1.5 1.5 1.5 1.5 1.5 1.4 1.4 1.4 1.4 1.4 1.4 1.4 1.4 105 0 1.6 1.6 1.6 1.6 1.6 1.6 1.6 1.5 1.5 1.5 1.5 1.5 1.5 1.5 1.5 1.5 1.5 1.5 1.4 1.4 1.4 1.4 1.4 1.4 1.4 110 0 1.6 1.6 1.6 1.6 1.6 1.6 1.6 1.5 1.5 1.5 1.5 1.5 1.5 1.5 1.5 1.5 1.5 1.5 1.5 1.4 1.4 1.4 1.4 1.4 1.4 115 0 1.6 1.6 1.6 1.6 1.6 1.6 1.6 1.5 1.5 1.5 1.5 1.5 1.5 1.5 1.5 1.5 1.5 1.5 1.5 1.5 1.4 1.4 1.4 1.4 1.4 120 0 1.6 1.6 1.6 1.6 1.6 1.6 1.5 1.5 1.5 1.5 1.5 1.5 1.5 1.5 1.5 1.5 1.5 1.5 1.5 1.5 1.5 1.4 1.4 1.4 1.4 125 0 1.6 1.6 1.6 1.6 1.6 1.6 1.5 1.5 1.5 1.5 1.5 1.5 1.5 1.5 1.5 1.5 1.5 1.5 1.5 1.5 1.5 1.5 1.4 1.4 1.4
*Based on a four-lane, 65 mph (88 km/hr) posted speed limit scenario **Due to the deflection characteristic of cable barriers upon impact, installing on medians with a width less than 20 ft is usually not appropriate

79
Table 6-8. A Potential Guideline for Installing Median Barriers – Based on a Priority Zone Concept and Cross-Median Crash History (Five-Year Period).
AADT (in 1000)
Median Width (ft)
00-05
05-10
10-15
15-20
20-25
25-30
30-35
35-40
40-45
45-50
50-55
55-60
60-65
65-70
70-75
75-80
80-85
85-90
90-95
95-100
100-105
105-110
110-115
115-120
120-125
00-05 05-10 10-15 15-20 20-25 25-30 30-35 35-40 40-45 45-50 50-55 55-60 60-65 65-70 70-75 75-80 80-85 85-90 90-95
95-100 100-105 105-110 110-115 115-120 120-125
Note: Based on a four-lane highway with a posted speed limit of 65 mph (104 km/hr) scenario.
Zone #4: Installing Barrier May be Uneconomical or Even Wasteful
Zone #3: 2 ≤ Mean B/C < 6 Mean CMC: 0.2 CMC/mi-yr
Zone #2: 6 ≤ Mean B/C < 10 Mean CMC: 0.4 CMC/mi-yr
Zone #1: Mean B/C ≥ 10 Mean CMC: 0.7 CMC/mi-yr
80
The computed CMC rates are useful in formulating guidance for installation of median barrier on existing highways based on a highway section’s cross-median crash history. For example, for any existing road section, if its cross-median crash rate exceeds 0.7, 0.4, and 0.2 crashes per mile per year over a 5-year time period, it could be re-prioritized to Zone #1, #2, and #3, respectively, if it does not already belong to that zone based upon AADT and median width.
81
CHAPTER 7. MEDIAN BARRIER GUIDELINES RECOMMENDED GUIDELINES FOR TEXAS Table 7-1 presents a recommended guideline for installation of median barriers on high-speed, controlled-access highways in Texas that have relatively flat, traversable medians. These criteria are based on an economic analysis of median crossover crashes and other median-related crashes occurring in Texas on the selected highway classes. In Table 7-1, the guideline is divided into four different zones defined by various combinations of average annual daily traffic and median width. Each zone has an associated mean cross-median crash rate that can be used to evaluate cross-median crash history on a selected highway section. Barriers are normally required for combinations of AADT and median width that fall into the right-most zone, Zone #1. This zone is generally associated with high traffic volumes and low median width, which results in increased exposure and a higher probability of cross-median crashes. Note that the mean CMC rate associated with medians that fall in this zone is 0.7 cross-median crashes per mile per year. If a crash history study indicates a CMC rate less than 0.7 CMC/mi/yr, the highway section may fall to a lower priority zone and a barrier may not be required. For median width and AADT combinations that fall into Zone #2, installation of median barriers is cost-effective and should generally be considered. The need for barriers can be evaluated by examining cross-median crash history and comparing it to the mean CMC rate for this zone, which is 0.4 CMC/mi/yr. If the highway section has a CMC rate greater than 0.4 CMC/mi/yr, a barrier would normally be required. If the CMC rate is less than 0.4 CMC/mi/yr, a barrier is considered optional. For median width and AADT combinations that correspond to Zone #3, a barrier is considered optional and is only warranted when there is a significant history of cross-median crashes (i.e., CMC rate > 0.4 CMC/mi/yr). Barriers are not normally considered for combinations of AADT and median width that fall into the left-most zone, Zone #4, unless there is an adverse crash history. It should be noted that after a warranted median barrier is installed, the crash frequency at that location may increase because the recovery area available to drivers that errantly leave the travelway will be reduced. However, the overall crash severity should decrease due to the prevention of severe cross-median crashes that might otherwise occur along that highway section. The modeling and analyses upon which the median barrier guidelines are based take into account all types of median crashes, including the expected number of barrier crashes after a median barrier is installed. Given the various assumptions documented in earlier chapters of this report, the results of these analyses clearly indicate the cost-effectiveness of median barriers for the combinations of AADT and median width presented in the guidelines.
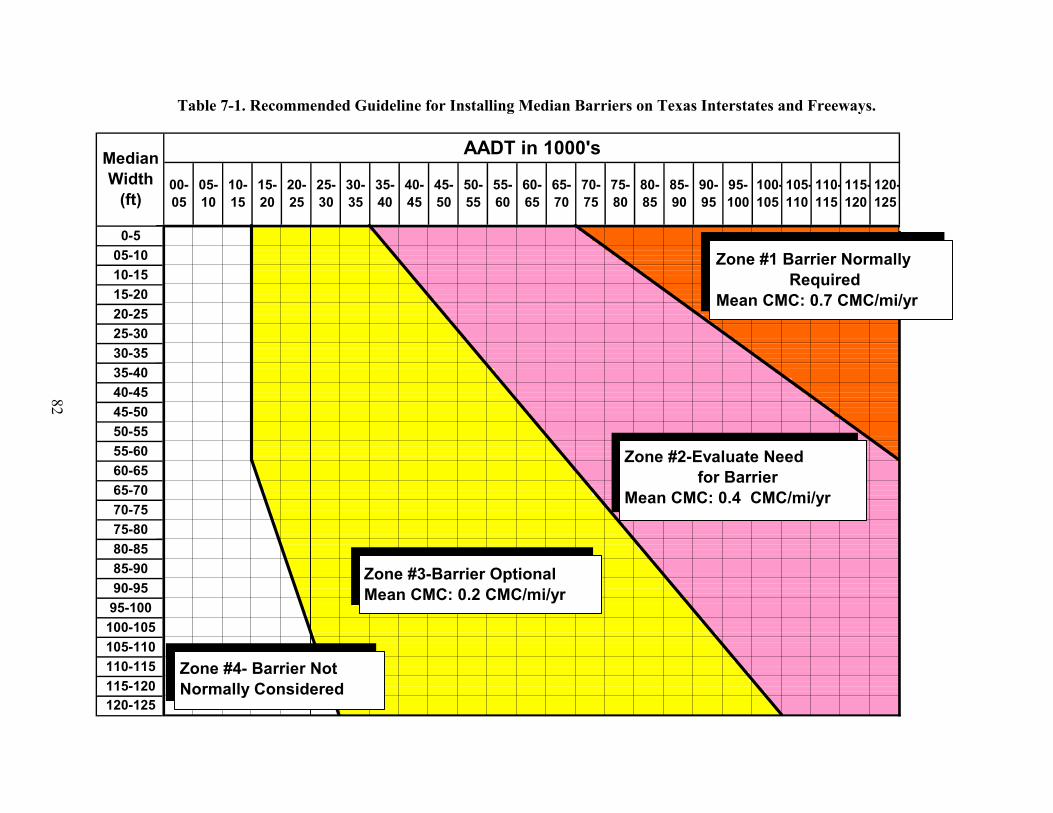
82
115-120120-125
95-100100-105105-110110-115
75-8080-8585-9090-95
55-6060-6565-7070-75
35-4040-4545-5050-55
15-2020-2525-3030-35
120-125
0-505-1010-15
100-105
105-110
110-115
115-120
80-85
85-90
90-95
95-100
60-65
65-70
70-75
75-80
40-45
45-50
50-55
55-60
Median Width
(ft)
AADT in 1000's
00-05
05-10
10-15
15-20
20-25
25-30
30-35
35-40
Zone #3-Barrier Optional Mean CMC: 0.2 CMC/mi/yr
Zone #2-Evaluate Need for Barrier Mean CMC: 0.4 CMC/mi/yr
Zone #1 Barrier Normally Required Mean CMC: 0.7 CMC/mi/yr
Zone #4- Barrier Not Normally Considered
Table 7-1. Recommended Guideline for Installing Median Barriers on Texas Interstates and Freeways.

83
Mean CMC rates are provided for each of the priority zones that form the median barrier guideline to assist designers and engineers in the decision-making process regarding whether or not to install a median barrier along an existing highway section. Crash history of a highway section can be analyzed to determine the mean CMC rate over a five-year period. Generally speaking, if the mean CMC rate exceeds 0.4 CMC/mi/yr, a median barrier should be considered. This holds for highway sections that might be classified in a lower priority zone, Zone #3, on the median barrier guideline based on AADT and median width. For example, a barrier would be optional for a highway section that has an AADT and median width that correspond to Zone #3. If a subsequent crash history study indicates that the section has a mean CMC rate greater than 0.4 CMC/mi/yr, it would be reprioritized to a higher zone and a median barrier should be considered. As indicated by the favorability ratios presented in Table 6-7, high-tension cable median barriers are generally more cost-effective than concrete median barriers for the range of median widths for which they are applicable. Generally speaking, depending on the configuration of the barrier, the dynamic design deflection of high-tension median barriers limit their use to medians that are 20 ft or greater in width. Concrete median barriers should be used in narrow medians that offer little or no room for barrier deflection. Concrete barriers may also be suitable when low maintenance is desirable due to cost or safety concerns or when the consequences of barrier penetration demand positive containment for a broad range of vehicles and trucks. EXISTING AASHTO AND STATE DOT GUIDELINES For high-speed, controlled-access roadways that have relatively flat, traversable medians, the AASHTO Roadside Design Guide recommends that a highway designer evaluate the need for barriers on all medians up to 30 ft (10 m) in width when the AADT is 20,000 vehicles per day or greater. Barriers are optional for all medians with widths between 30 ft (10 m) and 50 ft (15 m) or when the median width is less than 30 ft and the AADT is less than 20,000. In 1998, the North Carolina Department of Transportation implemented a more stringent policy of installing median barriers for all new construction, reconstruction, and resurfacing projects on freeways having median widths of 70 ft (21 m) or less. It also included a traffic improvement program to install cable median barriers on approximately 1000 miles of freeways during the 2000–2006 time period (9). While in the last two decades or so median barriers have either been metal-beam guardrail (including W and thrie beams) or concrete barrier (e.g., New Jersey and constant slope), NCDOT was one of the first states to use cable barriers in recent years (10). In 1998, the California Department of Transportation also adopted more stringent guidelines based on AADT for freeways with median widths less than 75 ft (23 m) (37). Concrete barriers are recommended for medians less than 20 ft (6.1 m) in width. Either concrete or thrie beam barriers can be used for medians with widths between 20 and 36 ft (6.1 m and 11 m). Thrie beam barriers are recommended for medians ranging from 36 to 75 ft (11 m to 23 m) in width. A crash-history warrant was also developed justifying further analysis to determine the advisability

84
of a barrier when a site exceeds 0.5 cross-median crashes of any severity level per mile per year or 0.12 fatal cross-median crashes per mile per year. For new construction, median barriers are required whenever it is anticipated that they will be justified within five years after construction. Glad et al. (38) reports a B/C analysis conducted by the Washington State Department of Transportation (WSDOT) for cable, metal beam guardrail, and concrete median barriers. It was concluded that barriers placed in median sections up to 50 ft (15 m) wide are cost-effective for high-speed (>45 mph or 72 km/hr in posted speed limit), high-volume, multilane, access-controlled, and divided state highways. An in-service study was recently conducted on cable median barriers installed in the mid-1990s to analyze their initial installation cost, maintenance cost and experience, and crash history (24). They noted that while the overall number of crashes increased noticeably, the number of severe crashes (fatal and disabling) decreased significantly. In addition, they estimated that the installation of cable barriers had benefited society by $420,000 per mile annually. The Florida Department of Transportation (FDOT) requires interstate highways to have median barriers installed if the median width is less than 64 ft (20 m). Median barriers are required for freeways with design speeds greater than or equal to 60 mph (96 km/hr) and median widths less than 60 ft. If the design speed is less than 60 mph (96 km/hr), median barriers are required for median widths less than 40 ft wide (39). FDOT further requires a cross-median crash history evaluation for any interstate and expressway project. If there are three or more cross-median crashes in the most recent five-year period within that segment, median barriers shall be provided and no B/C analysis is required. Depending on the length of the weaving section, this equates to about 0.35 to 0.4 cross-median crashes per mile per year, which is more stringent than the Caltrans’ crash history warrant of 0.5 crashes per mile per year. For those that have fewer than three cross-median crashes, a B/C analysis shall be conducted to determine barrier need. The various median barrier guidelines described above have been graphically plotted in Figure 7-1 for comparison with each other and with the proposed guidelines for Texas. As indicated in the table, there are several states (including some not shown) that have adopted guidelines that require use of median barriers in medians with widths beyond those currently published by AASHTO in the 2002 Roadside Design Guide. Several of the guidelines (e.g., Florida, North Carolina, and Washington) are based on median width only without consideration of average daily traffic. These guidelines are represented as horizontal lines on Table 7-2. Other guidelines (e.g., California, Ohio) vary with ADT up to some threshold median width beyond which median barriers are not required. The analyses conducted under this project indicate that the cost-effectiveness of median barriers varies with median width and AADT, both of which affect exposure for cross-median crashes. Although such policies may be adopted for a variety of reasons, the analyses do not support a guideline based solely on median width, nor any particular cutoff value for median width within the range analyzed.

85
110-115
115-120
120-125
AADT in 1000's
90-95
95-100
100-105
105-110
70-75
75-80
80-85
85-90
50-55
55-60
60-65
65-70
30-35
35-40
40-45
45-50
10-15
15-20
20-25
25-30
110-115115-120120-125
05-10
90-9595-100100-105105-110
70-7575-80
85-90
50-5555-6060-6565-70
35-4040-4545-50
80-85
Median Width
(ft) 00-05
0-505-1010-1515-2020-2525-3030-35 OH
WA
FL
AASHTO (Evaluate Need)
NC
CA
AASHTO (Optional)
Crash History WarrantsCA: >0.5 CMC/mi/yr or >0.12 fatal CMC/mi/yr
FL~0.35-0.40 CMC/mi/yr
CA
Proposed Guidelines for Texas
Figure 7-1. Graphical Summary of Existing Median Barrier Guidelines from AASHTO and Selected State DOTs.
CA: >0.5 CMC/mi/yr or >0.12 fatal CMC/mi/yr FL: ~0.35-0.40 CMC/mi/yr
86
The benefit/cost ratios suggest that, under some circumstances, a median barrier is cost-effective for median widths greater than those currently used for median barrier warrants by other states. As shown in Table 7-1, the recommended guidelines for Texas include consideration of median widths up to 125 ft, which is the limit for which crash data were available. As discussed in Chapter 5, 68 percent of the cross-median crashes analyzed during the two-year study period occurred on highway sections having median widths ranging from 51 to 74 ft. Another 18 percent occurred on sections having median widths of 75 ft or greater. Of course, it should be noted that most medians on interstates and controlled access freeways having a width of 30 ft or less were already treated with median barrier in accordance with current TxDOT guidelines.
87
CHAPTER 8. CONCLUSIONS AND IMPLEMENTATION RECOMMENDATIONS
This chapter is divided into two sections. The first section summarizes findings and presents conclusions emanating from the analyses performed under this project. The second section presents recommendations for implementation of the proposed median barrier guidelines developed for Texas. SUMMARY AND CONCLUSIONS When they occur, cross-median crashes are typically very violent in nature and have a high probability of multiple serious injuries and deaths. Research shows that cross-median crashes are responsible for a disproportionately high rate of fatalities in Texas and other states. Many of these severe cross-median crashes can be prevented with adequate barrier protection. However, barriers should not be used indiscriminately as they, too, constitute a hazard to motorists. A barrier is typically warranted when the consequences of encroaching into or across the median is judged to be more severe than striking the barrier. TxDOT’s Roadway Design Manual differentiates guidance for median barriers on the basis of control of access and median width. Median barriers are generally provided for controlled access highways with medians of 9 m (30 ft) or less in width. If justified through an operational analysis, median barriers may be provided for medians with widths greater than 9 m (30 ft). However, while the guidelines mention operational analysis, there is no guidance given on specific cross-median crash rates that might justify the use of a median barrier on an existing freeway. Furthermore, the current guidance is based on aging data, and changes to vehicle, roadway, and operational characteristics may necessitate changes. Under this project, new guidelines were developed to assist highway engineers with the evaluation of median barrier need such that the highest practical level of median safety can be achieved. The recommended guidelines are based on analysis of median-related crashes in Texas. The crash data were used to develop crash statistical models for the various types of median-related crashes. Based on the estimates derived from the frequency and severity models and crash costs used by the Texas Department of Transportation, an economic analysis of median barrier need was performed. B/C ratios for installing median barriers were computed for various average annual daily traffic and median-width combinations. In general, it was found that the mean B/C ratio increases as AADT increases and decreases as the median width increases. The results of the benefit/cost analysis were used to formulate median barrier guidelines for divided freeways as a function of median width and AADT. Based on the median width and actual or expected AADT for an existing or new facility, respectively, the need for a median barrier can be assessed. Additionally, mean cross-median crash rates were computed for each of the priority zones established by the guideline. The CMC rates are useful to highway engineers in making decisions regarding median barrier needs on existing highway sections based on a

88
highway section’s mean cross-median crash history computed over a five-year period. Generally speaking, if the mean CMC rate exceeds 0.4 CMC per mile per year, a median barrier should be considered. Until the recent acceptance of high-tension cable barriers, TxDOT relied almost exclusively on concrete barriers for separating opposing lanes of traffic. Concrete barriers are well suited for use in narrow medians along high-speed, high-volume roadways due to their negligible deflection, low life-cycle cost, and relatively maintenance-free characteristics. However, rigid barriers impose greater decelerations on impacting vehicles than more flexible systems and, depending on the barrier profile and impact conditions, can impart instability to a vehicle as well. In addition, due to the contact with numerous posts, cable barriers often “capture” a vehicle (i.e., bring it to a safe stop) rather than redirect it back onto the roadway where a secondary crash can result. A disadvantage of weak-post systems is the additional space required to accommodate the larger design deflections. High-tension cable barrier systems are rapidly gaining popularity in median applications. These weak-post systems are typically less expensive to install than strong-post or rigid concrete barriers. Their flexible nature imparts lower decelerations to impacting vehicles and their occupants, resulting in a lower impact severity and probability of injury. The high tension reduces dynamic deflection and enables the cables to remain elevated after an impact. Thus, the barrier often retains much of its functionality and can accommodate additional impacts between the time the barrier is impacted and its subsequent repair. Socketing the support posts in concrete footings increases installation cost but facilitates rapid repair of the cable barrier after an impact, thereby reducing the cost and time of repairs and exposure of workers. Analyses conducted under this project indicate that high-tension cable barriers are generally more cost-effective than concrete barriers for the range of median widths for which they are applicable (i.e., > 20 ft). IMPLEMENTATION RECOMMENDATIONS A recommended guideline for installation of median barriers on Texas highways is presented in Table 7-1. The guideline is considered appropriate for use on high-speed, controlled-access freeways that have relatively flat, traversable medians. Development of the guideline is based on an economic analysis of median crossover crashes and other median-related crashes occurring in Texas on relevant highway classes. The guideline is divided into four different zones defined by various combinations of average annual daily traffic and median width. Mean cross-median crash rates are provided for each of the priority zones that form the median barrier guideline to assist designers and engineers in the decision-making process regarding whether or not to install a median barrier along an existing highway section. Crash history of a highway section can be analyzed to determine the mean CMC rate over a five-year period. Generally speaking, if the mean CMC rate exceeds 0.4 CMC/mi/ year, installation of a median

89
barrier should be considered. This holds for highway sections that might be classified in a lower priority zone on the median barrier guideline (e.g., Zone #3) based on AADT and median width. It is recommended that the guideline be implemented through its incorporation into TxDOT’s Roadway Design Manual. Current guidance can be revised to reflect both the crash history guideline and the operational guideline based on median width and AADT. It should be noted that the presence of a median barrier does not eliminate crashes occurring in medians but alters the character of those crashes. After a median barrier is installed, the crash frequency at that location may increase because the recovery area available to drivers that errantly leave the travelway will be reduced. However, the overall crash severity should decrease due to the prevention of severe cross-median crashes that might otherwise occur along that highway section. Given the stochastic nature of traffic crashes, the uncertainty associated with various data assumptions and the individual site differences (e.g., site preparation costs), a sensitivity analysis was performed to understand how the cost-effectiveness of median barriers might vary if some of the analysis assumptions proved inaccurate. Consideration of the sensitivity analysis in the guideline development helps assure that implementation of the guidelines will result in cost-effective median barrier installations and the realization of benefit/cost ratios greater than 1.0 even under unexpected future conditions. As indicated by computed favorability ratios presented in Table 6-7, high-tension cable median barriers were found to be more cost-effective than concrete median barriers for the range of median widths for which they are applicable. Generally speaking, depending on the configuration of the barrier, the dynamic design deflection of high-tension median barriers limit their use to medians that are 20 ft or greater in width. If it is desirable to offset the median barrier more than 1 ft from the center of the median to avoid drainage issues, potential for erosion, etc., the barrier can be placed anywhere along the median slope, provided it is located at least 8 ft from the bottom of the median ditch. The offset from the ditch bottom reduces the potential for vehicle underride as an errant vehicle traverses the ditch. Also note that as the barrier is offset from the center of the median, the median width required to accommodate the design deflection of the barrier (which is typically 8–10 ft) increases accordingly. Concrete median barriers should be used in narrow medians that offer little or no room for barrier deflection or for medians in which high-tension cable barrier is inappropriate due to insufficient median width. Concrete barriers may also be suitable when low maintenance is desirable due to cost or safety concerns, or when the consequences of barrier penetration demand positive containment for a broad range of vehicles and trucks. Other barrier selection and placement issues are discussed in Chapter 4 of the report. The current Department of Public Safety crash database does not contain a specific variable that adequately identifies a cross-median crash. Thus, various data screening methods must be developed to identify possible cross-median crashes. Hardcopy crash reports for these possible cross-median crashes must then be obtained and reviewed to verify whether or not a particular crash that meets the screening criteria is in fact a true cross-median crash. It is recommended that a designator or variable be implemented in the crash database to permit the clear identification of cross-median crashes for future analyses.


91
REFERENCES 1. Roadside Design Guide. American Association of State Highway and Transportation
Officials, Washington, D.C., 1996. 2. Lynch, J.M., N.C. Crowe, and J.F. Rosendahl. Across Median Accident Study: A
Comprehensive Study of Traffic Accidents Involving Errant Vehicles which Cross the Median Divider Strips on North Carolina Highways, North Carolina Department of Transportation, July 1993.
3. Cunneen, Caltrans Announce New Freeway Barrier Policy. July 7, 1997 Press Release. 4. Roadway Design Manual. Texas Department of Transportation, February 2004. 5. Ross, Jr., H.E., D.L. Sicking, R.A. Zimmer, and J.D. Michie. Recommended Procedures for
the Safety Performance Evaluation of Highway Features, National Cooperative Highway Research Program Report 350, Transportation Research Board, National Research Council, Washington, D.C., 1993.
6. Seamons, L.L., and R. Smith. Past and Current Median Barrier Practice in California,
Report No. Caltrans-TE-90-2, Traffic Operations Division – District 8, California Department of Transportation, June 1991.
7. Nystrom, K., et al. Median Barrier Study Warrant Review – 1997. California Department of
Transportation, Report CALTRANS-TE-97-02, Sacramentro, California, December 1997. 8. Traffic Manual. California Department of Transportation, Traffic Operations Division,
November 2002. [Online]. Available: http://www.dot.ca.gov/hq/traffops/signtech/signdel/trafficmanual.htm. Site Accessed May 17, 2004.
9. Troy, S. Median Barriers in North Carolina – Long Term Evaluation, Presentation at the
American Association of State Highway and Transportation Officials Cable Median Barrier Technology Implementation Group meeting, Raleigh, North Carolina, July 2005. [Online]. Available: http://www.ncdot.org/doh/PRECONSTRUCT/traffic/reports/AASHTO/docs/MBEval.pdf. Site Accessed April 10, 2006.
10. Hunter, W.W., J.R. Stewart, K.A. Eccles, H.F. Huang, F.M. Council, and D.L. Harkey.
“Three-Strand Cable Median Barrier in North Carolina: An In-Service Evaluation,” Paper No. 01-0375, Presented at the Transportation Research Board Annual Meeting, January 2001.
11. Hughes, W., Smith, M., Stewart, D., Harkey, D., and Reinfurt, D. “Improved Guidelines for
Median Safety,” Interim Report, NCHRP Project 17-14, October 1997.
92
12. Donnell, E.T. and W. E. Hughes. Improved Guidelines for Median Safety. NCHRP Project
17-14, Draft Final Report, July 2004. 13. National Cooperative Highway Research Program – Project 22-21: Median Cross-Section
Design for Rural Divided Highways, Project Page – March 2006. [Online]. Available: http://www4.trb.org/trb/crp.nsf/All+Projects/NCHRP+22-21.
14. National Cooperative Highway Research Program – Project 22-22: Placement of Traffic
Barriers on Roadside and Median Slopes, Project Page – March 2006. [Online]. Available: http://www4.trb.org/trb/crp.nsf/All+Projects/NCHRP+22-22.
15. Mason, J.M., et al. Median Safety Study – Interstates and Expressways, Final Report –
Volume I, Pennsylvania Transportation Institute, Pennsylvania State University, June 2001. 16. Mak, K.K. “Continuous Evaluation of In-Service Highway Safety Feature Performance,”
Final Report 482, Arizona Department of Transportation, September 2002. 17. Mak, K. K., “Cross-Median Accident Prediction Model,” White Paper prepared for NCHRP
Project 22-12, March 1999. 18. Roadside Design Guide. American Association of State Highway and Transportation
Officials, Washington, D.C., 2002. 19. “Proposed Full-Scale Testing Procedures for Guardrails,” Circular 482, Highway Research
Board, Washington, D.C., September 1962. 20. Outcalt, W. Cable Guardrail – Interim Report, Report No. CDOT-DTD-R-2004-10,
Colorado Department of Transportation – Research Branch, Denver, Colorado, June 2004. 21. First CASS Barrier Installation, TxDOT Expressway, Dallas District News Release, January
28, 2005. 22. Hartzel, T. Raising the Barrier on Bush Turnpike, Dallas Morning News, April 16, 2004. 23. Sharp, B. and R. Stewart. Annual Experimental Features Report, Report No. UT-04.03,
Utah Department of Transportation Research Division, Salt Lake City, Utah, June 2004. 24. McClanahan, D., R. Albin, and J. Milton. Washington State Cable Median Barrier
In-Service Study, CD-ROM for 83rd Annual Meeting of the Transportation Research Board, Washington D.C., January 2004.
25. Longitudinal Cable Barrier Installation along I-35 in Cleveland Count, Oklahoma
Transportation Commission, Agenda Item No. 61, April 22, 2004.
93
26. Sheikh, N. and R.P. Bligh. Analysis of the Impact Performance of Concrete Median Barrier
Placed on or Adjacent to Slopes, Research Report 0-5210-1, Texas Transportation Institute, College Station, Texas, June 2006.
27. Martin, J-L., and R. Quincy. Crossover Crashes at Median Strips Equipped with Barriers on
a French Motorway Network. Paper No. 01-0524, Transportation Research Record 1758, TRB, 2001.
28. Miaou, S-P., J.J. Song, and B.K. Mallick. Roadway Traffic-Crash Mapping: A Space-Time
Modeling Approach. Journal of Transportation and Statistics. Vol. 6, No. 1, Nov. 2003, pp. 33-57.
29. Miaou, S-P., and D. Lord. Modeling Traffic Crash-Flow Relationships for Intersections:
Dispersion Parameter, Functional Form, and Bayes Versus Empirical Bayes Methods. Paper No. 03-3363, Transportation Research Record 1840, Journal of Transportation Research Board, 2003, pp. 31-40.
30. Gelman, A., J.B. Carlin, H.S. Stern, and D.B. Rubin. Bayesian Data Analysis. Chapman &
Hall/CRC Press, 1995. 31. Spiegelhalter, D.J., A. Thomas, N.G. Best and D. Lunn. WinBUGS Version 1.4 User
Manual. MRC Biostatistics Unit, Cambridge, 2003. 32. Carlin, B.P., and T.A. Louis. Bayes and Empirical Bayes Methods for Data Analysis.
London: Chapman and Hall/CRC, 1996. 33. Congdon, P. Bayesian Statistical Modeling. Wiley, New York, 2001. 34. Federal Highway Administration (FHWA). Highway Safety Evaluation: Procedural Guide.
Report No. FHWA-TS-81-219, Washington, D.C., November 1981. 35. Minnesota Department of Transportation (MnDOT). Benefit/Cost Analysis for
Transportation Projects. Office of Investment Management, 2002. 36. Center for Transportation Research and Education (CTRE). New Guardrail System Should
Save Lives. Technology News. Iowa State University, March-May Issue, 2004. 37. California Department of Transportation (Caltrans). Traffic Manual: Chapter 7 Traffic
Safety Systems. California Department of Transportation, May 1998. 38. Glad, R.W., R.B. Albin, D.M. McIntoch, and D.K. Olson. Median Treatment Study on
Washington State Highways. Research Report WA-RD 516.1, Washington State Department of Transportation, March 2002.
39. Florida Department of Transportation (FDOT). Plans Preparation Manual, Volume 1:
Design Criteria and Process. Roadway Design Office. Revised, January 1, 2004.