medi-cal managed care performance dashboard · apr-15 may-15 jun-15 jul-15 aug-15 sep-15 oct-15...
TRANSCRIPT

Medi-Cal Managed Care Performance Dashboard Glossary
Released March 16, 2017
Glossary Page 1 of 3
Quarterly Release Notes
Utilization Figures 4-1 to 6-2: The abbreviation MO (Medi-Cal coverage only) has been added to the ACA, SPD,
OTLIC, and Other labels. This is to help better differentiate between Dual and Non-Dual member utilization. See the
Medicare Status section for addition information.
Note: Percentage metrics are displayed as whole numbers. Charts may add up to 99%, 100% or 101%.
Population Aid Code Groups
Affordable Care Act (ACA): This population consists of the following Adult Expansion aid codes: M1, M2, M3, M4, L1, and 7U.
Optional Targeted Low Income Children (OTLIC): This population consists of the following OTLIC aid codes: 2P, 2R,
2S, 2T, 2U, 5C, 5D, E2, E5, E6, E7, H1, H2, H3, H4, H5, M5, T0, T1, T2, T3, T4, T5, T6, T7, T8, and T9.
Medi-Cal only Seniors and Persons with Disabilities (SPD): This population consists of the following SPD aid codes:
10, 13, 14, 16, 17, 1E, 1H, 20, 23, 24, 26, 27, 2E, 2H, 36, 60, 63, 64, 66, 67, 6A, 6C, 6E, 6G, 6H, 6J, 6N, 6P, 6R, 6V, 6W,
6X, 6Y, C1, C2, C3, C4, C7, C8, D2, D3, D4, D5, D6, and D7.
Other Populations (Other): This population consists of all other aid codes not mentioned above.
Medicare Status
Dual: This population consists of any Medi-Cal eligible member who has active Medicare coverage. Active Medicare coverage means one or more of the following Medicare portions are active: Part A, B, or D. A Dual member is not identified by an aid code or aid code group.

Medi-Cal Managed Care Performance Dashboard Glossary
Released March 16, 2017
Glossary Page 2 of 3
Non-Dual: This population consists of any Medi-Cal eligible member who is Medi-Cal only and has no active Medicare coverage. Aid code groups are displayed as Medi-Cal only for the following measures: Utilization, Grievance and Appeals, and State Fair Hearings.
Utilization Measures for Certified Eligible Managed Care Members
Utilization is tracked by aid code population and Medicare status. Utilization metrics displayed by aid code group is Medi-
Cal coverage only (MO) and does not include Medicare coverage.
Emergency Room (ER) Visits: This measure captures the number of ER visits per month. The results from this
measure are used to calculate ER visits with an inpatient admission. A visit consists of a unique combination between
provider, member and date of service. This measure is displayed per 1,000 member months.
Emergency Room (ER) Visits with an Inpatient (IP) Admission: This measure captures the number of ER visits that
resulted in an inpatient admission per month. The results of this measure are a subset of ER visits and IP admissions.
The service date and member identification are linked to create this measure. An admission consists of a unique
combination between member and date of admission to a facility. This measure is displayed per 1,000 member months.
Inpatient (IP) Admissions: This measure captures the number of Inpatient Admissions per month. The results from this
measure are used to calculate ER visits with an inpatient admission. An admission consists of a unique combination
between member and date of admission to a facility. This measure is displayed per 1,000 member months.
Outpatient (OP) Visits: This measure captures the number of OP visits per month. A visit consists of a unique
combination between provider, member and date of service. This measure is displayed per 1,000 member months.
Prescriptions: This measure captures the number of prescriptions per month. A prescription consists of a unique
combination between National Drug Code, member, and date of service. This measure is displayed per 1,000 member
months.

Medi-Cal Managed Care Performance Dashboard Glossary
Released March 16, 2017
Glossary Page 3 of 3
Mild to Moderate Mental Health Visits: This measure captures the number of visits per month related to selected
Psychotherapy Services and Diagnostic Evaluations. The selected procedure codes aim to capture mild to moderate
mental health visits. A visit consists of a unique combination between provider, member and date of service. This
measure is displayed per 1,000 member months.
Grievance, Appeals and State Fair Hearings
Grievance and Appeals: Grievance and Appeals data is plan reported. Grievance and Appeals metrics displayed by aid
code group is Medi-Cal coverage only (Non-Dual) and does not include Medicare coverage.
State Fair Hearings: Hearing data is submitted through the Department of Social Services. Hearing metrics displayed by aid code group is Medi-Cal coverage only (Non-Dual) and does not include Medicare coverage.

Medi-Cal Managed Care Performance Dashboard
Released March 16, 2017
CERTIFIED ELGIBLE ENROLLMENT: As of September 2016 (Data Warehouse pull February 2017)
0%
10%
20%
30%
40%
50%
60%
70%
80%
90%
100%
Per
cen
tage
Oct-15 Nov-15 Dec-15 Jan-16 Feb-16 Mar-16 Apr-16 May-16 Jun-16 Jul-16 Aug-16 Sep-16
OTLIC 1,110,557 1,124,369 1,130,237 1,129,634 1,140,254 1,152,829 1,164,363 1,172,892 1,191,501 1,190,137 1,192,129 1,195,805
SPD 1,564,371 1,562,621 1,562,008 1,557,934 1,554,990 1,552,961 1,548,237 1,544,633 1,547,071 1,546,455 1,560,659 1,557,624
ACA 3,414,767 3,518,503 3,590,708 3,667,606 3,763,497 3,855,120 3,899,024 3,962,741 4,033,091 4,061,779 4,101,389 4,123,512
OTHER 4,036,390 4,014,124 3,991,594 4,002,024 3,994,243 3,980,672 3,929,994 3,899,277 3,896,085 3,871,977 3,870,538 3,838,873
1-1: Managed Care Enrollment by Aid Population
Managed Care Total 10,126,085 10,219,617 10,274,547 10,357,198 10,452,984 10,541,582 10,541,618 10,579,543 10,667,748 10,670,348 10,724,715 10,715,814
Medi-Cal Type Oct-15 Nov-15 Dec-15 Jan-16 Feb-16 Mar-16 Apr-16 May-16 Jun-16 Jul-16 Aug-16 Sep-16
Fee-for-Service 2,988,414 2,990,010 3,095,972 3,196,491 3,132,161 3,092,539 3,054,375 3,040,214 2,946,050 2,841,660 2,781,047 2,719,553
Speciality Plans 19,506 19,687 20,090 20,386 20,578 20,764 20,875 21,005 21,062 20,971 20,998 20,965
Medi-Cal Program Total 13,134,005 13,229,314 13,390,609 13,574,075 13,605,723 13,654,885 13,616,868 13,640,762 13,634,860 13,532,979 13,526,760 13,456,332
Other Medi-Cal Programs
CMC COHS GMC RM Two-Plan
OTLIC 0 297,888 142,674 45,693 709,550
SPD 111,760 328,707 150,900 33,482 932,775
ACA 1,747 840,359 467,330 173,654 2,640,422
Other 512 732,497 405,629 133,651 2,566,584
0%10%20%30%40%50%60%70%80%90%
100%
Per
cen
tage
1-2: Aid Population by Plan Model
MC80%
FFS/Spec.20%
1-3: Medi-Cal Managed Care vs. FFS/Specialty
64% 62%57%
52%
69%
61%64%
59%
48% 50%
57% 53%
26% 27%30%
37%
24%30%
27%33%
46% 44%
32%38%
9% 11% 13% 10%7% 8% 9% 8% 6% 6%
11% 9%
1-4: Choice and Auto-Assignment Rates
Choice Auto-Assigned Passive + Prior
Note: Data in this dashboard is preliminary and subject to change Page 1 of 11

Medi-Cal Managed Care Performance Dashboard
Released March 16, 2017
CERTIFIED ELGIBLE DEMOGRAPHICS: Managed Care demographics for September 2016 (Data Warehouse pull February 2017)
86%
10%
4%
2-8: Medi-Cal Only "OTHER" Age
57%
43%
2-7: Medi-Cal Only "ACA" Age
96%
4%
2-5: Medi-Cal Only "OTLIC" Age
20%
22%
42%
16%
2-6: Medi-Cal Only "SPD" Age
Age < 1 Ages 1-5 Ages 6-11 Ages 12-17 Ages 18-20 Ages 21-44 Ages 45-64 Ages 65+
Male 86,357 633,075 805,606 712,061 278,213 1,295,929 897,451 301,301
Female 83,014 606,373 767,869 681,958 291,517 1,725,269 1,056,067 493,754
0%
20%
40%
60%
80%
100%
Per
cen
tage
2-2: Age by Gender "All Managed Care"
2%
12%
15%
13%
5%
28%
18%
7%
Age < 1
Ages 1-5
Ages 6-11
Ages 12-17
Ages 18-20
Ages 21-44
Ages 45-64
Ages 65+
2-3: Age Cohorts "All Managed Care"
46%
21%
14%
12%
8%
Hispanic
White
Asian/Pacific Islander
Other/Unknown
African-American
2-4: Race and Ethnicity "All Managed Care"
ACA38%
OTHER36%
SPD15%
OTLIC11%
2-1: Aid Groups "All Managed Care"
Note: Data in this dashboard is preliminary and subject to change Page 2 of 11

Medi-Cal Managed Care Performance Dashboard
Released March 16, 2017
Dual Status Oct-15 Nov-15 Dec-15 Jan-16 Feb-16 Mar-16 Apr-16 May-16 Jun-16 Jul-16 Aug-16 Sep-16
Dual 961,100 963,825 966,998 965,390 964,540 965,183 963,598 962,057 963,275 958,274 957,900 954,377
Non-Dual* 9,164,985 9,255,792 9,307,549 9,391,808 9,488,444 9,576,399 9,578,020 9,617,486 9,704,473 9,712,074 9,766,815 9,761,437
Note: Medi-Cal Only. See glossary.
CERTIFIED ELGIBLE DEMOGRAPHICS: Dual Eligible Managed Care demographics for September 2016 (Data Warehouse pull February 2017)
CMC COHS GMC RM Two Plan
Dual 114,005 225,208 80,907 9,683 524,574
Non-Dual 14 1,974,243 1,085,626 376,797 6,324,757
0%
10%
20%
30%
40%
50%
60%
70%
80%
90%
100%
Per
cen
tage
3-4: Plan Model Totals
28%
27%
19%
19%
8%
White
Hispanic
Asian/PacificIslander
Other/Unknown
African-American
3-3: Dual Eligible by Race and Ethnicity
ACA42%
OTHER39%
SPD7%
OTLIC12%
3-2: Aid Groups "Non-Dual"
ACA7%
OTHER0%
SPD93%
3-1: Aid Groups "Dual"
0%
6%
23%
71%
Age 0-18
Ages 19-39
Ages 40-64
Ages 65+
3-5: Dual Age Cohorts
Note: Data in this dashboard is preliminary and subject to change Page 3 of 11

Medi-Cal Managed Care Performance Dashboard
Released March 16, 2017
UTILIZATION: Statewide April 2015 to March 2016 (Data Warehouse pull February 2017)
-
5
10
15
20
Apr-15 May-15 Jun-15 Jul-15 Aug-15 Sep-15 Oct-15 Nov-15 Dec-15 Jan-16 Feb-16 Mar-16
Vis
its
Apr-15 May-15 Jun-15 Jul-15 Aug-15 Sep-15 Oct-15 Nov-15 Dec-15 Jan-16 Feb-16 Mar-16
MO-SPD 15 16 15 14 14 14 11 12 13 13 11 11
Dual 5 5 5 5 4 4 3 4 4 4 4 4
MO-ACA 4 4 4 4 4 3 3 3 3 3 2 2
MO-Other 1 1 1 1 1 1 1 1 1 1 1 1
MO-OTLIC 1 1 1 1 1 1 1 0 1 1 1 0
4-2: Emergency Room Visits With an Inpatient Admission per 1,000 Member Months
-
20
40
60
80
100
120
Apr-15 May-15 Jun-15 Jul-15 Aug-15 Sep-15 Oct-15 Nov-15 Dec-15 Jan-16 Feb-16 Mar-16
Vis
its
Apr-15 May-15 Jun-15 Jul-15 Aug-15 Sep-15 Oct-15 Nov-15 Dec-15 Jan-16 Feb-16 Mar-16
MO-SPD 97 100 95 94 94 92 83 82 85 90 88 86
Dual 34 34 33 37 37 37 37 35 37 39 38 38
MO-ACA 47 48 47 47 46 45 40 39 41 44 42 42
MO-Other 45 45 39 36 37 39 36 36 37 40 44 39
MO-OTLIC 24 25 20 18 20 21 20 19 19 22 26 22
4-1: Emergency Room Visits per 1,000 Member Months
Note: Data in this dashboard is preliminary and subject to change Page 4 of 11

Medi-Cal Managed Care Performance Dashboard
Released March 16, 2017
UTILIZATION: Statewide April 2015 to March 2016 (Data Warehouse pull February 2017)
-
10
20
30
40
50
Apr-15 May-15 Jun-15 Jul-15 Aug-15 Sep-15 Oct-15 Nov-15 Dec-15 Jan-16 Feb-16 Mar-16
Vis
its
Apr-15 May-15 Jun-15 Jul-15 Aug-15 Sep-15 Oct-15 Nov-15 Dec-15 Jan-16 Feb-16 Mar-16
MO-SPD 38 39 38 39 39 38 36 35 37 37 34 34
Dual 35 34 34 36 43 40 40 43 42 41 37 31
MO-ACA 10 10 9 9 9 9 8 8 8 8 8 8
MO-Other 5 5 5 4 4 5 4 4 4 4 4 4
MO-OTLIC 2 2 2 2 2 2 2 2 2 2 2 2
5-1: Inpatient Admissions per 1,000 Member Months
-
500
1,000
1,500
2,000
2,500
3,000
Apr-15 May-15 Jun-15 Jul-15 Aug-15 Sep-15 Oct-15 Nov-15 Dec-15 Jan-16 Feb-16 Mar-16
Vis
its
Apr-15 May-15 Jun-15 Jul-15 Aug-15 Sep-15 Oct-15 Nov-15 Dec-15 Jan-16 Feb-16 Mar-16
MO-SPD 2,523 2,464 2,374 2,278 2,282 2,495 2,461 2,230 2,293 2,365 2,432 2,518
Dual 1,607 1,547 1,591 1,549 1,535 1,574 1,496 1,414 1,512 1,531 1,508 1,540
MO-ACA 709 670 711 695 673 671 651 599 632 636 642 690
MO-Other 587 551 502 469 489 540 540 482 489 514 558 562
MO-OTLIC 465 431 377 354 381 441 455 398 389 414 467 464
5-2: Outpatient Visits per 1,000 Member Months
Note: Data in this dashboard is preliminary and subject to change Page 5 of 11

Medi-Cal Managed Care Performance Dashboard
Released March 16, 2017
UTILIZATION: Statewide April 2015 to March 2016 (Data Warehouse pull February 2017)
-
500
1,000
1,500
2,000
2,500
3,000
3,500
Apr-15 May-15 Jun-15 Jul-15 Aug-15 Sep-15 Oct-15 Nov-15 Dec-15 Jan-16 Feb-16 Mar-16
Pre
scri
pti
on
s
Apr-15 May-15 Jun-15 Jul-15 Aug-15 Sep-15 Oct-15 Nov-15 Dec-15 Jan-16 Feb-16 Mar-16
MO-SPD 3,158 3,066 3,182 2,990 2,994 3,128 3,141 3,035 3,096 3,010 3,008 3,207
Dual 364 356 369 317 327 369 384 370 375 377 381 401
MO-ACA 990 953 978 890 892 959 965 926 909 924 920 980
MO-Other 483 449 411 349 364 400 400 400 392 402 454 427
MO-OTLIC 257 242 211 174 191 223 223 230 215 229 294 264
6-1: Prescriptions per 1,000 Member Months
-
5
10
15
20
25
30
Apr-15 May-15 Jun-15 Jul-15 Aug-15 Sep-15 Oct-15 Nov-15 Dec-15 Jan-16 Feb-16 Mar-16
Vis
its
Apr-15 May-15 Jun-15 Jul-15 Aug-15 Sep-15 Oct-15 Nov-15 Dec-15 Jan-16 Feb-16 Mar-16
MO-SPD 14 13 15 15 15 16 16 15 16 16 17 17
Dual 25 22 23 24 22 22 22 19 22 22 21 22
MO-ACA 12 11 12 13 12 12 13 11 12 12 13 13
MO-Other 5 5 5 5 5 5 5 5 5 5 6 6
MO-OTLIC 6 5 6 6 6 6 6 5 5 6 6 7
6-2: Mild to Moderate Mental Health Visits per 1,000 Member Months
Note: Data in this dashboard is preliminary and subject to change Page 6 of 11

Medi-Cal Managed Care Performance Dashboard
Released March 16, 2017
Grievance Demographics: Q3 2016 (July to September 2016) Statewide
33%
31%
15%
14%
7%
White
Hispanic
African - American
Other/Unknown
Asian/PacificIslander
7-1: Grievances by Ethnicity
48%
22%
16%
11%3%
7-2: Grievances by Population
ACA
SPD
OTHER
DUAL
OTLIC
0.9
0.4
1.0
0.6
0.3
White
Hispanic
African -American
Other/Unknown
Asian/PacificIslander
7-4: Grievances by EthnicityPer 1,000 Member Months
0.7
1.9
0.2
0.6
0.1
ACA
SPD
OTHER
DUAL
OTLIC
7-5: Grievances by PopulationPer 1,000 Member Months
Note: Data in this dashboard is preliminary and subject to change Page 7 of 11
6%
18%
33%
5%
8%
8%
19%
3%
Age 0-18
4
Ages 65+
es 40-6Ag
es 19-Ag 39
Male Female
7-3: Grievances by Age

Medi-Cal Managed Care Performance Dashboard
Released March 16, 2017
Grievance and Appeals Outcomes: Q3 2016 (July to September 2016) Statewide
64%
46%
59%
52%
58%
29%
48%
28%
38%
35%
7%
7%
14%
10%
7%
Accessibility
Benefits
Other
Quality Of Care
Referral
8-1: Grievance Resolution by Type
Resolved in Favor of Member Resolved in Favor of Plan Unresovled
54%
46%
43%
49%
50%
17%
21%
23%
23%
27%
21%
14%
17%
17%
16%
6%
17%
14%
9%
4%
3%
3%
4%
3%
2%
Accessibility
Benefits
Other
Quality ofCare
Referral
8-2: Grievances by Population and Type
ACA SPD OTHER DUAL OTLIC
Quality Of Care44%
Benefits18%
Other18%
Accessibility12%
Referral8%
8-3: Grievances by Type
0.9
0.6
0.4
0.3
GMC
Two Plan
RM
COHS
8-4: Grievances by Plan Model per 1,000 Member Months
Note: Data in this dashboard is preliminary and subject to change Page 8 of 11
Medi-Cal Managed Care Performance Dashboard
Released March 16, 2017
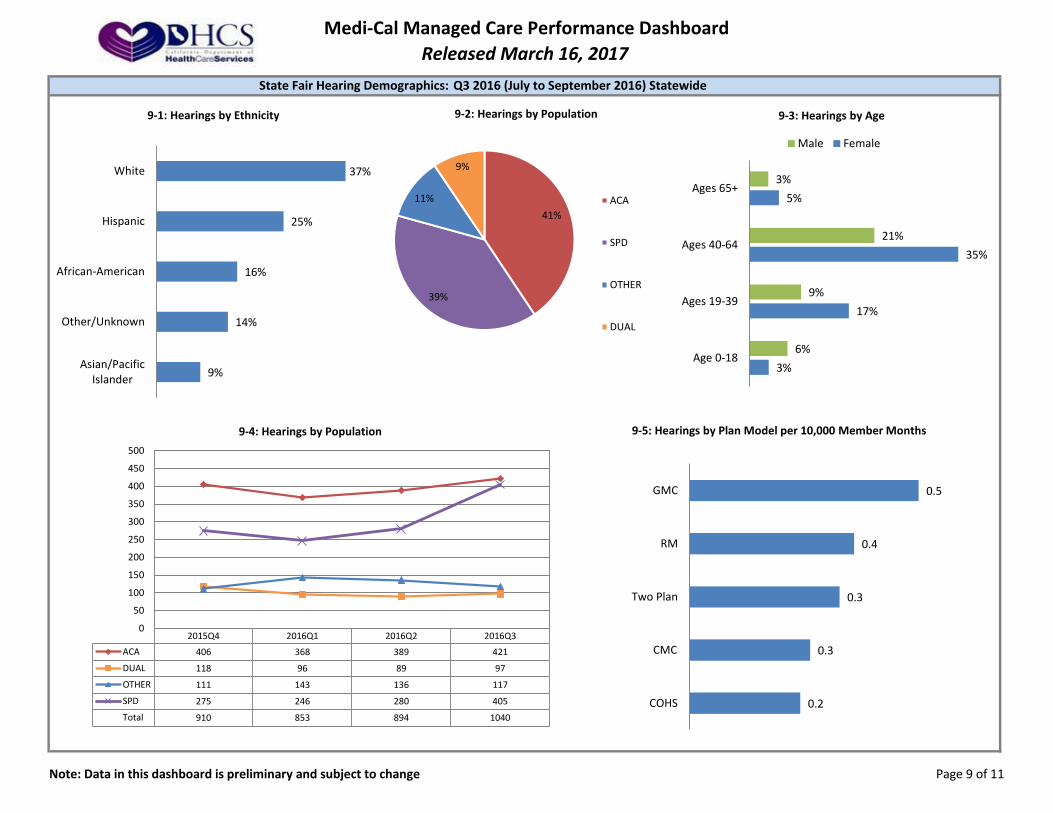
State Fair Hearing Demographics: Q3 2016 (July to September 2016) Statewide
2015Q4 2016Q1 2016Q2 2016Q3
ACA 406 368 389 421
DUAL 118 96 89 97
OTHER 111 143 136 117
SPD 275 246 280 405
Total 910 853 894 1040
0
50
100
150
200
250
300
350
400
450
500
9-4: Hearings by Population
0.5
0.4
0.3
0.3
0.2
GMC
RM
Two Plan
CMC
COHS
9-5: Hearings by Plan Model per 10,000 Member Months
37%
25%
16%
14%
9%
White
Hispanic
African-American
Other/Unknown
Asian/PacificIslander
9-1: Hearings by Ethnicity
41%
39%
11%
9%
9-2: Hearings by Population
ACA
SPD
OTHER
DUAL
3%
17%
35%
5%
6%
9%
21%
3%
Age 0-18
Ages 19-39
Ages 40-64
Ages 65+
9-3: Hearings by Age
Male Female
Note: Data in this dashboard is preliminary and subject to change Page 9 of 11
Medi-Cal Managed Care Performance Dashboard
Released March 16, 2017
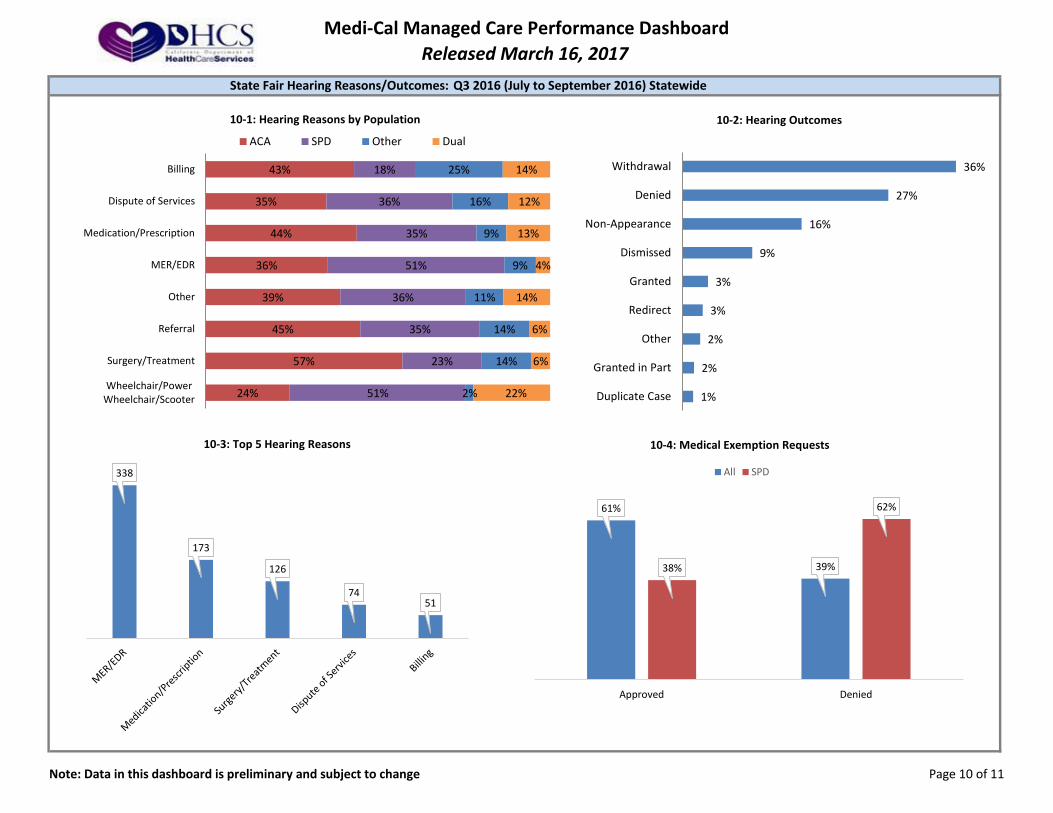
State Fair Hearing Reasons/Outcomes: Q3 2016 (July to September 2016) Statewide
43%
35%
44%
36%
39%
45%
57%
24%
18%
36%
35%
51%
36%
35%
23%
51%
25%
16%
9%
9%
11%
14%
14%
2%
14%
12%
13%
4%
14%
6%
6%
22%
Billing
Dispute of Services
Medication/Prescription
MER/EDR
Other
Referral
Surgery/Treatment
Wheelchair/PowerWheelchair/Scooter
10-1: Hearing Reasons by Population
ACA SPD Other Dual
36%
27%
16%
9%
3%
3%
2%
2%
1%
Withdrawal
Denied
Non-Appearance
Dismissed
Granted
Redirect
Other
Granted in Part
Duplicate Case
10-2: Hearing Outcomes
61%
39%38%
62%
Approved Denied
10-4: Medical Exemption Requests
All SPD338
173
126
7451
10-3: Top 5 Hearing Reasons
Note: Data in this dashboard is preliminary and subject to change Page 10 of 11

Medi-Cal Managed Care Performance Dashboard
Released March 16, 2017
Note: The Aggregated Quality Factor Score (AQFS) is a single score that accounts for plan performance on all DHCS-selected Health Effectiveness Data and Information Set (HEDIS)
indicators. It is a composite rate calculated as percent of the National High Performance Level (HPL). The High Performance Level is 100%. The Minimum Performance Level is 40%. The
State Average is 60%.
0%
10%
20%
30%
40%
50%
60%
70%
80%
90%
100%
KP
So
uth
- S
an D
iego
KP
No
rth
- K
P N
ort
h
SFH
P -
Sa
n F
ran
cisc
o
Cen
Cal
- S
anta
Bar
bar
a
CC
AH
- M
on
tere
y/Sa
nta
Cru
z
Par
tne
rsh
ip -
So
uth
eas
t
HP
SM -
San
Mat
eo
Cal
Op
tim
a -
Ora
nge
Par
tne
rsh
ip -
So
uth
we
st
Cen
Cal
- S
an L
uis
Ob
isp
o
CC
HP
- C
on
tra
Co
sta
He
alth
Ne
t -
Los
An
gele
s
CH
G -
San
Die
go
He
alth
Ne
t -
Tula
re
LA C
are
- Lo
s A
nge
les
IEH
P -
Riv
ers
ide
/San
Ber
nar
din
o
SCFH
P -
San
ta C
lara
AB
C -
Tu
lare
Mo
lina
- Sa
n D
iego
AB
C -
San
Fra
nci
sco
GC
HP
- V
en
tura
CH
W -
Imp
eri
al
AB
C -
San
ta C
lara
CC
AH
- M
erce
d
Car
e F
irst
- S
an D
iego
Cal
Viv
a -
Mad
era
Ala
me
da
Alli
ance
- A
lam
ed
a
Mo
lina
- Sa
cram
en
to
AB
C -
Mad
era
He
alth
Ne
t -
San
Die
go
Cal
Viv
a -
Fre
sno
KFH
S -
Ke
rn
Par
tne
rsh
ip -
No
rth
wes
t
He
alth
Ne
t -
Stan
isla
us
Mo
lina
- Im
pe
rial
Par
tne
rsh
ip -
No
rth
east
AB
C -
Kin
gs
He
alth
Ne
t -
Ke
rn
He
alth
Ne
t -
Sacr
ame
nto
AB
C -
Sac
ram
ento
AB
C -
Co
ntr
a C
ost
a
AB
C -
Ala
me
da
AB
C -
Fre
sno
Mo
lina
- R
ive
rsid
e/S
an B
ern
ard
ino
AB
C -
Re
gio
n 1
Cal
Viv
a -
Kin
gs
HP
SJ -
Sta
nis
lau
s
AB
C -
Re
gio
n 2
HP
SJ -
San
Jo
aqu
in
AB
C -
- S
an
Be
nit
o
CH
W -
Re
gio
n 2
CH
W -
Re
gio
n 1
He
alth
Ne
t -
San
Jo
aqu
in
11-1: 2016 HEDIS Aggregated Quality Factor Score (AQFS)
AQFS HPL - 100% MPL - 40% Weighted Average - 60%
Note: Data in this dashboard is preliminary and subject to change Page 11 of 11