mechanoaccumulative elements of the mammalian...
TRANSCRIPT

Report
Mechanoaccumulative Ele
ments of the MammalianActin CytoskeletonHighlights
d a-actinin, filamin, and myosin II paralogs are major
mechanoaccumulative proteins
d Dictyostelium-developed models predict mammalian
paralog-specific mechanoresponses
d Diffusion-mediated accumulation can be separated from
myosin II-driven flow
d Cooperativity and catch bonds define a ‘‘Goldilocks zone’’ for
mechanoaccumulation
Schiffhauer et al., 2016, Current Biology 26, 1473–1479June 6, 2016 ª 2016 Elsevier Ltd.http://dx.doi.org/10.1016/j.cub.2016.04.007
Authors
Eric S. Schiffhauer, Tianzhi Luo,
Krithika Mohan, ..., Eric R. Griffis,
Pablo A. Iglesias, Douglas N. Robinson
In Brief
The actin cytoskeleton controls cellular
shape change during normal
development and in disease processes.
Schiffhauer et al. discover mammalian
cytoskeletal proteins that accumulate in
response to stress and outline molecular
mechanisms driving this accumulation.
These proteins comprise the cell’s
network-scale response to control cell
shape.

Current Biology
Report
Mechanoaccumulative Elementsof the Mammalian Actin CytoskeletonEric S. Schiffhauer,1,7 Tianzhi Luo,1,7,8 Krithika Mohan,3 Vasudha Srivastava,4 Xuyu Qian,5 Eric R. Griffis,6
Pablo A. Iglesias,1,3,5 and Douglas N. Robinson1,2,4,*1Department of Cell Biology2Department of Pharmacology and Molecular ScienceSchool of Medicine, Johns Hopkins University, Baltimore, MD 21205, USA3Department of Electrical and Computer Engineering4Department of Chemical and Biomolecular Engineering5Department of Biomedical EngineeringWhiting School of Engineering, Johns Hopkins University, Baltimore, MD 21218, USA6Centre for Gene Regulation and Expression, School of Life Sciences, University of Dundee, Dundee DD1 5EH, UK7Co-first author8Present address: Department of Modern Mechanics, University of Science and Technology of China, Hefei, Anhui 230026, China*Correspondence: [email protected]
http://dx.doi.org/10.1016/j.cub.2016.04.007
SUMMARY
To change shape, divide, form junctions, andmigrate, cells reorganize their cytoskeletons inresponse to changing mechanical environments[1–4]. Actin cytoskeletal elements, includingmyosin IImotors and actin crosslinkers, structurally remodeland activate signaling pathways in response toimposed stresses [5–9]. Recent studies demonstratethe importance of force-dependent structural rear-rangement of a-catenin in adherens junctions [10]and vinculin’s molecular clutch mechanism in focaladhesions [11]. However, the complete landscapeof cytoskeletal mechanoresponsive proteins andthe mechanisms by which these elements senseand respond to force remain to be elucidated. Tofind mechanosensitive elements in mammalian cells,we examined protein relocalization in response tocontrolled external stresses applied to individualcells. Here, we show that non-muscle myosin II,a-actinin, and filamin accumulate to mechanicallystressed regions in cells from diverse lineages. Usingreaction-diffusion models for force-sensitive bind-ing, we successfully predicted which mammaliana-actinin and filamin paralogs would be mechanoac-cumulative. Furthermore, a ‘‘Goldilocks zone’’ mustexist for each protein where the actin-binding affinitymust be optimal for accumulation. In addition, weleveraged genetic mutants to gain a molecularunderstanding of the mechanisms of a-actininand filamin catch-bonding behavior. Two distinctmodes of mechanoaccumulation can be observed:a fast, diffusion-based accumulation and a slower,myosin II-dependent cortical flow phase that actson proteins with specific binding lifetimes. Finally,we uncovered cell-type- and cell-cycle-stage-spe-
Curre
cific control of the mechanosensation of myosinIIB, but not myosin IIA or IIC. Overall, these me-chanoaccumulative mechanisms drive the cell’sresponse to physical perturbation during proper tis-sue development and disease.
RESULTS AND DISCUSSION
To identify mechanosensitive elements, we examined protein
relocalization in response to controlled external stresses applied
locally to individual cells. We characterized more than 20
actin-binding, signaling, and lipid-binding proteins by transiently
expressing fluorescently tagged constructs in Jurkat T cells (Fig-
ure 1), NIH 3T3 fibroblasts (Figure S1A), HeLas (Figure S1B), and
HEK293Ts (Figure S1C). Cells were deformed into the pipette by
micropipette aspiration (MPA) [12] to a length twice the radius of
the pipette (2Lp/Rp) for 5 min using a fixed pressure defined by
their mechanical properties (Jurkat: 0.075 nN/mm2; NIH 3T3:
0.15 nN/mm2; HEK293T: 0.15 nN/mm2; HeLa: 0.2 nN/mm2). We
have previously determined computationally that the tip region
in the pipette is the region of highest dilational deformation,
whereas the pipette neck experiences shear deformation [13].
The concept of dilation of the cytoskeleton at the tip region is
also supported by the immediate decrease in actin density
upon deformation by MPA (not shown), similar to what has
been observed in red blood cells [14]. Furthermore, although
the actin network has a very fast recovery time, a significant
immobile fraction exists, which is likely to be the network that
experiences these two modes of deformation [15]. Maximal pro-
tein accumulation in response to dilational deformation was
quantified by normalizing the fluorescence intensity of the cortex
in the tip region (It) to that of the unstressed cortex opposite the
pipette (Io) (Figure 1). The blue bar represents the 95% confi-
dence interval for cytosolic GFP quantified in the same manner,
a control used in all cell types to denote the threshold over which
a protein must accumulate to be significantly mechanosensitive.
The response of the majority of proteins fell within this confi-
dence interval, implying their insensitivity toward dilational
nt Biology 26, 1473–1479, June 6, 2016 ª 2016 Elsevier Ltd. 1473

Figure 1. Five Actin-Binding Proteins
Respond to an Externally Applied Mechani-
cal Stress
A ratio (It/Io) of maximum tip intensity (It) to opposite
cortex intensity (Io) shows that actin-binding pro-
teins a-actinin 4, filamin B, myosin IIA, myosin IIB,
and myosin IIC accumulated to the highest level
among 22 cytoskeletal, signaling, and lipid-binding
proteins in Jurkat cells (*p < 0.05; **p < 0.0001). The
horizontal blue bar depicts the 95% confidence
interval for cytosolic GFP. n values are provided
within each individual sample’s vertical bar. See
also Figure S1 for similar results in 3T3, HeLa, and
HEK293T cells.
deformation in all cell types. The greatest accumulative re-
sponses were observed in actin-binding proteins, including the
myosin IIs. The extent of myosin accumulation did not correlate
with the radius of the pipette, ruling out accumulation due to
specific local membrane curvature (Figure S2D). In addition,
the curvature-sensing protein i-BAR showed no accumulation
(Figure S1B), supporting the notion that the observed accumula-
tions are due to mechanical stress sensing rather than curvature
sensing. We selected the highly accumulative myosin II, a-acti-
nin, and filamin for further characterization.
Non-muscle myosin II is an established part of a mechanosen-
sitive system both in Dictyostelium and Drosophila, where it ac-
cumulates at the site of applied forces and drives cellular
contraction [9, 12, 13, 16]. The magnitude of accumulation de-
pends on the net force on each myosin II head and requires
the presence of actin-crosslinkers to anchor actin filaments
[13, 17–19]. Mammalian cells express three paralogs of non-
muscle myosin II: IIA (MYH9); IIB (MYH10); and IIC (MYH14).
By examining differences in accumulation of these paralogs
across multiple cell lines during MPA, we aimed to uncover
how the mechanoresponsiveness of this important mechanoen-
zyme is regulated in mammalian cells. The paralogs have
differing duty ratios [19], unique force-dependent affinities to
F-actin [20], and distinct spatial distributions in migrating cells
[19–22], suggesting non-overlapping roles for the myosin II pa-
ralogs. Several studies revealed that cells respond to their
mechanical environment by modifying or regulating the expres-
sion of these distinct myosin IIs [5, 21, 23, 24].
In response to dilational stress, we found myosin IIA and IIC
exhibited a characteristic accumulation curve in all cell types,
showing a short (30–70 s) delay followed by a sigmoidal rise in
protein intensity, plateauing by 150–200 s (Figures 2A and 2C).
This biphasic behavior is characteristic of cooperative binding
interactions, a behavior we previously modeled forDictyostelium
myosin II [25]. The network stress-dependent stalling of myosin II
heads in the strongly bound state during the myosin power
stroke gives rise to this cooperativity and promotes bipolar thick
1474 Current Biology 26, 1473–1479, June 6, 2016
filament assembly [9, 13, 18, 26]. Once
the accumulated myosin II fully opposes
the applied stress, the bound heads do
not experience increasing stress, result-
ing in maximal accumulation [13, 25].
Interestingly, whereas the accumula-
tion kinetics for myosin IIA and IIC were
nearly identical between cell types, myosin IIB showed highly
cell-type- and cell-cycle-stage-specific behavior. In Jurkats,
myosin IIBwas themost-mechanoresponsive paralog, achieving
greater than 2-fold normalized intensity relative to the opposite
cortex. In HeLa cells, myosin IIB accumulated moderately,
whereas in NIH 3T3 cells, no appreciable accumulation was de-
tected (Figure 2B). This difference in accumulation did not corre-
late with endogenous expression levels (Figure S2B inset) or the
cortical tensions of the cell types (Figure S2B). It is unlikely that
the accumulation of any paralog can be attributed to co-assem-
bly with another, given the consistent behavior of myosin IIA and
IIC in cells endogenously expressing very different quantities of
all three proteins. In fact, whereas the mechanoresponse of
myosin IIB correlated with IIA expression for these first three
cell types, Cos-7 cells, which lack myosin IIA (Figure S2B inset),
showed robust myosin IIB accumulation (Figure S2C), demon-
strating that IIB’s mechanoresponse is independent of IIA. In
addition, the accumulation of myosin IIB exceeded that of any
other myosin II in Jurkat cells and did not accumulate in 3T3s
despite the presence and accumulation of myosin IIA. Further,
whereas myosin IIA showed no change in mechanoresponse
over the cell cycle in HeLa cells (Figures 2E, S3A, and S3B),
the myosin IIB mechanoresponse is cell-cycle-stage specific; it
accumulates in interphase and metaphase, but not anaphase
(Figures 2F, S3A, and S3B). This cell cycle specificity implicates
relatively transient regulatory mechanisms for themyosin IIBme-
chanoresponse that tune cellular shape change during cytoki-
nesis. One explanation is the phosphoregulation of IIB is distinct
from that of IIA and IIC. Indeed, a short serine-rich stretch within
the assembly domain of IIB confers its distinct localization
pattern and behavior in cells in a phosphorylation-dependent
manner [27], and this regulation could also affect myosin IIB
mechanoaccumulation.
Force sharing among actin crosslinkers is also important for
cellular mechanoresponsiveness [13]. From our search for
mechanoresponsive elements, the actin crosslinkers a-actinin
4 and filamin B strongly responded. Interestingly, a-actinin 1
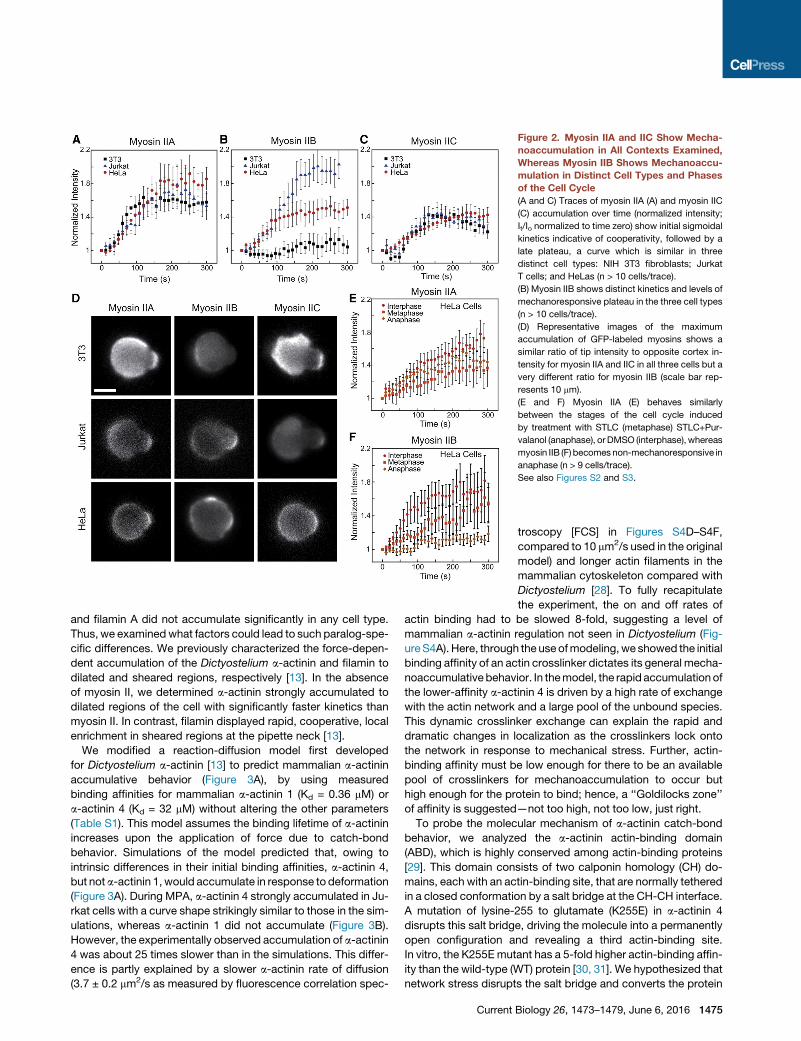
Figure 2. Myosin IIA and IIC Show Mecha-
noaccumulation in All Contexts Examined,
Whereas Myosin IIB Shows Mechanoaccu-
mulation in Distinct Cell Types and Phases
of the Cell Cycle
(A and C) Traces of myosin IIA (A) and myosin IIC
(C) accumulation over time (normalized intensity;
It/Io normalized to time zero) show initial sigmoidal
kinetics indicative of cooperativity, followed by a
late plateau, a curve which is similar in three
distinct cell types: NIH 3T3 fibroblasts; Jurkat
T cells; and HeLas (n > 10 cells/trace).
(B) Myosin IIB shows distinct kinetics and levels of
mechanoresponsive plateau in the three cell types
(n > 10 cells/trace).
(D) Representative images of the maximum
accumulation of GFP-labeled myosins shows a
similar ratio of tip intensity to opposite cortex in-
tensity for myosin IIA and IIC in all three cells but a
very different ratio for myosin IIB (scale bar rep-
resents 10 mm).
(E and F) Myosin IIA (E) behaves similarly
between the stages of the cell cycle induced
by treatment with STLC (metaphase) STLC+Pur-
valanol (anaphase), orDMSO (interphase), whereas
myosin IIB (F) becomesnon-mechanoresponsive in
anaphase (n > 9 cells/trace).
See also Figures S2 and S3.
and filamin A did not accumulate significantly in any cell type.
Thus, we examinedwhat factors could lead to such paralog-spe-
cific differences. We previously characterized the force-depen-
dent accumulation of the Dictyostelium a-actinin and filamin to
dilated and sheared regions, respectively [13]. In the absence
of myosin II, we determined a-actinin strongly accumulated to
dilated regions of the cell with significantly faster kinetics than
myosin II. In contrast, filamin displayed rapid, cooperative, local
enrichment in sheared regions at the pipette neck [13].
We modified a reaction-diffusion model first developed
for Dictyostelium a-actinin [13] to predict mammalian a-actinin
accumulative behavior (Figure 3A), by using measured
binding affinities for mammalian a-actinin 1 (Kd = 0.36 mM) or
a-actinin 4 (Kd = 32 mM) without altering the other parameters
(Table S1). This model assumes the binding lifetime of a-actinin
increases upon the application of force due to catch-bond
behavior. Simulations of the model predicted that, owing to
intrinsic differences in their initial binding affinities, a-actinin 4,
but nota-actinin 1,would accumulate in response to deformation
(Figure 3A). During MPA, a-actinin 4 strongly accumulated in Ju-
rkat cells with a curve shape strikingly similar to those in the sim-
ulations, whereas a-actinin 1 did not accumulate (Figure 3B).
However, the experimentally observed accumulation of a-actinin
4 was about 25 times slower than in the simulations. This differ-
ence is partly explained by a slower a-actinin rate of diffusion
(3.7 ± 0.2 mm2/s as measured by fluorescence correlation spec-
Current
troscopy [FCS] in Figures S4D–S4F,
compared to 10 mm2/s used in the original
model) and longer actin filaments in the
mammalian cytoskeleton compared with
Dictyostelium [28]. To fully recapitulate
the experiment, the on and off rates of
actin binding had to be slowed 8-fold, suggesting a level of
mammalian a-actinin regulation not seen in Dictyostelium (Fig-
ureS4A). Here, through the useofmodeling,we showed the initial
binding affinity of an actin crosslinker dictates its general mecha-
noaccumulative behavior. In themodel, the rapidaccumulationof
the lower-affinity a-actinin 4 is driven by a high rate of exchange
with the actin network and a large pool of the unbound species.
This dynamic crosslinker exchange can explain the rapid and
dramatic changes in localization as the crosslinkers lock onto
the network in response to mechanical stress. Further, actin-
binding affinity must be low enough for there to be an available
pool of crosslinkers for mechanoaccumulation to occur but
high enough for the protein to bind; hence, a ‘‘Goldilocks zone’’
of affinity is suggested—not too high, not too low, just right.
To probe the molecular mechanism of a-actinin catch-bond
behavior, we analyzed the a-actinin actin-binding domain
(ABD), which is highly conserved among actin-binding proteins
[29]. This domain consists of two calponin homology (CH) do-
mains, each with an actin-binding site, that are normally tethered
in a closed conformation by a salt bridge at the CH-CH interface.
A mutation of lysine-255 to glutamate (K255E) in a-actinin 4
disrupts this salt bridge, driving the molecule into a permanently
open configuration and revealing a third actin-binding site.
In vitro, the K255Emutant has a 5-fold higher actin-binding affin-
ity than the wild-type (WT) protein [30, 31]. We hypothesized that
network stress disrupts the salt bridge and converts the protein
Biology 26, 1473–1479, June 6, 2016 1475

Figure 3. A Force-Dependent Model Based on Actin-Binding Affinity
Predicts the Mechanoaccumulative Behavior of a-Actinins, and the
High-Affinity a-Actinin 4 Mutant K255E Is Non-mechanoresponsive
(A) A reaction-diffusion catch-bond model of mechanoaccumulation derived
from parameters outlined in Dictyostelium predicts high accumulation of
mammalian a-actinin 4 and low accumulation of a-actinin 1 based on pub-
lished actin-binding affinities.
(B) This prediction captured both the protein behavior and shape of the curve
in aspiration experiments in Jurkat cells (It/Io normalized to time zero; n =
12 cells/trace).
(C and D) The a-actinin 4 K255E mutant has a 5-fold higher binding affinity (C)
and shows delayed, myosin-dependent (D) accumulation as determined by
1476 Current Biology 26, 1473–1479, June 6, 2016
into the open, high-affinity conformation, giving rise to catch-
bond behavior of WT a-actinin 4 and leading to localized,
stress-dependent accumulation. To test this, we analyzed the
mechanoaccumulation kinetics of the K255E mutant, which we
hypothesized lacks this mechanosensitive switch. Indeed, a-ac-
tinin 4 K255E did not accumulate in the first 100 s of aspiration.
However, themutant began to accumulate after 100 s (Figure 3C)
with accumulation kinetics mirroring those of myosin II (Figure 2).
Therefore, we tested the role of myosin II by inhibiting the me-
chanoresponse of the three myosins with the myosin light chain
kinase inhibitor ML7 (Figure S2E). Upon the addition of 30 mM
ML7, WT a-actinin 4 protein still accumulated considerably,
whereas the K255E mutant did not (Figure 2D). To rule out
off-target effects of ML7, we independently verified the result us-
ing 10 mM Y-27632, an inhibitor of the Rho-associated kinase
ROCK, which also regulates myosin light chain phosphorylation.
The results were nearly identical for the two inhibitors (Fig-
ure S2E). The model predicts that a simple 5-fold change in
actin-binding affinity would not prevent a-actinin 4 accumulation
(Figure S4B), suggesting the K255E mutation perturbs a-acti-
nin’s mechanism of mechanoresponse.
To assess the necessity of the salt bridge for catch bonding,
we analyzed the fluorescence recovery after photobleaching
(FRAP) of both WT and mutant a-actinin 4 in HeLa cells in the
absence or presence of compressive stress (Figure 3E). Cells
were compressed with a thin sheet of agarose, reducing their
height by roughly a factor of 2.We have demonstrated previously
that this technique drives the accumulation of mechanosensitive
proteins, including myosin II and cortexillin, to the cell’s lateral
edges where dilation is highest [13] as the cell actively resists
the applied load [15]. Although the exact force felt by the cyto-
skeleton is difficult to quantify in this technique, the recovery
time (t) of proteins that lock onto the cytoskeleton under physi-
ologically relevant applied loads increases [15]. The K255E
mutant localized to stress fibers more readily than the WT even
without applied stress, but all FRAP measurements were taken
from the cell cortex (Figure 3E). Similar to a previous report
[31], the higher-affinity K255E mutant showed much-slower re-
covery than WT (Figures 3F and 3G). Interestingly, whereas WT
a-actinin 4 showed slower recovery under agarose overlay, the
K255E mutant showed no significant change in recovery time
(t) or immobile fraction (Figures 3F, 3G, and S4H). Thus, the
catch-bond behavior of a-actinin 4 is most likely dependent on
the conversion of the highly conserved ABD from a closed to
an open conformation, a change regulated by the salt bridge.
In addition, a late, myosin-dependent cortical flow phase is
responsible for moving the higher-affinity K255E mutant to the
using the pan-myosin II inhibitor ML7 at 30 mM (n > 16 cells/trace). Myosin
accumulation was fully inhibited by ML7 (Figure S2E).
(E) FRAP analysis of HeLa cells expressing GFP-a-actinin 4 and the K255E
mutant in normal and compressed state. White boxes show bleached region at
the time of bleaching, and ‘‘Time t’’ shows the level of fluorescence for each
condition after one e-fold time of recovery as outlined in (G) (scale bar repre-
sents 10 mm).
(F and G) Representative FRAP traces show a much-faster recovery time
for a-actinin 4 than K255E. The applied stress from agarose overlay drives
slower recovery of a-actinin 4 but no change in K255E recovery (*p = 0.001;
**p < 0.0001).
See also Figure S4 and Table S1.

Figure 4. A Force-Dependent Model Based on Actin-Binding Affinity
Predicts theMechanoaccumulative Behavior of Filamins to a Region
of Shear Deformation, Followed by Myosin-Driven Cell Tip Accumu-
lation
(A) A cooperative reaction-diffusion catch-bond model of mechanoaccumu-
lation predicts low accumulation of filamin A and high accumulation of filamin
(B) to the neck region of the cell, where shear deformation is highest.
(B) In Jurkat cells, filamin A does not accumulate appreciably whereas filamin
B accumulates to the cell neck, though initial accumulation was followed by a
decay phase (In/Io normalized to time zero; n = 10).
(C) This decay phase resulted from flow of filamin B, but not filamin A, from the
cell neck to the cell tip (scale bars represent 10 mm).
(D) Accumulation to the cell neck was not myosin dependent (n = 10).
(E) However, flow to the cell tip was myosin II dependent.
Cells in (D) and (E) were treated with DMSO or the pan-myosin II inhibitor ML7
at 30 mM (n = 12). See also Figure S4 and Table S2.
tip region, a phenomenon we also observed with filamin (see
below).
In mammalian cells, non-muscle filamins A and B form
Y-shaped dimers, which orthogonally crosslink actin filaments
[32]. We previously found thatDictyostelium filamin, which forms
a similar V-shaped dimer, is sensitive to shear deformation. This
sensitivity manifests as an accumulation to the neck of the cell
being deformed [13]. The reaction-diffusion model for filamin
included cooperativity, predicted robust accumulation of the
higher-affinity filamin B (Kd = 7 mM), and reduced accumulation
of lower-affinity filamin A (Kd = 17 mM; Figure 4A). This is in
contrast with the stronger accumulation for lower-affinity a-acti-
nin 4. Whereas both a-actinin (non-cooperative) and filamin
(cooperative) models unveil a Goldilocks zone for which the Kd
is optimal for accumulation, the Kd that allows the most-robust
accumulation for each protein depends onwhether cooperativity
is present (Figures S4B and S4C).
We were initially surprised to find that mammalian filamin B
accumulated at the tip of the cell in our studies in Jurkats, instead
of the neck region. Upon closer analysis, we noted that, within
15 s of the pressure application, filamin B accumulated to the
aspirated cell neck (Figure 4B). The kinetics of this accumulation
showed acceleration (Figure 4B), suggesting cooperativity exists
between neighboring actin-bound filamin B molecules. Longer-
term tracking revealed that filamin B flows from the neck to the
tip of the cell along the cortex (Figures 4C and 4E), a process
not observed in Dictyostelium. Filamin A failed to respond to
applied pressure (Figures 4B and 4C). Because the timescale
for the tip accumulation of filamin B is �80 s (Figure 4E), along
myosin II’s timescale, we hypothesized that filamin B accumula-
tion in the tip was driven by myosin II accumulation. Upon the
addition of 30 mM ML7 or 10 mM Y-27632 (Figure S2E),
filamin B showed normal neck accumulation (Figure 4D) but
did not accumulate to the tip (Figure 4E). It has been shown
that a filamin A mutant lacking the hinge 1 region fails to cause
strain stiffening induced by its WT counterpart [33]. However,
in our experiments, the filamin B hinge mutant showed WT
mechanoaccumulation to either the neck or the tip of the cell
(Figure S4I), indicating shear-force sensation does not depend
on this hinge. Thus, filamin B shows both rapid, intrinsic, shear
deformation-sensitive accumulation at the cell neck, as well as
myosin II-dependent cortical flow to the tip of the cell upon
applied force. This myosin-dependent cortical flow resembles
that seen in the a-actinin 4 K255E mutant; these two proteins
have similar affinities for actin (Kd z 7 mM), which may allude
to the requirement of a specific actin-binding affinity in order to
be acted upon by the myosin-dependent flow. In HeLa cells,
the important cytokinesis-regulator anillin also responds to the
tip of the pipette but does so exclusively during anaphase in a
myosin-dependent manner (Figures S3D–S3F). This implies a
biological role for myosin-dependent accumulation in mamma-
lian cytokinesis. These myosin-driven cortical network flows
are similar to those essential for proper asymmetric cell division
during C. elegans development [34].
In this study, we uncovered mammalian mechanosensors that
accumulate under mechanical stress. We identified a Goldilocks
zone of actin-binding affinities, determined by their cooperative
or non-cooperative binding properties, which dictates the
maximal accumulation of these elements. We discovered two
distinct modes of force-dependent accumulation: a rapid, diffu-
sion-based mode dependent on molecular catch-bonding
behavior and a slower, myosin-II-dependent cortical flow, which
drives actin-binding proteins to the cell tip. We also discovered
the cell-type- and cell-cycle-specific mechanosensitivity of
myosin IIB, which is intriguing in light of studies implicating
myosin IIB as a driver of breast cancer metastasis [35]. As
growing evidence demonstrates that cell behavior is modulated
by the mechanical properties of the actin network, the molecular
mechanisms of the mechanoresponsive cytoskeletal elements
involved become critical to understand. For example, mechano-
transducing stress fibers, which dynamically form and dissolve
during cell migration, are crosslinked largely by a-actinins and
therefore could becomemore stable via a-actinin catch-bonding
under load [36, 37]. In addition to genetic diseases related to
Current Biology 26, 1473–1479, June 6, 2016 1477

filamin B and a-actinin 4 mutations [38, 39], increased expres-
sion of the mechanosensitive paralogs of a-actinin and filamin
are strong negative prognosticators in multiple metastatic
cancers [40–42]. Defining the mechanisms by which individual
proteins and the network as a whole respond to force, and deter-
mining which cytoskeletal elements are mechanosensitive is
essential for elucidating normal mechanosensitive biological
processes and identifying new targets for inhibiting aberrant pro-
cesses in disease states.
EXPERIMENTAL PROCEDURES
Experimental procedures include cell culture and transfection, live-cell fluores-
cence imaging, MPA, FRAP, FCS, drug treatments, and computational
modeling. Tables of model parameters are provided in Tables S1 and S2. All
statistical analysis was performed using KaleidaGraph (Synergy Software).
Significance of difference was determined using ANOVA with a Fisher’s least
significant difference (LSD) post-test. The full details of methodology and ma-
terials can be found in the Supplemental Experimental Procedures.
SUPPLEMENTAL INFORMATION
Supplemental Information includes four figures, two tables, and Supplemental
Experimental Procedures,and can be found with this article online at http://dx.
doi.org/10.1016/j.cub.2016.04.007.
AUTHOR CONTRIBUTIONS
E.S.S., T.L., E.R.G., V.S., and D.N.R. conceived the experiments. E.S.S., T.L.,
V.S., and X.Q. performed the experiments. K.M. and P.A.I. developed the
model and carried out the simulations. E.S.S. and T.L. wrote the manuscript.
V.S., K.M., E.R.G., P.A.I., and D.N.R. edited the manuscript.
ACKNOWLEDGMENTS
This work is supported by NIH grants GM66817 and GM109863 to D.N.R., NIH
grant GM086704 to P.A.I. and D.N.R., and a Wellcome Trust Research Career
Development Fellowship award (090064/Z/09/Z) to E.R.G. The authors thank
Mingjie Wang, Miho Iijima, Takanari Inoue, Joy Yang, Susan Craig, AllanWells,
Fumihiko Nakamura, Arnoud Sonnenberg, William Trimble, Anthony Hyman,
and Michael Glotzer for their generosity with reagents. We also thank Huaqing
Cai, Allen Chen, and Raihan Kabir for technical assistance.
Received: November 20, 2015
Revised: February 16, 2016
Accepted: April 1, 2016
Published: May 12, 2016
REFERENCES
1. Geiger, B., Spatz, J.P., and Bershadsky, A.D. (2009). Environmental
sensing through focal adhesions. Nat. Rev. Mol. Cell Biol. 10, 21–33.
2. Johnson, C.P., Tang, H.Y., Carag, C., Speicher, D.W., and Discher, D.E.
(2007). Forced unfolding of proteins within cells. Science 317, 663–666.
3. DuFort, C.C., Paszek, M.J., and Weaver, V.M. (2011). Balancing forces:
architectural control of mechanotransduction. Nat. Rev. Mol. Cell Biol.
12, 308–319.
4. Engler, A.J., Sen, S., Sweeney, H.L., and Discher, D.E. (2006). Matrix elas-
ticity directs stem cell lineage specification. Cell 126, 677–689.
5. Raab, M., Swift, J., Dingal, P.C., Shah, P., Shin, J.W., and Discher, D.E.
(2012). Crawling from soft to stiff matrix polarizes the cytoskeleton and
phosphoregulates myosin-II heavy chain. J. Cell Biol. 199, 669–683.
6. Chowdhury, F., Na, S., Li, D., Poh, Y.C., Tanaka, T.S.,Wang, F., andWang,
N. (2010). Material properties of the cell dictate stress-induced spreading
and differentiation in embryonic stem cells. Nat. Mater. 9, 82–88.
1478 Current Biology 26, 1473–1479, June 6, 2016
7. Ehrlicher, A.J., Nakamura, F., Hartwig, J.H., Weitz, D.A., and Stossel, T.P.
(2011). Mechanical strain in actin networks regulates FilGAP and integrin
binding to filamin A. Nature 478, 260–263.
8. Effler, J.C., Kee, Y.S., Berk, J.M., Tran, M.N., Iglesias, P.A., and Robinson,
D.N. (2006). Mitosis-specific mechanosensing and contractile-protein
redistribution control cell shape. Curr. Biol. 16, 1962–1967.
9. Kee, Y.S., Ren, Y., Dorfman, D., Iijima, M., Firtel, R., Iglesias, P.A., and
Robinson, D.N. (2012). A mechanosensory system governs myosin II
accumulation in dividing cells. Mol. Biol. Cell 23, 1510–1523.
10. Buckley, C.D., Tan, J., Anderson, K.L., Hanein, D., Volkmann, N., Weis,
W.I., Nelson, W.J., and Dunn, A.R. (2014). Cell adhesion. Theminimal cad-
herin-catenin complex binds to actin filaments under force. Science 346,
1254211.
11. Thievessen, I., Thompson, P.M., Berlemont, S., Plevock, K.M., Plotnikov,
S.V., Zemljic-Harpf, A., Ross, R.S., Davidson, M.W., Danuser, G.,
Campbell, S.L., and Waterman, C.M. (2013). Vinculin-actin interaction
couples actin retrograde flow to focal adhesions, but is dispensable for
focal adhesion growth. J. Cell Biol. 202, 163–177.
12. Kee, Y.S., and Robinson, D.N. (2013). Micropipette aspiration for studying
cellular mechanosensory responses and mechanics. Methods Mol. Biol.
983, 367–382.
13. Luo, T., Mohan, K., Iglesias, P.A., and Robinson, D.N. (2013). Molecular
mechanisms of cellular mechanosensing. Nat. Mater. 12, 1064–1071.
14. Discher, D.E., Winardi, R., Schischmanoff, P.O., Parra, M., Conboy, J.G.,
and Mohandas, N. (1995). Mechanochemistry of protein 4.1’s spectrin-
actin-binding domain: ternary complex interactions, membrane binding,
network integration, structural strengthening. J. Cell Biol. 130, 897–907.
15. Srivastava, V., and Robinson, D.N. (2015). Mechanical stress and network
structure drive protein dynamics during cytokinesis. Curr. Biol. 25,
663–670.
16. Kim, J.H., Ren, Y., Ng, W.P., Li, S., Son, S., Kee, Y.S., Zhang, S., Zhang,
G., Fletcher, D.A., Robinson, D.N., and Chen, E.H. (2015). Mechanical
tension drives cell membrane fusion. Dev. Cell 32, 561–573.
17. Luo, T., Mohan, K., Srivastava, V., Ren, Y., Iglesias, P.A., and Robinson,
D.N. (2012). Understanding the cooperative interaction between
myosin II and actin cross-linkers mediated by actin filaments during me-
chanosensation. Biophys. J. 102, 238–247.
18. Ren, Y., Effler, J.C., Norstrom, M., Luo, T., Firtel, R.A., Iglesias, P.A., Rock,
R.S., and Robinson, D.N. (2009). Mechanosensing through cooperative
interactions between myosin II and the actin crosslinker cortexillin I.
Curr. Biol. 19, 1421–1428.
19. Vicente-Manzanares, M., Ma, X., Adelstein, R.S., and Horwitz, A.R. (2009).
Non-muscle myosin II takes centre stage in cell adhesion and migration.
Nat. Rev. Mol. Cell Biol. 10, 778–790.
20. Kovacs, M., Thirumurugan, K., Knight, P.J., and Sellers, J.R. (2007). Load-
dependentmechanism of nonmuscle myosin 2. Proc. Natl. Acad. Sci. USA
104, 9994–9999.
21. Shin, J.W., Buxboim, A., Spinler, K.R., Swift, J., Christian, D.A., Hunter,
C.A., Leon, C., Gachet, C., Dingal, P.C., Ivanovska, I.L., et al. (2014).
Contractile forces sustain and polarize hematopoiesis from stem and pro-
genitor cells. Cell Stem Cell 14, 81–93.
22. Even-Ram, S., Doyle, A.D., Conti, M.A., Matsumoto, K., Adelstein, R.S.,
and Yamada, K.M. (2007). Myosin IIA regulates cell motility and actomy-
osin-microtubule crosstalk. Nat. Cell Biol. 9, 299–309.
23. Vicente-Manzanares, M., Koach, M.A., Whitmore, L., Lamers, M.L., and
Horwitz, A.F. (2008). Segregation and activation of myosin IIB creates a
rear in migrating cells. J. Cell Biol. 183, 543–554.
24. Swift, J., Ivanovska, I.L., Buxboim, A., Harada, T., Dingal, P.C., Pinter, J.,
Pajerowski, J.D., Spinler, K.R., Shin, J.W., Tewari, M., et al. (2013). Nuclear
lamin-A scales with tissue stiffness and enhances matrix-directed differ-
entiation. Science 341, 1240104.
25. Mohan, K., Luo, T., Robinson, D.N., and Iglesias, P.A. (2015). Cell shape
regulation through mechanosensory feedback control. J. R. Soc.
Interface 12, 20150512.

26. Orlova, A., and Egelman, E.H. (1997). Cooperative rigor binding of myosin
to actin is a function of F-actin structure. J. Mol. Biol. 265, 469–474.
27. Juanes-Garcia, A., Chapman, J.R., Aguilar-Cuenca, R., Delgado-Arevalo,
C., Hodges, J., Whitmore, L.A., Shabanowitz, J., Hunt, D.F., Horwitz, A.R.,
and Vicente-Manzanares, M. (2015). A regulatory motif in nonmuscle
myosin II-B regulates its role in migratory front-back polarity. J. Cell Biol.
209, 23–32.
28. Roland, J., Berro, J., Michelot, A., Blanchoin, L., and Martiel, J.L. (2008).
Stochastic severing of actin filaments by actin depolymerizing factor/cofi-
lin controls the emergence of a steady dynamical regime. Biophys. J. 94,
2082–2094.
29. Sutherland-Smith, A.J., Moores, C.A., Norwood, F.L., Hatch, V., Craig, R.,
Kendrick-Jones, J., and Lehman, W. (2003). An atomic model for actin
binding by the CH domains and spectrin-repeat modules of utrophin
and dystrophin. J. Mol. Biol. 329, 15–33.
30. Weins, A., Schlondorff, J.S., Nakamura, F., Denker, B.M., Hartwig, J.H.,
Stossel, T.P., and Pollak, M.R. (2007). Disease-associated mutant a-acti-
nin-4 reveals a mechanism for regulating its F-actin-binding affinity. Proc.
Natl. Acad. Sci. USA 104, 16080–16085.
31. Ehrlicher, A.J., Krishnan, R., Guo, M., Bidan, C.M., Weitz, D.A., and Pollak,
M.R. (2015). Alpha-actinin binding kinetics modulate cellular dynamics
and force generation. Proc. Natl. Acad. Sci. USA 112, 6619–6624.
32. Stossel, T.P., Condeelis, J., Cooley, L., Hartwig, J.H., Noegel, A.,
Schleicher, M., and Shapiro, S.S. (2001). Filamins as integrators of cell me-
chanics and signalling. Nat. Rev. Mol. Cell Biol. 2, 138–145.
33. Shin, J.H., Gardel, M.L., Mahadevan, L., Matsudaira, P., and Weitz, D.A.
(2004). Relating microstructure to rheology of a bundled and cross-linked
F-actin network in vitro. Proc. Natl. Acad. Sci. USA 101, 9636–9641.
34. Hird, S.N., andWhite, J.G. (1993). Cortical and cytoplasmic flow polarity in
early embryonic cells of Caenorhabditis elegans. J. Cell Biol. 121, 1343–
1355.
35. Beach, J.R., Hussey, G.S., Miller, T.E., Chaudhury, A., Patel, P., Monslow,
J., Zheng, Q., Keri, R.A., Reizes, O., Bresnick, A.R., et al. (2011). Myosin II
isoform switching mediates invasiveness after TGF-b-induced epithelial-
mesenchymal transition. Proc. Natl. Acad. Sci. USA 108, 17991–17996.
36. Hotulainen, P., and Lappalainen, P. (2006). Stress fibers are generated by
two distinct actin assembly mechanisms in motile cells. J. Cell Biol. 173,
383–394.
37. Burridge, K., and Wittchen, E.S. (2013). The tension mounts: stress fibers
as force-generating mechanotransducers. J. Cell Biol. 200, 9–19.
38. Kaplan, J.M., Kim, S.H., North, K.N., Rennke, H., Correia, L.A., Tong, H.Q.,
Mathis, B.J., Rodrıguez-Perez, J.C., Allen, P.G., Beggs, A.H., and Pollak,
M.R. (2000). Mutations in ACTN4, encoding a-actinin-4, cause familial
focal segmental glomerulosclerosis. Nat. Genet. 24, 251–256.
39. Feng, Y., andWalsh, C.A. (2004). Themany faces of filamin: a versatile mo-
lecular scaffold for cell motility and signalling. Nat. Cell Biol. 6, 1034–1038.
40. Kikuchi, S., Honda, K., Tsuda, H., Hiraoka, N., Imoto, I., Kosuge, T., Umaki,
T., Onozato, K., Shitashige, M., Yamaguchi, U., et al. (2008). Expression
and gene amplification of actinin-4 in invasive ductal carcinoma of the
pancreas. Clin. Cancer Res. 14, 5348–5356.
41. Shao, H., Li, S., Watkins, S.C., andWells, A. (2014). a-Actinin-4 is required
for amoeboid-type invasiveness of melanoma cells. J. Biol. Chem. 289,
32717–32728.
42. Iguchi, Y., Ishihara, S., Uchida, Y., Tajima, K., Mizutani, T., Kawabata, K.,
and Haga, H. (2015). Filamin B enhances the invasiveness of cancer cells
into 3D collagen matrices. Cell Struct. Funct. 40, 61–67.
Current Biology 26, 1473–1479, June 6, 2016 1479

Supplemental Information
Figure S1
Supplemental Data

Figure S2

Figure S3

Figure S4
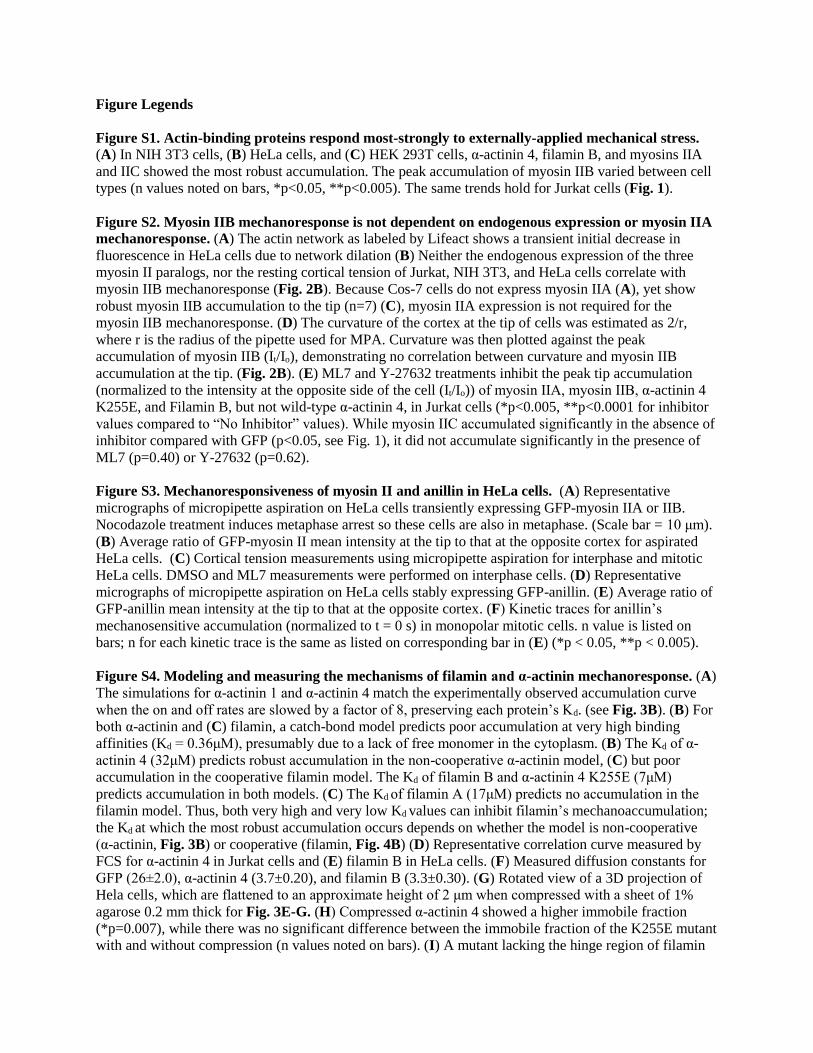
Figure Legends
Figure S1. Actin-binding proteins respond most-strongly to externally-applied mechanical stress.
(A) In NIH 3T3 cells, (B) HeLa cells, and (C) HEK 293T cells, α-actinin 4, filamin B, and myosins IIA
and IIC showed the most robust accumulation. The peak accumulation of myosin IIB varied between cell
types (n values noted on bars, *p<0.05, **p<0.005). The same trends hold for Jurkat cells (Fig. 1).
Figure S2. Myosin IIB mechanoresponse is not dependent on endogenous expression or myosin IIA
mechanoresponse. (A) The actin network as labeled by Lifeact shows a transient initial decrease in
fluorescence in HeLa cells due to network dilation (B) Neither the endogenous expression of the three
myosin II paralogs, nor the resting cortical tension of Jurkat, NIH 3T3, and HeLa cells correlate with
myosin IIB mechanoresponse (Fig. 2B). Because Cos-7 cells do not express myosin IIA (A), yet show
robust myosin IIB accumulation to the tip (n=7) (C), myosin IIA expression is not required for the
myosin IIB mechanoresponse. (D) The curvature of the cortex at the tip of cells was estimated as 2/r,
where r is the radius of the pipette used for MPA. Curvature was then plotted against the peak
accumulation of myosin IIB (It/Io), demonstrating no correlation between curvature and myosin IIB
accumulation at the tip. (Fig. 2B). (E) ML7 and Y-27632 treatments inhibit the peak tip accumulation
(normalized to the intensity at the opposite side of the cell (It/Io)) of myosin IIA, myosin IIB, α-actinin 4
K255E, and Filamin B, but not wild-type α-actinin 4, in Jurkat cells (*p<0.005, **p<0.0001 for inhibitor
values compared to “No Inhibitor” values). While myosin IIC accumulated significantly in the absence of
inhibitor compared with GFP (p<0.05, see Fig. 1), it did not accumulate significantly in the presence of
ML7 (p=0.40) or Y-27632 (p=0.62).
Figure S3. Mechanoresponsiveness of myosin II and anillin in HeLa cells. (A) Representative
micrographs of micropipette aspiration on HeLa cells transiently expressing GFP-myosin IIA or IIB.
Nocodazole treatment induces metaphase arrest so these cells are also in metaphase. (Scale bar = 10 μm).
(B) Average ratio of GFP-myosin II mean intensity at the tip to that at the opposite cortex for aspirated
HeLa cells. (C) Cortical tension measurements using micropipette aspiration for interphase and mitotic
HeLa cells. DMSO and ML7 measurements were performed on interphase cells. (D) Representative
micrographs of micropipette aspiration on HeLa cells stably expressing GFP-anillin. (E) Average ratio of
GFP-anillin mean intensity at the tip to that at the opposite cortex. (F) Kinetic traces for anillin’s
mechanosensitive accumulation (normalized to t = 0 s) in monopolar mitotic cells. n value is listed on
bars; n for each kinetic trace is the same as listed on corresponding bar in (E) (*p < 0.05, **p < 0.005).
Figure S4. Modeling and measuring the mechanisms of filamin and α-actinin mechanoresponse. (A)
The simulations for α-actinin 1 and α-actinin 4 match the experimentally observed accumulation curve
when the on and off rates are slowed by a factor of 8, preserving each protein’s Kd. (see Fig. 3B). (B) For
both α-actinin and (C) filamin, a catch-bond model predicts poor accumulation at very high binding
affinities (Kd = 0.36μM), presumably due to a lack of free monomer in the cytoplasm. (B) The Kd of α-
actinin 4 (32μM) predicts robust accumulation in the non-cooperative α-actinin model, (C) but poor
accumulation in the cooperative filamin model. The Kd of filamin B and α-actinin 4 K255E (7μM)
predicts accumulation in both models. (C) The Kd of filamin A (17μM) predicts no accumulation in the
filamin model. Thus, both very high and very low Kd values can inhibit filamin’s mechanoaccumulation;
the Kd at which the most robust accumulation occurs depends on whether the model is non-cooperative
(α-actinin, Fig. 3B) or cooperative (filamin, Fig. 4B) (D) Representative correlation curve measured by
FCS for α-actinin 4 in Jurkat cells and (E) filamin B in HeLa cells. (F) Measured diffusion constants for
GFP (26±2.0), α-actinin 4 (3.7±0.20), and filamin B (3.3±0.30). (G) Rotated view of a 3D projection of
Hela cells, which are flattened to an approximate height of 2 μm when compressed with a sheet of 1%
agarose 0.2 mm thick for Fig. 3E-G. (H) Compressed α-actinin 4 showed a higher immobile fraction
(*p=0.007), while there was no significant difference between the immobile fraction of the K255E mutant
with and without compression (n values noted on bars). (I) A mutant lacking the hinge region of filamin

B did not show a difference in accumulation to the tip (It/Io) or the neck (In/Io) of the aspirated Jurkat cell
(n=9).

Table S1. Parameters for α-actinin modeling.
Parameter Value Reference
[F1] 72 μM [S16]
[F2] 8 μM [13]
D1 (ACTN) 3.7 μm2s-1 Measured
D2,3 (cortex) D1/50 Calculated using parameters
outlined in [13]
D2,3 (cytoplasm) D1 Calculated using parameters
outlined in [13]
KD 0.36 μM (ACTN1),
7 μM,
17 μM,
or 32 μM (ACTN4)
[S17]
[S18]
[S19]
[30]
kon 1,20 1.1 μM-1 s-1 [S20]
koff 1,20 0.4 s-1 (ACTN1),
7.7 s-1,
19 s-1,
or 35 s-1 (ACTN4)
[S17]
Calculated from KD
Calculated from KD
Calculated from KD

Table S2. Parameters used in filamin model simulations.
Parameter Value Reference
[F1] 100 μM [25]
[F2] 5 μM [13]
D1 (filamin) 3.3 μm2s-1 Measured
D2 (cortex) 0.03 μm2s-1 [13]
D3 (cortex) 0.003 μm2s-1 [13]
D2,3 (cytoplasm) D1
KD 0.36 μM,
7 μM (FLNA),
17 μM (FLNB),
or 32 μM
[S17]
[S18]
[S19]
[30]
kon 10 1.3 μM-1 s-1 [S21]
kon 20 0.013 μM-1 s-1 Estimated from sensitivity
analysis, [13]
koff 10 0.47 s-1,
9.1 s-1 (FLNB),
22 s-1 (FLNA),
or 41 s-1
Calculated from KD
Calculated from KD
Calculated from KD
Calculated from KD
koff 20 0.047 s-1,
0.91 s-1 (FLNB),
2.21 s-1 (FLNA),
or 4.1 s-1
Estimated from sensitivity
analysis1, [13]
Estimated from sensitivity
analysis1, [13]
Δxα
Δxβ
0.194 nm
-0.194 nm
[S17]
[S17]
χ 8 [13], sensitivity analysis1
1Extensive sensitivity analysis was performed based on parameters described in [13] with little
difference in the result with values above or below.

Supplemental Materials and Procedures
Cell culture
Jurkat cells were cultured in RPMI 1640 (Sigma-Aldrich) with 10% FBS (Life Technology). HeLa, Cos-7,
and NIH 3T3 cells were cultured in DMEM (Life Technology) with 10% FBS. For MPA experiments,
adherent cells were cultured on tissue-culture treated dishes (Corning), detached using 0.5% trypsin (Life
Technology), centrifuged and resuspended in media. Cortical tension was calculated as described
previously [12]. Transient transfections were performed using FuGene HD (Promega) for adherent cells,
and electroporation for Jurkat cells. For FRAP studies, HeLa cells were cultured on glass-bottom dishes
(Corning) and transferred to Leibowitz Media (Life Technology) + 10% FBS four hours prior to imaging.
Constructs
The following plasmids were acquired from Addgene:
The Ras-binding domain sequence from human Raf and the PH domain of human AKT were cloned into
the FUW2 vector, tagged with GFP and mCherry respectively. GFP tagged constructs for EGFP-C3-
myoIIA [S9], EGFP-C3-myoIIB [S9], and EGFP-N3-myoIIC [S10], were gifts from Robert Adelstein.
CFP-C1-Kras, EYFP-C1-Rac1, mCherry-iBAR, and Lifeact-RFP-N1 were gifts from Allison Suarez and
Takanari Inoue. EGFP-N1-ACTN4 was a gift from Allan Wells [S11]. A point mutation K255E was
made in EGFP-N1-ACTN4 by site-directed mutagenesis to generate EGFP-N1-ACTN4 (K255E). The
filamin A construct, pmdsRed-FLNA, was a gift from Fumihiko Nakamura. Filamin B full length
construct EGFP-FLNB-pCI-C1, and hinge 1 deletion mutant construct EGFP-FLNB(ΔH1)-pCI-C1 were
gifts from Arnoud Sonnenberg [S12]. Constructs for Septin 1 and 7, EGFP-N1-sept1 and EGFP-C1-sept7,
were gifts from William Trimble [S13]. EYFP-paxillin and EGFP-vinculin were gifts from Susan Craig
[S14]. GFP-anillin was stably expressed from a BAC and was a gift from Anthony Hyman [S15].
Drug treatment
Myosin II light chain inhibitor ML7 (Sigma I2764) was dissolved in DMSO. The final concentration of
DMSO in culture medium was kept below 0.15% during drug treatment. After resuspension, cells were
treated with DMSO or ML7 for 15 minutes prior to imaging. ROCK inhibitor Y-27632 was dissolved in
water, and cells were treated 30 minutes prior to imaging. For making measurements in mitotically
arrested cells, 20 μM STLC was added for 4 hours. Anaphase onset was induced by adding 30 μM
purvalanol A, followed by 15-30 minutes incubation. Microtubule depolymerisation was carried out by
treating with 1 μg/mL nocodazole for 4 hours.
Construct Addgene Number Resource
EGFP-C1-β-actin 31949 Vladislav Verkhush [S1]
Mcherry-UtrCH-pCS2 26740 William Bement [S2]
mCherry-Ezrin-C14 55042 Michael Davidson
EGFP-C1-Talin 26724 Anna Huttenlocher [S3]
EFGP-N1-ACTN1 11908 Carol Otey [S4]
Mcherry-N1-coronin1B 27694 Christien Merrifield [S5]
E-cadherin-GFP 28009 Jennifer Stow [S6]
EGFP-C1-PH-PLCδ 21179 Tobias Meyer [S7]
mCherry-C1-cofilin 27687 Christien Merrifield [S5]
EGFP-MLCK-C2 46316 Anne Bresnick [S8]

Measurements of mechanosensory response of proteins using micropipette aspiration Micropipette aspiration was performed as described previously [12]. In short, a pressure difference was
generated by adjusting the height of a motor-driven water manometer. Mammalian cells expressing
desired fluorescent proteins were loaded into the observation chamber, which was filled with either
DMEM or RPMI 1640 medium depending on the cell type. Cell types were deformed equally using the
ratio of the aspirated length of the cell in the pipette (Lp) over the radius of the pipette (Rp) as a guide.
Once a pressure was determined for each cell type for which Lp/Rp was approximately equal to two, this
fixed pressure was used for all cells of that type. These values were different between cell types (0.075
nN/μm2 for Jurkat cells, 0.15 nN/μm2 for NIH 3T3 cells, 0.2 nN/μm2 for HeLa cells, and 0.15nN/ μm2 for
Cos-7 cells) due to the unique cortical tensions of these cells (Fig. S2B). Pressures higher than this often
led to blebbing, or the separation of cell membrane from the cortex. All cells which demonstrated
blebbing at any time during recording were discarded. Images were collected with an Olympus IX81
microscope equipped with MetaMorph software and analyzed using ImageJ (National Institutes of
Health). After background correction, the fluorescence intensity at the accumulation sites inside the
micropipette were normalized against the opposite cortex of the cell. This was repeated for each frame to
obtain time-courses and account for expression level variation and photobleaching.
Measurement of fluorescence recovery after photobleaching (FRAP)
FRAP was performed as described previously [15]. HeLa cells were plated at low density on glass-bottom
dishes and transiently transfected 40 hours prior to imaging. The culture media was changed to Leibowitz
Media four hours prior to imaging. FRAP experiments were performed using a Zeiss AxioObserver with
780-Quasar confocal module, with a 63x (NA 1.4) objective at 37C and 5% CO2. A small region of the
cell cortex was bleached using a 488 nm Argon laser, and the fluorescence recovery was recorded until
recovery saturated (100 frames, 5-15 s/frame depending on the protein). The size and placement of the
bleach region was kept relatively constant across measurements. For each frame, the average intensity of
the bleached cortical region, reference (unbleached) region, and background was quantified using ImageJ
(National Institutes of Health). For photobleaching correction, the reference theoretical intensity (RTI)
was calculated by fitting the background subtracted reference intensity to an exponential decay equation
as follows:
(1) 𝑅𝑇𝐼(𝑡) = 𝐴 − 𝐵 ∙ 𝑒−𝐶𝑡
where 𝐴, 𝐵 and 𝐶 are fitting parameters.
The intensity of the bleached region was background subtracted and normalized to RTI. The normalized
intensity (NI) was obtained by normalizing this to the pre-bleach intensity (average of 4 pre-bleach
images), and was fitted to a single exponential as follows:
(2) 𝑁𝐼(𝑡) = 𝑚1(1 − 𝑚2 ∙ 𝑒−𝑘𝑡)
Where 𝑚1, 𝑚2 are fitting parameters and 𝑘 is the recovery rate.
The recovery time, , and the immobile fraction, Fi were measured as:
(3) Recovery time, 𝜏 = 1/𝑘
(4) Immobile fraction, 𝐹𝑖 = 1−𝑚1
1−𝑚1+𝑚2

Measurement of diffusion time by fluorescence correlation spectroscopy (FCS)
Jurkat (ACTN4) or HeLa (FLNB) cells were plated at low confluence in glass bottom dishes, transiently
transfected 40 hours prior to imaging, and media was replaced with Leibowitz media 4 hours prior to
imaging. FCS was performed exactly as previously described [15] at 37C and 5% CO2 on a Zeiss
AxioObserver with 780-Quasar confocal module & FCS, with a C-Apochromat 40x (NA 1.2) water
objective.
Modeling the catch-bond behavior of α-actinin and filamin
A full explanation of the molecular model used to predict the behavior of α-actinin and filamin in
Dictyostelium is published [13]. In short, α-actinin is a dimer containing two actin-binding domains
(ABD). One ABD of the protein first binds a single actin filament, where its diffusivity becomes greatly
reduced, and it searches for a second filament to bind within a 3D sphere with a radius equal to the length
of the protein rod. This binding reaction can be written as [Cr]+[F1]↔[CrF1]+[F2] ↔[CrF1F2] where Cr,
F1, and F2 correspond to the crosslinker, the actin filament in the first step, and the actin filament in the
second step, respectively. The reaction-diffusion equations used to model these conditions are as follows:
𝜕[𝐶𝑟]
𝜕𝑡= 𝐷1∇2[𝐶𝑟] − (𝑘on1[𝐶𝑟][𝐹1] − 𝑘off1[𝐶𝑟𝐹1])
(5) 𝜕[𝐶𝑟𝐹1]
𝜕𝑡= 𝐷2∇2[𝐶𝑟𝐹1] + (𝑘on1[𝐶𝑟][𝐹1] − 𝑘off1[𝐶𝑟𝐹1]) − (𝑘on2[𝐶𝑟𝐹1][𝐹2] − 𝑘off2[𝐶𝑟𝐹1𝐹2])
𝜕[𝐶𝑟𝐹1𝐹2]
𝜕𝑡= 𝐷3∇2[𝐶𝑟𝐹1𝐹2] + (𝑘on2[𝐶𝑟𝐹1][𝐹2] − 𝑘off2[𝐶𝑟𝐹1𝐹2])
where 𝐷1, 𝐷2, and 𝐷3 are the diffusion constants of 𝐶𝑟 , 𝐶𝑟𝐹1, and 𝐶𝑟𝐹1𝐹2, and 𝑘on1, 𝑘on2, 𝑘off1, and
𝑘off2 are the on and off rates for the first and second steps, respectively. To simulate catch-bond behavior,
we assumed the force-dependent binding condition would be the one in which the crosslinker is bound to
two filaments. We used the following equation to make the second off rate slow with the application of
force:
(6) 𝑘off2 = 𝑘off20 exp (−𝑓∆𝑥/𝑘B𝑇)
where 𝑘off20 is the zero-force off rate, 𝑓 is the force applied, and ∆𝑥 is the phenomenological bond length
in a Bell-type model [S22].
Filamin also forms dimers and undergoes a two-step binding reaction with actin, however it binds
orthogonal filaments which may not be at right angles, and different filament angles lead to different off
rates for filamin [S17]. Thus, we use α to denote angles less than 90°, and β to denote angles greater than
90° in the following reaction-diffusion equations for filamin:
(7)
𝜕[𝐶𝑟]
𝜕𝑡= 𝐷1∇2[𝐶𝑟] − (𝑘on1[𝐶𝑟][𝐹1] − 𝑘off1[𝐶𝑟𝐹1])
𝜕[𝐶𝑟𝐹1]
𝜕𝑡= 𝐷2∇2[𝐶𝑟𝐹1] + (𝑘on1[𝐶𝑟][𝐹1] − 𝑘off1[𝐶𝑟𝐹1]) − (𝑘on2[𝐶𝑟𝐹1] − 𝑘off2
𝛼 [𝐶𝑟𝛼𝐹1𝐹2])
− (𝑘on2[𝐶𝑟𝐹1][𝐹2] − 𝑘off2
𝛽[𝐶𝑟𝛽𝐹1𝐹2])
𝜕[𝐶𝑟𝛼𝐹1𝐹2]
𝜕𝑡= 𝐷3∇2[𝐶𝑟𝛼𝐹1𝐹2] + ( 𝑘on2[𝐶𝑟𝐹1][𝐹2] − 𝑘off2
𝛼 [𝐶𝑟𝛼𝐹1𝐹2])

𝜕[𝐶𝑟𝛽𝐹1𝐹2]
𝜕𝑡= 𝐷3∇2[𝐶𝑟𝛽𝐹1𝐹2] + ( 𝑘on2[𝐶𝑟𝐹1][𝐹2] − 𝑘off2
𝛽[𝐶𝑟𝛽𝐹1𝐹2])
In the case of filamin, we used Equation 6 to incorporate catch-bond behavior into 𝑘off2, but also
incorporated structural cooperativity into 𝑘on2 using the following equation:
(8) 𝑘on2 = 𝑘on20 (1 +
[𝐶𝑟𝛼𝐹1𝐹2]+[𝐶𝑟𝛽𝐹1𝐹2]
𝐹2)
𝑥cos𝜃
where 𝑥 is the cooperativity index and θ is the azimuth angle in the tip of an aspirated cell. See Table S1
and Table S2 for the parameters used for each variable.
Statistical analysis
Statistical analysis was performed using Graph Prism (www.graphpad.com) or KaleidaGraph (Synergy
Software). The Mann-Whitney test was used for non-parametric comparisons of different data sets. Data
sets were also analyzed by analysis of variance (ANOVA) with a Fisher's least significant difference
comparison. Both methods obtained nearly identical conclusions.

Supplemental References
S1. Subach, F.V. et al. (2009). Photoactivatable mCherry for high-resolution two-color fluorescence
microscopy. Nat. Methods. 6, 153-159.
S2. Burkel, B.M., von Dassow, G., and Bement, W.M. (2007). Versatile fluorescent probes for actin
filaments based on the actin-binding domain of utrophin. Cell Motil. Cytoskeleton. 64, 822-832.
S3. Franco, S.J. et al. (2004). Calpain-mediated proteolysis of talin regulates adhesion dynamics. Nat.
Cell Biol. 6, 977-983.
S4. Edlund, M., Lotano, M.A., and Otey, C.A. (2001). Dynamics of alpha-actinin in focal adhesions and
stress fibers visualized with alpha-actinin green fluorescent protein. Cell Motil. Cytoskeleton. 48,
190-200.
S5. Taylor, M.J., Perrais, D., and Merrifield, C.J. (2011). A high precision survey of the molecular
dynamics of mammalian clathrin-mediated endocytosis. PLoS Biol. 9, e1000604.
S6. Miranda, K.C. et al. (2001). A dileucine motif targets e-cadherin to the basolateral cell surface in
Madin-Darby canine kidney and LLC-PK1 epithelial cells. J. Biol. Chem. 276, 22565-22572.
S7. Stauffer, T.P., Ahn, S., and Meyer, T. (1998). Receptor-induced transient reduction in plasma
membrane PtdIns(4,5)P2 concentration monitored in living cells. Curr. Biol. 8, 343-346.
S8. Dulyaninova, N.G., Patovsky, Y.V., and Bresnick, A.R. (2004). The N-terminus of the long MLCK
induces a disruption in normal spindle morphology and metaphase arrest. J. Cell Sci. 117, 1481-
1493
S9. Wei, Q., and Adelstein, R.S. (2000). Conditional expression of a truncated fragment of nonmuscle
myosin II-A alters cell shape but not cytokinesis in HeLa cells. Mol. Biol. Cell 11, 3617-3627
S10. Golomb, E., et al. (2004). Identification and characterization of nonmuscle myosin II-C, a new
member of the myosin II family. J. Biol. Chem 279, 2800-2808.
S11. Shao, H., Wang, J. H., Pollak, M.R., and Wells, A. (2010). α-Actinin-4 is essential for maintaining
the spreading, motility and contractility of fibroblasts. PloS one. 5, e13921.
S12. van der Flier, A. et al. (2002). Different splice variants of filamin-B affect myogenesis, subcellular
distribution, and determine binding to integrin β subunits. J. Cell Biol. 156, 361-376.
S13. Huang, Y.W. et al., (2008). Mammalian septins are required for phagosome formation. Mol. Biol.
Cell. 19, 1717-1726.
S14. Chen, H., Cohen, D. M., Choudhury, D.M., Kioka, N., and Craig, S.W. (2005). Spatial distribution
and functional significance of activated vinculin in living cells. J. Cell Biol. 169, 459-470.
S15. Poser, I. et al. (2008). BAC TransgeneOmics: a high-throughput method for exploration of protein
function in mammals. Nat. Methods 5, 409-415.
S16. Haugwitz, M., Noegel, A.A., Karakesisoglou J., and Schleicher, M. (1994). Dictyostelium amoebae
that lack G-actin-sequestering profilins show defects in F-actin content, cytokinesis, and
development. Cell. 79, 303-314.
S17. Ferrer, J.M. et al. (2008). Measuring molecular rupture forces between single actin filaments and
actin-binding proteins. Proc. Natl. Acad. Sci. U S A. 105, 9221-9226.
S18. Sawyer, G.M., Clark, A.R., Robertson, S.P., and Sutherland-Smith, A.J. (2009). Disease-associated
substitutions in the filamin B actin binding domain confer enhanced actin binding affinity in the
absence of major structural disturbance: Insights from the crystal structures of filamin B actin
binding domains. J. Mol. Biol. 390, 1030-47.
S19. Nakamura, F., Osborn, T.M., Hartemink, C.A., Hartwig, J.H., and Stossel, T.P. (2007). Structural
basis of filamin A functions. J. Cell Biol. 179, 1011-1025.
S20. Wachsstock, D.H., Schwarz, W.H., and Pollard, T.D. (1994).Cross-linker dynamics determine the
mechanical properties of actin gels. Biophys J. 66, 801-809
S21. Goldmann, W.H., and Isenberg, G. (1993). Analysis of filamin and alpha-actinin binding to actin by
the stopped flow method. FEBS Lett. 336, 408-410.
S22. Bell, G.I. (1978). Models for the specific adhesion of cells to cells. Science 200, 618-627.