mechanistic studies of polymeric samples exposed aboard sts · jpl publication 87-25 mechanistic...
TRANSCRIPT

JPL Publication 87-25
Mechanistic Studies of Polymeric Samples Exposed Aboard STS Vlll Ranty H. Liang Amitava Gupta Shirley Y. Chung Keri L. Oda
December 15,1987
NASA National Aeronautics and Space Administration
Jet Propulsion Laboratory California Institute of Technology Pasadena, California
https://ntrs.nasa.gov/search.jsp?R=19880004820 2018-09-30T05:06:46+00:00Z

The research described in this publication was carried out by the Jet Propulsion Laboratory, California Institute of Technology, under a contract with the National Aeronautics and Space Administration.
Reference herein to any specific commercial product, process, or service by trade name, trademark, manufacturer, or otherwise, does not constitute or imply its endorsement by the United States Government or the Jet Propulsion Laboratory, California Institute of Technology.

Th e a r l y Shut t l f l i g h t a
ABSTRACT
d t h e at tendant c p o r t u n i t y t o deploy
mater ia l samples t o t h e near-earth space environment, along wel l de f ined
t r a j e c t o r i e s and accompanied by d e t a i l e d c h a r a c t e r i z a t i o n o f these samples
p r i o r t o and fo l low ing t h e f l i g h t exposure, have brought t o l i g h t several
novel phenomena associated w i t h i n t e r a c t i o n o f these m a t e r i a l s w i t h t h e space environment. The J e t Propuls ion Laboratory (JPL), i n coord ina t ion w i t h other Nat ional Aeronautics and Space Admin is t ra t ion (NASA) centers, has c a r r i e d out a research program t o study t h e mater ia l degradation and
o x i d a t i o n processes caused by i n t e r a c t i o n o f these mater ia ls w i t h atomic oxygen a t an i n t e r a c t i o n energy o f 5 e l e c t r o n v o l t s (ev). I n add i t ion , t h e i n t e r a c t i o n o f energet ic atomic oxygen w i t h m a t e r i a l s i s be l ieved t o be responsib le f o r t h e " s h u t t l e glow" f i r s t observed dur ing t h e f l i g h t of
Space Transpor tat ion System (STS) I 1 I. The s h u t t l e glow phenomenon has been ex tens ive ly s tud ied and modeled because o f i t s long-range p o t e n t i a l
impact on o p t i c a l communication schemes and i t s more immediate impact on
t h e Space Telescope. mater ia l degradation and eros ion experiments c a r r i e d out aboard t h e STS
VI11 f l i g h t , which occurred between August 30, 1983 and September 5, 1983.
Based on these data, a gener ic degradation model has been developed for
common s t r u c t u r a l polymers.
This r e p o r t summarizes t h e r e s u l t s o f c e r t a i n
iii

TABLE OF CONTENTS
I. STS FLIGHT VI11 HARDWARE AND OXYGEN ATOM FLUENCE ................. 1
5 11. EXPERIMENTAL .................................................... A. Sample Preparat ion ......................................... 6. Analys is ................................................... 7
111. RESULTS ......................................................... 9
A. Polyethylene (PE) .... ..... ... ........ ................ .... ... 9 6. Polymethylmethacrylate (PMMA) ............. .... .............. 14
C. Polysul fone ................................................ 17 D. Kapton and Teflon-coated Kapton ............................. 19
E. Polystyrene ................................................ 20 F. 2-306 Chemglaze Pa in t ......................................* 21
PRECEULNQ PAGE BLANK NOT FILMED
V

LIST OF FIGURES
1 . Mater ia l Tray Conf igura t ion ..................................... 2
2 . Raman Spectra o f Polyethylene ................................... 10
3 . ESCA Spectra o f a) Control and b) Exposed Surfaces o f Polyethy-
lene ............................................................ 11
4 . High-Resolution ESCA Spectra o f the Carbon i n a) Control and b)
Exposed Surfaces o f Polyethylene ................................ 12
5 . HPLC o f Polymethylmethacrylate .................................. 15
6 . Stress-Stra in Curves o f PMMA Returned from STS F l i g h t V I I I ...... 16
7 . Stress-Stra in Curves o f Polysul fone Returned from STS F l i g h t
VI11 ............................................................ 18
8 . Resonance Raman Spectra o f Kapton Before and A f t e r Exposure ..... 19
9 . High-Resolution ESCA Spectra o f Carbon on 2-306 Surfaces ........ 22
10 . High-Resolution ESCA Spectra o f Oxygen on 2-306 Surfaces ........ 23
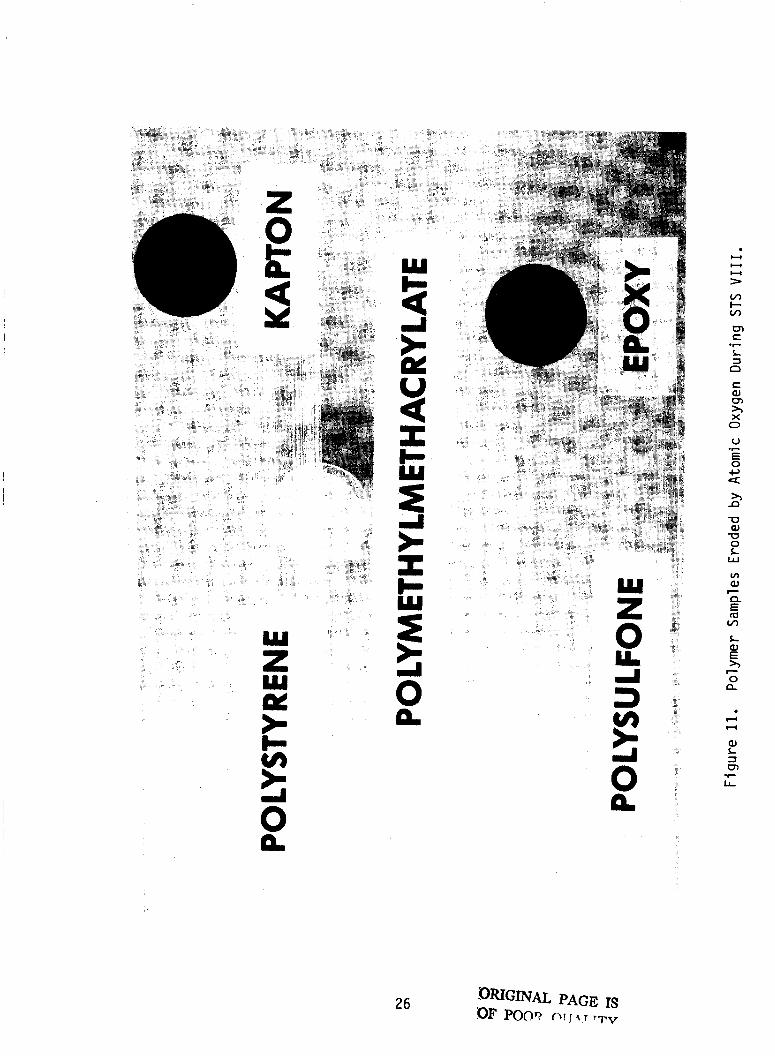
11 . Polymer Samples Eroded by Atomic Oxygen During STS V I I I ......... 26
v i

1.
11.
111.
IV.
V.
VI.
VII.
VIII.
I X .
X.
XI.
XII.
XIII.
LIST OF TABLES
STS F l i g h t V I 1 1 A t t i t u d e Summary ................................ Tests Performed on Samples Flown on STS V I 1 1 .................... 6
Weight Loss Data ................................................ 7
Percent Composition o f Polyethylene Surfaces from ESCA .......... 13
Densi ty Measurement of Polyethylene ............................. 13
Summary of Resul ts o f HPLC on PMMA .............................. 15
Percent Composition o f Polymethylmethacrylate Surfaces from ESCA .16
17
3
Percent Composition o f Polysul fone Surfaces by ESCA .............. Summary o f HPLC Resul ts on Polysul fone 18
Percent Composition o f Kapton Surfaces from High-Resolution ESCA -20
20
...........................
Dynamic Modulus Data f o r Kapton Flown on STS V I 1 1
ESCA Summary o f Resul ts on Polystyrene ........................... 21
................
Surface Composition o f the 2-306 Paint Aboard STS V I 1 1 ............24
v i i

I. STS FLIGHT VI11 HARDWARE AND OXYGEN ATOM FLUENCE
D e t a i l s o f t h e STS VI11 exposure experiment have been repor ted e lse-
wherecl l .
c a r r i e r a t a forward l o c a t i o n i n the o r b i t e r bay.
p les o f mater ia ls i n the form o f d iscs as wel l as s t r i p s .
t r a t e s t h e placement o f these two t r a y s w i t h respect t o t h e o r b i t e r .
s t r i p samples were mounted on c a l i b r a t e d heat ing p l a t e s t o evaluate t h e e f f e c t o f temperature on degradation. Templabels were used t o monitor
sample temperatures i n f l i g h t . Temperatures o f 75OF, 150°F, and 25OOF were planned. Readings from templabels, however, i n d i c a t e d t h a t tempera-
t u r e s o f 75"F, 25OoF, and 260°F were reached dur ing f l i g h t . The t o t a l
f l i g h t dura t ion was 140 hours w i t h four p r i n c i p a l a t t i t u d e s acquired dur-
i n g t h e mission. Table I summarizes t h e f l i g h t a t t i t u d e s . The p r i n c i p a l
mater ia l exposure a t t i t u d e was +-XLV, payload bay i n t o t h e v e l o c i t y vector,
and i s i l l u s t r a t e d i n F igure 1. This a t t i t u d e was acquired th ree t imes
dur ing t h e mission and t h e t o t a l oxygen atom f luence was ca lcu la ted t o be
=2.7X10'20 atoms/cm2 over a 41-hour durat ion. This number was der ived from Goddard Space F1 i ght Center (GSFC) atmospheric dens i ty model s and
NOAA s o l a r a c t i v i t y p r e d i c t i o n s f o r t h e actual f l i g h t t r a j e c t o r i e s .
I n STS V I I I , two experimental t r a y s were placed on a payload
These t r a y s he ld sam-
A l l F igure 1 i l l u s -
1

L aJ c,
l-4
aJ L 1 CT,
LL .I-
2

Table I. STS F l i g h t V I11 A t t i t u d e Summary
I ATTITUDE
-ZLV NOSE FWD
- X S I ORB RATE
-ZLV FREE DRIFT
*XLV PLB FWD
+XLV PLB NORTH
STAR TRACKER TESTS
KuBd/IMU ALIGNMENT
TAIL GLOW
TOTALS
ORB ITS
35
10
9
27
1
2
8
1
93
HOURS -I 52 -83
15.67
12.92
41.17
1.33
2.75
12.00
1.50
140.17
3

11. EXPERIMENTAL
A. Sample Preparat ion
S i x types o f d i s c samples (1" i n diameter) and two types o f s t r i p (3"x l I' ) samples were prepared f o r t h e STS f l i ght V I I I exposure experiment.
Polymethylmethacryl a te (PMMA) beads were purchased from Polysciences, Inc.
a t two i n t r i n s i c v i s c o s i t i e s : 1.4 and 0.4. The samples were compression
molded a t 177°C between te f lon-coated Kapton sheets. A f i l m o f 0.007 in .
th ickness was obtained f o r t h e 0.4 v i s c o s i t y mater ia l and a t h i c k e r f i l m
o f 0.044 in. was prepared from t h e 1.4 i n t r i n s i c v i s c o s i t y PMMA.
y lene (PE) w i t h a dens i ty o f 0.915 and polystyrene (PS) were molded a t
150°C and 177"C, respect ive ly , as received from Polysciences, Inc. F i l m
thicknesses o f 0.005 in . were made. Polysul fone (Union Carbide Ildel 1700) p e l l e t s were d r i e d i n a vacuum oven a t 150°C f o r 3 days and then compres-
s ion molded a t 293°C t o form 0.005 in . t h i c k f i lms . No mold re leas ing
agent which contains s i l i c o n was used i n any compression molding i n order
t o avoid sample surface contamination. Instead, samples were molded be-
tween two sheets o f te f lon-coated Kapton f i lms . Tef lon was used f o r ease
o f sample release. Kapton (DuPont 500H) and te f lon-coated Kapton (DuPont
F131) were cu t from as-received sheets.
approximately l-i nch d i ameter d i scs .
Polyeth-
The above f i l m s were cut i n t o
Carbon-f i 1 l e d polyurethane-based 2-306 chemgl aze p a i n t samples were
a lso f lown on STS V I I I . This chemglaze p a i n t i s o f i n t e r e s t t o study be-
cause o f i t s d isp lay o f t h e mater ia l glow phenomenon bel ieved t o be a con-
sequence o f i n t e r a c t i o n o f t h e surface l a y e r w i t h energet ic oxygen atoms
i n t h e low-earth o r b i t environment. Samples were provided by Marshall a bama . F l i g h t Center, Huntsv i l le , A
Two types o f s t r i p samp
mechanical t e s t i n g : 3" X 1" Table I 1 l i s t s var ious t e s t s
es were prepared f o r exposure and subsequent PMMA ( v i s c o s i t y 0.4) and polysul fone f i lms .
t h a t were performed on t h e samples. Table
I11 shows t h e weight l o s s data.
5

Table 11. Tests Performed on Samples Flown on STS V I11
MATERIAL ESCA
TENSILE
HPLC STRESS-STRAIN
WEIGHT
RR LOSS RHEOVIBRON
PMMA (V iscos i ty 1.4)
PMMA ( V i s c o s i t y 0.4)
POLYETHYLENE
POLY SULFONE
(Udel 1700)
POLYSTYRENE
KAPTON (nuPon,*, 500H)
KAPTON (DuPont F131)
2-306 CHEMGLAZE PAINT
X
X
X
X
X
X
X
X -
X
X
X
-
X
-~
X = Completed
- = Attempted but unable t o obta in data
- X
X
X
X
X
X
X
6

I
Table 111. Weight Loss Data
1
MATERIAL
WEIGHT LOSS
mg/cm2
POLYETHYLENE
POLYMETHYLMETHACRYLATE: ( V I S C O S I T Y - 1.4)
(VISCOSITY - 0.4)
POLYSULFONE
KAPTON (DuPont 500H)
KAPTON (DuPont F131)
POLYSTYRENE
B. Analys is
2.1
1.1
1.3
<0.2
0.8
The f o l l o w i n g analyses were c a r r i e d out on the STS VI11 samples:
1) ESCA - E lec t ron Spectroscopy f o r Chemical Analysis was per-
formed on a Hewlet t Packard ESCA photoelect ron spectrometer Model 5958. This t e s t provides data on the elemental com-
p o s i t i o n o f t he sur face (approximately the top 50 - 100 A ) o f each sample. H igh- reso lu t ion spectra were c u r v e - f i t t e d
7

t o resolve t h e presence o f m u l t i p l e atomic components and
estimates o f concentrat ion i n atomic percentage.
2) HPLC - High Pressure L i q u i d Chromatography was c a r r i e d out
by a Water Associates Model 6000A chromatogram. Four-col-
umn ( l o 5 A, l o 4 A, l o 3 A, and 500 A) microstyrogel separa- t i o n was performed.
weight c a l i b r a t i o n and chloroform was used as the solvent.
Polystyrene was used f o r molecular
3) Tens i le St ress-Stra in Tests - Tensi le s t r e s s - s t r a i n t e s t s were c a r r i e d out by s t r e t c h i n g t h e sample i n a t e n s i l e mode
a t a pre-set crosshead speed i n a t a b l e Model-TM-Instron
machi ne . This I n s t r o n was equipped w i t h an envi ronmental chamber w i t h temperature cont ro l t o ?0.5OC. The load was measured
as a f u n c t i o n o f t ime i n a s t r i p char t recorder. Tests
were performed a t a s t r a i n r a t e o f 0.02 min-’.
perature was 25OC. Test tem-
4) RR - A CW A r + and K r + i o n l a s e r and a CW A r + i o n pumped dye
l a s e r were used as t h e tunable e x c i t a t i o n source f o r reso- nance Raman spectroscopy. I n order t o s e l e c t the best ex-
c i t a t i o n and minimize t h e f l uorescence background, several
e x c i t a t i o n wavelengths were used.
5 ) Weight Loss - Samples were measured us ing a M e t t l e r Type
815 1609 balance w i t h a s e n s i t i v i t y o f 0.1 mg.
6) Rheovibron - Dynamic mechanical t e s t i n g was performed using a Rheovi bron Dynamic V i scoel astometer Model DDV- I I.
temperature range was -133 t o 24OoC, a t 11-Hz frequency.
Test
8

111. RESULTS
A. Polyethylene (PE)
Polyethylene has the s implest poss ib le chemical s t r u c t u r e o f a1 1
polymers and, hence, t he fewest poss ib le modes o f i n t e r a c t i o n w i t h ener-
g e t i c oxygen atoms. known t o undergo slow t e r r e s t r i a l ox idat ion, extreme care was taken when
samples o f PE were prepared t o minimize t h i s ox ida t i on process.
weight l oss o f d i sc samples f lown aboard STS VI11 was found t o be 1.3 * 0.2 mgjcm’. Eros ive weight l oss amounted t o 7% o f t he t o t a l sample
weight. Control and exposed surfaces o f PE have s i m i l a r Raman spectra,
as shown i n F igure 2.
t he exposed sur face as evidenced by the broad peak a t 1090 cm-’. t h e th ickness o f t he res idua l ox id ized l a y e r was expected t o be very small. charac ter ize t h i s layer . F igure 3 i s t h e ESCA spectra o f con t ro l and ex-
posed surfaces o f polyethylene.
It was the re fo re used as a model system. Since PE i s
The
There i s a h i n t o f the format ion o f a C-l) bond on
Hence,
Both low- and h igh - reso lu t i on ESCA were performed i n order t o
H igh- reso lu t ion ESCA spectra o f the carbon i n PE were i l l u s t r a t e d i n
F igure 4. The in teg ra ted area under each peak was used t o c a l c u l a t e the
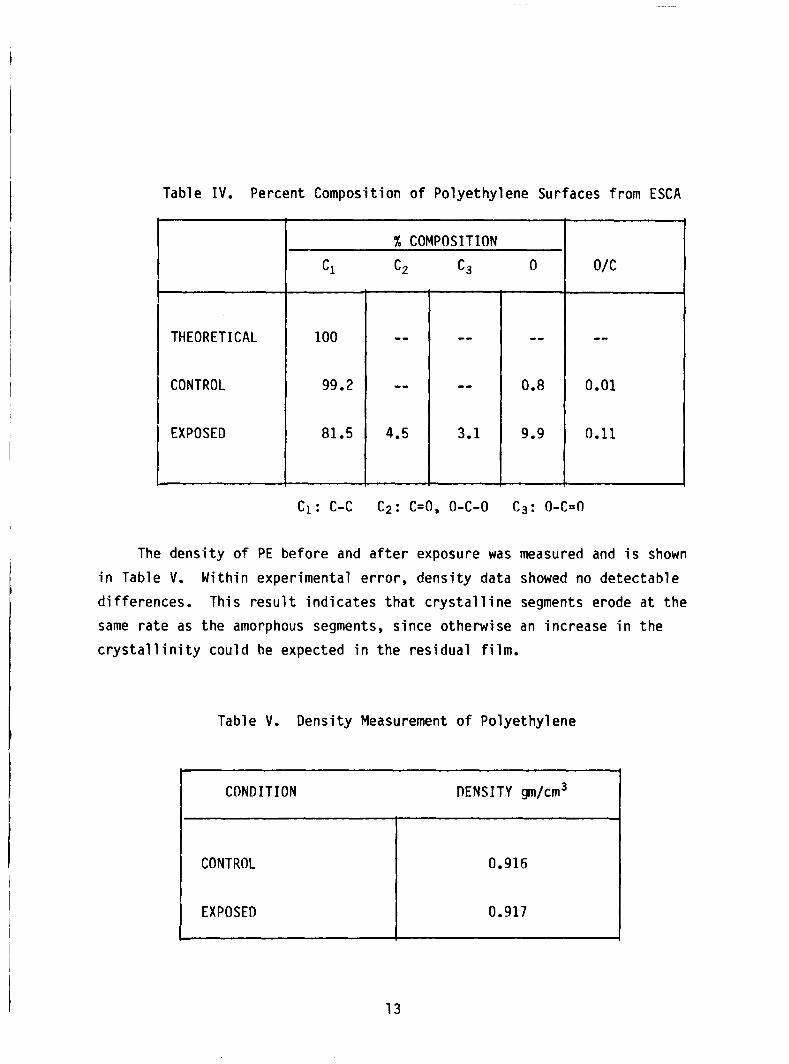
percent composition and the r e s u l t s are l i s t e d i n Table I V . It i s c l e a r
t h a t t he chemical composition o f the exposed surface l a y e r (50A) inc ludes
9.9 atom percent oxygen, i n con t ras t t o 0.8 atom percent on a con t ro l sur- face (backside o f t he same sample). High-resolut ion ESCA on the carbon peak a l so i nd i ca ted t h a t ox id ized carbon atoms were formed on the exposed
surface. we l l as doubly ox id ized (C,) carbon atoms, i n c l u d i n g ca rboxy l i c ac id
groups were detected on the exposed surface.
s i t i o n of t h i s res idua l ox id ized l a y e r lead t o the conclus ion t h a t the
i n i t i a l o r t he pr imary i n t e r a c t i o n o f the PE sur face w i t h atomic oxygen
creates a p a r t i a l l y ox id ized in termediate s t a t e which may undergo v o l a t i l -
i z a t i o n o r subsequent f u r t h e r ox ida t i on lead ing t o t h e formulat ion o f
carboxyl groups found by ESCA spectroscopy.
It i s o f i n t e r e s t t o note t h a t both s i n g l y ox id ized (Cz), as
The ESCA data on the compo-
9

8 00 H
A 1 I S N U N I
0 0 s
0 0 cv 4
0 0 0 d
I E u
n i w
2 2 7 > w
a 3
10

I
c 1s b)
t 2 0
=ne - BINDING ENERGY IeV)
F igure 3. ESCA Spectra o f a ) Control and b ) Exposed Surfaces o f
Polyethylene.
11

t 2 Y I- W n i
d
- B IND ING ENERGY (eV)
F igure 4. High-Resolution ESCA Spectra of the Carbon i n a ) Control
and b ) Exposed Surfaces of Polyethylene.
12
i
CONTROL
EXPOSED
Table I V . Percent Composition of Polyethylene Surfaces from ESCA
0.916
0.917
I t------- I
THEORETICAL
I CONTROL
EXPOSED
C l c2
100
99.2
81.5
0
--
0.8
9.9
--
0.01
0.11
c1: c-c c2 : c=o, 0-c-0 c 3 : 0-c=o
The dens i ty o f PE before and a f t e r exposure was measured and i s shown
i n Table V. Wi th in experimental e r ro r , dens i ty data showed no de tec tab le
d i f fe rences . This r e s u l t i nd i ca tes t h a t c r y s t a l l i n e segments erode a t t he
same r a t e as the amorphous segments, s ince otherwise an increase i n the
c r y s t a l l i n i t y could he expected i n the res idua l f i l m .
Table V. Densi ty Measurement o f Polyethy lene
13

B. Polymethylmethacrylate (PMMA)
PMMA of two i n t r i n s i c v i s c o s i t i e s (0.4 and 1.4) were used. While t h e
h igh -v i scos i t y (1.4) sample showed a weight l oss o f 1.2 mg/cm2, t h e low- v i s c o s i t y one (0.4) showed almost tw ice as much weight loss, i.e. 2.1 mg/
cm2. Resul ts o f HPLC ana lys is are shown i n Table V I and Figure 5. These data i nd i ca ted the l ow-v i scos i t y PMMA contained a subs tan t ia l amount o f a
low molecular-weight component which would be suscept ib le t o v o l a t i l i z a -
t i o n .
t h i s sample.
This may account f o r t he unusual ly h igh weight l oss observed f o r
ESCA ana lys is was a l so c a r r i e d out on both d i sc samples. per imental e r r o r (+-2%), both high- and low-v i scos i t y samples e x h i b i t s im i -
l a r r e s u l t s and are summarized i n Table V I I .
W i th in ex-
It i s i n t e r e s t i n g t o p o i n t out t h a t wh i l e PMMA was s u f f e r i n g weight
l oss due t o erosion, t he chemical composition o f t he eroded surface re- mained unchanged.
Tens i le s t r e s s - s t r a i n t e s t s were a l so performed on PMMA s t r i p s .
S t ress -s t ra in data were obtained a f t e r accounting f o r changes i n the
th ickness o f t h e specimen due t o erosion. Resul ts showed no de tec tab le change i n the t e n s i l e modulus and are i l l u s t r a t e d i n Figure 6.
The HPLC data i n d i c a t e t h a t chain sc i ss ion and unzipping processes
were occur r ing i n PMMA on oxygen atom in te rac t i on . Since the ox id ized mater ia l would be v o l a t i l i z e d under these condi t ions, t he eroded sur face
would r e t a i n the chemical composition o f t h i s o r i g i n a l mater ia l . The ex ten t o f t he molecular weight l oss i s i n s u f f i c i e n t t o cause a .measurable
decrease i n deformat ion proper t ies ; hence, no change i n the t e n s i l e modu-
l u s i s observed.
14
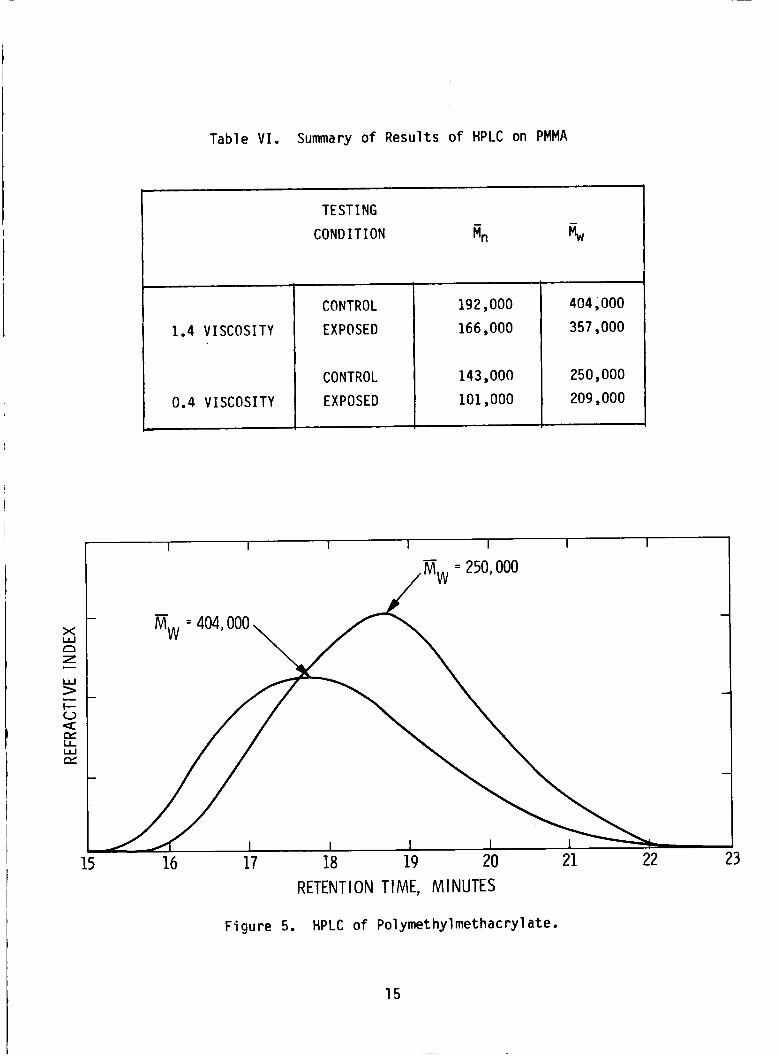
Table V I . Summary o f Results o f HPLC on PMMA
CONTROL
1.4 VISCOSITY EXPOSED
CONTROL
0.4 VISCOSITY EXPOSED
TESTING
COND I T 1 ON R"
192,000
166,000
143,000
101,000
15 16 17 18 RETENT
Figure 5. HPLC
ON TIME, MINUTES
o f Polymethylmethacrylate.
404,000
357,000
250,000
209,000
3
15

Table V I I . Percent Composition o f Polymethylmethacrylate
Surfaces from ESCA c
% COMPOSITION
I
THEORETICAL
CONTROL
EXPOSED
60 1 I I I ' a a
o/c 0 C l c 2 c 3
29 43 14 14 0.41
24 48 14 13 0.32
26 45 14 14 0.36
50 c 3 40 v 4 2 1 30
a A n
d n
d J - 1 S T R A I N RATE: 0.02 min
TEST TEMPERATURE: 25OC
n n
tY E X P O S E D TEMPERATURE: 132OC I I b
a I .4' a C O N T R O L I
E X P O S E D 20 I 10 L i 1 -
1 1 I I I 1 o! 1 2 3 4 5 6
S T R A I N ("A)
Figure 6. Stress-St ra in Curves o f PMMA Returned from STS F l i g h t V I I I .
16

C. Polysul fone
X COMPOSITION
c1 c2 c 3 s 01 02 N
THEORETICAL 72 13 - 3.1 6.3 6.3 -
CONTROL 72 7.4 2.2 2.6 8.3 5.8 1.5
EXPOSED 62 8.8 2.6 3.4 10.5 10.5 -
The weight l o s s o f a d i s c sample o f polysul fone was found t o be 1.1 An a t - mg/cm2, which amounts t o 3.5% change o f t h e t o t a l sample weight.
tempt t o ob ta in a resonance Raman spectrum o f po lysu l fone f a i l e d due t o
t h e in tense f luorescence and p h o t o - i n s t a b i l i t y o f t h e sample a t v i s i b l e
wavelengths (600-450 nm).
V I I I . The c o n t r o l surface matches we l l w i t h t h a t o f a pure polysul fone. The exposed surface, however, showed a 10% decrease i n hydrocarbon con-
c e n t r a t i o n and a 7% increase i n oxygen content.
Resul ts o f ESCA ana lys is are shown i n Table
o/c
0.15
0.16
0.29
Tensi le s t r e s s - s t r a i n measurements were c a r r i e d out on t h e s t r i p PO-
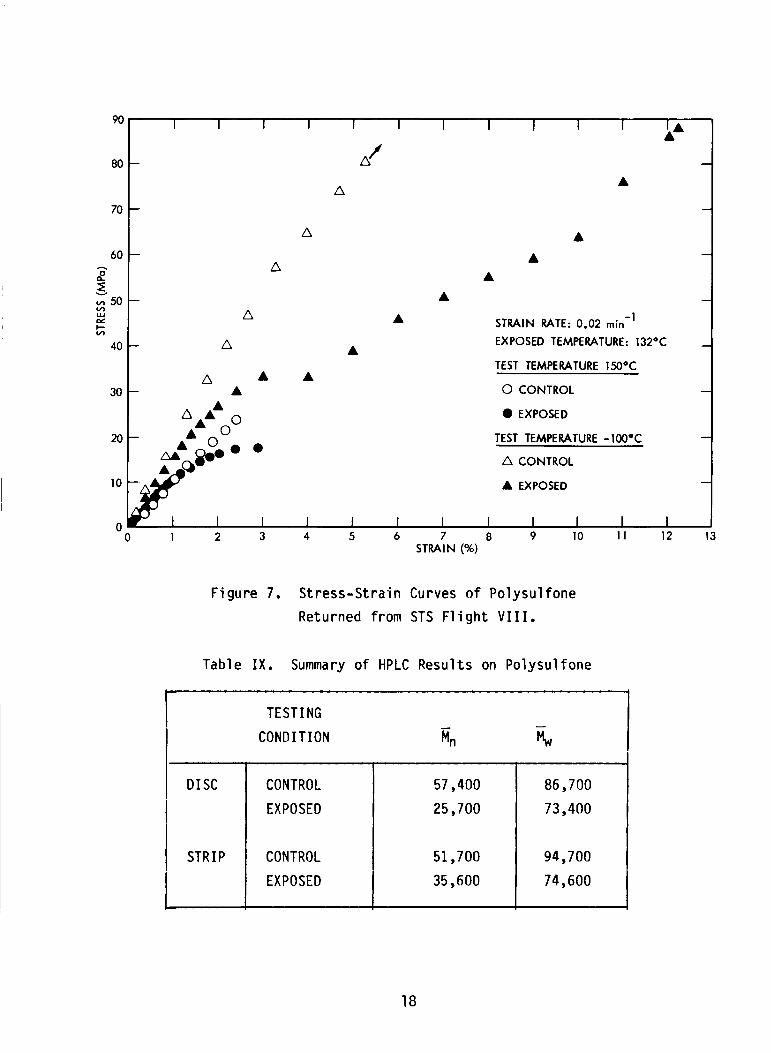
l y s u l f o n e samples and t h e r e s u l t s are shown i n F igure 7. drop i n t h e t e n s i l e modulus was observed as a r e s u l t o f atomic.oxygen ex- posure.
s t r a i n.
A subs tan t ia l
The onset o f y i e l d i s found i n t h e exposed samples a t around 3%
The HPLC data i n d i c a t e subs tan t ia l l o s s o f molecular weight due t o
chain sc iss ion. This decrease i n molecular weight causes a decrease i n
mechanical p r o p e r t i e s such as t h e t e n s i l e modulus, r e f l e c t e d i n t h e ten-
s i l e s t r e s s - s t r a i n data. Presumably t h e chain s c i s s i o n i s i n i t i a t e d through o x i d a t i o n o f t h e polysul fone chain, probably a t t h e phenyl nucle-
us. HPLC r e s u l t s are summarized i n Table I X .
Table VIII. Percent Composition o f Polysulfone Surfaces by ESCA
17
90
80
70
60 - 2 z G 5 0 w w I- lA
40
30
F igure 7. Stress-Stra in Curves o f Polysulfone
Returned from STS F l i g h t V I I I .
I I I I I I I 1 I I I LA f - A -
A A
- -
A A A - -
A A
A - - - 1 STRAIN RATE: 0.02 min
EXPOSED TEMPERATURE: 132OC - A - TEST TEMPERATURE l X 0 C
C A
A
A A A - A 0 CONTROL -
Table I X . Summary o f HPLC Results on Polysulfone
0 EXPOSED
TEST TEMPERATURE -1OOOC - a CONTROL
A EXPOSED -
1 I I I I 1 I I I 0 1 2 3 4 5 6 7 8 9 10 1 1 12 13
TEST1 NG
COND I T I ON
1 DISC
I CONTROL 57,400 86,700 EXPOSED 25,700 73,400
STRIP I i I I I 749600 I 35,600
CONTROL 51,700 94,700
18

D. Kapton and Teflon-Coated Kapton
An average weight l oss o f 1.3 mg/cm2 was observed on the exposed
DuPont (500H) disc. No de tec tab le weight l oss could be determined on the te f lon-coated Kapton DuPont (F131) samples. Resonance Raman spectra o f
Kapton before and a f t e r exposure are i l l u s t r a t e d i n F igure 8. The on ly notable d i f f e rence i s t he disappearance o f the 1600 cm” phenylene peak. This r e s u l t was repor ted e a r l i e r f o r t he exposed Kapton sample returned from STS 11, 111, and V missions.
shown i n Table X.
room temperature and are summarized i n Table X I .
Resul ts o f ESCA ana lys is on Kapton a re
Rheovibron measurements were taken i n t r i p l i c a t e a t
I I 1 I I 1 I I I 1 I 1 1 1 I 1 I
EX: 406.7 nm
EXPOS ED 1 (25OOF)
400 600 800 WAVENUMBER
Figure 8. Resonance Raman Spectra o f Kapton Before and Af te r Exposure.
19

Table X. Percent Composition o f Kapton Surfaces from High-Resolution ESCA
% COMPOSITION
C, C2 C, 0, 0, N
c1:
Table X I .
O/C
I I I
CONTROL
EXPOSED
48 14 14 14 3.4 6.9 0.23
29 30 14 15 4.1 7.1 0.26
C-C C2: C-O,C-N C 3 : N-C=O 01: C=O 02: C-0
Dynamic Modulus Data f o r Kapton Flown on STS VI11
i MATERIAL TESTING CONDITION E, lo5 p s i
EXPOSED 26.1 f 0.6
I TEFLON-COATED
I KAPTON
CONTROL
EXPOSED
26.8 f 0.2 23.5 f 0.3
I E, Polystyrene
Polystyrene has the s implest chemical s t r u c t u r e fo r an aromatic po ly - mer and i s t he re fo re used as a model compound.
o f a d i sc sample i s 0.8 mg/cm2, which i s s u b s t a n t i a l l y lower than the o ther samples exposed. Surface composition from h igh- reso lu t ion ESCA
ana lys is i s l i s t e d i n Table X I I .
The average weight l oss
20

Table X I I . ESCA Summary o f Resul ts on Polystyrene
THEORETICAL
CONTROL
EXPOSED
% COMPOSITION
C l - 100
97
28 -
c2 c 3 P l P, Ca
J Zn -
-
-
1.7
0 -
-
2.2
34 -
1 --
C 1 : C-C C2: C-0 C3:O-C=O C4: shake-up PI: POL,~' P2: P205
The exposed surface was contaminated as evidenced by t h e de tec t ion o f
phosphate s a l t s , calcium, and z inc (PI, Pp, Ca, and Zn).
weight o f these contaminants may be p a r t i a l l y responsib le f o r t h e low ero-
s ion r a t e o f t h e polystyrene observed. content was reduced from 97% t o 28%, w h i l e t h e oxygen content rose from
2.2% t o 34% as a r e s u l t o f exposure. This r i s e i n oxygen content on t h e
exposure sur face i s subs tan t ia l , i n s p i t e o f t h e c o n t r i b u t i o n from POb3'
and P2O5.
The a d d i t i o n a l
Note t h a t t h e hydrocarbon (C,)
F . 2-306 Chemglaze Pa in t
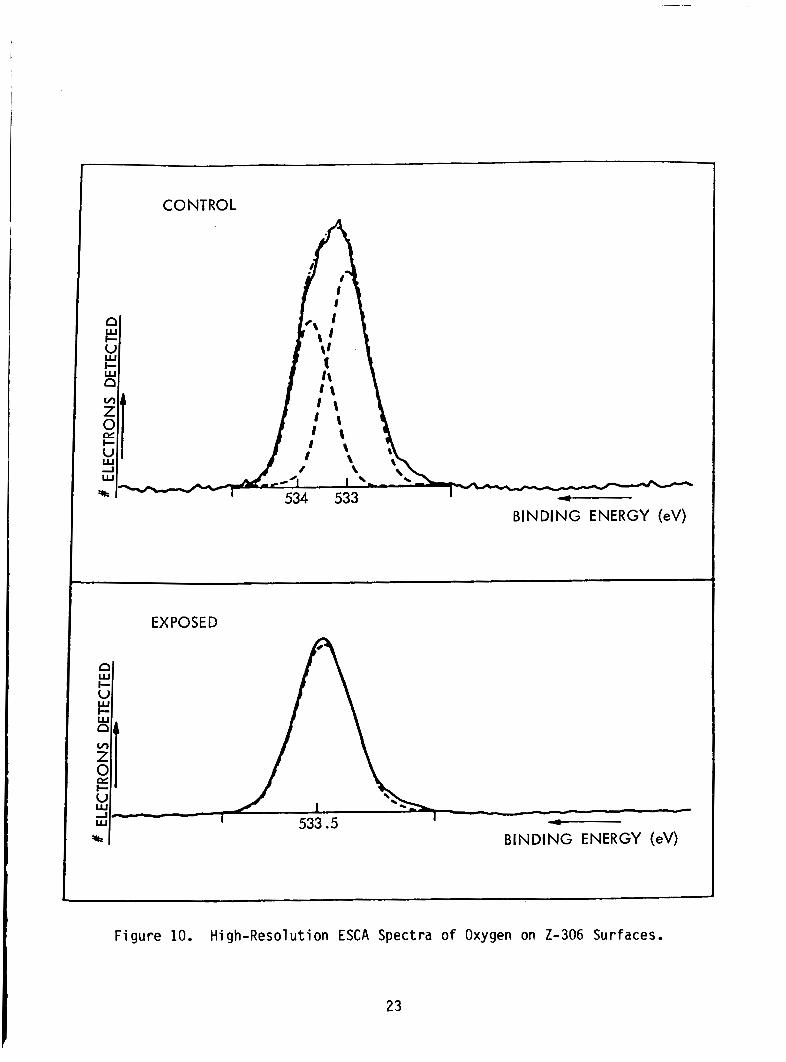
Surface composit ion o f t h e chemglaze p a i n t was a l s o t e s t d by ESCA Figures 9 and 10 are t h e h igh- reso lu t ion carbon and oxygen ESCA spectra o f
2-306, respect ive ly . The percent composit ion o f t h e surface i s summarized
i n Table X I I I .
21

r
CONTROL
EXPOSED
n w I-
286.5 284.5 - BINDING ENERGY (eV)
. Figure 9. High-Resolution ESCA Spectra o f Carbon on 2-306 Surfaces.
22
CONTROL
EXPOSED
F igure 10. High-Resolution ESCA Spectra o f Oxygen on 2-306 Surfaces.
23

Table X I I I . Surface Composition o f t h e 2-306 Paint Aboard STS VI11
% COMPOSITION
26
57
I I
-
2,
I I c1 c 2 C3
EXPOSED 6.5 11 -
O S i F N
T 1.6
C 1 : C-C C2: C-0 C3: 0-C=O S i = S i n 2
24

I V . DISCUSSION
The f o l l o w i n g generic model o f i n t e r a c t i o n o f organic mater ia ls w i t h
energet ic oxygen atoms has been developed based on t h e r e s u l t s o f t h e
physicochemical c h a r a c t e r i z a t i o n o f samples flown on STS VI11 (see Figure 11) :
When t h e polymer sur face (P) i s exposed t o an energet ic oxygen atom (O), a polymeric in termediate such as an oxide (PO o r P02) i s formed.
in termediate may then encounter another oxygen t o form e i t h e r PO2 o r a v o l a t i l e product (VI) p lus the o r i g i n a l polymer (P). PO2 may a l s o reac t
f u r t h e r w i t h oxygen t o form a d i f f e r e n t v o l a t i l e product ( V z ) , thus, re- generat ing t h e polymer. When v o l a t i l i z a t i o n o f t h e product occurs, i t
r e s u l t s i n mass loss and cont r ibu tes t o t h e weight loss experienced by most o f the samples flown (see Table 111). Therefore, t h e ex ten t o f
degradat ion o f samples i s c o n t r o l l e d by t h e amount o f oxide formed. The mode o f degradation, however, depends on t h e r a t e of dep le t ion o f oxides
(PO and POz). concentrat ion accumulating on t h e polymer surface w i l l be low and t h e
sample w i l l undergo weight loss, but w i t h no apparent changes i n bulk proper t ies.
The
I f the r a t e o f dep le t ion i s r e l a t i v e l y fas t , the oxygen
This appears t o be the case f o r Kapton (DuPont 500H).
The longer t h e oxides remain on t h e surface, t h e h igher the oxygen
concentrat ion and t h e lower t h e weight loss. however, i f t h e oxides remain long enough t o react chemical ly w i t h t h e
Bulk p roper t ies may change,
25
26
0, t
L 3 a
*?
t W 0,
0 2
-0 W -u 0 L
P E tu v)
L

I
polymer. ESCA data i n d i c a t e the re are chemical changes occur r ing on the
surface (50 A ) o f the polyethy lene f i l m . found on the sample sur face versus 0.8% on the unexposed side.
measurements, however, f a i l e d t o i n d i c a t e any change i n the bulk between the con t ro l and exposed f i lms .
A 10% oxygen composition was
Densi ty
Oxide concentrat ions were a l so ca l cu la ted from ESCA data f o r po ly -
su l fone and used as i n d i c a t o r s o f the oxygen bu i ldup on the sample sur- face. The surface o f t he po lysu l fone sample d isp layed a 7% increase i n oxygen content. There i s a l so a s i g n i f i c a n t change i n bulk p roper t i es i nd i ca ted by t e n s i l e s t r e s s - s t r a i n data. Teflon-coated Kapton (DuPont
F131), on the o ther hand, experienced no detectable l oss o f weight, which
may correspond t o a slow bu i ldup o f oxides on the surface. Rheovibron measurements showed a decrease i n the dynamic modulus o f 3.3 X lo5 ps i
between con t ro l and exposed sampl es . When analyz ing oxide concentrat ion measurements obtained from ESCA
data, a l l exposed samples ( w i t h the except ion o f PMMA) showed an oxygen
concentrat ion bui ldup. PMMA a lso experienced a l a r g e weight loss, bu t
w i t h l i t t l e chemical changes. Tensi le s t r e s s - s t r a i n data i n d i c a t e no ap-
p rec iab le d i f f e r e n c e between the con t ro l and exposed samples.
One theory t o exp la in these data i s t h a t PMMA i s known t o unzip under
c e r t a i n circumstances once degradat ion i s i n i t i a t e d . This would g ive r i s e t o weight loss, but w i t h no apparent chemical change on the sur face s ince
f resh PMMA chains are always brought t o the surface as these ox id ized chains undergo depolymerizat ion and subsequent removal through evapora-
t i o n . chain.
The mechanism a t p lay here seems t o be the unz ipp ing o f the polymer
The chemical composition o f the 2-306 chemglaze con t ro l surface i s
what one would expect o f the pa in t .
urethane embedded w i t h s i l i c a . Fur ther ana lys is o f t he oxygen s i t e s i n
the con t ro l sur face i nd i ca tes t h a t both carbonyls and C - 0 (esters , e thers )
are present. The eroded surface, i n cont ras t , i s 70 t o 80% SiOx. It a l s o
This p a i n t i s a c a r b o n - f i l l e d po ly -
27
contains minor amounts o f carbonyl groups and some f l u o r i d e . i n d i c a t e t h a t t h e erosion proceeds u n t i l a continuous l a y e r o f SiOx i s
l e f t on t h e sur face, thus, provid ing p r o t e c t i o n from f u r t h e r a t t a c k by t h e
energet ic oxygen atoms.
These data
28

I
V. CONCLUSION
A set o f polymeric f i l m s were exposed t o the low-earth o r b i t a l env i -
ronment aboard STS V I I I . Pre- and p o s t - f l i g h t cha rac te r i za t i on s tud ies
were performed on each sample. These s tud ies i nd i ca ted t h a t :
1) A res idua l ox id ized l a y e r was found on most, but no t a l l , sam-
ples. The composition o f t h i s l a y e r and i t s th ickness r e f l e c t e d the o v e r a l l mechanism o f i n t e r a c t i o n o f these ma te r ia l s w i th
atomic oxygen, lead ing t o erosion.
2) Cer ta in samples, such as polysul fone, showed changes i n bu lk p roper t ies , wh i l e o ther samples, such as PMMA, showed no change
i n bu lk p roper t ies , desp i te s u f f e r i n g considerable erosion.
3 ) There was evidence of secondary ox ida t i on i n some samples, caused by i n t e r a c t i o n o f atomic oxygen w i t h the ox id ized layer .
More d e t a i l e d studies, espec ia l l y i n c l u d i n g i n - s i t u mon i to r ing o f
v o l a t i l e degradat ion products, are needed t o f u r t h e r e luc ida te the mechan-
ism o f t he eros ion process.
29
V I . REFERENCE
1. Leger, L. J., V isent ine , J. T., and Kuminecz, J. F., "Low Earth
O r b i t Atomic Oxygen E f f e c t s on Surfaces," A I A A Paper 84-0548,
January, 1984.
31