mechanics of self-healing thermoplastic elastomers
TRANSCRIPT

Journal of the Mechanics and Physics of Solids 137 (2020) 103831
Contents lists available at ScienceDirect
Journal of the Mechanics and Physics of Solids
journal homepage: www.elsevier.com/locate/jmps
Mechanics of self-healing thermoplastic elastomers
Kunhao Yu, An Xin, Zhangzhengrong Feng, Kyung Hoon Lee, Qiming Wang
∗
Sonny Astani Department of Civil and Environmental Engineering, University of Southern California, Los Angeles, CA 90089, United States
a r t i c l e i n f o
Article history:
Received 5 August 2019
Revised 27 November 2019
Accepted 15 December 2019
Available online 23 December 2019
Keywords:
Self-healing mechanics
Thermoplastic elastomer
Diffusion-reaction model
Constitutive modeling
Polyurethane
a b s t r a c t
Self-healing polymers crosslinked by dynamic bonds have shown great potential in various
engineering applications ranging from electronics to robotics. Due to the intrinsic weak-
ness of dynamic bonds, most of the existing self-healing polymers have relatively weak
mechanical strengths. To address this drawback, it is proposed to incorporate crystalline
domains within the polymer matrix during the synthesis to make tough and strong self-
healing thermoplastic elastomers with semi-crystalline phases. Despite the success in the
polymer synthesis, the theoretical understanding of self-healing thermoplastic elastomers
remains elusive. In this paper, we develop a theoretical framework to model the consti-
tutive and healing behaviors of self-healable thermoplastic elastomers with both dynamic
bonds and semi-crystalline phases. We model the virgin thermoplastic elastomer by using
a spring-dash model that couples the soft rubbery phase and the stiff crystalline phase.
The rubbery polymer network is formed by layering the body-centered unit cubes that link
polymer chains via dynamic bonds. Then, the healing is considered as a coupling of poly-
mer chain diffusion and dynamic-bond binding, leading to an effective diffusion-reaction
model. Based on the theoretical framework, we can model the stress-strain behavior of the
virgin and healed polymers and theoretically explain the relationship between the healing
strength and the healing time. The model can consistently explain our own experiments
on self-healable thermoplastic elastomers polyurethane and the documented experiments
on self-healable thermoplastic elastomers with disulfide bonds and π- π interactions.
© 2019 Elsevier Ltd. All rights reserved.
1. Introduction
Self-healing polymers with dynamic bonds have been used in a broad range of engineering applications, such as flex-
ible electronics ( Tee et al., 2012 ), energy storage ( Wang et al., 2013b ), biomaterials ( Brochu et al., 2011 ), and robotics
( Terryn et al., 2017 ). The healing mechanism primarily relies on the reversible nature of dynamic bonds, i.e., reforming when
the fractured materials are contacted. The dynamic bonds include dynamic covalent bonds ( Chen et al., 2002 ; Ghosh and Ur-
ban, 2009 ; Imato et al., 2012 ; Lu and Guan, 2012 ; Skene and Lehn, 2004 ), hydrogen bonds ( Chen et al., 2012 ; Cordier et al.,
2008 ; Montarnal et al., 2009 ; Phadke et al., 2012 ; Sijbesma et al., 1997 ; Wang et al., 2013a ), ionic bonds ( Das et al., 2015 ;
Haraguchi et al., 2011 ; Ihsan et al., 2016 ; Mayumi et al., 2016 ; Sun et al., 2012 ; Sun et al., 2013 ; Wang et al., 2010 ),
metal-ligand coordinations ( Burnworth et al., 2011 ; Holten-Andersen et al., 2011 ; Kersey et al., 2007 ; Nakahata et al., 2011 ;
Rowan and Beck, 2005 ; Wang et al., 2013b ), host-guest interactions ( Liu et al., 2017a ; Liu et al., 2017b ), hydrophobic inter-
actions ( Gulyuz and Okay, 2014 ; Okay, 2015 ), and π- π interactions ( Fox et al., 2012 ).
∗ Corresponding author.
E-mail address: [email protected] (Q. Wang).
https://doi.org/10.1016/j.jmps.2019.103831
0022-5096/© 2019 Elsevier Ltd. All rights reserved.

2 K. Yu, A. Xin and Z. Feng et al. / Journal of the Mechanics and Physics of Solids 137 (2020) 103831
Fig. 1. (a) Schematics to show the healing process. (b) Schematics to show the molecular structures around the healing interface during the healing process.
An evident drawback of most of the existing self-healing polymers enabled by dynamic bonds (primarily elastomers and
hydrogels) is that their mechanical strengths are typically much weaker than polymers with permanent covalent bonds, be-
cause the strength of a dynamic bond is typically much weaker than that of a permanent covalent bond ( Chen et al., 2012 ).
To address this drawback, it is proposed to incorporate crystalline domains within the polymer matrix to make tough and
strong self-healing thermoplastic elastomers with semi-crystalline phases ( Chang et al., 2018 ; Chen et al., 2012 ; Ghosh and
Urban, 2009 ; Jian et al., 2018 ; Ling et al., 2018 ; Liu et al., 2017c ; Xu and Chen, 2016 ; Zhang et al., 2017 ). These tough
self-healing polymers overcome the low-stiffness-drawback of existing soft self-healing elastomers or hydrogels. Despite the
synthesis success, the theoretical understanding of the mechanics of self-healing thermoplastic elastomers has been left be-
hind. The theoretical understanding should include two parts: (1) the modeling of the constitutive behaviors and (2) the
modeling of the self-healing behaviors. In the first part, though the constitutive behaviors of the thermoplastic elastomers
with permanent covalent bonds have been modeled ( Ames et al., 2009 ; Anand et al., 2009 ; Boyce et al., 2001 ; Boyce et al.,
1988 ; Boyce et al., 1989 ; Cho et al., 2017 ; Qi and Boyce, 2005 ), it remains elusive how to understand the constitutive behav-
iors of the self-healing thermoplastic elastomers with dynamic bonds that can be dissociated by the applied force. In the
second part, though we have recently proposed several models to understand the self-healing of self-healable soft polymers
in the amorphous state ( Wang and Gao, 2016 ; Wang et al., 2017 ; Xin et al., 2019 ; Yu et al., 2018 , 2019 ), it remains elusive
how to model the coupling of dynamic bonds, amorphous phase, and crystalline phase within the semi-crystalline polymer
network.
Here, we propose a theoretical framework to model the constitutive and self-healing behaviors of self-healable ther-
moplastic elastomers with both dynamic bonds and crystalline phases. A typical healing experiment is shown in Fig. 1 . A
thermoplastic elastomer is first cut/broken into two parts, and then immediately brought into contact at a given tempera-
ture for a certain period of healing time. The healed sample is then uniaxially stretched until the sample rupture. The tensile
stress-strain behavior of the virgin sample will be first modeled by considering both the coupling of the rubbery phase and
the crystalline phase and the force-induced dissociation of the dynamic bonds. Then, a diffusion-reaction model will be
considered to model the interfacial healing process. Finally, considering the healed sample as a composite with two virgin
segments and a small healing segment, we model the stress-strain behavior of the healed sample and then theoretically
explain the relationship between the healing strength and the healing time. Effects of the crystallinity fraction, the chain
length of the rubbery phase, and the chain mobility on the stress-strain or healing behaviors will be studied. The model can
consistently explain our own experiments on self-healable thermoplastic elastomers polyurethane with dynamic disulfide

K. Yu, A. Xin and Z. Feng et al. / Journal of the Mechanics and Physics of Solids 137 (2020) 103831 3
bonds. The model can also consistently explain others’ experimental results on self-healable thermoplastic elastomers with
disulfide bonds and π- π interactions.
The plan of the paper is as follows: Section 2 introduces our experiments on self-healable polyurethanes. In Section 3 ,
we present the theoretical model system by considering first the constitutive model of the virgin polymer with dynamic
bonds, then the interfacial healing process, and finally the stress-strain behavior of the healed polymer. In Section 4 , we
show the theoretical results for both the virgin and healed polymer. Effects of the crystallinity fraction, the chain length of
the rubbery phase and the chain mobility on the stress-strain or healing behaviors will be studied. In Section 5 , we will
compare our experimental results on the self-healable polyurethanes with the theoretically calculated results. In Section 6 ,
we will use the theoretical model to further explain others’ experimental data of self-healable thermoplastic elastomers. The
conclusive remarks will be presented in Section 7 .
2. Experimental
The self-healing thermoplastic elastomers were prepared by preheating 0.00829 mole Polytetramethylene ether glycol
(PTMEG, molar mass 250, 10 0 0, and 1810 g/mol) at 90 °C and bubbled with nitrogen for 1 h to remove water and oxy-
gen. 7.369 g isophorone diisocyanate (IPDI), 5 g dimethylacetamide (DMAc) and 0.15 g dibutyltin dilaurate (DBTDL) were
mixed with the preheated PTMEG at 70 °C under magnetic stirring for 1 h. Then, a solution with 20 g DMAc and 2.557 g
2-Hydroxyethyl disulfide (HEDS) was added drop-wisely to the mixture with magnetic stirring for another 1 h. To com-
plete the synthesis, 2.147 g 2-Hydroxyethyl methacrylate (HEMA) was mixed with the mixture at 40 °C for 1 h. During the
synthesis process, nitrogen was bubbled in the solution to prevent the reaction between the mixture and the oxygen. The
obtained solution was put in a vacuum chamber for 12 hours to evaporate 90% of solvent and then mixed with 1 w.t% trib-
utylphosphine (TBP, catalyst), 1 w.t% phenylbis(2,4,6-trimethylbenzoyl)phosphine oxide (photoinitiator) and 0.01~ 0.02 w.t%
Sudan I (photoabsorber) for 2 h. The solution was then used for the projection-based additive manufacturing process to
print the thermoplastic elastomer samples. Prepared samples were post-cured for one hour in a UV chamber to enable the
full photopolymerization of the material and were heated for 12 h at 40 °C to remove the residual solvent inside the ma-
terial matrix. Note that all chemicals were purchased from Sigma-Aldrich, USA and were commercially available without
further purification.
The prepared strip samples (length 20 mm, width 5 mm, and thickness 1 mm) were first cut into two pieces with a sharp
blade and then contact back immediately with clamped on two ends to ensure good contact during the healing process
( Fig. 2 a). The samples were then healed under 80 °C for various healing time. Note that the glass transition temperatures
Fig. 2. (a) Image sequence to show a self-healing process of a strip polymer sample. The healed sample (0.5 g) can sustain a weight of 200 g. (b) Microscope
images to show the fractured and healed interfaces. (c) Tensile stress-strain curves of virgin and healed polymers with various healing time. (d) Healing
strength ratios of the healed polymers in functions of the healing time. The healing strength ratio is defined as the tensile strength of the healed polymer
normalized by the tensile strength of the virgin polymer. The shadow areas in d indicate the healing time corresponding to 90% healing strength ratio.
Scale bars in a represent 4 mm. Scale bars in b represent 300 μm.

4 K. Yu, A. Xin and Z. Feng et al. / Journal of the Mechanics and Physics of Solids 137 (2020) 103831
for polymers with PTMEG 250, 10 0 0, and 1810 g/mol are 65–71 °C, 39 °C, and below 25 °C, respectively (Fig. S1). At
80 °C, all these polymers are in the rubbery state during the healing. The optical microscope (Nikon ECLIPSE LV100ND) was
used to monitor the healed surface. The microscopic images show that the fractured interface can be nicely healed during
the healing process ( Fig. 2 b). The healed strip sample can sustain a weight of 50 g that is 200 times its own weight (0.25 g)
( Fig. 2 a). The mechanical behavior of both virgin and healed samples was tested using Instron (Model 5942) to uniaxially
stretch the samples with a strain rate of 0.06 s-1 until ruptures ( Fig. 2 c). The tensile stress corresponding to the rupture is
considered as the tensile strength of the polymer. The tensile strengths of the self-healed samples for various healing time
were normalized by the tensile strength of the virgin sample are calculated as the healing strength ratios, which were then
plotted as a function of the healing time ( Fig. 2 d). On the contrary, the control polymers without disulfide bonds (PTMEG
250 g/mol) could not bond together after the healing experiments at 80 °C for 18 h (Fig. S2).
3. Theoretical model
3.1. Overview of the material system
The overall process is shown in Fig. 1 a and the molecular structure is modeled as Fig. 1 b. We consider that the thermo-
plastic elastomer is composed of both soft rubbery phase with amorphous polymer chains and stiff crystalline phase with
folded polymer segments ( Fig. 1 b). Effectively, the stiff crystalline phase resembles nanoparticles and each of them bridges
a number of polymer chains. Literally, the dynamic bonds can be located within the rubbery phase or crystalline phase.
For the sake of analysis simplicity, we here assume that dynamic bonds are only located around the interface between the
rubbery phase and the crystalline phase. This assumption can reveal the key physics of the problem, and at the same time
significantly reduce the complexity of the problem. Under a sufficiently large force (such as stretching to deform globally
and cutting to deform a spot locally), the dynamic bonds between the amorphous chains and the crystalline domain will be
forced to broken. When a dynamic bond is broken, it becomes two open distal groups attaching on respective parts. When
a sufficiently amount of dynamic bonds are broken, a crack will emerge, or the polymer will be fractured into two pieces.
When two fractured pieces are brought into contact with an adequate temperature condition, we assume that the dissoci-
ated polymer chain with open distal group will diffuse into the other matrix to find another open distal group to reform
the dynamic bond.
3.2. Constitutive model of the virgin thermoplastic elastomer
Following Boyce, Parks, and other authors ( Boyce et al., 2001 ; Boyce et al., 1988 ; Boyce et al., 1989 ; Cho et al., 2017 ;
Qi and Boyce, 2005 ), we employ a spring-dash model to analyze the large-deformation of the thermoplastic elastomer
( Fig. 3 ). The thermoplastic elastomer consists of two phases ( Fig. 3 a,b): The soft rubbery phase is modeled as nonlinear
springs (A and B) and the stiff crystalline phase is modeled as an elastic spring (C) in series with a plastic dash pot (D).
To consider the connection between the rubbery phase and the crystalline phase, we consider a general dash-spring model
Fig. 3. (a) Schematics to show the molecular structure of thermoplastic elastomer. (b) Schematics to show the proposed spring-dash model for the ther-
moplastic elastomer. A and B are nonlinear springs that present for the soft rubbery phase. C is an elastic spring present for the stiff crystalline phase in
series with a plastic dash pot D.

K. Yu, A. Xin and Z. Feng et al. / Journal of the Mechanics and Physics of Solids 137 (2020) 103831 5
( Fig. 3 b). In the model, the rubbery phase is divided into two parts: part A is in series with the crystalline phase C-D, and
part B is in parallel with the element A-C-D. The volume fraction of the crystalline phase (CD) within the thermoplastic
elastomer matrix is P CD , and the volume fraction of element A within the rubbery phase is ηA .
The overall deformation gradient of the thermoplastic elastomer F can be expressed as
F = F B = F A F CD (1)
where F A , F B , and F CD are the deformation gradients of elements A, B, and C-D, respectively. According to the schematic
layout, the deformation gradient F CD can be decomposed into two parts as
F CD = F C F D (2)
where F C and F D are the deformation gradient of the spring element C and the dash pot element D, respectively.
Accordingly, the overall Cauchy stress of the thermoplastic elastomer T can be written as
T = T
B + T
A = T
B + T
CD (3)
where T A , T B , and T CD are the Cauchy stresses of elements A, B, and C-D, respectively. Due to the in-series configuration, the
Cauchy stress of element A and element C-D should be equal, namely,
T
A = T
CD = T
C = T
D (4)
where T C and T D are the Cauchy stresses of the spring element C and the dash element D, respectively.
3.2.1. Rubbery polymer network
Following the essential idea of polymer-network theories ( Erman and Mark, 1997 ; Rubinstein and Colby, 2003 ;
Treloar, 1975 ), we assume the rubbery polymer network is constructed by layering unit cubes to span over the whole volume
(unit cube shown in Fig. 4 a). In each unit cube, crystals are located at the corners and centers in a body-centered fashion
( Fig. 4 a). The corner and center crystals form a crystal pair, and polymer chains with inhomogeneous lengths attach be-
tween the crystal pair with dynamic bonds ( Fig. 4 a). Between a crystal pair, we assume that N polymer chains are attached
( Fig. 4 b), each polymer chain made of freely-jointed Kuhn segments with each segment length b ( Erman and Mark, 1997 ;
Rubinstein and Colby, 2003 ; Treloar, 1975 ). We assume that the polymer chains can be classified into m types, each with
the same Kuhn number. We denote the Kuhn number (chain length) of the i th type polymer chain as n i , and the number
of i th type chains as N i , where 1 ≤ i ≤ m and n 1 ≤ n 2 ≤ ... n i ... ≤ n m
. The i th chain number follows a statistical distribution
written as ( Fig. 4 c)
P i ( n i ) =
N i ∑ m
i =1 N i
=
N i
N
(5)
where N =
∑ m
i =1 N i is the total chain number. We here consider a log-normal distribution function as ( Wang et al., 2015 )
P i ( n i ) =
1
n i δ√
2 πexp
[− ( ln n i − ψ )
2
2 δ2
](6)
where ψ and δ are the mean and standard deviation of ln n i , respectively. ψ denotes logarithm of the average chain length,
and δ indicates the chain distribution width.
We then consider the deformation of a single chain, the i th chain. In the freely-joint state, the average end-to-end dis-
tance of the i th chain is
r 0 i =
√
n i b (7)
Fig. 4. Proposed network model of the thermoplastic elastomer. (a) The polymer consists of layered unit cubes. (b) Crystals are located at the corners and
centers in a body-centered fashion. (c) Between a crystal pair, polymer chains with inhomogeneous lengths are attached to the crystal surfaces via dynamic
bonds.

6 K. Yu, A. Xin and Z. Feng et al. / Journal of the Mechanics and Physics of Solids 137 (2020) 103831
Under deformation, the end-to-end distance of the i th chain becomes r i , and the stretch of the i th chain can be expressed
as
�i =
r i
r 0 i
(8)
We approximate the end-to-end distance of i th chain at the fabricated state as the distance between a crystal pair L ,
written as,
r 0 i = L (9)
The distance between a crystal pair L can be estimated by using the volume fraction of the crystalline phase P CD . The
volume fraction of the crystalline phase is estimated as
P CD =
(8 πd 3
3
)/(2 L + 2 d √
3
)3
(10)
where d is the average diameter of the crystalline phase. Using Eq. (10) , the crystal pair distance L is calculated as
L =
[ (√
3 π
P CD
)1 / 3
− 1
]
d (11)
At the deformed state, the rubbery phase has a deformation gradient F A or F B . We assume that the deformation of
the body-centered cube follows the affined deformation assumption ( Arruda and Boyce, 1993 ; Rubinstein and Colby, 2003 ;
Treloar, 1975 ). Therefore, the distance of the crystal pair at the deformed state becomes
r i = L
√
I 1 3
(12)
where the strain invariant I 1 is
I 1 = trace
(F A F A
T )
or trace
(F B F B
T )
(13)
The stretch of the i th chain can be calculated as
�i =
r i √
n i b =
√
I 1 3
L √
n i b (14)
The chain force on the i th chain at the current state is
f i =
k B T
b �−1
(r i
n i b
)=
k B T
b �−1
( √
I 1 3
L
n i b
)
(15)
where �−1 () is the inverse Langevin function, and the Langevin function can be written as �(x ) = coth x − 1 /x . k B is Boltz-
mann constant and T is the absolute temperature in Kelvin.
For the original material, the initial number of i th chain per unit material volume is N i . This i th chain density will
decrease to N
a i
as the material deforms because the chain force will motivate the dissociation of the dynamic bond between
the chain and the crystal. To model the binding kinetics of the dynamic bond, we denote the reaction from the dissociated
state to the associated state as the forward reaction, and otherwise as the reverse reaction. We further denote the associated
i th chain number per unit volume as N
a i
and the dissociated i th chain number per unit volume as N
d i
. The binding reaction
kinetics can be written as
dN
a i
dt = k f
i N
d i + k r i N
a i (16)
where k f i
and k r i
are forward and reverse reaction rates at the deformed state, respectively. Following the Bell’s model, we
can write the chain-force-dependent reaction rates as ( Bell, 1978 ; Ribas-Arino and Marx, 2012 ; Xin et al., 2019 ; Yu et al.,
2018 , 2019 )
k f i
= k f 0 i
exp
(− f i �x
k B T
)(17)
k r i = k r0 i exp
(f i �x
k B T
)(18)
If the loading is applied quasi-statically, the active ith chain volume density N
a i
can be calculated as a function of the
applied chain force,
N
a i =
N i k f 0 i
exp
(− f i �x
k B T
)k r0
i exp
(f i �x k T
)+ k f 0
i exp
(− f i �x
k T
) (19)
B B

K. Yu, A. Xin and Z. Feng et al. / Journal of the Mechanics and Physics of Solids 137 (2020) 103831 7
Fig. 5. Deformation of the viscoelastic-plastic element in element C and D.
As shown in Fig. 4 , one cubic element averagely involves 2 crystals and 8 crystal pairs. The crystal number per unit
volume can be estimated as
ηc =
3 P CD
4 πd 3 (20)
The number of crystal pairs per unit volume is 4 ηc . Therefore, the free energy density of stretching the polymer network
of the deformed original-polymer can be expressed as
W R =
3 P CD
πd 3
m ∑
i =1
(n i k B T
[βi
tanh βi
+ ln
(βi
sinh βi
)]N
a i
)(21)
where βi = �−1 ( �i / √
n i ) = �−1 ( √
I 1 / 3 L/ ( n i b ) ) .
3.2.2. Visco-elasto-plastic element
The viscoelastic-plastic element is composed of an elastic spring element C and a viscoplastic dash pot element D. The
deformation of the two elements can be simply decomposed into two steps: first the plastic flow (element D) and the elastic
deformation (element C) ( Fig. 5 ).
As the plastic flow is incompressible, we have
J D = det (F D
)= 1 (22)
Therefore, we have
J CD = det (F C
)(23)
The Cauchy stress of C-D element can be calculated as ( Boyce et al., 2001 ; Boyce et al., 1988 ; Boyce et al., 1989 ; Cho et al.,
2017 ; Qi and Boyce, 2005 )
T
CD =
1
det (F C
)R
C M
C R
C (24)
where R
C is the rotation tensor that can be obtained through the polar decomposition of the deformation gradient, obtained
from
F C = R
C U
C (25)
where U
C is the elastic stretch tensor. The Mandel stress M
C is given by ( Boyce et al., 2001 ; Boyce et al., 1988 ; Boyce et al.,
1989 ; Cho et al., 2017 ; Qi and Boyce, 2005 )
M
C =
E C (1 + νC
) ln U
C +
(
E C
3
(1 − 2 νC
) − E C
3
(1 + νC
))
tr (ln U
C )I (26)
where E C and νC are Young’s modulus and Poisson’s ratio of element C, respectively; and I is the identity tensor.
The evolution of the plastic flow is given by
·F
D
= D
D F D (27)
where the flow rule is
D
D =
1 νD
M
D d (28)
2 τ

8 K. Yu, A. Xin and Z. Feng et al. / Journal of the Mechanics and Physics of Solids 137 (2020) 103831
where M
D d
= M
C − tr (M
C ) I / 3 is the deviator of M
C , and the equivalent plastic shear strain rate νD is modeled as ( Boyce et al.,
2001 ; Cho et al., 2017 ; Qi and Boyce, 2005 ; Qi et al., 2008 )
νD = ν0 exp
[−�G p
k B T
(1 − τ̄
Y
)](29)
And the equivalent shear stress is
τ =
√
1
2
M
D d
: M
D d
(30)
The evolution of the deformation resistance Y is modeled as
˙ Y = h ( Y sat − Y ) νD (31)
where Y sat is a saturation level of the deformation resistance.
3.2.3. Stress-strain under uniaxial stretch
We assume the rubbery phases are nearly incompressible with the deformation as
d et ( F ) = d et (F B
)≈ 1 (32)
when the material is under a large-strain uniaxial tension with stretch λ1 = λ, the total deformation gradient can be written
as
F =
⎡
⎢ ⎣
λ
λ−1 / 2
λ−1 / 2
⎤
⎥ ⎦
(33)
At a given uniaxial stretch λ, we assume the deformation of the element A as
F A =
⎡
⎢ ⎣
λA
λA −1 / 2
λA −1 / 2
⎤
⎥ ⎦
(34)
The deformation gradient of element C-D is
F CD =
⎡
⎢ ⎢ ⎣
λλA −1
λ−1 / 2 λA 1 / 2
λ−1 / 2 λA 1 / 2
⎤
⎥ ⎥ ⎦
(35)
At a given F , F A can be determined by using T A = T CD , where T CD is calculated by Section 3.2.2 using the deformation
gradient F CD .
When the element B is under a uniaxial tension with F B = F , the Cauchy stress along the stretching direction can be
calculated as
T B 1
(λB
)=
3 P CD
πd 3 k B T
L
b
(λB 2 − λB −1
) m ∑
i =1
(
N
a i βB
i √
3 I B 1
)
(36)
where I B 1
= tr (F B F B T ) and βB
1 = �−1 ( L/ ( n i b )
√
I B 1 / 3 ) .
Combining the Cauchy stress T B , we can obtain the overall Cauchy stress as
T = T
B + T
A = T
B + T
CD (37)
which can be written as a function of the deformation gradient F . It is expected that the stresses should first increase and
then decrease with increasing strains, with a peak point in the middle. In the strain-controlled tensile testing experiment,
the peak point is corresponding to a breaking, and the corresponding stress is the tensile strength.
3.3. Interfacial self-healing model
The sample is first cut into two parts, and then immediately brought into contact to heal the interface ( Fig. 6 a). During
the cutting process, the dynamic bonds that crosslink the polymer chains in the rubbery elements A and B will be disso-
ciated by the large force induced by the cutting ( Fig. 6 b). We assume one distal group of the chain is dissociated from a
binding site that is within the matrix, and then this distal group will be pulled out of the matrix to the fracture interface.
Since the healing experiment is carried out immediately after the cutting, we assume the open distal group on the chain

K. Yu, A. Xin and Z. Feng et al. / Journal of the Mechanics and Physics of Solids 137 (2020) 103831 9
Fig. 6. (a) Schematics to show the molecular structures during the healing process. (b) Schematics to show the dissociation and re-association of spring
elements during the cutting and healing process, respectively. (c) A schematic to show the diffusion of the i th polymer chain across the interface.
will still be located around the interface at the very beginning of the healing process, primarily because the migration of
the chain and its distal group takes substantial time. During the healing process, the polymer chain with the open distal
group will gradually diffuse cross the interface to find the binding site to reform the dynamic bond. Once the dynamic bond
is reformed (or re-associated), the polymer chain becomes active and can sustain loading forces.
3.3.1. Healing process of the ith chain
The re-binding process of the i th chain involves the chain diffusion and distal group reaction ( Fig. 6 c). The radical-assisted
binding will facilitate the chain diffusion to cross the healing interface. Therefore, these two processes are strongly coupled.
The chain diffusion can be modeled by following a snake reptation model proposed by De Gennes ( De Gennes, 1979 ;
de Gennes, 1971 ; Doi and Edwards, 1978 ; Rubinstein and Colby, 2003 ). The basic idea is that the polymer chain is con-
strained by the polymer matrix so it can only reptate along a primitive tube ( Doi and Edwards, 1988 ). The primitive tube
length is L c , so the original chain is divided into n i segment with each segment length
b c =
L c
n i
(38)
At each small time step, the chain is considered to jump by a step length b c in a random-walk fashion. In the original
reptation model, the tube length is considered as smaller than the contour length of the i th chain, i.e., L c ≤ n i b ; because
the chain may coil around the reptation tube. Subsequently, the jump step b c is considered as an unknown parameter. Here,
we make a bold assumption that the contour length of the i th chain is approximately equal to the reptation tube length;
therefore, the jump step length
b c ≈ b (39)
The motion of the polymer chain is enabled by extending out small segments called “minor chains” ( Fig. 6 c). The curvi-
linear motion of the polymer chain is characterized by the Rouse friction model with the curvilinear diffusivity of the i th
chain expressed as
D i =
k B T
n i ξ(40)
where ξ is the Rouse friction coefficient per unit Kuhn segment, k B is the Boltzmann constant, and T is the temperature in
Kelvin.
As shown in Fig. 6 c, we assume the end-to-end distance of the i th chain is L . Without loss of generality, we assume
the cutting position is located in the middle of the chain; thus, the distance between the healing interface and the binding
site is L /2. This assumption is just for the sake of analysis simplicity; other location may also work but may involve more
complicated statistic averaging algorithm. As shown in Fig. 6 c, the distal group will diffuse cross the normal distance L /2 fol-
lowing a curvilinear pathway. To facilitate the analysis, we construct two coordinate systems: s denotes the curvilinear path
along the minor chains, and y denotes the linear path from the interface to the binding site. When the i th chain moves s idistance along the curvilinear path, it is corresponding to y i distance along y coordinate. Here we assume the selection
of the curvilinear path is stochastic in a random-walk fashion ( Kim and Wool, 1983 ; Whitlow and Wool, 1991 ; Zhang and
Wool, 1989 ). Therefore, the conversion of the distances in two coordinate systems is expressed as ( de Gennes, 1971 ; Doi and
Edwards, 1988 )
y i =
√
s i b c ≈√
s i b (41)
10 K. Yu, A. Xin and Z. Feng et al. / Journal of the Mechanics and Physics of Solids 137 (2020) 103831
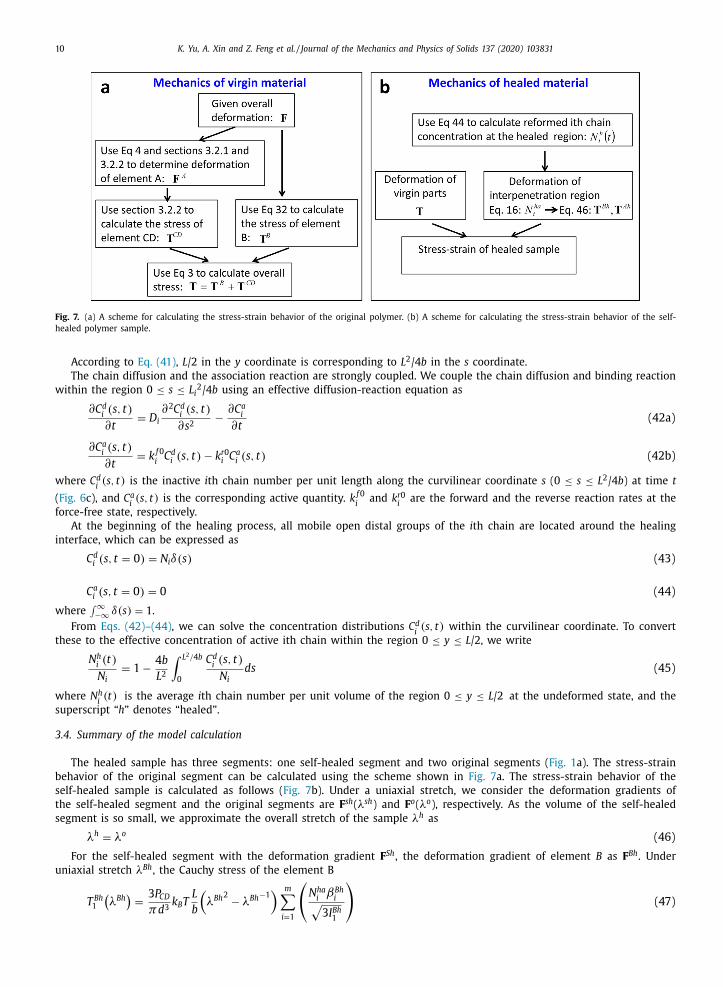
Fig. 7. (a) A scheme for calculating the stress-strain behavior of the original polymer. (b) A scheme for calculating the stress-strain behavior of the self-
healed polymer sample.
According to Eq. (41) , L /2 in the y coordinate is corresponding to L 2 /4 b in the s coordinate.
The chain diffusion and the association reaction are strongly coupled. We couple the chain diffusion and binding reaction
within the region 0 ≤ s ≤ L i 2 /4 b using an effective diffusion-reaction equation as
∂C d i ( s, t )
∂t = D i
∂ 2 C d i ( s, t )
∂ s 2 − ∂C a
i
∂t (42a)
∂C a i ( s, t )
∂t = k f 0
i C d i ( s, t ) − k r0
i C a i ( s, t ) (42b)
where C d i ( s, t ) is the inactive i th chain number per unit length along the curvilinear coordinate s (0 ≤ s ≤ L 2 /4 b ) at time t
( Fig. 6 c), and C a i ( s, t ) is the corresponding active quantity. k
f 0 i
and k r0 i
are the forward and the reverse reaction rates at the
force-free state, respectively.
At the beginning of the healing process, all mobile open distal groups of the i th chain are located around the healing
interface, which can be expressed as
C d i ( s, t = 0 ) = N i δ( s ) (43)
C a i ( s, t = 0 ) = 0 (44)
where ∫ ∞
−∞
δ(s ) = 1 .
From Eqs. (42)–(44) , we can solve the concentration distributions C d i ( s, t ) within the curvilinear coordinate. To convert
these to the effective concentration of active ith chain within the region 0 ≤ y ≤ L /2, we write
N
h i ( t )
N i
= 1 − 4 b
L 2
∫ L 2 / 4 b
0
C d i ( s, t )
N i
ds (45)
where N
h i (t) is the average i th chain number per unit volume of the region 0 ≤ y ≤ L /2 at the undeformed state, and the
superscript “h ” denotes “healed”.
3.4. Summary of the model calculation
The healed sample has three segments: one self-healed segment and two original segments ( Fig. 1 a). The stress-strain
behavior of the original segment can be calculated using the scheme shown in Fig. 7 a. The stress-strain behavior of the
self-healed sample is calculated as follows ( Fig. 7 b). Under a uniaxial stretch, we consider the deformation gradients of
the self-healed segment and the original segments are F sh ( λsh ) and F o ( λo ), respectively. As the volume of the self-healed
segment is so small, we approximate the overall stretch of the sample λh as
λh = λo (46)
For the self-healed segment with the deformation gradient F Sh , the deformation gradient of element B as F Bh . Under
uniaxial stretch λBh , the Cauchy stress of the element B
T Bh 1
(λBh
)=
3 P CD
πd 3 k B T
L
b
(λBh 2 − λBh −1
) m ∑
i =1
(
N
ha i
βBh i √
3 I Bh 1
)
(47)

K. Yu, A. Xin and Z. Feng et al. / Journal of the Mechanics and Physics of Solids 137 (2020) 103831 11
where I Bh 1
= tr (F Bh F Bh T ) and βBh 1
= �−1 ( L/ ( n i b )
√
I Bh 1
/ 3 ) . At a given F Sh , we will employ T Bh = T A + T CD to determine F Bh . Then
the overall stress-strain behavior of the healed segment can be determined.
Along the stretching direction, we consider that the Cauchy stress of the self-healed segment and the original segment
should be equal, written as
T Bh 1
(λBh
)= T B 1
(λBo
)(48)
where T Bh 1
( λBh ) is given by Eq. (47) and T B 1 ( λBo ) is given by Eq. (36); and λBo is determined using λo and Eq. (3) . From the
above equations, we can eventually calculate the overall stress-strain behavior of the self-healed sample ( Fig. 7 b).
When the temperature increases from the room temperature to the healing temperature (e.g., 80 °C), the crystalline
phase will undergo a phase transition to transfer to the rubbery phase. However, we do not need to consider the phase
transition in our modeling system. It is because of the following reasons: (1) We only test the stress-strain behavior of
polymers at room temperature, that is, virgin polymers at room temperature and healed polymer at room temperature. The
crystalline phase would transfer to the rubbery phase at 80 °C, but will transfer back to the crystalline phase at room
temperature. (2) We here assume that only the rubbery phase is fractured before healing ( Fig. 6 b). Then, during the healing
process, only the polymer chains within the rubbery phase interpenetrate into the other matrix.
4. Theoretical results
In this section, we will present the theoretical results calculated from the model presented in Section 3 . We will first
show the stress-strain behavior of the virgin thermoplastic elastomer and study the effect of the phase fraction on the stress-
strain behavior of the virgin material. Then, we will study the stress-strain behavior of the healed material and examine the
effects of chain length and chain mobility on the self-healing behavior.
4.1. Stress-strain of the virgin thermoplastic elastomer
We consider the chain length of the soft phase follows a log-normal distribution ( Fig. 8 a). When the soft phase is loaded,
the stress response will first increase to resist the deformation. As the strain increases, the polymer chain is dissociated due
to the dissociation of the dynamic bonds. When the strain is sufficiently large, most of the polymer chains are dissociated
and the stress response begins to decrease. Therefore, the stress-strain curve first increases and then decreases, featuring a
critical maximal point ( Fig. 8 b). For the stiff phase, we model it using a linear combination of an elastic element C and a
viscoplastic dash pot element D. When the strain is small ( < 0.1), it shows an elastic behavior with a modulus much larger
than the soft phase ( Fig. 8 b). As the strain increases, the stress gradually reaches a plateau with the plastic yielding. Overall,
the stress-strain of the self-healable thermoplastic elastomer is presented in Fig. 8 c. In the small-strain range ( < 0.1), the
material behaves like an elastic solid. Afterwards, the material undergoes a strain-hardening range with increasing stress as
the strain increases. This strain-hardening range is due to the increasing stress of the soft rubbery phase during the plastic
yielding of the stiff crystalline phase. When the soft phase reaches the critical maximal point, the overall material also
reaches a critical maximal point, which is corresponding to the material rupture under the tensile load. It shows that the
material rupture is primarily governed by the failure in the soft phase which is related to the dissociation of the dynamic
bonds. This critical maximal stress of the material is the tensile strength of the material. Compared to the existing theoretical
model for the thermoplastic elastomers ( Boyce et al., 2001 ; Boyce et al., 1988 ; Boyce et al., 1989 ; Cho et al., 2017 ; Qi and
Boyce, 2005 ), this theoretical model has a special capability in predicting the tensile strength of the material.
Fig. 8. (a) Probability P i in a function of chain length n for the soft phase. (b) The stress-strain behaviors of the soft phase and stiff phase. (c) The overall
stress-strain behavior of the thermoplastic elastomer. The used parameters can be found in Table 1 .
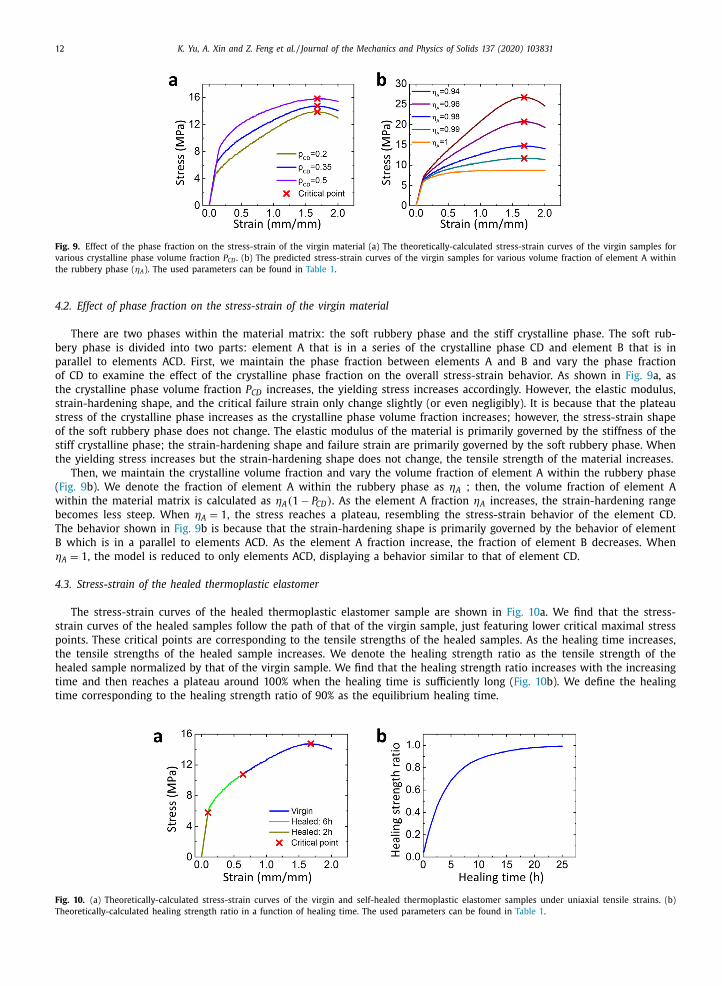
12 K. Yu, A. Xin and Z. Feng et al. / Journal of the Mechanics and Physics of Solids 137 (2020) 103831
Fig. 9. Effect of the phase fraction on the stress-strain of the virgin material (a) The theoretically-calculated stress-strain curves of the virgin samples for
various crystalline phase volume fraction P CD . (b) The predicted stress-strain curves of the virgin samples for various volume fraction of element A within
the rubbery phase ( ηA ). The used parameters can be found in Table 1 .
4.2. Effect of phase fraction on the stress-strain of the virgin material
There are two phases within the material matrix: the soft rubbery phase and the stiff crystalline phase. The soft rub-
bery phase is divided into two parts: element A that is in a series of the crystalline phase CD and element B that is in
parallel to elements ACD. First, we maintain the phase fraction between elements A and B and vary the phase fraction
of CD to examine the effect of the crystalline phase fraction on the overall stress-strain behavior. As shown in Fig. 9 a, as
the crystalline phase volume fraction P CD increases, the yielding stress increases accordingly. However, the elastic modulus,
strain-hardening shape, and the critical failure strain only change slightly (or even negligibly). It is because that the plateau
stress of the crystalline phase increases as the crystalline phase volume fraction increases; however, the stress-strain shape
of the soft rubbery phase does not change. The elastic modulus of the material is primarily governed by the stiffness of the
stiff crystalline phase; the strain-hardening shape and failure strain are primarily governed by the soft rubbery phase. When
the yielding stress increases but the strain-hardening shape does not change, the tensile strength of the material increases.
Then, we maintain the crystalline volume fraction and vary the volume fraction of element A within the rubbery phase
( Fig. 9 b). We denote the fraction of element A within the rubbery phase as ηA ; then, the volume fraction of element A
within the material matrix is calculated as ηA ( 1 − P CD ) . As the element A fraction ηA increases, the strain-hardening range
becomes less steep. When ηA = 1 , the stress reaches a plateau, resembling the stress-strain behavior of the element CD.
The behavior shown in Fig. 9 b is because that the strain-hardening shape is primarily governed by the behavior of element
B which is in a parallel to elements ACD. As the element A fraction increase, the fraction of element B decreases. When
ηA = 1 , the model is reduced to only elements ACD, displaying a behavior similar to that of element CD.
4.3. Stress-strain of the healed thermoplastic elastomer
The stress-strain curves of the healed thermoplastic elastomer sample are shown in Fig. 10 a. We find that the stress-
strain curves of the healed samples follow the path of that of the virgin sample, just featuring lower critical maximal stress
points. These critical points are corresponding to the tensile strengths of the healed samples. As the healing time increases,
the tensile strengths of the healed sample increases. We denote the healing strength ratio as the tensile strength of the
healed sample normalized by that of the virgin sample. We find that the healing strength ratio increases with the increasing
time and then reaches a plateau around 100% when the healing time is sufficiently long ( Fig. 10 b). We define the healing
time corresponding to the healing strength ratio of 90% as the equilibrium healing time.
Fig. 10. (a) Theoretically-calculated stress-strain curves of the virgin and self-healed thermoplastic elastomer samples under uniaxial tensile strains. (b)
Theoretically-calculated healing strength ratio in a function of healing time. The used parameters can be found in Table 1 .

K. Yu, A. Xin and Z. Feng et al. / Journal of the Mechanics and Physics of Solids 137 (2020) 103831 13
Fig. 11. (a) The chain length distributions for various average chain lengths. (b) The predicted stress-strain curves of virgin samples under uniaxial tensile
strains. (c) Theoretically-calculated healing strength ratios in functions of healing time. The used parameters can be found in Table 1 .
Fig. 12. (a) Theoretically-calculated healing strength ratios in functions of healing time for various Rouse friction coefficients ξ . (b) The predicted equilib-
rium healing time in a function of the Rouse friction coefficient. The used parameters can be found in Table 1 .
4.4. Effect of average chain length of soft rubbery phase
We use a log-normal distribution to capture the chain-length distribution of the rubbery phase ( Fig. 11 a). As the average
chain length n a increases, the material becomes more stretchable in the rubbery phase; therefore, the failure strain increases,
and the corresponding tensile strength increases ( Fig. 11 b). At the same time, the chain diffusivity D i decreases with the
increasing chain length Eq. (40) ; and the equilibrium healing time to reach 90% healing increases with the increasing chain
length.
4.5. Effect of chain mobility
Similarly, if we increase the mobility of the polymer chain alone, the stress-strain behavior of the thermoplastic elastomer
does not change, but the healing process requires a shorter time. As shown in Fig. 12 ab, the required equilibrium healing
time increases with the increasing Rouse friction coefficient ξ . Because the diffusivity of the polymer chain is in a reverse
function of the Rouse friction coefficient ξ , expressed in Eq. (40) .
5. Comparison with our own experimental results
After presenting the general characteristics of the theoretically predicted stress-strain behaviors of the virgin and healed
thermoplastic elastomers, we compare the theoretical calculations with the experimental results. We first compare the theo-
retical results with our own experimental results ( Fig. 13 ). The employed parameters and their estimation sources are shown
in Table 1 . Briefly, the parameters for the rubbery phase and the parameter for the self-healing behavior are estimated
based on our previous papers ( Wang and Gao, 2016 ; Wang et al., 2017 ; Wang et al., 2015 ; Xin et al., 2019 ; Yu et al., 2018 ,
2019 ). The parameters for the crystalline phase are estimated based on the reported study for the thermoplastic elastomers
( Boyce et al., 2001 ; Boyce et al., 1988 ; Boyce et al., 1989 ; Cho et al., 2017 ; Qi and Boyce, 2005 ). The volume fraction of the
stiff crystalline phase (i.e., crystallinity) is estimated using the differential scanning calorimetry thermographs ( Chang et al.,
2019 ; Lin et al., 2019 ; Motokucho et al., 2013 ) (Fig. S3). The compositions of the soft rubbery phases A and B are obtained
based on curve fitting. We first take a self-healable thermoplastic elastomer with the molar mass of the chain extender
PTEMG 10 0 0 g/mol for an example. As shown in Fig. 13 a, the theoretically calculated stress-strain behaviors of the virgin
and healed thermoplastic elastomers can agree with the experimental counterparts. Likewise, the theoretically calculated
healing strength ratio can also consistently match the experimentally measured results ( Fig. 13 b).

14 K. Yu, A. Xin and Z. Feng et al. / Journal of the Mechanics and Physics of Solids 137 (2020) 103831
Fig. 13. The experimentally-measured and theoretically-calculated (a) stress-strain curves of the original and self-healed samples, and (b) healing strength
ratios in a function of the healing time. The used parameters for the theoretical model can be found in Table 1 .
Table 1
Model parameters used in this paper. The chain dynamics parameters and Rouse friction coefficients are within the reasonable order compared with
limited experimental or simulation results in the references ( Chapman et al., 1998 ; Silberstein et al., 2014 ; Whitlow and Wool, 1991 ). The parameters for
the rubbery phase and the parameter for the self-healing behavior are estimated based on our previous papers ( Wang and Gao, 2016 ; Wang et al., 2017 ;
Wang et al., 2015 ; Xin et al., 2019 ; Yu et al., 2018 , 2019 ). The parameters for the crystalline phase are estimated based on the reported study for the
thermoplastic elastomers ( Boyce et al., 2001 ; Boyce et al., 1988 ; Boyce et al., 1989 ; Cho et al., 2017 ; Qi and Boyce, 2005 ). The parameters for the volume
fractions of the soft rubbery and stiff crystalline phases are obtained based on curve fitting.
Parameter Definition Figs. 8 , 10 , 13 Fig. 9 Fig. 11 Fig. 12 Fig. 14
PU250
Fig. 14
PU 1810
Fig. 15 Fig. 16 Estimation
source
Parameters
for rubbery
phase
k f 0 i
(s −1 ) Forward
reaction rate
2 × 10 −7 2 × 10 −7 2 × 10 −7 2 × 10 −7 2 × 10 −7 2 × 10 −7 2 × 10 −7 2 × 10 −7 ( Wang and
Gao, 2016 ;
Wang et al.,
2017 ;
Wang et al.,
2015 ;
Xin et al.,
2019 ;
Yu et al.,
2018 ,
2019)
k r0 i
(s −1 ) Reverse
reaction rate
4 × 10 −4 4 × 10 −4 4 × 10 −4 4 × 10 −4 4 × 10 −4 4 × 10 −4 4 × 10 −4 3 × 10 −4
�x (m) Distance along
the energy
landscape
coordinate
1.4 × 10 −9 1.4 × 10 −9 1.4 × 10 −9 1.4 × 10 −9 1.4 × 10 −9 1.4 × 10 −9 4 × 10 −9 4 × 10 −9
b (m) Kuhn segment
length
5.2 × 10 −10
5.2 × 10 −10 5.2 × 10 −10 5.2 × 10 −10 5.2 × 10 −10 5.2 × 10 −10 5.2 × 10 −10 5.2 × 10 −10
n 1 Minimum
chain length
50 50 50 50 13 50 200 200
n m Maximum
chain length
200 200 200 200 200 300 1500 20 0 0
n a Average chain
length
77 77 55–77 77 19 96 665 1160
δ Chain length
distribution
width
0.05 0.05 0.05 0.05 0.1 0.1 0.1 0.15
Parameters
for
crystalline
phase
E C (MPa) Young’s
modulus of
element C
170 170 170 170 1088 74.8 34 4.76 ( Boyce et al.,
2001 ;
Boyce et al.,
1988 ;
Boyce et al.,
1989 ;
Cho et al.,
2017 ;
Qi and
Boyce, 2005 )
γ C Poisson’s ratio
of element C
0.48 0.48 0.48 0.48 0.48 0.48 0.48 0.48
Y 0 (MPa) Initial
resistance
6.82 6.82 6.82 6.82 43.6 3 1.36 0.19
Y sat (MPa) Saturated
resistance
10.22 10.22 10.22 10.22 65.4 4.5 2 0.29
h Hardening
modulus
3 3 3 3 3 3 3 3
�G p /( k B T ) Activation
energy for
plastic
deformation
100 100 100 100 100 100 100 100
ν0 Reference
plastic shear
rate
0.001 0.001 0.001 0.001 0.001 0.001 0.001 0.001
Composition
parameters
p CD Volume
fraction of
crystalline
phase
0.35 0.2–0.5 0.35 0.35 0.5 0.3 0.35 0.35 Estimated
from Fig.
S3
ηA Volume
fraction of
element A in
rubbery
phase
0.98 0.94–1 0.98 0.98 0.8 0.99 0.992 0.993 Fittting for
stress-
strain
curve
Parameter for
self-
healing
ξ (N/m) Rouse friction
coefficient
4 × 10 −1 4 × 10 −1 4 × 10 −1 4 × 10 −2 -
4 × 10 −1 13 2.6 × 10 −1 6.4 × 10 −4
5.9 × 10 −5 Fitting for
healing
time

K. Yu, A. Xin and Z. Feng et al. / Journal of the Mechanics and Physics of Solids 137 (2020) 103831 15
Fig. 14. (a–c) Tensile stress-strain curves of the virgin and healed polymers with various healing time. The polymers in a-c have various PTMEG mo-
lar masses from 250 to 1810 g/mol, respectively. The experimentally-measured and theoretically-calculated (d–f) stress-strain curves of the original and
self-healed samples, and (g–i) healing strength ratios in functions of the healing time. The polymers in d-f and g-i have various PTMEG molar masses
corresponding to a-c, respectively. The used parameters for the theoretical model can be found in Table 1 .
Then, we vary the molar mass of the chain extender PTEMG from 250 to 1810 g/mol, and the corresponding stress-strain
behaviors of the virgin and healed materials are shown in Fig. 14 a–c. As the molar mass of the chain extender increases,
the volume fraction of the soft rubbery phase increase and gradually dominate the mechanical behavior of the polymer
( Fig. 14 d–f). In the experiment, the yielding strength and tensile strength of virgin materials decrease as the volume fraction
of the rubbery phase increases. This behavior can be theoretically understood based on our model with the effect of phase
fraction explained in Section 4 . Our theory can quantitatively capture the elastic range, strain hardening and tensile strength
of different phase fraction polymers. Also, as the healing time increases, tensile strengths of the healed samples increase
until reaching a plateau. The healing strength ratios with various healing time of polymers with different phase compositions
can also quantitatively capture by our self-healing model ( Fig. 14 g–i).
It is also noted that as the rubbery phase volume fraction increases, the equilibrium healing time increases from 6–15 h.
This phenomenon can be explained as follows: The healing process is primarily governed by the coupling of diffusion of
polymer chains and reforming of dynamic disulfide bonds around the healing interface. Base on the Eq. (40) , as the molar
mass of the chain extender increases (corresponding to chain length increasing), the diffusivity decreases, and the required
healing time is expected to be longer.
6. Comparison with others’ experimental results
In Section 5 , we compare our experimental results on the self-healable polyurethanes with the theoretically calculated
results. To further demonstrate the versatility of the present model, we show our model may be applied to understand a

16 K. Yu, A. Xin and Z. Feng et al. / Journal of the Mechanics and Physics of Solids 137 (2020) 103831
Fig. 15. (a) The experimentally-measured stress-strain curves of the original and self-healed samples. The experimentally-measured and theoretically-
calculated (b) stress-strain curves of the original and self-healed samples, and (c) healing strength ratios in a function of the healing time. The experimental
data in a-c are reproduced from reference ( Chang et al., 2018 ) with permission. The used parameters for the theoretical model can be found in Table 1 .
number of thermoplastic polymers with variety of dynamic bonds, including disulfide bonds ( Jian et al., 2018 ; Rekondo et al.,
2014 ; Xu and Chen, 2016 ), urea bonds ( Ying et al., 2014 ) and hydrogen bonds ( Chen et al., 2012 ). In this section, we will
compare the theoretical results with several other’s reported experimental results ( Chang et al., 2018 and Mei et al., 2016 )
6.1. Disulfide bonds
The first example is a self-healing polyurethane based on disulfide bonds from 4-4-aminophenyl disulfide ( Chang et al.,
2018 ). The disulfide bond is a type of dynamic covalent bond that can trigger the dynamic exchange under elevated tem-
perature. The disulfide bonds were treated as chain-extender introduced in polyurethane prepolymer and exhibited 93.43%
healing efficient after being healed for 24 h at 80 °C. The corresponding experimental results are shown in Fig. 15 a. Using
the presented model, we can use adequate model parameters to consistently explain the experimental stress-strain behavior
of original and healed samples ( Fig. 15 b, parameters in Table 1 ). In addition, the theoretically calculated healing strength
ratio–healing time relationship has a good agreement with the referenced experimental results ( Fig. 15 c).
6.2. π- π interaction
The second example is a self-healing polymer that crosslinked by Pt ••• Pt and π- π interactions between polydimethysilox-
ane (PDMS) and platinum (II) complex ( Fig. 16 a) ( Mei et al., 2016 ). The dynamic and reversible association-disassociation
process of Pt ••• Pt and π- π stacking interactions allow the polymer to realize the self-healing property. The excellent mobil-
ity of PDMS chins allows the polymer to heal at room temperature. The healed sample shows the tensile modulus, strength
and stretchability can reach more than 90% of those of the original sample after 12 h at room temperature. The correspond-
ing experimental results are shown in Fig. 16 b. With adequate parameters, our theoretical model can consistently capture
the experimental stress-strain behaviors of the original and healed samples ( Fig. 16 c). In addition, the healing strength ratios
with different healing time from the experiment roughly agree with theoretically calculated results ( Fig. 16 d). Note that the
polymers shown in ( Mei et al., 2016 ) have backbone PDMS chains, but their mechanical behaviors do not necessarily re-
semble that of the commonly used elastomer PDMS. Actually, the PDMS shown in ( Mei et al., 2016 ) showed an elastoplastic
stress-strain curve: a small-strain linear elastic range followed by a strain-hardening region ( Fig. 16 b).
7. Conclusive remarks
In summary, we report a theoretical framework that can explain the constitutive and self-healing behaviors of self-
healable thermoplastic elastomers with both dynamic bonds and crystalline phases. We consider the virgin thermoplastic
elastomer by employing a general spring-dash model that couples the soft rubbery phase and the stiff crystalline phase.
The rubbery polymer network is formed by layering the body-centered unit cubes that link polymer chains via dynamic
bonds. During the self-healing process, we use a diffusion-reaction model to model the interfacial healing process. The the-
oretical framework can explain the stress-strain behaviors of original and self-healed thermoplastic elastomers, as well as
the corresponding healing strengths over the healing time. We show that the theoretical framework can nicely explain our
own experiments on self-healable thermoplastic elastomers polyurethane with dynamic disulfide bonds and the documented
results of thermoplastic materials with disulfide bonds and pi-pi interactions. We expect that our model can be further ex-
tended to explain the self-healing behaviors of thermoplastic polymer with a wide range of dynamic bonds ( Jian et al., 2018 ;
Rekondo et al., 2014 ; Xu and Chen, 2016 ; Ying et al., 2014 ; Chen et al., 2012 ).
Note that as an initial attempt to model the self-healing thermoplastic elastomers, we here only focus on the quasistatic
loading condition. Actually, the loading rate can affect two aspects of the material behavior: First, the loading rate affects
the mechanical behavior of the plastic element D (reference plastic shear rate ν ). Second, the loading rate also affects the
0
K. Yu, A. Xin and Z. Feng et al. / Journal of the Mechanics and Physics of Solids 137 (2020) 103831 17
Fig. 16. (a) The photograph and proposed structure of the PDMS-Pt film (b) The experimentally-measured stress-strain curves of the original and self-
healed samples. The experimentally-measured and theoretically-calculated (c) stress-strain curves of the original and self-healed samples, and (d) healing
strength ratios in a function of the healing time. The graph in a and the experimental data in b-d are reproduced from reference ( Mei et al., 2016 ) with
permission. The used parameters for the theoretical model can be found in Table 1 .
binding kinetics of the dynamic disulfide bonds. We would leave the effect of the loading rate on the mechanical properties
of the virgin and healed self-healing thermoplastic elastomers to future research.
In addition, we do not consider the strain-induced crystalline change in our material system. The typical strain-induced
crystallinity change is considered in natural rubbers in which the strain can enable the increase of the crystallinity
( Dargazany et al., 2014 ; Guilié et al., 2015 ; Kroon, 2010 ; Mistry and Govindjee, 2014 ; Rastak and Linder, 2018 ). However,
for the polyurethane system, most of the modeling works on polyurethanes have not considered the strain-induced crys-
tallinity change ( Boyce et al., 2001 ; Boyce et al., 1988 ; Boyce et al., 1989 ; Cho et al., 2017 ; Qi and Boyce, 2005 ).
Declaration of Competing Interest
The authors declare that they have no known competing financial interests or personal relationships that could have
appeared to influence the work reported in this paper.
The authors declare the following financial interests/personal relationships which may be considered as potential com-
peting interests:
The University of Southern California has filed a patent application related to the self-healing polymers in this work.
CRediT authorship contribution statement
Kunhao Yu: Conceptualization, Methodology, Formal analysis, Data curation, Writing - original draft, Investigation, Re-
sources. An Xin: Investigation, Resources. Zhangzhengrong Feng: Investigation, Resources. Kyung Hoon Lee: Investigation,
Resources. Qiming Wang: Conceptualization, Methodology, Formal analysis, Data curation, Writing - original draft, Supervi-
sion, Project administration.
Acknowledgement
The authors acknowledge the funding support from the National Science Foundation ( CMMI-1762567 ) and the Air Force
Office of Scientific Research ( FA9550-18-1-0192 , program manager: Dr. Jaimie S. Tiley).

18 K. Yu, A. Xin and Z. Feng et al. / Journal of the Mechanics and Physics of Solids 137 (2020) 103831
Supplementary materials
Supplementary material associated with this article can be found, in the online version, at doi: 10.1016/j.jmps.2019.
103831 .
References
Ames, N.M. , Srivastava, V. , Chester, S.A. , Anand, L. , 2009. A thermo-mechanically coupled theory for large deformations of amorphous polymers. Part II:Applications. Int. J. Plast. 25, 1495–1539 .
Anand, L. , Ames, N.M. , Srivastava, V. , Chester, S.A. , 2009. A thermo-mechanically coupled theory for large deformations of amorphous polymers. Part I:Formulation. Int. J. Plast. 25, 1474–1494 .
Arruda, E.M. , Boyce, M.C. , 1993. A three-dimensional constitutive model for the large stretch behavior of rubber elastic materials. J. Mech. Phys. Solids 41,389–412 .
Bell, G.I. , 1978. Models for the specific adhesion of cells to cells. Science 200, 618–627 .
Boyce, M.C. , Kear, K. , Socrate, S. , Shaw, K. , 2001. Deformation of thermoplastic vulcanizates. J. Mech. Phys. Solids 49, 1073–1098 . Boyce, M.C. , Parks, D.M. , Argon, A.S. , 1988. Large inelastic deformation of glassy polymers. Part I: rate dependent constitutive model. Mech. Mater. 7, 15–33 .
Boyce, M.C. , Wever, G.G. , Parks, D.M. , 1989. On the Kinematics of Finite Strain Plasticity. MASSACHUSETTS INST OF TECH CAMBRIDGE . Brochu, A.B. , Craig, S.L. , Reichert, W.M. , 2011. Self-healing biomaterials. J. Biomed. Mater. Res. Part A 96, 492–506 .
Burnworth, M. , Tang, L. , Kumpfer, J.R. , Duncan, A.J. , Beyer, F.L. , Fiore, G.L. , Rowan, S.J. , Weder, C. , 2011. Optically healable supramolecular polymers. Nature472, 334 .
Chang, K. , Jia, H. , Gu, S.-Y. , 2018. A Transparent, Highly Stretchable, Self-Healing Polyurethane Based on Disulfide Bonds. European Polymer Journal .
Chang, K. , Jia, H. , Gu, S.-Y. , 2019. A transparent, highly stretchable, self-healing polyurethane based on disulfide bonds. Eur. Polym. J. 112, 822–831 . Chapman, B.R. , Hamersky, M.W. , Milhaupt, J.M. , Kostelecky, C. , Lodge, T.P. , von Meerwall, E.D. , Smith, S.D. , 1998. Structure and dynamics of disordered
tetrablock copolymers: composition and temperature dependence of local friction. Macromolecules 31, 4562–4573 . Chen, X. , Dam, M.A. , Ono, K. , Mal, A. , Shen, H. , Nutt, S.R. , Sheran, K. , Wudl, F. , 2002. A thermally re-mendable cross-linked polymeric material. Science 295,
1698–1702 . Chen, Y. , Kushner, A.M. , Williams, G.A. , Guan, Z. , 2012. Multiphase design of autonomic self-healing thermoplastic elastomers. Nat. Chem. 4, 467–472 .
Cho, H. , Mayer, S. , Pöselt, E. , Susoff, M. , in ’t Veld, P.J. , Rutledge, G.C. , Boyce, M.C. , 2017. Deformation mechanisms of thermoplastic elastomers: Stress-strain
behavior and constitutive modeling. Polymer 128, 87–99 . Cordier, P. , Tournilhac, F. , Soulié-Ziakovic, C. , Leibler, L. , 2008. Self-healing and thermoreversible rubber from supramolecular assembly. Nature 451, 977–980 .
Dargazany, R. , Khiêm, V.N. , Itskov, M. , 2014. A generalized network decomposition model for the quasi-static inelastic behavior of filled elastomers. Int. J.Plast. 63, 94–109 .
Das, A . , Sallat, A . , Böhme, F. , Suckow, M. , Basu, D. , Wießner, S. , Stöckelhuber, K.W. , Voit, B. , Heinrich, G. , 2015. Ionic modification turns commercial rubberinto a self-healing material. ACS Appl. Mater. Interfaces 7, 20623–20630 .
De Gennes, P.-G. , 1979. Scaling Concepts in Polymer Physics. Cornell university press .
de Gennes, P.G. , 1971. Reptation of a Polymer Chain in the Presence of Fixed Obstacles. J. Chem. Phys. 55, 572–579 . Doi, M. , Edwards, S.F. , 1978. Dynamics of concentrated polymer systems. Part 1.-Brownian motion in the equilibrium state. J. Chem. Soc. Faraday Trans. 74,
1789–1801 . Doi, M. , Edwards, S.F. , 1988. The Theory of Polymer Dynamics. Oxford University Press .
Erman, B. , Mark, J.E. , 1997. Structures and Properties of Rubberlike Networks. Oxford University Press, Oxford . Fox, J. , Wie, J.J. , Greenland, B.W. , Burattini, S. , Hayes, W. , Colquhoun, H.M. , Mackay, M.E. , Rowan, S.J. , 2012. High-strength, healable, supramolecular polymer
nanocomposites. J. Am. Chem. Soc. 134, 5362–5368 . Ghosh, B. , Urban, M.W. , 2009. Self-repairing oxetane-substituted chitosan polyurethane networks. Science 323, 1458–1460 .
Guilié, J. , Le, T.-N. , Le Tallec, P. , 2015. Micro-sphere model for strain-induced crystallisation and three-dimensional applications. J. Mech. Phys. Solids 81,
58–74 . Gulyuz, U. , Okay, O. , 2014. Self-Healing Poly (acrylic acid) Hydrogels with Shape Memory Behavior of High Mechanical Strength. Macromolecules 47,
6 889–6 899 . Haraguchi, K. , Uyama, K. , Tanimoto, H. , 2011. Self-healing in nanocomposite hydrogels. Macromol. Rapid Commun. 32, 1253–1258 .
Holten-Andersen, N. , Harrington, M.J. , Birkedal, H. , Lee, B.P. , Messersmith, P.B. , Lee, K.Y.C. , Waite, J.H. , 2011. pH-induced metal-ligand cross-links inspired bymussel yield self-healing polymer networks with near-covalent elastic moduli. Proc. Natl. Acad. Sci. U.S.A. 108, 2651–2655 .
Ihsan, A.B. , Sun, T.L. , Kurokawa, T. , Karobi, S.N. , Nakajima, T. , Nonoyama, T. , Roy, C.K. , Luo, F. , Gong, J.P. , 2016. Self-healing behaviors of tough polyampholyte
hydrogels. Macromolecules 49, 4245–4252 . Imato, K. , Nishihara, M. , Kanehara, T. , Amamoto, Y. , Takahara, A. , Otsuka, H. , 2012. Self-healing of chemical gels cross-linked by diarylbibenzofuranone-based
trigger-free dynamic covalent bonds at room temperature. Angew. Chem. Int. Ed. 51, 1138–1142 . Jian, X. , Hu, Y. , Zhou, W. , Xiao, L. , 2018. Self-healing polyurethane based on disulfide bond and hydrogen bond. Polym. Adv. Technol. 29, 463–469 .
Kersey, F.R. , Loveless, D.M. , Craig, S.L. , 2007. A hybrid polymer gel with controlled rates of cross-link rupture and self-repair. J. R. Soc. Interface 4, 373–380 . Kim, Y.H. , Wool, R.P. , 1983. A theory of healing at a polymer-polymer interface. Macromolecules 16, 1115–1120 .
Kroon, M. , 2010. A constitutive model for strain-crystallising Rubber-like materials. Mech. Mater. 42, 873–885 .
Lin, S. , Liu, X. , Liu, J. , Yuk, H. , Loh, H.-C. , Parada, G.A. , Settens, C. , Song, J. , Masic, A. , McKinley, G.H. , 2019. Anti-fatigue-fracture hydrogels. Sci. Adv. 5eaau8528 .
Ling, L. , Li, J. , Zhang, G. , Sun, R. , Wong, C.-P. , 2018. Self-healing and shape memory linear polyurethane based on disulfide linkages with excellent mechanicalproperty. Macromol. Res. 26, 365–373 .
Liu, J. , Tan, C.S.Y. , Yu, Z. , Lan, Y. , Abell, C. , Scherman, O.A. , 2017a. Biomimetic supramolecular polymer networks exhibiting both toughness and self-recovery.Adv. Mater. 29, 1604951 .
Liu, J. , Tan, C.S.Y. , Yu, Z. , Li, N. , Abell, C. , Scherman, O.A. , 2017b. Tough supramolecular polymer networks with extreme stretchability and fast room-tem-
perature self-healing. Adv. Mater. 29, 1605325 . Liu, W.-X. , Zhang, C. , Zhang, H. , Zhao, N. , Yu, Z.-X. , Xu, J. , 2017c. Oxime-based and catalyst-free dynamic covalent polyurethanes. J. Am. Chem. Soc. 139,
8678–8684 . Lu, Y.-X. , Guan, Z. , 2012. Olefin metathesis for effective polymer healing via dynamic exchange of strong carbon–carbon double bonds. J. Am. Chem. Soc.
134, 14226–14231 . Mayumi, K. , Guo, J. , Narita, T. , Hui, C.Y. , Creton, C. , 2016. Fracture of dual crosslink gels with permanent and transient crosslinks. Extreme Mech. Lett. 6,
52–59 .
Mei, J.F. , Jia, X.Y. , Lai, J.C. , Sun, Y. , Li, C.H. , Wu, J.H. , Cao, Y. , You, X.Z. , Bao, Z. , 2016. A highly stretchable and autonomous self-healing polymer based oncombination of pt ••• pt and π–π interactions. Macromol. Rapid Commun. 37, 1667–1675 .
Mistry, S.J. , Govindjee, S. , 2014. A micro-mechanically based continuum model for strain-induced crystallization in natural rubber. Int. J. Solids Struct. 51,530–539 .
Montarnal, D. , Tournilhac, F. , Hidalgo, M. , Couturier, J.-L. , Leibler, L. , 2009. Versatile one-pot synthesis of supramolecular plastics and self-healing rubbers. J.Am. Chem. Soc. 131, 7966–7967 .

K. Yu, A. Xin and Z. Feng et al. / Journal of the Mechanics and Physics of Solids 137 (2020) 103831 19
Motokucho, S. , Furukawa, M. , Kawashima, M. , Kojio, K. , Yoshinaga, K. , 2013. Physical properties of poly (tetrahydrofuran)-block-poly (2-ethyl-2-oxazoline)triblock copolymer. Polym. J. 45, 1115 .
Nakahata, M. , Takashima, Y. , Yamaguchi, H. , Harada, A. , 2011. Redox-responsive self-healing materials formed from host–guest polymers. Nat. Comm. 2, 511 .Okay, O. , 2015. Self-healing hydrogels formed via hydrophobic interactions. Supramol. Polym. Netw. Gels Springer 101–142 .
Phadke, A. , Zhang, C. , Arman, B. , Hsu, C.-C. , Mashelkar, R.A. , Lele, A.K. , Tauber, M.J. , Arya, G. , Varghese, S. , 2012. Rapid self-healing hydrogels. Proc. Natl.Acad. Sci. U.S.A. 109, 4383–4388 .
Qi, H.J. , Boyce, M.C. , 2005. Stress–strain behavior of thermoplastic polyurethanes. Mech. Mater. 37, 817–839 .
Qi, H.J. , Nguyen, T.D. , Castro, F. , Yakacki, C.M. , Shandas, R. , 2008. Finite deformation thermo-mechanical behavior of thermally induced shape memorypolymers. J. Mech. Phys. Solids 56, 1730–1751 .
Rastak, R. , Linder, C. , 2018. A non-affine micro-macro approach to strain-crystallizing rubber-like materials. J. Mech. Phys. Solids 111, 67–99 . Rekondo, A. , Martin, R. , de Luzuriaga, A.R. , Cabañero, G. , Grande, H.J. , Odriozola, I. , 2014. Catalyst-free room-temperature self-healing elastomers based on
aromatic disulfide metathesis. Mater. Horizons 1, 237–240 . Ribas-Arino, J. , Marx, D. , 2012. Covalent mechanochemistry: theoretical concepts and computational tools with applications to molecular nanomechanics.
Chem. Rev. 112, 5412–5487 . Rowan, S.J. , Beck, J.B. , 2005. Metal–ligand induced supramolecular polymerization: a route to responsive materials. Faraday Discuss. 128, 43–53 .
Rubinstein, M. , Colby, R. , 2003. Polymer Physics. Oxford University Press, Oxford .
Sijbesma, R.P. , Beijer, F.H. , Brunsveld, L. , Folmer, B.J. , Hirschberg, J.K. , Lange, R.F. , Lowe, J.K. , Meijer, E. , 1997. Reversible polymers formed from self-comple-mentary monomers using quadruple hydrogen bonding. Science 278, 1601–1604 .
Silberstein, M.N. , Cremar, L.D. , Beiermann, B.A. , Kramer, S.B. , Martinez, T.J. , White, S.R. , Sottos, N.R. , 2014. Modeling mechanophore activation within aviscous rubbery network. J. Mech. Phys. Solids 63, 141–153 .
Skene, W.G. , Lehn, J.-M.P. , 2004. Dynamers: polyacylhydrazone reversible covalent polymers, component exchange, and constitutional diversity. Proc. Natl.Acad. Sci. U.S.A. 101, 8270–8275 .
Sun, J.-Y. , Zhao, X. , Illeperuma, W.R. , Chaudhuri, O. , Oh, K.H. , Mooney, D.J. , Vlassak, J.J. , Suo, Z. , 2012. Highly stretchable and tough hydrogels. Nature 489,
133–136 . Sun, T.L. , Kurokawa, T. , Kuroda, S. , Ihsan, A.B. , Akasaki, T. , Sato, K. , Haque, M.A. , Nakajima, T. , Gong, J.P. , 2013. Physical hydrogels composed of polyampholytes
demonstrate high toughness and viscoelasticity. Nat. Mater. 12, 932–937 . Tee, B.C. , Wang, C. , Allen, R. , Bao, Z. , 2012. An electrically and mechanically self-healing composite with pressure-and flexion-sensitive properties for elec-
tronic skin applications. Nat. Nanotechnol. 7, 825–832 . Terryn, S. , Brancart, J. , Lefeber, D. , Van Assche, G. , Vanderborght, B. , 2017. Self-healing soft pneumatic robots. Sci. Robot. 2 eaan4268 .
Treloar, L.R.G. , 1975. The Physics of Rubber Elasticity. Oxford University Press, Oxford .
Wang, C. , Liu, N. , Allen, R. , Tok, J.B.H. , Wu, Y. , Zhang, F. , Chen, Y. , Bao, Z. , 2013a. A rapid and efficient self-healing thermo-reversible elastomer crosslinkedwith graphene oxide. Adv. Mater. 25, 5785–5790 .
Wang, C. , Wu, H. , Chen, Z. , McDowell, M.T. , Cui, Y. , Bao, Z. , 2013b. Self-healing chemistry enables the stable operation of silicon microparticle anodes forhigh-energy lithium-ion batteries. Nat. Chem. 5, 1042–1048 .
Wang, Q. , Gao, Z. , 2016. A constitutive model of nanocomposite hydrogels with nanoparticle crosslinkers. J. Mech. Phys. Solids 94, 127–147 . Wang, Q. , Gao, Z. , Yu, K. , 2017. Interfacial self-healing of nanocomposite hydrogels: Theory and experiment. J. Mech. Phys. Solids 109, 288–306 .
Wang, Q. , Gossweiler, G.R. , Craig, S.L. , Zhao, X. , 2015. Mechanics of mechanochemically responsive Elastomers. J. Mech. Phys. Solids 82, 320–344 .
Wang, Q. , Mynar, J.L. , Yoshida, M. , Lee, E. , Lee, M. , Okuro, K. , Kinbara, K. , Aida, T. , 2010. High-water-content mouldable hydrogels by mixing clay and adendritic molecular binder. Nature 463, 339–343 .
Whitlow, S.J. , Wool, R.P. , 1991. Diffusion of polymers at interfaces: a secondary ion mass spectroscopy study. Macromolecules 24, 5926–5938 . Xin, A. , Zhang, R. , Yu, K. , Wang, Q. , 2019. Mechanics of electrophoresis-induced reversible hydrogel adhesion. J. Mech. Phys. Solids 125, 1–21 .
Xu, Y. , Chen, D. , 2016. A novel self-healing polyurethane based on disulfide bonds. Macromol. Chem. Phys. 217, 1191–1196 . Ying, H. , Zhang, Y. , Cheng, J. , 2014. Dynamic urea bond for the design of reversible and self-healing polymers. Nat. Commun. 5, 3218 .
Yu, K. , Xin, A. , Wang, Q. , 2018. Mechanics of self-healing polymer networks crosslinked by dynamic bonds. J. Mech. Phys. Solids 121, 409–431 .
Yu, K. , Xin, A. , Wang, Q. , 2019. Mechanics of light-activated self-healing polymer networks. J. Mech. Phys. Solids 124, 643–662 . Zhang, H. , Wool, R.P. , 1989. Concentration profile for a polymer-polymer interface. 1. Identical chemical composition and molecular weight. Macromolecules
22, 3018–3021 . Zhang, L. , Chen, L. , Rowan, S.J. , 2017. Trapping dynamic disulfide bonds in the hard segments of thermoplastic polyurethane elastomers. Macromol. Chem.
Phys. 218, 1600320 .