mechanical trading systems - money management
TRANSCRIPT

M.O.N.E.Y.M.A.N.A.G.E.M.E.N.T.In a chapter entitled "The Secrets of Successful Trading" in Street Smarts,Fernando Diaz concluded:
"Successful traders have a larger edge and better money management thanunsuccessful traders. Unlike popularbelief however, this study shows that the smaller edge of successful traders isnot the cause of their failure.Traders' failures can be explained almost exclusively by their poor moneymanagement practices."
When trading stocks or commodities the importance of Money Management isunderestimated by a lot of traders. It is of much more importance than entryand exit decisions (=timing decisions) will ever be.Very few indicators are better than a coin toss, and if they are, the edge iseaten up by slippage and commission.
Money Management is also sometimes called asset allocation, position sizing,portfolio heat, portfolio allocation, cash flow management, trade management,capital management, position management, size management, bet sizeselection, lot size selection, or even risk control, equity control, and damagecontrol.
Money Management is managing the position size while Risk Management isabout managing losses and open profits (unrealized trading returns).
Actually I don't like the term 'Money Management' as it also has a very generalmeaning (it's also used describing the "process" of saving, these "learn valuableskills" pages, talking about piggy banks and how to teach kids aboutpaycheques).But 'Money Management' tells a trader that (s-)he should concentrate hisresearch on how to optimize capital usage and to view his/her portfolio(-)s as awhole.
Actually there are (at least) 2 steps to implement proper Money Management:
1) Bet sizing is the determination of what (fixed or non-fixed) fraction of aportfolio's total (or again fixed or non-fixed fraction) equity to risk on eachtrade expressed in Dollar-, Euro-, Yen-, or Swiss Franc-denominated currencyvalues.
2) Position sizing, on the other hand, is the calculation of how many contracts Ishould hold in my position, once a trade entry is signaled which basically is afunction of the BigPointValue (the number of dollars that a 1-point price move

represents) and a rounding algorithm as the number of contracts/stocks can'tbe traded in fractions and must be cut down to a whole integer.
On my desk there are 5 statistics related books and just 2 on trading. Soaccording to the books next to me my focus on statistics is at least 70% :-). Asound knowledge of statistics is a good start into the Money Managementarena.
Here a 10 Money Management lessons, including strategies, hints & tips, sourcecode, etc.They are copied together indiscriminately from several sources from theInternet, from Trading Software, and Trading Literature.
These lessons won't automatically build wealth, but will bring a wealth ofexperience and knowledge, which will prove invaluable to you if bothunderstood and applied properly. It will steer the course for your success in theglobal financial marketplace.
I hope you will find and pick what your trading system is desperately lookingfor.
If you are too lazy to dig deep to both find and understand these lessons Iwould advise to either refrain from trading or if you are really willing to learnnothing else, then learn this:
Be bright, give up being right, and emphaSIZE on Position SIZE !!! empha
on PositionSIZE !!!

Money Management 1
The underlying concept is, that, if we cannot accurately predict our own performance, and as wecannot influence how the markets will behave, we should at least exercise control over thosevariables that we have actually control of. And that is the risk that we as traders take whenentering a position.
Few, if any, have the ability to view their portfolios as a whole and even fewer are able tooptimize capital usage. Traders and investors must move from a defensive or reactive view ofrisk in which they measure risk to avoid losses, to an offensive or proactive posture in whichrisks are actively managed for a more efficient use of capital.
NO set of indicator rules will ever make money in futures trading. So forget about fractals,alligator, turtles, waves, cycles, etc.The best these and ALL other indicators, including Moving averages and Breakouts, will do ismake you break-even and at worst blow your account.
The KEY is in your Risk and Money Management.Combined with sound risk and money management I could even reverse the above statement:"ANY set of indicators rules will make money in futures trading."
Choose a CLEAR, TREND following indicator. One that an 8 year old could tell you whether it islong or short. ONLY trend following indicators will work. If you have to think for more than 1second whether it is long or short, it isn't clear enough.Stick to 1 indicator in 1 time frame. NEVER pay any money for other people's systems. They willNOT work.
ENTRY: Decide on whether you want to use Reversals or retracements. I recommend reversals.
RISK Management:Trading only 1 contract at a time will cause you to FAIL !!!Make sure you are well capitalized. This is not a game for those who are not.
The only way to win at futures trading is for you to be larger (have more positions) when youare right and less positions when you are wrong.
THIS IS THE KEY TO TRADING.Maintaining the same number of contracts for each trade will cause you to FAIL.Varying contract size is the MOST important thing you must do, if you want to be successful.
Buying and Selling using the same number of contracts will at best, lead you no where and atworst, wipe you out in the long run. You can vary your positions with the following:1) Stagger out of your trades when wrong (Phantom of the Pits points out that you should letthe market prove you correct instead of letting it prove you wrong by hitting your stop loss).The market goes against your entry (!!!). BUT hold on to all your positions when right.2) Make sure your profit goal is larger than your stop loss point.
MONEY Management:Never let a winner become a loser. Adjust your stops as the market moves with you. TREND:Use trend following indicators only. I recommend Moving average 2 lines and Break outs.-----> Pick the shortest time frame with the longest trend indicator.
Principles of Money Management:While Risk management dealt mainly with maximizing profits using contract size, Money

management deals mainly with minimizing losses using stops, as well as showing youwhen to take profits. They are both very closely intertwined with each other. You cannot haveall risk rules but no money management rules, and vice versa.I gave you Rule #1 which says to stagger your stop losses, and here is ONE very importantprinciple that you have to learn in Money management:
80% of your Profits will come from 20% of your trades (Pareto Principle). What do I mean by that? Let's say we are playing the game of 50/50. So 50% of our trades willbe losers. There is no way avoiding it and we will attempt to keep those losses small bystaggering our stops with multiple contracts.
The other 50% are NOT all going to be big winners. Out of that 50%, roughly half will be whereyou really make your money and the rest will pay for your losses. It is similar to running abusiness. 80% of your clients will pay your costs for running the business and 20% will be thereason you are in business.
Why is that? You will have trades where you are right initially but they will come back andbecome only small winners. This is okay, you will never be able to predict the exact perfect exitfor a trade, but you can see where the problem is. If you don't capitalize on that 20% of tradeswhere the price just keeps on going in your direction, you will end up just covering your lossesand you will not get anywhere.
Here is an example:
100 trades
50 trades are immediate losers but kept small using stops
30 trades are moderate winners
20 trades are big winners
50 losing trades x average of 4 points = 200 points
30 winning trades x average of 8 points = 240 points
20 winning trades x average of 20 points = 400 points
Net Result: 440 points
So if we did not hold out for those 20 points on each of those winning trades, we wouldprobably just break even after paying commissions, and we are definitely not going through allthis hardship to make the broker rich, right?
So while rule #1 dealt with cutting losses, rule #2 will deal with when to Exit ... with a PROFIT!This is usually the most difficult of the rules to quantify. Getting into a position is elementary.Exiting for a loss, expected. But when do you take your profits?
For a trader this can be very difficult. You have entered your position, sat there while themarket was ticking back and forth, and now finally it is showing a small profit.
The natural tendency will be to take it. Will you be right? Sure, sometimes you will catch the topbefore it retraces, but when you get into a habit of doing that, you will miss the big trenders andyou will curse and stomp around and there is nothing you can do except pray it stops and do youknow what? It won't and you will miss it all. Truly a sad tale, but luckily there are many moretrends where they came from, so don't worry.
Alright, let's get back to our example. The market is ticking, and is now showing a small profit.Here is where the true test of your nerve will be played out. Where all those other traders are

going to try to scare you out of your position, so they can get in. Will you know when? No, ofcourse not. No one knows how long a position will go in one direction.
This is where position size again plays a crucial role. What will happen if you enter with onlyone position? Well, when you exit, that's it. You will now have to wait for another trade.And if you try to hold out for the big trade, you will have a lot more losers or break-even trades.
With multiple contracts, you have many more options. First, have a profit objective that is largerthan your stop loss points. It is important that it is larger. You can see why in the exampleabove.
This is where you will exit some of your positions for profit. Now with the use of trailing stops,you are going to sit back and try to go catch a big move. You will never know when it willhappen, but it is critical that you are there when it happens.
So before we continue, here is Rule #2.
RULE #2
STAY with ALL your positions until they meet the minimum profit objective.
Exit a portion of your trade at the minimum profit objective. Hold the rest using a trailing stopto take advantage of huge trenders.
Use a breakeven stop to never let a winner become a loser.
The markets are going to try to scare you out of your positions. DON'T LET THEM!! This is whenyou are right and you CAN'T AFFORD to not capitalize on this. If you get out early, even if youmade a small profit, IT IS A LOSS!!!
Fear and greed are emotions felt when you don't have specific rules in place. Follow your rules,and the only way to have confidence in them is to test them.
So let us break down all the Money Management principles from the point of entry:
STOP LOSS
click for larger image
You have entered a trade with 4 contracts (greenarrow). You immediately enter your stop loss orders(red lines) IN the market. We do that because themarket will go to where it will go, with or without you.Keeping the stops in your head will not help you if themarket starts racing against you.
We have followed rule #1 and staggered our stops asyou can see with the red lines, now we wait....
Scenario #1
click for larger image
Oh well, the market went against you and took outsome or all of your stops. If it took out all your stops,as it did in this example, forget about it and wait forthe next trade. If it took out only a couple and thenwent in your favour then great, continue the lesson
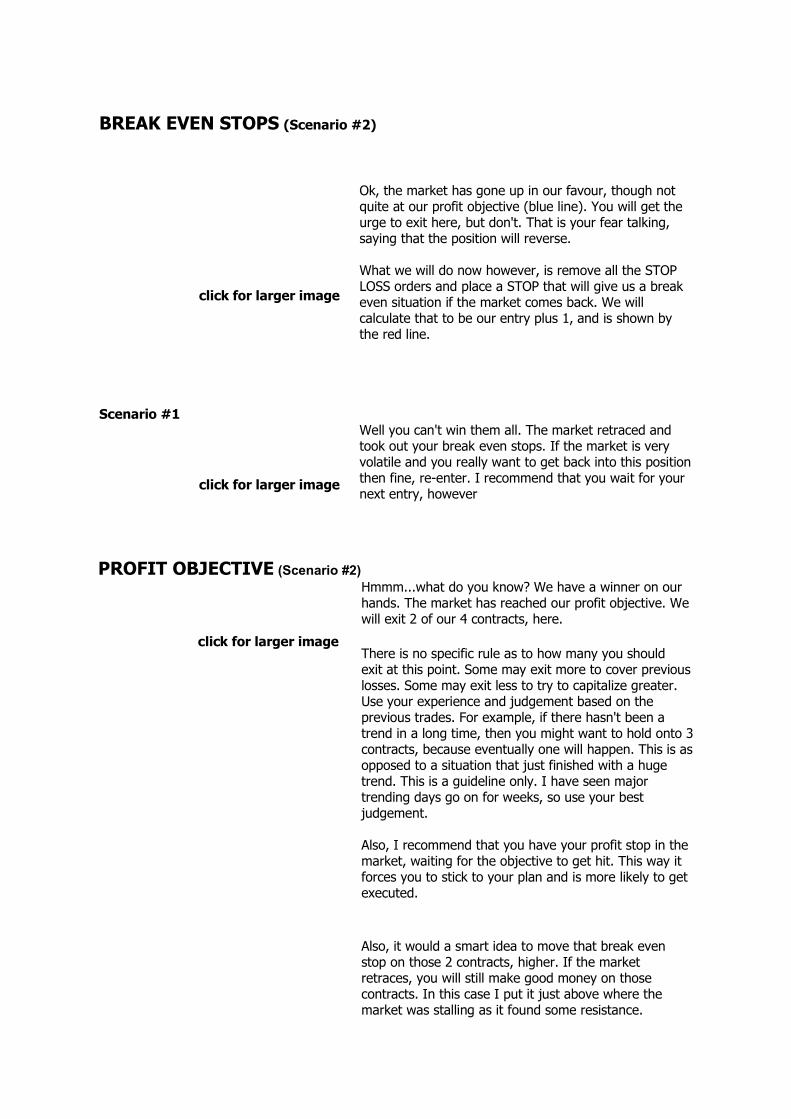
BREAK EVEN STOPS (Scenario #2)
click for larger image
Ok, the market has gone up in our favour, though notquite at our profit objective (blue line). You will get theurge to exit here, but don't. That is your fear talking,saying that the position will reverse.
What we will do now however, is remove all the STOPLOSS orders and place a STOP that will give us a breakeven situation if the market comes back. We willcalculate that to be our entry plus 1, and is shown bythe red line.
Scenario #1
click for larger image
Well you can't win them all. The market retraced andtook out your break even stops. If the market is veryvolatile and you really want to get back into this positionthen fine, re-enter. I recommend that you wait for yournext entry, however
PROFIT OBJECTIVE (Scenario #2)
click for larger image
Hmmm...what do you know? We have a winner on ourhands. The market has reached our profit objective. Wewill exit 2 of our 4 contracts, here.
There is no specific rule as to how many you shouldexit at this point. Some may exit more to cover previouslosses. Some may exit less to try to capitalize greater.Use your experience and judgement based on theprevious trades. For example, if there hasn't been atrend in a long time, then you might want to hold onto 3contracts, because eventually one will happen. This is asopposed to a situation that just finished with a hugetrend. This is a guideline only. I have seen majortrending days go on for weeks, so use your bestjudgement.
Also, I recommend that you have your profit stop in themarket, waiting for the objective to get hit. This way itforces you to stick to your plan and is more likely to getexecuted.
Also, it would a smart idea to move that break evenstop on those 2 contracts, higher. If the marketretraces, you will still make good money on thosecontracts. In this case I put it just above where themarket was stalling as it found some resistance.

Scenario #1
click for larger image
Now you are still holding 2 contracts, but the markethas run out of steam and retraced and has taken outyour break even stops. No problem. You still made somemoney and you didn't lose on your winners.
TRAILING STOPS (Scenario #2)
click for larger image
Time to come to papa! The remaining 2 stops are nowshowing some serious profit, and we will have ourtrailing stop (as seen in blue) right there to catch it incase the market reverses.
Where to place that trailing stop? Here are some ideas:
The first should be put just above your 1st profitobjective. Then the market may reverse slightly. If itcontinues in your favour, put the stop just below thatretracement. Any retracement that holds is a good place.
Now if based on your research, you have seen that hugemoves like this are usually x ticks, and we have nowmade that size move, there is nothing wrong with takingprofits here, before the market retraces. In fact I wouldrecommend it, but just don't jump the gun at any move.You can also remove 1 more contract here and hold outthe last on the trailing stop or wait for the close.
There are countless possibilities and no "perfect" way.The main goal is if it is going your way, do everythingyou can to be part of the action.
Many successful money managers trade systems that do take the same trades without trying tomeasure 'market environment'. The size of the trade is determined by the money managementparameters which again are systemized rules. They do not change from trade to trade. Onecould also build rules to react differently to different 'market environments'. That would be partof the system. System or mechanical trading is not limited to anything but a set of rules thatgovern each and every trading decision. These rules are decided before hand.This example also assumes that one has a system that provides a market edge. This alsoassumes that the trader has the ability to correctly follow the system. Both of these are largeassumptions.A system will have winning trades and losing trades, but the winning trades either from theirnumber or their size, will make up for the losers and leave a profit. From this scenario the traderMUST trade the exact same way for every trade/environment. He/she has an edge. If the edgeis used the same way every time over a large enough set, a profit will be made. The trader actsas the HOUSE in a casino. The edge works for him. You apply the edge the same way over andover. While you know certain market action will produce losing trades, you also know that thewinning trades will overcome that. You do NOT want your judgment getting in the way. Ifsomeone was paying you 7-5 every time you correctly guessed heads but only 4-5 every timeyou correctly guessed tails, you would not sit out flips or throw in some tails guesses. Youwould sit and guess heads until you had all the money you wanted. IF you can correctlydetermine 'market environment', then you should work that into your system.Most good systems have fewer than three parameters, filters etc. They are very simple which

adds to their 'robustness'.
Scot Billington
- emotions can be managed but not controlled- view each trade merely one in a series of probabilities- know why you take a trade and what must happen for you to remain in it (!!!).If it fails to happen - get out even if your stop has not been triggered.
- You cannot have one without the other. It is not the 'system' (and I despise that word when itcomes to trading) that makes the trader, it is thetrader that makes the 'system'.- important: the ability to trade WITHOUT a BIAS or OPINION as to market direction (NO EGO),and realize that there is no such thing asoverbought/oversold, and no price is too high to buy or too low to sell. You also need to learn tolike your losses as they just put you one step closer to a winning Trade(s) and are nothing morethan the cost of doing business.- I take the same trades each day, but how I manage each trade is dependent upon my read ofthe environment (discretion). You cannot tradethe exact same size and exit the exact same way for every trade/environment. For example, atrending market requires a different approach than a range bound market. In the end it boilsdown to your ability to read the PRICE action and adopt your game plan to the currentconditions - AND THEN EXECUTE. And all you 1-lot traders out there better re-think yourapproach as trading 1-lots is a fool's game (***!!!***). You are far better off trading 3 ES/NQthan you are trading 1 SP/ND. I'll make the same challenge to the 1-lot traders that my mentormade to me when I was a 1-lot trader - I'll trade 3 NQ/ES to your 1 ND/SP and we'll see whowins. I took him up on that and he cleaned my clock... I have not traded 1-lots since and neverwill again.
Trading is all about management - yourself, your money, your attitude and your position.It is NOTabout predictions, forecasts or OPINIONS. You cannot learn how to drive a car withoutbeing behind the wheel - and you can't learnhow to trade by just reading a book, attending a class or buying a 'system'.
Bob Heisler [email protected] http://www.rjhtrading.com
System trading is only good if the computer automatically enters the orders, the stops andthe exits. If not, if the individual decides to not take a trade the system is flawed. I onlyknow of one person that is set up this way. He uses a break out system and it producesapproximately 37% winning trades. His profit picture is about a 22% annualized return. Idid not see his sheets or look at his numbers. But the computers do put in all the trades.Any system where an individual trader puts in the order is discretionary to a degree. Theparty that says he is trading totally system may be using the system as a crutch to blamefor the losing trades.The system I use is 80% mechanical and 20% discretionary. If I lose it is my mistake, thesystem has a 20% losing factor, but I have to look at it as my error. I am not blamingmyself for the lose, I am saying that the lose is part of the system. I developed thesystem, therefore the lose is mine. If I did everything the system said to do, and tookevery trade the system gave me, then I could blame the system if my percentage ofwinners to losers changes. If my profit per trade goes down, or if the graph of my profitshas lower highs and lower lows, I look for a problem, not in the system, but in me.If you did what the system said and you lost money, it was still a good trade. It is goodonly because you had the discipline to follow the system. Did you bother to analyze the

trade after the close to see why the trade lost? Was there something that you didn't see?Was it something that you over looked? With me, I usually find that I got lazy and didn'tdo my homework. I assumed that because I was successful that I was bullet proof. Not so.No one is bullet proof. Self, ego, and the psychological need to be right are thediscretionary traders worst nightmare. The other problem is ones belief system.Taking everything into consideration, I still believe that the human brain is the bestcomputer ever developed. The thing that people forget is that the brain sees in picturesand not in numbers. The first thing most traders want to know is to were do I get in andhow much will I make. This is overbought or oversold. Volume is up or volume is down.They start seeing numbers and figuring. They start back testing, they start using indicatorsthat they don't understand. They look at the past rather then the future. Wrong, look atthe picture and it will tell you the whole story. Like a road map.A good trader can take almost any system, astro, volume, eliot, Gann, even some of LarryWilliams stuff and make a good living. He does it because outside of the system he islooking at the chart and that picture is what triggers his final decision. Like everything inlife, you have to visualize what you want to accomplish before you can get there. Tradingis a business. You need a plan for everyday that will take care of the contingencies thatmight arise. With the proper planning there are very few surprises. You won't get rich overnight, but you will be able to get there. Many have done it. Ira.
Learn to trade the leading edge of the market, by following the price action. Furthermore,it means only using the very liquid markets with a daily range and movement that isconsistent with their ability to withstand drawdowns that their account will allow. Not easy!Now, clever people with sophisticated computer programs and all the other factorsnecessary to trade a system, with all its implications, have to have a bank account or otherpeople's money of sufficient size to trade. Most on this list are individual traders who don'thave the money or systems. If they cannot trade with discretion, they cannot trade at all.Therefore, it follows that effective means of day trading is for the little guy and systems,indicators et al, are for those who, shall we say, live to play, rather than play to live.
Bill Eykyn www.t-bondtrader.com______________________________________________________________________________________________________________
- Which money management strategy best fits your risk profile?In general terms, the more stable your equity curve, the more aggressive you can be inyour money management strategy. It should come as no surprise to those who havestudied Optimal f, that it can be aggressive in its position size. Therefore, to properlyimplement this strategy it should be applied to systems with very stable trading results.Systems with Sharp Ratios above 2, Return Retracement Ratios above 8 and K-ratiosabove 2.5, will (in general terms) satisfy our stable trading condition. Now in real worldtrading it is very rare that systems will generate these results. To help focus on theappropriate money management strategies that will fit most trading systems, consider theleast aggressive strategy before moving onto the most aggressive strategy. In generalterms begin with the Fixed Fractional and Secure f strategies before moving onto Diluted fand the ultra aggressive Optimal f money management strategy. This will save you a greatdeal of time and effort when testing some of the more popular money managementstrategies.

______________________________________________________________________________________________________________
Trading Metaphor:Trading is like driving. Where you want to go etc., the "how much do you want to make"metaphor, depends on me. How fast do I want to go? Well, how much risk do I want totake, e.g., tickets, accidents, etc., or in trading, how quickly do I want to achieve mygoals.How much wear on my car (me and everyone around me) do I want to incurr? I couldwear my breaks and tires out by starting and stopping at every stop light - i.e., enteringthe market by choosing too tight of stops or exits. What if I never get where I'm going?Have I prepared a road map (trading plan) with check points.
______________________________________________________________________________________________________________
A low risk idea is an idea with a positive expectancy that is traded in such a way to allowfor the worst possible conditions in the short runso that you can achieve the long term expectancy.
Q:Percent Risk Model (using e.g. 2.0% of you capital for position sizing):if a trade moves in your favor you add additional contracts in different or the samemarkets?A:You might simply decide to keep a constant risk. In that case, you adjust your stopaccording to your system and peel off (=reduce) contracts when the risk got above thelevel you wanted to maintain.
Q:Which is "better" mathematically, a 20% chance of winning a dollar or a 10% chance ofwinning two? In each case the expectancy is 20cents but they are clearly not the same. - Why are they not the same?
A:Question including full background:In an interview in Stocks & Commodities you described a simple position size game (60%win, 40% loss and expectancy 1.2).The expectancy is 0.6*1 - 0.4*1 = 0.2 or 20 cents per dollar risked.I immediately started trying to derive the optimal bet size. In consultation with mycolleagues we broke the problem up a little, derivedsome intermediate goals and came away with a few results:1. The first problem was to define "optimal".We decided that optimal meant "highest risk / reward ratio". Well "reward" was obviousbut...2. So the second problem was "define risk". Do you define risk as the probability that acertain outcome will occur or do you definerisk as the variance of possible outcomes aka standard deviation or do you use something

different again?We found this problem intractable and decided to approach from a different angle.3. There must be some kind of function which will define optimal betsize - but what arethe independent variables? We assumed that the system would have to work regardless ofhow much money was involved so the betsize couldn't be fixed, it had to be some sort ofpercentage. Secondly it couldn't only be based on the expectancy of the underlyingsystem. Consider the following two games:A game with a 50% chance of a 3:1 win and a 50% chance of a 1:1 loss has anexpectancy of 0.5*4 + 0.5*0 = 2No, the expectancy is 0.5*3 - 0.5*1 = 1.50 or $1.50 per dollar risked.A game with a 100% chance of a 1:1 win and 0% chance of a loss has an expectancy of1*2 = 2No, the expectancy is 1.0*1 - 0 = $1.0Same expectancy but vastly different optimal betsizes.In each of those cases the Kelly criterion defines the optimal bet size--(i.e., for maximumreturn only).We were back to being stumped but at least now we could clearly state the core problem:Which is "better" mathematically, a 20% chance of winning a dollar or a 10% chance ofwinning two? In each case the expectancy is 20 cents but they are clearly not the same.How would you define "better"?Here your opportunity factor would make the key difference. If you only had one chance,I'd want the 20% opportunity. If you have unlimited chances and there was no cost toplaying, it wouldn't make any difference unless you like more rewards in which case you'dstill want the 20% opportunity.We are currently refining some software that will answer the question of optimal bet sizefor you and help you determine what optimal means for you. It will be included with a newmoney management report that we are planning to offer soon.
Q:Suppose you have a $10,000 account and wish to trade using volatility. Using an examplesimilar to Van's book, say you want to purchase a $50 stock with an ATR of $4. You electto set a stop at 3x volatility and you will risk 2% or $200.00. If I understand your logic,this means you could only purchase 200/12 or 16 shares and stay within the guidelines.Now here is my real question. If you set the stop at 3x volatility, but find statistically thatVan is correct, and on average you stop out at 1.5x volatility, then could you increase yourrisk to 4% and achieve the same results. Somehow this seems mathematically equivalent,but logically I think the overall risk increases.A:Volatility has nothing to do with the stop. If the ATR is $4 and your 2% allocation is $200,then you would purchase $50 shares. If you are using a 2% risk allocation (i.e., $200),and your stop is a three times volatility stop, then you would purchase 16 shares. Risk andvolatility are not the same thing for position sizing allocations. Since that is the case, yourlogic is wrong. You would probably only use a volatility allocation when you were using avery tight stop like a dollar. In that case, you would by 200 shares, so a 2% volatilityallocation of $50 is safer.In a nutshell, volatility position sizing is totally independent of your stop. You keep yousame stop, you just size your positions based upon volatility.If you are using stock data, then I wouldn't recommend a volatility stop. I'd trail a 45 daymoving average.

You have stated that a good money management plan should involve risking a percentageof total equity and that the volatility should also bea percentage of total equity. How would one measure volatility so that it is a percentage oftotal equity?Answer:You would measure volatility according to a 10 day exponential moving average of theATR. Let's say that's $3.00 Thus, for 100 shares of stock it is $300. If you have $100,000and wanted to trade a 1% volatility algorithm, you could expose $1000 to volatility. Sincevolatility is $300 per hundred shares, you could have 333 shares.---------80% - 90% of traders lose - 10%-20% are consistent winners.----------Van Tharp:3 MM algorithms (Minimum will be taken):1) 1% of core capital:a) (core capital - Total outstanding risk)*0,01 = xb) x / $ value of initial stop = Nr. Contracts I2) new risk limited (total risk <=25% of equity): before execution: equity * 25% - totalrisk= yif y >0, y / $ value of initial stop = Nr. Contracts II3) ongoing volatility (10 day M.A. of ATR): max 2% of equity----------My initial stop I place very close sometimes to close but statistically it works and I alwayslimit my losses to very small amounts when I am wrong. My initial stop is placed 1 tickbelow the previous days low. As the stock goes up I move my stops up to continuallyprotect my profit.I will loosen my stops some as the stock moves so as not to get stopped out by generalfluctuations, but I generally keep stops with in 10 - 15% of where the stock closes.----------
!!! Use expectancy + know what it means to be wrong ten times in a row in a goodsystem !!!
Trading Program/Software is difficult because most vendors cater to the model ofpredicting the market and they give people what they want.
------------------------------------------------------------------------------------------------------------------------------------------------
Market Wizard System -- here's a candidate
Mark [email protected]/04/21misc.invest.futures
Here's my test results of a Market Wizard System. It is profitable,averaging a compound growth rate of 65% per year for twelve years(net gain 420X in 12 years). It traded an initial stake of $100Kand ran the equity up to $42 million after twelve years.

The system is found on page 60 of LeBeau and Lucas's book,_Computer_Analysis_of_the_Futures_Market_. Unfortunately that meansthe system is unacceptable to Andrew St. John Goodwin, the originatorof this news thread. Ah well, he no doubt has accumulated bettersystems anyway. Still, this one might perhaps be useful for"diversication across a number of different systems," which itselfis a Market Wizard principle.
A few details about my tests:* I used commissions = $50 per contract per round trip* I used slippage = 4 ticks per contract per round trip(for example in the Deutschemark, 1 tick = $12.50 so thecommissions+slippage in DM is $100.00/contract)* I tested from 01 January 1985 to 18 April 1997 (last Friday)* I tested the system on the 25 markets that I myself happento trade in my own real-money futures account. Theseare the markets for which I always have continuous,up-to-date data files ready for testing:BP C CD CL CT DM DX ED FYHG HO HU JO JY KC LB MB MPNG SB SF TB TU TY US* I used a Market Wizard "money management" rule: always riskexactly 2.6% of total (closed + open) account equity onevery trade.* I used the software package "Trading Recipes" by RW Systemsto perform the tests* I started the historical test account at $100K. You maydispute whether this is too much (or too little) tostart simultaneously trading 25 futures markets. Butthat's what I did.
File: LEBEAU.GODate: 21 Apr 97
----------------------------- Performance Summary ---------------------------
Net Win Loss 42,053,156 Capital Required 36,143 Percent Wins 41.6% Date of Requirement 850404 Trades, Trades Rejected 1427 0 Wins 594 153.3M Total Slpg + Commssn 24,733,183 Losses 833 111.2M Start Up Capital 100,000 Long Wins 346 94,867,737 Margin Calls, Max 0 0 Long Losses 427 52,638,274 Max Items Held 13,617 970404 Short Wins 248 58,478,932 Days Winning, Losing 1630 1424 Short Losses 406 58,655,237 Expectation, Kelly 22.1% 11.4% Max Consecutive Wins 8 15,950 Comp. Anul. ROI, ROI 65.0% 42053.2% Max Consecutive Losses 14 9,202,127

Largest Winning Trade 5,325,899 Start Date, End Date 850326 970418 Largest Losing Trade 1,183,200 Total Items Traded 217623 Average Winning Trade 258,159 MAR Ratio 1.38 Average Losing Trade 133,606 New Highs, Percent 269 8.8% Avg $Win to Avg $Loss 1.93 Max Drawdown by %, $ 46.95% $15.76M % on 891101 $ on 960304 Longest Drawdown 1.39 years 950707 to 961125
Here's the "equity curve". For brevity I've only included 6 equityreadings per year; this keeps the message length manageably small.There's nothing sinister here; I'm just "saving bandwidth" as theUsenet expression goes.
850201 100000.00850401 97830.15850603 114061.95850801 128820.94851001 138293.08851202 169813.23860203 216806.97860401 288582.59860602 285737.25860801 254516.64861001 230563.89861201 243111.95870202 327757.22870401 328005.34870601 416479.59870701 400805.09870803 471144.72871001 498039.31871201 678973.75880201 755799.69880401 714359.19880601 688729.88880801 1067212.50881003 1039365.00881201 1201548.50890201 1363686.00890403 1484712.38890601 1684390.50890801 1887812.75891002 1256556.75891201 1103038.00900201 1820179.38900402 1966021.63900601 1868241.38900801 2269144.75901001 3050966.25

901203 3390288.25910201 2887254.25910401 2751789.75910603 2450820.50910801 2247085.50911001 3246755.00911202 4257608.50920203 6582033.00920401 5058539.50920601 5094387.50920803 8523964.00921001 10232035.00921201 8946255.00930201 8634425.00930401 10871372.00930601 10686823.00930802 11951045.00931001 11933584.00931201 10493555.00940201 10365359.00940401 11514206.00940601 12596234.00940801 17350238.00941003 14743892.00941201 17446028.00950201 15582884.00950403 24957432.00950601 30482370.00950801 28926444.00951002 23099142.00951201 25886892.00960201 27243478.00960401 27255586.00960603 31130510.00960801 29642532.00961001 27338004.00961202 37941076.00970203 36292488.00970401 43538832.00970418 42153156.00
In article [email protected] (UBCHI2) writes:> I am a professional hedge fund trader looking for some new> technical systems. If you know the rules of a Wizard system,> email a description and statistical summary of results. If it> checks out, I will make you a cash offer on it. If you need> privacy, just leave a phone number or email for mine.> Publicly available systems not acceptable.> --Please no day of week, volatility expansion, channel breakout,

> oscillator, bar chart pattern or other common methodologies.> Only a totally mechanical method will be purchased.> Andrew St. John Goodwin
------------------------------------------------------------------------------------------------------------------------------------------------
Re: Turtle Trading Seminars Mark [email protected]/08/09misc.invest.futures
In article [email protected] (Ken Skaggs) writes:# I just received a direct mail peice telling me that# for $2500 I can learn from one of the Turtles, Russell# Sands. With all the usual caveats, like why is a successful# Tutle going public, does anyone know anything about # this seminar?
> Subject: Simulation of the Turtle system (Re: What's the best system?)> Date: Fri, 14 Apr 1995 18:12:14 GMT> Here's a copy of an email I placed on the omega mailing list> in November 1994. > Despite Dave Chamness's provocative subject line> "What's the best system", I don't mean to state, imply, or> suggest that the Turtle system is in any way "best". It's> a system, a long term trend following system. That's all.> >> > A while back I used Omega Research's System Writer Plus> > (abbreviated SWP) to analyze the Turtle System as> > propounded and sold by Russell Sands, one of the original> > "Turtles" trained by R. Dennis and W. Eckhardt. See> > the book _Market_Wizards_ by Schwager for more of the> > Turtle story if you're interested in the history.> > Anyway, because of limitations in the System Writer> > Plus software, I deviated from Russell's teaching in two> > ways that _might_ be important.> > 1. Russell adds more contracts onto trades that show> > a profit, under control of a table of what-to-do> > contingency instructions created by Richard Dennis.> > (Adding more contracts onto existing positions> > is called "pyramiding".) SWP doesn't do> > pyramiding, so I left it out. In Russell's terms,> > I always traded "single, 1N units".> > > > 2. Russell provides a specific formula for determining> > how many contracts to trade (one aspect of "money> > management") which is a function of the equity level

> > in your account on the day you initiate the trade.> > I didn't do that. I made constant-size bets> > throughout the year, and I only adjusted my betsize> > once per year, on December 31, based on the equity> > in the account on that day. I found it a whole lot> > easier to program SWP this way; it's difficult to> > continuously compute the total equity in an account> > that's trading multiple commodities simultaneously.> > Difficult in SWP, that is.> > > > With those two deviations, I programmed up the Turtle> > System in SWP. I used system parameters found> > on the diskette that Russell provides (Initiation> > parameter = 40, Liquidation parameter = 15). I ran a> > SWP historical simulation of ten years of trading, from> > 3/31/84 to 3/31/94. (I was using Omega's "20 year"> > historical data package, which stops at 3/31/94. They> > promise an update Real Soon Now :-)> > > > I charged myself an outrageously high $125 per round> > trip trade, PER CONTRACT, for commission and slippage.> > Even at full commission brokerage houses, commission> > per contract drops quite low when you trade more than> > one contract at a time. Still, I felt that if the> > system could show a profit under these difficult testing> > conditions, it would be a very good sign.> > > > I ran the simulation on eight commodity markets.> > Russell's data indicates the Turtle System is weak> > in the grains and the meats, so I left them out.> > The markets I used were> > Crude Oil> > Japanese Yen> > Coffee (Note that the monster coffee> > Deutsche Mark trend of 1994 took place AFTER> > Orange Juice 3/31/94 and so was not included> > Swiss Franc in the simulated trading)> > 30 Year T Bonds> > British Pound> > > > I staked myself to 100 grand and started the historical> > simulation of trading. What were the results? Here's> > the yearly equity statement:> > > > DATE TOTAL EQUITY OPEN TRADES CLOSED TRADES> > > > 03/31/84 100000.00 0.00 100000.00> > 12/31/84 151390.00 25990.00 125400.00> > 12/31/85 414672.50 200176.25 214496.25> > 12/31/86 542322.50 143495.00 450117.50

> > 12/31/87 1320185.00 422156.25 898028.75> > 12/30/88 1882528.75 202292.50 1680236.25> > 12/29/89 2608198.75 646685.00 1961513.75> > 12/31/90 5127685.00 -35650.00 5163335.00> > 12/31/91 8101231.25 2370407.50 5730823.75> > 12/31/92 10941421.25 166010.00 10775411.25> > 12/31/93 14214740.00 1428970.00 12785770.00> > 03/31/94 12901833.75 0.00 12901833.75> > > > The worst drawdown period in percentage terms was December> > 1990 through August 1991, when total equity dropped from> > $5,712,182.50 to $3,953,901.25. (A decline of 31%).> > There was also a decline of 24% from July 1993 to February> > 1994. In the ten year period I simulated, the system made> > a total of 500 trades. (6 trades per year in each> > market). The winning percentage was 40%: 198 winning> > trades, 302 losing. Overall, I was pretty pleased with> > the results.> > > In what is probably a futile attempt, I will _try_ to answer the> two most commonly asked questions here, in the naive hope it> may reduce the number of repeated replies/followups:> >Q1. Tell me the trading rules of the Turtle system.>A1. Buy them from the vendor. He advertises in Futures>magazine and Technical Analysis of Stocks and Commodities>magazine.> >Q2. Why didn't you compute Statistic X? If you had a brain>you would know that Statistic X is vitally crucial for>a proper scientific evaluation of a trading system.>Your failure to include Statistic X means either that>you're hiding something, or you're a nitwit, or both.> >A2. I typed in what System Writer Plus prints out; there's>no intent to deceive or mislead. I'll be glad to email>you the sequence of trades and the equity stream from>the SWP simulation so that YOU can compute Statistic X.>Best regards, Mark Johnson
------------------------------------------------------------------------------------------------------------------------------------------------
HERE IS: Source code for Option Pricing, binomial model
Mark [email protected]/05/20misc.invest.technical, misc.invest.futures

Here's the Binomial model, used to compute optionsprices for both American and European style expirations.You can test and cross-check the answers by comparing theprogram's prices for European options, with a Black-Scholessubroutine.
You get what you pay for. You paid zero for this code.Think about it.
--------BEGIN--------BEGIN--------BEGIN--------BEGIN--------BEGIN--------#include #include
void option_val(x, k, r, v, dx, days, n, european, cval, pval, cd, pd)double x ; /* current index price */double k ; /* option strike price */double r ; /* annual T-bill interest rate *//* NOTE: rdouble v ; /* annual volatility; 0<vdouble dx ; /* dividends (fraction); 0<dxint days ; /* how many days to expiration */int n ; /* how many iterations of the algorithm */int european ; /* if 1 then European, otherwise American */double *cval, *pval ; /* call value, put value */double *cd, *pd ; /* call delta, put delta */{double s[200] ;double c[200] ;double p[200] ;
double doubl_n ;double nd ;double time, tn ;double divt, div ;double v0, r0 ;double u, d, du, ur, a ;double q1, q2 ;double rkm, pdm ;double y, t0 ;
int i ;
if(x <= 0.0) fprintf(stderr, "Hey bozo, index price must be >0, not %.4f\n", x);if(k <= 0.0) fprintf(stderr, "Hey bozo, strike price must be >0, not %.4f\n", k);if((r <= 0.0) || (r >= 0.25))fprintf(stderr, "suspicious interest rate %.4f\n", r);if((v <= 0.0) || (v >= 0.5))fprintf(stderr, "suspicious volatility %.4f\n", v);if((dx < 0.0) || (dx >= 0.3))

fprintf(stderr, "suspicious fractional dividend %.4f\n", dx);if(days <= 0) fprintf(stderr, "Hey bozo, days must be >0, not %4d\n", days);if((n <= 0) || (n>195))fprintf(stderr, "suspicious number of iterations %4d\n", n);
doubl_n = (double) n ;nd = (double) days ;time = nd / 365.00 ;tn = time / doubl_n ;divt = 1.0 - (dx * time) ;div = 1.0 / pow(divt, (1.0/doubl_n)) ;v0 = v * sqrt(tn) ;r0 = 1.0 + (tn * log(1.0 + r)) ;u = exp( (r0 - 1.0) + v0 );d = exp( (r0 - 1.0) - v0 );du = d / u ;ur = 1.0 / u ;a = (r0 - d) / (u - d) ;q1 = a / r0 ;q2 = (1.0 - a) / r0 ;
/* set expiration values for index, call, and put */s[n] = x * pow(u, doubl_n) * divt ;for(i=n; i>=0; i--){a = s[i] - k ;c[i] = 0.0 ;if(c[i] < a) c[i] = a ;p[i] = 0.0 ;if(p[i] < (0.0 - a)) p[i] = 0.0 - a ;if(i > 0) s[i-1] = s[i] * du ;}
/* initialize values for present value of dividend */y = dx / time ;t0 = 0.0 ;rkm = 1.0 ;pdm = 1.0 ;
/* do n iterations of the model */while(n >= 1){if((dx = 0.0) || (european == 1)) goto do_iteration;/* adjust for dividend payment */for(i=0; i<=n; i++){s[i] = s[i] * div ;a = s[i] - k ;if(c[i] < a) c[i] = a ;

a = (k * rkm) - (s[i] * pdm) ;if(p[i] < a) p[i] = a ;}/* compute new present value of dividend */t0 = t0 + tn ;rkm = 1.0 - pow((1.0 + r), t0) ;pdm = 1.0 - (y * t0);
do_iteration:for(i=0; i<=(n-1); i++){c[i] = (q1 * c[i+1]) + (q2 * c[i]) ;p[i] = (q1 * p[i+1]) + (q2 * p[i]) ;s[i] = s[i+1] * ur ;if(european != 1){a = s[i] - k ;if(c[i] < a) c[i] = a ;a = (k * rkm) - (s[i] * pdm) ;if(p[i] < a) p[i] = a;}}/* if n=2, use values to compute deltas */if(n == 2) {a = x * (u - d);*cd = (c[1] - c[0])/a ;*pd = (p[1] - p[0])/a ;}n--;} /* next n */
*cval = c[0] ;*pval = p[0] ;
}
/* a little stub to test out the options valuation subroutine */main(){int n, number_of_iterations ;double number_of_days ;int days ;double dx, dividend_dollars_through_expiration ;double v, index_annual_percent_volatility ;double x, current_index_price ;double r, interest_rate ;double k, option_strike_price ;

int european ;double cd, pd, cval, pval ;
number_of_iterations = 50 ;number_of_days = 95.0 ;current_index_price = 351.25 ;index_annual_percent_volatility = 0.16 ;dividend_dollars_through_expiration = 3.00 ;interest_rate = 0.075 ;option_strike_price = 345.00 ;european = 0;
n = number_of_iterations ;days = (int) number_of_days ; /* (expiration_date - today) */dx = dividend_dollars_through_expiration / current_index_price ;v = index_annual_percent_volatility ;x = current_index_price ;r = interest_rate ;k = option_strike_price ;
option_val(x, k, r, v, dx, days, n, european, &cval, &pval, &cd, &pd) ;
printf(" Call Value %11.4f Call Delta %11.4f\n", cval, cd);printf(" Put Value %11.4f Put Delta %11.4f\n", pval, pd);
}

Money Management 2
Ray Barros:
THE ROLE OF MONEY MANAGEMENT
Introduction
I have noticed that in newsgroups and trading magazines, the emphasis is on trading systemsand/orapproaches. On the other hand, theoretical works tend to emphasize the primacy of moneymanagement.
For example, in a chapter entitled "The Secrets of Successful Trading" in Street Smarts,Fernando Diazconcluded:
"Successful traders have a larger edge and better money management than unsuccessfultraders. Unlike popularbelief however, this study shows that the smaller edge of successful traders is not the cause oftheir failure.Traders' failures can be explained almost exclusively by their poor money managementpractices."
While I agree with this statement in principle, I am certain a trader's plan must give him anedge. Good moneymanagement will not save a plan without an edge; all it will result in is slower ruin. In"Anatomy of a Trade", Iindicated the elements I believe are essential to giving a trader his edge.
In this article, I want to outline the best money management approach I have encountered.
W Gallagher's method set out in "Winner Take All".
Gallagher's Money Management
This section will be divided into three parts:
1) disagreement over % stops
2) the pillars of the approach
3) a spreadsheet formula for the approach
Fixed % Stops
Gallagher argues that "risk to trading equity cannot be reduced by reducing the amount riskedon each trade".
Let's illustrate this by way of an example Gallagher uses in his book.
Traders A and B both have $20,000.00 and both want to take a trade in Soybeans that may netthem$4,000.00 per contract. Both decide to trade 1 contract.

Trader A decides to risk $5,000.00 and Trader B $400.00. Trader A thinks his trade has a riskreward ratio of1:4; trader B, 1:10.
Gallagher argues that the risk /reward for both traders is exactly the same because "thestrategy risking$400.00 can be expected to be stopped out two and one-half times as often as the strategyrisking $1,00.00".
To quote Gallagher:
"You can drive from Toronto to Miami in one day, or you can spread the drive over three days; itstill takes thesame amount of gas to get there. The small amounts risked with very tight stops will bebalanced by the highfrequency of occurrence of losing trades."
For me this is true only if you believe the market is random and/or your stop placement is amoney stop ratherthan a technical stop. On the other hand, if you believe, like I do, that the market has astructure, then stops canbe placed at levels which if hit indicate the trend has changed.
As an example, in "Anatomy of a Trade", I set a stop for the A$ at 7782 because if the marketgot to that level,the trend would change from up to down in my time frame.
If my belief is right , you first determine your stop and then see if the dollar value from entry iswithin your risksparameters. If not, you skip the trade. Given my trading results, I am happy to risk 2% to 5% ofcapital. Eachtrader has to set his boundaries. These boundaries are determined by a trader's profitabilityprofile, ie
* his historical run of outs,
* percentage of wins: percentage of losses,
* average $ win: average $ loss etc,
and his psychological tolerance to loss. Here I'll mention one factor. I have had the opportunityto observe manytraders over the years. On average I would say that at the 20% drawdown mark, most tradersstart to lose it - theirdiscipline starts to go, they start to look for new methods etc. So as a general rule, set yourboundaries for amaximum loss of 20% and you won't go too far wrong.
To conclude this section.
Unlike Gallagher, I believe a maximum % loss has a part to play in keeping a trader fromblowing out.
Having said that, maximum % loss is not the only criteria. There will be times when the unusualevent will occur(and in trading, it seems to happen all too often!)
To protect against the rare occurrence, the key element is exposure. And it is here thatGallagher comes into hisown.

The Pillars of the Approach
By exposure Gallagher means the dollar amount needed to cover each open position.
Risk to equity increases with exposure and with time. To adopt Gallagher's approach a traderhas to decide forhow long he wants to trade and the maximum draw down he would expect to experience in theperiod. Gallagherpostulated as a result of his trading experience, a 25 % probability of a 50% draw down in tenyears.
The next step is to calculate objectively the largest equity drop (LEED).
"Once LEED is ..... determined, the trader can then make a logical decision on how he wishes tofinance thisLEED. He can be aggressive, or he can be conservative - as long as he is aware of the risks he isrunning."
To work out the LEED, first work out the average daily range (rather average true range) overthe period of the results under consideration;then work out the $ value of your trading results in terms of the daily range. This gives you aresult in units.(example: let's say the average range of D-Mark is 40 points and you make 120. The win resultis 3).
Once this is done, you can calculate two things:
1) a probability distribution of your method (ie your edge quantitatively determined) and
2) the LEED
Let's look at an example for the LEED
Trade Gain/loss (in units) Cumulative Equity LEED
1 -1 -1 1
2 -1 -2 2
3 0 -2 2
4 2 0 2
5 3 3 2
6 -1 2 2
7 6 8 2
8 -5 3 5
You get the idea.
Gallagher takes the view that most methods with a 10% edge need 40 units to finance onecontract of anything.Gallagher calls this the "R" factor.
He also found that LEED is a function of the square root of the trading time and therefore a

function of thesquare root of the number of the independent positions being taken.
Once you have worked out the "R" factor you can work out the dollar value of any contract.
As an example, at the time of Gallagher was writing, the US Bonds had an average daily rangeof 24 points for adollar value of $750.00
If we assume Gallagher's desire not to exceed 50% draw down over 10 years of trading and a10% edge, we willhave a 40R requirement.
To finance the US Bonds:
Number of Positions Amount Required
1 $ 30,000.00
2 $ 21,000.00
3 $15,000.00
Note that as the number
The Formula
Col A: The instrument you are trading.
Col B: The probability of drawdown over your trading life . I have adopted Gallagher 's 25%.
Col C: The number of independent positions.
Col D: Col B/Col C
Col E: The dollar value of daily mean range
Col F: The "R" value. Notice that Gallagher worked out that for his method he needed 40R, Irequire20R. You may require more or less "R"s.
Col G: Square Root of Col D x Col F
Col H: 1st line ; in the example above Row 8 , original capital / Col 6;
thereafter Col J in previous row / Col G; in the above example, J8/G9.
Col I: The actual number of positions taken.
Col J: 1st line: original capital minus (Col I x Col G)
thereafter previous Col J minus (Col I x Col G).
Note in the example above the amount required if the A$ is part of two other independentpositions isA$16,500.00; whereas if it is traded alone, the amount required is A$28,500.00.

Conclusion
In this article, I have suggested that risk to equity can managed by two factors:
a) technical stops that do not exceed a fixed percentage of the trader's equity and
b) the Gallagher formula for exposure.
Both depend on the trader's personality, profitability profile and the volatility of the market.
Dated 1st day of July 1996
R Barros
---------------------------------------------------------------------------------------
ANATOMY OF A TRADE
My aim here article is to give an example of theprinciples I outlined previously. I shall be consideringthe a$/US as at July 3rd 1996.
Trend Analysis
In any trading plan, the first requirement some means ofidentifying of trend of the timeframe we are trading (I callthis, a "trader's timeframe"). For reasons outlinedpreviously, this implies:
a) we have some means of identifying moves of similarmagnitude, and
b) we have some means of identifying changes in thetrend of trader's timeframe.
I would also add that the trader's timeframe's trend maybe influenced by the trend of the next higher timeframe.
To determine trends, I use swing charts and a wavetheory of my own (R-Wave). The latter is based oncategorising corrective waves to define moves of similarmagnitude,
On July 3rd 1996, the quarterly trend had just given aconfirmed change in trend to the upside (no chartshown). As long as the a$ did not accept below 7795before breaking above 8045, I was happy that thequarterly uptrend was intact.
Chart 1 shows that the monthly swing chart had justgiven a confirmed breakout to the upside. As with thequarterly, I wanted to see a lack of acceptance below7705.
Chart 2 shows that wave (1) had completed and wave(2) should terminate between 7890-7920 with the meanat 7807 being the most probable termination point,

At the end of the trend analysis, I had come to thefollowing conclusions:
1) The trader's timeframe (monthly) was up. Acceptancebelow 7705 would change this view.
2) A preliminary support zone for wave (2) terminationwas 7694 - 7920, with the mean retracement at 7807.
Given what I said in (1) above about 7705, the range for(2) was 7705 - 7920.
Once we have determined the trend, we have ourstrategy. We now need a low risk entry.
Low Risk Entry
The next step in the trading plan is to identify a low riskentry zone. I look at three factors.
1) Some area which is likely to mark the end of thecorrective move. The tools I use here are Dynamic GannLevels and Steidlmayer Distribution zones.
For DGL's, level 2 support came in at 7807, the samenumber as the R- Wave mean. The Distribution buy zonecame in at 7841 - 7812 (See Chart 3).
2) Once a zone is determined, you need something (a chart pattern or principle) to tellyou that the zone has held - what I call a setup.
In this case, the bar of July 3rd was a Wyckoff "spring" - also known in Distributionterms as a 313 outside - The market dipped below the previous low at 7812 and wasunable to go on with the down move.
These patterns were examples of the principle of "effort vs. result". The strong movedown of on the July 2nd should have led to some further losses. None wereforthcoming as at the close of trading on July 3rd 1996.
3) After a setup, I need an entry technique. For me that came on July 4th when the90 mins chart (not shown) produced a confirmed change in trend.
Stops were below 7782 and made up as follows:
7806 - (8045 - 7806)* 10% = 7782
Once in the market, we have to manage the trade. Let's look at that now.
Trade Management
Normally I would wait for the market to enter the 8045 - 8014 zone before taking 1/3or 1/2 my positions out, However on Friday July 5th (see chart 4), we had a range of1048 points!
The mean daily range for the a$ at present is 45 points with a standard deviation of15. That means that the 145 point range had less than a 1% chance of occuring.

Even allowing for statistical error, Friday's range was excessive.
Given that range, I pulled 1/2 my positions out once the 90 mins showed that the upmove had stalled. The point is, I am not sure if Friday's move is a sign of strength or iflike a rubber band stretched too far, there is a strong down move to come.
As it stands, I can now bring up the stops on the remaining position to
7788 made up as follows:
7806 - (7980 - 7806)* 10% = 7788.
This gives me a "free run" for this trade ie even if stopped out, I make a few dollars.
If the market, moves into the 8045 - 8014 zone, partial positions would be liquidatedand stops moved up.
So there we have it an anatomy of a trade.
A Final Comment
I have come across many traders who "just want the secret" to make money.
In a sense there is no "secret". Traders who make money do so because they have atrading plan with an edge that incorporates effective money management. They thenhave the discipline to execute it relatively flawlessly and the self esteem to accept themoney the market gives them.
Then again may be that is the "secret".
Happy and profitable trading!
---------------------------------------------------------------------------------------
Sigma of mean return declines over timeSigma of total return rises over time
I realize if I had started trading in March last year I would havebeen blown out, so will only increase position size when I can limit riskto 2% per trade.
...ask is touched on a buy stop or when the bid is touched on a sell stop.
often exit positions long before I am stopped out !!!
I executed long trades at 1,785.Target for my second third was 1,891 - 1,866First resistance was at 1,843 - 1,832 I exited the first third at the low 1,830's. Not only did that zonerepresent resistance, it was also the area that allowed me to break even onthe remaining 2/3s if stopped out.I was wrong about this week's direction and took out the second third in thehigh 1,800's. If I was wrong about the week's direction, it was probable Iwas wrong about the mkt getting to the 18910 zone.The stop on the remaining 1/3 has been raised so that if I am stopped out,I should lose no more than 50 points (allowing for slippage) on the last 3rd.
Preservation of capital and consistent profitability is most important.As Steidlmayer used to say "trading is 10 months of grind and 2 monthsof gravy. If you can stay ahead in the 10 months of grind (or least lose

very little), the 2 months of gravy will make you a very successful trader".
With any system, you can "over filter" either it is by adding seasonalconsiderations or just too many filters. The trick is when adding filtersone must be sure that the filters do not contradict each other. When thishappens you have created your own version of chaos.
ATR D-Mark its about 40 ticks
Set a stop at 3 ATRs under the entry, reversing when it hits the stop.Then adding an additional contract to when the stop is moved up another ATR.This assumes that you can get out reliably with simple stop orders. Thats notalways the case, especially when multiple contracts are pyramided up.The money management step, adding on the contracts with each movement of thestop and then adding positions with "the markets money" is what makes themoney. The real money is not made with the usual 1 to 3 strike moves in thissystem. Its in the pyramiding that can take place after a position becomesriskless. If it goes on past the 3 or 4 strikes and another similar positionis added, it then only takes a 2 strike move to become riskless again.You have twice as many positions working. Then another pair of futures andoptions are then added, using the equity from the previous positions requiringonly a 1 strike move to become riskless. It doesn't take much of a trend togather 64 or 128 contracts/options to become "ballistic" and still not haveany additional risk to your account using "the markets money" to pay the way.It just takes getting over trying to be "right" all of the time and lettingthe market take you where it wants to go. When the move is over, you juststart over again in the opposite direction with the 3% risk again - hopefully.
chi squared test: indicate that the improvements are unlikely to be random.
Look at the momentum of what is happening. If volatility and momentum go toa certain level and get way out of line, I'm looking for a reaction in theother direction and then I put on a trade.search via e-mail?
-------------------------------------Ray Barros:
You are right. Money Management attempts to answer these questions:
* how much to allocate as initial deposit* how much to risk per trade* how to allocate among competing opportunities.* number of contracts to be traded.
> I tried to increase postition size according to the %return on> margin (the higher it grows the higher the number of contracts), when> %return on margin calms down, I decrease postition size, but the results> are not very satisfactory.> I also tried to increase/decrease postition size according to the> dependency among the last x trading days of a trade. When there is a> Win-Lose-Win-Lose pattern I increase-decrease-increase-decrease, when> there is a Win-Win-Win-Win pattern I increase continuosly (e.g. every 5th> day). Also not very satisfactory. Am I on the right track but on the wrong branch?
**************************************************************************** I am not a believer in increasing/decreasing the size of my capital a matter

of course (=selbstverständlich). My reasoning is thus:"If a have a 65% probability of winning on a trade, the probability does change because you have had a run of outs or wins."
I have simple rules about increasing the size of my capital. Whenever Iachieve a 30% increase, my capital base increase by 15%.
Example: I start out with $100,000.00. When I have made $30,000.00,my capital base increases to $115,000.00. When I have made $35,000, (arounded 30% of $115,000.00) my capital base increases to $132,000.You will note that I round up for the requirement of 30% increase and rounddown for the capital base increase.
If I increase my bank by 15% and I suffer loses gives back all of the 15%,I return to the original bank.Example: I increase by %15,000 to $115,000.00 and losses of $16,000.00accrue, my bank drops to $100,000.00 for money management purposes.
****************************************************************************
The best books I have come across on the subject in increasing order ofimportance on my ideas on Money Management:
* Gallacher "Winner Take All". There is a chapter on MM which is betterthan any book.
I take issue with (anderer Meinung sein) Gallacher's attitude to 2% on a technical andpsychologicalissue rather than mathematical. However that is because I am a discretionarytrader - his argument is directed to the mechanical trader.If you read his book and want to take the discussion further, please write.
* Balsara'a "Money Management Strategies for Futures Traders". Poses goodquestions but the answers are inadequate.
* Gehm's "Commodity Market Money Management". Good book for introducing theprobability issue. That title is probably out of print. However Gehm did havea re-write 2/3yrs ago with a new title but I cannot recall its name.
regards
ray---------------------------------------------------------------------------------------RANKING OF TRENDS
In "Anatomy of a Trade", I said that identifying the trend of the timeframe you aretrading is important because it sets up the strategy for your trade. In other words, inan uptrend, you buy dips or upside breakouts, in a downtrend, you sell rallies anddownside breakouts and in a sideways trend, sell the top end of the range and buythe bottom end.
It is almost a cliche that "trends are where traders make their money". However, Ibelieve that you need to go beyond merely identifying a trending market. To maximisemy profits, I would rank the type of trending market I am in.
For the purposes of these notes, I am assuming a monthly uptrend. Themonthly is therefore the "trader's timeframe trend".
Moves in the direction of the trend (ie up moves), I shall be calling "impulse moves" or

"impulsive" and moves in a direction opposite to the trend (ie down moves), I shall becalling "corrective moves" or "corrections".
This article will suggest four categories. They are ranked from "0" to "3", with "0" beingthe most difficult to make money and "3" being the easiest provided you can identifyit.
The key to the categories is the relationship between the impulse and correctivewaves by the amount that one overlaps the other.
Ranking "0"
Characteristics
1 Corrections of the impulse move tend to be between > 67% to < 87.5%.
2 Breakouts are followed by a correction between > 67% to < 87.5% and a deepre-entry (ie greater than 50%) into the previous correction.
eg After the breakout at "3", the market retraces between > 67% to < 87.5% of "2" to"3" and greater than 50% of "1" to "2".
3 At either Point 5 or point 7, the trend or trend type will change. In other words, themarket will either change from an uptrend to a downtrend or at Point 5 or point 7change to a Ranking of 1 or 2 or 3
Profit Potential
Unless you identify it, it is difficult to make money in this type of trend.
Breakout traders have to wear the pain of the retracement. Most will place their stopsbelow the 50% or 67% retracement areas and will continually get stopped out.
Responsive buyers
ie buyers on dips
will probably not get set.
Responsive sellers at the top end of the ranges will make some money if they takepartial stops or use some form of trade management. Otherwise, they also will bestopped out continually.
Ranking "1"
Characteristics
1 Corrections of the impulse move tend to be between > 33% to < 67%.
2 Breakouts are followed by a correction between > 33% to < 67.% and a shallowre-entry (ie 50% or less) into the previous correction.
eg After the breakout at "3", the market retraces between > 33% to < 67.% of "2" to"3" and 50% or less of "1" to "2".
Profit Potential
Profit potential is reasonable.
The danger points are the correction following the breakout when re-entry occursbelow the point of breakout. Good trade management is necessary.
Ranking "2"
Characteristics
1 Corrections of the impulse move tend to be between > 33% to 50%.
2 Breakouts are followed by a correction between > 33% to 50% and no re-entryinto the previous correction.
eg After the breakout at "3", the market retraces between > 33% to 50% of "2" to "3"and above "1".
Profit Potential
Profit potential is excellent as this is the most orderly of all the trends. When themarket retraces into the previous correction's range, you will KNOW that a CIT isimminent.
Ranking "3"
Characteristics
1 Strong (in terms or price and time) directional move after a confirmed CIT onbreakout above "1".
2 No corrective moves.
Profit Potential
Profit potential is poor unless identified early or you have developed special rules todeal with it. This type of trend can prove very frustrating for the responsive trader asthe market steams ahead without any corrections.
Breakout traders can make excellent money as the market quickly turns poor tradelocation into fine ones.
Novice traders learn extremely dangerous habits as they "learn" that the market willget them out of trouble as long as they trade with the trend and "isn't easy to identifya trend that will go on forever" (??!!)
There you have a method of ranking trends. In my next article, I shall look at someexamples.
Happy trading 27/08/96
---------------------------------------------------------------------------------------
RANKING OF TRENDS
PART II
In the first part of this article, I outlined the concept of "ranking of trends".
Here I shall look at a practical application reviewing the current US/Jy picture. The trader'stimeframe is the monthly trend.
In the above chart, the monthly trend has been up with a ranking of "0". In the previous articleIsaid,
"3 At either Point 5 or point 7, the trend or trend type will change. In other words, themarket will either change from an uptrend to a downtrend or at Point 5 or point 7change to a Ranking of 1 or 2 or 3."
The question now is:
"Will the US dollar accelerate its uptrend or will we see a deep correction to at least 10335 andprobably below?"
The quarterly trend shows the US/JY still in a downtrend and currently in a sell zone. Even if weareto have a change in the quarterly trend from down to up, we can expect to have a test of thelow at8010. Generally the market will retrace to the 50% level around 9700 - 8965.
Given the quarterly picture, the probability is the monthly trend will break to the downside.
Identifying the actual setup and entry is beyond the scope of this example - the point of whichwasto illustrate the use of "ranking of trends".
October 7, 1996
---------------------------------------------------------------------------------------
Wyckoff, Steidlmayer and my own observations on how markets behave.
Let me introduce myself. My name is Ramon Barros. I have been a professional trader since1980.I trade the forex markets, and interest rate futures, Australian Ten Year Bonds, US 30 Years, theGilts and Bunds.
What follows are the basis of my trading approach.
My approach to the markets is a combination of Wyckoff, Steidlmayer and my own observationson how markets behave.
Here I would like to set out the principles that govern my trading so that you have a basis tofollowmy line of thought in future articles.
Wyckoff:
He was the first that I know of that drew the distinction between mechanical TA and subjective

TA.
The grandfather of the former is Schabacher. He studied charts looking for patterns that led tothesame result. In modern lexicon, the Edwards and Mcgee formations, head and shoulders etc.Herethe approach is observations of models and then finding as many carbon copies as possible.
With subjective TA, we begin with a set of principles. The observation is aimed at finding theseprinciples at work and responding to them in the appropriate manner.
"At this point there may be the inclination to say,
"What is the difference"?
There is a very basic difference. A formation is a constant. If the stock does not fit one of themolds.....it is eliminated.
A principle ....... is more than a constant. It is an absolute. In the case of the market, it is astatementof condition that is unequivocally true. Given a certain set of conditions, the result will alwaysbe thesame. These conditions may not and usually do not, produce carbon copy formations."
Introduction to the Wyckoff Method of Stock MarketAnalysis
Wyckoff articulated three laws:
The Law of Supply and Demand:
Market go up when demand exceeds supply and vice versa. He also identified that "in betweentheexcess of supply and demand, or demand over supply, is a state in which the two are inequilibrium"
COMMENTS: All of the above should be self evident. However many trading systems/approachesrecognise only two trends:
up or down
It’s the reason you get such huge drawdowns in non trending markets.
The Law of Cause and Effect
The effect realised by a cause will be in direct proportion to that cause. To get an importantmove(effect), there must be an important cause ie these moves take time to develop.
The Law of Effort and Result
What is important is not only price but also the character of the volume. When volume and pricearein harmony, the trend is likely to continue. When they are out of sync, positions are in dangeranddefensive measures need to be taken.
For example, in the US Bonds. We have had a down move which began on or about February

13th1996. From the 11th April lows onwards we see the market make new lows only to retrace backinto the previous congestion area.
On June 12th, we see a beak of the closing low of the past six weeks.
The volume was above its mean (in fact it was close to its mean plus 1 Standard Deviation); therange was below its mean and the net change was a mere thirteen ticks.
Given the disharmony, I would tighten stops on long term shorts and liquidate any freshpositionstaken on the break of the six week closing low.
Wyckoff did develop a model for identifying how markets moved, terminated its trends and theappropriate trading strategies. However, the model was secondary to the principles and a wayofillustrating their use.
Before we leave Wyckoff, I need to mention one other item.
Wyckoff believed that markets moved in waves as a trend progressed. The magnitude of theactionin time and price determined the nature of the underlying trend.
Given the above, it is critical to his approach we determine the trend of the timeframe we aretrading. The tool he used was a trend channel. What is important is not the tool but the mannerinwhich it is constructed.
"(In an uptrend)...The next step is to construct a justifiable trend channel (emphasis added)....The important word here is justifiable.
An uptrend channel is formed from a support line and an overbought line....To define a supportline requires two points.... they are to be low points of two consecutive reactions of similarimportance (emphasis added)..."
Introduction to the Wyckoff Method of Stock MarketAnalysis
The idea here is to measure moves of similar magnitude. I shall have more to say later on thissubject later on.
For now I would like to leave Wyckoff and turn to Steidlmayer.
Steidlmayer
Peter J Steidlmayer , floor trader and former director of the CBOT is known of his work on theMarket Profile and its subsequent evolution, the Steidlmayer Distribution.
Much of Wyckoff’s ideas are found in his work. As Steidlmayer has never acknowledgedWyckoff’s influence, I would say that he made his observations independently of Wyckoff. Imake this point to stress that two traders, centuries apart, have made similar observationsabout market behaviour.
Like Wyckoff, Steidlmayer believes that principles rather than models are the key to tradingsuccess. His key message is that trading is no different to any other business endeavour and

that the common management techniques used in other business endeavours are applicable totrading andinvesting.
My Own Work
Most of my own research lies in identifying what constitutes moves of similar importance. Ibelieve that one of the key failures of modern technical analysis is a failure to answer thisquestion. To determine the nature of the current trend, we first have to determine, themagnitude of that trend by some relatively objective means. One of the problems with the ElliotWave is subjective nature of the various wave classes.
For me, there are two ways of measuring moves similar moves - by time or price.
In the case of time, swing charts are easy to apply. In my own trading I use the 12 week todetermine the quarterly trend, the 18 - 20 day to determine the monthly, the 5 day to determinethe weekly and an intra day swing chart to determine the daily.
In the case of price - what was important to me was the magnitude of the corrective move. Forthis reason I classified all the corrective moves for each market and worked out the mean andstandard deviation for each. In this way, I know when one category ends and another begins.
Well that’s it. In the future, we’ll look at the specifics and their implementation.

Money Management 3
Date: Sat, 14 Dec 96 11:24:06 PSTFrom: [email protected]: Re: Tuition and Education To: [email protected]
================================================================================On Fri, 13 Dec 1996 04:04:17 -0500 (EST) Carl wrote:> I WANT and NEED 'HELP' in my trading decisions!!! >>I've "BEEN THERE and DONE THAT" but always,my way-NO DISCIPLINE!!! , seat>of the pants kind of stuff-------what a rush,a 30,000 + day,and then watch>the 'screen' in >a sort of trance for a 90,000 ---(minus) day! ..... (of course,day >trade,NO stops, >until my order taker asked for it)===================================================================================Hi Carl,Here are some suggestions and hope they can at least point you in the right direction.
I believe the transition from "mug trader" to "consistent profitability" needs the learning of three lessons.
1 thinking in terms of probabilities. Ultimately, this needs the developmentof a trading plan (including a money management plan).2 executing that plan as flawlessly as possible and3 accepting the profits the markets gives a trader as a reward for his efforts.
The first lesson is firstly technical ie acquisition of the relevant knowledgeand secondly psychological ie application of the knowledge. The other two lessonsare mainly psychological.
Generally I have found that most novice traders fail to have a plan; in other wordsthey fail at the first gate. To have discipline means to "execute your plan flawlessly";if you don't have a plan, then how can you expect to have discipline?
So what must a trading plan contain?
* Identification of the timeframe you are trading:
This means you have some means of measuring moves of a like magnitude and identifyingthe trend of that timeframe:up, down or sideways.It also means you have some means of identifying changes in trend.Once you have identified the trend and answered the question "continuation orchange", you have established your strategy.
in uptrends: buyin down: sell in congestion: buy the bottom end of congestion and sell the top end or just stand aside until a trend resumes.
Once you have your strategy, then you need to establish

* low risk entry
++ To do this, you need to have some means of establishing support or resistance areaswhere the market is likely to stall eg
- you're in an uptrend, a correction is in place, you need toestablish an area where there is a high probability the correctionwill end
- you're in an uptrend and given the structure of the market, you are looking for a change in trend. You need toestablish an area where there is a high probability the trend willwill end.
DGL's are great for this.
++ You then need to define a series of high probability setups. I definethis idea as indications that the support/resistance area are likely to be effective.
There are three groups of setups. These (with examples) are:
time: Delta, Gann dates, Fibo dates, cycles, etc
volume/price: Wyckoff, Arms etc
price: Candelsticks, 5VBT etc
You can of course mix setups from each group.
++ Finally you need to establish an entry technique and initial stop.
eg the ATR posted here recently.
The principle here is you need some means of identifying rejection awayfrom the zone.
* trade management
Once you are in a trade, you need to manage it.
++ at its most basic, this involves a trailing stop.
++ however, I have found that the "rule of three" allows you to takesome profits early while retaining the possibility of taking partin large trending moves - the best of both worlds. I postedthis idea before. If you missed it, e-mail me and I'll resend it.
When the trading plan is in place, you need to establish a moneymanagement approach. This has two purposes:
a how much capital is needed to fund each contract, b the stop loss for each position
Both questions are determined by four factors:
a financial capacity to lose ie your capital baseb psychological capacity for lossc the profitability profile of your methodologyd the volatility of the markets you are trading

I won't go into this here - this post is getting too long as it is. However I did write an article on this topic on the RealtradersWebsite, http://www.realtraders.com/.Go to "trading secrets" and to my "shelf".
regardsray-------------------------------------Name: ray barrosTel : 61 2 9267 3470Fax : 61 2 9267 3478101/25 Market StreetSydney NSW 2000AustraliaE-mail: [email protected]: 12/14/96Time: 11:24:06-------------------------------------
In any given market, the sum total of all traders's perceptions is onecollective perception which, at any given moment, creates the price andhence the reality of the marketplace. Every trader's account is creditedor debited based on this.If that perception is not in harmony with the collective perception of themarket, that trader will be punished by losing money.These are not my personal beliefs anymore than the law of gravitybelongs to Newton. This is the way of the market. But, perhaps this isall wrong given that it is coming from someone who you claim has a 70IQ. On that last point, I think you may be on to something. Every sincegraduating from my third rate alma matar college, I have been workinghard at dumbing down so I could become a better trader. Since arrivingon the CBOE trading floor in 1975, I came to the conclusion that tradinggenius lies in the brain of a 4 or 5 year old child. More recently, I hadthe opportunity to test this hypothesis and was pleasantly surprised whenmy then 4 1/2 year old son produced some extrordinary trading results, i.e.62% winning trades with a 2.41 to 1 win/loss ratio, and more than $7,000in profit in about ten trading days. Please keep in mind that for thepurpose of this experiment I provided little or no instruction to him onthe markets. I merely ask him to look at some charts and indicate up, down,sideways, or that he didn't know. I then took the markets for which he hadan up or down opinion and did a paper trade based on the close price of thatday, i.e. bought if he said up or sold if he said down.So if IQ measures one's intelligence in relation to one's age, I can see howit would be helpful for me to perhaps reduce my IQ to about 25 in order tobecome a more succesful trader. I thank you for your assessment of me beingat an 70 IQ, as this shows that I have been making steady progress in reducingmy IQ.Norman [email protected]
What makes you think that determining market direction and chosing indicatorsare relevant in making money trading? If you look for these, you become ananalyst, not a trader.Joe Ross: "TRADE WHAT I SEE, NOT WHAT I THINK!"
You can fool all of the people some of the time and some of the people all of the time.
The best time to buy is when blood is running in the streets, even if it isyour own.

Neal T. Weintraub in "Tricks of the Floor Trader" said: You will run out ofmoney before a guru runs out of indicators...
Subject: Re: Poll: Pick your favourite three indicatorsIn order of priority:1. Price2. Price3. Price
The problem is, the tighter the stop, the more likely noise will stopyou out with a loss even if your entry was good and the trade will showa profit if you stay in. Therefore the best stops are not stops in thetraditional sense but rather short and long exit signals based on carefulsystem design and with due respect to the reasons why the systemgot you into the trade. Do the justifications for entry still exist?Bottom line is that exiting a position requires as much thought insystem development as entries do. The better the system, the less oftenyou will wish you had a stop loss that was not already part of the systemitself. These days, many system writers are looking to volatility as partof the criteria for entry and exit, but other factors involve partial vs.complete profit taking, looking at multiple time frames. etc.James Charles [email protected]
Try looking at a 3/9/15 Exponential Moving Averages and trade multiplecontracts (2 or more). When the 3 crosses the 9 sell one. If the 3 crossesthe fifteen sell the rest. If the 3 doesn't cross the fifteen you willstill have a contract or two on. This can reduce the number of whipssaws.It will also increase the dollars of profit per trade and decrease thedollars of loss per trade. POINT IN THOUGHT: has anyone considered inwhich time frame you use your moving average? If you trade 5 min charts,what about putting the MA on the next longer time frame( 20 min)? Commentsor ideas welcomed.Richard Chehovin [email protected]
Should you desire to increase this stop loss (1% of cap.), you should reduceaccordingly the size of the position or exposure you have in that market andat that method at that particular time.=> adjust stop loss and profit-taking levelsas the profit in a position increases, you should reduce the position size tomaintain a maximum portfolio exposure and, ideally, in effect you will beinvesting only the profits generated in the trade (!).
1. I trade a basket of commodities having certain margin requirements. 2. I fund my account at least 2 times margin. I can thus withstand adrawdown of up to 40% emotionally...3. I increase my units of trading when I have enough money to cover taxesand another 2 times margin.It is simplistic but it works for me. Rumery and Lehman also offer a system.
If you know the approximate drawdown (who really knows???)...you must thenfund your account according to your temperament..., i.e. it sounds as if youare uncomfortable with the % drawdown....deleverage by having a larger accountsize...thus a lower % drawdown... If that is not possible, try to deleverage

by switching to the DJH8 or ESH8...thus accomplishing the same effect.Tom Stein [email protected]
I use threshold levels to increase my trading size. My formula is:2x max historical drawdown + margin = equity needed to trade 1 S&P contract.So a 50% drawdown to me means a real 25% drop in equity. By drawdown I'm talking about my total net running drawdown. I alwaysuse stops on my individual trades which keeps my max. daily net loss around3% to 5% depending how many systems trade that day (I use 3 systems). Therecent volatility in the S&P's has forced me to almost double my stops overthe last 6 months which has made the drawdowns deeper.Bob [email protected]
Maximizing use of Margin:Margin for British Pound is $1552 while Swiss Franc is $1721, both had almostthe same amount of margin requirement to trade one contract. But BP offersthe most bang for the buck in which its average EOD close is at around 100+points compared to SF which is 50+ points.BP tick size is $6.25, SF point value is $12.50.=> Both point values are NOT 12.50. The Pound is 6.25 per point. Both are 12.50per TICK, but the minimum tick in the Pound is 2 points. So the margin in thiscase does accurately represent the "bang for your buck" since the average dailymove in both is $625 per contract.The tick in the BP is $6.25 per contract but the minimum tick is twoso you are back to $12.50 per contract.
trading plan has three rules:1) When to get into the market2) When to get out with a profit3) When to get out with a loss
If I flip a coin N times, then the odds that I will never flip a headare 1/(2^N). This is true no matter how high a value I give for N. So itseems plausible that, if I flip a coin a countably infinite number of times,then the odds that I will never flip a head are 1/(2^countable infinity)--inother words, one over an uncountable infinity. This result seems reasonable,since the problem can also be looked at as "If I somehow picked a random infinite string of coin flips from the set of all possible infinite strings ofcoin flips, what would be the odds that I would pick the set with all tails?"There are an uncountably infinite number of infinite strings of coin flips, andI'm looking for exactly one; so, assuming that I'm really picking randomly (soI'm no more or less likely to pick one string than another), the odds of picking the all-tails string should be 1 over that uncountable infinity.Now, _if_ I'm restricting myself to the real numbers, I then proceed tosay "Well, any finite number over any infinity must be zero"--so I say thatthe probability is zero. If I'm allowing myself to use infinitesimals, thenfinite numbers _don't_ get zeroed out by infinities in this way, so I simplyleave the result as it is--1 over an uncountable infinity. That's not a validreal number, but it's a valid infinitesimal.Yes, this is counterintuitive; but then, so is infinity itself. Andthink about this: If we exclude infinitesimals, then the odds that an infinitestring of coin flips will contain at least one head are "1-but-just-maybe-it-won't-happen." The odds that an infinite string of coin flips will contain at least ten coin flips are "1-and-I-really-really-mean-it-this-time." We'reusing the exact same probability figure--1--to describe one event that'scertain to happen, and another event that's not. Doesn't that defeat the whole

purpose of probability figures? Doesn't that suggest that, in problems likethis, we're making an error by restricting probability figures to real numbers?
Risk Trailing Stop:
maximum profit is calculated from the point of entry using the highest high if long, or thelowest low if short.The dollar amount of profit per contract or per position you are willing to risk is then subtractedand the trailingstop is placed at that point.
Multiple Entries:
Average all entry prices (factoring in any profit for any entry) and divide by the number ofcontracts.This average, minus a market move that represents an additional $500 loss, is the stop price, alevel where once theposition is exited you would lose $500.
Let's look over the shoulder of an experienced gambler (you will learn much more on MoneyManagement on Gamblers' websites than on Trading websites!!!):
Here is what a lifelong gambler told me.
You buy in for $100 at blackjack.Maximum bet is $2 until you start winning.Then you increase your bet size.Increase your bet 50% on a win. Go back to $2 on a loss.If you lose the $100 you walk!If you get to $175, YOU PUT $150 in your pocket,never to see daylight again!Now you play the $25 left. You lose it, you walk.You are now betting $2 again. Increase your bet 50% as you are winning.When you lose back to $2.If your chips total on the table $50, you put $25 again in your pocketnever to see daylight again !!!This goes on until you lose the $25 stake once and then you walk!!!No drinking and you must be disciplined.You must follow basic strategy perfectly or use the card.Sit at third base. Only shoe games. Never take insurance.Once in a while put out $1 for them, especially when you have a big bet out there. You have tobe comfortable. If there areobnoxious players, cigarets or cigars or dealers that bother you, change tables. If you are tiredand up money, do not play anymore.Never play at a casino that does not let you double down after splitting.Never play at a casino that does not let you double down on any two first cards.If you want to bet $5 minimum, you must start with $250; 50 times minimum [email protected]
==> You minimize the casino advantage by knowing when to split and when to double.
What I mean here is that using ONLY WINNINGS or "house money" I follow a classicMartingale betting progression in an attempt to win MORE money, i.e. even whenI am only winning LESS than 50% of the hands I am playing. If the table is"choppy" (win-lose-win-lose) or even if it becomes slightly dealer-biased so

that I'm only winning, say, one out of three hands, this STILL allows me toslowly win more money than I'm losing.IF it happens (as it does quite often) that my chasing the losses all fail andI end up back at my starting basic buy-in money (20 units), I will then give upon the progression and basically start over, flat betting my own money andbasically pretending that I just arrived in the casino once again.
Negative progressions tend to increase the frequency of winning small amountsbut expose you to occasional large losses. Positive progressions tend toincrease the frequency of losing small amounts but give you a shot atoccasional big wins.
First, gambling is not a continual game resting purely on chance. Individualscan materially affect their odds by knowing what those odds are and makingchoices to maximize their odds.Second, no one gambles with unlimited funds thus stop losses and strategiesfor money management are important to the game. Third, if you increase yourbets when you win but always hold a little back (never betting the entirewinnings) you will be better able to take advantage of winning streaks.Probability operates in the long term over many trials. Mostindividuals bet for short periods of time. The imbalances that occur in theshort term correspond to what people call "luck" and can be very good orvery bad without necessarily evening out for the periods people generallyplay (hours or days vs. months). It is entirely possible to win in the shortterm and many people do.
I plotted histograms of the actual results. There was the familiar "bell-shaped"normal curve. For regressive betting, it had a long relatively flat tail onthe negative side (the small number of big losses) but the bulk of the curvewas on the winning side. For progressive betting, the curve was centered onthe losing side but had a long flat tail on the positive side (the smallnumber of big wins).(A distribution with a significant positive skewness [the more extreme valuesare greater then the mean] has a long right tail. Investors prefer returnsand positive skewness and dislike risk and negative skewness)A measure of the (a-)symmetry of a (return) distribution. Positive skewnesswould indicate a greater probability of large high returns relative to lowreturns.

Money Management 4
Money Management-Keywords:money-management, betsizing, bet sizing, position sizing, asset allocation, position sizing, betsize, bet sizing, cash flow management, trade management, position management, moneymanagement, position management, risk control, optimal exposure, betsize, betsize selection,size of a trade, portfolio heat, portfolio management, portfolio exposure, risk management,optimal betsize, optimal trade size, trade size, position size, constant size bets, adjustingbetsize, betsize adjusting, number of contracts, leverage
Martingale Method (part 1):
The proper way to use it, especially if your system has less than a 50/50 win/loss ratio, is to useyour research to see what is the maximum number of losses you have ever had in a row.Let's say it's 8. Then what you would do, is start increasing contracts, (I recommend 1 at atime), until you get a win, and then go back to your base unit.For example:After 8 losses in a row, trading 3 contracts each, you would then increase your contracts to 4. Ifit is a winner, then go back to 3. If it is a loser, you would go to 5 contracts, etc.. until you win.This is the most conservative use of the Martingale method. More aggressive uses are:1. Start increasing after the average number of losses in a row. So here you find out what youraverage losing trades in a row are. 2. Increase more than 1 contract at each time. So instead of increasing 1 contract after each ....loss, you might go 2 or more. This should not be done unless your system has a better than ....50/50 win/loss ratio.The Martingale method, was invented for casino betting, and unfortunately, doesn't work wellthere, for several reasons.- Table Limit keeps you from increasing your bet after many losses.- Inability to remove portion of bet after start of game- Maximum win is double betIn futures, the situation is much different:- No table limit, though you can reach margin limit- You can remove positions whenever you want- Maximum win can be many times the average lossI personally recommend the use of this method and use it every day. Your goal when trading isto make your wins larger than your losses and there is no better way to capitalize on your winsthan this.I start increasing 1 contract after 3 losses, until I win. 80%-90% of the time I win then, andthe rest of the time, the market takes me a few more rounds, and then rewards me.Although exceeding 8 losing trades in a row while increasing has never happened to me, mycurrent plan for that situation is to stop increasing after the 9th loss. Hopefully I will never haveto write about that event, though I am always expecting it to happen.Now since we are far from graduation, I don't want any of you using this method, unless youare 100% capitalized to take 10 losses in a row, increasing each time, plus you already have awinning system. I will be going over this strategy much more after graduation.I do have something that all of you can start researching now and which should help a lot ofnew traders be successful in their trading, and you will find that in part 2 of this mini-series.
Martingale Method (part 2):
*** Only take trades after "x" losing trades in a row. ***
For example:Let's say your research shows you that on average you suffer 3 losing trades before you get awinner. So you would be OUT of the market and would watch the market, and wait patiently
waiting for 3 losers in a row. Only then would you risk capital and start trading. You should thentake every trade after that until you win.
Now here you have a couple of options:1) Start after the 3rd loser with a higher starting base of contracts than you normally would. (Ifnormally you would only consider starting with 1 contract, think about trading 2).2) Consider increasing contracts by 1 after each loss thereafter. So if on that 4th trade you ....lose it, then add 1 contract and take the next trade. Keep on doing so until you win.
The name of the game in trading is Win BIG and lose small. This risk management tool allowsyou to do that. The reason this works well, is that the markets go into streaks of losing periods (choppymarkets) and eventually take off in a big way in one direction. This method allows you to be apart of that without enduring all the losing trades.This is NOT a miracle solution. One of the problems that you will encounter is that your winsmight be very small.For example, let's say you wait for the 3 losing trades and then get in, but that one is a loser andyou lose 4 ticks. Then the next one is a loser and again you lose 4 ticks, but the following one isa winner but you only get 8 ticks out of it.While you may have broke even you ended up losing because of commissions. On average thismay happen to you 30% of the time, so be prepared for it. The rest of the time you should havenice trends.So one last plug on working on your risk/money management tools and less on indicatorselection. Ok?
How correlated are the drawdowns of the various components of your portfolio, and what willthe effect be of a worst case event on the entirety of the capital you have been entrusted with?
Please note: A Neutral Position is a signal! Neutral means that the system is not currently in themarket but is looking to enter either a long or short position.
The 2% money stop is for accounts <$50,000.Risk a certain percentage of money invested on the entry, then raise that percentage, as well astrailing the stops.
The chance of a coin being flipped one time landing on heads is not 50%. It is either 0% or100%. It is either heads or it is not. The 50% chance is based on an expected average that isitself based on multiple, even 10,000 flips or more, that have nothing at all to do with theoutcome of the single real flip that is happening at this moment. We make a terrible mistakeand waste our money by soley relying on statistical abstractions and by applying them to aparticular casino, table, session, or hand of cards to determine what is "good" or bad."Again, the single coin flip is either heads or tails. What has happened for all time past and alltime future has nothing at all to do with the outcome of the moment. It truely is a single event.Instead, the recreational gambler's real friend is variation. While one cannot predict whenvariation will occur, one can predict that it will with certainty occur. The amount one betsduring an extremely positive string of wins in a statistically short occurance will determine ifthe recreational gambler comes away a big winner, while making sure to sit at a single deckgame (the factor that drives the edge lower than anything else) is nearly useless.

Van Tharp:3 Money-Management algorithms (min will be taken):1) 1% of core capital:a) (core capital - Total outstanding risk)*0,01 = xb) x / $ value of initial stop = Nr. Contracts I
2) new risk limited (total risk <=25% of equity): before execution: equity * 25% - total risk= yif y >0, y / $ value of initial stop = Nr. Contracts II
3) ongoing volatility (10 day M.A. of ATR): max 2% of equity
If a share doubles in one year and halves in the next we have an arithmetic return of:100% - 50 %/2=25% per annumand a compound gain of 2 x 1/2 = zero. If the right proportion of risk capital is put to that risk, a six percent geometric return can beextracted.
Trading can be mastered if you concentrate your efforts on how you will react to price ratherthan desiring to predict it. Reacting is a business decision, predicting is an ego play.
Traders want to make money. Losses in the long run don't matter.Forecasters (prophets) want to be right (ego). And that's all that they are concerned about.
Don't decide anything (ego), let the market do that job for you (business).
Like any other business you have a business plan and the financial portion of that plan is themost important.In this business your inventory is stocks, bonds, futures or options. Like any other business youdefine what an acceptable loss is on an item and what is an acceptable profit for the riskundertaken. Like any other businessif the item of inventory doesn't do what you expected it to do, you put it on sale and liquidate itto raise capital to purchase inventory that will do what you want it to do. Your acceptable loss isyour stop. Your money managementsystem tells you how much that is. Your mark up is dependent upon your trading system andtrading style. It doesn't make any difference if you are a day trader or an investor. Like anybusiness, some turn there inventory 10 times a day, some 20 times a year and some only twicea year. Your trading style and inventory volatility will tell you what your turnover rate will be.Trading is a business and if you treat it as anything else you will be a loser.
Losing traders spend a great deal of time forecasting where the market will be tomorrow.Winning traders spend most of their time thinking about how traders will react to what themarket is doing now, and they plan their strategy accordingly.
If one were to ask a successful trader where he thought a particular market was going to betomorrow, the most likely response would be a shrug of the shoulders and a simple commentthat he would follow the market wherever it wanted to go.
Winning traders acknowledge their emotions and then examine the market. If the state of themarket has not changed, the emotion is ignored. If the state of the market has changed, theemotion has relevance and the trade is exited.
Establish a trading and money management strategy to determine how much of the availablefunds should be used at each buying opportunity. In particular, at the start, such money mustbe held in reserve for future buying. Later, when some stocks have been sold at a (hoped for)

profit, there may be a considerable amount of cash available for new purchases. Whatpercentage should be deployed at the next buy signal? Is it better to build up cash reservesresulting from profitable sales in order to wait for a subsequent market decline and even betterbuying opportunities? Part of the money management would deal with potential "stop-loss"sales and what do to when all of the funds have been invested and there is a new buy signal.Should some stock be sold to provide funds for the buy, or should the signal be skipped?
As a simplified illustration of how hard it is to time the market, assume that you are 70%accurate calling market turns. If you are in the market, two calls are required: a sell and asubsequent buy. The probability of being correct (buying back in at a lower price than yourselling price) is 70% times 70%, or 49%. That shows you have to be very good (and mostpeople are not much better than a coin toss) to be successful at market timing.
I have a clearly defined sell strategy, and I will sell for three reasons, all of which helps me tocontrol risk. My belief is that capital preservation is every bit as important as making it grow.1) I set upside price targets for all of our investments, using future estimates and premiums ordiscounts to the S&P 500 market multiple. As I approach 90% of our upside target, I will beginto sell. I am never afraid to take profits. Second, if a stock declines about 15% or so from whereI bought it, I will sell part of the position, maybe five or ten percent, and quickly reevaluate mycatalyst or my reason.2) If at any time during my ownership period, my catalyst changes for the negative, I will sellmy entire position. I do not hesitate to admit that I am wrong.3) Finally, and the third reason to sell, is that I am very opportunistic and am always looking forbetter returns elsewhere. The marketplace is often inefficient and irrational, and I try to takeadvantage of short-term volatility and the inefficiencies of information flow amongst othermutual funds.
Dennis Holverstott [email protected]:
risk {disaster stop} = factor_1 * volatility#_contracts = factor_2 * account_size / volatility
So, #_contracts is proportional to account_size/risk. To find factor_2,program the system to trade 10 contracts at peak volatility and more whenvolatility is lower. Export the "volatility adjusted" P/L numbers to afile and divide them by 10. Run a monte carlo sim (thanks dkomo) on theresults and you will have a pretty good idea of possible drawdowns(volatility adjusted). Then, you can choose a factor_2 that matches yourrisk tolerance.
Once you have studied TA enough to realize how true this is, you will be ready to think aboutplaying with the big boys in the futures pits.The sooner you accept reality and purge fantasy from your brain the sooner you will be on yourway to actual success in trading.
* Good markets don't give you a good opportunity to buy. *
If you believed the ads and could make $1000 a day on $10,000 capital, you could get 200%return every month. Compound that out and you will own the world in a few years.
Stocks are never too high to buy and never too low to sell.

A bull market will made us look smarter than we really are."A rising tide lifts all boats."
I am a technician and will do what the market tells me.
There is no way to provide an estimate of the absolute worst outcome (in the same sense thatthe tails of continuous probability distributions are unlimited).
It's the Execution or implementation of your trading plan that is the bigger challenge.Throw out 99% of all the crap I learned about oscillators, divergence's, Elliott Wave, cycles,timing, seasonals, Gann, pitchforks, volume, fractals, RSI, stochastics, overbought/oversold(this is a good one - the stock indexes, currencies and cotton for example everyone said wereoverbought and topping in February and March this year). Look what they did. Needless to say,I don't pay attention to this anymore either, etc., etc. The list goes on to infinity almost. I wentback to the basics. I went back to a few simple chart patterns, (a simple moving average andtrendline now and then for a visual aid).Most people make finding the method the big challenge. That is because there is so much junkthrown at traders. They feel like a child in a candy store and have to try every doodad in theplace. When they are done, they are sick and never want to see another candy store (tradinggizmo) again. They could have had the plain piece of milk chocolate at the front of the store(simple method price patterns) which would have done everything they desired and fulfilled alltheir needs.
The addition and removal of winning positions at key turning points in a market may hold thekey.
Trade to make money, not to be "right" or satisfy some personal agenda. The key to success isto know your limitations and don't trade outside your psychological and risk comfort zones.
Then the trade you entered begins to perform well, and trends in a wave type pattern earningback not only the $1,200 previously lost on the first 3 trades, but another $3,000 on just onecontract. Once this trade gets going and confirms a trend, you begin to prudently add on onemore contract at a time on each new short spurting rally to the next higher level. Now you're upover $8,000 on the one trade with a trailing sell order (covered in the 3 month course) followingthe price up so that when the market turns down, you're out with healthy gains.
Someone who has to be right a high percentange of the time is someone who needs constant re-inforcement that they are alright, i.e. a good person. This is all about psychology and how onefeels about oneself.But, which of the following is better: Is it better to make
A. $2, 80% of the time orB. $6, 60% of the time orC. $10, 40% of the time?
Assuming that the losses are the same for each profile, the answer is C. which has the lowestwinning percentage because the probability times the expected value = the risk adjusted valueor in this case 40% x $10 = $4 vs risk adjusted values for A. = $1.60, and B. $3.60. People who have trouble with this concept are often victims of the educational system whichteaches that the key to be successful is being right. One can see from the above example howwrong that can be. The true paradigm for trading is that IT'S OK TO BE WRONG, JUST DON'T BEWRONG FOR LONG. So, now one must make a philosophical decision as to what is more

important, being right or making money. If profit is the ultimate goal and not ego then one willadapt to having a smaller percentage of winning trades in exchange for more money over timeon the bottomline. To do this, for an experiment, see what happens on a minimum trade size,say a one lot, see what happens if you double your profit target, i.e. rather than going for $2, gofor $4. Then keep track of both systems and see which one over several months is moreprofitable.
Changing the 25 X 25 System Exit
After the last big run up in bonds we observed that the logic of the "25 X 25"Bond System exitsneeded someimprovement. The system was operating on the assumption that in a trending market the longerwe hold aposition the greater the profit. The exit strategy was intended to more or less force us to holdpositions atleast 25 days or more.
The problem we discovered was that after the recent buy signal we had a huge profit after only12 days andthe stop was still too far away. Our original logic was flawed because we equated time in thetrade withprofitability rather than simply measuring profitability directly.
Big profits need to be protected regardless of how long it takes to obtain them. As usual the fixwas easyonce the problem was defined. We simply added an additional exit that moves the stop up assoon as wehave 5 AverageTrue Ranges of profit. This is not a curve fit for one event. There were several other times in ourhistoricaldata where this exit was needed. The logic of the exits makes much more sense now. We shouldhavespotted this flaw earlier because we want all of our systems to be as logical as possible. Wecontinuouslyemphasize that the logic of a system is much more important than the historical performancedata.
Here is the additional line of code that will convert the previous system into version 2.0:
if c> entryprice + (5 * AvgTrueRange(45)) then exitlong lowest(low,2) stop
Average True Range
In this Bulletin we will show some of our favorite applications of ATR as part of our entry logic.Sample Applications of ATR as an entry tool:
Entry Setups: (Remember, entry setups tell us when a possible trade is near. Entry triggers tellus to do the trade now.)
Range contraction setup: Many technicians have observed that big moves often emerge fromquiet sidewaysmarkets. These quiet periods can be detected quite easily by comparing a short period ATR witha longerperiod ATR. For example if the 10 bar ATR is only .75 or less of the 50 period ATR it wouldindicate that themarket has been unusually quiet lately. This can be a setup condition that tells us an importantentry is near.

Range expansion setup: Many technicians believe that unusually high volatility means that asustainabletrend is underway. Range expansion periods are just the opposite of the range contractionperiods. Rangeexpansion periods can be measured by requiring that the 10 bar ATR be some amount greaterthan the 50 period ATR.For example the 10 bar ATR must be 1.25 or more times the 50 period ATR.
If you are concerned about the apparent contradiction of these two theories we could easilycombine them.We could require that a period of low volatility be followed by a period of unusually highvolatility beforelooking for our entry.
Dip or rally setup: Lets assume that we want to buy a market only after a dip or sell it only aftera rally. Wecould tell our system to prepare for a buy entry whenever the price is 3 ATRs or more lower thanit was fivedays ago. Our setup to sell on a rally would be that we want to sell short only when the price is3 ATRs ormore higher than it was five days ago. The choice of 3 ATRs and five days is simply an exampleand isn’tnecessarily a recommended choice of parameters. You will have to figure out the properparameters on yourown depending on the unique requirements of your particular system.
Entry Triggers: Volatility Breakout: This theory assumes that a sudden large move in one direction indicatesthat a trend inthe direction of the breakout has begun. Normally the entry rule goes something like this: Buyon a stop if theprice rises 2 ATRs from yesterday’s close. Or sell short on a stop if the price declines 2 ATRsfrom theprevious close. The general concept here is that on a normal day the price will only rise or fall 1ATR or lessfrom the previous close. Rising or falling 2 ATRs is an unusual occurrence and indicates thatsomething outof the ordinary has influenced the prices to cause the breakout. The inference is that whatevercaused thisbreakout has major importance and a new trend is beginning. Some volatility systems operate by measuring the breakout in points rather than units of ATR.For examplethe system may require that the Yen must rise 250 points from the previous close to signal abreakout to theupside. Systems measuring points rather than units of ATR may need frequent reoptimization tostay in tunewith current market conditions. However, breakouts measured in units of ATR should notrequirereoptimization because, as we previously explained, the ATR value contracts and expands withchangingmarket conditions.Change in direction trigger: Lets assume that we want to buy a dip in a rising market. Wecombine the dip orrally setup described above with an entry trigger that tells us the dip or rally may be over andthe primarytrend is resuming. The series of rules might read something like this: If the close today is 2.0 ATRs greater thanthe 40 daymoving average (this condition establishes that the long term trend is still up) and the close

today is 2 ATRsor more below the close seven days ago (this condition establishes that we are presently in adip within theuptrend) then buy tomorrow if the price rises 0.8 ATRs above todays low. This entry triggershows that wehave rallied significantly from a recent low and that the dip is probably over. As we enter thetrade the pricesare again moving in the direction of the major trend.As you can see, the ATR can be a most valuable tool for designing logical entries. In our nextarticle we willdiscuss using ATR in our exit strategies and give some interesting examples.
Average True Range
Average True Range is an indespensable tool for designers of good trading systems. It is truly aworkhorseamong technical indicators. Every systems trader should be familiar with ATR and its manyuseful functions.It has numerous applications including use in setups, entries, stops and profit taking. It is evena valuable aidin money management. The following is a brief explanation of how ATR is calculated and a few simple examples of themany waysthat ATR can be used to design profitable trading systems.
How to calculate Average True Range (ATR):Range: This is simply the difference between the high point and the low point of any bar.True Range: This is the GREATEST of the following:1. The distance from today's high to today's low2. The distance from yesterday's close to today's high, or3. The distance from yesterday's close to today's lowTrue range is different from range whenever there is a gap in prices from one bar to the next. Average True Range is simply the true range averaged over a number of bars of data.To make ATR adaptive to recent changes in volatility, use a short average (2 to 10 bars). Tomake the ATRreflective of "normal" volatility use 20 to 50 bars or more.
Characteristics and benefits of ATRATR is a truly adaptive and universal measure of market price movement. Here is an example that might help illustrate the importance of these characteristics: If we were to measure the average price movement of Corn over a two day period and expressthis in dollars it might be a figure of about $500.00. If we were to measure the average pricemovement of a Yen contract itwould probably be about $2,000 or more. If we were building a system where we wanted to usethe set appropriate stop losses in Corn and Yen we would be looking at two very different stoplevels because of the difference in the volatility (in dollars). We might want to use a $750 stoploss in Corn and a $3,000 stop loss in Yen. If we were building one system that would be appliedidentically to both of these markets it would be very difficult to have one stop expressed indollars that would be applicable to both markets. The $750 Corn stop would be too close whentrading Yen and the $3,000 Yen stop would be too far away when trading Corn. However, let's assume that, using the information in the example above, the ATR of Corn over atwo dayperiod is $500 and the ATR of Yen over the same period is $2,000. If we were to use a stopexpressed as 1.5 ATRs we could use the same formula for both markets. The Corn stop would be$750 and the Yen stop would be $3,000.Now lets assume that the market conditions change so that Corn becomes extremely volatileand moves$1,000 over a two day period and Yen gets very quiet and now moves only $1,000 over a twoday period. If we were still using our stops as originally expressed in dollars we would still have
a $750 stop in Corn (much too close now) and a $3,000 stop in Yen (much too far away now).However, our stop expressed in units of ATR would adapt to the changes and our new ATR stopsof 1.5 ATRs would automatically change our stops to $1500 for Corn and $1500 for Yen. TheATR stops would automatically adjust to the changes in the market without any change in theoriginal formula. Our new stop is 1.5 ATRs the same as always.The value of having ATR as a universal and adaptive measure of market volatility can not beoverstated.ATR is an invaluable tool in building systems that are robust (this means they are likely to workin the future) and that can be applied to many markets without modification. Using ATR youmight be able to build a system for Corn that might actually work in Yen without the slightestmodification. But perhaps more importantly, you can build a system using ATR that works wellin Corn over your historical data and that is also likely to work just as well in the future even ifthe nature of the Corn data changes dramatically.
-In this article we will show some specific examples of how using ATR can help to make oursystems more robust.First lets look at a simple buy only system for Corn without using ATR. Here are the rules:
1. Buy Corn whenever it rises 4 cents per bushel from the opening price.2. Take a profit whenever the profit reaches 18 cents per bushel.3. Take a loss whenever the loss reaches 6 cents per bushel.
Now lets build the same system using ATR. (Assume that the 20 day ATR is 6 cents).
1. Buy when the price rises 0.666 ATRs from the open.2. Take a profit when the profit reaches 3 ATRs.3. Take a loss whenever the loss reaches 1 ATR.
We have the original system and a modified version that has substituted ATR for the importantvariables.The two systems appear to be almost identical at this point. They both will enter and exit at thesame prices.Now let's assume that the market conditions change and the Corn market becomes twice asvolatile so that the ATR isnow 12 cents per day instead of 6 cents. Here is a comparison of the original system and theATR system:
1. The original entry of 4 cents per bushel from the open is now too sensitive. It will generatetoo many entrysignals since the daily range is now 12 cents instead of only six cents. However, the entry expressed as 0.666 ATRs will adjust automatically and will now require theprice to move8 cents per bushel to enter. The frequency and reliability of our entries remains the same asbefore.
2. The original profit objective of 18 cents per bushel is much too close for a market that is nowmoving 12cents per day. As a result the profits will be taken too quickly and our original system will bemissing manyopportunities to make much bigger profits than usual.
However the profit target expressed as 3 ATRs has automatically expanded the profit objectiveper trade to36 cents per bushel. Significantly larger profits are now being realized by the ATR system as aresult of theincreased volatility.
3. The original stop loss of 6 cents per bushel will now be hit frequently in a market that ismoving 12 cents

per day. If you combine these frequent stop loss exits with the overly frequent entries beinggenerated, youhave a classic whipsaw situation and we can expect to encounter a severe string of losses. Ouroriginalsystem is now failing because the market conditions have changed. We need to fix it or abandonit in a hurry.
However lets look at our ATR version of the system. The stop loss expressed as 1 ATR now setsour stopfarther away at 12 cents so it isn’t being hit any more frequently than before. We continue tohave the samepercentage of winning trades only the winning trades are much larger than before thanks to anincreasedprofit objective. Our ATR system has a nice series of unusually large winning trades and iscurrently makinga new equity peak. The ATR system now looks better than ever.
In our example, the proper application of ATR has made the difference between success andfailure.
Here is a system that grows:
Take a look at a commodity like March Coffee KC.Then look at the Highest High for the last 20 days and lowest low for the last 20 days I think theHIGHEST HIGH is 125 (1/5) and LOWEST LOW is 113 (12/21) so the 20 day channel is 375 bigpoints which is the same as $4,500 dollars.
The exit is is the difference between the HIGHEST and LOWEST at the time of the trade or125.5-113 12/21.This is the amount that we trail upward on this trade.
You then take your bankroll:let's say you start trading with $1,000,000and you only want to risk 1%1% x 1,000,000 is $10,000$10,000 / $4,500 = 2you then would buy 2 contracts of Mar coffee if it broke through the high or low and you wouldtrail the stop at 125-113 = 12 big points(12 Big Points mean you risk 12 * 375 = $4500 per contract)
This system grows with you forever and you can take any days 20-40-100 but in TradeStation,you cannot test systems that share a common bankroll among commodities.
My first approach was to find max DD and then use it or 2X it to find an amount of contracts tobuy, my second approach is to use the size of the channel to determine contract size.
I think people that know C++ and other languages can also test markets sumultaneously.I fake test this by testing each commodity one by one...lets say I start with coffee and 1 millionand risk 1%...I run all of coffee and lets say I end up with 2 million, I then use the 2 million anduse it in OJ, then run it, then take that value onto the next commodity...so I use a manual lineartechnique which is not perfect, but gives me a rough idea.

Money Management 5
Here are what I have determined to be the greatest lessons of future trading and moneymanagement
1. Break-Out systems are the best.Moving averages and other system all work well on paper...but they have very large drawdownsand it is easy to look at drawdowns on paper...in real life, most people can't watch 45% of theirmoney disappear. I think many of the top traders prefer channel break outs. Dennis, Seykota,Kaufman.
2. You make much of your income on BIG rare trends. I find many break out systems to tradebetween 40% wins and 50% wins...almost a coing flip. BUT I find the average win is 2 timesthe average loss. So you use the trailing stops to get out of the bad trades at 1% each time
3. Large accounts have a HUGE mathematical advantage over small bank accounts.I tried to explain this in my earlier letter.Remember when I talked about the March Coffee KCand then look at the Highest High for the last 20 days and lowest low for the last 20 days
Trade Plan:
Question: Example Trade:Futures Contract GoldContract Month DecWhere is support on the monthly chart? 277.5How long ago was the market BELOW support? 1979/19yrsWhere is resistance on the monthly chart? 417.5How long ago was the market ABOVE resistance? 1990/8yrs
What is the top price of the trend (daily chart) that is changing? 352What is the bottom price of the trend (daily chart) that is changing? 287.250% retracement of these two points (Profit Target)? 320What is your entry point? 300What is your stop out point (Loss Target)? 295Entry Point minus Profit Target (Potential Profit) 20Entry Point minus Loss Target (Potential Loss) 5Potential Reward & Potential Profit (Reward:Risk Ratio) 20/5 (4:1)
1) Plan your trade. Trade your plan.
This means use the same sequence every time. If your plan is to get in when the weekly anddaily trend are in the same direction, volatility is rising and a 1,2,3 is formed. Follow it.Every time. This could also be seen as discipline which is defined as "to train or develop byinstruction and exercise especially in self-control.
2) Money Management.
This means more about managing losers than winners. Greed will generally keep you in a tradelong enough to "Let your winners run." But, managing your losers is the key to trading for alifetime. Don't add to a loser. If you owned a dry cleaners that was losing money would youopen another shop across town? Follow your stop you set-up in Rule 1 when emotions weren'tclouding your judgment. NEVER, EVER MOVE YOUR STOP LOSS AWAY FROM THE MARKET.

3) Proper Quantity.
Don't think, even on a trade that fits your "Trade Plan", that you should load up to get back atthe market. Yes, there are times when you should increase your quantity above normal, but notat the risk of placing your whole account at risk. Similar to diversification, never diversify at therisk of putting yourself in borderline trades. I love trading options in three's. When the optionshave doubled, take profits on one, free-trade the second and let the third one rununencumbered. With futures, never "Reverse Pyramid". A reverse pyramid is when you start at1 contract, increase to 2, then increase to 4 and so on. This is like a pyramid on it's head(reversed), easily toppled. Instead build a strong base but never add more in quantity thanwhat you started with.
Math Question Challenge
From: "Andy Dunn" To: [email protected]: Math Question Challenge
Can anyone write me a formula for the following.
I have a system and the average WIN is 2X the average LOSSThe system WINS exactly 50% of the timeLet's say I start with $1MEach time I trade, I risk 1% of the bankroll (starts at 1M then goes up with each trade)
Can anyone write an algebraic formula that will determine the yearly Rate-Of-Return dependingon HOW MANY trades this system does each year?----------------------------------------------------------------------------Date: Wed, 16 Dec 1998 09:33:57 -0500From: Val Clancy To: [email protected]: [email protected]: Re: Math Question Challenge
In this specific case:( .99^n/2 - 1 ) *100where n = total number of trades.Val.
----------------------------------------------------------------------------
Date: Wed, 16 Dec 1998 10:12:29 -0500From: "Gaius Marius" To: "Val Clancy" , Cc: Subject: Re: Math Question Challenge
Val,
Can you explain the formula? Is the .99 derived from (100% - 1%) risk of thebankroll?Is it raised to the power of n/2? And where did the 1 come from? Where doesthe 50% of the percentage of winning trades fit in the formula? And theratio of wins to losses?
Andy

----------------------------------------------------------------------------Date: Wed, 16 Dec 1998 10:19:43 -0500From: Bob Fulks To: [email protected]: [email protected]
You don't say what the loss percentage is. Assume you lose L (as afraction) of your capital on each losing trade and win 2*L (as a fraction)of your capital on each winning trade. Assume trades occur in pairs - onewin followed by a loss. Then:
End = Start*((1-L)*(1+2*L))^(n/2)
For example, if the loss on a losing trade ("L") is 0.5% of your capital (L= 0.005)and the number of trades in the year ("n") is 400
End = Start * ((0.995)*(1.01))^(400/2)= Start * 2.68
So the ending value would be 2.68 times the starting value or a profit of168% in the year.
This assumes you adjust the trade size as you capital increases/decreases.Hope this is what you meant.
Bob Fulks----------------------------------------------------------------------------
Date: Wed, 16 Dec 1998 10:13:36 -0500From: Val Clancy To: [email protected]: [email protected]: Re: Math Question Challenge
win/loss trade ratio = 2% win / loss = 50initial accsize = 1Mlosing trade ( risk ) = 1% of account sizeSolve for: yearly ROASolution:ROA = ( GrossProfit - GrossLoss ) / initial account size * 100;if win/loss = 2 then GrossProfit/GrossLoss = 2 thenGrossProfit = 2*GrossLossROA = ( 2GrossLoss - GrossLoss ) / initial account size * 100 or= GrossLoss / intial account size * 100;GrossLoss = initial accountsize* [ ( 1 - %risk )^n/2 ) - 1]where n = total number of trades losers and winnersrisk = .01 thenGross Loss = initial accountsize ( .99^n/2 - 1 )ROA = ( .99^n/2 - 1 ) *100so in this case ROA depends only on number of trades you makeso at 100 total trades ROA = 39% of your account sizeat 50 trades - 22%at 2 trades - 1.99%The general formula to use is the Compound Interest Formula:Int = Principal [ (1 + %)^n - 1 ];in case of trading, %risk is simply negative % so thegeneral formula for the total loss is:GrossLoss = InitialAccountSize [ ( 1 - %risk )^n - 1];

general formula for the total profit isGrossProfit = InitialAccountSize [ ( 1 + %profit )^n - 1];Val.Correct me if I am wrong.
Portfolio Management Subject: efficient frontierAuthor: John G. Nelson Date: 10/17/98 [email protected]
I have read the original and to-date replies and feel that the "efficient frontier" concept is veryimportant for investors and actually a rather simple concept, even though it is also profound.Harry Markowitz, in his 1952 15-page paper "Portfolio Selection", laid the ground-work forModern Portfolio Theory, and in 1990 became a co-winner of the Nobel Prize for his work in thisarea. The basic equation used to calculate the EF was in my in my elementary statistics book asthe equation for the expected variance for a weighted sum of correlated random variables.While a correct direct application requires an enormous table of correlations, which the smallinvestor is not going to get, the simplified version can be very useful. If you assume a constant(mean) correlation, which will approximate the correct results in a portfolio of any reasonablesize, then that part of portfolio variance (of return) which can be reduced by diversification(~50%) can be approximated as (N-1)/N. This is why Value Line suggests portfolios of 10 to 12stocks, and empirical studies show little additional variance reduction when you hold more than16 stocks.
Date: Wed, 9 Dec 1998 09:21:31 -0500From: "Gaius Marius" To: [email protected]: Re: Money Management
:Scott, This sounds like it may be a great idea but I don't have a:clue as to how to treat a system as a transformation of raw price. I:sure would appreciate an example and / or clarification.
One way of using money management: If you have a smooth equity curve (see attached GIF),and you can trade multiple contracts, when you see a retracement on the equity curve, increaseyour positions in the originaldirection of the trade. I.E., my system has historically gone against me by 10 points one third ofthe time before it reverses direction and goes in my favour (if it goes against me by 13 points, Iknow it will never reverse andgo again in my favour. So I get out).So what I do is increase my position when it goes 10 points against me and then get out (ofboth positions) if it goes 13 points against me from my original entry. This reduces my averageentry price and results in another 40% ROA.
::Here's a clue for you. Treat a system as a transformation of the::raw price series. In futures, other than equity contracts, the raw::price series goes up and down. If your system has an edge, then the::transformed price series should be gradually upward sloping, like a::the long term chart of the stock market. Now treat the transformed::price series as an asset class and mix them altogether via MPT and::presto, your can get some great stuff like I have. ---------------------------------------------------------------------------------------------------------------------------------------Date: Wed, 9 Dec 1998 18:43:18 -0800 (PST)From: Jim Osborn To: [email protected]: RE: Money Management
MARTIN MARTIN Bernardo responds:

>I would appreciate if you or any other member of the list could>expand more or give me references on the following; >1. Scaling in/out as a way of protection (not exposing to much at the>begining of a trade) and maximizing your profits (let profits run)
My approach is pretty informal: Start with one contract, then when you have enough profit inthat contract that a reasonable stop on two contracts still leaves you with a satisfactory profit,consider adding that second contract. On the exit side, keep a trailing stop somewhere safelyback from where you think the market shouldn't go, but OCO that with a profit target where youthink the market might, in your wildest dreams, get to.
Joe diNapoli, Mr. Fibonacci, has some interesting techniques for being a bit more quantitativeabout profit targets. You might track him down somehow and see what you can find. He'sspoken at TAG a few times, so that'd be a good starting point. Maybe someone else can amplifyon this point...
>2. You mentioned some notes of Chuck's TAG lecture some years ago.>How could I get them? Please give any other reference to book,>author, etc. you consider valid
The TAG talk I heard was in 1993, but Chuck has spoken at TAG several other times, too, onvarious subjects. Contact Tim Slater of TAG at 504-592-4550 for tapes lecture notes from oldconferences.
>3. I guess that what you mention as volatility trailing stops is based in a>certain X ATR of the last Y days? (I myself find it very useful, as the>"turtle" way of determining how many contracts to trade related to>percentage of equity risk and volatility (ATR).
I see in looking up that TAG phone number, that Chuck spoke on "New Techniques UsingAverage True Range" at this year's TAG conference. I should order that tape myself...
Gee, this is sounding like a ringing endorsement for Chuck LeBeau, and I guess it is. :) You canlearn a lot of good stuff from his work.
Cheers, Jim
Dealing with excessive Volatility:
I have a rule of thumb that I try to apply in cases of high volatility that helps me to decide if Ishould enter atrade in a high volatility situation. I should warn you that this rule sometimes saves me moneyand itsometimes costs me big profitable trades. The primary benefit of the rule is that it is objectiveand disciplined. The rule keeps me from just guessing and agonizing over what to do insituations where the volatility is obviously extreme. The rule has some inherent logic that helpsme to quantify "extreme" volatility on a system by system and market by market basis.The rule is that if the recent daily range is greater than the money management stop (!!!) youare using, youdon't do the trade. The logic is that our money management stops should be outside the rangeof what normally happens in one day. To have stops closer than that is to be inside the "noiselevel" where you can get randomly stopped out for no good reason. Once the market settlesdown to where the range between the high and low is less than the amount of your stop youcould then enter the trade and safely place your stop.Now let me give you a specific example. We just took a quick but big loss on a Yen trade todayand it is now set up for a new trade tomorrow. The range over the last day or two, as we allknow, has been far beyondnormal, several times more than our protective stop loss. The trade for tomorrow should beskipped because

of the volatility rule described above. If you like, the trade can be entered at a later date whenthe averagetrue range is less than our stop.This volatility rule applies to all systems and markets. It does not come into play very often andit is notsomething we just made up for the Yen. I have found it to be a valuable rule that I have usedfor years to limitmy exposure in times of excessive volatility.Please keep in mind that high volatility is an opportunity for unusually large profits as well aslosses and ifyou skip a big winner you will certainly regret it. For those with more than adequate capital analternativesolution is to reduce the position size and arbitrarily change the money management stop to amuch biggernumber on a temporary basis. If you can afford losses of this size this might be a better solutionbecause youwould avoid being stopped out needlessly and you would still be able to participate in the bigwinners. Basedon past experience I would say that as a minimum a stop of about two recent average trueranges (!!!) would berequired. Obviously this would be a huge dollar amount to be risking in Yen or S&Ps right now.
My approach is to make stops depend on "percentiles" of the recent true range. That is, you takethe past 59 days' true range values and sort them from lowest to highest. The reason I use 59 isthat the percentiles are easy to calculate. The nth value is the n/60th percentile. For example,the lowest true range is the 1/60th percentile and the highest true range is the 59/60thpercentile. The median is the middle value, the 30th.The 90th percentile is the 54th value. So let's assume you want a stop that will only be hit 10percent of the time and be missed 90 percent of the time. That's the 90th percentile, which isthe 54th value in the list! If you're a little more gun-shy, take the 75th percentile, which is the45th Value. If you're are real risk-lover, go for the 95th percentile, the 57th value. I think youwant to use the true range rather than the high minus low because that accounts for overnightrisk.M. Edward Borasky http://www.teleport.com/~znmeb
A Purchase stop should apply only until the equity price rises above the purchase price. At thattime, the Trailing stop should apply, and the Purchase stop should disappear. The Trailing(High) Stop should NOT apply until the equity price rises above the purchase price. I contendthat, in Monacle, both the Purchase and High stops are applied at the time of purchase.Consequently, if the equity goes down after purchase, the lesser of the two stops willdetermine the stop condition, and, hence, the performance of the portfolio.This can be easily be seen by using the Optimize function with any DAA system tosimultaneously vary both the Purchase and High stops through a range, say 1 - 10. Plot theresulting portfolio Average Returns as follows:Make a plot with Purshase Stop as the X-axis, and High stop as the Y-axis.Write down the value of the Avg. Return for each back test at the intersection of the applicablestops. Thus, for example, if the DAA returned 25%/yr using stops of P=7 and H=8, then write25 at the intersection of 7 on the x axis and 8 on the Y axis. You won't have to fill in the entiregrid before you will see a pattern. The result is that, for any given value of HighStop, the portfolio performance will vary for all values of Purchase Stop less than or equal tothat of the High Stop, but will remain frozen thereafter at the value achieved when the HighStop is equal to or greater than the Purchase Stop.I believe that this can happen only if both the High and Purchase stops are being appliedtogether at the time of purchase. Thus, if you buy a fund and its NAV heads down afterpurchase, you will get stopped out at the value of the High stop, if it is less than or equal to thePurchase stop.

Rodger [email protected]
Rodger - I believe that all your observations are correct - both purchase stop and trailing highstop are in effect at the time of purchase. The purchase stop remains fixed at the percentagebelow purchase for the entire period. The trailing stop rises as the NAV rises. Where I disagreeis the statement that "A purchase stop should apply only until the equity price rises above thepurchase price." - Why??The next statement is also puzzling: "At that time, the Trailing stop should apply, and thePurchase stop should disappear". - Again why??? - If you buy at $30.00 and set a Purchase stopof 4%, you want to sell if the NAV drops below $28.80 (-4%). Suppose the price rose to $32.00,Don't you want to protect yourself if price turns around and drops 4% below the purchasepoint? Why do you suggest that the purchase stop should no longer be in effect if the price risesabove the purchase?? However, many people put too much reliance in either stop loss option. More than 85% of thesystems give better returns when both purchase and trailing high stops are set to Zero! That is"0". Waiting for the Cutoff about 2/3 of the way down the ranking often produces betterreturns, and lots fewer trades. Try it!!
Good luck - Howard Gadberry [email protected]

Money Management 6
Money Management:
It's something that most people spend very little time on. The most important aspect of tradingis not sexy, exciting, or easy to describe, so who would want to spend time on it?Who cares if I have 8 losers in a row for $500.00 each? It might only take a few trades to makeback my $4,000 and more.....
I would suggest a 1% parameter per trade. If you have a winning method, the only way you canlose is by running out of money. Why take the chance? Never risk more than 20% of youraccount on your total current trades (cumulative risk, remember, all of the trades you are in,can and at some time (!), will be losers)
Trade long term to cut down on the costs of slippage and commission. Roughly 20% of anaverage account is spent on those costs per year.
If you want to be more advanced, I would devise a sliding scale of initial risk that was quitesmall when the original starting capital is at risk and increases if one has profits over a self-chosen Mendosa line of acceptable returns. (ie At the beginning of the year or when down forthe year while original capital is at risk, the risk would be .5%. Profits between 1-10% wouldbe risked at a 1% rate. Between 10-20% 2% etc. The numbers used arefor example only.)
In a long term trading situation where the market often gets away from the stop creatingunenviable situations, I suggest peeling off contracts, but never below 1, to smooth volatility.(i.e. $100,000 account. Buy 5 Silver at 5.00 on the entry signal. Original stop is 496, 1% risk. [¢470,0 - ¢471,0 = $50] At the close several weeks later the price is 600, but the stop has onlymoved up to 580. The account is now worth $125,000, and the risk, close to stop, is $22,500 or18.0%. My 'peel off level' is 3%, this is higher than initial risk because it is dealing with openprofits. I can risk $3,750. The risk per contract is $1,000; therefore, I can only have 3 contracts.I cover two.)This will smooth volatility without adversely affecting returns in the long run.It will hurt returns in massively trending markets, which number one or two a year, but it willhelp returns on an 'average' move. It will cut the volatility by over 50%.
By combining the sliding scale of initial risk and a sliding peel off %, both per trade anddepending on the initial risk, one will see that money management has much more to do withreturns than entry exit decisions. However, the best money management in the world will notwork if one's methods do not have an edge over the market.Scot Billington [email protected]
Robert Buran Company [email protected]
Markets must move in such a manner so as to Frustrate, undermine and defeat the bestinterests of the majority of market players. According to this rule the majority cannot makemoney in the marketplace. The markets will totally ignore fundamentals if the majority of themarket players act on those fundamentals.
Price movement is predominantly random, i.e. not 100% random, but predominantly random.The "secret" to making money in the market is locating that small portion of market behaviorwhich is not random and exploiting it. I do not feel that conventional technical analysis is of anyvalue in doing this. The problem with technical analysis is that it will present the illusion ofuncovering hidden relationships between price behavior and various indicators.

I would submit that all such indicators are as random as the price behavior they attempt topredict and that all profits and losses realized from trading such indicators will be randomlydistributed.
First law of price movement is:If prices move up there is greater probability they will move higher rather than lower.If prices move down there is greater probability that they will move lower rather than higher.
Second law of price movement is:If price goes up you must buy the market long and if price goes down you must sell the marketshort.
The problem is that when we look at the chart we want to buy low and sell high. You cannot,however, buy bottoms and sell tops. You can only follow a trend which has already beenestablished through price movement in the same direction as the position you are taking.
You must understand that when you elect to buy long a market when price rises you are ineffect buying the market at the worst possible price at the time of your entry. It's not going tofeel good and it's not going to look good on the charts. But by "buying high" you are probablygoing to be placing yourself on the minority side of the market and therefore assuring yourselfof profits.
Stop and Reverse method:
The stop and reverse method involves utilizing some kind of indicator or a price based on anindicator. If the system is long one contract and the market comes back and the price is hit thesystem sells 2 contracts and reverses to a short position and so on. Of all possible tradingstrategies I have found this to be the least profitable and grossly inefficient with respect to theuse of margin. I will discuss margin efficiency in greater detail later but for now it need only besaid that systems that are in the market all the time tie up your margin needlessly. Markets tendto move sideways about 85% of the time and consequently these systems will have yourmargin tied up doing absolutely nothing for at least 85% of the time. These systems can alsowhipsaw you to death while moving sideways.
Trailing Stop:
The second most common way mechanical systems take profits is through the use of a "trailingstop." The idea behind a trailing stop is that it allows you to "let your profits run" while at thesame time "locking in" any profits you may have already made. My experience with systemdesign and trailing stops has been that the trailing stop is at best a mediocre method of exitinga profitable position. The problem is that if the trailing stop is too tight it results in your havingyour stop tagged right before the start of a big move. Conversely if your stop is too deep itresults in many small profits going to large losses. The other problem I have with trailing stopsis more theoretical. With a trailing stop you are trying to take profits only after the market hasturned against you. Frequently you are forced to sell out your long position when many othersare trying to sell too. You are then moving with the crowd and this is almost inevitably going tocause you excessive losses.
Therefore the rule I have developed with regard to taking profits is:*** You should try to take profits only when the market is moving strongly in your favor.
This is much more consistent with my contrary philosophy of trading. If you are long a marketand the market takes off like a space ship you should sell. By doing so you put yourself on theminority side of the market selling to the majority of panicked buyers. That is how you makemoney in this game.
Bob Buran:
What should you do, however, if your position starts out bad, get worse and then threatens anuncontrolled hemorrhage of your account equity?

Unfortunately this happens with about 15 or 20% of our trades and our ability to keep theselosses within a normal distribution pattern is what makes or breaks us as traders. This is aparticularly critical issue if you are using Systems without stops on day of entry. Let meassure you that you are utterly mad if you place no stop on day of entry. The day you enter atrade is the time you are most likely to be gored.I originally experimented with using a money management stop strategy on my day of entry. IfI were trading three coffee contracts and figured $2500 was as much as I wanted to loose Iwould put a stop in about 220 points away from where I got in (1 Point = ¢166 to ¢167 = $375= ¢37500$2500/3 = $833/Contract ¢250000/3 = ¢83333,3/Contract¢83333,3/$375 = 222 points
The problem was that on some days 220 points was far more than I should be risking andothers 220 points wasn't enough. The market didn't really care about what Bob Buran waswilling to risk.
Out of this frustration I developed a simple strategy that probably works better than anything Iever developed. If you are sick of always having your stops run, this simple strategy is going tobe a big help. If you got into a trade based on a longer time frame such as a timeframe based on daily data you need to develop a stop loss strategy that is based on a shortertime frame. For starters you should kick up an intra-day bar chart on your on line computerscreen and set the bars to something like 3 to 10 minutes. If you are following our trading rulesyou are going to buy when the market goes up. This upward movement should create some kindof upward wave on the intra-day chart. You should measure this wave from its top to its bottomand if you are long the market you should place your stop at the point that represents a 75%retracement of that wave. If you are short the market you simplyreverse the process. Hence my rule for placing your protective stop is:
Place your protective stop at a point that represents a 75% retracement (5/8 or 6/8) of thewave/move that got you in.
Here again you see why the "buying high" strategy doesn't sell systems. Buying point B (whichis the high) looks like a terrible place to enter this market. Why not sell at point B? Or if we haveto go long why didn't we buy at point L (which is the low)? Don't despair. Because you feel thatway others will feel that way also and so they, the majority of market players, won't buybecause it's too scary. The market in the best tradition of the "Rule of the Screw" will sense thishesitation by the timid majority and move much higher. That will encourage the timid majorityand they will then jump into this market in a buying frenzy. At that time you will calmly sell yourpositions back to the frenzied majority and take your profits.
The point I'm making is that when you first get into these trades they seldom look good and youneed to use the 75% retracement rule to place a stop so as to give yourself some peace of mind.If you go back and look at Figure 2 you can see how this stop was calculated. I measure frompoint L (low) to point H (high) and take 75% of that and subtract that from point H todetermine the stop which is equivalent to the price shown at point SS (sell stop).
If you are an Elliot Wave purist you may notice that there are other smaller waves in figure 1.Try to keep it simple and try not to miss seeing the forest for the trees. I'm not an Elliot Wavepurist and what I do with a 3 to 10 minute chart is to measure from the highest high after yourbuy point has been hit to the lowest low on the screen.Usually that is going to be the lowest low in the last day or two. That's what I mean by "thewave that got you in."
The Fibonacci Connection
Some of you sharper readers may at this point notice that maybe I might really just be playingaround with Fibonacci ratios. Indeed what we are really saying when we elect to place a stop at"75% retracement of the wave that got you in" is that if the market fails to be supported at the5/8 or .618 Fibonacci retracement point, it becomes a "Fibonacci failure," a trend reversal andwe need to get out of the way of a collapsing market. Believe me you are going to be very happy

to be out of the market if these stops are hit and it will be very unusual for the market to "tag"these stops and then move higher. This is the most effective stop loss strategy we use.
Some of you technical analysts may at this point feel somewhat indicated. Here I am telling youfirst that technical analysis is a lot of baloney and then I turn right around and start usingFibonacci ratios for stop placement. Of course the ratio .618 wasn't invented by a technicalanalyst. It was known to ancient Greek and Egyptian mathematicians as the Golden Ratio or theGolden Mean and was used in the construction of the Parthenon and the Great Pyramid ofGizeh. Then again maybe I just like Leonardo Fibonacci because he never was a floor trader andnever tried to sell me a seminar or a $3,000 piece of trading software. In any case I confess tohaving almost obsessive fascination with Fibonacci expansion and retracement analysis.Nevertheless I don't think that at this time I have developed fully all my ideas regarding this. Iam, however, giving you the most significant part of my work with these ratios.
Summary and Conclusions
These "laws" (If Prices move up there is greater probability they will move higher rather thanlower; If prices move down there is greater probability that they will move lower rather thanhigher) are permanent, will not break down and cannot change in the future.
Once we have entered a trade based on these rules we will reject traditional "stop and reverse"and "trailing stop" strategies of exiting our trade. Instead we will:
Take profits only when the market is moving strongly in our favor and place our protective stopat 75% retracement of the wave that got us in.
Some of you may at this point be ready to reject these market theories as being far too simpleto be useful. Before you toss this manual in the trash, however, I want you to go back to theappendix and look at my equity curve for the past seven years. Look at the summary of mymonthly profits from January 1, 1989 when I became fully automated, through June, 1991.Look at the consistent income and small drawdowns.How many gurus do you know who have included seven years of real-time trading records alongwith the materials they are selling?
I learned these rules in the marketplace and while attending the "School of Hard Knocks." Onthe surface they may seem simple, but implementing them in the marketplace is a morecomplicated process. Later in this course I will show you how you can consistently gain anedge on the markets and automate a trading system using these same simple rules. Using thesestrategies you need not fear that these basic rules will break down or stop working. They can'tstop working anymore than Newton's Law of Gravity can stop working. I believe if we stoplooking at all those wiggly lines, charts and complicated formulas and concentrate instead onsimple up and down price movement we can beat the pants off the big boys. Call this back-to-the-basics trading or call it anything you like. I call it financial security.
Design a system that puts you in an average of 2 markets every day and never more than 5markets. The drawdowns were extraordinarily small and the equity curve was amazinglysmooth. Based on my testing I figured I could make about $100,000 per year with a $60,000account.
Random Distribution of Profits and Losses, the Professionals' Nemesis
A system cannot know what the market is doing after entry. Your trade plan can. That is youredge. It is not second-guessing but intelligence-gathering upon entry. Systems may be givingyou a signal again and again. Does this mean to add at every signal? Your trade plan mustaddress that. I have liked the three add-on points. Use your own ideas.

Don't draw any conclusions about a system (or indicator) on the basis of isolated examples. Theonly way you can determine if a system has any value is by testing it (without benefit ofhindsight) over an extended time period for a broad range of markets.
Exits:
1. Exit at a target, i.e. a retest2. Exit at a target, i.e. an expansion3. Exit at a target, a fixed profit objective in dollars4. Exit at a target, an objective chart point5. Exit at a target, a subjective chart point6. Exit at a time interval, 4 days7. Exit at a combination profit time, first profitable open, 2nd profitable close.8. Don't exit but just reverse9. Exit on a range expansion10. trail a stop off the low11. trail a stop off the high12. parabolic exit13. Exit on close14. exit if the day's close is less then 66% of the daily range in the direction you are trading
On backtesting, find the maximum profit on each entry before a reverse signal is triggered. Thenuse something like a standard deviation of maximum profits to find a probable profit range.Take profits on partial position when that profit target is hit, then run a trailing stop.On stock system trades my first target is 2%, then a trailing stop of 62% of maximium moveafter 3 days. The system takes advantage of intermediate term swing moves (days to weeks),hopefully catching a few trends. I almost always get knocked out of trend moves, so amdesigning ways to re-enter the trend after being stopped out. The simplest is to re-enterwhen the high (for long) or low (for short) bar is taken out on close. Then I need a stop systemon that re-entry.-A.J. Carisse [email protected]
> This means taking smaller profits and not letting any get away from you,> it also does not mean trailing a stop because if you do, you will get an even smaller profit.
Not sure about that. This will get you out early too much. One of the difficult things to properlyrealize is that the performance of an instrument does not bear any relationship to your specificentry. By concentrating on its current characteristics in relation to your entrypoint, your exits will suffer significantly. You must let the instrument tell you when it is time toexit. Simply put, this means - the point when you can calculate that your capital would be betteroff in cash or in something else. Patterns, ranges, and TA can give us valuable input to wherethis point is, but one thing's for sure, it has nothing to do with how little or much you've madeso far on the trade. As far as moving stops go, at least this is relevant, but they are stillsomewhat arbitrary, and at best are an over generalization (i.e. always exiting on an Xretracement without regard to the peculiarities between patterns).
This is a complex matter, and one's approach will vary according to what is traded and one'spreferred style. However, there are a couple of principles that would apply universally. In allcases one should seek price confirmation for one's decisions. Ultimately, price patterns are king,and it is wise to at least wait for a reasonable indication that the trading is starting to go thewrong way. As well, while we need to spend a great deal of effort on trying to formulateefficient exit strategies, all this is wasted if we don't stick with whatever rules we haveformulated. This isn't always easy in the heat of a trade, but I've found that more often thannot, sticking to our well thought out plans will prove to be more profitable.
> So, what I am thinking is to exit when the trade is moving in your favor> and as long as you made money, be happy.

You'll be happier, though, if you can develop more efficient exits. In terms of risk, i've foundthat the old adage of giving your profitable trades a little more leeway (not too much of course)makes a lot of sense. It's important, though, that you consider the option of re-entry into yourcalculations, which is a tool that can allow you to tighten up your exits a little more while stillcapturing a large part of the bigger moves.
> I would like to hear from experienced traders on this philosophy. I have> had many times where I have had 500 profit into a trade and did not take> it only to have the trade fail to my stop. I am a one lot trader so it> is hard to scale in and out.
I never let profitable trades go south. You need to tailor you exits a little more to performance,as for sure there isn't any way that one should go from a good profit to a good size loss. Havingseparate objectives is usually the main culprit here, as is setting your exit criteria too loosely.Ideally, an exit strategy should be totally removed from your entry, and just focus on the thingbeing traded. As simple example, let's say that you plan to exit whenever a set of MA's cross. So- either they cross, or you're still in the trade - regardless of your P/L at any point (which mustbe kept separate). This doesn't mean that objectives shouldn't be considered - but in terms ofthe instrument's performance, and not yours. For instance, if you can sense that a meaningfulretracement is at hand, on the basis of its recent range of similar moves, and the price patternsuggests that it is underway, you could consider exiting, but this still has nothing to do withwhere you entered.
> I don't let 500 get away from me anymore, but then I am not letting> profits run either. I suppose a solution would be to build up the acct> with one lots and later use three lots to scale out and leave one on for the big pull.
I'm not a big fan of this approach, simply because the odds are either with the play or theyaren't. Therefore, there is a right and wrong answer in terms of whether to hold or not, and thetask is to try to determine which is the case. Whenever you focus on P/L, you will tend to beovercautious, and believe me, I've learned this the hard way. It is much better to focusexclusively on the present (the short term odds), while putting the past behind you (where youentered, and thus your current P/L), and letting the future take care of itself.
Regards, A.J.
Bill Shumake [email protected]
The first is to always trade a fixed unit of contracts per money invested. In other words aperson may decide to trade one contract for every $50,000 of capital, in this way risk-of-ruin isalways kept constant.
A second approach was suggested in which the number of contracts traded is increased afterthe second or third consecutive loss.The idea being that if a trader has a system that say 60 % correct on average, after twoconsecutive losses the probability that the next trade will be a winner is about 84 % and ifthree consecutive losses occur the probability is 93.6 % that the next trade will produce awinning trade.
A third approach, which is simply a conservative variation of the second, is to only take tradesafter two or three consecutive losses occur. This is a very interesting approach which warrantsinvestigation. It is based on the idea that all freely traded markets go through bases ofaccumulation/distribution and then an explosive trending move followed by another basingperiod followed by another explosive move. The money is made, of course, in the explosivemoves. If you could isolate the explosive moves you would have the perfect system. Thisapproach attempts to isolate these moves by waiting for two or three consecutive losses, whichtypically occur during a basing period, before a trade is taken. When a trade is taken, the oddsof it catching a trending phase is increased.

With regards to strict money management ideas such as only risking 1% or 2% of total equityon any given trade, the reason I think you find so little written on the subject is that there is notmuch to write about. What I mean by that is that a trader has very little information to basemoney management decisions on. For example, a great deal has been written about moneymanagement with regards to playing black-jack. One reason is that a black-jack player hasinformation about the odds of winning a given hand, information about exactly how much is atrisk and information about exactly how much stands to be won on any given hand. Thisinformation allows the black-jack player to use money management systems that allow him tovary the size of the bet in order to maximize his ultimate winnings. Many people have tried toadopt similar strategies for trading. Unfortunately as traders we only have informationregarding two areas; what our approximate odds are of winning a given trade, and how muchwe stand to lose if we do not win. Unlike the black-jack player, we have absolutely noinformation regarding how much we might win on any given trade, should it turn out to be awinner. (We have an idea of what the average winning trade has been in the past, but noinformation on any one specific trade in the future.) It is because of the lack of information onthis one critical area, "how much will be won on this trade," that most money managementsystems deal only with putting a certain percentage of capital at risk. However, I believe this isentirely adequate, because ultimately money management exists to do one thing; to make sureyou have enough money to stay in the game and continue to trade until winnings offset lossesand a profit is realized. If you have a system that is 60% accurate and limit your loss per tradeto approximately 1% of total equity your probability of success approaches 100%.
Something else you should consider when thinking about money management and the idea ofonly risking 1% per trade is the psychological effect. As you no doubt know, one of the keyelements to successful trading is being disciplined in applying the rules of your system overtime. Those who can consistently apply their system usually win and those who cannot beconsistent ultimately lose. Only risking 1% on any given trade means I can be wrong more than50 times in a row and still have over half my original money. Place this in the context of asystem that is 60% correct, where one might routinely be wrong only 4 or 5 time in a row andyou can see that it makes trading a much less stressful endeavor and insures that it will neverbe difficult to pull the trigger on a trade. In other words it makes it easy to be disciplined andconsistent with your trading strategy, which in turn guarantees your success. To give a real lifeexample, I read the other day that Linda Raschke typically trades one contract per $100,000.When I read this I thought back to when I was a young boy and my father would attempt totrade futures on a $3000 account (he was never successful by the way). Can you imagine howmuch easier it must be for Linda Raschke to pull the trigger on the next trade after experiencinga loss than it was for my father when he had just experienced a loss. It is this psychologicalfactor of money management that I personally believe is the most important. Remember,trading is only fun and worth the profits if you can sleep well at night. This is why I believe yousee so much about risking only 1 or 2 percent per trade...it is very simple, and while it may notbe the path to maximizing gains, it does insure that the trader will always be able take the nexttrade and apply his system with discipline and consistency. In short, risking only 1% per trademay not make financial sense but it does make Peace-of-mind sense, and in this business, peaceof mind is itself a valuable commodity.
Jack Schwager: New Market Wizards:
- nothing else but Volatility can be measured
- when a bigger than daily average move occurs, there is a 55% chance of being followed by asimilar directional move on the following day (probability edge is not sufficient after allowingfor slippage & commissions).
- 1 coin: 55% chance of landing on heads (i.e. odds of getting heads of a single coin is 55%)- 9 coins: 62% chance of getting more heads than tails- 99 coins: 75% chance of getting more heads than tails (binomial probability distribution)
- Fund:Average Daily Volatility = 1% (1% change per day)

Annual Return = 20% approximately 54% of the days were up (135 of 250 days), 46% of thedays were down (115 of 250 days)Annual Return = -20% approximately 46% of the days were up, 54% of the days were down
- the worse slippage, the better the trade- Fundamentals = funny mentals (Ed Seykota)
Coin Toss:Ted Juszczak [email protected]
In a system that is correct 50% of the time (which is typical of most trading indicators andflipping a coin too) strings of losers and winners will approach 15 in a row. In other words, if acoin is flipped 1000 times, probably (key word) at least once, heads will occur 15 times in a row,tails 15 times in a row also.There will be even greater occurances of 10 and 11 heads in a row, and numerous runs of 4 and5. Very few indicators are better than a coin toss.The same can be true of winning and losing trades. Those strings of losers will occur even morefrequently in a system that has 40% winners. A winning system only needs bigger wins by acertain percentage. The probability of winning times the average win minus the probability oflosing times the average loss just needs to be greater than zero to generate profits over time. Acasino wins about 55% of the time - they wired it into the rules of the game. With only a 5%edge, they can pay all of those employees, give away free drinks and meals, build lavish palacesand subsidize travel. The casinos in New Jersey alone, paid taxes on $6 billion from the take onslots alone in recent years. Your broker and and his colleages in the pits get about 5% slippageand commission. If you use just about any indicator it's going to be "right" about 50% of thetime, leaving you with a 45% system. You just have to make sure your average win is greaterthan your average loser, and not quit just because you started off with that string of 15 losers ina row.
Money management and Trading businessGwenn Ael Gautier [email protected]
1 - Trading constant size is riskier than increasing size. Indeed, as traders you have fixed costs,and you have to face unexpected events in trading and or life. Let's say you have- a $100.000 account to live off- a 100% return yearly- $80.000 in living, tax and trading expenses yearly
If you are trading constant size, you'll move only very slowly over the years out of yourundercapitalized status.If you are trading with a view to increase along the way, it may still take some time, but youwill indeed take off.
Now if in two years you have to face a $100.000 instant loss due to an accident, illness orsomething, which situation would you rather be in? The prospect of higher risk due to increasedsize, is also a prospect of lower exposure to unforeseen bankruptcy. I vote for the first.
2 - Increasing size is to be tested just as a system is. Sampling, back testing, forward testingetc. Check all ratios. Is your system displaying typical behaviors? Do winning streaks followlosing streaks, or are outcomes randomly distributed? What are your chances of having awinerafter a winner? Two winners? etc.What are your chances of having a winning streak, after a losing one? A positive return after anegative one? Is their seasonality? Depending on the above, you may increase in %, in steps oraccording to immediate results, period etc.
3 - Consider trading as a losing game, hence play very conservative as long as your not in a

winning position, find ways to be agressive when you are. May be add along the way, or playmuch bigger in some circumstances.
4 - ABOVE ALL, BE ABSOLUTELY CONSISTENT. With money management, more than anythingelse, lack of consistency will totally ruin your best laid plans.
5 - Take out profits on a consistent basis, in a consistent way. Either you pull winnings, or youpull revenues, but decide once and for all and TEST, TEST TEST everything. These steps shouldaccount foreway over 50% of the time you spent on testing your system.
6 - Same for breaks, holidays etc.
7 - Test for capital accumulation. Your plan should allow self insurance.Remember, anything can happen, and you want to still be around tomorrow.Plan for the B scenario, your retirement, etc...
Then you may also look at system diversification, market diversification:
8 - I only trade individually working systems, which also work on a combined basis. Last thing Iwant is having all drawing down together all the time.For some time I traded a group of 4 uncorrelated systems, two of which were underperformers,but very uncorrelated. Guess what, they "max drew down" all together, tripling a 15 yearcombined max drawdown (or over 20.000 combined trades tested).
9 - Know when to stop something that is not working. Just as for a single trade, your activitymust have a stop, if things are not right (see 8 above).
10 - Market or product diversification: Again, each must stand its own test, and in combination.For me option writing works well with futures system trading combined. Make sure also, youhave the means and resources to follow it all day in day out.
11 - Ideally, generate revenues elsewhere for basic living expenses. It is amazing how muchthis reduces your stress level, and increases your returns... But is difficult to implement.
Turtletrader:
Q1) How much capital do you place on each trade? Is this precise?Q2) When should you take a loss to avoid larger losses?Q3) If you begin a losing streak do you trade the same? What formula do you use?Q4) How should you prepare if trading both long and short positions?Q5) Is trading affected by commodities that move at different times?Q6) How is correlation handled in practical trading sense?Q7) Should you have profit targets? Yes or No?Q8) Does a portfolio of long and short allow one to trade more positions?Q9) How is your trading adjusted with accumulated new profits?Q10) How are stops handled when volatility is a concern?Q11) Is there a method to limit entry risk with options?Q12) How does one prepare for unforseen large scale trends?
Money Management questions (Ramon Barros [email protected])
Q1) How much capital do you place on each trade? Is this precise?
Capital per trade is for me a function of my plan's edge, the market's volatility, and thecorrelation between the markets I trade. I use Gallacher's formula to determine this.
Q2) When should you take a loss to avoid larger losses?
This is a function of my trading plan.

The first element is my initial stop, placed where if hit I am wrong about the trade. Then thesecond step is, once I have a position, the market must act in accordance with the scenario formy trade - or - as the Phantom of the Pits puts in, the trade must prove that it is a winner.
Q3) If you begin a losing streak do you trade the same? What formula do you use?
Measure a losing streak over the portfolio (not just one market at the time).I start to reduce numbers once a predetermined level is hit.Again this is function of statistical data based on my trading history and the current volatility ofthe mkt.
Q4) How should you prepare if trading both long and short positions?
I'm not sure what this means. Do you mean holding back to back? If so, I don't engage in thispractice. For me a long and short of the same position is the same as no position.If you mean when do I stop and reverse? Again this is a function of my plan.If you mean some sort of spread strategy - I don't trade spreads.
Q5) Is trading affected by commodities that move at different times?
I trade only FX but keep an eye on Gold, Interest Rates and the Stock Market - usingIntermarket Analysis to provide an overview of the longer term trends.
Q6) How is correlation handled in practical trading sense?
This is a function of the capital allocation formula I use.
Q7) Should you have profit targets? Yes or No?
I use the "rule of three" with profit objectives for the first 2 thirds. The last third looks tocapture unexpected trends and is usually taken out by a trailing stop.
Q8) Does a portfolio of long and short allow one to trade more positions?
As above - I don't understand "portfolio of long and short..."
Q9) How is your trading adjusted with accumulated new profits?
Once I have made 30%, I add 15% to my capital base and apply the same strategy each 15%thereafter. Each financial year begins afresh.This means after making 30%, 45%, 60%,... on each step you put 15% of the profit in youraccount. I want to ensure that I keep some of my profits. Also prevents the normal situationwhere a loss of 15% is a greater $ amount than a 30% loss because of a rapid escalation ofcapital.
Q10) How are stops handled when volatility is a concern?
My stops are a function of the market's structure and volatility. If the volatility becomesunacceptable, then I take a trading holiday.My stops are placed where if hit, I am wrong about the trade. Most times I exit a trade beforethe stop gets hit. When I plan my trades, I plan for certain things occuring and if they don't, Iexit. POP (at http://www.futuresmag.com/library/phantom/phantom.html) puts it muchbetter: "Assume a trade is wrong and has to prove itself within a specific period; if it doesn'texit."
Q11) Is there a method to limit entry risk with options?
I don't use options.
Q12) How does one prepare for unforseen large scale trends?

This is a function of last last third of my contracts.
What is the way to measure the Risk To Reward ratio ??
Really this question depends on a number of factors. I am going to make the followingassumptions for this post:
1 you have a written trading plan
2 your plan contains a number of setups
3 you have historical data pertaining to your trades so that you can calculate the meanplus/minus one standard deviation for your profits.
4 you can also calculate the mean plus/minus one standard deviation for your losses.
5 you can calculate the number of trades that have made money and the number that have lost.By dividing wining trades by the total number of trades, you will have the probability of success(PS).
6 you have at least 30 profitable and 30 losing trades from which to make the abovecalculations.
Once you have the data above, you can now calculate your RR.
The mean minus one standard deviation of your profits is the minimum profit you can expect tomake 70% of the time (P); the mean plus one standard deviation is the maximum loss you canexpect 70% of the time (L).
The formula for calculating the RR is:
(P*PS)/(L*(1-PS))
e.g.
if your probability of success (PS) = 55%if your mean -1 std of profit (P) = $1000.00if your mean + 1 std of loss (L) = $678.00
then your RR =
(1000*.55)/(678*.45) = 550/350 = 1.8
If you have enough trades, you can categorize them by mkts and setups.
You can also substitute the average profit for "mean - 1 std" for (P) and the average loss for"loss + 1 std" for (L). However, I believe that since the average represents a 50% occurrence,you are not putting the odds in your favour by doing this.
If you if need to learn some basic stats and (like me) run at the mention of a maths formula,read "Statistics Without Tears" by Derek Rowntree. A great book in that it teaches basicstats without a single formula!! I believe all traders would improve their bottom line byunderstanding basic probability theory.
Note that the formula above says nothing about how many contracts you should take as this is aseparate issue altogether. It merely states that given "x" contracts on your past results your RR,70% of the time, will be "A".

The more volatile the market, the more likely that you will have a large move against youand therefore you shold work with a tighter stop. However, there also is a contradictoryapproach that says that the more volatile the market, the more leeway you should give it. Whatis right and what is wrong? I don't know. You simply have to try both methods and pick the onethat you feel the most comfortable with and that matches your overall trading strategy.
The main movement in markets comes from people observing what others around them aredoing and reacting to it. So there's a kind of dynamic interaction rather than a specific responseidentifiable with external news arrival.It is the dynamic interaction between groups of market participants, who differ in their risk andreward objectives and in their trading time-frames, that is the key to explaining marketbehaviour.The fact that some people trade at short time intervals with high risk for profit, while at theother end of the spectrum some trade infrequently at low risk for hedging purposes, creates aset of relative effects where groups react in different ways to events and then react to eachother's reactions.
First off, there are many strategies that try and increase/decrease contractsas a function of the last x trades off of certain equity curve movement.The point that is important to keep in mind is that any strategy that relieson the last x trades is inferring that there is a dependency in the tradingsystem.For example, if you toss a coin 49 times and all 49 times you get heads,what do you think will happen on the 50th toss? If the coin is a fair coin,then regardless of the 49 tosses, the 50th toss still has a 50% chance ofbeing heads and a 50% chance of being tails. In other words, the results ofthe previous 49 trials offers no useful information.In looking a trading systems, one measure for assessing if you have ahidden dependency in your system is to do a statistical runs test, also knownas a Z-test. Given the systems Z-score you can determine if you have astatistical dependence. If you don't (and most systems don't) then trying totrade based off of the last x-trades offers nothing to improve the system andperhaps even degrades the performance.In an effort to try and control drawdown in a money management schemeI typically pay close attention to the systems historical largest loss on asingle contract basis. If you can incorporate this largest loss in yourmoney management model, you can usually maintain better control over drawdown.I prefer to use this number over say average loss, average trade, etc.
Neil Peplinski [email protected]
The best way is to start with a unit bet. Then it all depends on how the hands are streaking. Ifyou are going to win, then you should increase your bet according to the Fibonocci sequence.Otherwise decrease your bet to the square root of the previous bet. This way you will bewinning your large bets and losing your small bets. Some call it "locking in" your profits.Everyone knows that everytime you win a hand you are playing with the house's money - sokeep betting more, you've got nothing to lose.
Ken Fuchs [email protected]

Money Management 7
Money Management:
The best way to test this (an interesting experiment for your thesis) is totry a positive expectation game. Have 10 marbles 6 black (winners) 4 white(losers); randomly select and return the marbles 100 times. Have room fullof people trying different money management systems starting with ahypothetical $100,000; winning or loosing what they risk for each "trade".(Or record the sequence and do it yourself). The results will range from 0to Millions. Try a 70% game. The results will also range from 0 to millions.This is why the worlds best and largest traders have very simple systems butsophisticated MM rules.
The best definition I've come across for MM is "how many". Your systemshould tell you when and where to get out, only after these decisions havebeen made should you then use your MM system to decide HOW MANY, but the twodecisions should not over-lap.
You are right to try antimartingale systems, increase with wins, decreasewth losses. The exact nature of the system determines the best formula. Withwide stops like an n-day breakout, something like 2% is a good starting point, howeverthis would be suicidal with close stops. A volatility based formula wouldstop be better to stop you getting too carried away.
> I also tried to increase/decrease position size according to the>dependency among the last x trading days of a trade. When there is a>Win-Lose-Win-Lose pattern I increase-decrease-increase-decrease, when>there is a Win-Win-Win-Win pattern I increase continuously (e.g. every 5th>day). Also not very satisfactory.>Am I on the right track but on the wrong branch?
Close.Example 1: If your MM rules are to risk 2% of a $100,000 account ($2,000)Your system stop is $1000 away so you take 2 positions. The market moves upand you have a $4,000 profit but your system exit has not moved. You arenow risking giving back 4% ($4,000) If you want to keep a constant 2% riskyou may consider reducing risk back to 2% and just selling one at themarket.
Example 2: The same as above except your system has a reason (a technicalone, not a MM one), to move up the exit stop. The new stop is risking only1% now ($1,000) so you could now double your position size a buy two more atthe market. With this MM system you could increase dramatically yourposition size while never risking more than the original 2% to the market.
Example 2 is the basis of the very successful turtle trading system alongwith a very simple n-day channel breakout entry and exit system. There aremany variations on this i.e. you could risk say 1% for initial positions and4% marked to market or MARKET HEAT as it's sometimes called.
The idea is to limit risk and maximise profits by letting your testedtechnical system give you a reason to enter and exit the market, and MM tosay "HOW MANY" but the two are quite separate decisions.
Andrew Dykes at "Kerry O'Connor" [email protected]

Money Management/Expectancy/Expected Value:
>1) I tried a very close system stop, e.g. a $500 stop while Volatility (in>terms of a 15 day Average True Range) was higher than $500 at least in 2/5>of the cases. - I was surprised as the results were not too bad, as I could>"pack" more Nr. of Contracts with a close stops which obviously paid for>the higher number of stopped out positions.>Do you consider such close stops as hazardious?
As long as your realise that this $500 stop is not a money management rulebut a trading rule. If you wish to include it in your system then by allmeans test it and see what it does to your expectancy (!) ***. A MM rule does notalter your expectancy therefore is not at trading rule.>>2) What I was thinking about is to have a recursive money management system.>That means I just look at what results a certain system produces, e.g. an>average loss of $1000, an an average profit of $3000 and has tendency to win>big after a loosing streak and vice versa (lose bigger after a winning streak).
I've not found this to be true to any meaningful extent. I would caution against trying use socalled "streaks" to determine outcome. This is the very psychological bias that allows casinos toprosper. If you know the expectancy (!) *** of your system then every trade has the sameexpectancy going in, the actual result of any one trade is close to random. Also I've found theonly way to have the "real world" trading to match up to your hypothetical expectancy is totrade multiple markets and use many years of data in your testing.
>Any ideas how to build the average loss/average profit into a money>management plan? - Unfortunately I never played Black Jack, otherwise I>would maybe have an idea.>To know to suffer a loss in 60% of the time, and to have a profit in>40% of the time is advantage (Expected Value = 60% x -$1000 + 40% x $3000 =>$600), but I am not quite sure how to implement it into a valid method.
To see how good a system is I like to then divide the expected value $600 bythe average loss ie $600/$600 = 1 Which means your expectancy is $1.00 perdollar risked. This is a great way to compare different systems.
If the system has been tested properly with adequate slippage an expectancyof .5 is tradeable and .7 is a good one. An expectancy of 1.0 will make yourich!
Here is one plan, however the unfortunate truth is only with a large accountcan one truly use it or any effective MM plan,
Firstly I use my gambling formulas to determine maximum bet size forgreatest return (unfortunately this will result in large drawdowns and youhave to be psychologically prepared to trade through these.)
I use the Kelly Criterion. Kelly % = A-[(1-A)/B]{A is the % of winning trades in decimal format (reliability of system) andB is the average profitable trade in $ divided by the average losing trade in $
e.g. a coin flip game: the reliability of the system is 0.5. In this game youmake twice what you risk when you win. Thus B = 2. Therefore the amount ofremaining equity you should risk to produce the maximum rate of return is
Kelly % = 0.5 - [1 - 0.5)/2] = 0.5 [0.5 / 2] = 0.5 - 0.25 = 0.25

The maximum bet then is 25%.
Now with this information I would take 80% of Kelly to be on theconservative side (20%) I then work out how many different markets I will betrading i.e. 10. So I would allocate 2% of my trading equity per position.If in this example my account is $100,000. For each new position I wouldsubtract my initial entry price from my exit price then determine "Howmany". I might be able to afford 4 corn (if the amount risked was $500 orless) only 1 Swiss Franc and maybe have to forgo an S&P if the initial stopwas further away than $2000.
If I have on 10 positions and all of them go against me on one day I'mstill within the Kelly Criterion. But I know the "how many" has not changedmy expectancy (!) *** in any way.
>Is this what I call a recursive money management system? You decide AFTER a>trade what (rather 'how many') to risk next? This obviously requires>dependency between the trades. But I also read very often one should see>each trade independently, what a contradiction.
No, I have never seen any evidence of dependency between trades. A wellthought out system should have the entry and exit point fixed before thetrade is entered. The difference is your risk. The money managementdiscussion "how many" is then based on your total account size.
>The problem I had (to transfer the experiences from the game to the futures>markets) was a) that I did not know if I should consider daily changes (dailysettlement) as a streak or the last x closed out trades (which could be weeks away).
There are 3 basic approaches:Core Equity Method: to use only the value of your account from closed outtrades to determine positions size, less the amount risked on each open position.
Total Equity Method: the cash in your account as above, plus the value ofany open positions.
Reduced Total Equity Method: A combination of the two. It's like the core equity method but youadd back open profits if the stop has been moved into profit.
>b) that I often increased risk when the market was already lost steam, so>big drawdowns were the result.
The only way to avoid this is to trade many un-correlated markets at once.The selection of your portfolio is crucial. (And not an easy task by any means).
>What do you mean by 2%? - Initial risk?
Yes 2-3% of your account size for the initial risk and maybe double that for market heat(Marked to market on the close). However this market heat should not mean moving your stops(this would change the expectancy (!) *** and would mean you are trading a different system)but by varying position size. This is of course the luxury of a large account and is not usuallypossible for the individual trader staring out. In fact it doesn't necessarily increase overallprofitability but should produce a smoother equity curve, and cause less psychologicalproblems.
I can't recommend highly enough the "Special Report on Money Management" by Van Tharp (Imentioned it in my last e-mail) which covers all of the above in great detail (different positionsizing methods, different models of money management).
>> For each new position I would subtract my initial entry price from my

>> exitprice then determine "How many".>You are probably talking about the stop loss (exit) point here or do you use target exits>(at a profit)?
Yes stop loss exits. I never use profit targets. I always follow the basic cut losses short, letprofits run. The reason this works is in the nature of distribution of the trades. There is not theclassic bell shaped curve but one with "fat tails" i.e. there are more large moves than would beexpected if they were random. By having an initial stop to prevent the unusually large adversemoves, and a trailing stop to attempt to capture as much of the extraordinary large moves, it ispossible to profit in the long run.As a result all profitable systems I've seen are trend following and have less than 50% win toloss ratios.
>Do you try to be in different markets all the time (i) or is it possible>that you trade only one at the time (ii)?
When I say I'm in the market this includes buy stop orders above the market or sell order belowthe market. I then "trade" about 35 market world-wide and would have open positions in about60% of them at any one time.
It's all about having a positive expectancy then applying it as much as possible. As a blackjackplayer I used a system which had the odds of one player coming out ahead over a weekend to 2out of 3. Two players together could, by combining banks effectively double the number of daysand the probability of winning would be 3 out of 4. By the time we had a dozen players we wonevery day!Trading is the same, the more markets the better. I would even add a marketif I knew it was less profitable than the others (of corse this is impossible to know in advance)because the smoother my equity curve the higher my bet size can be.
>If (i), you must have a very 'easy-going' Entry Signal, which gets you in>very often, otherwise you couldn't be in, let's say, 5 markets simultaneously.
As I said previously having an order in the market is the same to me as being in it. But don't betoo worried about entries, it's a common beginners fallacy. It's the same as those "Lotto" typelotteries where you get to pick your own numbers (birthdays, lucky numbers etc..) Obviously asan educated Man you know this makes no difference to the outcome.Entries are the same. If you don't believe me try using all the well knownentry techniques, Channel breakout, moving average cross-overs, volatility entry etc and if theyare profitable after 5,10,20 days few are even as good as random entry.They seem important because the decision when to get in is the last time a trader is in control.Exits are at the whim of the market. Only money management makes any real difference onyour profitability.
>>Is this what I call a recursive money management system? You decide AFTER a>>trade what (rather 'how many') to risk next? This obviously requires>>dependency between the trades. But I also read very often one should see>>each trade independently, what a contradiction.
I know of no dependency between my trades. "How many" is a function ofaccount size and the percentage you are willing to risk.
>Do you measure correlation among markets with the LN (Natural Log) of price>changes? What I even find difficult here is how do the programming efficiently (I do>all the calculations with MS Excel): I must have all the data (of all commodities involved)>open to calculate a correlation matrix in a certain time window. This eats up all my>memory... Maybe I should calculate the correlations beforehand and write the>results into a separate file where it is read from during simulation? Danger is to 'lose >contactto reality' here. Which program do you use to run your calculations?
None of the above. I don't consider correlation among markets to be a mathematically problem,
rather a common sense one. For example I'm currently short Swiss Franc Futures so I don'thave a position in D-Marks. Just from looking at the charts of these markets they obviouslymove in a similar fashion. From experience I know to sell the weaker contract and buy thestronger. Grains and precious metals obviously have some correlation as dobonds and Euro's. S&P's have a negative correlation to bonds but not always. It is just a matterof paring down position size when you feel you may be over exposed to a particular sector. Iknow of no formular which improves on experience in this matter.I know this is not too helpful to an academic study of trading however the nature of market aforever changing. Oil and Gold moved together in 70's but by the 80's they were quite different.
The point to remember when testing a trading system, is that testing is not about accuracy orexactness. We only have last years data to test on when we really need next years! It would besimilar to trying to find out who would win the next Austrian Elections by polling the French, i.ethe wrong data pool.
To quote William Eckhart "The delicate tests that statisticians use to squeeze significance out ofmarginal data have no place in trading. We need blunt statistical instruments, robusttechniques. I.e a robust statistical estimator is one that is not perturbed by mistakenassumptions about the nature of the distribution."
>I have heard about the fact that moving stops would change the expectancy and varying>position size will not. But what is the (mathematical) explanation of this?
>I do not really understand why a money management rule does not alter my>expectancy.
Your expectancy is per dollar risked. A 2-1 expectancy game does not changeif the bet size changes.
>Is it correct that any additional rule which alters my expectancy (up or>down) is dangerous and should be avoided?
It is important not to have too many degrees of freedom. Do not use rules which would onlyaffect a very rare occurrence. If I had to choose between two otherwise equal systems I wouldgo for the one with the lessor number of imputs or degrees of freedom. This would be the onethat would be less "curve fitted" and more likely to work in the future.
>I know the Kelly formula for quite a while but never tested it.
The kelly formula should be use only for total portfolio risk. Assuming the worse case scenarioand all positions act as one and move against you at the same time. It is much too large for anindividual position.
>In practical terms, that means you decrease position size during the life of a trade instead>of moving your stops closer, right?
Yes, although this depends on the system. The only way to know is to test all possiblevariations. Remember trading is a much psychological as mathematical. Over all profitability isirrelevant if the trader cannot stomach the drawdowns.So changing position size during the life of a trade is more to do with keeping a constant riskbut doesn't necessarily increase profitability. If your exits are particularly clever it may bebetter to keep the bet size constant.
Andrew Dykes at "Kerry O'Connor" [email protected]
Fixed Ratio money management technique (Ryan Jones' company):
As you stated, Optimal F is the quickest way mathematically to increase your

account balance. As you also noted, it comes at the expense of large drawdowns.Additionally, better systems will typically have larger Opt. F drawdowns becausebetter systems yield a higher optimal fraction, such that when a loss does occur,you have a large amount of your account at risk.
Ryan's "Fixed Ratio" money management formula looks to maintain the drawdown of anaccount at a constant percentage level. In other words you increase or decreasethe number of contracts traded in order to keep your drawdown at roughly the samepercentage level. This theoretically makes the account easier to trade because youdon't have the wild equity swings associated with optimal f. This money managementapproach boosts account returns well above single contract trading, but stillfalls short of optimal f levels. It's just at matter of whether or not you couldwithstand (both psychologically and in regards to account capital) a 60% or 90%drawdown that is quite typical of optimal f.
I've purchased and worked with Performance I (Ryan Jones' software package forfixed ratio). At $1200, the software leaves something to be desired (pretty much aglorified spreadsheet) although a new version was just released (free to currentowners). Basically what you're paying for is the concept, which is fullydisclosed. Bottom line: Fixed Ratio is unique, but not stellar. I believe if youstudy Vince's material (opt. f) and Kelly's techniques and fixed fractionaltrading and get an understanding of how money management works, you could probablycome up with an approach that works just as well as Fixed Ratio. If you're lookingfor someplace to spend money, however, this is as good a place as any!
Neil Peplinski [email protected]
Never risk more than one days range. In general, it is preferable to exit in the direction that themarket is going I believe. I am also interested in this type of discussion, because I have a greatentry technique and am more interested now in a great exit technique. Most trading systemsexpound on great entries but ignore how to have great exits. Many Gurus recommend scalingout of trades in order to cut down risk. Finally, when the risk is greatly reduced and some profitsare protected, a final contract is left to go for the big long home run. The first few contracts aretaken off at targets, and the final one is let run with a loosely trailing stop.For small accounts, a profit target is probably preferable for short term systems and a trailingstop is preferable for long term systems. The system that I am trading allows your profits to runfor one day, and then you nail them the next day. If the market keeps going in yourfavor, you reenter. The system skips a lot of profit between where you took profits and reenter.I am thinking about how to fill the gap.
Money Management-Van Tharp:
Long trades have a high positive expectancy but make you money only 25% of the time. Whenthe market starts up trending (winning streak on the long side), the probability of it continuingis about 70%. A winning trade could last 15 days or more, and (if you risk the maximumallowed) you could double your equity each day. Thus, a winning trade that was allowed todouble each day for 15 days could pay more than 16,000 to 1. However, if it didn't go 16 days,you would lose all of your profits. For more information on expectancy or probabilities, see thequestions and answers below and Dr. Tharp's comments on money management.
Short trades have a negative expectancy but they make money for you 75% of the time.However, you could loose up to 20 times the amount you risked. Thus, any time you risk morethan 5% of your equity on the short side you risk bankruptcy. A losing trade onlylasts one day, but a winning trade can go as long as 15 days and as short as two days. The artform to winning this game is to be able to capture as much profit as possible from a winningtrade while, as the same time, not letting the profit get away. For example, if a winning trade

went 15 days, you could make as much as 16,000 times your initial risk if you continually riskedthe maximum. But, if you continually risk as much as possible on awinning trade, you will eventually lose all of your profits.All trades are not necessarily 1:1. The market can move in your favor or against you at 1:1, 2:1,5:1, and even as much as 20:1 on the short side. There are occasional 2:1 losses on the longside.
During the course of play, each player has a listing of the last 10 trades they placed. Here is howto interpret some of the columns:
Risk - the amount risked during the tradeL/S - indicates whether the player traded on the Long side or the Short sideMkt - indicates the market movement:Up = a win on the long side or a loss on the short sideDown = a loss on the long side or a win on the short sideChg - indicates the amount the market movedClose - your closing equity (Equity + Amount)
YOUR LAST 10 TRADES
Date Equity Item Traded Risk L/S Mkt Chg Amount Close
06/12/1996 50000 Ethiopean Rice 00500 L DN 01 -00500 4950006/25/1996 49500 ABC Shoes 00880 L DN 01 -00880 4862007/03/1996 48620 Monitors Inc 00200 L UP 02 +00400 4902008/28/1996 49020 Monitors Inc 00200 S UP 01 -00200 4882009/01/1996 48820 Manual Trans 00200 S DN 01 +00200 4902009/04/1996 49020 Cups Mugs Inc 01000 L DN 02 -02000 47020
Thus, if you risked $1000 on the long side, as it did with "Cups Mugs Inc." and the marketmoved down by 2 times, then you would end up losing $2000.
If a player elects to "go short" and the market enters a long winning trade, you won't bepermitted to participate (except by going short) until a loss occurs and a new item is presented.The reason for this is that we are simulating the whole issue of allowing profits to run, but notletting them get away from you. By going short, you have elected not to participate in thatparticular trade. Remember that a winning long trade can last manydays. Thus, when you go short, you may be locked out of the game (except to go short again)for a number of days.
Only one stock or commodity is traded per day. During a winning streak, the stock orcommodity being traded remains the same from one day to the next. Once a loss occurs, a newstock or commodity is offered. During the winning streak, you can risk a maximum of yourinitial trade on that item plus any profits you have realized since the item was offered. If yourisk $0 on the long side, you will not be able to participate in a winning trade because theamount you can risk is limited to $0 throughout the trade.
Players that are unable to return to the Virtual Trading Exchange daily are letting their profitsride (once they have some) just like in the real markets. However, we do have an error in thelogic of the game in that program only lets your profits ride during the second day of yourparticipation in a winning streak, but not after that. In fact, if you let your profits ride, by notparticipating, you risk getting the results of the trade on the day you return (instead of the nextday). We will not fix errors of this type, so you are on your own if you try it. You need totake this into consideration when considering your money management prior to placing yourlast trade, and then place the trade accordingly. You can also decide to place a "stop" in themarket by entering a "0" as your last trade, effectively preserving your capital.
There may be circumstances where you will notice two trades listed on a single day. This tellsyou that the exchange automatically executed your trade at the end of a winning streak (which

would have occurred during one of the days which you were not participating but had a tradeon) before switching to a new item. By not participating, you were letting your profits ride. Thisis the only circumstance which will cause two trades to be listed on the same day.
When a winning trade starts, it may last as long as a week or two. It is considered to be just onetrade. If you elected to take it on the short side or risk $0 on the long side, you haveessentially decided not to participate in that trade on the long side. However, you can makemore short entries on that trade - should you decide that the winning streak should be over.Your risk on the short side is only 1:1, but remember that a winning trade can last a long time.
There is a lot of uncertainty in the markets, just like there is a lot of uncertainty in the game. Inother instructions, we say that certain things will probably happen. However, nothing iscertain. And if the unexpected happens, it is your problem. We will not resolve such problems inyour favor. It's one of the hazards of trading.
How to Play the Simulation:
The best way to describe how to play the simulation is to take you through a series of trades tosee what will happen. The names of the stocks or commodities used in this example are purelyfictitious - any resemblance to actual companies is purely coincidental.
Let's say that the first trade is MicroLoft, Inc. On day 1 you place a trade for $1,000 on the longside. The next day, you look to see what happened in the market and find that themarket moved against you at 1:1 and you've lost the $1,000 (if you had gone on the short side,you would have won).
TIP: Each day, the market switches instruments unless there is a profit on the long side.
Now, on day 2 everyone is trading on Gold. You place a trade for $1,000 on the long side. Thenext day, you look to see what happened in the market and find that the market moved againstyou again, this time at 2:1 and you've lost the $2,000 (if you had gone on the short side, youwould have won again).
On day 3, everyone is trading Silver. Again, you place a trade for $1,000 on the long side. Thenext day, you look to see what happened in the market and find that the market moved againstyou again, at 1:1 and you've lost another $1,000.
Your new equity is now $46,000. If you had gone on the short side for all three trades, your newequity would have been $54,000.
On day 4, everyone is trading WXYZ Corp. Again, you place a trade for $1,000 on the long side.The next day, you look to see what happened in the market and find that the market moved inyour favor at 1:1, and you've now won $1,000. However, if you had decided to go short on day4, you would have lost at 5:1, or $5,000, and would not be permitted to trade on the long sideuntil a new instrument is offered.
___________________________________
TIP: When there is a win on the long side, the short side can lose anything from 1:1 to 20:1.Once the market enters an up trend, it enters a new mode of play. WXYZ Corp. is now trendingup. It will remain the instrument offered as long as it remains in the up trend(i.e.: until the first loss). Subsequent, days are just a test for you (those of you who've mademoney on the long side) to be able to let you profits run, but also lock in some of the profits byraising your stop (i.e., not risking the maximum).
On day 5, WXYZ Corp is still being traded. Your decision now is whether to risk all your winningsor to raise your stops. You decide to trade $2,000 on the long side. The next day you look andfind the market is still up trending and you have won at 1:1, or $2,000. You have now made

$3,000 on this trade!
On day 6, WXYZ Corp is still being traded. You decide to transfer $500 into your equity by onlytrading $2,500 today. The next day, you look to see what happened in the market and find thatit moved in your favor, and you won $2,500.
Your new equity is now $51,500 with $5,000 to risk.
On day 7, WXYZ Corp is still being traded. You decide to move an additional $1000 into yourequity account by only trading $4,000 today. The next day, you look to see what happened inthe market and find that it moved in your favor, and you won $4,000.
Your new equity is now $55,500 with $8,000 to risk.
On day 8, WXYZ Corp is still being traded. You decide to only risk $2,000 on the trade. The nextday, you look to see what happened in the market and find that it moved against you,at 1:1. This trade is now concluded and you have $53,500 in equity. You've made a total of$7,500 on WXYZ.
On day 9, Arizona Oceanfronts is being traded and the entire process begins again.
It pays to cut your losses short and to let your profits run. You do this by implementing goodmoney management techniques. Our simulation has been designed to provide you interactivefeedback during the course of play. The simulator has been programmed with a set of rules. If itsenses that you are trading in a highly risky manner, you will receivean instructional email message to help you out.___________________________________
Questions & Answers:
I don't have access to the internet over the weekends. Why does the simulation runcontinuously?
The simulation runs continuously by design. During the design phase, we considered theproblem that some people that may only have internet access at their office during "regularbusiness hours". However, our simulation is being played by people all over the world in varioustime zones, thus it was impossible for us to define what "regular business hours" would be foreach player.
Furthermore, the goal of the Virtual Trading Exchange is to teach people money managementskills. People need to learn to consciously consider their money management strategies eachtime they place a trade. Thus, if a member is unable to participate over a weekend, holiday,business trip or any other time, then they need to consider this when deciding how much to riskon the last day that they are able to participate. Their money management should tell them toeither reduce the amount they are willing to risk on the trade or to place their trade on hold byplacing a stop in the market (entering a "0") as their last trade.
This game seems like gambling, not trading, to me. You'll even lose on long trades most of thetime. What am I suppose to learn?
It's not gambling because, unlike the casinos, the game has been programmed to give you apositive expectancy if you go long on every trade. It is actually a good simulation of long-termposition trading. The losses only last a day and you've got to let your profits run. You also haveto learn to make sure that your profits don't get away from you. Thus, if you play the game well,you'll learn the lessons necessary to be a good long-term trader/investor.
I don't have a lot of information about any particular stock or commodity that you give. How amI suppose to make a decision?
Actually, taking every trade in this simulation is a little like following a system. You don't know

which trades will make money, but you know that you will make money if you take them all andmanage your money well. You also know that you have a positive expectancy by trading on thelong side.
The key to making money in the markets is money management. That is what we areemphasizing in this game. Most people think that the key to success is analyzing the market andfinding the next winner. That's why most people have a lot of trouble making money. We'retrying to teach you how to make money in the markets through money management. Hopefully,you'll be open to learning about it.
How can I make a decision on this trade (it could be any one) when I can't see a chart of it?
The answer to this question is again the same as the last one. Follow the expectancy and golong. The key to this game is money management (how much to risk) and how much to continueto ride on a trade during a winning streak. Going long or short shouldn't be a part of yourdecision making. However, we allow you that option because most people like to make stupidmistakes.
Why not give us a portfolio to trade?
A portfolio would be useful, but our goal with this simulation is to teach you moneymanagement. That's easier to do when you only have one item to concentrate on. We want tomake the lessons simple and easy for everyone to understand.
What's a good strategy to use in this game?
We don't want to give one strategy and have everyone play that. However, we will give yousome general hints:
Trade a percentage of your equity on each trade --- enough to do well, but not so much thatyou'll get too far "in the hole". You might consider increasing the percentage when you areahead and decreasing the percentage of equity when you are behind.
When the market is up trending (a winning streak on the long side), conserve some of yourprofits. On method is by protecting a fixed percentage of your profits (which is like using atrailing stop in the market). When the market starts up trending, you may only protect a smallpercentage at first, but as the trend continues, protect more of your profits. One way you mighttrail stops (and there are many) would be to trade 80% of the maximum on day 2; 60% of themaximum on day 3; 40% on day 4; and 20% on day 5 onward. However, you can do anynumber of possibilities in terms of protecting your stops. For example, if you risked 100% ofwhat's possible on days 2 and 3 of a winning streak, you'd risk losing it all, but you'd have an8:1 (2^3) = (((1/0,25)^3)^0,5) = (((1/0,25)^(3*0,5)) winner after three straight winningdays. If you risked the maximum in a trade that went ten days, you would have a 512 (2^9)(((1/0,25)^9)^0,5) to one winner. However, in order to get that profit, you would have to riskall of your profits on days 2 through 10 - which is probably not a wise decision.
Incidentally, you can determine how much you are allowed to bet during a winning streak byrisking your total equity. The computer will reject the trade and telling you how much you canrisk. You can then elect to trade a percentage of that figure.
I am having trouble reconciling the following statements: Long trades have a high positiveexpectancy but make you money only 25% of the time. Short trades have a negativeexpectancy but they make money for you 75% of the time. How can you have positiveexpectancy with only a 25% success rate, but negative expectancy with a 75% success rate?
___________________________________
Expectancy is a function of both the probability of winning and the size of the average gain tothe average loss. For example, imagine having a bag of marbles in which there are 99 black andone white. The 99 black ones will cause you to lose whatever you risk. The one white one will

pay off 1,000 times what you risk. Each marble is replaced in the bag after it is drawn out. Thus,on any given trial, you only have a 1% chance of winning, but a great positive expectancy. I'dplay that game all day, but you must be in the game to capture the 1000 to one marble. [1000 *1% - 1 * 99% = 10 - 0,99 = 9,01]
Most people don't understand expectancy, so that's why we do it that way. To understandexpectancy better I'd suggest that you either subscribe to our Market Mastery newsletter orpurchase our Money Management Report. Also see the expectancy section of this web site.
When you say that their are only 25% winning trades, please look at the following scenario andtell me if there are 25% winning trades.
Gold LossABC Stores LossGolf Shoes WinGolf Shoes WinGolf Shoes LossCopper Loss
Would you agree that there are only four trades there three losses and one winner thateventually loses. Thus, the winning percentage is 25%.
Yes, that is correct. There are three losing trades -- gold, ABC Stores, and Copper -- and onewinning trade -- Golf Shoes. Thus, there are 25% winning trades.
Be looked at the trials in this game, and there is no positive expectancy. Your engineers need tore-program this thing.
I agree that we have some bugs in the program. The biggest bug is that it doesn't force you tolet your profits run beyond the second trial of a winning streak. However, you have to takeadvantage of those streaks (by letting your profits run) and you can't keep betting it all (whichmeans you have to raise your stop). When you do that there are some big winners. For example,there was a potential 96:1 winner on the long side in one of the last two games (see below). Notone person took advantage of it. In addition, the random generation has not had any really bigwinning streaks in the past, but there is a good chance of one in the future.
There is only a positive expectancy on the long side when you allow your profits to run. Forexample, a good strategy after a win might be to risk 80% of the maximum on the second bet ofa win streak; 70% of the maximum on the third trial; 50% of the maximum on the fourth trial,;30 % of the maximum on the fifth trial and 20% thereafter. If the streak, only starts out with aone to one winner, might not want to risk more than 50% on the next trial.
In the last game, there was one trial that started out as a five to one winner. If you had risked athousand on the first trial and let the whole winnings go for the five winning trials, you wouldhave made $96,000. But let's say you did something like the following:Trial Risk Amount Won New max. risk1 $1,000 $5,000 $6,0002 $5,000 $5,000 $11,0003 $7,000 $7,000 $18,0004 $9,000 $9,000 $27,0005 $8,000 $8,000 $35,0006 $6,000 ($6,000) $29,000 (Total Gain)
Look what happens, you make $29,000 out of that streak on an initial risk of $1,000. That'salmost a 30 to 1 gain. Even if you left your risk at the initial win of $5,000, you would still havemade 20:1. However, no one was willing to do that. And, of course, no game has a positiveexpectancy if you don't play the big marbles. Remember that the core risk on this trade - therisk to your core equity - was never more than $1,000.During the rest of it, you were just risking open profits.

Some winning trades pay 5:1, others pay 2:1, and others pay 1:1.What is the distribution of those trades? Also some long trades lose at 5:1, 2:1, and 1:1. What isthe distribution of those?
If we've programmed things correctly for the current game (beginning September 21st 1997),the long trades can only win or lose at 1 to 1, with an occasional 2:1 loser on the first tradeonly. (There has already been one exception to this on November 7th). The way you'll make alot of money is to be able to as much as double your capital everyday by riding a winning streak10 to 15 days. But of course, if you continually double your risk, you'll eventually lose it all. Youhave to lock in some of your profits, just like you would with a stop order in themarket.
I have made some simulated runs assuming a 25% chance of a winner being long and a 70%chance of a winner continuing the next day. I also assumed that a long wins and loses by 1:1each day. I'm betting a constant size on each day, and stay with the initial bet during thewhole long trade if it trends. The bet size is $500. I recorded 100 runs and found out on theaverage one breaks even. To conclude, your rules don't give a positive expectancy on the longside.
The long trade is one trade. Your initial risk might be $500, but you can risk $1,000 on day two,$2,000 on day three, $4,000 on day 3, $8,000 on day four etc. By day 14, you could riskas much as $446,000. Your core equity risk would still only be $500 since it is the same trade.Please understand that -- if ABC Stores wins for 8 straight days it is still only one trade. You canlet profits ride in a trade. That's what is wrong with your calculations. Money managementdetermines how much you risk initially. But money management also controls your position sizeduring the trade. The golden rule of trading is let your profits run.
You need to lock in some of your profits. Otherwise, you'll eventually lose your core equity riskand all your accumulated profits in that trade), but you could theoretically make 16,384to 1 on the initial risk of a trade that goes 15 days. A trade that goes 15 days is not thatprobably, but some big winners are.
What if I haven't played for a few days, how do I know if we're in a winning trade or not? And ifwe are in a winning trade, can I jump into the middle?
There is no way that you can know if we are in a winning trade or not if you've been away for afew days. However, the odds are much greater than the 25% that we will be in one if you'vebeen away for a while. Yes, you can jump right in. Just realize that if it is already going, it mightnot last that much longer.
I've been following the winners and number 26 appeared to go short and then go back in on thelong side. The rules say that cannot be done and I haven't been able to do it. What gives?
That's a great question and it illustrates how one of the querks in the game, previously given inthe instructions, works. When you leave the game for a period of time, the computer doesnot process your trade until you return. If the trade is no longer in a winning streak when youreturn, it will be counted as a loser (even those it would have been a winner had you played thenext day. Here's what happened with number 26.
11/06/1997, 0190815,Viper Technologies , 0001120, L, W, 01,0001120, 0191935,11/06/1997, 0191935,Viper Technologies , 0002240, L, L, 01,-002240, 0189695,11/09/1997, 0189695,Basket Ball Inc , 0001000, L, W, 01, 0001000, 0190695,
Viper Technologies did not actually have a losing day until 12/7. However, #25 made a trade on11/6 and then did not return until 11/9. Since the 11/6 trade had not been resolved, it wasdeclared a winner, but the next trade was carried over and lost at double the best size. As aresult, it might have looked like #26 really went short on 11/8 in Basket Ball Inc.. But was

really happened was that several trading days were skipped.__________________________________
If you look at what people are doing with money management in this game, it is reallyatrocious. First, if you want to get into the top 10 in any of the first three games you couldprobably bet $50 long on every trade and make it. Sometimes there are only 10 profitablepeople in a game (aside from our staff members and people who are cheating and playing twoaccounts at one time), and you get into the top ten if you make $500. Most of you want to getinto the top ten immediately. Resist that temptation and just follow your discipline. Most of thepeople in the top 10 end up doing something foolish and then falling behind. Be patient.Most of you give into the temptation to bet with the probability and you do so big time. Severalpeople risked everything on the first trial and went bankrupt. If you risk more than 5% on theshort side on any trial, you risk bankruptcy.
Percentage risk and percentage return do not have a symmetric effect on the portfolio, becausethe required percentage return to recoup a given loss (in percent) increases geometrically withthe size of the loss. Not adjusting the trading size to the portfolio value (by decreasing withgreater risk) would lead to an increase of risk at an increasing rate (as expressed by theincreasing leverage of a fixed-size trading position).
The process of translating portfolio risk into number of units traded, under given price riskestimates, is shown here using a T-Bond position as an example.
Example A: Proposed LONG position in US T-Bonds at 100(Unit Face Value US$ 100,000)Estimated (Accepted) Price Risk: 2%Allocated Equity to this trade: US$ 1,000,000Accepted Portfolio Risk on Position: 1.5%Calculating Accepted Position Risk in absolute US$ = (1,000,000 * 1.5%) = 15,000Calculating Accepted Per Unit Risk in absolute US$ = (100,000 * 2% ) = 2,000
Accepted size of the trading position = 15,000 / 2,000 = 7.5 units of T-Bonds at face value US$100,000 equalling a US$ 750,000 investment. If contract sizes do not permit the exact tradesize as calculated, we mostly round down to the lower possible trading size (lower risk), here, aUS$ 700,000 investment.
Example B: Actual Market Price is now at 101 (up from 100)System calculates price risk to be 3% (up from 2%).Allocated equity now at US$ 800,000 (due to losses in other markets within the portfolio)Accepted Portfolio Risk unchanged at 1.5%
Calculating Accepted Position Risk in absolute US$ = (800,000 * 1.5%) = 12,000Calculating Accepted Per Unit Risk in absolute US$ = (101,000 * 3% ) = 3,030
Calculated accepted position size = 12,000 / 3,030 = 3.96 units of T-Bonds (at face value US$100,000), rounded up to 4 units, equals accepted position size of US$ 400,000. The system willtherefore issue a signal to sell US$ 300,000 worth of T-Bonds in order to adjust the position tochanges in the price risk and in the portfolio composition, expressed in the lower portfolioallocation.
CAPITALIZATION
Capitalization (actually, the lack thereof) is perhaps the most overlooked, misunderstood, andMAIN reason why so many traders starting out fail to achieve their goals. They go into their newbusiness without an adequate supply of a traders lifeblood: CAPITAL. Think of yourself as ageneral or field marshal. You are fighting a war. If the war goes badly at first and your openingbattles all end in defeat, then you must have adequate reserves to carry on the struggle until

you emerge victorious. You lose all your soldiers, guess what? YOU LOSE!!! A general can nothope to fight a successful campaign without enough soldiers in his army. A trader can not tradehis account properly if financial armageddon rides upon every trade.
YOU MUST BE SUFFICIENTLY CAPITALIZED! IF YOU ARE NOT YOU ARE DOOMED TO FAILUREFROM THE BEGINNING!
THE RULE OF 4.5
What then is sufficient capital to begin trading the S&P/DJ? As a common sense guideline Ihave developed a simple and straightforward method to determine what your MINIMUMaccount balance should be to open your account and begin trading. I call this THE RULE OF 4.5.Simply put, you can NOT risk more than 4.5% of your total equity on any single trade. This givesyou the advantage of being able to lose 20 times in a row without having your account wipedout. (If you do lose 20 times in a row I want you to do 2 things: 1) Realize that you were notmeant to be a trader. 2) Send me your methodology so I can fade it).
All kidding aside, there is something known as LUCK and STREAKS. If you begin trading 2 S&Pcontracts with $5000 and run into a bad streak (say 4 out of 5 losers for a loss of $2500) at thevery start, you are going to seriously think about quiting right away! Thats a 50% drawdown inequity in a very short period of time...maybe even ONE day! It will be very difficult from apsychological standpoint to trade properly after that or have confidence in your abilities. Yet ifyou were properly capitalized you would have only suffered a %12 drawdown on those S&Pcontracts, not nice, but you can dig in your heels and continue the fight!Below is a simple table to determine what your MINIMUM opening account balance should bebased upon the Rule of 4.5. The amount of the contracts varies based upon the account balance.Remember: you must always begin with TWO contracts at a minimum, or you do not stand aghost of a chance to be profitable.
OPENING ACCOUNT EQUITY: 7000 10000 13000 16000# Dow Jones (DJ) you can trade: 2 3 4 5
OPENING ACCOUNT EQUITY: 20000 30000 40000# S&P 500 you can trade: 2 3 4
If you stick to the above table, and do not deviate from it (and for goodness sakes, if you dodeviate, do so on the side of caution), then you have an excellent chance of making money. Ifyou disregard this advice, you do so at your own peril! THIS MAY WELL BE THE SINGLE MOSTIMPORTANT ADVICE I AM GIVING YOU. IF YOU LEARN NOTHING ELSE, THEN LEARN THIS.

Money Management 8
Money Management
An essential element to success in trading is ignored in almost all trading or market timingbooks or articles. It's surprising given its importance that very few writers devote any time tothe discussion of money management practices and principles. This chapter will present oneapproach to money management that is general and could be easily supplemented by othermethods if you desire. The goal here is to provide recommendations for a simple, viableapproach to allocating funds and managing your portfolio.This book is not intended to include a course on money management. However, if there is onesubject within the realm of trading that is vital to a trader's financial survival and at the sametime totally overlooked as critical, it is the discipline of money management as it applies totrading success. If market indicators and systems were always precise in identifying tops andbottoms, the necessity for prudent money management skills would not exist.Unfortunately, such is not the case. Even if a system were 99 percent accurate, the 1 percentfailure rate could conceivably wipe out a trader who did not apply money managementmethodology. The following techniques for your consideration in designing a prudent and viablemoney management program may appear simplistic upon first glance. However, makingprocedures complex serves only to obfuscate the obvious, easy, and straightforward approachto sound money management. These recommendations regarding the design of a moneymanagement methodology are a compilation of various techniques I have developed andemployed successfully throughout the years.Before you enter any trade, you should be convinced that the trading event will prove to beprofitable. Otherwise, why even attempt the trade? Obviously, no decision in life is alwayscorrect and this applies invariably to the markets. In the case of the markets, however, you arenot able to undo a bad decision and recover your losses from a trade.This lesson came early in my career. Discretionary decisions or trading hunches or guesses mayprove profitable on occasion, but how do you quantify and duplicate this decisionmakingprocess in the future? Consequently, the following suggestions are directed not only towarddeveloping -a series of mechanical, objective approaches to trading decisions and moneymanagement but also to enable you to replicate your decision-making process regardless of thetime period and the number of markets followed. The primary considerations are consistency,objectivity, and portability. Additionally, you need to be sensitive to diversification of markettiming techniques, as well as markets monitored. By implementing a number of unrelatedmethods, you will be able to sufficiently diversify your portfolio and thereby reduce your level ofrisk. In other words, by applying a combination of market timing approaches, each of whichuses a different trading philosophy, you will be able to operate as if you had a number of tradingadvisors managing your funds. Obviously, these techniques should be applied on paper beforeintroducing them real time into your trading regimen. Once the techniques have beensufficiently tested to ensure performance results and nuances, the money managementdisciplines must be introduced. The other chapters of the book pertain to the methodologies, sothis discussion is devoted to a basic approach of managing trades and your investment.First, you should allocate percentages of capital equally to various mechanical market timingmodels. Therefore, if you have developed and decided to use three noncorrelated mechanicalapproaches, then you should designate the same percentage participation to each. You maychoose to vary this approach. For example, if one system is two times more effective thananother, then you would double by position size or if the frequency of trading for one method istwice as active as another technique, you may wish to reduce portfolio commitment by 50percent.However, for sake of discussion, assume that all systems are equally effective. Assuming a totalof 100 percent, you may not wish to allocate in total more than 30 percent to these systemscollectively at any one time. Also assume for purposes of simplicity that you have elected tofollow 10 individual markets for each system. Consequently, your maximum exposure would beno greater than 30 percent of your beginning equity, and that is only if each model has itsmaximum investment exposure of 10 markets at any one time and each market is being traded
simultaneously at the same time (10 markets times 3 trading methods times 1 percent apieceequals 30 percent exposure).How are you to measure your investment commitment in terms of number of futures contracts,for example? Rather than subscribe to an esoteric portfolio management methodology withnumerous complicated variables connected by advanced statistical formulas, you should rely onthe market itself to dictate your level of exposure at any point of time. Specifically, the variousfutures exchanges determine the margin requirements to trade markets. Typically, as tradingactivity becomes volatile, the margin requirements increase. At that time, you should reduceyour exposure because you would have specifically allocated only a 1 percent commitment tothat market for this particular market timing method. Conversely, when price activity becomesinactive and less volatile, you would increase your investment exposure, hopefully, awaiting abreakout and increased volatility. Consequently, margin requirements serve as a barometer forfund allocation.To clarify this process, the market itself is the best source for dictating market exposure. Thismeasure can easily be determined through simple calculations. The various futures exchangesevaluate the volatility and volume of markets continuously. If for any reason, they believe thatthe potential exists for wide daily swings in the market and, concurrently, the risk of erosion ofa trader's margin, then, typically, they will be inclined to raise margin requirements. Therefore,whenever margin requirements are raised, market exposure as measured by the number ofcontracts traded should be adjusted accordingly. In other words, say you assume a portfoliosize of $1 million, the use of three trading systems, and the limitation of trading only 10markets in each. The maximum exposure can be no greater than $300,000 dollars, since thatamount accounts for 30 percent of $1 million, the maximum account size defined above. It isunrealistic to assume that positions will exist in each and every market at any one period oftime, however. In any case, this allocates $100,000 to each of three markets. In turn, thiswould imply that for each method, each market would represent $10,000 dollars. Now supposethe margin requirement in one market is $ 1,000. Then 10 contracts could be traded at any onetime. If volatility increases, the exchange may decide to raise margin requirements by anadditional $1,000 to $2,000, thereby forcing you to reduce your position size to five contracts (5x 2,000 = $10,000 and 10 x $1,000 = $10,000). What has effectively occurred is a portfoliocontract-size adjustment of 50 percent due to a 100 percent increase in margin requirements. Ifthe volatility has increased sufficiently that the exchange is compelled to raise marginrequirements, and you are still positioned in the market and have not been stopped out of thetrade, then it is likely that the market has moved in your favor. In that case, the moneymanagement discipline and methodology described here requires closing out profitablepositions, and prudent trading would also dictate profit taking. The initial exposure was afunction of margin requirements, and the change was made as a result of market volatility andpotential risk as defined by the increase in margin requirements.Once in a trade, stop losses must be introduced. Generally, you should apply a standard stoploss and not risk any more than 1 percent of your portfolio on any one trade. Should you desireto increase this stop loss, you should reduce accordingly the size of the position or exposure youhave in that market and at that method at that particular time.For example, you should always maintain a 1 percent risk level, but if you wanted to increasethe dollar stop loss to double that amount, you should reduce your market exposure by 50percent. All other increases in stops would be adjusted accordingly as well.As the portfolio size in one method and in one market increases, you should adjust your stoploss and profit-taking levels and make certain that your exposure does not constitute an undueweighting in the portfolio. In fact, as the profit in a position increases, you should reduce theposition size to maintain a maximum portfolio exposure and, ideally, in effect you will beinvesting only the profits generated in the trade.The approach described here is simplistic but effective. High-tech mathematical modeling andsophisticated statistical techniques can be introduced, but experience indicates that minimalimprovements will be produced.Although this approach to money management is devoted to high-margin futures, a similarapproach can be easily applied to stock portfolios.In conclusion, it is critical that a trader design and implement a methodology that is capable ofbeing measured for performance statistics historically. Once confident of the results andcomfortable with the implementation, a trader should paper-trade the method and then apply itreal time to the markets with funds in small lots or shares. As you gain experience andconfidence with the method, the position size can increase. Discipline is a prerequisite. If you

conform to the general money management guidelines discussed in this chapter and then addimprovements to the schedule to fill in any blanks in procedure, a difficult and criticalcomponent of trading success will have been addressed and satisfied.
The Kelly formula
A simple case of the Kelly formula is where you either double your wager (i.e. you get back yourbet plus an equal amount) with probability p or else lose it all with probability q = 1-p . TheKelly system says that in this case the optimum fraction of your capital to risk is f=p-q.For example, if you have a system in which you double your money with a 60% probability andlose it all with a 40% probability then your optimal fraction to bet isf = p - q = 60% - 40% = 20%.The mathematical reason that its true is actually quite simple.In the double or nothing case above, the log of your return per bet after W wins and L lossesusing this system is:(W/N) log(1+f) + (L/N) log(1-f) where N=W+L.If N is large then W/N=p and L/N=q. Maximizing this expression in f using calculus gives f=p-q,as expected.
Thus, if the assumptions are satisfied, your portfolio will grow at the highest rate if you investthe optimal f each time. One problem with the Kelly criterion is that it implies a larger maximumdrawdown than most people would be comfortable with. Most people would likely want tochoose a fraction to bet which is less than the Kelly fraction even at the expense of optimality.Another problem is that you often don't know what p is.For purposes of illustration, I have used the same simple double or nothing setup that Kelly usesin his original article but the entire idea generalizes substantially beyond this.Since you probably don't know what p and q are you could just pick an X% and Y% that aresufficiently small. For example, you could choose X% as 3% or 5%, say. A number of practicallyoriented books and articles recommend that sort of approach.William Gallacher's book, Winner Take All, is another source which mentions and critiquesOptimal f in the context of futures trading.
Louis [email protected]
Tips & Hints:
Should you desire to increase this stop loss (1% of cap.), you should reduce accordingly the sizeof the position or exposure you have in that market and at that method at that particular time. ðadjust stop loss and profit-taking levelsAs the profit in a position increases, you should reduce the position size to maintain a maximumportfolio exposure and, ideally, in effect you will be investing only the profits generated in thetrade (!).
Random Entry Strategy:
The initial strategy demands that with any trade on, right or wrong, the stop and exit systemwould either leave you in the good trades or get you out of the bad trades at a small loss andunder certain circumstances get you on the other side. The random initial entry perspectiveforces you to develop a very disciplined trading strategy and trading rules to go along with it.More importantly, it gets you away from looking for all the answers in the various entry systemswhich were being promoted.The stop and exit rules for the system were developed with an extreme perversion to optimizedvalues and being very careful to watch the degree of freedom which I allowed the system tohave. Once you have a set of profitable stop and exit rules, you can concentrate on developingan entry system that was more intuitive than the random 'flip of the coin' method. This step in

the development of a system, by definition, became much less important.
The importance of discipline in your trading regime can not be overstated, especially on exits.This discipline was a welcomed (and badly needed) side effect of developing a trading systemwith this methodology.
Trailing or multiple contracts:
Enter all contracts on the entry and exit half (or a portion) at the primary exit signal, stop ismoved to breakeven on the remainder and we trail the remainder until the secondary target orwe get stopped out. Each trade has an associated stop plus a primary and secondary exit ð atthe time of entry, all possible exits signals are known and quantified
I use threshold levels to increase my trading size. My formula is:2x max historical drawdown + margin = equity needed to trade 1 S&P contract.So a 50% drawdown to me means a real 25% drop in equity. By drawdown I'm talking about my total net running drawdown. I always use stops on myindividual trades which keeps my max. daily net loss around 3% to 5% depending how manysystems trade that day (I use 3 systems). The recent volatility in the S&P's has forced me toalmost double my stops over the last 6 months which has made the drawdowns deeper.
Turtle System trading signal:
1. Enter a long/short when a tradable (!) exceeds its 20 day highest/lowest close.2. Exit a long/short when a tradable (!) reverses to inside its 10 day highest/lowest close.(wenn letzter "theoretischer Trade" ein Verlust war, nur eine Position eingehen [theoretischerTrade: wenn weitere Kriterien' nicht erfüllt?])The second part on money management describes when to increase or decrease the number ofcontracts traded.The hint I can give is "volatility". Focus on the volatility of each individual market. Then think ofin terms of "units". Derive your starting capital into measureable "units" based on volatility.
The Turtles managed the absolute risk this way:
1. Take the average of the True Range over 10 days2. If this is rising, trade with FEWER contracts. This allows the stop (=risk) to bewider and so you risk a constant amount of money but with fewer contracts3. If average TR is lower, then start trading more contracts
Trailing Stop:
Let's say you buy an S&P at 900 and it rises to 902. If the S&P stays above 902 for a week andthen falls below 900, say to 898.40 then you get stopped out at that point, 898.40, assuming noslippage. A Trailing $400.00 trailing stop would get you out at 900.40 assuming that the S&Pdid not get any higher than 902.
Risk-Reward-Ratio:
10% risk per trade: you may think, that if you have 100000 you could risk/invest no more than10000 in one stock (e.g. 50 stocks á 200). But consider buying a stock priced at 200 with a 2$stop loss: risking 10% means, one could buy 5000 stocks ! So risk must be thought of as thepercent of equity you are willing to lose on a trade if you are wrong. Risking more than 3% isextremly risky, especially if you have 10-15 positions on at one time.
Limit Orders:A big advantage to limit orders is maintaining a predetermined Risk-Reward-Ratio for a specific

trade. In other words, if you enter a trade with a stop-loss and a target price and you like tomaintain a certain ratio, say 3 to 1, then you must pass if you can't enter the trade within theRisk-Reward parameters. For this reason, I like to use stop with limit orders.
Adaptive Moving Average & "Efficiency Ratio":An exponential moving average in which the smoothing factor varies with the "Efficiency Ratio".Efficiency ratio is the ratio of total price excursion divided by the sum of all individualexcursions of each bar. It equals 1 if all moves are in one direction over the lookback period.
Buy & Hold:Take your system and gauge it against a Jan through Dec against simply buying and holding.This will let you know how much was really your system and how much was just the market.
100000 Account + Stop-Loss: $1500 13 Marketsa) simultaneously active in all markets and stopped out in all markets:19500 Loss ð 19,5% Drawdownb) 13 consecutive losses:19500 Loss ð 19,5% Drawdownc) simultaneously active in all markets and stopped out in allmarkets + 5 consecutive losses:97500 Loss ð 97,5% Drawdown (!!!)d) 5 consecutive losses in all 13 markets (65 consecutive losses):97500 Loss ð 97,5% Drawdown (!!!)ð check 50% Drawdown (shutdown point) !!!
5 Systems: sum all positions up to arrive at the final trade:get a net position of 3 contracts long (5 long - 2 short)
Bring the two files into Excel, and add the NetProfit columns together to get the combinedequity curve.weight the equities: for example, if I have equities for BP, DM, JY and SF I may create an equitycurve of 2*BP + 1*DM + 1*JY * 1*SF where the coefficients 2,1,1,1 are inputs
15% in margin: 2-5% DM, 2-4% DAX, 2-4% Gold, 1-2% Euro-$ð so increase number of contracts within these limits
accept a 50% reduction in Return if it comes together with a 30% reduction in Drawdown
Portfolio-Stop: -7-8% monthly: Stop !Return p.a.: = 3 * DrawdownDrawdown + Regression-Analysis:45° + deleverage at a parallel line ABOVE the 45° line (to let room for further losses)
Drawdown 40%Recovery 100%Net Return 20,0% =(1-40%)*(1+100%)-1when using a proportional Trading System, the ratio of recovery should be a constant:X 2,50(1-Drawdown)*(1+2X)-1 = 0D = (X-1) / (2*X)30,0% optimal Drawdown ð trade 1/4 less (from 40% to 30%)22,5% new Net Return
Third Of A Series On The Successful Use of Money Manage-ment To Improve Your TradingResults - Tom D'Angelo

http://www.commoditytraders.com/issue/tom.html
This is the third in a series of articles which describe how to construct a professional anddisciplined money management plan, designed to allow the trade to manage his trading in thesame manner as a successful business. Refer back to my previous articles in Vol 4-1 and Vol 3 8for a detailed discussion of the Profit Center methodology and calculation of the required moneymanagement statistics.
In this article I will discuss the Performance Report. The Performance report is a summary of allthe significant money management statistics for each individual Profit Center. Each ProfitCenter is a business and the Performance Report is a management report which reveals yoursuccess or failure in managing that business.
The Trading Plan is the trader's strategy for the next trade based on the information provided bythe Performance Report. The Trade Journal is an "after the fact" critique of the Trading Planafter the trade is closed out with a profit or loss. I will discuss the Trading Plan and TradeJournal in my next article.
There appears to be lots of interest in the Real Success trading methodology. I have notpurchased this course but I will try to describe a sample Performance Report for Real Successmethodology traders.
First, if I was trading the Real Success method, I would set up the following Profit Centers:
RS(M)- All trades taken from the Real Success Methodology
RSDAY - All Real Success day trades. Overnight Real Success trades can be entered into aCenter named RSONITE
RSSP500 - Real Success trades segregated by the future traded (RSSWISS, RSBEANS etc)
RS3MIN - All Real Success trades taken off of 3-minute bars RS5MIN - All Real Success tradestaken off of 5-minute bars
RS3MINSP500 - All SP500 trades taken off of 3-minute bars (RS3MINSWISS for all RealSuccess trades taken off of 3-minute bars for Swiss Franc, etc)
Substitute 5MIN for 3MIN to segregate trades taken off of 5-minute bars. Example,RS5MINSP50O for all SP500 trades taken off of 5-minute bars.
Helpful hint - If you are planning to paper trade the Real Success methodology first, simply adda P to the end of all the Profit Center names. The P signifies a paper trading Profit Center. Forexample, paper trading the Real Success method with 5-minute SP500 bars, you would enterthe trades into a Center named RS5MINSP500P. After you have about 20 paper trades in eachCenter, calculate the statistics I described in Vol 4-1 of CTCN and you will have excellentinformation as to your performance paper trading the Real Success methodology for each ProfitCenter.
Results of the paper trades can then be compared with real time results by using thePerformance Report.
When you begin real-time trading, create The Profit Centers I have described above (withoutthe P at the end of the name) and enter the real-time trades into those Centers.
After 20 real-time trades have been entered into a Profit Center, you will have a good data baseof trading information and can complete your first Performance Report.
The following is a brief description of the items contained in the Performance Report.

Profit Center Name - Name of Profit Center analyzed.
Example, RS5MINSP500 for all trades taken from Real Success methodology trading 5 minuteSP5OO bars.
Profit Center Type and Goals - Description of the Profit Center and the financial goals the traderis attempting to achieve.For Example, Profit Center RS5MINSP500 will contain only SP500 trades taken from the RealSuccess methodology based on 5-minute bar charts.
After 100 paper trades, the trader has achieved 60 profitable trades (6O%) and 40 unprofitabletrades (40%). Average Profitable trade was $600, average unprofitable trade was $400 for aratio of 1.50. The Profit Factor was calculated to be 1.23. Net profits after 100 hypotheticalpaper trades are $2000.
Worst drawdown was $1800. Best series of winners was 6 with $1600 in profits. Worst series oflosers was 4 with $1550 in losses. The trader will try not to lose more than 3% of capital on anyone trade. These statistics of hypothetical paper trades can then be used as goals to be achievedwith real-time trades.
The remainder of the Performance Report lists statistics from real-time trading.
Initial Capital - $30,000. This serves as the funding requirement for the business to covermargin requirements and trading losses.
Drawdown - Current drawdown in progress = $1050. Largest actual real-time drawdown =$2300
Series - Worst series of consecutive losers = 4 with a loss of $1300 in the series of 4 trades.Best series of winners = 6 with a profit of $1700 in the series of 6 trades.
Current series in effect - 2 consecutive profitable trades with a profit of $600 in the series of 2trades.
Largest profitable trade - $ 950 on 3/11/96
Largest unprofitable trade - $1020 on 2/ 5/96
Optimum number of contracts to trade = 3, based on Ralph Vince's formula.
Trading efficiency - 57% winners and 43% losers.
Average profitable trade = $500. Average unprofitable trade = $300. Ratio of profitable tounprofitable = 1.67.
Range of losing trade as % of capital = 2.1% to 4.3%
Profitability - Profit Factor = 1.14. Profit Center is profitable with profitability trending upwards.I use graphs to determine the trend of profitability with the Pro-Graphics module of myMANAGER money management software. I will describe in my next article how I use the trendof profitability to determine how many contracts to trade.
Current net profit after 60 real-time trades $1100. Current Capital = $31,100 which equals$30,000 Initial Capital plus $1100 net profit.
Thus, the trader has established a business named RS5MINSP500 which is producing revenues(profitable trades) and expenses (losing trades + commissions). The Performance Reportinforms him of his trading performance in the RS5MINSP500 business as well as enabling himto compare actual real-time results with goals derived from hypothetical paper trades.

The Performance Report takes the trader out of the dark and into the light. He knows exactly histrading performance for each of his businesses and can instantly explain to anyone hisprofitability and efficiency as a speculator.
Most traders experience psychological problems due to the fact that they attempt to manage abusiness (i.e. trade) without any type of organizational structure which can provide them withthe information necessary to execute disciplined, informed and educated trading decisions.
Nearly all traders manage their trading using monthly broker's statements which provide a"macro" view of their trading.These statements only inform you as to your overall profit or loss for all your trading. This typeof data is totally inadequate for the professional trader who requires more detailed informationsuch as provided by the Profit Center methodology.
Hopefully, the reader has begun to see why many aspiring traders experience the samepsychological problems....fear, greed, anxiety, inability to "pull the trigger" etc. The averagetrader operates in a fog. He has no money management methodology to provide the structurefor successfully managing his trading business. Since he operates in the dark, he inevitablybecomes uncertain and anxious. Continually floundering around in the dark makes the situationworse and worse, like a snowball rolling downhill.
You cannot successfully manage any type of business without first organizing your tradingperformance into a meaningful structure which reveals trading strengths which can beexploited and weak areas which must be eliminated or reduced.
The Performance Report provides the basis for formulating the Trading Plan. The Trading Plan isthe strategy for the next trade based on the trader's trading performance as revealed by thePerformance Report. I will also explain how the Performance Report is used to formulate theTrading Plan as regards to how many contracts to trade.
After the Trading Plan has been executed and the trade closed out with a profit or loss, thetrader completes the Trade Journal. The Trade Journal is the "after the fact" critique of theTrading Plan. These three reports are specifically designed to eliminate the psychologicalproblems which plague most traders and create an environment conducive to executing rapid,informed and educated trading decisions.
The Trading Plan and Trade Journal will be described in my next article as well as how this typeof methodology promotes psychological stability and significantly reduces stress.
I will also describe how to file all the reports so that the trader will now be operating in aprofessional, disciplined and informed trading environment . . . similar to a successful businessand structured to engender confident trading decisions.This type of environment is specifically designed to advance the trader up the learning curves ofthe three disciplines necessary to achieve successful long-term successful speculation: Tradingmethodology; psychological discipline and; money management.
For a free booklet describing the reports I use and information on a newly completed book Iwrote on money management, feel free to contact me at 800-MONEY30.
System Testing ObservationAdam White
Here is an interesting observation I made while system testing.
Say you run a system test over 10,000 bars of data, then print out a chart of the system's equityline. Then repeat the test, but start 100 bars later. Let's say two trades were included in those100 bars, so they've been dropped. Now print the second equity line and compare it to the first.You'd get exactly the same equity line, but 100 bars shorter. Right?

- Wrong!
When I do this I get a radically different equity line on the second test, i.e., they are not nearmirror images of each other. My hunch is that a form of the chaotician's "butterfly-effect" hasarisen: changing any given trade's market position (long, short, flat) will effect in a chainreaction all the subsequent trades in complex and unexpected ways. Here dropping the first twotrades could very well change the system's market position when the third trade is calculated,and so on.
I believe this observation has profound and unfortunate implications for the robustness ofsystem testing. It's a second and more subtle problem that lies behind the mere curvefitting/optimization problem.
If dropping a couple of early trades will always effect later trades, then there's no truly"neutral" starting point with any test data. Where your test data starts determines the final testresults just as much as your system does.
Editor's Note: Not too many CTCN members are aware of this but I have known about this forsome time. The success or failure of many different mechanical systems is predicated to asurprising and varying degree on the sequence of events just prior to the first actual tradegenerated by the system.
The trade setup and timing of the first trade can have a profound effect on the subsequenttrading results. The circumstances and timing of entry into the first trade can sometimes make ahuge difference in the overall trading performance.
Max Robinson Has A Unique Way To Use Closing Price To Mimic A Moving Average
Keep up the good work. Anyone that is trying to do something good will be criticized or dislikedby someone. But remember, you are helping many, while only a few are unhappy.
I have the System 2000. It does help identify turning points and congestion areas in the market.But then one needs an entry method.
The secret of all financial success is money management. How much can you risk on this trade,and still be financially able to take some losses and still be able to trade when the profitabletrade finally comes by. Study Vol 4-1 of CTCN, articles are really enlightening (D'Angelo & ??).Can't read name?
I have two Ken Roberts courses. They have some good ideas in them and one of them convincedme to let go of some old anger.
Every one needs to understand that the constitution may guarantee equality under the law, butwe are not born with the same abilities. Some of us just will never become a winning trader, butwe might become a successful painter.
Larry Williams latest video had lots of information in it.
I have a mathematical way of using the close of today's market to compute an average that issimilar to the 9-day and 40-day average.
My method is much easier and quicker to compute than most averages, since you only deal withtoday's close. This method picks turning points and acceleration points like any system that Ihave seen. But like all of the other systems, one has to apply his own entry and moneymanagement plan to it.
The big problem I believe we all have is fear and greed. Most of us are so greedy that we can'tstand to be wrong 5 or 6 times out of every 10 trades. So we keep searching for the Holy Grail.In order to get over the fear of losing, one has to find a system and run it on old data until you

realize that it may work okay!Call anytime 308-775-3140.
All about StopsDonald Turnbull
Here are some thoughts that might prove useful to neophyte traders like me. They mayduplicate many that you have already published, but I have not had the pleasure of reading.
I do not trade the S&P index because the margin requirements are so high it would take too biga proportion of my account to cover them. I would then have one position with, perhaps a 50%chance of success (and a 50% chance of failure).
Editor's Note: The S&P 500 margin is indeed very high for overnight position trades. The lasttime I checked it was $12,500 at my brokerage firm. This is one of the main reasons the S&P isnot recommended for overnight trades.However, like most brokers, my broker reduces the margin sharply for daytraders, where it'sonly $3,500.
In fact, I have heard it said by some of our members that certain brokers do not require anymargin providing no trades are carried overnight. I am not sure if that's correct information andhave not verified it to be correct, but have heard it said many times.
For similar reasons, I do not trade Japanese Yen, where one full point is worth $1,250. Thedifference between the high and low in one day can be $6,000. This is too rich for my tradingstyle.Instead I trade low margin trades like pork bellies, live meats and beans, and have a number oftrades going at one time.
Just suppose I have 5 trades going, each with a 50% chance of success (and a 50% chance offailure). The statistical probability of all five failing is .5 x.5 x .5 x .5 x .5 which in .03125 or only3%.
Editor's Note: Are Don's figures correct? Is it true that five trades involving 50% odds results inonly a 3% chance of having five straight losers? If so, why does your editor frequently hearabout certain systems or trading advisors having far more than five consecutive losers. Many ofthose systems are in fact ranked much better than a 50% success ratio by either the developeror Futures Truth Ltd.
In fact, I have heard of some systems or trading advisors that claim perhaps a 60 or 70% (oreven better) success rate yet sometimes will have say ten, or even 20 (or more) straight losingtrades. How is this possible, if Don's failure possibility is only 3%, or even less than 3% basedon profitable trade percentages considerably higher than 50%?
I recall some years ago I read in one of the major trading publications(I believe it was BarronsNewspaper) that Jake Bernstein had (if I remember correctly), 23 straight losing trades. I knowJake and he is perhaps the most respected and most knowledgeable commodity expert there is.Jake has also written 23 books on trading commodities and is incredibly knowledgeable ontrading. Jake is also a psychiatrist (or a psychologist . . . I always get the two confused) and nodoubt has great discipline and trading skill. I am sure Jake will normally have at least 50%winning trades. So how is it possible someone like Jake could have over 20 consecutive losers? Iam not picking on Jake as many other famous traders and experts have also had 20 or morestraight losing trades over the years.
What is the chance of this happening, if in fact the profitable trade percentage is 50%, or evenhigher? If the chance is extremely small, why has your editor heard about this happeningnumerous times over the years, involving a vast number of popular systems, methods, and wellknown trading advisors or respected advisory services?

The probability of at least one or more successes is 1-(.5x.5x.5x.5) which is 93.755% . That's alot better than the 50% mentioned above.
With tight stops, the losses are limited to an average of $300. With 4 losses, this amounts to$1,200. Profits are allowed to run and usually average $2,000. This results in small but virtuallycertain profits.
In actual practice, by limiting my trades to the recommendations of an advisory service, likeSteve Myers on Futures (Summerfield, FL, 1 800-835-0096), probability of success is muchhigher.
I have heard it is bad practice to order a position "at the market." Before placing an order, Iphone my broker's quoteline and get the high, low and last figures. Then I place a limit order atthe "last" figure. Is there a better way of doing it?
Editor's Note: I do not necessarily agree it's a "bad practice" to trade with market orders. Infact, our Real Success Methodology uses market orders more frequently than limit orders,especially when entering into a new position. We also use market orders extensively on exitsinvolving targets and stops.
Market orders have several major advantages over limit orders. One major advantage is youoccasionally have difficulty verifying you are actually in a trade or out of a trade due touncertainty involving a limit order being filled. On the contrary, with a market order you alwaysknow you are filled and in the trade or out of the trade. Another advantage is a market orderwill normally have less slippage than a limit order. In fact, as witnessed in CTC's Real SuccessVideos, sometimes we actually have positive slippage with market orders, rather than the usualnegative slippage involving limit orders.
When profits accumulate and my account grows above my target figure, I have my broker sendme a check for the difference. That way, I am not tempted to get into larger and larger trades.This may not be the way to become a millionaire, but it suits my risk tolerance level.
Moore Research Center publishes a list of "optimum" stop values, beyond which a commodityrarely recovers, and within which it often recovers. Their "optimum" stops seem to me to be toohigh. They are all in the range of $1,200 to $1,500.To go along with my philosophy of having a number of trades going at a time, I think that tightstops are appropriate. This may stop you out of some trades that eventually recover and make ahuge profit. But even in these cases, if you have confidence that the market will eventually rise,and you watch the market closely, you can get back in again and lose only one round-turncommission. However, if the commodity doesn't recover, you've saved yourself a lot of money.
Money Management, Optimal f
BALANCING ACT By Mike DeAmicis-Roberts
Comparing optimal f and probability of ruin can give you better insight into the risk-rewardparameters of your trading.
As many traders know, success depends as much on money management strategy as it does ona particular trading system. Optimal f and probability of ruin (POR) are two key moneymanagement concepts that help you determine how to best allocate capital for maximumgrowth and minimal risk to your account.
In some cases, however, these formulas conflict. We will overview the meaning and applicationof optimal f and POR and discuss a method (and offer some free Windows software) forevaluating systems by comparing these two formulas.
See Futures' downloads page for a copy of this software and "Profiling Optimal f And POR" for

directions on using it.
Optimal growth Optimal f, popularized by Ralph Vince in his book Portfolio ManagementFormulas (Wiley 1989), is the ideal percentage of capital to allocate for any particular trade -the amount of equity that will result in the greatest gain to the account (see "Without moneymanagement, you don't have a system," Futures, Building a Trading System special issue,October 1994). This amount, which determines how many contracts you can trade, is based onthe profit and loss profile of a trading system, rather than a percent of account equity.
Optimal f allows the trader to maximize the profitability of a system. If you trade with a higheror lower percentage of equity, you run the risk of not capitalizing enough on your winningtrades or getting hit too hard on your losing trades.
The POR is the likelihood your system will reach a point of success or failure, that is, the chancethat you will blow out your account before hitting your financial goal. Ruin is defined as theaccount level at which a trader stops trading. The POR is calculated using the percentage win,the average win, the average loss, the account size, the account size at ruin and the accountsize at success.
Because the probability of ruin increases with the amount risked, it's important to limit theamount of capital you commit to each trade. By trading smaller portions of the account equity,there is a greater chance a well-tested system will perform closer to its historical results.Traders who risk a larger percentage of account equity are more susceptible to variation fromthe expected results because of the small trade sample size.
Unfortunately, finding the optimal f and POR for a system is a computationally intensiveprocess, (although the math involved is not difficult). As a result, few traders know the optimal for POR for their systems. In most cases, this leads to diminished returns and increased risk.
Optimal f and POR calculations do not always suggest the same risk parameters. By comparingoptimal f and POR, you can determine if the amount of capital risked at the optimal f valueresults in an unacceptably high POR. On the other hand, a trader may wish to increase the PORfor the chance of exponentially higher returns. Ultimately this is a decision every trader mustmake. The optimal f amount suggests how much to risk; the POR value gives you an idea of therelative risk associated with trading this amount.
Application When evaluating a system for the optimal f, you find that the total returns lie on acurve, with the optimal f value at the apex. Moving the same amount to the left or right of theapex curbs the potential returns of a system by approximately the same amount. For example, ifthe optimal f for a system is 25%, then a trader can expect about the same amount of returnswhile trading at either 20% or 30% of the account.
The same cannot be said about the POR. In short, the more a trader risks, the greater the POR:It always will be higher when trading more than the optimal f and lower when trading less.Generally, if you don't want to trade at the optimal f value, it's wise to trade at a lower value todecrease your risk of ruin.
In some instances, it might not even be possible to trade a system at optimal f. For example, atrader with a $15,000 account and an optimal f of 5% can only risk $750 on any trade. This maynot be an adequate amount in markets like the bonds and S&Ps.
Another problem is when the optimal f amount does not translate evenly into whole contracts.Using the example above, the trader should risk only $750 on each signal. If a single contractposition implies a $500 risk to the account, the trader must decide if it is better to trade one ortwo contracts, which in turn influences the POR for the account.
There are no strict rules - "you should always trade y percent of optimal f" or "x is an acceptablePOR." Optimal f and POR analysis does not give a trader any specific guidelines on how to trade.Rather, it shows the risk and reward associated with using a certain money managementstrategy for a trading system. You can then use this information to better evaluate the prudence

of your trading approach.
Mike DeAmicis-Roberts is a researcher-programmer specializing in risk management and neuralnetwork technology with Comet Management in Hollister, Calif.His internet address is: [email protected]
MONEY MANAGEMENT INTRODUCTIONhttp://www.bhld.com/brochure/money.html
Money management is a part of an over-all investment system. Most people never have a formalmoney management strategy, yet every investment must address the two basic moneymanagement questions "What should I invest in?" and "How much should I invest?"
Your over-all investment system includes your money management strategy and several tradingand investment models. You may have a number of investment models which you have neverformalized, such as accumulation of savings, purchase of long term bonds and so forth.
The money management information you develop with Behold! cannot utilize information aboutthose parts of your investment system which are not formalized within Behold! yet those otherparts will affect the degree of risk which your are willing to accept for the trading andinvestment models you develop with Behold!
The money management features in Behold! address two main questions:
(A) What is the best way to allocate my money among my formalized tradingmodels and potential markets?
(B) With the capital on hand how many contracts (shares) should I buy?
This second question is particularly important to commodity traders as the leverage available tothem allows carrying more contracts than is wise.
The question concerning capital allocation is vital to any trader who has sufficient capital toallow trading more than one stock or commodity.
Definition of Terms:The Performance Summary for a single file or for a set of files for a single commodity (a roll-over report) shows two pieces of information at the bottom of the "All Trades" section, OptimalCapital and TWR.
Optimal Capital can be defined as: The amount of capital which you "should" have used to backup each commodity position, in order to achieve the highest rate of gain.
TWR is an acronym for terminal wealth relative. It is the ratio of final capital to initial capitalwhich you would have achieved had you backed each position with the optimal capital.
Both of the above definitions assume that all profits/losses are to be plowed back into trading,and that you have the ability to carry fractional positions. Note that TWR in Behold! is anannualized number to allow comparisons between tests of different lengths.
"q" If you test a portfolio (with more than one stock or commodity) and check the box CalcOptimum Allocation then you will get two other types of data. One is simply labeled as "q" andthe other is a list of numbers showing the optimal fraction of capital which should have beenallocated to each security. Use of the capital allocation numbers and "q" will allow a commoditytrader to obtain a Geometric Optimal Portfolio: that portfolio of the commodities tested whichwill give the highest growth rate.

For a better description of the terms and an in depth understanding of their derivation youshould read the book Portfolio Management Formulas by Ralph Vince. For those with amathematical bent it would be good to read his second book The Mathematics of MoneyManagement.
Optimal Capital, TWR, the optimal capital allocation in a portfolio and the "q" value are allcomputed using data taken for trading with a fixed number of positions. They are not effectedby the manner in which you vary the number of positions you are trading.
Trade Testing Options in Behold!
There are many ways to do portfolio performance testing, and in order to allow you to get whatyou want (which is not necessarily what we expect) the money management features in Behold!have been placed under your direct command. Thus we do not determine exactly what is"optimum" and then force you to live with it.
The Test Options dialog is use to set many testing options, of which the following are of interestnow.
#Positions:Single. This selection will require Behold! to always open a single position. This is the way thatyou should do your initial system development.
by Rules This selection allows you to write rules which control the number of positions opened.Your rules can access trade information such as the amount won or lost on the previous trade,current working capital and Worksheet data such as RSI, ADX and so forth.
Auto Behold! will calculate the number of positions to open as current working capital dividedby the capital per position ($Posn) which is set in the same dialog. The initial working capital isset in this dialog in the Capital, Single file test item.
The next items determine how your working capital is changed by your trading results.
None Means no reallocation. All of your wins accrue to your working capital, and all losses aresubtracted from working capital.
Percentage A certain percentage of each win will be taken away, to simulate re-capitalizinglosses in other markets. A certain percentage of each loss will be replaced, to simulate re-capitalization using profits from other markets.
Dynamic This choice is only applicable to tests on portfolios.
The last item of interest is Monthly Withdrawal. This item allows you to determine howwithdrawing a portion of your working capital, to cover expenses and so forth, will effecttrading results.
Optimal Capital
The information in this section is mainly of interest to commodity traders, however stocktraders should always assure themselves that the Optimal Capital value shown in the mainTrade Test report is well above the cost of the stocks they are trading.
Portfolio Capital Allocation
Proper diversification of your investment capital would recognize all of your investments andallocate capital among them in order to obtain the maximum rate of return with the minimumrelative risk. Capital Allocation in Behold! can only determine the best way to allocate yourcapital among the trading models and securities which you have formalized with Behold!

IF you run a Portfolio trade test and check the Calc Optimum Allocation box you will get threenew items at the top of the full portfolio report. These are "Q" and the optimal % Capitalallocation as determined for the securities tested in your portfolio. See Vince's book for adiscussion of "Q."
As an example of the allocation information, see the example below.
Financial.PTF Initial Capital = 100000 "Q"(E/V) = 2.29IMMEUD Actual %Capital = 100.00 Optimal % 62.55TBOND Actual %Capital = 100.00 Optimal % 37.45

Money Management 9
A small Quizlet: (T: Theory, Q: Question, A: Answer, E: Explanation)
T: It is better to trade 2 different assets at the time than to trade 2 different trading systemssimultaneously.
Q: True or False?
Click here to see the answer (after thinking, not guessing...)
Money Management
Dr. Van K. Tharp on Money Management & Position Sizing
DrawdownsManage Other's MoneyDefinitionModels
An Excerpt from Dr. Tharp's Report on Money Management.
John was a little shell-shocked over what had happened in the market over the last three days.He'd lost 70% of his account value. He was shaken, but still convinced that he could make themoney back! After all, he had been up almost 200% before the market withered him down. Hestill had $4,500 left in his account. What advice would you give John?
Perhaps your answer is, "I don't know. I don't have enough information to know what John isdoing." But you do have enough information. You know he only has $4,500 in his account andyou know the kind of fluctuations his account has been going through. As a result, youhaveenough information to understand his money management -- the most important part of histrading. And your advice should be, "Get out of the market immediately. You don't have enoughmoney to trade." However, the average person is usually trying to make a big killing in themarket, thinking that he or she can turn a $5,000 to $10,000 account into a million dollars inless than a year. While this sort of feat is possible, the chances of ruin for anyone who attemptsit is almost 100%.
Ralph Vince did an experiment with forty Ph.D.s. He ruled out doctorates with a background instatistics or trading. All others were qualified. The forty doctorates were given a computer gameto trade. They started with $1,000 and were given 100 trials in a game in which they would win60% of the time. When they won, they won the amount of money they risked in that trial. Whenthey lost, they lost the amount of money they risked for that trial.
Guess how many of the Ph.Ds had made money at the end of 100 trials? When the results weretabulated, only two of them made money. The other 38 lost money. Imagine that! 95% of themlost money playing a game in which the odds of winning were better than any game in LasVegas. Why? The reason they lost was their adoption of the gambler's fallacy and the resultingpoor money management.

Let's say you started the game risking $1000. In fact, you do that three times in a row and youlose all three times -- a distinct possibility in this game. Now you are down to $7,000 and youthink, "I've had three losses in a row, so I'm really due to win now." That's the gambler's fallacybecause your chances of winning are still just 60%. Anyway, you decide to bet $3,000 becauseyou are so sure you will win. However, you again lose and now you only have $4,000. Yourchances of making money in the game are slim now, because you must make 150%just tobreak even. Although the chances of four consecutive losses are slim -- .0256 -- it still is quitelikely to occur in a 100 trial game.
Here's another way they could have gone broke. Let's say they started out betting $2,500. Theyhave three losses in a row and are now down to $2,500. They now must make 300% just to getback to even and they probably won't do that before they go broke.
In either case, the failure to profit in this easy game occurred because the person risked toomuch money. The excessive risk occurred for psychological reasons -- greed, the judgmentalheuristic of not understanding the odds, or in some cases, the desire to fail. However,mathematically their losses occurred because they were risking too much money.
What typically happens is that the average person comes into most speculative markets withtoo little money. An account under $50,000 is small, but the average account is only $5,000 to$10,000. As a result, these people are practicing poor money management just because theiraccount is too small. Their mathematical odds of failure are very high just because they open anaccount that is too small.
Hundreds of thousands of hopefuls open up their speculative accounts yearly, only to be lead tothe slaughter by others who are happy to take their money. Many brokers know these peopledon't have a chance, but they are happy to take their money in the form of fees andcommissions. In addition, it takes many $5,000 accounts to feed a single multi-million dollaraccount that consistently gets a healthy rate of return.
Look at the table below. Notice how much your account has to recover from various sizeddrawdowns in order to get back to even. For example, losses as large as 20% don't require thatmuch larger of a corresponding gain to get back to even. But a 40% drawdown requires a66.7% gain to breakeven
Drawdown Gain to Recover5 Percent 5.3% Gain10 Percent 11.1% Gain15 Percent 17.6% Gain20 Percent 25% Gain25 Percent 33% Gain30 Percent 42.9% Gain40 Percent 66.7% Gain50 Percent 100% Gain60 Percent 150% Gain75 Percent 300% Gain90 Percent 900% Gain
and a 50% drawdown requires a 100% gain. Losses beyond 50% require huge, improbablegains in order to get back to even. As a result, when you risk too much and lose, your chances ofa full recovery are very slim.
Managing Other People's Money
In the futures industry, when an account goes down in value, it's called a drawdown. Supposeyou open an account for $50,000 on August15th. For a month and a half, the account goesstraight up and on September 30th, it closes at a high of $80,000 for a gain of 60%. At thispoint, you may still be in all of the same trading positions. But as a professional, your account is

"marked to the market" at the end of the month and statements go out to your clients indicatingwhat their respective accounts are worth.
Now, lets say that your positions start to go down in value around the 6th of October.Eventually, you close them out around the 14th of October and your account is now worth about$60,000. And let's say, for the sake of discussion, that your account at the end of October isworth $60,000. Essentially, you've had a peak-to-trough drawdown (peak = $80,000, trough =$60,000) of $20,000 or 25%. This may have occurred despite the fact that all of your tradeswere winners. It doesn't really matter as far as clients are concerned. They still believe that youjust lost $20,000 (or 25%) of their money.
Let's say that you now make some losing trades. Winners and losers, in fact, come and go sothat by August 30th of the following year, the account is now worth $52,000. It has never goneabove $80,000, the previous peak, so you now have a peak-to-trough drawdown of$28,000 -- or35%. As far as the industry is concerned, you have an annual rate of return of 4% (i.e., theaccount is only up by $2,000) and you are now labeled as having 35% peak-to-troughdrawdown. And the ironic thing is that most of the drawdown occurred at a time in which youdidn't have a losing trade -- you just managed to give back some of your profits. Nevertheless,you are still considered to be a terrible money manager. Money managers typically have to wearthe label of the worst peak-to-trough drawdown that they produce for their clients for the restof their lives.
Think about it from the client's viewpoint. You watched $28,000 of your money disappear. Toyou it's a real loss. You could have asked for your money on the first of October and been$28,000 richer.
Trading performance, as a result, typically is best measured by one's reward-to-risk ratio. Thereward is usually the compounded annual rate of return. In our example, it was 4% for the firstyear. The risk is considered to be the peak-to-trough drawdown which in our example was35%.Thus, this traders reward-to-risk ratio was 4/35 or 0.114 -- a terrible ratio.
Typically, you want to see ratios of 2 better in a money manager. For example, if you had put$50,000 in the account and watched it rise to$58,000 you would have an annual rate of returnof 16%. Let's say that when your account has reached $53,000, it had drawn down to$52,000and then gone straight up to $58,000. That means that your peak to trough drawdown was only0.0189 ($1,000 drawdown divided by the peak equity of $53,000). Thus the reward-to-risk ratiowould have been a very respectable 8.5. People would flock to give you money with that kind ofratio.
Let's take another viewpoint and assume that the $50,000 account is your own. How would youfeel about your performance in the two scenarios? In the first scenario you made $2,000 andgave back $28,000. In the second scenario, you made $7,000 and only gave back$1,000.
Let's say that you are not interested in 16% gains. You want 40-50% gains. In the first,scenario you had a 60% gain in a month and a half. You think you can do that several times atyear. And you're willing to take the chance of giving all or most of it back in order to do that.You wouldn't make a very good money manager, but you might be able to grow your ownaccount at the fastest possible rate of return if you could "stomach" the drawdowns.
Both winning scenarios, plus numerous losing scenario, are possible using the same tradingsystem. You could aim for the highest reward to risk ratio. You could aim for the highest return.Or you could be very wild, like the Ph.D.s in the Ralph Vince game and lose much of your moneyby risking too much on any given trade.
Interestingly enough, a research study (Brinson, Singer, and Beebower, 1991) has shown thatmoney management (called asset allocation in this case) explained 91.5% of the returns earnedby 82 large pension plans over a ten year period. The study also showed that investmentdecisions by the plan sponsors pertaining to both the selection of investments and their timing,accounted for less than 10% of the returns. The obvious conclusion is that money managementis a critical factor in trading and investment decision making. (Determinants of Portfolio

Performance II: An Update, Financial Analysts Journal, 47, May-June, 1991, p 40-49.)
You now understand the importance of money management. Let's now look at various moneymanagement models, so that you can see how money management works.
Money Management Defined
Money management is that portion of one's trading system that tells you "how many" or "howmuch?" How many units of your investment should you put on at a given time? How much riskshould you be willing to take? Aside from your personal psychological issues, this is the mostcritical concept you need to tackle as a trader or investor.
The concept is critical because the question of "how much" determines your risk and your profitpotential. In addition, you need to spread your opportunity around into a number of differentinvestments or products. Equalizing your exposure over the various trades or investments inyour portfolio gives each one an equal chance of making you money.
I was intrigued when I read Jack Schwager's Market Wizards in which he interviews some ofthe world's top traders and investors. Practically all of them talked about the importance ofmoney management. Here are a few sample quotes:
"Risk management is the most important thing to be well understood. Undertrade, undertrade,undertrade is my second piece of advice. Whatever you think your position ought to be, cut it atleast in half." -- Bruce Kovner
"Never risk more than 1% of your total equity in any one trade. By risking 1%, I am indifferentto any individual trade. Keeping your risk small and constant is absolutely critical." -- Larry Hite
"You have to minimize your losses and try to preserve capital for those very few instanceswhere you can make a lot in a very short period of time. What you can=t afford to do is throwaway your capital on suboptimal trades." -- Richard Dennis
Professional gamblers play low expectancy or even negative expectancy games. They simplyuse skill and/or knowledge to get a slight edge. These people understand very clearly thatmoney management is the key to their success. Money management for gamblers tends to fallinto two types of systems -- martingale and anti-martingale systems. And investors and tradersshould know about these models.
Martingale systems increase winnings during a losing streak. For example, suppose you wereplaying red and black at the roulette wheel. Here you are paid a dollar for every dollar you risk,but your odds of winning are less than 50% on each trial. However, with the martingale systemyou think you have a chance of making money through money management. The assumption isthat after a string of losses you will eventually win. And the assumption is true -- you will wineventually. Consequently, you start with a bet of one dollar and double the bet after every loss.When the ball falls on the color you bet, you will make a dollar from the entire sequence ofwagers.
The logic is sound. Eventually, you will win and make a dollar. But two factors work against youwhen you use a martingale system. First, long losing streaks are possible, especially since theodds are less than 50% in your favor. For example, one is likely to have a streak of 10 losses ina row in a 1,000 trials. In fact, a streak of 15 or 16 losses in a row is quite probable. By the timeyou reached ten in a row, you would be betting $2,048 in order to come out a dollar ahead. Ifyou lose on the eleventh throw, you would have lost $4,095. Your reward-to-risk ratio is now 1to 4095.
Second, the casinos place betting limits. At a table where the minimum bet was a dollar, theywould never allow you to bet much over $50 or$100. As a result, martingale betting systems,where you risk more when you lose, just do not work.

Anti-martingale systems, where you increase your risk when you win, do work. And smartgamblers know to increase their bets, within certain limits, when they are winning. And thesame is true for trading or investing. Money management systems that work call for you toincrease your risk size when you make money. That holds for gambling and for trading andinvesting.
The purpose of money management is to tell you how many units (shares or contracts) you aregoing to put on, given the size or your account. For example, a money management decisionmight be that you don't have enough money to put on any positions because the risk is too big.It allows you to determine your reward and risk characteristics by determining how many unitsyou risk on a given trade and in each trade in a portfolio. It also helps you equalize your tradeexposure in a portfolio.
Some people believe that they are "managing their money" by having a "money managementstop." Such a stop would be one in which you get out of your position when you lose apredetermined amount of money -- say $1000. However, this kind of stop does not tell you"how much" or "how many", so it really has nothing to do with money management.
Nevertheless, there are numerous money management strategies that you can use. In theremainder of this report, I'm going to present different money management strategies thatwork. Some are probably much more suited to your style of trading than others. Some workbestwith stock accounts, while others are designed for futures account. All of them are Anti-martingale strategies.
The rest of this article is continued in Dr. Tharp's special report on money management.
A Special Report on Money Management By Van K. Tharp Ph.D.
In this special report, written by Van K. Tharp, Ph.D., you'll learn dozens of different models ofmoney management-one of which could make a big difference for you. The biggest secret thatmost people neglect in their quest for big profits is proper money management. Research hasproven that about 90% of the variance in performance between portfolio managers is due tomoney management. For the average trader, it makes the difference between losing, andwinning big-depending upon your objectives. Probably the most valuable book any trader couldown.
What you will learn from this report:
How to meet your objectives using money management
The definition of money management
27 models of money management with three ways to measure equity
How to design high reward risk systems for managing money
Four techniques to produce maximum profits
Dr. Tharp calls this type of money management a "secret" because few people seem tounderstand it, including many people who've written books on the topic. Some people call itriskcontrol, others call it diversification, and still others call it how to "wisely" invest your money.However, the money management that is the key to top trading and investing simply refers tothe algorithm that tells you "how much" with respect to any particular position in the market.
As if the issue of money management weren't confusing enough on its own, there are also manypsychological biases that keep people from practicing sound money management. And, thereare practical considerations, such as not understanding money management or not having

sufficient funds to practice sound money management.
This report is written to give you an overall understanding of the topic and to show you variousmodels of money management. To order this exclusive report call IITM at800-385-IITM (4486)or at 919-852-3664. The report is $79.95 plus shipping and handling.
Last revised: July 08, 1999
Five Tips To Give You More Discipline
They Will Help You Earn Bigger, More Consistent Profits (Without the Stress) by Changing YourThinking -- GUARANTEED!
ResponsibilityMistakesMental State ControlChange What You're DoingScan Your Body
Tip #1: Take Responsibility for Everything That Happens to you. One of the keys to peakperformance is to make the assumption that you create everything that happens to you. Forexample, if you give your money to someone and then run off with it, you must still takeresponsibility. You made the decision to give that person money. You made a decision abouthow much information you needed from that person before you gave them money. Thus, eventhough they committed an illegal act, you are still ultimately responsible.
When this sounds like I'm asking you to feel guilty for you mistakes, the truth is exactly theopposite. What I am asking you to do is set yourself free by taking control over the rest of yourlife instead of being a victim.
Tip #2: There are only two types of mistakes. You might say that you biggest problem is yourspouse. If you believe that, then it is probably true. In addition, you are also doomed to repeatthat mistake for the rest of you life. No, I'm not saying that you can't divorce your spouse. Youprobably can and may do so. But you will probably just find another spouse that will give youthe same problems. However, if you look at the problem different, such as noticing that I getangry when my spouse does X, then you have taken a step toward controlling the problem. Thereason is that you have now traced the problem to a mental state that you can elect to own --your anger. You don't have to get angry at your spouse when that person does X. You can electto have another response. That is the essence of discipline.
Now you can also apply this to the process of trading or investing. The mistakes you make are insome way related to negative mental states -- whether it's an inability to pull the trigger orcompulsiveness, you can trace it to a negative mental state.
Tip #3: Discipline Involves Controlling Your Mental State. My home study course has over 15ways to control your mental state. This means that you control your life and not your mentalstate. You don't have to be the victim of fear. Instead, you can just notice "Oh, I'm starting todo that fear thing and I need to take control."
Tip #4: If you don't like the results you are getting, respond differently! How are you producingfear or the mental state you don't want? Notice what you are doing and do something else or doit differently. For example, are you producing fear by something you tell yourself? Then tellyourself something else. Or change the nature of the voice. Try saying the same thing in a voicelike Mickey Mouse. If you are producing fear by something your are seeing in your mind, thenpicture something else. Or you might change the nature of the picture. Make it black and whiteor move it further away. This amounts to taking charge of the way you run your brain.
Tip #5: Change what you are doing with your body to change the reaction of your mind. Whenyour mental state is inappropriate, then scan your body. Notice what you are doing with your

body. If there is tension, relax that area. If your posture is bad, straighten up. Also notice yourbreathing. Take regular deep breaths and you can literally change your state. As an exercise, tryimitating people's walking. Notice what it feels like to walk in another person's shoes. This willconvince you how important it is to change what you do with your body to change your mentalstates.
Next time you are having a problem trading, ask yourself how am I doing this? Change whatyou are doing with your body, and if you do it right, you should notice a big change in yourbehavior.
For more information about discipline see Dr. Tharp's Home Study Course or the PeakPerformance Trading Seminar.
Last revised: July 08, 1999
BASIC TECHNIQUES
Exploiting Positions With Money Management by Daryl Guppy
Here's a trading technique adding positions to successful trades.
Even in a bull market, there is a feeling of triumph when a trade goes our way. When thishappens, the novice trader feels that getting the trade right is enough in itself and that profitswill automatically follow. He is invariably disappointed when profits turn out to be smaller thanexpected, and often, he will redirect his attention to derivative markets to try to leveragewinning trades into larger profits. This in turn exposes him to a higher level of risk than heanticipates. A better solution would be to apply money management techniques to equitymarkets to grow profits more effectively. This is also an important way of reducing risk.
The entry is just after the 10- and 30-day moving average crossover signal, and it was made at$5.52. The exit at $6.37 is also triggered by the crossover of the 10- and 30-day exponentialmoving average. The return on trading capital depends on how the initial position taken at$5.52 is added to in October 1998. We buy 6,000 shares for a total cost of $33,120. If this sameparcel were sold at $6.37 following a simple buy-and-hold strategy, then we collect $5,100profit for a 15.3% return on capital employed in the trade.
Here's how risk changes, even with comparable positions and stop-loss exits. Risk, here, istrade risk, measured by the dollar loss incurred with adverse price movements. This includesboth capital reduction and reduction in open profit. Risk is directly related to the moneymanagement technique selected. By comparing outcomes, the trader can exploit his winningpositions more effectively. Let's examine a method to increase profits while reducing risk that Icall the grow-up strategy. I use the name to distinguish it from adding to winning positionsusing constant dollar or constant position size.
When traders first approach the market, they concentrate on choosing the right analytical tools.They believe that if they get this right, profits will automatically follow. As time goes on,however, they realize that success is more closely tied to the way they trade and to tradingdiscipline. They understand analysis tools are a starting point, not an end point. Truly successfultraders take the next step by using money management to control risk.
Fund managers and institutional traders have a selection of well-defined money managementformulas. Texts by Ralph Vince and Fred Gehm serve well as a good introduction to this area,but their solutions are less applicable to private traders. The private trader finds generally lessinformation available, and even less of it applicable to portfolios at his level of capital. Take acloser look at the strategies for loading up the winners. Many trading books suggest thatloading up winners is a good strategy, and because it is so self-evident, traders spend no timeexploring the outcomes of their advice.
My objective is to increase the total position size as the trade continues to move in my favor.
The ultimate outcome is to have most of my trading capital tied up in positions making moneyrather than in positions losing money.
Despite intensive analysis and research of potential and actual trading positions, many tradersapproach money management armed with a collection of old wives' tales. High on this list ofadages is the assumption that traders improve trading outcomes by adding to winningpositions. The concept is sound. The way the concept is implemented, however, is often lesssuccessful.
Most traders reach for one of two common strategies. The first is to add new positions to awinning trade of the same parcel size (that is, the same number of shares in each new position)as the initial position; the second is to add new positions that are the same dollar size. Bothstrategies appear successful while the trend continues, but they expose the trader tounexpected risk when the trend reverses.
Daryl Guppy is an author and a private equity and derivatives trader. He speaks regularly ontrading in Australia and Asia. He can be contacted via www.ozemail.com.au/~guppy.
Excerpted from an article originally published in the September 1999 issue of Technical Analysisof STOCKS & COMMODITIES magazine. All rights reserved. © Copyright 1999, TechnicalAnalysis, Inc.
CLASSIC TECHNIQUES
Matching Money Management With Trade Risk
by Daryl Guppy
Manage your trades using technical analysis by identifying risk points as well as setting profitobjectives. This Australia-based author shares some of his favorite techniques.
Most of us think trading is a rational process, but many private traders approach trading thesame way that other people approach a wishing well. Those people throw money into the well,make a wish and wait for their wish to come true. In the same vein, some private traders throwmoney into the market and all they wish for is a profit. Sometimes the wish comes true, butmost times, just like a wishing well, it is a waste of money and time. For traders using themarket as a substitute for a wishing well, trading is a very emotional experience.
With that in mind, let's take a closer look at the way emotion interferes with good trading andat some of the ways that chart analysis can help us establish trading objectives moreeffectively.
Most readers will protest that trading is not like a wishing well; we don't just toss money in andhope for fat profits. By and large, we prefer to believe that we are too sophisticated for that.Instead, we analyze the tradable instrument in question, applying sound technical analysis tocharts and price data, and then, and only then, make a trading decision. This is a rationalprocess, and if our analysis is correct, the tradable's price will increase when we go long.
Unfortunately, describing the entry decision in pretty words and trading jargon does not alterthe trader's intent nor the outcome. Trading based on the wishing-well approach ischaracterized by poor trade management illustrated by the lack of a plan. Just hoping to make aprofit is not a plan. It is an objective, but it tells us nothing about how we are going to getthere.
Assume that all the sound analysis has been done, and Woodside appears to be irresistibleat$8.60. As prices tumble toward the chosen entry level, the trader must concentrate on thepossibility that his or her decision might be wrong.

Daryl Guppy is a full-time private position trader. He is the author of several books, includingShare Trading: An Approach to Buying and Selling (with editorial assistance from AlexanderElder) and Trading Tactics: An Introduction to Finding, Exploiting and Managing ProfitableShare Trading Opportunities and Trading Asian Shares: Buying and Selling Asian Shares forProfit. He is a regular contributor to the Sydney Futures Exchange magazine. He can becontacted via E-mail at www.ozemail.com.au/~guppy.
Excerpted from an article originally published in the May 1998 issue of Technical Analysis ofSTOCKS & COMMODITIES magazine. All rights reserved. © Copyright 1998, Technical Analysis,Inc.
October 1998 Letters to the Editor
SECURING OPTIMAL F
Editor,
In your July 1998 issue, you published an article titled "Secure fractional money management."The technique uses Ralph Vince's optimal f, and purports to limit the drawdowns that occurwhen optimal f is applied. But the authors do not consider the biggest problem with optimal fapplications.
Optimal f is a random variable. It depends on the largest loss experienced to date and all thetrade results to date. Because these variables are subject to large statistical fluctuations,optimal f is subject to random variations. The method set forth by the authors does not addressthe drawdowns that can occur when future trades are subject to an optimal f different from thecalculated value.
A partial solution is to just replace the largest loss to date in Vince's formula with a conservativechoice of a larger loss. Still, the resulting optimal f will be exposed to large variations from thetrade history employed. The best way to address these problems is to simply rerun the optimal fcalculation over several different time frames containing the same number of trades and thenaverage the results for optimal f. That way, the result will be much more "secure."
PAUL H. LASKY via E-mail
------------------------------------------------INSECURE ABOUT SECURE F
Editor,
The article "Secure fractional money management" by Leo J. Zamansky and David C. Stendahlthat appeared in the July 1998 issue of STOCKS & COMMODITIES contains a major error.Optimal f is not the percentage of equity to trade, as stated in the article. Optimal f is used tofigure the number of contracts to trade:
number of contracts to trade = (equity) (opt f)/-profit of worst trade
The equations that the authors give are correct, but because of their error in thinking, theymisapply the equations.
In the example of the three series given in the article, the authors correctly come up with anoptimal f of 1/3. But then to interpret this as being able to buy only three contracts is wrong.Using their interpretation, you could buy only three contracts in each of the series and end upwith $101,500, a terminal wealth relative (TWR) of 101,500/100,000 = 1.015. This is far fromthe TWR of 1.185 that is seen in their Figure 3. Using the correct interpretation, you don't buythree but 66 contracts!
66.666 = 100,000 * 1/3/(500)

You always round down the number of contracts. Then, after winning $33,000 in the first, thesecond series gets 88 contracts: 88 = 133,000/(1,500). The third series gets 118contracts: 118= 177,000/(1,500). You end up with $118,000, giving TWR = 1.18.
The authors' calculation of maximum drawdown of $7,500 is dwarfed by the actual maximumdrawdown, which is 5/3 of equity, or $220,000, as it occurs in series 2. The correct value of thesecure f is 0.01.
Perhaps the authors became confused with equalized optimal f (see page 83 of Ralph Vince'sThe Mathematics of Money Management). In this method, you can come up with a number thatis a fraction of equity to trade with, but this number is neither f nor optimal f. (As far as I know,Vince does not identify this fraction, but it is evident from his equations.) In this method, youuse the percentage loss or gain for each trade. In the authors' example, the trades become($500/$10,000 = $0.05, 0.05, -0.05) instead of ($500, 500, -500). In this case, the equalizedoptimal f = 1/3; it is the same as optimal f because the buy price was always $10,000. Now usethis equation: fraction of equity = equalized optimal f/ - return of worst losing trade
For the equalized optimal f of 1/3, the fraction of equity is 666.7% = (1/3)/(0.05). Yes, thisdoes mean you are buying on margin. For the equalized secure f of 0.01, the fraction of equity is20%.
After getting every other interpretation wrong, the authors do come up with the correct finalanswer of 20%. This leads me to believe that they do have access to a program that correctlygenerates these numbers for them.
Despite my criticism, Zamansky and Stendahl are to be congratulated for the idea of secure f.Fixed fractional money management is a wonderful and complex subject that deserves someattention. Too bad this article got the fundamentals wrong.
BRADEN A. BROOKS via E-mail
------------------------------------------------Leo Zamansky and David Stendahl reply:
Thank you for the feedback about our July 1998 article, "Secure fractional moneymanagement."
Mr. Brooks is correct in saying that according to Ralph Vince, the formula is number of contracts=(equity) * (optimal f) / (- profit of worst trade). He is also correct that according to thisformula, we buy66 contracts, not three. However, as we assumed in the article, one contractprice is $10,000. To buy 66contracts, we need to have enough money to buy 66 contracts at$10,000 each. That makes66*$10,000 = $660,000. And that amount should be only one-third ofthe total capital available, which, as stated, is $100,000. The question we are answering is: Howmany contracts can we buy following optimal f? The answer is $33,000 / $10,000 = 3. If thecontract price were $500, then the number of contracts to purchase would be exactly 66. If thecontract price were less than $500, then the number of contracts to purchase also would beexactly 66.
Vince, in his book Portfolio Management Formulas, states on page 80, "Margin has nothing to dowhatsoever with what is the mathematically optimal number of contracts to have on." Weemphasize the word mathematically. In real trading, if you need to buy one contract, you needto have a certain amount of money in your account, say x, and if you buy n contracts, you needto have the amount of money equal to n*x. In the article's example we call it price, but in realityit is a margin requirement. Inother words, the formula for the number of contracts should beadjusted to the price of the contract and be modified to look as follows:
number of contracts to trade = (equity) (opt f)/max [price of contract, -profit of worst trade]

We agree that we should have specified that. Of course, if you follow this number of contractspurchased, the TWR is not going to be 1.18, because the contract price is too high and does notallow you to buy the number of contracts that would maximize it. However, the lower the priceof a contract, the closer you will come to the calculated maximum of TWR.
We develop tools to use in trading futures. We cannot introduce a calculation that is not basedon real trading rules. In real futures trading, the margin requirement per contract always existsand has a very similar meaning to the contract price in the game introduced.
As to the software we use to obtain our results, we use only the software written by us. In fact,readers can download the secure f calculator from our Web site, as mentioned in the article, andrun it to obtain values for both secure f and optimal f. This should demonstrate the validity ofthis approach.
We appreciate the feedback from Mr. Brooks, who makes the important point regarding thedifference between optimal f as a mathematical concept and trading using optimal f given theconstraints imposed by the reality of futures trading.
Quizlet-Answer: (A: Answer, E: Explanation)
A: False:
E: You will never find 2 assets with a satisfying continuous correlation structure (above all at the downside whenthere usually is a high degree of correlation). You could even trade a single commodity with a portfolio ofpatterns and models.It might be easier to breed a custom correlation structure by synthesizing trading models than to find andapply those correlations offered by the markets.

Money Management 10
Money Management, kNOW, DeAmicis
Table of Contents
· General Introduction - Recommended· Book Introduction - Recommended · Overview of Applying Money Management - Recommended· You Have A System · Bias toward mechanical systems? · A statistical winner? · What's a valid sample? · Evaluating Different Money Management Methods · What Is Money Management? · Selecting A Money Management Method to Use · An IMPORTANT distinction · Overview of Money Management Techniques · Organization of Following Sections · No Money Management Technique · Multiple Units/Contracts Technique · Fixed Dollar Value Trading Technique · Fixed Percent of Account Trading Technique · Adjust Trading on Win or Loss Technique · Crossing Equity Curves Technique · Applying the Optimal f Technique · Summary of Techniques/Methods · Using Optimizations · Before Comparing Money Management Techniques · How to Compare Money Management Techniques · Comparing Results on the Basis of Total Profit · Comparing Results for the Smallest Drawdown· Comparing Results for the Profit/Margin Ratio · Comparing Results for the Profit/Drawdown Ratio · Comparing the Profit/Time Ratio · How Important is the System's Percent Win Ratio · Z-Score and Confidence Limits · The Optimal f · The Probability of Ruin · Conclusion
GENERAL INTRODUCTION
A Brief Overview of the Book, Manual and Software
The Money Software Company, LLC thanks you for your purchase, faith and interest in thekNOW Money Management Program and welcomes you to the arcane but extremely importantworld of "Risk Management".
Half of investing/trading is knowing what and when to trade. The other half is kNOWing whatamount to risk. This manual, book and software seeks to assist and educate the investor/traderon this very important second half of investing and trading, the art and science of riskmanagement.
The value of unique money management techniques (not just stops, pyramiding, percent of

account value, etc.) is finally being recognized as being as important as the investing/tradingsystem used. In fact, there are numerous examples where the utilization of proper moneymanagement techniques has turned a losing investing/trading system into a winner and taken amarginal or successful system and substantially increased the return while reducing thefinancial and psychological trauma of losses/drawdowns. However, the reason more people donot thoroughly understand the subject, is because until recently there was no easy way to testand evaluate different money management techniques. This is the reason the Money SoftwareCompany, LLC developed and is now offering the kNOW Money Management Program.
The kNOW (k =$1,000s-NOW) Money Management Program was designed for both theprofessional and the less experienced investor/trader in order to allow them to enter individualtrades or import investment/trading results (Trade Station, SuperCharts, Excel, etc.) and runthousands of variations and "what if scenarios" on seven major money managementtechniques. This means that users can now easily determine which money managementtechnique(s) and/or method(s) meet their needs in terms of: maximizing profits, smoothing outthe equity curve, diversification for stability, or the reduction of drawdowns. The kNOWProgram is applicable for any investing/trading system pertaining to futures, options, equities,mutual funds or any other type of investment with specific profit and loss results.
The money management techniques/approaches discussed include such items as the Optimal f,probability of ruin, Z-scores and Confidence limits, fixed fractional trading, crossing equitycurves, optimal risk allocations and much, much more.It should be noted that through out the book/manual/software the term technique andapproach refers to the seven major money management methods being discussed while theterm option refers to variations or additional things the user can do with the differenttechniques/approaches. Also, through out the book and manual the term trade and trader areused, this is synonymous with investing and investor and when the term contract is used it issynonymous with a "unit". A single "unit" can be one, five, ten+ future contracts, 100+ sharesof stock, 100+ options or even 100+ shares of a mutual fund. The user determines the size,value and type of instrument to make up a "unit". When the term system is used it means adefined investing/trading method for getting in and out of the market(s) with specific andhistorical profit and loss results. It should also be noted that the kNOW Money ManagementProgram is applicable for many different investing/trading systems and time frames but is notapplicable for the buy and hold investor.
It is the Money Software Company's sincere hope and desire that through the combination ofthe money management information and the software tools provided, traders and investors willhave everything they need to make informed and educated investment decisions about moneymanagement. With the knowledge of how different money management techniques/approacheswork with different types of systems, investors and traders can now easily pick the method(s)that best achieves the desired profit and risk objectives.
Thank you again for your acquisition of the kNOW Money Management Program. All of us at theMoney Software Company LLC sincerely hope it will be both educational and profitable to youand your trading/investing philosophy and systems.
Book Introduction
"k" as in thousands. "NOW" as in immediately. kNOW as in understanding how to make thousands immediately.
Welcome to the kNOW Money Management Program.
I once knew a very successful trader that told me the way he decided whether or not to enterthe market was to throw two old chicken bones over his shoulder. Depending on how theylanded, he would buy, sell or stay out of the market. When I pointed out to him this was not avery reliable entry method, he agreed, but stated that it made little difference because in the

long run money management was everything.
Most investors and traders have heard that money management is half of every great tradingsystem. In fact, some traders feel their money management approach or technique is moreimportant than their trading system. As you will soon learn during the reading of this book, thecorrect money management technique(s) can mean the difference between success and failure.The best investing/trading system with poor money management ends up still being a poorsystem. On the other hand, a poor investing/trading system with good money managementtechniques can be a good system. It is even possible, in some cases, to take a losing system andmake it profitable with the right money management techniques.
The science of money management is:
1.Knowing how and when to use different money management techniques and approaches that:
· Maximize the return on an account · Keeps the risk and drawdown within psychological and financial levels acceptable to thetrader.
2.Knowing the relationships between different money management approaches and differentstatistical peculiarities of a given investing/trading system:
· Variability of the results. · Probability of success or ruin. · Correlation between wining and losing trades, etc.
Many articles have been written on how to maximize the return on an account. These articleshave helped bring the science of money management to new levels. However, most of thearticles and books on this subject have neglected to discuss the risk and psychologicalramifications of maximizing the return on an account. In most cases, maximizing the return onan account will expose traders to a larger risk of going bankrupt or, at the minimum, largerdrawdowns. Most people do not want to see a 50%+ drawdown on their accounts, even if it isonly a loss of profit. For professional money mangers, a 30% drawdown can begin to wreck acareer for the simple reason the institutions and individuals that invest with money managerswant to see drawdowns only in the 10-15% range.
The kNOW Money Management Program will give you the opportunity to see yourinvestment/trading system analyzed using hundreds of different money managementtechniques and approaches. Then, when you kNOW the effects of the different moneymanagement techniques on your investment/trading system, you can intelligently choose theone that is right for your financial and psychological goals.Please look over all of the material in this manual. It is meant to inform, educate and stimulateyou. Also, please give us your feedback, questions, insights and direction so that we can doadditional upgrades and new money management articles. We feel that the kNOW MoneyManagement Software Program is a dynamic entity and thus will be growing in intelligence andcapability, just like it's users.
Mike DeAmicis-Roberts - President Money Software LLC
Overview of Applying Money Management
It is frequently said that money management is half of investing/trading. This is true in thesense that the two major aspects of any investment/trade are when and how much. In reality,much more is going on in an investment/trade. There are psychological aspects to trading andthere are execution aspects to trading. If traders are either to scared to trade or they havebrokers that consistently get bad fills, it will also effect the profitability of any system. Overall,

many aspects come into a solid trading approach and money management is only one piece ofthe puzzle. But, it's a very big piece. In fact the more professional traders become, the moreimportant money management becomes.
Money management is something all traders can apply. But, in order to apply moneymanagement effectively, trader's needs to have a defined system for entering and exiting themarket with a historical and accurate profit and loss record. Although some traders don't use adefined system, these days, most traders do have some type of a trading approach/system.Having a well tested trading system helps insure that traders get consistent trading results fromfuture trades, within normal statistical boundaries. It is understanding these statisticalboundaries that represents a large aspect of managing an account both effectively andefficiently. The main way traders learn to understand these statistical boundaries is to have alarge sample of tested trades. However, what is a correct number of trades to have? The initialsections of this book cover these kinds of issues.
When you have an investing/trading system you feel comfortable with, it is time to startexploring how money management can help improve the results of the system. Often timeswhen one hears about money management, the topics are interesting, but have limitedrelevance to most traders on a day to day basis. Ideas like "don't trade into an economic report"or "keep 25% of your account in savings bonds" does not tell traders how much to risk on thenext trade. This book will deal only with the "nuts and bolts" aspects of investing/trading: howto risk your money on a trading system for maximum gain or risk management and steer awayfrom the more casual money management ideas.The process of applying the correct money management approach and/or technique consists ofa few but very important steps (they are not necessarily in order of importance):
Learn the value and benefits of applying different types of money management options andtechniques. · Determine on a personal level what is correct for you. Deciding how much you are willing torisk and/or bear and how much profit is desired is very important when picking the correctmoney management techniques and options. · Learn how to compare and analyze the different money management techniques/approaches.Users of the kNOW Software will always receive a detailed set of results after applying aspecific money management technique to a trading system. It is then important to know how tocompare the latest results to the results received from previous simulations. There are trade-offs here. It is not as simple as picking the one with the best profit.
The what, why and how of money management is the general format and sequence of this book.This may be out of order for some people. Some traders would rather learn how to comparedifferent money management techniques before learning about them. Or, should deciding whattechnique you want as a trader be the first step, or the last?However, it is felt the format and sequence of the following presentation is the most reasonablemethod for traders and users of the kNOW Program to learn. This book is really a jumping offpoint for traders to begin analyzing their own systems, and this format will leave them bestprepared for their own explorations. Also, there are some peripheral topics that are discussedalong the way, that pertain to the subject at hand.When traders have completed these steps, they will then be well positioned to make the bestmoney management decisions. Decisions that will materialize themselves into increased profits,lower drawdowns and better mental health. (What more could one ask for?)
The first major section in this book is the "what" section. It explains to the reader what themajor types of money management are and discusses the advantages and disadvantages of thefollowing seven major money management approaches and techniques:
1.No Money Management - This technique is the default method that many traders use. Itconsists of entering the market with one unit/contract every time a trading system gives asignal to enter the market. This method has advantages and disadvantages that will bediscussed later.
2.Multiple Units/Contracts - This technique is very similar to the one above, but the difference is

traders would take multiple units/contracts. Although similar to the No Money Managementtechnique, this method has some definite peculiarities to be concerned about.
3.Fixed Dollar Value for Risk- In this technique traders define how much money to risk on anygiven investment/trading signal. For example, a money manger may choose to risk up to, butnot more than, $1000 on each trading signal.
4.Fixed Percent of Equity - In this technique, traders define what percent of the account valueto risk on any given trading signal. For example, a money manger may choose to risk up to, butnot more than, 5% of the account on each trading signal.
5.Adjust Trading on Win or Loss - This technique is often called the pyramiding (up or down) orMartingale (normal or reverse) approach. In this technique, traders determine how much totrade after successive wins or losses. For example, after losing trades, they may decide todouble up on the next trading signal, to recoup the losses.
6.Crossing Equity Curves - With this technique, traders define a long and short average (3 and 8for example) of the trade profit and losses. When the short average is greater than the longaverage, it means the system is doing better than it did in the past. Based on this information,they would enter the market. If the short average is below the long average, they would trade.The profit or loss from all trading signals, whether taken or not, are calculated in the average.
7.Applying the Optimal f - This section goes over what the Optimal f is and how to apply it as amoney management technique. Many people are familiar with this approach, but it does havesome dangers to watch out for.
Upon completion of this section, traders will know most of the "nuts and bolts" about differentmoney management techniques and variations and options to these techniques but even moreimportant, they will kNOW about their own trading systems. Traders will also be able todetermine the profitability and risk factor for their personal trading systems by utilizing any oneor all of these money managementapproaches/techniques.
But, before traders try and figure out the profit potential of their trading systems, they shouldfirst try and determine what is right for themselves. This is the next important section in thisbook and the shortest. Basically, in order for traders to accurately choose the best moneymanagement technique(s), they need to decide what kind of risks and rewards they want or arewelling to endure. Each one of the money management techniques discussed can impact andtransform a trading system differently. Some of the techniques will allow traders to make a veryhigh profit, while others will allow the traders to minimize the drawdown on their tradingsystem. A system may have a high probability of ruin, but incredible profit values. In order fortraders to pick the best method, they will need to be honest with themselves on how they wanttheir accounts to grow. Some people need security, others need rapid growth. Who knows whatyou need, better than you?
Once traders are comfortable with what they want, they can then move on to the sections ofthis book discussing how to compare different techniques and trading systems. Systems canand should be compared in many different ways. No one ratio tells the whole story. Astutetraders will look at their trading possibilities from several different angles, before deciding whatis best for them. This section of the book looks at nine different ways to compare systems:
1.The total profit 2.The drawdown 3.The profit / margin ratio 4.The profit / drawdown ratio 5.The profit / time ratio 6.The percentage of winners 7.The Z-score and confidence limits 8.The Optimal f 9.The probability of ruin

Each of these methods for evaluating results has different advantages and disadvantages.Traders should be aware of these differences before using any of these methods to evaluate atrading system. Only after using several or all of these techniques can traders make an informedand intelligent decision for or against the value of a trading system. Not looking at a tradingsystem's results from several angles may leave traders in the unhappy situation of picking thewrong approach. Choosing the wrong approach could leave traders with a less fulfilling andunprofitable trading experience.Choosing the correct approach will allow traders to feel more comfortable about their trading.This comfort can manifest itself by allowing traders to focus on the other aspects of trading thateffect the profitability of a system, such as the psychological aspects for example. Overall, themore comfortable traders are, the better.
Periodically throughout this book, references will be made to what is still not known aboutmoney management. This book contains a great amount of useful information on the applicationand value of money management but it is not a definitive encyclopedia on the subject. It is veryobvious there is still much to be learned about the arcane subject of money management. Forexample, is there a way of knowing in advance which money management method will workbest with a particular trading system? There probably is, but the authors of this book do notknow how to determine this and most traders probably do not know either. Or, is there a way amoney management technique can tell if a trading system has broken down? Another question,yet to be answered. It seems there is a great deal more to learn about the theory of moneymanagement than is known at this point in time.The same three or four trading systems have been used as examples throughout this book. It isthe intent of the authors not to deceive the reader with a trading system that is optimized for aparticular money management technique and thus give the reader the wrong impression.Additionally, these systems are included in the software, so the reader has the opportunity tocheck them out if desired.
In summary, this book is a tool for traders to receive the basic knowledge that is required tostart exploring the principals of money management. The software is the tool that will allowtraders to take this knowledge into the real world and in turn take this process of exploration toplaces this book hasn't gone to.....yet.
You Have A System Bias Towards Mechanical Systems?
In order for traders to take an effective approach to money management, the trading resultsmust have some consistency or some common denominator. Usually, the easiest way to achievethis end, it to have a mechanical trading system. A mechanical trading system allows traders totake subjectivity out of their trading. It is assumed, at some deep level, that a truly mechanicaltrading system has a particular set of results associated with it. And, it and to the extent thatpast situations are similar to the future, this mechanical system will perform in a similarmanner, in the future. Based on this assumption, it is possible to collect data on a tradingsystem (percent win, average profit per trade, etc.) and expect it to perform, within statisticalboundaries, in a similar manner.
It would be very hard to be a professional money manager who didn't make this assumption.What's the alternative? It is hard to believe that pure luck has propelled some traders togreatness. We are inclined to believe in trading systems because they seem to work. Manysystems only work for a short time, but others seem more solid.Humans excel at finding patterns. Humans excel at following patterns. Perhaps this is whytrading systems work?
An example of a mechanical trading system might be: "Enter the market with a long positionand a protective stop loss of 200 points, when a 10 period moving average crosses up and overa 30 period moving average of the closing price. This is a fairly simple form of a trading system.However, today's systems can also be complex neural networks using genetic algorithms tofilter the final entry and risk parameters. Traders may never be able to verbalize what exactlytriggered the trades, other than "My software told me." Luckily, it doesn't matter to the traders'

accounts if they know why X follows Z, or why this price action leads to that market move. Itonly matters to their accounts when traders apply a trading system to make money.
Trading systems spring to mind easily, almost intuitively. "When the market does X then itusually goes up." Luckily, there are many pieces of software on the market that can help tradersautomate their trading systems. Once a particular system is automated, traders can run itthrough a couple of years of historical data to see how well that particular pattern worked. Theprocess of automating a system is important for two main reasons.
1.Automating a system takes the subjectivity out of the results. For example, if traders knowthat a particular system wins 73% of the time and the system has been thoroughly tested; it isreasonable to assume this system will continue to perform in this general manner. (If tradersbegin to "second guess" the system, they invariably make things worse. Unfortunately, it isMurphy's law and a cold reality to many traders, who have chosen to second guess theirsystems and missed the biggest winners.) In short, having an automated system helps insurethat a well-tested trading system will continue to perform the same way.
2.Having an automated system, with well-tested results, gives traders specific informationabout the characteristics of their systems. If a trading system has been tested thoroughly, it ispossible to find out unique characteristics about that system. (For example, Confidence limits,standard deviations, Z-scores, POR, etc.) When this is known, it is possible to find ways toexploit these unique characteristics. There are techniques for risking capital that can bespecifically tailored to a particular trading system, but only thorough testing of that system willyield reliable data. These "specifically tailored" money management techniques can help tradersget more profit, for less risk, from the same old system.
Having an automated system is very important, but it is not absolutely necessary. It is possiblethat discretionary and/or fundamental investors/traders could have a long enough tradingrecord to show consistency. For example, if discretionary traders have a large number ofrecorded trades (100 or more, as an example); it is reasonable to assume they will have areliable trading record. The same thought process might apply to a system that re-optimizesitself every 10 trades. The point is, if there is a sufficient history to develop reliable informationon the trading system, then it is time to consider money management.
The main goal is to have an investment/trading system that will perform the same way insimilar circumstances. At the deepest level, a system is an attempt to characterize a peculiarityabout the market. The "peculiarity" could be the monetary manifestation of the fear and greedof the trading pit or the method by which bank computers hedge their stock holdings or evenweather patterns over the mid-west. It is very important that traders learn if there is apeculiarity, if it is consistent and how to exploit it. Part of exploiting and maximizing a tradingsystem is knowing how to risk your money.
A statistical winner?
It has frequently been published, especially in books on gambling, that there is no use tryingdifferent money management systems if the system is not a statistical winner. This means thaton a statistical basis, at the end of a trading period, you should have more money than youstarted with. With this definition, it can be stated that a system is a statistical winner when:
(Average winning trade) * (% winners) (Average losing trade) * (% losers)
Although many books say there is no use in trading a statistically losing system, there areexceptions to this statement. When traders have a statistically losing system, most conventionalforms of money management will not work. This is because they rely equally on all the trades ina system to factor into the account value.On the other hand, when traders have a statistically losing system, it may be possible toimplement strategies that do not rely on all the trades equally. For example, there are tradingsystems that tend to always have two losers or winners in a row. (This can be determined byinterpreting the Z-score and Confidence limits of a system. This is discussed later in this book.)
If this is known about a system, it is possible to devise a money management approach thattakes a smaller position after a loss and a bigger position after a win. The results of thisapproach may minimize the losses and actually turn a losing system into a winning one!
There are several other money management techniques and methods that do not rely on all thetrades in a system equally. Any of these methods could conceivably turn a statistically losingsystem into a wining system. However, they can just as easily change a winning system to alosing one. By not relying on all of the trades equally, traders are opening up a new game inmoney management. These new approaches need to be carefully evaluated with a good dose ofcommon sense. This book will explore these different approaches in detail.Getting to a deeper point, why would traders want to try to turn a losing system into a winnerwith money management? There are several reasons why traders may want to try to improve aloser rather than trying to develop a winning system. The main reason traders may want to usethis kind of approach is to compensate for drawdown periods in another system. Manysuccessful traders have complimentary systems that compensate for each other's drawdownperiods. It is possible that one of these complimentary systems can be a losing system.However, when combined with a winning system, it makes for a smooth equity growth.
One more fact that all traders are familiar with is, really good trading systems are hard to find.Anybody who has tried to look for systems knows it is an emotional game. One day you havefound the holy grail Holy Grail to trading. The next day, after some additional testing, you findthe system lost a million dollars between 1985 and 1996. You go back to the drawing board andstart over again. On the other hand, OK systems are not that hard to find, with serious looking.There have been many traders who found a system, did thorough and complete testing, only tofind out that it earned 7% a year. "I can't quit my job for 7% a year", they say, then try again,more frustrated then before. This is a pity, because good money management can often make asystem like this very feasible.
Given the fact that good trading systems are hard to find, it becomes necessary to effectivelyuse money management techniques to improve the profitability of an OK system, as much aspossible. Using solid money management principals allows traders to squeeze more out of theirsame old system, often times with less risk. Traders can be sure that with ever increasingcomputer power pointed at the market, people will become faster at finding market peculiaritiesand exploiting them into profitable trading systems. But finding the trading system is the smallpart of the problem, managing the risk to the account will be the major separation betweencasual traders and the institutional ones, the winners from the losers.
Consider the definition of a statistically winning system again for a moment. (Average winning trade) * (% winner) (Average losing trade) * (% losers)
Please keep in mind, this does not account for any costs, such as commissions, slippage,overhead, etc. When these numbers go into the formula above they can often shift a winningsystem into a losing one. Many traders often do not take the commissions and slippage in toaccount when evaluating systems. It can be very important. It can also add up quickly. If youare paying $50 in commissions per turn, it only takes 40 trades to spend $2000. These kinds ofcosts can put a $20,000 account down 10%, before calculating any profit or loss from thetrades. On top of this kind of overhead, astute traders will also account for the day when theyare caught in a limit move or when the market gaps way past their stop on the open of the nextday. Whatever the case, these are real costs that can make or break a system. With this in mind,the definition of a statistically wining system becomes:
((Average winning trade) * (% winner)) - (all other costs) (Average losing trade) * (%losers)
What Is a Valid Sample?
In order to evaluate a trading system, it is necessary to have a sufficient number of trades tomake a valid sample. This much is common sense. Knowing how many trades are necessary tomake a valid sample, is not. Some traders say 10 while other say 1000. This is interesting,

because to some extent, both of the traders are right. The answer lies in the definition of theword "valid." By valid, these traders mean the ability of the sample trades to predict futureperformance of the system.
Starting with the most conservative approach, some traders feel they need to see 1000 tradesbefore they truly know the performance of a trading system. One's first reaction to thiscomment may be, "Wow, that's really conservative!" Over time, however, this point of viewbecomes more reasonable. This is especially true when one considers how many people,including the authors, have tried a tested trading system real time, only to watch it crash. In aninformal way, there is some scientific data to back up the conclusion that a very large number oftrades are needed. Those of you who are familiar with "Random Walk" indicators know that themarket is moving in what appears to be a random way a fair amount of the time. Given that themarket is random, at least some of the time, it is reasonable to assume the results from many ofthe trades taken have a random element to them. Therefore, it is necessary to have a very largenumber of trades in order to begin to see the actual effects of a trading system on an account, ifmany of the trades in the sample are random wins or losses. It is also very important to knowhow the system behaves independent of the market or other conditions. Also, it may take alarger number of trades to see the effects of randomness on a trading account.Of course, the Random Walk theory may be bunk, but it does give astute traders an interestingperspective on the market and how to view the success or failure of a particular trade. There isone other thought on randomness, that could lead traders to believe a large amount of tradesare necessary. It is reasonable to expect that if you flip a coin 1000 times, at some point it willcome up " heads" 10 times in a row. If this happen within the first 20 flips, then a trader wouldnot have an accurate prediction of the probabilities of flipping a coin. When these kinds ofstatistics are applied to money management, it becomes clear why a large sample of trades isnecessary. It can take a large sample of trades just to figure out what is normal.
Taking a slightly different perspective, scientific traders will often state they need at least thirtyfive trades to develop any results that are statistically valid. This belief comes frommathematical proofs associated with standard deviation. As a general rule of thumb, safetraders will want at least thirty trades when testing their trading systems. Other traders, for example, may utilize trading systems that rely on odd seasonal or marketpatterns and thus have very few trades. In cases like this, there may only be ten examples ofthis particular pattern. Is it reasonable to believe that a trader can have a reliable system withonly ten samples? Who knows? It seems possible. The answer lies in whether or not thesystem/sample can reasonably predict future action. This is the area where moneymanagement drifts from science to art. It will take the discretion of the traders to ultimatelydecide this question.
The following represents thoughts that should thing that need to be considered when examiningsystems with small sample sets:
1.Are the market conditions similar for all of the trades? For example, was the market trendingin all of the examples, or did the entry/exit signal happen before a major economic report. Ifthe short term market conditions are similar, traders can have a degree of confidence thatresults are reliable. On the other hand, if some of the signals are from trending markets andothers are from choppy markets, the system may not be reliable, even though other statisticslook good. Also, this kind of analysis can help traders gain additional insight into their tradingsystems.
2.What is the distribution of the profitability of the trades? If all the winning trades seemed tomake about the same amount of money, then traders can have a higher degree of confidenceabout the system. If the profitability of the trades is spread out over a large range, it can be asignal that the system is random.
3.To some extent, you can use the percentage of winning trades as a barometer. However, thisis not "fail safe" necessarily a good method either. As mentioned above, even a system of 50%winners goes into periods where it may lose ten in a row.It is clear there are many different perspectives on how many sample trades are required tomake a reasonable test set. As mentioned above, this is one of those areas where art and

experience meet science. One of the few things that can be said with certainty is that the moretrades one has in their test set, the more accurate the results will tend to be. The more accurate,the better. To repeat what was said above, the answer lies in whether or not the system/samplecan reasonably predict future action.
Evaluating Different Money Management Strategies
What is Money Management?
Let's define "money management" in a way that has utility to everyday traders. Moneymanagement is a way of deciding how much of an account to risk on a particular tradingopportunity.Setting aside the psychological aspects, one half of trading is deciding when to enter themarket. The other half is how much to risk. In many ways these two aspects of trading are bothrelated and separate. Traders can receive a signal to enter the market and decide to risk threecontracts or four. But the trade either wins or loses in an absolute sense and it doesn't makeany difference how many units/contracts the traders risked. In this sense, the two halves of atrade are independent of each other. On the other hand, the market entry half and the moneymanagement half of a trade can be tightly linked. Consider a trading situation where traders canonly afford a stop loss of $500, although $750 fits perfectly below a market resistance level fora stop. The traders are then forced to put the stop at $500 due to the amount of money in theiraccount. In this case, the money management approach, can influence the success or failure ofthe entry. Whether or not your money management approach effects your trading system, it will alwayseffect your account value. Every trade represents a risk of making or losing money. Therefore, inthis respect, every decision to enter the market effects the account value in some way. Themethod of money management that traders decide to use determines how much their accountsare effected. The basis of these decisions rely on the wants and needs of the traders. Forexample, some traders might want to maximize profit while others might want to minimize therisk to an account. Most of us are in the middle somewhere.
It is my experience most traders never make informed decisions about money management.Instead, most of them fly by "gut feel." This is not a bad approach in itself; some people aregood "gut" traders. But for the rest of us, going on gut feel does not give us any tools foranalyzing if what we are doing is right or wrong. When we begin to examine differentapproaches to money management and begin to understand the dynamics of a particulartrading system, we can make decisions that maximize the growth to an account while keepingthe risk to a minimum.
Despite the fact that money management is half of a trade, many traders still spend five timesmore effort reading about trading systems than learning about the principals of sound moneymanagement. The fact there are very few good articles or books on money management ispartially to blame for this disparity of effort. However, the major part of the blame lies with thetraders. Despite the fact that money management can greatly effect traders' accounts, very fewof them focus any effort on improving their knowledge in this area. Instead, most traders focuson timing the entry or exit to the market as a way of maximizing profit.
This is an easy trap to fall into. Firstly, the common tools for system development usually onlyallow for limited money management techniques/approaches, if any at all. This situation deniestraders the tools to really evaluate different money management techniques/options. Secondly,the calculations involved are usually very time consuming. To use a simple example, imagine iftraders wanted to know the return on their accounts if they risked exactly 10% of the accountvalue on each trade. This kind of simple problem could take a large number of calculations towork out on a calculator. These situations and others, leave traders with very few easy optionsfor evaluating different money management techniques and options, other than a few booksand this software. Please Note: There are other money management software programscommercially available (some in excess of $10,000.00) , but to the best of the authors'knowledge, none of them offer the total capability found in the kNOW Program.

Selecting A Money Management Method To Use?
Let us start with the negative side of things. Selecting the wrong money managementtechniques/approach can have a detrimental effect on your trading performance. In light of thisconsequence, there is only one reliable way to come to a valid conclusion, testing differentapproaches. To some extent, different mathematical properties (% winners, average loss, etc.)may point to certain methods over others. However, the testing of different money managementtechniques, (just like in trading system development), is the most reliable way to understandwhat to expect from a trading system. In the following chapters, this book will go over variousconsiderations and optional methods when reviewing the results of the different moneymanagement techniques/approaches.
When developing the results for a particular money management technique and approach,traders should use the same methodology as in system development. This method takes thescientific approach to testing. First, traders should start with two or more data sets, all comingfrom the same trading system. Using the first data set, traders should develop the best moneymanagement methodology for that particular timeframe/system. Once they have reached sometype of conclusion as to what money management technique/approach is the best for the initialdata set, it can then be tested on the other data sets. The results from the first data set shouldthen be discarded. But, this is often hard to do, since the numbers look so good. However, thisfirst data set is naturally skewed to look good, because the goal was to try to find what workedbest (optimization?). The results from the other data sets will be the most trustworthy data andwill determine the true value of the money management technique(s) tested.
Many traders do not go through this process when testing their trading systems or their moneymanagement approaches. As a result, Therefore, back tested systems that may have workedwonderfully for the last couple years, fall apart in real time. The tight curve fitting of the pastoften does not match the future. (Please see the section on Optimizations.)
Selecting the correct money management approach will take time to test and evaluate. It willalso cost money if it is done wrong. On the other hand, if serious traders take the time to findthe best money management technique(s) and/or system, it will be one of the best investmentsthey ever make. In other words, you will have to work to find out what money managementapproach works best for your style, goals and trading system. No traders like the additionalwork involved, but trading is like anything else in life; the people who work the smartest andhardest usually come out on top.
Often smaller investors will only be able to afford to take one unit/contract on any tradingsystem signal, due to the size of their account. These traders feel that because of this fact, theirmoney management options are limited. This is a legitimate concern, because the initial size ofthe account can effect how much money there is available to trade. However, it is important tokeep in mind there are alternatives. For example, traders can take partial contracts on the Mid-Am or even choose not to trade at all. There is no reason why traders should open themselvesup to undue risk, due to a lack of capital. If traders are in a position where they can not regulatethe risk to their accounts within acceptable bounds, then they should stop trading. Traders whochooses to stop trading and wait until they have more expendable capital will usually be happierin the long run, than traders who are willing to risked it. There will always be traders that takegreat risks and win. The rest of us will read about them and wish we were as lucky. The realityis that for every person who pulls off a trading miracle, there are twenty that didn't. Also, it iseasier on one's own mental health, family support group and ultimately the wallet, to play itsafe.
An IMPORTANT Distinction
When evaluating money management techniques/approaches and, to a smaller extent tradingsystems, it is important to note that there are two types of processes effecting the values. It isconvenient to think of these as linear and non-linear factors.

Linear factors have results such as:
1.Gross profit 2.Total profit 3.The dollar value of the drawdown
These kinds of attributes of money management techniques/approaches, will grow in a linearfashion as traders risk more or less money. This can be demonstrated with a simple example. Iftraders take one unit/contract, they will make $X amount of money. If traders take twounits/contracts, they will make twice that amount of money. This is pretty intuitive. Theproblem arises because many traders assume that all money managementtechniques/approaches are linear.
Non-linear factors are results such as:
1.Percentage growth of the account 2.Probability of ruin 3.Standard deviation of the trades
These kinds of attributes do not grow in a linear manner. Using the example above, if traderstake a one unit/contract position they may have a probability of ruin of X%. If traders take twounits/contracts the probability of ruin may be up to four times as high. The reason for this isthat the probability of ruin is tied to the success of the trades and the account size. (Moredetails on the probability of ruin are given later in this book.) The same kind of reasoningapplies to calculating the percent growth of an account. These non-linear factors are very important when comparing various money managementtechniques/approaches, because it is often these factors that have more to do with a trader'ssuccess of traders than the profitability of the their systems. To a large extent, it is not understanding, or even recognizing, there is a difference betweenhow the linear and non-linear factors interact that causes many traders to fail. Unfortunately,most traders, and the tools they use are primarily interested in just a few basic numbers, profitand drawdown, and automatically assume they are all linear. The truth is, depending on themethod of money management utilized, there are cases when the profit and drawdown are noteven linear.
Below are two very relevant examples of how these non-linear aspects of money managementcan effect trading:
Example 1:
Assume the starting account size is $25,000 and the traders are trying to find out what percentof their account to risk on each trading signal the system gives them. This "percent of theaccount" will represent a different amount of money for each trade, since the account changesvalue with every win or loss. Traders will need to risk up to, but not over that amount of money.Therefore, on the first trade, if the traders were going to risk 6% ($1500 = 6% of $25,000), theideal trading signal would have a risk of $1,500. (Traders would not take a trading signal thathad a risk of $2000 since it is over the allotted risk. Alternatively, if the risk is $500 perunit/contract, traders would take three contracts to reach the $1500 risk goal.)
The following table shows the results of risking different percentages of an account on this typeof money management approach:
Although the traders grew the percent to trade in a linear fashion (2%, 4%, 6%, etc.), there isnothing linear about the results. As you can see, risking 4% was the best approach for thetraders in terms of profit. Risking more or less than 4% resulted in a lower profit for thetraders. This kind of example shows that if traders take additional risk in a linear fashion, thereturn on the account is not necessarily linear. Traders should keep this in mind when exploringand/or comparing different money management techniques/approaches.
Example 2:
If we lived in a perfectly statistical world, we would all have 0.78 of a house, 1.5 children and0.34 dog. But this is not reality. Trading systems and their results happen within a range ofvalues. For example, you can expect a system to be within plus or minus 15% of your expectedresults after a sufficiently large number of examples. The correlation of your system within aparticular range of expectation is one of those non-linear factors. This is not usually one of thethings that most traders consider. However, understanding this principal helps traders to knowif their trading system has "broken down." To illustrate this point consider the following tradingsystem:
Percent (%) winners = 50% The average win = $100 The average loss = $ 50 Average profit per trade = $ 25 (by deduction)
In a perfectly statistical world, traders could expect to make $25 per trade. Therefore, after 100trades, the traders would expect to make $2500.Unfortunately, this is not a perfect world and as traders use this system, they will probably findthat the real-time results do not match the hypothetical results. The more trades there are, theless chance traders will end up having a perfect statistical outcome. To simplify the example,consider tossing a coin four times. You know that half the time you should get heads and halfthe time you should get tails. But statistics show us that if you flip a coin four times you willonly get two heads and two tails 38% of the time. The other 68% of the time you will get someother outcome after four flips.
If we apply this back to our trading example above, statistics allow us to state the following:
As the number of trades increases
1.The total profit (real-time results) from a system will get closer to the expected profit ($25per trade) as a percentage.
2.The total profit (real-time results) from a system will get farther from the expected profit($25 per trade) as an actual number. In other words a little error adds up each time.
The goal of this section is not meant to be a primer for statistics or standard deviation. This isused purely as an example of the fact that there are linear and non-linear forces effecting yourmoney management choices. Where you will probably end up and where you should end upafter trading, do not have a linear correlation. This book and software will try to highlight thesefactors. In fact, it is the primary value of the software to allow you to understand these factorsfor your system.
Overview of Money Management Methods
This book and the accompanying software go over seven different techniques and approaches ofmoney management:
1.No Money Management - This is the default method most traders use. It consists of going intothe market with only one unit/contract every time a trading system gives a signal to enter themarket.
2.Multiple Units/Contracts - This method is very similar to the one above, but traders may takemultiple units/contracts. Although similar to the No Money Management technique, this methodhas some peculiarities to watch out for.
3.Fixed Dollar Value for Risk- In this technique, traders define how much money to risk on any

given trading signal. For example, a money manger may choose to risk up to, but not more than,$1000 on each trading signal.
4.Fixed Percent of Equity - In this technique, traders define what percent of the account valueto risk on any trading signal. For example, a money manger may choose to risk up to, but notmore than, 5% of the account on each trading signal.
5.Adjust Trading on Win or Loss - This technique is often called the pyramiding (up or down) orMartingale (normal or reverse) method. In this approach, traders determine how much to tradeafter successive wins or losses. For example, after a losing trade, traders may decide to doubleup on the next trading signal to recoup the losses.
6.Crossing Equity Curves - With this technique, traders define a short and a long average (3 and8 for example) of the trade profit. When the short average is greater than the long average, itmeans that the system is doing better than it did in the past. Based on this information, traderswill enter the market. If the short average is below the long average, traders will not trade. Theprofit from all trading signals, whether taken or not, are calculated into the average.
7.Applying the Optimal f - This section goes over what the optimal f is and how to apply it as amoney management system. Many people are familiar with this approach, but it does havesome dangers to watch out for.
8.There is also a way to check for the best diversification plan across a set of instruments.
Organization of Following Sections
In the following sections, three different kinds of typical systems will be used to contrast thedifferent types of money management techniques. They all make about the same amount ofmoney when traded on a single unit/contract basis. In these examples, the trading accounts allstart with $25,000. The graphs shown below are the accounts' equity, while trading:
1.) System A - This system wins about 76% percent of the time. The risk per trade is set at $500dollars. However, this system typically has small wins. This is similar to the type of systems thattraders often develop for choppy markets or for some forms of intra-day trading.
2.) System B - This is the "typical" system. It wins about half the time. The winners are goodand the losers are OK. Often, systems that use stochastics for entry and exit will give thesekinds or results.
3.) System C - This is a typical trend following system. It has many losers and a few largewinners. This system wins about 33% of the time, but the profit on the winners is almostdouble the two systems above. The results might be similar to systems that use large movingaverage crossovers or entering the market at Fibonachi retracements.
Different money management approaches will be applied to these three systems to illustratesome of the subtleties of the different money management techniques/approaches. However, Itis important to keep in mind that the following are just examples. The intent is not to showwhich method is best, but to give the reader some insight into the different money managementapproaches, how they can effect the account, and to show the dramatic effects different typesof approaches can have on an account.
No Money Management Technique
The simplest form of money management is basically no money management.Additionally, it is the type of money management that most small investors use. In thistechnique traders buy or sell one unit/contract. No adjustments are made for other factors,such as the amount of risk per trade, the amount of money in the account, the previoussuccesses or failures, etc. This is also the type of money management that most trading system

software programs default to.
The initial account size is one of the most important considerations traders can make if theychoose to use this technique/approach. Depending on the account size, this technique can varyfrom being very dangerous to being a very safe way to approach money management. In short,the bigger the account size the better it is. When traders have small accounts, by definition,they are risking a substantial amount of the account on each trade. Many small accounts cannot handle two or three losses in a row. As a result, a small account size can dramaticallyincrease the probability of ruin for an account. (Probability of Ruin is discussed in it's ownsection later in the book.)
If the account size is large enough, there is little one can negatively say about thistechnique/approach. However, usually there is a substantial opportunity to make more moneyusing other types of money management techniques. For example, with the No MoneyManagement Technique, traders have do not have any way to regulate the risk or any methodfor compounding returns.
Here are the No Money Management Technique results for the various systems previouslyoutlined. They are provided primarily as a reference point against the other money managementtechniques and to give the reader a feel of how normal these systems are.
SYSTEM A
System InformationType : All trades Total Profit : $ 9490.00Gross Profit : $ 19460.00 Gross Loss :$ (-9970.00) Number of Trades : 45 Number of Wins : 25Percent Win : 56% Number of Losses : 19 Long Num Trades : 22 Long Number Win : 13Long-Percent Win : 59% Short Num Trades : 23 Short Number Win : 12Short-Percent Win: 52% Average Trade : $ 210.89 Average Win : $ 778.40Biggest Win : $ 1840.00 Average Loss : $ (-524.74)Biggest Loss : $ (-2445.00) Num Avg Trade : 18 Num Avg Win : 11 Num < Avg Loss : 1
Account Information:
Starting Account Value: $ 25000.00Highest Account Value: $ 37060.00Final Account Value : $ 34490.00Lowest Account Value : $ 24505.00 Starting Percent : 100%Highest Account Percent: 148%Final Percent : 138%Lowest Account Percent : 98%Worst Drawdown on a Dollar Value Basis Drawdown as Percent : -08%

Drawdown From : $ 37060.00 Drawdown Dollar Value : $(-2860.00)Drawdown To : $ 34200.00
SYSTEM B
System InformationType : All trades Total Profit : $ 5315.00Gross Profit : $ 18565.00 Gross Loss : $ (-13250.00) Number of Trades : 41 Number of Wins : 19Percent Win : 46% Number of Losses : 22 Long Num Trades : 19 Long Number Win : 13 Long-Percent Win : 68% Short Num Trades : 22 Short Number Win : 6Short-Percent Win: 27%Average Trade : $ 129.63Average Win : $ 977.11Biggest Win : $ 3500.00 Average Loss : $ (-602.27)Biggest Loss : $ (-2050.00) Num Avg Trade : 36 Num Avg Win : 19 Num < Avg Loss : 7
Account Information Starting Account Value: $ 25000.00Highest Account Value : $ 30315.00Final Account Value : $ 30315.00Lowest Account Value : $ 20575.00 Starting Percent : 100%Highest Account Percent: 121% Final Percent : 121% Lowest Account Percent : 82%Worst Drawdown on a Dollar Value BasisDrawdown as Percent : -18%Drawdown From : $ 29280.00 Drawdown Dollar Value : $ (-5200.00)Drawdown To : $ 24080.00
SYSTEM C
System Information Type : All trades Total Profit : $ 6847.00Gross Profit : $ 20917.00 Gross Loss : $ (-14070.00)Number of Trades : 41Number of Wins : 12Percent Win : 29%
Dumber of Losses : 29 Long Num Trades : 19 Long Number Win : 8Long-Percent Win : 42%
Short Num Trades : 22 Short Number Win : 4Short-Percent Win: 18% Average Trade : $ 167.00 Average Win : $ 1743.08Biggest Win : $ 3500.00 Average Loss : $ (-485.17)Biggest Loss : $ (-1200.00) Num Avg Trade : 47 Num Avg Win : 25 Num < Avg Loss : 25
Account InformationStarting Account Value: $ 25000.00Highest Account Value : $ 32447.00 Final Account Value : $ 31847.00Lowest Account Value : $ 23900.00 Starting Percent : 100%Highest Account Percent: 130%Final Percent : 127%Lowest Account Percent : 96%Worst Drawdown on a Dollar Value BasisDrawdown as Percent : -20%Drawdown From : $ 32110.00Drawdown Dollar Value : $ (-6410.00)Drawdown To : $ 25700.00
Multiple Units/Contracts Technique
This form of money management is almost identical to the No Money Management Techniquedescribed above. In terms of directions to your broker, it would only be the difference betweenbuying or selling additional units/contracts at the same time, on the same trading signal.As mentioned before, doubling or tripling the amounts risked can have a non-linear effect on theaccount in terms of the probability of ruin, plus other factors. Therefore, if you are consideringthis technique/approach, it is best to run your trading system through a number of scenariosusing the kNOW Software, to determine how it might be effected.
One of the concerns with increasing the number of units/contracts taken is the drawdown. Onthe positive side, the profit increases are in a linear fashion. Therefore, in this respect, it is easyto estimate. On the negative side, the drawdown also increases in a linear fashion. If tradersusing this approach want to increase profits, they do so at the expense of increased drawdown.The point is, that although this may be an effective method for increasing the profitability of atrading system, it is frequently not the most effective way for controlling the drawdown. Whatmany traders fail to account for is how bad drawdowns can effect their overall track record. Iftraders have any hopes of becoming professional money managers, and many do, keeping thedrawdown to a minimum is one of the most important considerations, of any trading system.Often when investors, especially institutional investors, are looking for fund managers, having alow drawdown is more valuable/important than high returns. This may not be a concern for allthe readers. However, to the extent that good money management is planning for the future, itis important to consider one's potential long long-term goals. You can't erase a track record orget money back after losing it.
Risking a Fixed Dollar Value for Each Opportunity Technique
Another money management technique/approach often used on the markets is to risk a fixedamount of equity on each trading signal/opportunity. This technique allows one to efficientlyplay the odds associated with the percentage of wins and losses in the account. For example, iftraders started with a $25,000 dollar account, they could decide to risk $1000 on each

opportunity. Traders would then take as many units/contracts necessary, to come as close aspossible to a $1000 risk for that particular opportunity, without exceeding the desired risk. If atrading opportunity has a $1000 risk then they would only take one unit/contract. If anothertrading opportunity has a $500 dollar risk then two units/contracts could be taken. If a tradingopportunity has a $750 dollar risk then traders would only take one unit/contract. If there wasa $1500 dollar risk then the trade would be skipped completely.
This approach will give traders the confidence of knowing they will have a minimum of twenty-five trades in which to let their system "do it's stuff". This can be advantageous for some trendfollowing systems that may only win 30% of the time. Additionally, using the values for howmuch to risk per trade and knowing the percentage of wins and losses can allow traders togenerally predict the potential drawdown to their accounts. For example, if traders have asystem that wins 50% of the time it would not be unusual for that system to have four or fivelosses in a row, given enough trades. Knowing this, will give the traders a reasonableexpectation of losing at least $4,000-$5,000 in a run.
It is important to note that this type of money management technique may be filtering thetrading system. In the previous example given, the traders would only risk $1000 per trade andif a signal were given that has a risk of $1500,then the trade would be skipped. This may seemlike blasphemy to system traders that know they should take every signal. In a sense they areright. As discussed above:
As the number of trades increases:
1.The total profit (real-time results) from a system will get closer to the expected profit as apercentage.
2.The total profit (real-time results) from a system will get farther from the expected profit asan actual number.
What this means is, that by skipping this trade, traders will be farther from the expected profit,as a percentage. Is this bad? Maybe? However, if the traders continue trading, the effect ofskipping a trade diminishes.
OK, so much for statistics. It is not always reasonable to let the desire to be in every trade forceone into a trade that may be a large loss, which in turn greatly increases the size of the averageloss. (The average loss value correlates directly with the probability of ruining an account).Filtering out some trades based upon trading signals derived from money managementconcerns, can be justified. However, in order to do so, it is necessary to have a large enoughnumber of examples in the test set, (after the big ones have been filtered out), to give a validsample/results.
This technique also allows traders to get more leverage out of their trading signals with asmaller amount of risk, by allowing them to take multiple units/contracts. Signals that have asmaller risk can be entered with more units/contracts than signals with larger risk. This allowstraders to get more "bang for their buck". In other words, this allows traders to make moremoney out of the same type of market move, utilizing signals that have a smaller risk. In thissense, the traders have managed to put a limit on the possible losses, while leaving thepotential for profits unlimited.
A few money managers use this technique/approach with success. It generally allows for a veryclean and easy way to calculate the potential risk that is involved. Consider the followingtrading system: it wins 50% of the time and the risk is $1000 per trading signal. Since we knowthat in a 50% system, there is about a 1% chance of getting seven losses in a row, astutetraders can expect the worst drawdown to be about $7,000. It is very convenient to be able toquantify the worst potential drawdown prior to trading real time. If for no other reason than itallows one to be mentally prepared to lose the money.
However, there are two main drawbacks to this technique:

1.This money management technique/approach filters the trades in a system to keep thembelow a certain risk value. As described above, this approach may change the percent ofwinners and other statistics about a system. This in turn can effect the results of the system.Traders
should have a good idea of what kinds of risk to expect, before employing their systems. If thethreshold for risk is very low, this money management technique/approach could effectivelyscreen out most, or all of the trades. This is undesirable for several reasons. Firstly, it isassumed you have developed a reliable trading system otherwise you wouldn't be worried aboutmoney management. If this is the case, it is generally not a good idea to introduce anyadditional filters to a good system. The less curve fitting the better. On the other hand, a littlefiltering of the most volatile trades can help stabilize the equity growth of an account.
2.The second drawback of this money management technique/method is the fact it is notresponsive to the size of the trading account. If the trading account doubles or halves in size,the amount of money to risk, which was determined at the beginning of trading, may not beappropriate or commensurate with the new account size. In these situations, it will benecessary to decide on a new amount of money to risk on each trade. But, if this is done, it mayeffect the percentage of winners and losers. Therefore, it will be necessary to re-characterizethe trading system/money management combination to insure it is still acceptable and workingproperly. It is very possible to have a trading system that performs poorly for trades that have arisk of less than $1000, performs well for trades that have a risk between $1000 to $2000 andagain does poorly on trades with a risk above $2000. In this case, if the system iswere not doingwell, it would do more harm than good to filter the trades for the reduced risk of $1000. On theother hand, if the account is doing well, increasing the risk may not be beneficial either.
The following is a table showing the profit and drawdown for different values that are used forthis system:
SYSTEM A
System A, as previously mentioned, is a high probability system designed to limit the risk to$500. (This system was actually developed using TradeStation . A trailing stop of $500 dollarswas used to insure the risk was not above $500.) With this in mind, it is clear why the profitover drawdown numbers level out after more than $500 is risked per trade, at a value of 3.32.An interesting fact about this system is that although the risk was locked at $500, there weremany trades that experienced a loss greater than $500. The reason for this is that the particularmarket used for the development of this system was not particularly liquid. As a result, therewere several trades that were exited when the market gapped on the open and the trade wasexited with a larger loss than expected. Steps can be taken to minimize these types of problems,but this will be addressed in a later section of this book.
It is also important to note that the drawdown to the account creeps up, as more money isrisked.
SYSTEM B
This system made $5,315 using no money management with a drawdown of 20%. Assumingtraders risked $750 per trade, applying this approach would allow them to increase theprofitability of the system by about 50%, while only increasing the drawdown by 10%, overall.This is a substantial improvement.System B illustrates what is typical of most systems, schizophrenia. If traders want the bestprofit to drawdown ratio (1.24 profit/drawdown), they should decided to risk $750 per tradingsignal. On the other hand, if the traders want to achieve a higher profit ($21,075), the most

reasonable choice is to risk $2,500 per trading signal, assuming they only want to keep thedrawdown under a whopping 70%. (Alternatively, traders could risk $1,500 per trade, since thepercent of drawdown to the account is equally bad for the values achieved at both a $2,500 and$1,500 risk.)
SYSTEM C
System C is the trending system with a low percentage of winners. This system made $6,847when using no money management, on a drawdown of 20%. Assuming traders risked $750 pertrade, applying this approach will allow them to increase the profitability of the system byapproximately 50%, while only increasing the drawdown by 20%. This is another substantialimprovement. This example is similar to System B in its schizophrenic nature. To achieve the best profit todrawdown ratio, traders should only risk $750 per trade. However, to achieve the best profit,one needs to drop to the bottom of the table and risk $4,500 per trade to make $50,963.
Risking a Fixed Percentage of Equity on Each Opportunity Technique
The main disadvantage of the previously described techniques/approach, is that it will not allowtraders to compound the winnings and/or decrease the risk in bad times. A way to compensatefor this is to only risk a certain percentage of the account value for each opportunity. Thistechnique allows traders to increase or reduce the risk as the account grows or shrinks.
With this technique/method, traders decide on a fixed percentage of the account to risk on eachtrading signal. For example, they may decide to risk exactly 10% on each opportunity. Once thisis established, they would take that percentage of the current account value and only risk up tothat amount on the trade. For example, if traders have a $25,000 account, on the first tradethey would risk only $2,500 on this opportunity. On the next trading signal, the traders wouldrecalculate the total equity for their account and then risk exactly 10% of the new accountvalue, and so on.
Please note that traders will only risk up to, but not over this amount on any tradingopportunity. (If a trade has a potential $2,500 risk then they would only take a oneunit/contract position. If a trade only has a $1,250 dollar risk then they would take twounits/contracts. If the trade has a potential $2000 risk then the traders would only take a oneunit/contract position. If the trade has a potential $3,000 dollar risk then the trade would beskipped.)
This approach can do wonderful things for an account by compounding the profits of theaccount. Other methods often need to be reworked when the account size grows, but thismethod automatically readjusts with each trade. This can be a real administrative advantage totraders.
On the other hand, during down periods, it will slowly reduce the dollar value of the trades. Thisfeature automatically protects traders from being wiped out after a long series of losses. Thefollowing table shows how an account would react after a given number of losses, using thismethod:
The following represents an example on how to use this table. Assume that traders using aspecific system lose seven trades in a row. If the traders always risked 10% of their account,after seven losing trades in a row, they could expect to have 48% of the original account size.After fourteen losses in a row, these traders would still have 23% of the original account size.This is a pretty good example of how this method can help save traders when they are

experiencing a long string of losses.
But this is only half of the story. Although it takes seven losing trades to move the accountdown to 48% of it's original size, it takes nine winning trades to get it back up to it's originalsize. This is a well-known phenomena in many sales and marketing circles. Good sales andmarketing executives are aware that if they cut prices on their products by 25%, then theymust increase sales by 33%, just to get back to even again. This can create an uphill battle forsome systems that will have to win more times than they lose, to recoup the money that waslost. On the other hand, this may not be an issue. If you are using a statistically winning system,sooner or later you should get back to where you were before the string of losses.
The following table shows how many trades it would take to lose 50% of the account and thenumber of trades necessary to build the account back up again to where it was, before thelosses.
As you can see from the table, it will always take more wins than losses to get the account backto the original size, after losing a portion of the account.
Another disadvantage of this approach is that it can be hard for traders to calculate. This isespecially true for day traders. It is often inconvenient for traders to figure out the results of thelast trade, adjust the account value and figure out what the correct amount is for the nexttrade. Of course, if the traders are fairly automated, it may be possible to keep all this data in aspreadsheet and quickly and easily calculate it out.
Since this technique allows traders to risk up to, but not over the allotted percentage, thismoney management approach may have the effect of filtering out some high-risk trades. Thismay or may not be favorable to traders. However, for the most part, it should be considered anadvantage for the same reasons discussed in the "Risking A Fixed Dollar Value for EachOpportunity" section.
An important result of the "risk up to, but not over" condition is that the growth to the accountwill not always be linear in regards to the percent of the account risked. In the followingexamples you will see that the growth of the account is linear in one example and non-linear inthe other two. This highlights the necessity for traders to look over the different scenarios tofind the best fit.
SYSTEM A -
System A is the system with the highest percentage of winners. This system made $9,490 whenusing no money management on a drawdown of 8%. If traders are willing to accept adrawdown of 22%, they could almost double the profitability of the system from $9,490 to$17,145.
Once again we see that you can't have your cake and eat it too. If profitability is the traders'goal, they will need to risk 12% of the account on each signal. If this is the case, they couldmake $60,470 using this approach but with a 63% draw- down. On the other hand, sometraders may prefer to maximize their profit to drawdown ratio. If that is the case, the traderswill need to risk only 4% of the account to make $17,145, with a 22% maximum drawdown.
SYSTEM B - 53% Winning Average System
System B is the "normal" system, with about 50% winners. It made $5,315 when using nomoney management, on a drawdown of 20%. Applying this technique of money management tothis trading system did very little to improve it. The profitability of the trading system was

doubled but the drawdown also increased substantially.It is also interesting to point out that using this money management technique with thisparticular system, had a very distinct peak, with low values to either side. This kind of formationcan suggest that there is some instability for this combination. Generally, traders should steeraway from systems that act in a similar way, since the results may not be predictable.
SYSTEM C - 35% Winning Trend Following System
System C is the trending system with a low percentage of winners. This system made $6,847when using no money management, on a drawdown of 20%. As you can see from the tableabove, there was no combination that would be worth taking. It would be better to trade thissystem using no money management, rather trying this technique/approach.
In conclusion, different systems seem to respond differently to this money managementtechnique/approach. It is wise to do testing on your system before implementing this type ofmoney management. For the right system it can increase the profitability of the system andprotect the trader from losing periods. On the other hand, with the wrong system, it can beworse than no money management at all.
Adjust Trading on a Win or Loss Technique
This type of trading goes by several different names: Pyramiding (up and down) and Martingale(normal and reverse). Basically it consist of varying the number of units/contracts taken, basedupon the results of the last trade. For example, traders can choose to double up on a positionafter a losing trade in hopes of recouping losses or doubling up only after a winning trade tomaximize the system's potential. This can be a very effective money managementtechnique/strategy. However, it will only work correctly for some systems. Many traders try thisapproach in testing and get very successful results, only to have their systems fall apart in realtime. In order to effectively employ this technique, it is necessary to know the Z-score of thetrading system. (The Z-score is discussed later in this book, with specific applications to thisform of money management.) Basically, the Z-score will tell traders if there is a dependence orrelationship between winning and losing trades. For example, what is the statistical evidencethat winning trades follow losing trades and vice a versa. Knowing the dependency betweensubsequent trades, (Z-score), gives traders the information on how to exploit their tradingsystems correctly. Without this information, traders are unable to accurately gauge theappropriate risk for the next trade, using this money management technique. It is veryimportant to understand the Z-score and the Confidence limit of a system before applying thistechnique/approach. Please read the sections on Z-scores and Confidence limits, before usingthis approach.
This technique of money management can do wonders for a system that meets the Z-scorerequirements. The main strength of this technique is that it allows traders to maximize the riskreward ratio on high probability opportunities, while reducing the risk on low probabilitysituations. The result is that a trading account can grow substantially faster, without increasingthe over all risk to it.
There are two ways the trades in a system can be dependent on each other:
1.There are trading systems that tend to have wins and losses in runs. Under thesecircumstances, traders would want to implement strategies where after a wining trade; theywould double up on the next trade and decrease the exposure after a loss.
2.On the other hand, there are trading systems that tend to flip flop between wins and lossesand thus have fewer runs than one would expect. Under these circumstances, traders wouldwant to double up after losing trades and cut back after wins.

Another advantage of this type of money management technique/approach is that it isrelatively easy to implement in real time. Once traders are aware of the desired pyramidingtechnique to use, it is easy for them to know exactly how many positions to take on the nexttrade, based on the results of the last trade.
The major disadvantage of this money management technique/approach is that it is verysensitive to optimization, especially if the Z-score and Confidence limits are not high enough.Traders must be very careful not to over optimize the system/technique. Consider the followingresults:
Pyramiding Schemes Applied to System B
The table above shows wide variability of the results. With strict application of the Z-score andConfidence limits, traders can easily achieve very reliable results, plus large increases in profitand low drawdowns, using this money management technique/ approach. See the section on Z-scores and Confidence limits for more details on how to use this money management technique.
The table above shows some common pyramiding techniques, such as pyramiding up or downon wins or loses. Example A has no pyramiding and is shown just as the base number. ExampleB is pyramiding up on losses, while example C is pyramiding down on losses. The rest of thetable goes over other different possibilities for pyramiding.Example H looks particularly interesting for this trading system. In example H, the appliedtechnique has traders reducing their exposure after successive wins. Applying this methodallows traders to triple the profit for their account, while reducing the drawdown. Othermethods didn't work as well, but still allowed them to make additional profit.
As one can see, the particular scheme that traders take can have significant effects on theprofitability of their accounts. In fact, this technique has the ability to transform a losing systeminto a winning system. However, just as easily, it can change a winning system into a losingone. It is the wide variability in the results that makes this money managementtechnique/approach very sensitive to optimization. Traders can easily select values that seem tomake good profit only to find that their systems lose money in real time. The reason for the lossis that often the real time wins and losses come in a slightly different order. Since this neworder (win/loss sequence) is different than the order in the historical results tested, the moneymanagement technique used is not well prepared for the future. This is the major reason why itis important to know the Z-score for any trading system used. The Z-score will give you thestatistical basis to justify using this method and, as a result, the future performance of thesystem will be more consistent with the historical results.
A drawback to this approach is that traders will periodically have to re-evaluate the moneymanagement technique, as the account grows. The number of units/contracts taken on pasttrades would not be appropriate if the size of the account had doubled in size. For this reasontraders will have to set profit goals and then re-evaluate the money managementtechnique/approach once these goals are reached.
Crossing Equity Curves Technique
Using crossing equity curves for money management can be an excellent technique/method totrade an account. Often this technique can minimize the drawdown periods better than anyother methodology. Additionally, when properly applied, this technique can actually improve thepercentage of winning trades taken.
Many traders are familiar with using moving averages to decide when to enter the market.Almost every charting software package has this feature. Usually, traders will use two movingaverages and enter the market when the short moving average crosses the larger moving

average. Traders would enter a long position when the short average crosses from below toabove the longer moving average, and vice a versa for a short position.
This form of money management technique/approach is similar to the trading technique ofusing moving averages. First, you decide on a long and short moving average. This is an averageof the profit of all the trades. The shorter average is an average of the profit (or loss) of themost recent trades. The longer average is an average of a lager block of the most recent trades.When the short average is greater than the long average, it means the trading system is doingbetter per trade than it has done in the immediate past. If the short average is less than thelong average, it means the trading system is doing worse now than it did in the immediate past,on a per trade basis.Consider the following example. Note how the shorter average is sometimes above or below thelonger average:
Trade # Profit1 $ 5002 $1,2003 ($1,000)4 ($ -500)5 ($ -500)6 $ 5007 $ 5008 ($ -350)9 ($ -500)10 $ 2511 ($ -200)12 $ 20013 $ 56014 $2,13515 $ 750
When using this form of money management, traders would only enter a position in the marketwhen the short average is above the long average. This is noted in the graph by the arrows. Iftraders got a trading signal and the short average was below the long average, they would skipthat particular trade. However, for the purpose of calculations, all the trading signals and theirresults will need to be tracked. The averages are for all of the signals generated, not just thetrades that where taken.
It is reasoned that this strategy will help keep traders out of long drawdown periods.Additionally, traders will only be trading the system when it is "in sync" with the markets.Numerous results show this to be true. Often, traders can achieve equal or greater profit, withless drawdown, on fewer trades. The fact that a higher profit is achieved on fewer trades is anespecially attractive bonus. Fewer trades result in fewer fixed costs and less exposure to themarket.
The basic assumption is that there are "phases" when a trading system does better or worse.This is true in many cases. However in other cases, what traders perceive as phases, are simplystatistical consequences of the percentage of wins or losses of a system. As mentionedrepeatedly though out this book, a 50% system has a very high chance of getting several winsor losses in a row. These runs may be perceived by traders as being "phases", when in actualitythey are not. They are just the statistical consequences of a particular system.
In order for this type of money management technique to work effectively, it is necessary thatthere really are "phases" in the trading system. (Otherwise its just luck, that will probably runout.) Lets clarify the term "phases" to mean that wins and losses are grouped more togetherthan would be expected, according to a normal statistical distribution. For example, the winsand losses tend to come in runs. The best tool for determining if a trading system has phases isto consult the Z-score and Confidence limits for that system. (Z-scores and Confidence limits aredealt with extensively in following sections of this book. These sections will also deal withspecific applications for this from of money management.)

Although this money management technique has several substantial advantages over othermethods, there are also disadvantages to this approach:· This technique/approach can be hard to implement in real time. This can be especiallytiresome for day traders. This is not an insurmountable problem, if the traders have a fairlyautomated approach to trading. · Since it is necessary to track all the trading signals given, whether or not a position was takenin the market, traders may find themselves spending a fair amount of time tracking trades thatprovide no real equity for the them. · Many trades are necessary for both historical testing and real-time trading. Since a fairnumber of the trading signals will be filtered out, traders will need additional trades in order totrade as frequently. The real-time aspect may not be necessary for some traders since they maybe making more money with fewer trades. However, from a testing perspective, more trades arenecessary since some of the sample set will not be taken. It is only the trades that are takenthat a money manager can base the statistical reliability of their trading system/moneymanagement approach on.
One last concern about this technique/approach is that this method of money management canbe sensitive to optimization, especially if the system does not have a high enough Z-score.Traders may find that a 3 short and 6 long moving average combination works wonders for theiraccount. On the other hand a 4 short and 7 long combination loses money. To get anunderstanding of how sensitive to optimization a system can be, consider the followingcombinations tried on System C, the low probability trending system:
The table above shows the wide variability of the results. With strict application of the Z-scoreand Confidence limits, traders can easily achieve very reliable and favorable results, largeincreases in profit and low drawdowns using this money management technique/approach.Please see the sections on Z-scores and Confidence limits for more details on how to use thismoney management technique.
The table above shows how subtle changes in the two moving averages can dramatically effectthe profitability of a system. System C, when traded with no money management made $6,847on a 20% drawdown. If you consider examples D and E, you can see how changing from a 5period to a 6 period moving average made the profitability of the trading system range fromalmost double the profit, down to almost half of the profit, of the trading system with no moneymanagement. Examples A, B and C also illustrate the dangers of optimizing this approach. Asthe subtext under the graph states, if the Z-score is high enough, the danger of optimizing isnegligible, since you then have mathematical justification for applying this technique/approach.
On the other hand, example D shows how valuable this method can be when employedcorrectly. Under these circumstances, traders can almost double the profit from a system whilereducing the drawdown in half. Frequently you will find that this method of money managementcan increase the profit and reduce the drawdown at the same time. In the section on Z-scores,you will see how when it is properly applied to this technique/approach it quadruples the profitof the trading system. Because of it's enormous utility, this money management techniqueshould definitely be considered by all serious traders.
Optimal f Technique
For any particular system, it is possible to find the optimal amount to risk on each tradingopportunity. Trading with this optimal amount of capital will result in the greatest gain to theaccount. If traders risk either a higher or lower dollar amount, they will make less money. (This

is because a greater risk does not necessarily result in more gain. This is a good example of anon-linear force in money management.) For this reason, it is important to know what theOptimal f is for your system. If traders do not trade at the Optimal f value, they are essentiallycurbing the potential return on their trading system. However, some traders may have a desireand/or reason to do this, others may not. The Optimal f was popularized by Ralph Vince in hisbook "Portfolio Management Formulas" (Wiley 1989). Although, it was originally developed by aMr. Kelly to solve problems in the Communications Industry.
(This section deals with the money management aspects of applying the Optimal f technique. Inthe section of this book on "How to Compare Money Management Approaches", there is anotherdiscussion about the Optimal f. That section will go into detail on the mechanics of what theOptimal f is, how the Optimal f is calculated and what it will tell traders when comparingsystems.)
The Optimal f is not hard to work with. Some of the math can be confusing and the applicationof it is a bit obtuse, but the kNOW Software will do most of the work for you. When one usuallysees a graph for the Optimal f, it looks like the following:
System B - Optimal f Graph
The Optimal f is a value that is between 0 and 1. The kNOW Software displays it as apercentage. This graph shows an optimal value of about 30% or 0.30. When the account istraded at this level, the account will grow most quickly.Different points along the graph represent different amounts of profit or loss. At the peak of thegraph, traders will make the most money. If traders move equally to either side of the peak,they will make roughly the same amount of money on either side. To illustrate this point,consider the following table for different values of f.
System B Traded With Different Values For f
As you can see from the table, 30% is the optimal value. (Actually it is more like 31%, but theexample still shows the point.) Likewise, traders can see how risking more or less than thisoptimal value results in a lower return on the account. However, it is important to note that anytime traders are risking more than the optimal value, they are getting less return on theirmoney with a greater risk to their account. This can be seen from the growing drawdownnumber as you proceed down the table. It is because of this drawdown value that traders maynot want to trade their accounts at the optimal level. If you remember, System B made $5,315with an 18% drawdown. It is true that if traders are trading at the optimal level, they candouble their profit, however the drawdown is 53%! This is a very high drawdown and may beunacceptable for most traders. To combat this problem, traders may want to limit thedrawdown of an account to underless than 30%. In this case, if traders were going to use theOptimal f technique, they would have to use 15% for the f value. In this scenario, traders arelimiting the profit in order to bring the drawdown into a more reasonable number. Please keepin mind this is only an example. Some trading systems may respond much better to the Optimalf technique while others will respond worse.
If you reference the table again, you will see that it also shows another anomaly that canappear in this type of money management technique/trading. In a statistically perfect world,since we know that 31% is the optimal value, we would expect the values closest to 31% tohave more profit than values that are farther away from 31%. In the real world, this is notalways the case. If you look closely at the profit, when traders risk either 20% or 25%, you findthat 20% made more money than the 25% value. This is caused by the fact that often, for agiven value of f, this method of money management can suggest taking something like 3.2456contracts. Since this is not feasible, it is necessary to round down. The reason we round downrather than up, is because, if we round up, then we are trading at a value for f that is greaterthan what was selected. And, when we trade with greater values of f we increase the risk, butnot necessarily the return. Since the reality of trading forces us to round down, there are caseswhen the effects of the rounding are not equal. As a result of this situation, it is not uncommon

to find that 31% is the optimal value for f, but using 30% the trading system actually makesmore money historically. Moving into the future, it would be best to use 31% for actual trading,because the more trades there are in a sample, the more likely the highest profit value willconverge with the optimal value for f.
Summary of Money Management Techniques
As previously outlined, usually there is more than one way to improve a trading system withmoney management techniques. It is important to note that often it is initially very hard to tellwhich money management technique will work the best, with any specific type of tradingsystem. There are only a few clues to tell traders what works the best, such as the Z-sore andrelated methods. However, even these methods need to be thoroughly tested by traders. Theonly way traders can possibly know what works best for their trading system and their personalgoals/needs is to test out the system with all of the different money management techniquesand scenarios.Any one of the techniques can dramatically improve the profitability and reduce the drawdownfor the right trading system. For the wrong trading system, it can have the opposite effect. Atthe time of this writing, little research has been done to correlate the different types of tradingsystems with particular money management techniques/approaches. The authors are planningon doing more research into this subject area but in the meantime it is up to the users of thekNOW Program to thoroughly test their own trading systems to determine what works best.This is a good example of how much more knowledge is needed to be acquired about using ourmoney wisely and the arcane subject of money management.
Using Optimizations
This section will be brief, since most experienced traders either know or ignore thefacts about optimization.
For most of the different money management techniques discussed, it is possible to find theoptimal values. For example, X% is the perfect percentage of the account to risk on eachtrading opportunity or X and Y are the perfect values for using a crossing equity curve approachto money management. Knowing these different values is important to traders. However, fartoo many traders expect their systems to perform the same in the future as they do in the"optimal" past. This just isn't the case.
Optimal values are important because they give traders an idea of about where they need to be,but they are poor indicators of the future. The best way to determine the success of a particulartechnique/approach is to try it out on several different data sets.When traders are looking to pick the best value for a particular money management technique,it is best to look at all the values around the optimal value and select the one that is most in themiddle, of the good values. Consider the following table:
Value Profit1 $ 1002 $ 1503 $ 2004 $ 3005 $ 5006 $1,7007 $1,2008 $1,5009 $1,30010 $2,00011 $ 40012 $ 600
In the table above, it is clear that the optimal value is 10 ($2000). However, if one considers the

other good values in this area, values 6 through 9 are also worthwhile. Under thesecircumstances, traders will have more reliable results if they use 8 as the value in real-timetrading. It is not the optimal value, but it will offer the most security in terms of the variably ofthe results.
This method of selecting an optimal value should not be used in lieu of doing testing onadditional data sets, but it can direct traders to the most secure value to use. (The only exception to this is probably the Optimal f value. Please consult that section of thisbook in order to determine how to pick the optimal value for f.)
Before Comparing Management Approaches, Know What You Want
Many of us have heard the joke, "You want to lose 10 pounds of ugly fat? Cut your head off." Ina strange way, this kind of thought process applies to money management. There is an aspectto money management that is not something you can think about, it is something that you feelabout. This section has a lot to say about values, but nothing about numbers, trades orstatistics. Additionally, we will only discuss profits in terms of happiness and peace of mind.
Before a person can really dive into selecting the correct money management approach, thereare a couple of steps that need to be completed.
· Establish your investment goals and limits. · Develop realistic expectations for your trading system and money management combination. · Reconcile the two.
The vast majority of this book and software deal with steps two and three. This is the onlychapter that deals with step one. It seems reasonable to expect most traders to read throughthis chapter academically and never take the ten minutes that are necessary to evaluate whatthey really want in a system. The exercises below are designed to move this chapter from anacademic curiosity into reality.Far too many traders use money management methods they are barely familiar with. Far fewertraders use money management methods they are comfortable with. Fewer still are the peoplewho are happy about the money management choices they have made. This is because mosttraders very seldom or never, make choices about money management or what they want.Knowing your own personal limits is the first step in picking what is right for you. It is also themost powerful tool for doing what is right for both you and your trading account.
Let's take a little different approach to explaining why it is important to identify your limits inadvance. Have you ever seen a friend lose all their money trading, all of it, including theirhouse? It has to be one of the most sobering and scary things to watch. The main reason peoplefall into these traps is because they have not set up the boundaries necessary to effectivelymanage their money. (Of course, there are other reasons also.) The reason traders puts in stoploss orders is to protect the capital in their accounts. Why not have the same mechanisms forthe total account. For example, "If I lose $XXX, then I quit."
On the positive side, "When I make "$XXX, then I will take $XXX out of the account to buy anew sports car." The horror story above was meant to scare casual traders, but fear of thenegative repercussions is only one reason to go through this exercise. On the other hand, thereare many very positive reasons to make these kinds of decisions in advance. Making these kindsof decisions in advance can relieve the anxiety for traders. Additionally, these kinds of goals cankeep traders focused on the markets and their accounts in a positive way.
As final thoughts, keep in mind two things:
You will probably never find a perfect system. (A system that is more reliable than the US postoffice, makes a fantastic profit and is easy to trade.) You probably will find a good system, or atleast, an OK system. Many very successful money mangers are successful because they knowhow to effectively use a couple of OK systems. In short, try to have realistic expectations.The best traders in the world are the ones having the most fun. The best money management

technique/system is the one that gives traders the greatest peace of mind. It is important tomake money, but you are only on this planet once.
Please give some thought to the following questions and please take the time to enter yourresponses. This is a simple but very important exercise.
What is your profit goal for your trading account?
______________________________________________________________________________________________________________________________________________________________________________________________________________________________________________________________________________________________________________________________________________________________________________________________________________________________________________________________________________________________________
How quickly do you want to achieve this goal?
__________________________________________________________________________________________________________________________________________________________________
How much are you comfortable losing on one trade?
__________________________________________________________________________________________________________________________________________________________________
How much of your trading account are you comfortable losing, before you stop?
__________________________________________________________________________________________________________________________________________________________________
Do you ever intend to be a professional money manger?
__________________________________________________________________________________________________________________________________________________________________
If so, what professional risk/reward goals do you have?
_____________________________________________________________________________________________________________________________________________________________________________________________________________________________________________________________________________________________________________________________________________________________________________________________________________________
It would be wise to revisit this chapter after you have had an opportunity to look at the effectsof the different money management techniques/methods on your trading account.
With clear and stated goals, you are ready to Compare Money Management Approaches.

How to Compare Money Management Approaches
The previous sections have spoken about different kinds of money management techniques andapproaches and how they can effect the results of a trading account. This section discusses some of the ways for analyzing these results, with the aim of givingtraders the methods to select the best approach. It also discusses some of the hazards of usinga particular type of analysis, so traders may avoid common mistakes when deciding on aparticular system.
In addition to helping traders pick the best money management technique(s), these methodswork equally well in helping traders decided on which trading system to use. These methodsinclude comparing results on the basis of:
1.The total profit 2.The drawdown 3.The profit / margin ratio 4.The profit / drawdown ratio 5.The profit / time ratio 6.The percentage of winners 7.Z-score and Confidence limits 8.The Optimal f 9.The probability of ruin
Each of these methods can give the user a little different perspective on the results of a tradingsystem and/or money management technique. On the flip side, each of these methods also haslimitations. In all likelihood, traders will find it necessary to use several of these methods to findthe technique that works best.
It is probably important at this stage to define the word "best." The problem is that "best" hastwo definitions:
1.It is the highest reward to risk ratio. The optimal asset allocation where capital grows thefastest with the smallest amount of risk.
2.It is the method that maximizes profit within levels of risk that are acceptable to traders.
These two definitions are not always compatible with each other. The optimal risk/reward ratiomay have too much risk involved for small traders/investors. For example, traders may find bydoing the Optimal f analysis, they should risk 25% of their account for the fastest equitygrowth. However, this may put them in a position where the probability of ruin is high enoughto warrant concern. In cases like this, traders would have to choose a non-optimal value thatcorresponds to an acceptable amount of risk.With this in mind, definition number two becomes our working definition. It is theseconddefinition of how the word "best" is used through out this section.
Comparing Results on the Basis of Total Profit:
Total profit is often the most intuitive way to compare results. If you were offered either a ten-dollar bill or a twenty-dollar bill, you would probably pick the twenty. The same applies tosystems. Knowing that trading system X made $10,000 profit and trading system Y made$20,000, most traders would choose system Y.
Profit data is the easiest data to get on a system. It is important to remember to addcommissions and slippage to your calculations. Many novice system developers will omit orunderestimate commissions and slippage. For example, if a system trades 100 times and earns a$5,000 profit, if commission and slippage ($75 per trade) are added to the equation, the systemactually loses $2,500. It is also important to note that while commissions may be similar fordifferent commodities, the chance of getting a bad fill is not. Traders should account for largerslippage in markets that have a low volume or are fast moving markets. This is particularly true

for traders that do spreads. They can get caught in the low volume period of the forwardcontract when entering and the low volume period of the near contract while exiting. Theslippage values should also include some "insurance" for the possibility of being caught in agapping or limit move.Only when all of these costs are calculated into the equation should traders begin to considerevaluating the profitability of a system.
Evaluating trading systems on the basis of total profit can be valuable, but since most highreturn systems include a large amount of risk, it can expose the traders' accounts tounacceptable losses. For some traders a 50% drawdown may be OK, for others it's not. Largedrawdowns can effect ones account, mental health and track record. It is possible to have ahighly profitable system without large drawdowns. But as a general rule, systems achievegreater profit at the expense of greater risk.
Also, comparing results on the basis of total profit doesn't tell traders many things. Forexample, traders would have no idea how the margin was allocated, how efficient the systemwas in terms of time in the market, etc. These kinds of factors can play heavily into the viabilityof a trading system. So, in this respect, evaluating a trading system on the basis of profit istaking a very narrow perspective on that system.
It is impossible not to be concerned or look at the profitability of various systems. After all,that's why people trade, to make a profit. On the other hand, many traders should do more todown play this method of analysis, since there are many important things it does not tell themabout their systems. Analysis on the basis of profit is a valuable tool only when it is combinedwith other methods and should not be trusted as the sole form of analysis.
Comparing Techniques for the Smallest Drawdown (Smoothest Equity Curve)
As most traders know, the markets are run by Murphy... As Murphy would have it, almost everysystem runs into its drawdown period shortly after its inception. For traders that have littleexperience with drawdowns, comparing trading systems on the basis of the smallest drawdownmight be the superior method for selecting a system that works best with the their personality.(Often margin is added to this figure because it represents the total capital necessary to trade asystem. However, adding margin into the total equation does not reflect the actual amount thetraders might lose.)
The drawdown period for a system is the largest drop in account equity from a peak in theaccount to a valley. The drawdown period can span across winning periods, to connect largelosing periods, to form a large account decline. There are two forms of drawdowns. Neither oneis the "correct" form, but traders will find they are usually pulled to one or the other.
1.Largest drop in equity, in terms or percent. 2.Largest drop in equity, in terms of dollars.
The following graph shows an example of how these different kinds of drawdowns can appearat different times, in a trading system's life:
These two types of drawdowns appeal to different types of traders. What primarily separatesthese two types of traders are their professional goals. Traders interested in becoming fundmanagers, or other types of trading professionals, would be wise to limit their drawdowns toaround 20%. Most successful professional traders have less than a 30% drawdown. Funds thathave large drawdowns tend to scare off investors. For institutional clients of a fund, consistencyof results can often supersede the return of an account in importance. Additionally, it's badpress. The drawdown is frequently calculated when magazines are comparing different fundmanagers.
For traders who do not intend to be money managers, the maximum dollar value of the
drawdown becomes more a thing of personal taste. What are you willing to bear? (No punintended.) Some investors are willing to risk a large percentage of their expendable capital ontrading, while others are only trying to get a good return on their capital. In either case, it's apersonal decision. Systems analysis on the basis of the smallest drawdown can be very important to traders foranother reason, mental peace. It is easier to stick to a system that does not have large losingperiods. Many traders fail because they do not stick to a well-tested system. Having a systemwith small drawdown periods can make it easier to stay with the system during the hard times.
The only real disadvantage for evaluating trading systems on the basis of drawdowns, is profit.Often limiting drawdowns means limiting the risk. Limited risk usually translates into limitedprofit. Contrary to popular belief, it is OK to limit the profitability of a system. Often,professional traders limit the risk to their accounts and forgo potential profits at the expense ofassured consistency. There sometimes seems to be this testosterone/ego thing about havingthe most profitable system. The same thing applies to people who like to dive off high placesinto water. It is good for getting an adrenaline rush or a "Wow" from the audience, but wouldn'tyou rather let someone else do it, while retiring to your hot tub? To pull together this analogy, itis often more comfortable to grow an account slowly and safely than to take the large risksneeded to achieve maximum account growth.
Comparing the Profit/Margin Ratio
Using a profit/margin model to evaluate systems is often the technique used by advertisers oftrading systems, when stating profit results. This usually is not the best or the most accurateway to represent systems. Since, as stated above, many of the high yield trading systems havelarge drawdown periods, thus making the entire system unacceptable to most traders. Thesame system, being analyzed by this method might seem impossible to pass up, since amargin/profit ratio usually looks pretty good. Who wants to turn down a system returning300%? Often commercial trading systems of this type are targeted for a particular commodity;hence, the results can be skewed by the margin requirements for that particular commodity. Atrading system making the same profit in the S&P 500 as in Soybeans, would look better inSoybeans due to the lower margin requirements. This combination of facts can frequently makethe profit/margin ratio a misleading number.
Despite what was said above, comparing systems on the basis of the profit/margin ratio doeshave some utility to traders. It can help them to know if the capital in their account is beingleveraged correctly. Simply put, the margin required to enter a particular trade is capital thatcannot be used to enter new opportunities. This money could be used as margin in othersystems or as risk capital for new entry signals. Analyzing different systems on the basis of theprofit/margin ratio allows traders to maximize the utility of the capital in their accounts. Giventhat a trading system will earn the same amount in two different commodities, it is reasonableto trade the commodity with the smallest margin requirement. This approach will allow tradersto enter more trades and/or for each trade put on more units/contracts than they might havebeen able to do trading the instrument with the larger margin requirements.
Of course, developing strategies that limit the commitments to margin, may not be suitable forall traders. For professional money managers, margin is usually of little concern, since only afraction of the account is being risked at any one time. In cases like this, it is not necessary forthe money mangers to maximize the utility of their margin capital. In fact, doing so may workagainst the traders' overall risk/reward goals by enticing them to take more trades than wouldbe feasible to meet certain risk criteria.
On the other hand, for small and aggressive traders, leveraging margin requirements may allowthem to get the best bang for their buck. To give an example, for small traders it may bepossible to take only one contract in the S&P due to the large margin requirements ($12,000+or -), with a potential reward of $3,500 for the trade. If these traders considered other markets,for example the Canadian dollar ($400+ or - required margin), they may be able to enter thirtytimes as many contracts. Each contract may have the potential to make only $250, but whenyou add them all up, you would still make more money than trading just one S&P contract.

Overall, this method of analysis may have some utility to traders, but it is important toremember the things it's not telling you. It says relatively little about the risk to the account anddoes not even give a clear picture on the profit of the account, since margin requirements arevery diverse. It can give a picture of how effectively the margin is being used by traders, but noteven this applies to all the traders' needs.
Comparing the Profit /Drawdown Ratio:
Evaluating a trading system based on the profit/drawdown ratio is perhaps the most useful wayto compare two systems. It gives traders a solid base to compare different systems bystandardizing the risk reward aspects of different trading systems/money managementtechniques. This standard is easily compared across both trading systems and commodities.Additionally, this method gives traders a simple view of what kinds of risk to expect with certainprofit objectives. In this sense, traders can find a system that has a suitable profit/drawdownratio and begin to customize the results of the system to their needs.
Consider the following example:
This method allows traders to see that systems A, B and C all have a profit to draw down ratio of2. This is evident even though the profit, drawdown and the risk per trade are different for eachsystem. In this sense, traders can say these systems are similar, in respect to risk/rewardexpectations. Additionally, this method has the advantage of standardizing all three systemsacross two of the most important features to look for in a system, profit and drawdown.
This approach is a very powerful method for comparing trading systems to each other while stillallowing traders additional tools for optimizing a particular system. If traders also have theappropriate data on the drawdowns, it may be possible for them to scale their systems up ordown to meet the risk goals for their accounts. This can be achieved while maintaining the samerelationship between profits and drawdowns.Consider system B above, this system made $1,000 on an average risk of $50 per trade.Knowing this, traders may be able to take four times as many positions in the market for everytrading signal. In essence, doing this quadruples the traders' profits and drawdowns. Since thissystem had such a low drawdown to start with, a draw down that is four times as large, is stillreasonable. On the flip side, traders are often able to reduce a system using the same process.Traders could take half as many positions, and still maintain the same profit to drawdown ratio.Using these kinds of processes allows traders to scale their systems up or down in order tobetter accommodate their risk/reward objectives.
However, there are also some disadvantages to using this type of analysis on trading systemsand money management techniques/approaches. The most important of these is that it doesnot give traders any insight into drawdowns, in relationship to the account size. This is evidentfrom the examples above. Systems A and C have large draw downs in respect to their accountsize. It is possible traders would enter into a draw down period ($5,000) when they are justbeginning to trade their $10,000 account. This would be devastating to many traders.
When comparing trading systems on the basis of profit to drawdown it is best to comparesystems that have been traded in approximately the same time frame. If a good systemtypically experiences $10,000 of drawdowns per year and $20,000 in profits per year, thissystem has a profit to drawdown ratio of two. However, if you had two years of data, you mayfind that the system made $40,000 in profit, but still had a drawdown of $10,000. This wouldgive you a profit to drawdown ratio of four. Three years of data may give a profit to drawdownratio of six. Since the drawdown often does not grow substantially in magnitude over the years,additional years of data frequently improves the ratio value.
Analyzing a trading system on the basis of profit to drawdown can be a valuable tool forcomparing systems that have very different results. It also gives traders a convenient way to

examine how to scale a system to their particular needs. However, this method can also leavetraders in the dark when considering the drawdown to the account, since the account size is notcalculated into the formula.
Comparing the Profit/Time Ratio
Although time analysis is not common to most traders, it can be an important statistic to lookat. There are two main advantages for evaluating a system on the basis of time:
1.It allows traders to find systems that have less "global" risk, by finding systems that areexposed to the natural variability of the market less than other systems.
2.It allows traders to find systems that will use the capital in their accounts in a more efficientmanner.
When looking at the big picture, it is reasonable to say that given two equally profitable trades,the one that is in the market longer is usually exposed to additional risk. An example of thistype of risk, is the possibility of losing money due to an unexpected market phenomena such as,a gap opening of the price, a surprise weather pattern that effects the commodity or oddeconomic reports. Any one of these market phenomenas (and they happen more often than oneexpects) can quickly change a winning position into a losing position. In this sense, systemtraders will want to minimize the amount of time their system is in the market.
The risk of being exposed to the market is very hard to quantify, but it does exist as a realconcern. In this respect, minimizing this form of risk, is a part of an effective moneymanagement approach.
In addition to this, time analysis can help let traders know if they are using their funds in anefficient manner. This may not apply to all traders, but most professional traders, who have alarge amount of capital under management, can benefit form knowing how their money is beingused.
The argument here is similar to the profit /margin method of evaluating a trading system. Withthis approach it is important to note what is the average time it takes for a trade to move into aposition where it locks in the fixed costs or exits the market at a loss. A certain amount ofcapital is required to support a position until it has moved in the traders' favour, and they canlock in enough profit to cover the fixed costs (margin, risk capital, commissions, slippage and, ifnecessary, insurance from limit moves against the position). This "support capital" is moneythat cannot, or should not, be put into other opportunities, until traders have locked in a profiton their positions.
To illustrate, consider the following:
It should be fairly obvious that given the choice between these two systems, traders should usesystem B, since it is in the market half the time of system A. Assuming there are the samenumber of trades in both of these systems, system B has half the market exposure that systemA does. If system B is in the market half as much as system A, it may be possible for traders toexpand the number of commodities that are monitored by the system and enter twice as manytrades with system B than with A, and with the same account size. This approach allows tradersto expand the number of positions taken, without increasing the amount of capital that isdedicated to margin. Of course, this depends on the system. It may or may not be possible totake more signals, due to other limitations on the traders. At least in the theoretical sense,applying this kind of analysis can increase the percentage of risk capital traders have in anaccount. In real time this may or may not have an actual application for the traders.
Application of this kind of time analysis to increase the account's efficiency, will be most usefulwith systems that are expandable. By definition, expandable means a system that can be

expanded in order for traders to get additional trading signals. A good example might besystems that span over multiple commodities. This type of system may allow traders tointroduce additional trading signals to the system by using the system on additionalcommodities. In other cases, this type of analysis may not be appropriate. For example,consider traders who have specialized day trading systems for the S&P 500. These types oftraders do not have a method for getting additional valid signals, since their system iscustomized specifically for the S&P 500. Additionally, with a day trading system, the tradersmay not have enough time in a day to execute additional trading signals.
Analyzing a system for the profit/time ratio can be a valuable method if the traders have eitherlimited capital and/or the ability to increase the type of commodities they are trading. Thismethod, like the profit/margin method, will show traders, which of two similar systems willmaximize the utility of the money in their trading accounts.
This method of evaluation is especially useful if traders have a limited account size and cannottake all the signals generated by a system that monitors many commodities.
However, there are a couple things to watch out for if you use this kind of analysis:
1.This kind of analysis is not always relevant. If the difference between the average time in atrade for two systems is less than twenty percent, it is probably not necessary to worry about.(Twenty percent is a rule of thumb, and can be effected by the size of the account and the typeof trading system.)
2.In terms of optimizing the margin efficiency, make sure it is relevant to your system. Asmentioned above, if you do not have a method for increasing the number of signals, there is noway to increase the margin efficiency for your system.
One last thought, the profit over time ratio is not a static number. It can, and does, change frommonth to month. If traders see a change in the profit over time ratio, it can often be an earlysignal that the market is changing. For example, it is reasonable to see a change in the profitover time ratio when the market is changing from a trending to a choppy market.
How Important is the System's Percent Win Ratio?
In the trading systems the authors have found and used, the reliability of the winningpercentage of the system was not a major factor in selecting it over other systems. There aretrading systems that win 65% of the time and have the same profit and draw down as tradingsystems that win only 35% of the time. To some extent, given that most of the otherparameters can remain the same, choosing a high reliability versus a low reliability can be afunction of taste. Some people prefer trading systems that win frequently, others prefer to gofor the big win. Ironically, there are many traders who have good systems that take a reliableprofit by exiting the market early in a trend.These are also the same traders who often kick themselves for the rest of the trend, due exitingtoo early, even though they have a good system. Many traders tend to focus on the percentage of winners. There seems to be an assumption thatsystems that win more often make more money. In some instances this is true. However, inmany instances it is not. It is definitely not a conclusion to assume without thorough analysis ofthe system. It is the authors' experience, that most of the trading systems that traders will find,will only win approximately 50% of the time. Additionally, many money managers have systemsthat win more like 35% of the time. (Part of the reason for this is because most moneymanagers select trending systems.)What is strange is that most traders/investors know that professionals use lower probabilitysystems, but their eyes bug out and their mouths start salivating when they hear about an 85%winning system. The simple fact is, the profitability of a system is not directly related to howoften it wins.
While reliability is not a major factor in the viability of a trading system, it can have some majoreffects on the results of the system. Often times, the percentage of winning trades tells traders

much more about the potential for loss than gain. In this respect, looking at the downsidepotential for a system is important. Let's look at a trading system that has a 50% winningpercentage. The following table reflects the possible outcomes after ten trades:
Looking at this table, it is clear that traders with 50% winning systems have a 17.2% chance ofgetting seven losses or worse in a sample of ten trades. (This is calculated by adding the boldfigures together.) This level of confidence may not be acceptable to all traders, especially insituations where they have limited capital. Another way of explaining this phenomenon is thatafter ten trades, there is a 17.2% chance that a 50% wining system will appear as a 30%winning system. (In fact, there is a 75.4% chance a 50% winning system will appear to beanything but a 50% system after ten trades.) In this sense, it can become very hard to trust thevalue for the percentage of winners in any trading system.
Another issue with the percentage winning value of a system is that it can effect the worst runof a system. From a statistical point of view, the reliability of a system influences the maximumnumber of consecutive losers a system can be expected to have. The maximum number ofconsecutive losses can become relevant to traders because it is often associated with thedrawdown period of a system. To give the reader a sense about what kind of losses to expect ina row, consider the following table. It contrasts the winning percentage of a system and in turnthe probability of getting a run of losing trades in a row:
To use an example from this table, if traders have a 50% system, for any run of three trades,they will have a 12.5% (bold) chance of getting three losses in a row. This table illustrates howthe percentage of winning trades can effect the drawdown period for a system.
All things considered, this table is probably more valuable to traders mentally than to theiraccounts. It is valuable for traders to have realistic expectations of the worst run in a system. Itis often during these periods that traders feel their system has
"broken down." Unfortunately, it is during this "broken down" period that many traders give upon good systems.
Therefore, is the percentage of winners an important statistic to look at? On one hand, it canhelp traders have reasonable expectations about the performance of a system. On the otherhand, the profitability of a system is only partially linked to the reliability of winning trades. So,the truth lies some where in the middle.
Z-Scores and Confidence Limits
Looking at the percentage of winners and losers only tells part of the story when it comes totrading. This kind of analysis assumes that all the trades in a sample happened independently ofeach other. A good example of this kind of independent relationship between examples (trades)would be a coin toss. If you flip a coin, there is a 50% chance you will get heads, regardless ofthe result of the last coin toss. For independent situations, past events do not effect theprobability of current events.
The markets, however, can have a dependency between trades, where the outcomes of thetrades effect each other. For example, the fact that a system has lost on a long trade can effectthe chances of winning in the future. A good analogy of this kind of situation is most cardgames. Once a card is played, and it isn't returned to the deck, it will effect the probability ofthe other cards to be played. However, the next card to be played is still a random occurrence.In this sense the way a deck is played is both random and dependent on past events. This type

of situation can apply to trading, where past events effect the future.
Traders may find systems where the wins or losses come in streaks. Conversely, traders mayalso find that after a win they usually receive losses, or vice a versa. It is also possible to finddependency in the profitability of the trades. For example, traders may find that highlyprofitable trades are followed by low profit trades, or they may find the profitability going instreaks.
The Z-score is a statistical value that helps traders analyze the dependence between trades. TheZ-score is calculated by comparing the number of runs there are in a set of trades, with thenumber of runs that would be expected statistically. This number is then usually transformedinto another value called the Confidence limit. The Confidence limit is expressed in terms of apercentage, such as "90%." However, when the value is expressed this way, it can be a bitconfusing to laymen of statistics. We are usually conditioned to consider a 90% value as prettyreliable, but this is not the case when examining the Confidence limit. The reason for theconfusion is that unless a system has a Confidence limit of 94% or better, it is probably not avery reliable conclusion. It is possible for traders to make some valid conclusions about atrading system if the Confidence limit is 90-94%. However, usually in this range, it is morelikely the traders are only viewing a statistical anomaly, and the system does not have anyexploitable dependence.
In order to calculate the Z-score and the Confidence limits, it is necessary for traders to have atleast thirty trades in the sample. This is due to the calculations relying on the standard deviationof the system. (The Confidence limit is actually the amount of examples one would statisticallyexpect within X standard deviations. For example, one standard deviation represents the areawhere 68% of all the events will fall. If the Z-score was one then the confidence limit would be68%.)
The Confidence level is only a positive number. However, the Z-score can be either positive ornegative. Each has a slightly different meaning to traders.
1.A negative Z-score means there are fewer streaks in the sample of trades tested than wouldbe expected statistically. This means winning trades tend to follow wining trades and losingtrades tend to follow losers.
2.A positive Z-score means there are more streaks in the trading system than would beexpected. This means winning trades tend to follow losing trades and vice a versa.
If traders find a system with a reasonable Confidence level, it is possible to begin to exploit thisaspect of the system. The rest of this section will focus on two examples to demonstrate thepossible application of this type of analysis.
1.The first example trading system has a positive Z-Score. 2.The second example trading system has a negative Z-Score.
Keep in mind these are select examples. These types of calculations can be used with and/orapplied to other techniques of money management equally as well. The point of these examplesis NOT to show which is the best method, but to stimulate thinking on this subject.
Example 1 - Positive Z-Score
These are the basic results of a system before any money management method is applied.Basically it made $8,455 on a drawdown of 8%.
System Information: Total Profit : $ 8455.00Gross Profit : $ 18765.00 Gross Loss : $(-10310.00) Worst Drawdown on a Percentage Basis

Drawdown as a Percent : -08%Drawdown From : $ 36025.00Drawdown Dollar Value : $(-2860.00)Drawdown To : $ 33165.00
Number of Trades : 45 Number of Wins : 24Percent Wins : 53% Number of Losses : 21 Interdependence of trade results Z score : 2.15 Confidence Limit : 96%
As you can see from the values given, this trading system has a positive Z-score of 2.15. Thistranslates into a confidence limit of 96%. Having a positive Z-score means in this system, winstend to be followed by losses and via versa. Based on this information, it would seemreasonable to try a Martingale or pyramid money management approach to the system. Forexample, after traders experience a loss, they will take additional units/contracts on the nextsignal as a way of recouping losses and/or increasing the system's overall profitability. Thefollowing table shows a few methods associated with using this approach to moneymanagement:
As this table illustrates, application of the Z-Score can have a dramatic effect on a trading thesystem. If you would please look at example A, you will see the normal results from this system.If traders had used a Martingale method like in example B, the designated trades would havereduced the drawdown to the account by more than 50% and doubled the profit. Additionally, iftraders had used a method like in example C, they would have quadrupled the profit of thesystem, while only increasing the overall drawdown to the account by 1%. This has moved afairly average system into a very positive system.
At this point it is often easy to get trade dependence and independence mixed up and saysomething like, "If I'm doubling up on losing trades and I lose four trades in a row, that wouldbe a loss of fifteen units/contracts! What are the chances of getting four losers in a row?"
Naturally we would grab our calculators and find that for a 53% system, the odds of gettingfour losing trades in a row is approximately 11%. But this is not true. The chances of gettingfour losers in a row is less than 11% because we know there is a dependency between thetrades and that winners follow losers and losers follow winners.
In summary, a positive Z- score can easily be exploited by using a pyramiding method to correctfor losers and winners. Aggressive traders, who have a positive Z-Score for their systems, canturn this fact into cash if they apply proper money management intelligently.
Example 2 - Negative Z-Score
The following results are for a different system with no money management applied to it:
System Information: Total Profit : $ 3045.00Gross Profit : $ 17505.00Gross Loss : $ (-14460.00) Worst Drawdown on a Percentage Basis Drawdown as Percent: -22%Drawdown From: $ 28210.00 Drawdown Dollar Value: $(-6300.00)Drawdown To : $ 21910.00

Number of Trades : 41 Number of Wins : 20Percent Win : 49% Number of Losses : 21 Interdependence of trade results Z score : -2.21 Confidence limit : 97%
Basically this trading system made $3,045 on a 22% drawdown and has a negative Z-score.This means it has fewer streaks than one would statistically expect from a set of trades. (Inother words, the wins and losses tend to come in runs.) One method of maximizing thisapproach would be to use crossing equity curves to insure that the system is in the marketduring the good phases and out when it's bad. (Please reference the section of this book oncrossing equity curves for more details on this method.)
The following table illustrates the performance of a trading account using different lengths forthe moving averages, for the cross over.
As you can see from the table, this approach had a dramatic effect on the account. Consider thebolded combination above, it made $9,470 with only a 7% drawdown. This is an incredibleimprovement over the results from not using money management. ($3,045 on a 22%drawdown.) Basically, it tripled the profit of the system and reduced the drawdown by twothirds. This is effective money management! Additionally, for a system that has a good negativeZ-Score, almost any two averages will work to improve the results of a system.
For systems that have a negative Z-Score, using crossing equity curves is a natural fit for moneymanagement. The crossing equity curves technique is an approach designed especially forcatching the winning and losing waves in a system, which is what a negative Z-Score implies.Other techniques may also work as well. For example, a pyramiding method that increases therisk after a win and decreases after a loss would also work suitably.
If you have read this book in a sequential manner, then you have already been through thesections describing the "Amount Traded on a Win or Loss" and "Crossing Equity Curves". Bothsections warn traders about the pit falls of applying these two forms of money managementwhen there is a low Z-score and Confidence limit. The examples given in these sections alsoshow how the results can be extremely sensitive to optimization, if the Z-scores are too low. Ifthe examples in the other sections did have reliable Z-scores, it is reasonable to assume theywould show results similar to the ones above. The examples in the other sections of this bookare meant as a warning to traders who blindly try to exploit a trading system in this manner,without having the proper knowledge about the anomalies and characteristics of the system inquestion.
Knowing the Z-score about a trading system is one of the best things traders can do. It willallow traders to squeeze additional profit out of a system, without changing any of theparameters of the trading signals to enter the market. It is also one of the most direct waystraders can turn knowledge into money.
Optimal f
Some traders believe the Optimal f is the single best way to analyze a trading system. Othersnever use this method and do just fine without it.
When comparing the Optimal f value of two systems, all other things being equal, it is wise topick the account with the larger value. The system with the largest Optimal f value will have thepotential to grow the quickest, if the proper Optimal f money management technique/approach

is used.
The Optimal f graph is usually displayed as an arch, similar to the one shown below. The optimalvalue is the peak of the curve. This peak is usually called the Optimal f. (Other places on thegraph are usually called, "other values of f".)
In this optimal value lies the tools for growing an account the fastest. But it is necessary to gothrough a few steps before the data is truly useful to traders. To apply the Optimal f and find theoptimal value to risk for an account, follow the steps below:
1.Establish the account size. This is the starting account size and should be obvious to traders. 2.Establish the size of the single largest losing trade. Traders will need to look at the trades tofigure this out. 3.Get the Optimal f value from the software. 4.Divide the largest loss by the Optimal f. 5.Divide the account value by the results of step 4. 6.Repeat after each trade.
The results from step 5 will tell traders how many units/contracts to take on each trading signalfor maximum growth to their accounts. The following traces through the aforementioned stepswith a real example:
1.The account size is $25,000. 2.The largest losing trade is $2,050. 3.The Optimal f is 27%. 4.$7,592 = ( $2,050 / 0.27 ). 5.3.29 = $25,000 / $7,592. 6.Repeat for the next trade.
In a perfect world, traders would enter the next trading signal with 3.29 contracts. Since it isnot a perfect world, they need to round the number down to three. Due to the necessity toround down in real-time trading, some traders may find that a value near, but not the optimal,may produce the fastest gain to an account.
Although analyzing different trading systems on the basis of the Optimal f value gives tradersinsight into which system has the greatest potential for growth, it also has some disadvantages.The Optimal f does not give traders any insight into the risks of using this approach. In manycases, having a high Optimal f, and applying this form of money management to maximize anaccount, can leave traders susceptible to large draw downs or greatly increase the probability ofruin for an account.
Probability of Ruin
The Probability of Ruin (POR) is the "statistical possibility" a trading system will deplete anaccount to the point of ruin, before achieving a dollar level deemed as being successful. Ruin isdefined as the level of an account when traders will stop trading. Knowing this value can bevery important to traders. The POR illustrates to traders the statistical possibility that theirtrading systems will naturally, by the laws of probability, drift to a point of success or ruin.
To calculate the Probability of Ruin, traders must slog though a horribly long equation.(However, just let the kNOW Software do the math.) In short, the following represents somebasic outcomes/elements of the equation:
All other things being equal:
1.The greater the size of the average wins, the lower the POR. 2.The larger the average risk per trade, the greater the POR. 3.The larger the initial account size, ,the lower the POR 4.The higher the percentage of winning trades, the lower the POR.

5.The smaller the account, the greater the POR.
Some authors, have said that the probability of ruin (POR) is not a relevant concept because itdoes not tell traders anything they can capitalize on. In this sense they are correct. Additionally,it tends to be a small value in winning systems. However, all other things being equal, whengiven the choice between two trading systems, pick the one with the lowest POR. Also, theprobability of ruin should be a value that many small investors/traders look at. Since smallinvestors/traders usually have small accounts, the aggressive forms of money managementmethods can have PORs that deserve attention.
For the most part, PORs tend to be low. It is usual to see trading systems that have 0-5% fortheir PORs. For trading systems that work normally and have a reasonable account size, this iswhat should be expected. The second most common POR is 100%, meaning that failure isalmost completely guaranteed. These tend to be trading systems that would fail under mostcircumstances anyway. Every now and then you get something in the middle range.
In summary, the POR is a method/value that should be curious to all traders, but it usuallyoffers little additional insight, since most of the time the values are below 5%. However, undersome circumstances, it can show traders they have a significant risk of ruining their account.When traders are faced with this reality, it means they are risking far too much on eachindividual trade. With this knowledge, traders should then limit the risk per trade, in an attemptto bring the POR down to an appropriate level. By trading small portions of their accounts,traders are giving themselves, in essence, more chances to win.
Conclusion- For Now
It is the sincere desire of the authors that through the reading of this book and the using of thekNOW Software users of the kNOW Program will become not only very successful monetarilybut also very happy traders and investors.
Trading/investing is not easy, even if all you have to do is throw old chicken bones over yourshoulder to make a decision to get in or out of the market. Therefore, we hope the kNOWProgram will give you the knowledge and the initial foundation to make sound moneymanagement decisions and the desire to learn more about the arcane world of "riskmanagement."
It is the authors intent to continue updating this book and adding new money managementtechniques/approaches and options as they become known and tested.These new ideas/methods will also be included into the kNOW Software, as they becomeavailable. However, in order to expedite this updating effort we will need all the help we canget, so please, forward to us any ideas, questions or new techniques you would like to have usexplore and add to the Program.
Thank you again for your time and effort in reading this book and we hope it has been arewarding experience for you. Creating it has been a real pleasure.