mechanical behavior and permeability evolution of
TRANSCRIPT

Mechanical Behavior and Permeability Evolution of Reconstituted CoalSamples under Various Unloading Confining Pressures—Implications forWellbore Stability Analysis
Authors:
Qiangui Zhang, Xiangyu Fan, Yongchang Liang, Minghui Li, Guangzhi Li, Tianshou Ma, Wen Nie
Date Submitted: 2019-12-10
Keywords: unloading confining pressure, underbalanced drilling, permeability, coalbed methane, Coal
Abstract:
Low pressure, low permeability, and low saturation of Chinese coal-bed methane (CBM) reservoirs make underbalanced drilling (UBD)widely used for mining CBM in China. In this study, mechanical behavior and permeability of coal rock were investigated underdifferent degrees of unloading confining pressure (UCP)-reloading axial stress (RAS) by a triaxial experimental apparatus. These testsrevealed that: (1) peak deviatoric stress of coal rock in UCP-RAS is lower than that in a conventional triaxial compression (CTC) test,and the peak deviatoric stress linearly relates the degree of unloading confining pressure. The deformation modulus of coal in UCP-RAS is lower than that in CTC, while the lateral expansion ratio is larger than that in CTC; (2) higher UCP leads to a faster increase ofpermeability during RAS until the failure of coal; (3) the cohesion and internal friction angle tested by UCP-RAS are lower by 4.57%and 15.18% than those tested by CTC. In addition, a field case (Zhaozhuang well, Qinshui Basin, China) of a well collapse problemvalidates the higher probability of wellbore collapse due to the increase of equivalent collapse fluid density, which is calculated by usingcoal rock parameters tested by UCP-RAS rather than by CTC.
Record Type: Published Article
Submitted To: LAPSE (Living Archive for Process Systems Engineering)
Citation (overall record, always the latest version): LAPSE:2019.1435Citation (this specific file, latest version): LAPSE:2019.1435-1Citation (this specific file, this version): LAPSE:2019.1435-1v1
DOI of Published Version: https://doi.org/10.3390/en10030292
License: Creative Commons Attribution 4.0 International (CC BY 4.0)
Powered by TCPDF (www.tcpdf.org)

energies
Article
Mechanical Behavior and Permeability Evolution ofReconstituted Coal Samples under Various UnloadingConfining Pressures—Implications for WellboreStability Analysis
Qiangui Zhang 1,2,3, Xiangyu Fan 2,3, Yongchang Liang 3, Minghui Li 1, Guangzhi Li 1,Tianshou Ma 2,3 and Wen Nie 4,5,*
1 State Key Laboratory of Coal Mine Disaster Dynamics and Control, Chongqing University,Chongqing 400030, China; [email protected] (Q.Z.); [email protected] (M.L.);[email protected] (G.L.)
2 State Key Laboratory of Oil and Gas Reservoir Geology and Exploitation, Southwest Petroleum University,Chengdu 610500, China; [email protected] (X.F.); [email protected] (T.M.)
3 College of Petroleum Engineering, Southwest Petroleum University, Chengdu 610500, China;[email protected]
4 Quanzhou Institute of Equipment Manufacturing, Haixi Institutes, Chinese Academy of Sciences,Quanzhou 362200, China
5 Landslide Research, Faculty of Civil Geo and Environmental Engineering, Technische Universität München,80333 Munich, Germany
* Correspondence: [email protected]; Tel.: +49-0176-3119-9092
Academic Editor: Mofazzal HossainReceived: 14 December 2016; Accepted: 28 February 2017; Published: 2 March 2017
Abstract: Low pressure, low permeability, and low saturation of Chinese coal-bed methane (CBM)reservoirs make underbalanced drilling (UBD) widely used for mining CBM in China. In this study,mechanical behavior and permeability of coal rock were investigated under different degrees ofunloading confining pressure (UCP)-reloading axial stress (RAS) by a triaxial experimental apparatus.These tests revealed that: (1) peak deviatoric stress of coal rock in UCP-RAS is lower than that in aconventional triaxial compression (CTC) test, and the peak deviatoric stress linearly relates the degreeof unloading confining pressure. The deformation modulus of coal in UCP-RAS is lower than thatin CTC, while the lateral expansion ratio is larger than that in CTC; (2) higher UCP leads to a fasterincrease of permeability during RAS until the failure of coal; (3) the cohesion and internal frictionangle tested by UCP-RAS are lower by 4.57% and 15.18% than those tested by CTC. In addition,a field case (Zhaozhuang well, Qinshui Basin, China) of a well collapse problem validates the higherprobability of wellbore collapse due to the increase of equivalent collapse fluid density, which iscalculated by using coal rock parameters tested by UCP-RAS rather than by CTC.
Keywords: coal; coalbed methane; permeability; underbalanced drilling; unloading confiningpressure
1. Introduction
Underbalanced drilling (UBD), which can avoid drilling fluid polluting reservoirs, is widely usedfor mining coal-bed methane (CBM) in China, considering the low pressure, low permeability, and lowsaturation of Chinese CBM reservoirs [1]. Compared to conventional overbalanced drilling (OBD),the bottom hole pressure (BHP) of UBD must reduce to a design value for lowering the formationpressure. The decrease of BHP can increase deviatoric stress on a coal wellbore [2] resulting in a lack of
Energies 2017, 10, 292; doi:10.3390/en10030292 www.mdpi.com/journal/energies

Energies 2017, 10, 292 2 of 19
effective support from drilling fluid [3], which is similar with an unloading confining pressure (UCP)in a triaxial stress condition. The UCP damages the coal mechanical property [4]. In addition, thepermeability of the gas reservoir increased by the UCP [5] results in the damage of the mechanicalbehavior of coal [6]. Both aspects above threaten the coal wellbore stability [7].
The effect of UCP on the mechanical behavior of rocks is usually investigated by triaxialcompression tests [8]. Damage to the mechanical behavior of rock under unloading conditions is ofimportance in the analysis of stress-induced failure of overstressed rock masses [9]. Xie and He [10]show that the rock strength under unloading conditions is lower than that under loading conditions.A higher UCP rate corresponds to lower compressive strength and ductile strain [11]. The failuremode of the rock specimen gradually changes from shear to tensile with the increasing UCP rate [12].The radial deformation produced by unloading is often more than the axial deformation [13]. Theseinvestigations reveal that the mechanical characteristics of rocks reduce under UCP and the increasedUCP rate easily induces failure of rocks.
The deformation under UCP also influences the permeability of rocks [14]. The radial strain isa key variable for the evolution of permeability and the effect of UCP on the permeability cannotbe ignored [4]. UCP causes an obvious expansion of the rock volume, which leads to high rockpenetrability under unloading than that under loading conditions [15]. The UCP condition increasescoal permeability much earlier than that under constant confining pressure [11]. During the unloadingstage, the rock permeability shows a positive exponential relationship with the axial strain of therock [16]. Rock penetrability induced by UCP is small at the initial elastic deformation phase, butincreases near the end of the elastic deformation phase [17]. These investigations show that thepermeability of rocks significantly and quickly increases during the UCP process.
However, all of the above studies did not consider the in situ conditions during CBM welltransforming from conventional drilling methods to UBD. In the present work, considering this fieldstatus, the mechanical behavior and permeability of coal after suffering different degrees of UCP wereinvestigated by a triaxial experimental apparatus. In addition, the equivalent collapse fluid densities(minimum drilling fluid density maintaining coal wellbore stability) calculated by using parametersfrom CTC and UCP-RAS tests were compared for evaluating the stability of a field coal wellbore case(Zhaozhuang well, Qinshui Basin, China).
2. Experimental Procedures
2.1. Experimental Apparatuses
“THM coupled with triaxial servo-controlled seepage apparatus for gas infiltrated coal” [18] isused for our experiments (Figure 1). The device includes a servo loading system, pressure chamber,constant temperature oil heating system, gas pressure control system, data acquisition and storagesystem, and auxiliary system. The technical specifications of this apparatus are as shown in Table 1.This apparatus is applicable to investigate the combined effect of stress, strain, temperature, and gasflow on the mechanical behavior and permeability of coal specimens [19].
Table 1. Technical specification of the apparatus.
Maximum AxialStress
MaximumConfiningPressure
Frame Stiffness Maximum GasPressure
Maximum AxialDisplacement
MaximumCircumferenceDeformation
100 MPa 10 MPa 10 GN/m 6 MPa 60 mm 6 mm
Temperature Range Control Precisionof Stress
Test Precision ofStress
Test Precision ofDeformation
Control Precisionof Temperature
Test Precision ofPermeability
Indoor temperature−100 ◦C
±0.5% ofindicating value
±1% ofindicating value
±1% ofindicating value ±0.1 ◦C ±1% of indicating
value

Energies 2017, 10, 292 3 of 19
Energies 2017, 10, 292 3 of 19
(a) (b)
Figure 1. Apparatus and specimen installation: (a) photo of the apparatus; (b) schematic of the apparatus. 1. Lifter; 2. triaxial chamber; 3. sensor of axial stress; 4. servo-controlled hydraulic pump; 5. water tank; 6. movable work platform; 7. heater tubes; 8. water inlet valve; 9. water drain valve; 10. water circulating pump; 11. lifting rope; 12. sensor of axial displacement; 13. hydraulic cylinder of axial stress; 14. force plate; 15. gas inlet valve; 16. gas outlet valve; 17. air drain valve; 18. hydraulic oil inlet/drain valve; 19. servo valve; 20. controlling stand.
2.2. Specimen Preparations and Basic Parameters
The coal samples were taken from the third coal seam of the Zhaozhuang coal mine of the Qinshui coalfield in Jincheng, Shanxi Province, China. This is an advanced industrial district of CBM exploration. These coal blocks are soft and fragile and their physical and mechanical parameters are as shown in Table 2. The data of density, BET surface area, and porosity were measured by the rock pieces experiment, and the data of the elasticity modulus, Poisson’s ratio, and Boit coefficient were obtained by the logging analysis of a test horizontal well introduced in Section 4. The vertical depth of coal blocks from the coal seam of the test CBM horizontal well is about 720 m in a coal mine. In this seam, the high deviation of the horizontal in situ stress gradient (0.75 MPa) could potentially produce extreme fracture development in coal. Additionally, the process of taking coal blocks also could cause a stress release resulting in more fragmentation of the coal. These conditions make it difficult to obtain an intact coal rock. Therefore, we used the reconstituted coal samples in experiments.
The reconstituted coal specimens are used for our experiments. The coal powder has a particle size of 0.250–0.425 mm, and this particle size of coal powder was shaped by mixing with water for a 3% moisture content. The reconstituted coal specimens are shaped into a diameter of 50 mm and a height 100 mm ±0.25 mm, with a pressure of 100MPa by an implosion sampling machine. This pressure is according to the “general requirements for sampling (China National Code of GB/T 23561.1-2009)”. The numbers, sizes, and densities of the coal specimens are as shown in Table 3.
Table 2. Characterization data of coal blocks.
Density (g/cm3) BET Surface Area (m2/g) Porosity (%) 1.192 1.297 12
1.236×−
2.35 2.87 9
2.63− ×
0.087 0.14 90.10
− ×
Elasticity Modulus (GPa) Poisson’s Ratio Boit Coefficient
0.57 1.15 60.83
− × 0.18 0.33 6
0.26− ×
0.43 0.62 60.53
− ×
The symbolic model of the number is Minimum value Maximun value sample amountAverage value
×− .
Figure 1. Apparatus and specimen installation: (a) photo of the apparatus; (b) schematic of theapparatus. 1. Lifter; 2. triaxial chamber; 3. sensor of axial stress; 4. servo-controlled hydraulic pump;5. water tank; 6. movable work platform; 7. heater tubes; 8. water inlet valve; 9. water drain valve;10. water circulating pump; 11. lifting rope; 12. sensor of axial displacement; 13. hydraulic cylinder ofaxial stress; 14. force plate; 15. gas inlet valve; 16. gas outlet valve; 17. air drain valve; 18. hydraulic oilinlet/drain valve; 19. servo valve; 20. controlling stand.
2.2. Specimen Preparations and Basic Parameters
The coal samples were taken from the third coal seam of the Zhaozhuang coal mine of theQinshui coalfield in Jincheng, Shanxi Province, China. This is an advanced industrial district of CBMexploration. These coal blocks are soft and fragile and their physical and mechanical parameters areas shown in Table 2. The data of density, BET surface area, and porosity were measured by the rockpieces experiment, and the data of the elasticity modulus, Poisson’s ratio, and Boit coefficient wereobtained by the logging analysis of a test horizontal well introduced in Section 4. The vertical depth ofcoal blocks from the coal seam of the test CBM horizontal well is about 720 m in a coal mine. In thisseam, the high deviation of the horizontal in situ stress gradient (0.75 MPa) could potentially produceextreme fracture development in coal. Additionally, the process of taking coal blocks also could causea stress release resulting in more fragmentation of the coal. These conditions make it difficult to obtainan intact coal rock. Therefore, we used the reconstituted coal samples in experiments.
Table 2. Characterization data of coal blocks.
Density (g/cm3) BET Surface Area (m2/g) Porosity (%)1.192−1.297
1.236 × 12 2.35−2.872.63 × 9 0.087−0.14
0.10 × 9
Elasticity Modulus (GPa) Poisson’s Ratio Boit Coefficient0.57−1.15
0.83 × 6 0.18−0.330.26 × 6 0.43−0.62
0.53 × 6
The symbolic model of the number is Minimum value−Maximun valueAverage value × sample amount.
The reconstituted coal specimens are used for our experiments. The coal powder has a particlesize of 0.250–0.425 mm, and this particle size of coal powder was shaped by mixing with water for a 3%moisture content. The reconstituted coal specimens are shaped into a diameter of 50 mm and a height100 mm ± 0.25 mm, with a pressure of 100 MPa by an implosion sampling machine. This pressure isaccording to the “general requirements for sampling (China National Code of GB/T 23561.1-2009)”.The numbers, sizes, and densities of the coal specimens are as shown in Table 3.

Energies 2017, 10, 292 4 of 19
2.3. Experimental Schemes
The experimental scheme is determined according to the stress state of the wellbore during UBDintroduced here. During UBD, considering the gas flowing along the radial direction, the stress stateof a cylindrical micro-unit of the well wall (Figure 2) can be expressed as [20]:
σr = pi − φ(
pi − pp)
σθ = Aσh + BσH + Cσv + (K1 − 1)pi − K1 pp
σz = Dσh + EσH + Fσv + K1(
pi − pp)
σθz = Gσh + HσH + Jσv
σrθ = σrz = 0
(1)
where σr, σθ , σz, σrθ , σθz, and σrz are the stress components of the wellbore in a cylindrical coordinatesystem as shown in Figure 2b, MPa; σv is the vertical stress, MPa; σH and σh are the maximum andminimum horizontal crustal stresses, respectively, MPa; pi is BHP, MPa; pp is the formation pressure,MPa; φ is the porosity of the formation; the undetermined coefficients A, B, C, D, E, F, D, H, I, J, andthe coefficient related permeation K1 are
A = cos ψ[cos ψ(1− 2 cos 2θ) sin2 ω + 2 sin 2ω sin 2θ
]+ (1 + 2 cos 2θ) cos2 ω
B = cos ψ[cos ψ(1− 2 cos 2θ) cos2 ω− 2 sin 2ω sin 2θ
]+ (1 + 2 cos 2θ) sin2 ω
C = (1− 2 cos 2θ) sin2 ψ
D = sin2 ω sin2 ψ + 2υ sin 2ω cos ψ sin 2θ + 2υ cos 2θ(cos2 ω− sin2 ω cos2 ψ
)E = cos2 ω sin2 ψ− 2υ sin 2ω cos ψ sin 2θ + 2υ cos 2θ
(sin2 ω− cos2 ω cos2 ψ
)F = cos2 ψ− 2υ sin2 ψ cos 2θ
G = −(sin 2ω sin ψ cos θ + sin2 ω sin 2ψ sin θ
)H = sin 2ω sin ψ cos θ − cos2 ω sin 2ψ sin θ
J = sin 2ψ sin θ
K1 = α(1−2υ)1−υ − φ
(2)
where υ is Poisson’s ratio; α is the Boit coefficient; ψ is the angle of inclination, ◦; ω is the angle fromthe direction of maximum horizontal stress to the projection line of well axis in Cartesian coordinates(x1, y1, z1), ◦; θ is the angle from the x direction in the Cartesian coordinate to the direction of the radiusvector, ◦.
Energies 2017, 10, 292 4 of 19
2.3. Experimental Schemes
The experimental scheme is determined according to the stress state of the wellbore during UBD introduced here. During UBD, considering the gas flowing along the radial direction, the stress state of a cylindrical micro-unit of the well wall (Figure 2) can be expressed as [20]:
( )( )
( )1 1
1
1
0
r i i p
h H v i p
z h H v i p
z h H v
r rz
p p p
A B C K p K p
D E F K p p
G H J
θ
θ
θ
σ φ
σ σ σ σ
σ σ σ σ
σ σ σ σσ σ
= − − = + + + − − = + + + − = + + = =
(1)
where σr, σθ, σz, σrθ, σθz, and σrz are the stress components of the wellbore in a cylindrical coordinate system as shown in Figure 2b, MPa; σv is the vertical stress, MPa; σH and σh are the maximum and minimum horizontal crustal stresses, respectively, MPa; pi is BHP, MPa; pp is the formation pressure, MPa; ϕ is the porosity of the formation; the undetermined coefficients A, B, C, D, E, F, D, H, I, J, and the coefficient related permeation K1 are
( ) ( )( ) ( )
( )( )
2 2
2 2
2
2 2 2 2 2
2 2
cos cos 1 2cos 2 sin 2sin 2 sin 2 1 2cos 2 cos
cos cos 1 2cos 2 cos 2sin 2 sin 2 1 2cos 2 sin
1 2cos 2 sin
sin sin 2 sin 2 cos sin 2 2 cos 2 cos sin cos
cos sin 2 sin 2 cos si
A
B
C
D
E
= − + + + = − − + +
= −
= + + −
= −
ψ ψ θ ω ω θ θ ω
ψ ψ θ ω ω θ θ ω
θ ψ
ω ψ υ ω ψ θ υ θ ω ω ψ
ω ψ υ ω ψ ( )
( )
( )
2 2 2
2 2
2
2
1
n 2 2 cos 2 sin cos cos
cos 2 sin cos 2
sin 2 sin cos sin sin 2 sin
sin 2 sin cos cos sin 2 sinsin 2 sin
1 21
F
G
HJ
K
+ −
= − = − + = −
= − = − −
θ υ θ ω ω ψ
ψ υ ψ θω ψ θ ω ψ θ
ω ψ θ ω ψ θψ θ
α υφ
υ
(2)
where υ is Poisson’s ratio; α is the Boit coefficient; ψ is the angle of inclination, °; ω is the angle from the direction of maximum horizontal stress to the projection line of well axis in Cartesian coordinates (x1, y1, z1), °; θ is the angle from the x direction in the Cartesian coordinate to the direction of the radius vector, °.
Figure 2. Stress state of the wellbore unit: (a) the formation unit; (b) the conversion of coordinates for an inclined wellbore.
The stress change from the conventional drilling method (OBD) to UBD means the decrease of BHP (Pi), and 10 1K< < resulting from α, υ, and ϕ of coal is a key condition to realize the change (see Table 2). The following conclusions can be inferred by Equation (1):
Figure 2. Stress state of the wellbore unit: (a) the formation unit; (b) the conversion of coordinates foran inclined wellbore.
The stress change from the conventional drilling method (OBD) to UBD means the decrease ofBHP (Pi), and 0 < K1 < 1 resulting from α, υ, and φ of coal is a key condition to realize the change(see Table 2). The following conclusions can be inferred by Equation (1):
(1) Smaller radial stress (σr) corresponds to the lower BHP (Pi).(2) Circular stress (σθ) increases with the decrease of BHP (Pi).

Energies 2017, 10, 292 5 of 19
(3) Smaller axial stress (σz) corresponds to the lower BHP (Pi).
Therefore, different designs of BHP lead to various stress states of the wellbore, and the lower BHPresults in higher deviatoric stress of the coal wellbore during UDB. The stress state of the cylinder unitat the borehole wall (Figure 2a) was simulated by the coal samples (Figure 3), which are reconstitutedin the laboratory.
(1) An axial stress and a confining pressure are applied on a cylinder specimen, considering thestress of σθ and σr.
(2) Initial deviatoric stress of 8 MPa is applied on the specimens for simulating the difference of σθ
and σr under the initial condition of OBD. Different degrees of UCP are used to simulate thedifferent decrease levels of BHP.
(3) A gas pressure difference of 1.0 MPa is applied on the two ends of the specimens for simulatingthe field situation of the gas percolation gradient from the formation to the wellbore during UBD.
Energies 2017, 10, 292 5 of 19
(1) Smaller radial stress (σr) corresponds to the lower BHP (Pi). (2) Circular stress (σθ) increases with the decrease of BHP (Pi). (3) Smaller axial stress (σz) corresponds to the lower BHP (Pi).
Therefore, different designs of BHP lead to various stress states of the wellbore, and the lower BHP results in higher deviatoric stress of the coal wellbore during UDB. The stress state of the cylinder unit at the borehole wall (Figure 2a) was simulated by the coal samples (Figure 3), which are reconstituted in the laboratory.
Figure 3. Stress state of a coal specimen.
(1) An axial stress and a confining pressure are applied on a cylinder specimen, considering the stress of σθ and σr.
(2) Initial deviatoric stress of 8 MPa is applied on the specimens for simulating the difference of σθ and σr under the initial condition of OBD. Different degrees of UCP are used to simulate the different decrease levels of BHP.
(3) A gas pressure difference of 1.0 MPa is applied on the two ends of the specimens for simulating the field situation of the gas percolation gradient from the formation to the wellbore during UBD.
This laboratory test considers three stress paths (Figure 4): unloading confining pressure (UCP) until coal failure is to evaluate the mechanical behavior and permeability of coal during pure UCP. Different degrees of UCP then reload the axial stress (RAS) tests until coal failure to measure the mechanical behavior and permeability of the coal under different designed BHP. The stress path of conventional triaxial compression (CTC) tests under different confining pressure is used for comparison. The experiment parameters are presented in Table 3.
Figure 4. Stress paths of the tests.
Table 3. Sample sizes and experimental parameters.
Sample Stress Path
Length (mm)
Density (g/cm3)
Confining Pressure
(MPa)
Yield Deviatoric
Stress (MPa)
Peak Deviatoric
Stress (MPa)
At Peak Stress Initial Permeability
(×10−17 m2) ε1 (%) ε3 (%) εv (%)
I-0 OABC 101.3 1.240 — — 12.42 2.73 −1.64 −0.55 14.33 II-1 OABGK 98.4 1.252 2.6 — 12.42 3.08 −2.37 −1.66 13.76 II-2 OABFJ 102 1.219 3.72 — 14.00 3.77 −2.46 −1.15 14.48
Figure 3. Stress state of a coal specimen.
This laboratory test considers three stress paths (Figure 4): unloading confining pressure (UCP)until coal failure is to evaluate the mechanical behavior and permeability of coal during pure UCP.Different degrees of UCP then reload the axial stress (RAS) tests until coal failure to measure themechanical behavior and permeability of the coal under different designed BHP. The stress path ofconventional triaxial compression (CTC) tests under different confining pressure is used for comparison.The experiment parameters are presented in Table 3.
Energies 2017, 10, 292 5 of 19
(1) Smaller radial stress (σr) corresponds to the lower BHP (Pi). (2) Circular stress (σθ) increases with the decrease of BHP (Pi). (3) Smaller axial stress (σz) corresponds to the lower BHP (Pi).
Therefore, different designs of BHP lead to various stress states of the wellbore, and the lower BHP results in higher deviatoric stress of the coal wellbore during UDB. The stress state of the cylinder unit at the borehole wall (Figure 2a) was simulated by the coal samples (Figure 3), which are reconstituted in the laboratory.
Figure 3. Stress state of a coal specimen.
(1) An axial stress and a confining pressure are applied on a cylinder specimen, considering the stress of σθ and σr.
(2) Initial deviatoric stress of 8 MPa is applied on the specimens for simulating the difference of σθ and σr under the initial condition of OBD. Different degrees of UCP are used to simulate the different decrease levels of BHP.
(3) A gas pressure difference of 1.0 MPa is applied on the two ends of the specimens for simulating the field situation of the gas percolation gradient from the formation to the wellbore during UBD.
This laboratory test considers three stress paths (Figure 4): unloading confining pressure (UCP) until coal failure is to evaluate the mechanical behavior and permeability of coal during pure UCP. Different degrees of UCP then reload the axial stress (RAS) tests until coal failure to measure the mechanical behavior and permeability of the coal under different designed BHP. The stress path of conventional triaxial compression (CTC) tests under different confining pressure is used for comparison. The experiment parameters are presented in Table 3.
Figure 4. Stress paths of the tests.
Table 3. Sample sizes and experimental parameters.
Sample Stress Path
Length (mm)
Density (g/cm3)
Confining Pressure
(MPa)
Yield Deviatoric
Stress (MPa)
Peak Deviatoric
Stress (MPa)
At Peak Stress Initial Permeability
(×10−17 m2) ε1 (%) ε3 (%) εv (%)
I-0 OABC 101.3 1.240 — — 12.42 2.73 −1.64 −0.55 14.33 II-1 OABGK 98.4 1.252 2.6 — 12.42 3.08 −2.37 −1.66 13.76 II-2 OABFJ 102 1.219 3.72 — 14.00 3.77 −2.46 −1.15 14.48
Figure 4. Stress paths of the tests.
Stress Path I (UCP test): Stage 1 (OA), an isotropic in situ stress state of σ10 = σ30 = 6 MPa is appliedto the specimen. The methane tank connected to the specimen injects the methane into the specimenup to a gas pressure of 1.1 MPa. We close the gas outlet valve to maintain constant gas pressure. Thisstate is maintained for 12 h to let the coal fully adsorb the methane under this pressure [4]. The gas

Energies 2017, 10, 292 6 of 19
outlet valve is then opened and a differential gas pressure of 1 MPa is maintained at the two endsof the coal specimen. Stage 2 (AB), axial stress is loaded to 14 MPa given the confining pressure of6 MPa for simulating the σθ and σr at the highest designed BHP. Stage 3 (BC), the axial stress remainsconstantly at 14 MPa and the confining pressure is decreased at an unloading rate of 0.02 MPa/s untilcoal specimen failure.
Table 3. Sample sizes and experimental parameters.
SampleStressPath
Length(mm)
Density(g/cm3)
ConfiningPressure(MPa)
YieldDeviatoric
Stress (MPa)
PeakDeviatoric
Stress (MPa)
At Peak Stress InitialPermeability(×10−17 m2)ε1 (%) ε3 (%) εv (%)
I-0 OABC 101.3 1.240 — — 12.42 2.73 −1.64 −0.55 14.33II-1 OABGK 98.4 1.252 2.6 — 12.42 3.08 −2.37 −1.66 13.76II-2 OABFJ 102 1.219 3.72 — 14.00 3.77 −2.46 −1.15 14.48II-3 OABEK 101.6 1.234 4.48 11.20 15.49 3.93 −2.53 −1.13 14.62II-4 OABDH 98.8 1.253 5.24 13.98 16.88 4.02 −2.26 −0.17 14.57III-0 OAV 102.8 1.229 6 18.29 22.67 4.27 −1.76 0.75 14.88III-1 OLR 99.8 1.249 2.6 9.56 15.14 3.94 −3.50 −3.05 14.16III-2 OMS 100.3 1.242 3.72 10.15 17.55 4.12 −2.79 −1.46 14.12III-3 ONT 100.1 1.241 4.48 14.56 19.22 4.26 −2.33 −0.39 14.37III-4 OPU 101.2 1.235 5.24 17.32 21.29 4.40 −2.34 −0.36 14.49
Stress Path II (UCP-RAS test): there are four stages for these tests. Stages 1 and 2 are the same asStress Path I. Stage 3: UCP tests are conducted to the confining pressures of 5.24 MPa (D), 4.48 MPa (E),3.72 MPa (F), and 2.6 MPa (G), respectively, with the unloading rate of 0.02 MPa/s. Stage 4: the axialstresses are continuously increased at a loading rate of 0.05 kN/s until the specimens fail under thecurrent confining pressure.
Stress Path III (CTC test): these tests have two stages. Stage 1 is similar as the Stress Path Iwith the isotropic in situ stress state of 2.6 MPa (L), 3.72 MPa (M), 4.48 MPa (N), 5.24 MPa (P), and6 MPa (A), respectively. Stage 2: the axial stress is continuously increased until these specimens failunder current confining pressure.
The whole experimental procedure is presented in Figure 5.
Energies 2017, 10, 292 6 of 19
II-3 OABEK 101.6 1.234 4.48 11.20 15.49 3.93 −2.53 −1.13 14.62 II-4 OABDH 98.8 1.253 5.24 13.98 16.88 4.02 −2.26 −0.17 14.57 III-0 OAV 102.8 1.229 6 18.29 22.67 4.27 −1.76 0.75 14.88 III-1 OLR 99.8 1.249 2.6 9.56 15.14 3.94 −3.50 −3.05 14.16 III-2 OMS 100.3 1.242 3.72 10.15 17.55 4.12 −2.79 −1.46 14.12 III-3 ONT 100.1 1.241 4.48 14.56 19.22 4.26 −2.33 −0.39 14.37 III-4 OPU 101.2 1.235 5.24 17.32 21.29 4.40 −2.34 −0.36 14.49
Stress Path I (UCP test): Stage 1 (OA), an isotropic in situ stress state of σ10 = σ30 = 6 MPa is applied to the specimen. The methane tank connected to the specimen injects the methane into the specimen up to a gas pressure of 1.1 MPa. We close the gas outlet valve to maintain constant gas pressure. This state is maintained for 12 h to let the coal fully adsorb the methane under this pressure [4]. The gas outlet valve is then opened and a differential gas pressure of 1 MPa is maintained at the two ends of the coal specimen. Stage 2 (AB), axial stress is loaded to 14 MPa given the confining pressure of 6 MPa for simulating the σθ and σr at the highest designed BHP. Stage 3 (BC), the axial stress remains constantly at 14 MPa and the confining pressure is decreased at an unloading rate of 0.02 MPa/s until coal specimen failure.
Stress Path II (UCP-RAS test): there are four stages for these tests. Stages 1 and 2 are the same as Stress Path I. Stage 3: UCP tests are conducted to the confining pressures of 5.24 MPa (D), 4.48 MPa (E), 3.72 MPa (F), and 2.6 MPa (G), respectively, with the unloading rate of 0.02 MPa/s. Stage 4: the axial stresses are continuously increased at a loading rate of 0.05 kN/s until the specimens fail under the current confining pressure.
Stress Path III (CTC test): these tests have two stages. Stage 1 is similar as the Stress Path I with the isotropic in situ stress state of 2.6 MPa (L), 3.72 MPa (M), 4.48 MPa (N), 5.24 MPa (P), and 6 MPa (A), respectively. Stage 2: the axial stress is continuously increased until these specimens fail under current confining pressure.
The whole experimental procedure is presented in Figure 5.
Figure 5. Experiment procedure of the tests.
Silicon rubber was evenly coated on thecoal specimen to prevent gas leakage.
Specimen was installed between the top andbottom pressure shafts in the triaxial chamber.
A thermal shrunken pipe was put on and heated by a hair dryer toclosely contact the specimen wall and both ends of the pressure shafts.
The thermal shrunken pipe was then tightened bymetal hoops at both ends of the pressure shafts.
A circumferential extensometer and the remainingparts of the triaxial flow apparatus were installed.
A stress path was applied on the specimen and thestress–strain–permeability processes were recorded.
The pressure chamber was cleanedafter the specimen failure.
The experimental studies are finished.
Are the stress pathsall carried out?
Yes No
Figure 5. Experiment procedure of the tests.

Energies 2017, 10, 292 7 of 19
3. Experimental Results and Analysis
The strains of coal specimens, including axial strain, radial strain, and volumetric strain, andthe lateral expansion ratio are for evaluating the ductile deformation of coal under the stress path ofUCP, UCP-RAS, and CTC tests. The deformation modulus is for analyzing the ability of resisting thedeformation of coal. The peak deviatoric stress, cohesion, and internal friction angle are for estimationof the strength of coal.
3.1. Data Treatments
In the experiments, two lateral direction stresses are the same (σ2 = σ3), the volumetric strain canbe calculated as
εV = ε1 + 2ε3 (3)
where εV is volumetric strain, %; ε1 is an axial strain, %; ε3 is a radial strain.Since coal is a nonlinear elastic material, the elastic modulus evolves with the deformation in the
stress–strain process. For triaxial compression tests with UCP, deformation modulus E0 and lateralexpansion ratio µ0 are defined as [11] {
µ0 = − ε3ε1
E0 = σ1−σ3ε1
(4)
The methane gas permeation through the specimen is assumed to be isothermal and ideal. Thus,the permeability of coal can be calculated by [21,22]
K =2qµLP2
A(
P21 − P2
2) (5)
where K is the permeability (m2), q is the gas permeation rate (m3/s), µ is the gas kinematic viscosity(Pas), L is the length of the coal specimens (m), S is the cross-sectional area of the coal specimens (m2),P1 is the gas pressure at the upper stream of specimens (Pa), and P2 is the gas pressure downstream ofthe specimens (Pa).
3.2. UCP and CTC Affecting the Mechanical Behavior and Permeability
Figure 6 presents the stress–strain process of coal I-0 and III-0. In Figure 6a, the stress–straincurves of coal I-0 and III-0 at Stage 2 have a high uniformity. Until Stage 3, the peak of deviatoricstress (coal I-0) reduces compared to the peak of deviatoric stress (coal III-0). This reveals damagedue to unloading confining pressure is more obvious, leading the coal specimen to be prone to failure.In addition, the UCP test has no elastic deformation stage. After starting the UCP, the deviatoricstress-axial strain curve is protruding and its yield point is not clear. At the point of the coal failure,the UCP test has lower axial strain (Figure 6a) and volumetric strain than the CTC test (Figure 6b).The radial strain of the UCP test is similar with that of the CTC test (Figure 6c). The larger radialstrain of coal during unloading confining pressure (Figure 6c) causes more damage and larger volumeexpansion (Figure 6b). This may lead the poorer mechanical strength and the lower ability for ductiledeformation of the coal specimen of UCP.
Figure 7 presents the change of deformation modulus and lateral expansion ratio of coal I-0and III-0. In Stage 3, the deformation modulus reduces 64.95% for coal I-0 and 28.47% for coal III-0.Amplification of the lateral expansion ratio increases 311.48% for coal I-0 and 204.70% for coal III-0.The lateral expansion ratio of coal I-0 is larger than 0.5. The mechanical strength and the ability ofductile deformation of coal under the UCP test could decrease.

Energies 2017, 10, 292 8 of 19
Energies 2017, 10, 292 8 of 19
Figure 6. Stress–strain process of coal I-0 and coal III-0 (Stage 2 and Stage 3 in reference to Stress Path II): (a) stress vs. axial strain; (b) stress vs. volumetric strain; (c) stress vs. radial strain.
Figure 7 presents the change of deformation modulus and lateral expansion ratio of coal I-0 and III-0. In Stage 3, the deformation modulus reduces 64.95% for coal I-0 and 28.47% for coal III-0. Amplification of the lateral expansion ratio increases 311.48% for coal I-0 and 204.70% for coal III-0. The lateral expansion ratio of coal I-0 is larger than 0.5. The mechanical strength and the ability of ductile deformation of coal under the UCP test could decrease.
Figure 6. Stress–strain process of coal I-0 and coal III-0 (Stage 2 and Stage 3 in reference to StressPath II): (a) stress vs. axial strain; (b) stress vs. volumetric strain; (c) stress vs. radial strain.
Energies 2017, 10, 292 8 of 19
Figure 6. Stress–strain process of coal I-0 and coal III-0 (Stage 2 and Stage 3 in reference to Stress Path II): (a) stress vs. axial strain; (b) stress vs. volumetric strain; (c) stress vs. radial strain.
Figure 7 presents the change of deformation modulus and lateral expansion ratio of coal I-0 and III-0. In Stage 3, the deformation modulus reduces 64.95% for coal I-0 and 28.47% for coal III-0. Amplification of the lateral expansion ratio increases 311.48% for coal I-0 and 204.70% for coal III-0. The lateral expansion ratio of coal I-0 is larger than 0.5. The mechanical strength and the ability of ductile deformation of coal under the UCP test could decrease.
Figure 7. Change of the deformation modulus and lateral expansion ratio of coal I-0 and III-0 (Stage 2and Stage 3 in reference to Stress Path II).

Energies 2017, 10, 292 9 of 19
Permeability evolutions of coal I-0 and III-0 are as shown in Figure 8. In Stage 3, the permeabilityof coal I-0 increases immediately, while III-0 has a long time lag for the increase, as shown in Figure 8a.In Figure 8b, the permeability evolution of coal I-0 with the volumetric strain indicates highervolumetric strain corresponding to lower permeability, while the permeability of coal III-0 increaseswhen the moment of decreasing volumetric strain reaches that of coal failure. These phenomena aredue to the more rapid radial deformation of I-0 than that of III-0 (Figure 6c), producing more fracturesalong the radial direction [4].
1
Figure 8. Permeability evolution of coal I-0 and III-0 (Stage 2 and Stage 3 with reference to StressPath II): (a) permeability-deviatoric stress curve; (b) permeability-volumetric strain curve.
3.3. Mechanical Behavior and Permeability of Coal Rock under Different Degrees of UCP-RAS Test
3.3.1. Stress–Strain of Coal Rock
Figure 9 presents the stress–strain process of coals for coal II-1, II-2, II-3, II-4, and for coal III-1,III-2, III-3, and III-4. Firstly, the peak strengths under UCP-RAS tests are lower than these underCTC tests, as shown in Figure 10a. Secondly, the yield deviatoric stresses of coal II-3 and II-4 arelower by 23.08% and 19.28% than these of coal III-3 and III-4, respectively. The coal II-1 and II-2 haveno elastic deformation during Stages 3 and 4. These phenomena mean that the elastic deformationof coal after suffering UCP becomes short. Thirdly, coal samples under UCP-RAS tests have largervolume expansion than those under CTC tests. All of the volumetric strains of coal specimens aftersuffering CUP decrease with the increase of deviatoric stress at Stage 4. Differently, the decreases ofcoal specimens under CTC tests appear after the yield point. Fourthly, coal specimens under UCP-RAStests have lower ductile deformation than those under CTC tests. This evidence mean that the processof UCP tests damages coal, and a higher degree of UCP has a lower mechanical behavior. Figure 10aindicates the damage degree of the peak strength of coal linearly relates the current confining pressureby unloading of UCP-RAS. Figure 10b shows the linear relation between the reduction of confiningpressure by UCP and the peak strength of coal.
3.3.2. Deformation Modulus and Lateral Expansion Ratio of Coal
Figure 11 presents the relationships of the deformation modulus and lateral expansion ratio withthe axial strain for coal II-1, II-2, II-3, II-4, and for coal III-1, III-2, III-3, and III-4. In Figure 11a, firstly,the deformation modulus of coal II-1, II-2, II-3, and II-4 is lower than those of coal III-1, III-2, III-3, andIII-4, respectively, at Stage 4. With the axial strain increasing from 2.45% to 3.39%, the deformationmoduli under the CTC test decrease by 16.52%, 13.51%, 7.96%, and 1.17% for coal III-1, III-2, III-3,and III-4, respectively. Correspondingly, the deformation moduli under the RAS test decreases by23.80%, 18.11%, 15.84%, and 12.06% for coal II-1, II-2, II-3, and II-4, respectively. The decrease of thedeformation modulus of coal during the RAS test is more significant than that during the CTC test andthe higher degree of UCP has a larger decrease of deformation modulus. Figure 11b shows that the

Energies 2017, 10, 292 10 of 19
lateral expansion ratios of coal under the RAS test are larger than those under the CTC test under thesame confining pressure and axial strain. All of this indicates that coal, after suffering the UCP test,presents a lower ability of ductile deformation compared to the coal after suffering the CTC test.Energies 2017, 10, 292 10 of 19
Figure 9. Stress–strain of the coal specimens: (a) for coal II-1 and III-1; (b) for coal II-2 and III-2; (c) for coal II-3 and III-3; (d) for coal II-4 and III-4.
Figure 10. Unloading confining pressure damaging the peak strength of coal for UCP-RAS and CTC tests. (a) Peak deviatoric stress vs. current confining pressure; (b) peak deviatoric stress vs. reduction of confining pressure.
3.3.2. Deformation Modulus and Lateral Expansion Ratio of Coal
Figure 11 presents the relationships of the deformation modulus and lateral expansion ratio with the axial strain for coal II-1, II-2, II-3, II-4, and for coal III-1, III-2, III-3, and III-4. In Figure 11a, firstly, the deformation modulus of coal II-1, II-2, II-3, and II-4 is lower than those of coal III-1, III-2, III-3, and III-4, respectively, at Stage 4. With the axial strain increasing from 2.45% to 3.39%, the deformation moduli under the CTC test decrease by 16.52%, 13.51%, 7.96%, and 1.17% for coal III-1, III-2, III-3, and III-4, respectively. Correspondingly, the deformation moduli under the RAS test decreases by 23.80%, 18.11%, 15.84%, and 12.06% for coal II-1, II-2, II-3, and II-4, respectively. The decrease of the deformation modulus of coal during the RAS test is more significant than that during the CTC test and the higher degree of UCP has a larger decrease of deformation modulus. Figure 11b shows that the lateral expansion ratios of coal under the RAS test are larger than those under the CTC test under the same confining pressure and axial strain. All of this indicates that
Figure 9. Stress–strain of the coal specimens: (a) for coal II-1 and III-1; (b) for coal II-2 and III-2; (c) forcoal II-3 and III-3; (d) for coal II-4 and III-4.
1
Figure 10. Unloading confining pressure damaging the peak strength of coal for UCP-RAS and CTCtests. (a) Peak deviatoric stress vs. current confining pressure; (b) peak deviatoric stress vs. reductionof confining pressure.

Energies 2017, 10, 292 11 of 19
Energies 2017, 10, 292 11 of 19
coal, after suffering the UCP test, presents a lower ability of ductile deformation compared to the coal after suffering the CTC test.
Figure 11. Change of deformation modulus (a) and lateral expansion ratio (b) with the axial strain.
3.3.3. Permeability Evolutions of the Coal Rock
Figure 12 presents the permeability evolution of coal for coal II-1, II-2, II-3, II-4, and for coal III-1, III-2, III-3, and III-4. Firstly, the permeability of coal II-1, II-2, II-3, and II-4 decrease faster than those of coal III-1, III-2, III-3, and III-4, respectively, during Stage 2. This may be due to the confining pressure of the UCP-RAS test being higher than that of the CTC test during Stage 2. Secondly, permeability under UCP-RAS tests increase immediately when Stage 3 starts, while the permeability under the CTC tests increases near the peak strength. Thirdly, the higher degree of UCP has a larger increase of permeability during Stage 3. Fourthly, permeability under the UCP-RAS test during Stage 4 increases faster than those under the CTC test.
Figure 12. Permeability evolution with deviatoric stress: (a) for coal II-1 and III-1; (b) for coal II-2 and III-2; (c) for coal II-3 and III-3; (d) for coal II-4 and III-4 (Stage 2, Stage 3, and Stage 4 with reference to Stress Path II).
Figure 11. Change of deformation modulus (a) and lateral expansion ratio (b) with the axial strain.
3.3.3. Permeability Evolutions of the Coal Rock
Figure 12 presents the permeability evolution of coal for coal II-1, II-2, II-3, II-4, and for coal III-1,III-2, III-3, and III-4. Firstly, the permeability of coal II-1, II-2, II-3, and II-4 decrease faster than those ofcoal III-1, III-2, III-3, and III-4, respectively, during Stage 2. This may be due to the confining pressureof the UCP-RAS test being higher than that of the CTC test during Stage 2. Secondly, permeabilityunder UCP-RAS tests increase immediately when Stage 3 starts, while the permeability under theCTC tests increases near the peak strength. Thirdly, the higher degree of UCP has a larger increase ofpermeability during Stage 3. Fourthly, permeability under the UCP-RAS test during Stage 4 increasesfaster than those under the CTC test.
Energies 2017, 10, 292 11 of 19
coal, after suffering the UCP test, presents a lower ability of ductile deformation compared to the coal after suffering the CTC test.
Figure 11. Change of deformation modulus (a) and lateral expansion ratio (b) with the axial strain.
3.3.3. Permeability Evolutions of the Coal Rock
Figure 12 presents the permeability evolution of coal for coal II-1, II-2, II-3, II-4, and for coal III-1, III-2, III-3, and III-4. Firstly, the permeability of coal II-1, II-2, II-3, and II-4 decrease faster than those of coal III-1, III-2, III-3, and III-4, respectively, during Stage 2. This may be due to the confining pressure of the UCP-RAS test being higher than that of the CTC test during Stage 2. Secondly, permeability under UCP-RAS tests increase immediately when Stage 3 starts, while the permeability under the CTC tests increases near the peak strength. Thirdly, the higher degree of UCP has a larger increase of permeability during Stage 3. Fourthly, permeability under the UCP-RAS test during Stage 4 increases faster than those under the CTC test.
Figure 12. Permeability evolution with deviatoric stress: (a) for coal II-1 and III-1; (b) for coal II-2 and III-2; (c) for coal II-3 and III-3; (d) for coal II-4 and III-4 (Stage 2, Stage 3, and Stage 4 with reference to Stress Path II).
Figure 12. Permeability evolution with deviatoric stress: (a) for coal II-1 and III-1; (b) for coal II-2 andIII-2; (c) for coal II-3 and III-3; (d) for coal II-4 and III-4 (Stage 2, Stage 3, and Stage 4 with reference toStress Path II).

Energies 2017, 10, 292 12 of 19
3.4. Cohesion and Friction Angle Calculated by the UCP-RAS Test
Figure 13 presents the Mohr’s stress circle under the CTC test and UCP-RAS test. The results showthat both coal specimens under the CTC test and UCP-RAS test agree well with the Mohr-Coulombfailure criterion. The cohesion and internal friction angle were calculated by fitting the peak strengthMohr’s circles under four different confining pressures. The results show that the cohesion andinternal friction angle calculated by UCP-RAS are lower at 4.57% and 15.18% than that calculatedby the CTC test. This indicates that the strength parameters of coal after suffering UCP have beenreduced, especially the internal friction angle.
1
Figure 13. Mohr’s stress circle of coal specimens: (a) under the CTC test; (b) under the UCP-RAS test.
3.5. Error Analysis of Experiments
On one hand, the stress–strain curves of coal I-0 and coal III-0 during Stage 2 (elastic deformationstage) are consistent with relative average deviations of elasticity modulus of 4.01% (Figure 6) indicatinghigh replication of the stress–strain of the coal. On the other hand, at the initial hydrostatic pressurestate, the permeability of all coal specimens are from 13.76 × 10⁻¹⁷ to 14.88 × 10⁻¹⁷ m2 showing thecoal specimens’ high consistency with relative average deviations of 1.60% (Table 3). The better fittingdegree of the Mohr’s stress circle under the CTC and UCP-RAS tests can also verify the reliabilityof the results. The measuring errors of the experimental apparatus are <0.1% for stress, strain, andpermeability (Table 1) and the relative average deviations of the material properties of coal blocks(raw coal) are 1.61% for density, 6.31% for BET surface area, 11.99% for porosity, 21.29% for elasticitymodulus, 12.66% for Poisson’s ratio, and 9.72% for Boit coefficient (Table 2). Therefore, it can beinferred that the reconstituted coal specimen from the coal blocks has much smaller relative averagedeviation (for example, 0.66% for density in Table 3). Generally, both the equipment error and materialerror do not affect the reliability of the research results significantly.
4. A Field Case of the Well Collapse Problem during the Process from OBD to UBD
A horizontal test well with a potential well collapse problem lies in the Zhaozhuang well fieldin the southeast slope area of the Qinshui Basin, China (Figure 14). The formation in Zhaozhuangis a structure with the dip angle of 5◦–10◦, with a NW dip direction. Moreover, there are some wideand gentle folds and fault structures resulting in the significant development of joints. The CBMreservoir, whose thickness is 0.79–6.6 m with an average value of 4.53 m, lies in the third coal seamof Zhaozhuang. Its depth is 612.62–768.63 m with an average value of 685.07 m. Its gas content is10.14–21.82 m3/t with an average value of 15.88 m3/t [23]. The in situ stress field mainly contributedby tectonic stress is dominated by horizontal stress.

Energies 2017, 10, 292 13 of 19Energies 2017, 10, 292 13 of 19
Figure 14. In situ stress distribution map of the Zhaozhuang well field (modified after [24] with permission from Kang et al., 2009).
This horizontal test well has a well depth of 1993.24 m and vertical depth of 720 m. The inclined direction of the wellbore is N60°W. OBD with a fluid density of 1.6 g/cm3 was used for drilling the vertical well and kick-off sections. UBD was designed to drill the horizontal section for avoiding reservoir pollution.
Table 4 lists the formation parameters of this research area and the rock mechanical properties tested in our experiments. The formation parameters come from the well log analysis of this horizontal test well. The Poisson ratio and Biot coefficient are the average values of the tests, respectively. It is suspected that an increase of deviatoric stress caused by the decrease of the strength of the coal wellbore due to the UCP squeezes the drill fluid. In order to be against this increase of deviatoric stress, an object of higher drilling fluid density should be designed. For this case, based on the formation condition and rock mechanical properties by CTC testing, the drilling fluid density designed by the method from Ma et al. [25] and Ma and Chen [26] must be larger than 1.017 g/cm3 to avoid wellbore collapse (Figure 15). In real scenarios, the decrease of drilling fluid density was much faster than expected. The field monitoring revealed that the total hydrocarbon content increased significantly when the drilling fluid density reduced to 1.103 g/cm3. This phenomenon indicated that the gas flowed into the wellbore at that moment [27] and may be caused by the failure of coal surrounding the wellbore under the condition of unloading confining pressure as presented in Section 3.3.3. In addition, when the drilling fluid density decreased to 1.103 g/cm3, wellbore collapse appeared and the lower drilling fluid density led to higher hydrocarbon content and more serious wellbore collapse. While using the formation condition and rock mechanical properties from the UCP-RAS test, the drilling fluid density should be greater than 1.176 g/cm3 (Figure 15) for maintaining the stability of the well. Therefore, designing a drilling fluid density of 1.05 g/cm3 based on CTC for UBD is likely underestimated.
Figure 14. In situ stress distribution map of the Zhaozhuang well field (modified after [24] withpermission from Kang et al., 2009).
This horizontal test well has a well depth of 1993.24 m and vertical depth of 720 m. The inclineddirection of the wellbore is N60◦W. OBD with a fluid density of 1.6 g/cm3 was used for drilling thevertical well and kick-off sections. UBD was designed to drill the horizontal section for avoidingreservoir pollution.
Table 4 lists the formation parameters of this research area and the rock mechanical propertiestested in our experiments. The formation parameters come from the well log analysis of this horizontaltest well. The Poisson ratio and Biot coefficient are the average values of the tests, respectively. It issuspected that an increase of deviatoric stress caused by the decrease of the strength of the coal wellboredue to the UCP squeezes the drill fluid. In order to be against this increase of deviatoric stress, an objectof higher drilling fluid density should be designed. For this case, based on the formation conditionand rock mechanical properties by CTC testing, the drilling fluid density designed by the methodfrom Ma et al. [25] and Ma and Chen [26] must be larger than 1.017 g/cm3 to avoid wellbore collapse(Figure 15). In real scenarios, the decrease of drilling fluid density was much faster than expected.The field monitoring revealed that the total hydrocarbon content increased significantly when thedrilling fluid density reduced to 1.103 g/cm3. This phenomenon indicated that the gas flowed intothe wellbore at that moment [27] and may be caused by the failure of coal surrounding the wellboreunder the condition of unloading confining pressure as presented in Section 3.3.3. In addition, whenthe drilling fluid density decreased to 1.103 g/cm3, wellbore collapse appeared and the lower drillingfluid density led to higher hydrocarbon content and more serious wellbore collapse. While using theformation condition and rock mechanical properties from the UCP-RAS test, the drilling fluid densityshould be greater than 1.176 g/cm3 (Figure 15) for maintaining the stability of the well. Therefore,designing a drilling fluid density of 1.05 g/cm3 based on CTC for UBD is likely underestimated.

Energies 2017, 10, 292 14 of 19
Table 4. Formation and rock parameters of the third coal seam.
Formation Parameters
Verticaldepth
(m)
Formationpressure gradient
(MPa/100 m)
Gradient of maximumhorizontal in-situ
stress (MPa/100 m)
Gradient of minimumhorizontal in-situ stress
(MPa/100 m)
Gradient ofvertical stress(MPa/100 m)
Azimuthal angle ofmaximum horizontal
stress (◦)
Porosity(%)
720 1.109 2.46 1.71 2.05 N30W 0.1
Rock parameters
CTC UCP-RAS
Poissonratio Biot coefficient Cohesion
(MPa) Internal friction angle (◦) Poissonratio
Biotcoefficient
Cohesion(MPa)
Internal friction angle(◦)
0.271 0.476 2.494 32.340 0.365 0.532 2.380 27.431
Energies 2017, 10, 292 14 of 19
Table 4. Formation and rock parameters of the third coal seam.
Formation Parameters
Vertical depth (m)
Formation pressure gradient
(MPa/100 m)
Gradient of maximum horizontal in-situ
stress (MPa/100 m)
Gradient of minimum horizontal in-situ
stress (MPa/100 m)
Gradient of vertical stress (MPa/100 m)
Azimuthal angle of maximum
horizontal stress (°)
Porosity (%)
720 1.109 2.46 1.71 2.05 N30W 0.1 Rock parameters
CTC UCP-RAS Poisson
ratio Biot coefficient Cohesion
(MPa) Internal friction
angle (°) Poisson ratio Biot
coefficient Cohesion
(MPa) Internal friction
angle (°) 0.271 0.476 2.494 32.340 0.365 0.532 2.380 27.431
Figure 15. Equivalent collapse fluid density (minimum drilling fluid density for well stability) considering the wellbore azimuthal angle of the horizontal well.
5. Discussion
5.1. The Effect of the UCP Test on the Mechanical Behavior and Permeability of Coal
Unloading confining pressure damages the rock materials to some extent [4]. Figure 16 presents the Mohr’s circles of coal in Stress Paths II and III. For the stress state of Stress Circle S2, the axial stress increases from hydrostatic pressure of σ3 to σ1 and the confining pressure decreases from σ3 to
3σ ′ under Stress Path II while Stress Path II is a simple increase of axial stress from 3σ′ to
σ1. Figure 17 presents the strain of coal specimens at the stress state of Stress Circle S2. It is clearly seen that the strains of the coal specimens under Stress Path II are all greater than these under Stress Path III. This may be due to the vertical fractures being more sensitive to the confining pressure. UCP can lead to the production of a sharp increase of radial strain, resulting in untightening of the pores, voids, and fractures along the vertical direction under an initial deviatoric stress.
This untightening of the pores, voids, and fractures is an inelastic, unrecoverable deformation. The inelastic extension of the radial direction of the coal specimen can reduce the mechanical strength [4]. Therefore, the coal specimens, after suffering the UCP test, could be easily damaged during the RAS test, resulting in the decrease of cohesion and internal friction angle (Section 3.4) and an increase of Poisson ratio (Figure 11). In addition, the pores, voids, and fractures increased, enlarging the permeability of the coal. This reduces the resistant force against the gas seepage in the downstream section of the coal specimen leading the increases of gas pressure in the whole coal specimen. This high gas pressure can accelerate the failure of coal [28].
Figure 15. Equivalent collapse fluid density (minimum drilling fluid density for well stability)considering the wellbore azimuthal angle of the horizontal well.
5. Discussion
5.1. The Effect of the UCP Test on the Mechanical Behavior and Permeability of Coal
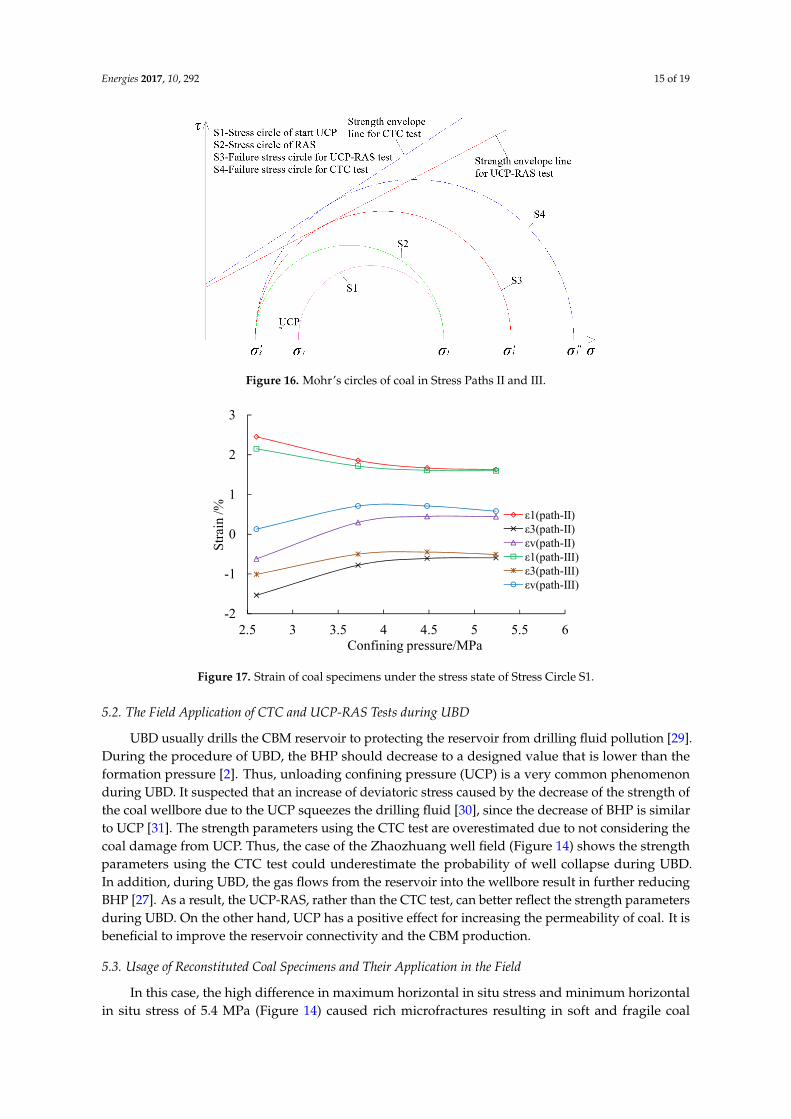
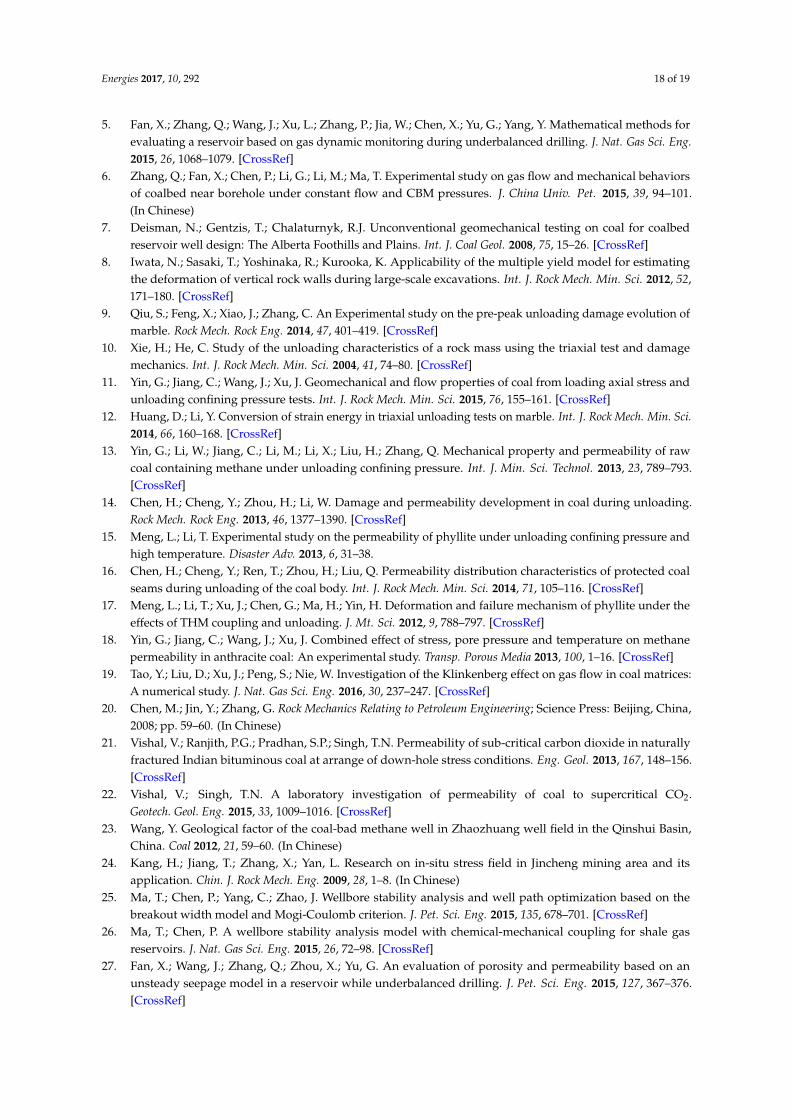
Unloading confining pressure damages the rock materials to some extent [4]. Figure 16 presentsthe Mohr’s circles of coal in Stress Paths II and III. For the stress state of Stress Circle S2, the axial stressincreases from hydrostatic pressure of σ3 to σ1 and the confining pressure decreases from σ3 to σ′3under Stress Path II while Stress Path II is a simple increase of axial stress from σ′3 to σ1. Figure 17presents the strain of coal specimens at the stress state of Stress Circle S2. It is clearly seen that thestrains of the coal specimens under Stress Path II are all greater than these under Stress Path III. Thismay be due to the vertical fractures being more sensitive to the confining pressure. UCP can lead tothe production of a sharp increase of radial strain, resulting in untightening of the pores, voids, andfractures along the vertical direction under an initial deviatoric stress.
This untightening of the pores, voids, and fractures is an inelastic, unrecoverable deformation. Theinelastic extension of the radial direction of the coal specimen can reduce the mechanical strength [4].Therefore, the coal specimens, after suffering the UCP test, could be easily damaged during the RAStest, resulting in the decrease of cohesion and internal friction angle (Section 3.4) and an increaseof Poisson ratio (Figure 11). In addition, the pores, voids, and fractures increased, enlarging thepermeability of the coal. This reduces the resistant force against the gas seepage in the downstreamsection of the coal specimen leading the increases of gas pressure in the whole coal specimen. Thishigh gas pressure can accelerate the failure of coal [28].
Energies 2017, 10, 292 15 of 19Energies 2017, 10, 292 15 of 19
Figure 16. Mohr’s circles of coal in Stress Paths II and III.
-2
-1
0
1
2
3
2.5 3 3.5 4 4.5 5 5.5 6
ε1(path-II)ε3(path-II)εv(path-II)ε1(path-III)ε3(path-III)εv(path-III)
Confining pressure/MPa
Stra
in/%
Figure 17. Strain of coal specimens under the stress state of Stress Circle S1.
5.2. The Field Application of CTC and UCP-RAS Tests during UBD
UBD usually drills the CBM reservoir to protecting the reservoir from drilling fluid pollution [29]. During the procedure of UBD, the BHP should decrease to a designed value that is lower than the formation pressure [2]. Thus, unloading confining pressure (UCP) is a very common phenomenon during UBD. It suspected that an increase of deviatoric stress caused by the decrease of the strength of the coal wellbore due to the UCP squeezes the drilling fluid [30], since the decrease of BHP is similar to UCP [31]. The strength parameters using the CTC test are overestimated due to not considering the coal damage from UCP. Thus, the case of the Zhaozhuang well field (Figure 14) shows the strength parameters using the CTC test could underestimate the probability of well collapse during UBD. In addition, during UBD, the gas flows from the reservoir into the wellbore result in further reducing BHP [27]. As a result, the UCP-RAS, rather than the CTC test, can better reflect the strength parameters during UBD. On the other hand, UCP has a positive effect for increasing the permeability of coal. It is beneficial to improve the reservoir connectivity and the CBM production.
5.3. Usage of Reconstituted Coal Specimens and Their Application in the Field
In this case, the high difference in maximum horizontal in situ stress and minimum horizontal in situ stress of 5.4 MPa (Figure 14) caused rich microfractures resulting in soft and fragile coal blocks of the third coal seam. It is not easy to collect an intact coal block for preparing a raw coal specimen. Additionally, the difference of test data of reconstituted coal and raw coal is not
Figure 16. Mohr’s circles of coal in Stress Paths II and III.
Energies 2017, 10, 292 15 of 19
Figure 16. Mohr’s circles of coal in Stress Paths II and III.
-2
-1
0
1
2
3
2.5 3 3.5 4 4.5 5 5.5 6
ε1(path-II)ε3(path-II)εv(path-II)ε1(path-III)ε3(path-III)εv(path-III)
Confining pressure/MPa
Stra
in/%
Figure 17. Strain of coal specimens under the stress state of Stress Circle S1.
5.2. The Field Application of CTC and UCP-RAS Tests during UBD
UBD usually drills the CBM reservoir to protecting the reservoir from drilling fluid pollution [29]. During the procedure of UBD, the BHP should decrease to a designed value that is lower than the formation pressure [2]. Thus, unloading confining pressure (UCP) is a very common phenomenon during UBD. It suspected that an increase of deviatoric stress caused by the decrease of the strength of the coal wellbore due to the UCP squeezes the drilling fluid [30], since the decrease of BHP is similar to UCP [31]. The strength parameters using the CTC test are overestimated due to not considering the coal damage from UCP. Thus, the case of the Zhaozhuang well field (Figure 14) shows the strength parameters using the CTC test could underestimate the probability of well collapse during UBD. In addition, during UBD, the gas flows from the reservoir into the wellbore result in further reducing BHP [27]. As a result, the UCP-RAS, rather than the CTC test, can better reflect the strength parameters during UBD. On the other hand, UCP has a positive effect for increasing the permeability of coal. It is beneficial to improve the reservoir connectivity and the CBM production.
5.3. Usage of Reconstituted Coal Specimens and Their Application in the Field
In this case, the high difference in maximum horizontal in situ stress and minimum horizontal in situ stress of 5.4 MPa (Figure 14) caused rich microfractures resulting in soft and fragile coal blocks of the third coal seam. It is not easy to collect an intact coal block for preparing a raw coal specimen. Additionally, the difference of test data of reconstituted coal and raw coal is not
Figure 17. Strain of coal specimens under the stress state of Stress Circle S1.
5.2. The Field Application of CTC and UCP-RAS Tests during UBD
UBD usually drills the CBM reservoir to protecting the reservoir from drilling fluid pollution [29].During the procedure of UBD, the BHP should decrease to a designed value that is lower than theformation pressure [2]. Thus, unloading confining pressure (UCP) is a very common phenomenonduring UBD. It suspected that an increase of deviatoric stress caused by the decrease of the strength ofthe coal wellbore due to the UCP squeezes the drilling fluid [30], since the decrease of BHP is similarto UCP [31]. The strength parameters using the CTC test are overestimated due to not considering thecoal damage from UCP. Thus, the case of the Zhaozhuang well field (Figure 14) shows the strengthparameters using the CTC test could underestimate the probability of well collapse during UBD.In addition, during UBD, the gas flows from the reservoir into the wellbore result in further reducingBHP [27]. As a result, the UCP-RAS, rather than the CTC test, can better reflect the strength parametersduring UBD. On the other hand, UCP has a positive effect for increasing the permeability of coal. It isbeneficial to improve the reservoir connectivity and the CBM production.
5.3. Usage of Reconstituted Coal Specimens and Their Application in the Field
In this case, the high difference in maximum horizontal in situ stress and minimum horizontalin situ stress of 5.4 MPa (Figure 14) caused rich microfractures resulting in soft and fragile coal

Energies 2017, 10, 292 16 of 19
blocks of the third coal seam. It is not easy to collect an intact coal block for preparing a raw coalspecimen. Additionally, the difference of test data of reconstituted coal and raw coal is not significant;for example, deviation of reconstituted coal is 4.23% for Poisson’s ratio and 10.19% for the Boitcoefficient compared to the values of raw coal calculated by the data in Tables 2 and 4. In addition,the references of Liu et al. [32] and Jasinge et al. [33] indicated most variation tendencies of thephysical properties of reconstituted coal and raw coal were consistent. Other aspects, such as thehighly heterogeneous nature of coal, sometimes makes it difficult to interpret the results of laboratoryexperiments. Due to the heterogeneity of natural materials property, calculation and measurementof parameters are not often precise. This makes it difficult to characterize and understand the coalproperties for developing ideal models for optimization of sequestration processes and generatinguseful correlations [34]. More homogeneous samples with properties reproducible in the laboratorywould provide significant advantages, especially in understanding the effects of various factors inthe properties of coal [35–38]. Therefore, in this study, reconstituted coal specimens were used inthe laboratory experiments. It should be known that the results obtained by the reconstituted coalspecimens, although having the advantage of good regularity to investigate the effect of UCP on themechanical behavior and permeability during reloading axial stress, do not accurately represent theactual mechanical behavior of the in situ coal field. However, to some extent, the results can reflectthe universal law from the perspective of engineering practice. It has some value in application ofcoalbed methane drilling engineering. We also have to point out this study mainly focuses on thesoft rocks, like coal, whose mechanical behavior and permeability are sensitive to the UCP. Since coalunder different UCP shows non-uniform damage, the cohesion and friction angle of coal specimensmay not be calculated by the Mohr-Coulomb failure criterion very precisely.
6. Conclusions
A series of experimental studies were conducted to measure the mechanical behavior and gaspermeability of coal in CTC and UCP-RAS tests. We also discussed the cause of overestimation of coalwellbore stability using the CTC test. Based on these results, several conclusions can be drawn.
Firstly, the mechanical behavior of coal under the UCP-RAS test is lower than that under theCTC test, including (1) the peak deviatoric stress of coal by UCP-RAS is much smaller; (2) the coalsuffering the UCP test has a shorter elastic deformation and a higher UCP degree, leading to aninelastic deformation; (3) the deformation modulus of coal by UCP-RAS reduces faster; (4) during theUCP test the coal has a higher lateral expansion ratio; (5) both the cohesion and internal friction angleof coal under the UCP-RAS test are lower.
Secondly, under the UCP-RAS test the permeability of coal increases immediately when theconfining pressure reduces, and the higher degree of UCP has a larger increase of permeability. Thepermeability of coal suffering the UCP test increases faster and the higher UCP degree leads to a fasterincrease of permeability during the RAS test.
Finally, a significant increase of equivalent collapse density was calculated by using the rockparameters of the UCP-RAS test. Thus, during UBD measuring the rock mechanical parameters couldcome from the UCP-RAS test rather than the CTC test.
Acknowledgments: The financial support obtained from the National Natural Science Foundation of China(Grant No. 51474185), Scientific Research Foundation of State Key Lab. of Coal Mine Disaster Dynamics andControl (2011DA105287-FW201203), the China Postdoctoral Science Foundation (Grant No. 2014M560728), andthe Young Scholars Development Fund of SWPU (Grant No. 201231010031) is appreciated.
Author Contributions: Drafting of manuscript: Wen Nie and Qiangui Zhang; acquisition of data:Yongchang Liang and Minghui Li; analysis and interpretation of data: Qiangui Zhang and Wen Nie; Model inthe case: Tianshou Ma; Real measurement data in the case: Guangzhi Li, and planning and supervision of theresearch: Xiangyu Fan.
Conflicts of Interest: The authors declare no conflict of interest.

Energies 2017, 10, 292 17 of 19
Abbreviations
The following abbreviations are used in this manuscript:
σr radial stress at the wellbore in cylindrical coordinate system, MPaσθ circumferential stress at the wellbore in cylindrical coordinate system, MPaσz axial stress at the wellbore in cylindrical coordinate system, MPaσrθ stress in r-θ plane at the wellbore in cylindrical coordinate system, MPaσθz stress in θ-z plane at the wellbore in cylindrical coordinate system, MPaσrz stress in r-z plane at the wellbore in cylindrical coordinate system, MPaσv vertical stress, MPaσH maximum horizontal in-situ stress, MPaσh minimum horizontal in-situ stress, MPapi bottle hole pressure (BHP), MPapp formation pressure, MPaφ porosity of the formation, 1υ Poisson’s ratio, 1α boit coefficient, 1ψ angle of inclination, ◦
ωangle from the direction of maximum horizontal stress to the projection line ofwell axis into the Cartesian coordinate (x1, y1, z1), ◦
θthe angle from the x direction in the Carteesian coordinate to the direction ofradius vector, ◦
K permeability, m2
q gas permeation rate, m3/sµ gas kinematic viscosity, PasL length of the coal specimens, mS cross-sectional area of the coal specimens, m2
P1 gas pressure at the upper stream of specimens, PaP2 gas pressure at the downstream of the specimens, Paε1 axial strain, %ε3 radial strain, %εV the volumetric strain, %σ1 the axial stress on coal speicmen, MPaσ3 the radial stress on coal speicmen, MPaE0 deformation modulus, GPaµ0 lateral expansion ratio, 1K1 the coefficient related permeation, 1A, B, C, D, E,F, D, H, I, J
undetermined coefficients, 1
References
1. Tian, L.; Cao, Y.; Chai, X.; Liu, T.; Feng, P.; Feng, H.; Zhou, D.; Shi, B.; Oestreich, R.; Rodvelt, G. Best practicesfor the determination of low-pressure/permeability coalbed methane reservoirs, Yuwu Coal Mine, Luanmining area, China. Fuel 2015, 160, 100–107. [CrossRef]
2. He, S.; Wang, W.; Shen, H.; Tang, M.; Liang, H.; Lu, J. Factors influencing wellbore stability duringunderbalanced drilling of horizontal wells-When fluid seepage is considered. J. Nat. Gas Sci. Eng. 2015, 23,80–89. [CrossRef]
3. Kaffash, A.; Zare-Reisabadi, M.R. Borehole stability evaluation in overbalanced and underbalanced drilling:Based on 3D failure criteria. Geosyst. Eng. 2013, 16, 175–182. [CrossRef]
4. Yin, G.; Li, M.; Wang, J.; Xu, J.; Li, W. Mechanical behavior and permeability evolution of gas infiltrated coalsduring protective layer mining. Int. J. Rock Mech. Min. Sci. 2015, 80, 292–301. [CrossRef]
Energies 2017, 10, 292 18 of 19
5. Fan, X.; Zhang, Q.; Wang, J.; Xu, L.; Zhang, P.; Jia, W.; Chen, X.; Yu, G.; Yang, Y. Mathematical methods forevaluating a reservoir based on gas dynamic monitoring during underbalanced drilling. J. Nat. Gas Sci. Eng.2015, 26, 1068–1079. [CrossRef]
6. Zhang, Q.; Fan, X.; Chen, P.; Li, G.; Li, M.; Ma, T. Experimental study on gas flow and mechanical behaviorsof coalbed near borehole under constant flow and CBM pressures. J. China Univ. Pet. 2015, 39, 94–101.(In Chinese)
7. Deisman, N.; Gentzis, T.; Chalaturnyk, R.J. Unconventional geomechanical testing on coal for coalbedreservoir well design: The Alberta Foothills and Plains. Int. J. Coal Geol. 2008, 75, 15–26. [CrossRef]
8. Iwata, N.; Sasaki, T.; Yoshinaka, R.; Kurooka, K. Applicability of the multiple yield model for estimatingthe deformation of vertical rock walls during large-scale excavations. Int. J. Rock Mech. Min. Sci. 2012, 52,171–180. [CrossRef]
9. Qiu, S.; Feng, X.; Xiao, J.; Zhang, C. An Experimental study on the pre-peak unloading damage evolution ofmarble. Rock Mech. Rock Eng. 2014, 47, 401–419. [CrossRef]
10. Xie, H.; He, C. Study of the unloading characteristics of a rock mass using the triaxial test and damagemechanics. Int. J. Rock Mech. Min. Sci. 2004, 41, 74–80. [CrossRef]
11. Yin, G.; Jiang, C.; Wang, J.; Xu, J. Geomechanical and flow properties of coal from loading axial stress andunloading confining pressure tests. Int. J. Rock Mech. Min. Sci. 2015, 76, 155–161. [CrossRef]
12. Huang, D.; Li, Y. Conversion of strain energy in triaxial unloading tests on marble. Int. J. Rock Mech. Min. Sci.2014, 66, 160–168. [CrossRef]
13. Yin, G.; Li, W.; Jiang, C.; Li, M.; Li, X.; Liu, H.; Zhang, Q. Mechanical property and permeability of rawcoal containing methane under unloading confining pressure. Int. J. Min. Sci. Technol. 2013, 23, 789–793.[CrossRef]
14. Chen, H.; Cheng, Y.; Zhou, H.; Li, W. Damage and permeability development in coal during unloading.Rock Mech. Rock Eng. 2013, 46, 1377–1390. [CrossRef]
15. Meng, L.; Li, T. Experimental study on the permeability of phyllite under unloading confining pressure andhigh temperature. Disaster Adv. 2013, 6, 31–38.
16. Chen, H.; Cheng, Y.; Ren, T.; Zhou, H.; Liu, Q. Permeability distribution characteristics of protected coalseams during unloading of the coal body. Int. J. Rock Mech. Min. Sci. 2014, 71, 105–116. [CrossRef]
17. Meng, L.; Li, T.; Xu, J.; Chen, G.; Ma, H.; Yin, H. Deformation and failure mechanism of phyllite under theeffects of THM coupling and unloading. J. Mt. Sci. 2012, 9, 788–797. [CrossRef]
18. Yin, G.; Jiang, C.; Wang, J.; Xu, J. Combined effect of stress, pore pressure and temperature on methanepermeability in anthracite coal: An experimental study. Transp. Porous Media 2013, 100, 1–16. [CrossRef]
19. Tao, Y.; Liu, D.; Xu, J.; Peng, S.; Nie, W. Investigation of the Klinkenberg effect on gas flow in coal matrices:A numerical study. J. Nat. Gas Sci. Eng. 2016, 30, 237–247. [CrossRef]
20. Chen, M.; Jin, Y.; Zhang, G. Rock Mechanics Relating to Petroleum Engineering; Science Press: Beijing, China,2008; pp. 59–60. (In Chinese)
21. Vishal, V.; Ranjith, P.G.; Pradhan, S.P.; Singh, T.N. Permeability of sub-critical carbon dioxide in naturallyfractured Indian bituminous coal at arrange of down-hole stress conditions. Eng. Geol. 2013, 167, 148–156.[CrossRef]
22. Vishal, V.; Singh, T.N. A laboratory investigation of permeability of coal to supercritical CO2.Geotech. Geol. Eng. 2015, 33, 1009–1016. [CrossRef]
23. Wang, Y. Geological factor of the coal-bad methane well in Zhaozhuang well field in the Qinshui Basin,China. Coal 2012, 21, 59–60. (In Chinese)
24. Kang, H.; Jiang, T.; Zhang, X.; Yan, L. Research on in-situ stress field in Jincheng mining area and itsapplication. Chin. J. Rock Mech. Eng. 2009, 28, 1–8. (In Chinese)
25. Ma, T.; Chen, P.; Yang, C.; Zhao, J. Wellbore stability analysis and well path optimization based on thebreakout width model and Mogi-Coulomb criterion. J. Pet. Sci. Eng. 2015, 135, 678–701. [CrossRef]
26. Ma, T.; Chen, P. A wellbore stability analysis model with chemical-mechanical coupling for shale gasreservoirs. J. Nat. Gas Sci. Eng. 2015, 26, 72–98. [CrossRef]
27. Fan, X.; Wang, J.; Zhang, Q.; Zhou, X.; Yu, G. An evaluation of porosity and permeability based on anunsteady seepage model in a reservoir while underbalanced drilling. J. Pet. Sci. Eng. 2015, 127, 367–376.[CrossRef]

Energies 2017, 10, 292 19 of 19
28. Nie, W.; Peng, S.; Xu, J.; Liu, L.; Wang, G.; Geng, J. Experimental analyses of the major parameters affectingthe intensity of outbursts of coal and gas. Sci. World J. 2014, 2014, 185608.
29. Lim, S.N.; Khalil, M.; Jan, B.M.; Ali, B.S. Lightweight biopolymer drilling fluid for underbalanced drilling:An optimization study. J. Pet. Sci. Eng. 2015, 129, 178–188. [CrossRef]
30. Gentzis, T.; Deisman, N.; Chalaturnyk, R.J. A method to predict geomechanical properties and model wellstability in horizontal boreholes. Int. J. Coal Geol. 2009, 78, 149–160. [CrossRef]
31. He, S.; Wang, W.; Tang, M.; Hu, B.; Xue, W. Effects of fluid seepage on wellbore stability of horizontal wellsdrilled underbalanced. J. Nat. Gas Sci. Eng. 2014, 21, 338–347. [CrossRef]
32. Liu, Q.; Cheng, Y.; Ren, T.; Jing, H.; Tu, Q.; Dong, J. Experimental observations of matrix swelling areapropagation on permeability evolution using natural and reconstituted samples. J. Nat. Gas Sci. Eng. 2016,34, 680–688. [CrossRef]
33. Jasinge, D.; Ranjith, P.G.; Choi, X.; Fernando, J. Investigation of the influence of coal swelling on permeabilitycharacteristics using natural brown coal and reconstituted brown coal specimens. Energy 2012, 39, 303–309.[CrossRef]
34. Vishal, V.; Ranjith, P.G.; Singh, T.N. Geomechanical attributes of reconstituted indian coals under carbondioxide saturation. In Rock Mechanics for Resources, Energy and Environment; CRC Press: Boca Raton, FL, USA,2013; pp. 171–173.
35. Jasinge, D.; Ranjith, P.G.; Choi, S.K.; Kodikara, J.; Arthur, M.; Li, H. Mechanical properties of reconstitutedAustralian black coal. J. Geotech. Geoenviron. Eng. 2009, 135, 980–985. [CrossRef]
36. Ranjith, P.G.; Jasinge, D.; Choi, S.K.; Mehic, M.; Shannon, B. The effect of CO2 saturation on mechanicalproperties of Australian black coal using acoustic emission. Fuel 2010, 89, 2110–2117. [CrossRef]
37. Jasinge, D.; Ranjith, P.G.; Choi, S.K. Development of a reconstituted brown coal material using cement as abinder. Environ. Earth Sci. 2011, 64, 631–641. [CrossRef]
38. Ranjith, P.G.; Shao, S.S.; Jaysinge, D.R. V.D. Carbon dioxide storage in coal-reconstituted coal as a structurallyhomogeneous substitute for coal. Int. J. Coal Prep. Util. 2012, 32, 265–275.
© 2017 by the authors. Licensee MDPI, Basel, Switzerland. This article is an open accessarticle distributed under the terms and conditions of the Creative Commons Attribution(CC BY) license (http://creativecommons.org/licenses/by/4.0/).
Powered by TCPDF (www.tcpdf.org)