mechanical and thermal properties of fly ash-based
TRANSCRIPT

Louisiana State UniversityLSU Digital Commons
LSU Master's Theses Graduate School
2014
Mechanical and Thermal Properties of Fly Ash-based Geopolymer CementFenghong FanLouisiana State University and Agricultural and Mechanical College, [email protected]
Follow this and additional works at: https://digitalcommons.lsu.edu/gradschool_theses
Part of the Civil and Environmental Engineering Commons
This Thesis is brought to you for free and open access by the Graduate School at LSU Digital Commons. It has been accepted for inclusion in LSUMaster's Theses by an authorized graduate school editor of LSU Digital Commons. For more information, please contact [email protected].
Recommended CitationFan, Fenghong, "Mechanical and Thermal Properties of Fly Ash-based Geopolymer Cement" (2014). LSU Master's Theses. 2579.https://digitalcommons.lsu.edu/gradschool_theses/2579

MECHANICAL AND THERMAL PROPERTIES OF FLY ASH-BASED
GEOPOLYMER CEMENT
A Thesis
Submitted to the Graduate Faculty of the
Louisiana State University and
Agricultural and Mechanical College
in partial fulfillment of the
requirements for the degree of
Master of Science in Civil Engineering
in
The Department of Civil and Environmental Engineering
by
Fenghong Fan
B.S., Hunan University, 2007
M.S., Hunan University, 2010
May 2015

ii
ACKNOWLEDGEMENTS
First of all, I thank Dr. Steve Cai, who offered me the chance to study at LSU from
2010 fall and offered me two year and half’s assistantship even when I was in severe
depression in 2012 and also guided me through the whole research and thesis writing
process.
Second, I am very thankful to Schlumberger Foundation Faculty for the Future for
their financial support and Boral Material Technologies providing the free class F fly ash
materials for my research.
I also want to express my appreciation to Dr. Ying Wang and Dr. Michele Barbato for
their service on the advisory committee, providing keen comments and insightful
suggestions. Thank Dr. Ying Wang for teaching me in x-ray diffraction (XRD) analysis
and characterization of microstucture (SEM-EDXS).
Many thanks go to my research group members- Hui Peng, Zhen Liu, Xingyun Xiang,
Xuan Kong, Bo Kong, Fang Pan, Wei Zhang, Miao Xia, Ye Zhang, etc. Also great
thanks for Dr. Jian He and Dr. Guoping Zhang’s help in my research.
Thank my husband Guoji Xu, who always helps and supports me in my research and
life! And also thank all my family members!
Finally, thank Lord Jesus Christ! He is my salvation, refuge, strength, and rest. He is
also my doctor, friend, lover, and father. He is also my peace, joy, and satisfaction. He is!
Whatever I need, He is!
God bless you all!
iii
TABLE OF CONTENTS
ACKNOWLEDGEMENTS ................................................................................................ ii
ABSTRACT ........................................................................................................................ v
CHAPTER 1 INTRODUCTION ........................................................................................ 1
1.1 Geopolymer Technology .......................................................................................... 1
1.2 Factors Affecting the Geopolymerization ................................................................. 3
1.2.1 Raw Materials ..................................................................................................... 4
1.2.2 Alkali-activators ................................................................................................. 5
1.2.3 Si/Al Ratio .......................................................................................................... 6
1.2.4 Water/ash Ratio .................................................................................................. 6
1.2.5 Curing Regimes .................................................................................................. 7
1.2.6 Plasticizers and Retardants ................................................................................. 8
1.3 Thermal Properties of Geopolymers ......................................................................... 8
1.4 Limitations .............................................................................................................. 10
1.5 Overview of the Thesis ........................................................................................... 10
CHAPTER 2 THE PROPERTIES OF GEOPOLYMER CEMENTS ACTIVATED BY
DIFFERENT ALKALI-ACTIVATORS .......................................................................... 12
2.1 Introduction ............................................................................................................. 12
2.2 Materials and Experimental Methods ..................................................................... 12
2.2.1 Materials ........................................................................................................... 12
2.2.2 Sample Preparation ........................................................................................... 14
2.2.3 Geopolymer Synthesis and Characterization .................................................... 18
2.3 Results and Discussion ........................................................................................... 21
2.3.1 NaOH Activated Fly Ash Based Geopolymer Cement (G1) ............................ 21
2.3.2 NaOH and Na2SiO3 Activated Fly Ash Geopolymer Cement (G2) ................. 29
2.3.3 KOH and Na2SiO3 Activated Fly Ash Geopolymer Cement (G3) ................... 37
2.4 Conclusions ............................................................................................................. 42
CHAPTER 3 THERMO-MECHANICAL PROPERTIES OF KOH AND Na2SiO3
ACTIVATED FLY ASH-BASED GEOPOLYMER CEMENT ...................................... 44
3.1. Introduction ............................................................................................................ 44
3.2 Materials and Experimental Methods ..................................................................... 44
3.2.1 Materials ........................................................................................................... 44
3.2.2 Sample Preparation ........................................................................................... 45
3.2.3 Geopolymer Synthesis and Characterization .................................................... 46
3.3 Results and Discussion ........................................................................................... 48
3.3.1 General Observation of Geopolymer Cement .................................................. 48
3.3.2 Factors Affecting the Thermo-mechanical Properties of Geopolymer Cement 51
3.3.3 Weight Loss after Elevated Temperature ......................................................... 60
3.3.4 Thermal Contraction/Expansion ....................................................................... 62
3.3.5 Density and Softening Temperature ................................................................. 64
3.3.6 X-Ray Diffraction (XRD) Analysis .................................................................. 65

iv
3.3.7 Characterization of Microstucture (SEM-EDXS) ............................................ 67
3.4 Conclusions ............................................................................................................. 83
CHAPTER 4 CONCLUSIONS ........................................................................................ 85
REFERENCES ................................................................................................................. 88
VITA ................................................................................................................................. 92

v
ABSTRACT
The geopolymer concrete is a more durable and green material with less CO2
emission and less energy consuming as compared with the widely used Portland cement
(PC) concrete. In this thesis, an experimental study of the thermo-mechanical properties
of a cement prepared using a class F fly ash and three different alkali-activators (NaOH
activator, NaOH and Na2SiO3 mixture activator, and KOH and Na2SiO3 mixture activator)
is presented. The mechanical properties, including the compressive strength, shrinkage,
weight loss, and chemical composition, are investigated utilizing several key tools, such
as X-ray Diffraction (XRD), Scanning Electron Microscopy (SEM), and Energy
Dispersive X-ray Spectroscopy (EDXS) measurements. The effects of the water/ash ratio,
curing methods, cooling methods, and sealing degree on the compressive strength and
thermal properties of the geopolymer products are studied and analyzed in details.
The tested results show that the geopolymer cement cured at appropriate conditions
can reach a compressive strength of more than 100MPa and it also has an excellent heat
resistance with a remarkable strength after the 500oC heating. In addition, it is found that
the studied geopolymer cement possesses a much higher spallation resistance when
suddenly cooled down by water after the high temperature heating than the ordinary
Portland cement concrete which has a high spallation tendency. These findings indicate
that the geopolymer cement may be an excellent construction material for the fire-
protection and fire-prone structures.

1
CHAPTER 1 INTRODUCTION
1.1 Geopolymer Technology
Currently, the Portland cement concrete is extensively used with a general life of
about 100 years and maybe 150 years for bridge engineering. In real life, the lifetime of
concrete structures is less than the expect design time owing to the original design and
construction errors, potential damages caused by mechanical actions and environmental
effects, and changes in functionality, etc. However, many previous studies reveal that old
Egyptians already knew how to build huge concrete blocks which can last for thousands
of years. It has been proven by the book titled “Why the pharaohs built the pyramids with
fake stones?” (Davidovits, 1984, 2009) that the building material used in the construction
of the pyramids at Giza as well as in other ancient constructions is made of geopolymer
concrete. During the summer of 2002, one team from the Geopolymer Institute
experimented with the fabrication of five blocks, 12 tones in total, resembling those of
the pyramids of Giza by using only those tools that have been found by archaeologists: a
hoe to collect the aggregate, a basket to transport it, a wooden mold, a trough, a ladder, a
square, a plumb line, a level, a float etc. It is well expected that geopolymers have great
potential to replace Portland cement concrete as the main building materials to build new
structures in the future.
Geopolymer, first coined by the French scientist Joseph Davidovits, is a class of
inorganic polymers formed by reacting silica-rich and alumina-rich solids with a high
alkaline solution, which combines the properties of polymers, ceramics, and cements
(Davidovits, 1994; Lecomte et al. 2003; Verdolotti, 2008). Prof. Davidovits, a French
scientist, proved that the Pyramids in Egypt 5000 years ago and the Great Wall in China
in Song Dynasty 600 years ago were all built by geopolymer technology (Davidovits,

2
2011). The geopolymer concrete has been recognized as a more durable “green” material
with less CO2 emission and less energy consuming as compared with the widely used
Portland cement (PC) concrete. It is predicted that the geopolymer will replace the
traditional cement and will lead to a revolution in civil engineering. Every great
breakthrough in the civil engineering history is due to the research and application of new
materials in civil engineering, such as the occurrence of concrete and steel, etc.
Geopolymers in general possess excellent physical and chemical properties: (1)
exceptional heat/fire performance; (2) nontoxic, thus will not release toxic gas when on
fire or heating; (3) better durability (thus can last for five thousand years as the pyramids):
not degrade under the UV light, and highly corrosion-resistant, which can resist all
organic solvents and acids resistant (Hardjjito, 2004, 2005; Song X-J, Marosszeky M,
Brung M, Chang Z-T, 2005); (4) less energy consuming and could be synthesized from
various low-cost materials, for instance, the fly ash-based geopolymer concrete is
estimated to be about 10 to 30 percent cheaper than that of the Portland cement concrete,
according Rangan, (2008). In addition, they have less greenhouse gas CO2 emission, six
to nine times less than the traditional Portland cement based on the study by
Davidovits(1993); (5) the heat-cured fly ash-based geopolymer undergoes low creep and
very little drying shrinkage (Hardjito 2004, 2005); (6) no Alkali-Aggregate-Reaction
(Davidovitts, 2013); (7) chemically compatible with concrete, and also adhere well to
carbon, glass fabrics, wood, and steel; (8) unlike Ca-based cements, the water is present
only to facilitate the workability and does not incorporate in the geopolymer crystal
structure, which renders the geopolymer more resistant to the water penetration and the
heat/fire (Davidovits 2008; Lloyd et al. 2009).

3
Geopolymers can be taken as a new binder for coating and adhesives, fiber
composites, and waste encapsulation. The usage and properties of geopolymers are being
explored in many scientific and industrial areas: chemistry, mineralogy, and geology. As
stated by Davidovits (2011) that “The wide variety of potential applications includes: fire
resistant materials, decorative stone artifacts, thermal insulation, low-tech building
materials, low energy ceramic tiles, refractory items, thermal shock refractories, foundry
applications, cements and concretes, composites for infrastructures repair and
strengthening, high-tech composites for aircraft interior and automobile, high-tech resin
systems, radioactive and toxic waste containment, arts and decoration, cultural heritage,
archaeology and history of sciences.”
Nowadays, geopolymer is being paid extensive attention due to its potential and
diverse applications to replace organic polymers and inorganic cements. Its exceptional
features, including high thermal and chemical stability, competitive mechanical strength,
adhesive behavior and long-term durability, make it a viable economical and
environmentally friendly material. Many industrial by-products and other kinds of
minerals can be utilized to produce the geopolymers (Cheng and Chiu 2003; He, J. et al.
2012).
1.2 Factors Affecting the Geopolymerization
The properties of constituent materials and the chemical composition in the
geopolymers dominate the mechanical properties of the geopolymer end products, the
same way for the Portland cement concrete. The experimental data with various
properties are essential to make the general guidance and further explorations can be
made based on the justification and verification with the as-established acknowledgement
(Hardjito et al. 2004).

4
The geopolymerization reaction is very sensitive to different raw materials (particle
size and distribution, crystallization degree, etc.), different alkali-activators
(Sodium/potassium hydroxide, Sodium/potassium silicate, and the ratio of these two,
etc.), different Si/Al ratios, different water/ash ratios, different curing conditions
(temperature, moisture degree, opening or healing condition, curing time, etc.). Different
mechanical and thermal properties of geopolymer cement will be produced according to
different raw materials, alkali-activators, Si/Al ratios, water/ash ratios, and curing
conditions.
1.2.1 Raw Materials
Raw materials must constitute a large portion of Aluminum and Silica, inorganic
non-metallic minerals and industrial waste, of which the main active ingredient is
aluminum silicate. There are different kinds of raw materials that can be used to produce
geopolymer cement, such as fly ash, red mud, metakaolin, natural pozzolan, blast steel
slag, rice husk ash, and etc. In this study, the class F fly ash is used to form the
geopolymer cement. Geopolymers possess different mechanical and thermal properties
due to different raw materials, such as their variable chemical composition, particle size
(fineness) and particle shape. Most of the recent studies are found focusing on the
mechanical and thermal properties of the fly ash based geopolymers.
It is observed that a higher content of the glass phase will ensure a higher degree of
geopolymerization, and thus resulting in a higher compressive strength. In addition, finer
fly ash balls will lead to a relatively larger contacting surface area and hence higher
reactivity can be guaranteed. Both the utilization of higher combustion temperatures and
the grinding of the fly ash can make the fly ash balls much finer (Diaz, 2010). Further, a
small portion of unburned coal in the fly ash will require a higher ratio of the alkali-

5
activators to the fly ash, resulting in detrimental influence on the mechanical properties of
the final geopolymer products (Diaz, 2009).
1.2.2 Alkali-activators
For the alkali-activators, several choices are adopted. Alkali metal hydroxide
(sodium hydroxide), carbonate, sulfate, phosphate, and fluoride (few studies) can be used
as the activators. Silicate and aluminum silicate enrich the alkaline activator species in a
large degree.
1.2.2.1 NaOH
Higher NaOH dosages can result in a better workability, higher 1-, 7-, and 8-day
strengths, and shorter demolding time. But too much (excessive) NaOH concentration
would adversely affects the strength. The optimal NaOH content depends on other
mixture constituents. The concentration of sodium hydroxide (NaOH) liquid measured in
terms of Molarity (Mol/L) is better in the range of 8 to 16 M (Mol/L). To check which
one influences the properties of the geopolymers more, the Na+ or the OH
—, the study by
Hardjito (2004) concluded that it is the OH— that influences the compressive strength of
the geopolymers most.
1.2.2.2 KOH
The compressive strength of the K-containing geopolymers is generally higher than
the Na counterparts because Na-containing pastes are more viscous and harder to mix. In
order to reach the same compressive strength level, the amount of Na-solution must
increases by 50% as compared to the K-solution, which means that the Na-based
geopolymers are less user-friendly than the K-based geopolymers (Davidovits, 2011).
1.2.2.3 Na2SiO3
The higher ratio of the sodium silicate to the sodium hydroxide liquid by mass, the

6
higher the compressive strength of the geopolymer concrete is. The reason maybe that
Na2SiO3 improves the Si:Al ratio and hence the compressive strength.
1.2.2.4 Si: Na
Some papers (Hardjito, and Rangan, 2005) mentioned about the increase of
Na2O:Si2O3 decreases the compressive strength of geopolymer.
1.2.3 Si/Al Ratio
Silica and alumina are the main precursors for the geopolymeric reaction, and the
ratio of Si and Al is the fundamental influence factor for the properties of geopolymer.
The Silicon oxide (SiO2) to the aluminum oxide (Al2O3) ratio by mass in the source
material (fly ash) should preferably be in the range of 2.0 to 3.5 to make a good concrete
(Si:Al by Mol is equal to 1.733 to 3.033). The ratios of Si and Al by mol in the
geopolymer concrete produced by Hardjito (2004) are about 1.779 and 1.883.
1.2.4 Water/ash Ratio
The added water remains outside of the geopolymeric network, acting as a lubricating
element (Davidovitts, 2011). While the mechanism of the polymerization is yet to be
fully understood, a critical feature is that water is present only to facilitate the workability
and does not become a part of the resulting geopolymer structure. In other words, water is
not involved in the chemical reaction and instead is expelled during curing and the
subsequent drying.
It is well accepted that the addition of water decreases the compressive strength.
However, water plays an important role in the dissolution and transportation process,
indicating that the water influences the first two essential steps of geopolymerization.
There must be a proper range of water/ash ratio that an optimum compressive strength of
geopolymer cement can be warrantied. The lower the water/ash ratio, the less fluidity is.

7
The water/ash ratio affects the volume of pores and the porosity in the matrix which
directly influences the strength of the geopolymer concrete (Kong et al. 2008b).
However, consider the mechanical property and workability together, it is important to
study the optimum water/ash ratios for the geopolymer cement, the same as that for the
ordinary Portland cement.
1.2.5 Curing Regimes
There are many studies about the effects of the heat curing on the compressive
strength of the fly ash based geopolymer (Davidovits 2011; Jiang et al. 1992; Duxson et
al. 2007; Bakharev 2005). Jiang et al. (1992) explained the reason for the need of the heat
treatment is that the activation of the fly ash is an endothermic reaction so that the heat
curing is very important for the geopolymerization of the fly ash based geopolymer
cement. Hardjito et al. (2004) studied the compressive strength of the fly ash based
geopolymer cement with the curing temperature ranging from 30oC to 90 °C and
concluded that the compressive strength of the geopolymer cement increases when the
curing temperature increases. It is also proved that a longer heat curing time improves the
degree of geopolymerization and hence results in higher compressive strength. However,
the increase in the compressive strength beyond 24 hours heat curing time is not
significant. Therefore, the heat-curing time is better to be set as less than 24 hours in the
practical applications. Long pre-curing process at the room temperature before the heat
treatment is also beneficial for the strength development of the fly ash based geopolymer
cement. Bakharev (2005) proved that the compressive strength is significantly higher
with the geopolymer cement samples stored 24 hours at the room temperature before the
heat curing.

8
1.2.6 Plasticizers and Retardants
Plasticizers: sodium naphtalene sulfonate is a well-known plasticizer, which
increases the fluidity of geopolymer resins and cement pastes (Davidovits, 2011).
Retarders: delay the setting time of geopolymer cement without affecting the long-
term mechanical properties. Retarding admixtures are mainly based on materials having
lignosulfonic acids and their salts, hydroxyl-carboxylic acids, tartaric acid, citric acid,
and their salts, sugar and their derivatives and inorganic acids and their salts such as
borates, phosphates. Several Fe2+
salts can be used as the retardants. Adding NaCl can
retard the curing time for 20 mins and also decrease the compressive strength of
geopolymer concrete (Davidovits, 2011).
1.3 Thermal Properties of Geopolymers
A 28-storey building caught fire and at least 42 people were killed and 90 more
people were critically injured on November 15th
2010 in Shanghai, China, which aroused
a great concern on the fire performance of structures. Another tragedy in this century is
the twin towers in New York destroyed in 9/11 attacks, 2001. The steel building
collapsed quickly within two hours in fire. Moreover, most organic matrix cannot bear
the temperature more than 200oC and will issue poison gas when on heat/fire. Therefore,
there is an urgent necessity to enhance the fire/heat resistant performance of structures.
Geopolymer concrete, coating, and matrix may resolve these problems. The geopolymers
discovered recently are reported to possess excellent fire resistant performance due to
their ceramic like characteristics and they are prepared using alkali activation and
alumino-silicate raw materials (Davidovits et al. 1984, 1994, 1996, 2008; Cheng et al.
2003; Barbosa et al. 2003a, 2003b; Bakharev, 2005, 2006; Kong et al. 2007, 2008a,
2008b, 2010). Foden, et al. (1996) first examined the mechanical properties of the carbon

9
composites made using an inorganic polymer, including strengths in tension, flexure, and
shear. It is reported that the carbon composite made with geopolymer matrix retains
considerable strength even at 1000°C.
Recent work by Bakharev (2005, 2006), Kong et al. (2007, 2008a, 2008b, 2010),
Provis et al. (2009), Pan et al. (2010), Guerrieri et al. (2010), and Zhao et al. (2011)
reported that the heat resistance of the fly ash based geopolymer materials is better than
that of the metakaolin-based geopolymers. Kong, et al (2007) reported that the fly-ash
based geopolymer paste had a strength increase of 6% while the metakaolin-synthesized
geopolymer paste counterparts showed a strength reduction of 34% after the exposure to
800oC. This is because the high porosity and proper pore size of the fly-ash based
geolpolymer matrix accelerate the dehydration of free and chemically-bound water when
heated, thus decreasing the damage to the matrix. The strength increase and high heat
resistant performance of the fly ash based geopolymers are also partly attributed to the
large proportion of hollow spheres and the sintering reactions of un-reacted fly ash
particles. Compared with metakaolin, the fly ash has a lower cost and less environmental
pollution.
The studies by Kong (2008b) and Xu et al. (2000) showed that KOH-based pastes
perform better at the room temperature and high heating temperature (after elevated
temperature exposure till 850oC) than NaOH-based pastes. However, Kong et al. (2008)
and Rahier et al. (2001) both proved that the sodium-silicate based geopolymer provides
better compressive strength than its potassium silicate-based equivalent, both before and
after exposed to the elevated temperature (850oC). The reason was described by Rahier et
al. (1997) that Na2SiO3-based geopolymer synthesized at a faster rate and may underwent

10
further progression of geopolymerization reaction than those K2SiO3-based geopolymers.
Portland cement concrete can spall when exposed to fire or high temperature heating,
especially when subjected to a rapid temperature rise simulating fire (Zhao et al. 2011),
like in an accidental fire. Portland cement concrete after heating or fire will also be fatally
damaged by rapid water cooling just like the real fire-fighting method in our daily life.
Geopolymer is reported to be an environmentally friendly and fire resistant material
which possesses higher spalling resistance in a rapid temperature rise simulating fire
(Zhao et al. 2011). However, the spalling behavior of geopolymer cement cooled
suddenly by water after high temperature heating is not reported in the literature.
1.4 Limitations
While numerous geopolymer systems have been proposed (many are patented), most
of them are difficult to work with and require great care in their production. In addition,
the polymerization reaction is very sensitive to the temperature and usually requires that
the geopolymer concrete should be cured at elevated temperature under a strictly
controlled temperature regime (Hardjito et al. 2004; Tempest et al. 2009; Lloyd and
Rangan 2009). In many respects, these facts may limit the practical applications of the
geopolymer concrete in the transportation infrastructure to the precast applications.
1.5 Overview of the Thesis
The goal of this research is to develop a goepolymer material-based “GeoCement”
that may replace the traditional Portland cement. This study first in Chapter 2 presents the
mechanical properties of the class F fly ash based geopolymer materials prepared using
different alkali-activators, such as NaOH solution, NaOH and Na2SiO3 mixed solution,
and KOH and Na2SiO3 mixed solution. The effects of water/ash ratio, curing methods,
and sealing degree on the compressive properties of geopolymer are investigated.

11
The geopolymer cement with a good thermo-mechanical performance is developed in
Chapter 3 in order to improve the fire performance of structures based on the good
mechanical performance of the class F fly ash based geopolymer materials as formed.
The effects of different factors on the thermo-mechanical properties of the geopolymer
cement are discussed. The compressive strength, shrinkage, and the weight loss before
and after the heating process are tested as well as the microstructures and the chemical
composition of the final products are investigated by employing the X-ray diffraction
(XRD), Scanning Electron Microscopy (SEM), and Energy Dispersive X-ray
Spectroscopy (EDXS) measurements. Potential applications of the formed geopolymer
cement are also discussed in Chapter 4 with the conclusions.

12
CHAPTER 2 THE PROPERTIES OF GEOPOLYMER CEMENTS ACTIVATED
BY DIFFERENT ALKALI-ACTIVATORS
2.1 Introduction
Alkali-activators play an important role in the geopolymerization, which determines
the mechanical and thermal properties of geopolymer cements. Alkali-activators have the
following choices: alkali metal hydroxide (sodium hydroxide, potassium hydroxide),
carbonate, sulfate, phosphate, fluoride (very few studies), silicate and aluminum silicate.
Two alkali metal hydroxides, sodium hydroxide and potassium hydroxide, are commonly
used and the sodium silicate is adopted in many studies. In this chapter, three kinds of
geopolymer cements will be discussed, which are activated by sodium hydroxide
activator, sodium hydroxide and sodium silicate mixed activators, and potassium
hydroxide and sodium silicate mixed activators.
2.2 Materials and Experimental Methods
2.2.1 Materials
The raw materials used for geopolymer synthesis include a low calcium Class F fly
ash (Boral Material Technologies, Inc.), sodium hydroxide (purity quotient: 99%, Sigma-
Aldrich Co., USA), potassium hydroxide (purity quotient: 88%, Sigma-Aldrich Co.,
USA), sodium silicate solution (9.07 wt.% Na2O and 29.35 wt.% SiO2, Aqua Solutions
Inc, USA) and deionized water. The chemical composition of the low calcium Class F fly
ash is shown in Table 2.1, the molar ratio of Si/Al is 2.154, and the gravity density is 2.46.
The XRD traces of the fly ash and one mixture of 5% quartz and 95% glass are
compared as shown in Figure 2.1. In this figure, a very huge and nonsymmetrical hump at
5-40° 2𝜃 can be clearly observed for the XRD trace of the fly ash, along with several
sharp peaks identified as quartz and Kaolinite. The high peaks of the quartz in the fly ash
and the mixture of 5% quartz and 95% glass are 785, and 664, respectively. Therefore, it

13
is predicted that the raw material of the Class F fly ash is almost amorphous with a
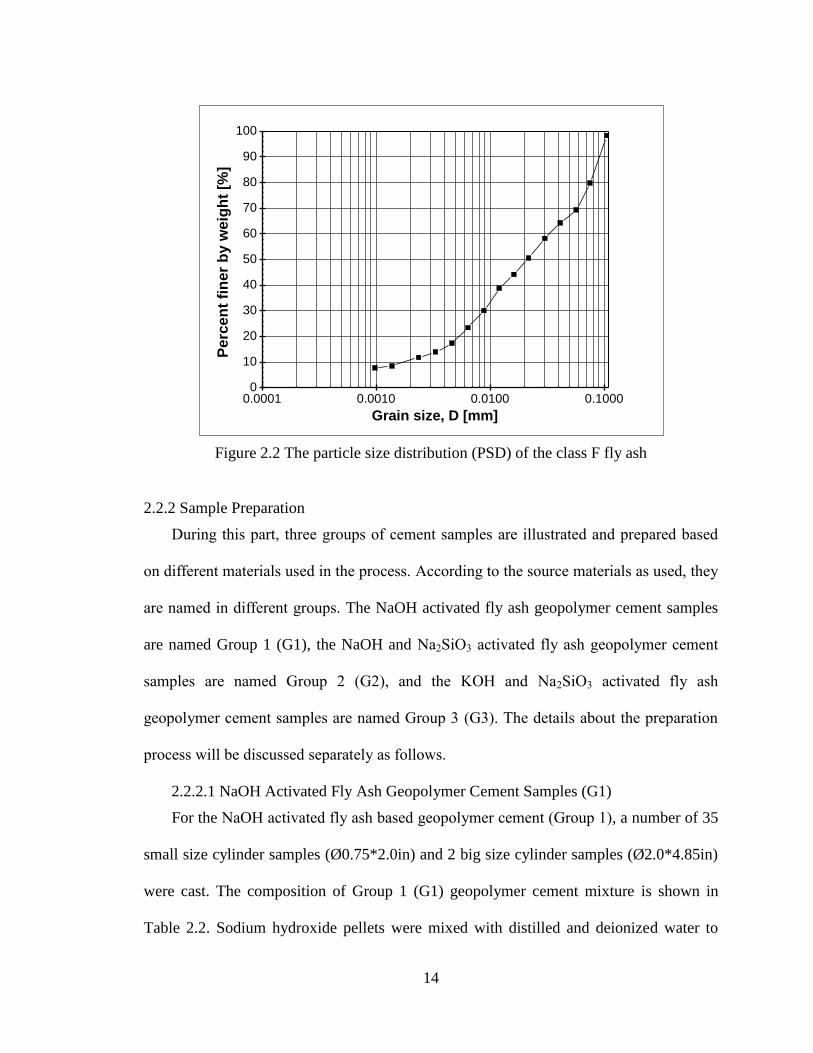
percentage of about 6% (785/664*5%=5.9%) of crystalline (mainly quartz). Figure 2.2
shows the particle size distribution (PSD) curve of the fly ash determined by the ASTM
standard test method combining both sieving and hydrometer analyses (ASTM 2010). For
this fly ash, 20% of the raw material are sand-sized (>75 µm) coarse particles and the
median particle size (D50) is 22 µm.
Table 2.1 Composition of the fly ash (wt.%) by ASTM C 618 test report.
SiO2 Al2O3 Fe2O3 CaO MgO SO3 Na2O K2O LOI Moisture
52.06 20.54 5.50 14.07 3.29 0.57 0.94 0.69 0.10 0.01
LOI: Loss of ignition
Figure 2.1 Comparisons of the XRD traces between the fly ash and a mixture of 5%
quartz and 95% glass (Q=quartz, QTZ=quartz, K=Kaolinite)
14
Figure 2.2 The particle size distribution (PSD) of the class F fly ash
2.2.2 Sample Preparation
During this part, three groups of cement samples are illustrated and prepared based
on different materials used in the process. According to the source materials as used, they
are named in different groups. The NaOH activated fly ash geopolymer cement samples
are named Group 1 (G1), the NaOH and Na2SiO3 activated fly ash geopolymer cement
samples are named Group 2 (G2), and the KOH and Na2SiO3 activated fly ash
geopolymer cement samples are named Group 3 (G3). The details about the preparation
process will be discussed separately as follows.
2.2.2.1 NaOH Activated Fly Ash Geopolymer Cement Samples (G1)
For the NaOH activated fly ash based geopolymer cement (Group 1), a number of 35
small size cylinder samples (Ø0.75*2.0in) and 2 big size cylinder samples (Ø2.0*4.85in)
were cast. The composition of Group 1 (G1) geopolymer cement mixture is shown in
Table 2.2. Sodium hydroxide pellets were mixed with distilled and deionized water to
0.0001 0.0010 0.0100 0.10000
10
20
30
40
50
60
70
80
90
100
Perc
en
t fi
ner
by w
eig
ht
[%]
Grain size, D [mm]

15
prepare an alkaline solution about one or two hours in advance (it mainly depends on the
size of the container, the stirring velocity and the size of the stirrer) in order to let it cool
down to the room temperature of 22oC. Then, the class F fly ash was added and blended
with the alkaline solution (NaOH solution), and the mixed solution was stirred about 90
minutes before it was cast in the prepared plastic cylinders. The water/cement ratio was
calculated as a ratio of the total mass of water to the total mass of fly ash and the sodium
hydroxide. The water/cement ratio plays an important role for the workability of the fly
ash cement.
Table 2.2 The composition of Group 1 (G1) geopolymer cement mixture.
G1
Si/Al 2.15
Si/Na 1.0
Water/Cement (FA+NaOH) 0.5
Class F fly ash 100g
NaOH (g) 19.0
H2O 59.5g
2.2.2.2 NaOH and Na2SiO3 Activated Fly Ash Geopolymer Cement Samples (G2)
For the Group 2 (G2) geopolymer cement samples, the sodium hydroxide pellets
were mixed with sodium silicate solution to prepare an alkaline solution one day in
advance in order to let it cool down to the room temperature of 22oC. It is also to make
sure there is enough time for the dissolution of Na2SiO3 to generate small reactive silica
and alumina (Al3+, Si4
+) by alkali. Hence, in the reorientation process, the large molar
ratio of the dissolved precursor ions can be easily transported and condensate into

16
monomers accompanied with a high rate of geopolymerization in the directly followed
process (Davidovitts, 2013). In the alkali-activated solution, the molar concentration of
OH— and Na
+ are 10.8M and 20.0M, respectively.
Two things must be paid attention to during the process. (1) The sodium hydroxide
pellets should be added slowly to the sodium silicate solution to prevent the spalling of
NaOH to the air and for safety purpose. Some water will evaporate due to the heat
released from the dissolution process. Even if the plastic cylinders are sealed quickly, the
water loss still exists, which reduces the water/ash ratio to some extent. So the sodium
hydroxide pellets should be added by several steps with careful stirring. (2) It is not
suggested to make too much alkaline solution at one time because it is difficult for all the
sodium hydroxide pellets to dissolve in a short time and the generated heat during the
dissolution is large.
As the sodium hydroxide pellets dissolved in the sodium silicate solution with
stirring, a transparent alkali solution was achieved. Then, the transparent solution became
white and hardened one day later. It should be noted that plastic containers, instead of
glass beakers, are highly recommended to contain the solution during the process. It was
witnessed that the glass beakers broke after the hardened solution being heated and
stirred again, which may be due to that the glass reacts with the alkali solution, or the
variation of the temperature.
The class F fly ash was blended with the cooled down alkaline solution (the mixed
solution of NaOH and Na2SiO3) by three or four steps with stirring for several minutes
before the mixtures were cast in the plastic cylinders. The composition of the geopolymer
cement mixtures (G2) is shown in Table 2.3 along with the curing methods adopted.

17
Table 2.3 Geopolymer mixture combinations of Group 2 (G2) samples
Mixture no. Si/Al Na/Si W/FA Curing regime
G2-No.1 2.50 1.0 0.30 22oC
G2-No.2 2.50 1.5 0.30 22oC
G2-No.3 2.50 1.0 0.35 22oC
G2-No.4 2.50 1.0 0.40 22oC
G2-No.5 3.00 1.5 0.74 22oC
G2-No.6 3.00 1.5 0.74 22oC(3h), 60
oC(7h)
G2-No.7 3.00 1.5 0.74 22oC(24h), 60
oC(7h)
G2-No.8 2.50 1.5 0.35 22oC
G2-No.9 2.50 1.0 0.30 22oC water curing(60days)
G2-No.1* 2.50 1.0 0.30 60oC(24h)
G2-No.2* 2.50 1.5 0.30 60oC(24h)
G2-No.3* 2.50 1.0 0.35 60oC(24h)
G2-No.4* 2.50 1.0 0.40 60oC(24h)
G2-No.5* 3.00 1.5 0.74 60oC(24h)
Note: W/FA refers to the ratio of water/fly ash. * refers to a different curing method
adopted as compared with the ones without the *.
2.2.2.3 KOH and Na2SiO3 Activated Fly Ash Geopolymer Cement Samples (G3)
In preparing the KOH and Na2SiO3 Activated Fly Ash Geopolymer Cement Samples,
the potassium hydroxide (KOH) pellets were added to sodium silicate solution by several
steps with careful stirring in plastic containers. The alkaline solution should be prepared
one day in advance to let it cool down to the room temperature of 22oC. For this alkali-
activated solution, the molar concentration of OH—
is 6.2M. Then, the class F fly ash was
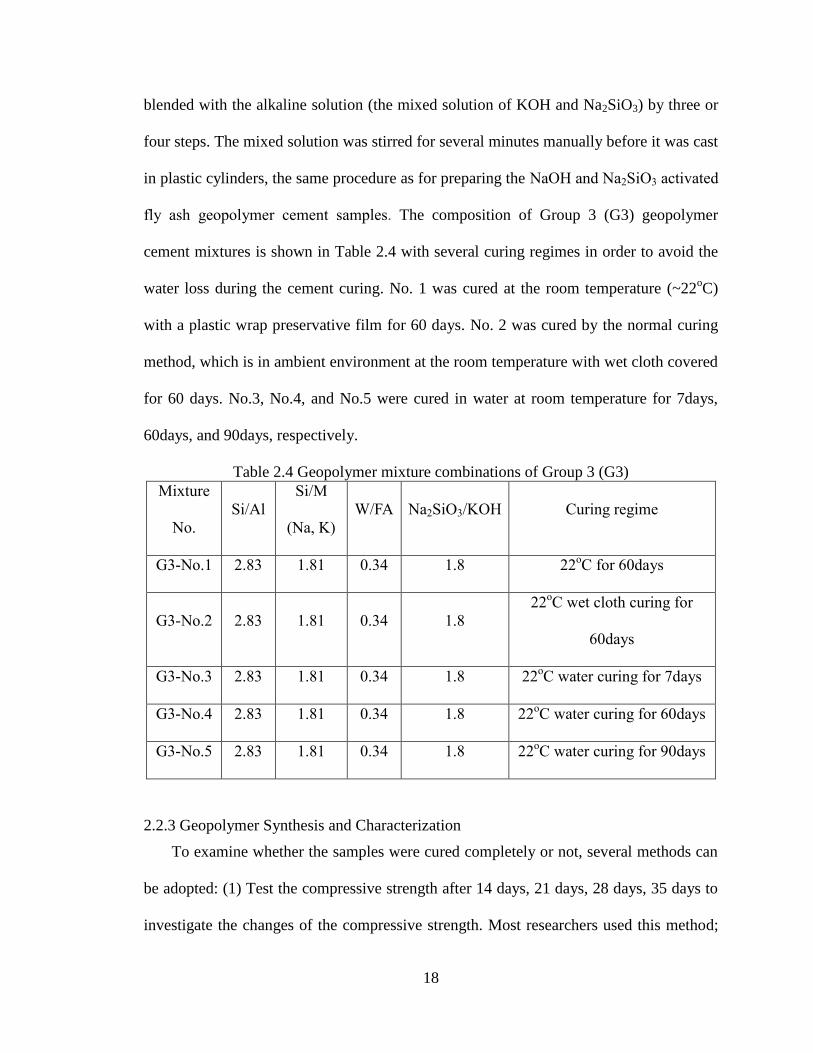
18
blended with the alkaline solution (the mixed solution of KOH and Na2SiO3) by three or
four steps. The mixed solution was stirred for several minutes manually before it was cast
in plastic cylinders, the same procedure as for preparing the NaOH and Na2SiO3 activated
fly ash geopolymer cement samples. The composition of Group 3 (G3) geopolymer
cement mixtures is shown in Table 2.4 with several curing regimes in order to avoid the
water loss during the cement curing. No. 1 was cured at the room temperature (~22oC)
with a plastic wrap preservative film for 60 days. No. 2 was cured by the normal curing
method, which is in ambient environment at the room temperature with wet cloth covered
for 60 days. No.3, No.4, and No.5 were cured in water at room temperature for 7days,
60days, and 90days, respectively.
Table 2.4 Geopolymer mixture combinations of Group 3 (G3)
Mixture
No.
Si/Al
Si/M
(Na, K)
W/FA Na2SiO3/KOH Curing regime
G3-No.1 2.83 1.81 0.34 1.8 22oC for 60days
G3-No.2 2.83 1.81 0.34 1.8
22oC wet cloth curing for
60days
G3-No.3 2.83 1.81 0.34 1.8 22oC water curing for 7days
G3-No.4 2.83 1.81 0.34 1.8 22oC water curing for 60days
G3-No.5 2.83 1.81 0.34 1.8 22oC water curing for 90days
2.2.3 Geopolymer Synthesis and Characterization
To examine whether the samples were cured completely or not, several methods can
be adopted: (1) Test the compressive strength after 14 days, 21 days, 28 days, 35 days to
investigate the changes of the compressive strength. Most researchers used this method;

19
however, it takes more time and effort. (2) Test the weight changes of the samples to
check whether the water still evaporates from the inside of the samples. In the current
study, the second method was used, which is more convenient and takes less time and
effort.
For the heating methods, the cylinder samples were exposed to 500oC and 800
oC
with the heating curve shown in Figure 2.3. For the setup of the temperature in the
furnace, a heating rate of 10oC/min was adopted, and then the temperature was
maintained for 60 min. After that, the temperature inside the furnace was left to cool
down to the room temperature at a pace of -40oC/min (natural cooling down method: NC).
For some samples, were put into water immediately after exposing to 500oC and 800
oC
for 1 hour (Water cooling down method: WC). Meanwhile, the unheated sam ples were
left undisturbed at the room temperature of 22oC.
Figure 2.3 The heating curve in different temperatures
0 20 40 60 80 100 120 140 160 180 200
0
100
200
300
400
500
600
700
800
900
1000
-40oC/min
1h
1h
Te
mp
era
ture
(oC
)
Time (minutes)
500oC
800oC
10oC/min

20
The unconfined compressive strength of the cured and heated geopolymer cylindrical
specimens were measured using an automated GeoTAC loading frame (Trautwein Soil
Testing Equipment, Inc., USA) with load limit of 2000Ib, and a strain limit of 15% at a
fixed strain rate of 0.5%/min (ASTM C39 and C39M), as shown in Figure 2.4. In order to
obtain flat and parallel surfaces of the two ends of each sample, sand papers were used to
polish each sample at the two ends. Then, a very thin layer of lubricant coating was used
for both ends of each sample so as to reduce the friction effects and the possible shear
stress, which was developed during the test between the sample ends and the contacting
surfaces of the test frame.
Figure 2.4 The unconfined compressive strength test
The compositions of the class F fly ash raw materials and completely cured NaOH
activated geopolymer cement were characterized by the X-ray diffraction (XRD) analysis

21
based on a Bruker/Siemens D5000 automated X-ray powder diffractometer. The scanned
materials were grinded into fine powders with particle sizes ≤38 μm for most silicate
minerals in a McCrone micronizing mill (McCrone Accessories and Components) (He, J.
et al. 2012).
2.3 Results and Discussion
2.3.1 NaOH Activated Fly Ash Based Geopolymer Cement (G1)
2.3.1.1 General Observations
For NaOH activated fly ash based geopolymer cement (G1), a number of 35 small
size cylinder samples (Ø0.75*2.0in) and 2 big size cylinder samples (Ø2.0*4.85in) were
casted (Figure 2.5). After the casting, some transparent solution permeated from the
bottom of all the plastic cylinder molds, which indicated that a smaller water/cement ratio
should be chosen for this kind of class F fly ash materials. The samples were sealed for
another 60 hours at the room temperature of 22oC, and de-molded 12days later. As the
whole sample exposed to the air, crystal needles grew out (as shown in Fig. 2.6), which
may be due to the excess of the sodium hydroxide solution, i.e. the water/cement ratio is
higher to some extent for this kind of class F fly ash.
(a) Demolding (b) Cling film sealing
Figure 2.5 Molded samples (G1)

22
Figure 2.6 The crystal needles on the samples during curing (G1)
All the samples cracked after 60 days (Figure 2.7) and the weight of the samples
continued decreasing. The compressive strength of the samples was very low and the fire
resistant performance of these samples was very poor, which indicated that the fly ash
and alkaline solution did not act very well and the geopolymerization rate was very small.
The main reason might be attributed to the high water/cement ratio.

23
Figure 2.7 The Geopolymer sample cracked after 60 days
2.3.1.2 Weight Change
The weight change of 9 selected samples (2 big size samples and 7 small size
samples) was measured and partial of the results are shown in Table 2.5. All the test
results of the 9 samples are plotted as shown in Figure 2.8, and Figure 2.9.
Table 2.5 The weight change of the selected 9 samples
s# 25days 26days 27days 28days 31days 33days 34days 35days 38days
s1 210.42 209.97 208.97 208.62 207.76 207.42 206.98 205.98 198.78
s2 214.57 214.27 213.87 213.55 212.54 212.13 211.77 210.75 203.27
s3 24.63 24.62 24.55 24.55 24.27 24.34 23.89 24.00 23.02
s4 25.65 25.62 25.67 25.59 25.28 25.23 24.81 24.58 23.87
s5 23.78 23.79 23.82 23.72 23.74 23.76 23.40 23.34 22.78
s6 23.97 23.97 23.98 23.91 23.73 23.72 23.59 23.34 22.29
s7 24.28 24.29 24.31 24.20 24.07 24.05 23.59 23.52 22.48
s8 25.25 25.27 25.29 25.28 24.79 24.80 24.40 24.62 23.6
s9 25.3 25.32 25.35 25.29 25.13 24.97 24.67 24.47 23.58
Note: s# refers to the number of the selected specimen. The error of measurement can be
±0.25g.

24
Figure 2.8 The weight change of the 2 big size samples (s1 and s2).
Figure 2.9 The weight change of the 7 small size samples (s3-s9)
It is observed in Figure 2.8 and Figure 2.9 that the average weight loss rate between
25 days and 38 days of big size samples (s1 and s2) and small size samples (s3-s9) is 5.4%
and 6.5%, respectively, while for the average weight loss rate between 25 days and 61
days of big size samples (s1 and s2) and small size samples (s3-s9) is 12.7% and 11.9%,
respectively. Therefore, the short term weight loss for the big size samples (s1 and s2) is
smaller than those for the small size samples (s3-s9), while the long term weight loss is
the opposite. The long term weight loss without sealing (s1and s2) is larger than that with
sealing (s3-s9), indicating that the sealing is a good method to prevent the water loss.

25
2.3.1.3 Compressive Strength
The compressive strength of the geopolymer samples without the heating procedure
was measured after 28 days of curing. The failure patterns are shown in Figure 2.10 and
the test results of 3 samples (s3-s5) are shown in Figure 2.11 and Table 2.6. The ultimate
stress is the broken stress, and the ultimate strain is the strain when the sample reaches
the ultimate stress.
Figure 2.10 Failure patterns of Group 1 samples
Figure 2.11 The axial stress (MPa)-axial strain (%) curve of the geopolymer cement
samples after 28days.

26
Table 2.6 The test results of specimens from Figure 2.11
specimen# Diameter
(inch)
Height
(inch)
Ultimate Stress
(MPa)
Ultimate Strain
(%)
Elastic
Modulus(MPa)
s3 0.75 1.91 4.6 2.66 234
s4 0.75 1.87 5.1 1.70 314
s5 0.75 1.92 4.4 1.73 314
It is shown in the Figure 2.11 that the typical compressive strength of the Group 1
geopolymer cement are less than 5.5MPa, which indicated that the geopolymerization
rate for Group 1 was very small. The elastic modulus of specimen 3 was only 234MPa
and it was only 314MPa for specimens 4 and 5, far less than the elastic modulus of
ordinary Portland cement concrete, 22000MPa.
Several reasons may contribute to this phenomenon: (1) the water/cement ratio is
very large, which directly reduced the compressive strength of the geopolymer concrete
similar to that for the ordinary Portland cement concrete; (2) the silicate in the class F fly
ash raw material may exist mostly as crystal phase which did not dissolve in the solution,
resulting in a low Si/Al ratio in the geopolymerization. However, this reason was
excluded by the XRD characterization of the class F fly ash raw materials from Figure
2.1 that the fly ash is mainly amorphous with little crystalline inclusions of quartz; (3)
only hydroxide alkali-activator cannot form good geopolymer, which directly lead to the
low geopolymerization.
To improve the compressive strength, low water/cement ratios should be considered,
with the addition of silicate (this is the main reason that sodium silicate was added in the

27
later tests for G2 and G3 samples), and some additives which will help the crystal phase
silicate in class F fly ash raw material to dissolve easily.
2.3.1.4 Thermal Properties
After exposed to the elevated temperature, the color of the geopolymer samples
became slight lighting. Macro-cracks can be observed on the surface of the samples after
800oC heating, as shown in Figure 2.12. The thermal test results for three selected
samples are shown in Table 2.7, which shows that the high water/cement ratio contributes
mostly to the large deformation and weight loss for G1 samples.
Kong et al. (2007) reported that a slight lighting of color and macro-cracks in the
order of 0.1 to 0.2 mm were found in the metakaolin based geopolymer with the solids-
to-liquids ratio of 0.8. However, the fly ash geopolymer paste with the solids-to-liquids
ratio of 3.0 did not have any cracks on the surface after high temperature exposure, which
indicated that the solids-to-liquids ratio (or the opposite water/cement ratio) influences
the thermal properties and compressive strength of geopolymer cement significantly.
Figure 2.12 Group 1 samples before and after heating (800
oC).

28
Table 2.7 Thermal extraction of Group 1 geopolymer cement samples
specimen# Diameter decrease (%) Height decrease (%) Weight loss (%)
s3 1.7 1.6 17.2
s4 3.0 1.3 17.5
s5 1.0 1.8 14.7
2.3.1.5 X-Ray Diffraction (XRD) Analysis
Figure 2.13 shows the comparison of the XRD patterns between the class F fly ash
and the NaOH activated fly ash-based geopolymer.
Figure 2.13 XRD patterns of fly ash raw material and geopolymer sample (G1) (Q=quartz,
K= Kaolinite).
The XRD pattern of the fly ash shows a huge broad hump between 6-36˚ 2θ with a
few sharp peaks, indicating that there are a large number of calcined silica and alumina
and a small number of crystalline phases such as quartz (SiO2), and Kaolinite
(Al2Si2O5(OH)4). As for the geopolymer end products, the broad hump (2θ) indicates that
there is amorphous geopolymer matrix formed. A broad hump between 18-36˚ 2θ is the

29
characteristic reflection of amorphous geopolymers (Li and Liu 2007; Guo et al. 2010).
For the geopolymer sample, there exists a broad hump between 8-16˚ 2θ, which is almost
the same as that of the fly ash, showing a low degree of geopolymerization and low
geopolymer binder in the NaOH activated geopolymer cement samples. This observation
may be used to explain why the NaOH activated fly ash-based geopolymer cement
possesses low compressive strength and stiffness. In addition, this also explains why the
NaOH activated fly ash-based geopolymer cement is weak and has poor thermo-
mechanical properties.
2.3.2 NaOH and Na2SiO3 Activated Fly Ash Geopolymer Cement (G2)
2.3.2.1 General Observations
Figure 2.14 The casting of geopolymer G2 samples
For each mixture combination of G2 as shown in Table 2.3, 5 duplicate specimens
were cast to ensure reproducibility, as shown in Figure 2.14. From Figure 2.14, it can be
seen that the organic epoxy like geopolymer adhesive were formed, which proved that
sodium silicate improves the degree of geopolymerization with an appropriate ratio of
Si/Al.
It was found that some water precipitated from the samples of G2-No.2 and G2-No.8
(Na/Si=1.5) mixtures 2 days later after the casting, as shown in Fig. 2.15, which will be

30
further discussed in the bleed water effect section later. The bottom molds were taken
away 6 days later.
Figure 2.15 The water precipitation of the G2-No.2 samples
After 14 days, all the samples were demolded except the water precipitated samples
of G2-No.2 and G2-No.8 mixtures, as well as the samples of G2-No.5 mixture. The
water/ash ratio (0.74) for the samples of G2-No.5 mixture is relatively high. As such,
some crystals grew out of the bottom surface of the samples of G2-No.5 mixture, which
makes the demolding not available at this time.
After 17days, the samples G2-No.2 and G2-No.5 mixtures expanded, especially the
samples of G2-No.5 mixture, which may be due to its high water/ash ratio (0.74). The
G2-No.5 samples shrank on both ends, but expanded in the middle of the cylinder, and
they were broken with lots of macro-cracks. The G2-No.6~7 samples also had macro-

31
cracks on the bottom, expanded and cracked, similar as observed for G2-No.5 samples
which have the same water/ash ratio.
All the samples of G2-No.1*-5* cracked after 24 hours of 60oC heat curing in the
oven. There was some water vapor in the cling film sealed on the top of the samples 4
days later. The reasons are analyzed in the following: (1) the samples may not be sealed
well, and the water inside of the samples evaporated quickly in the heat curing; (2) the
water may not act with the fly ash and alkali-activators completely before the heat curing.
More time are needed to let the samples stay alone for a while. It is known that different
curing methods have different effects on the compressive strength of the geopolymer
cement. Further studies about the effects of different heat curing methods on
geopolymerization are needed.
2.3.2.2 Weight Change
The weight change of selected samples of G2-No.1-3 and G2-No.5 mixtures were
measured with the data listed in Table 2.8 and plotted in Figure 2.16. From Table 2.8, the
weight change of the samples of G2-No.5 was larger than that for the samples of G2-
No.1 and G2-No.3, which was probably due to the higher water/ash ratio (0.74) adopted
for samples of G2-No.5. As the water precipitation cannot be avoided during the curing
process, it tends to be that lower compressive strength is accompanied with more water
precipitation. In addition, a range of the water/ash ratio from 0.3 to 0.35 was tested to be
a good range for appropriate operability of the mixture. The G2-No.5 samples cracked
finally maybe due to the high water/ash ratio.
Although the water precipitation lasted for a long time for the G2-No.2 samples, it is
noted that the weight of these samples increased 0.3g. This may be due to the production
of Na2CO3 by CO2 and additional NaOH caused by the large molar ratio of Na/Si (1.5).

32
Table 2.8 The weight change of the G2-No.1-3, and G2-No.5 samples.
No. 16days 18days 20days 24days 26days 34days Total
1.1 30.5 30.5 30.5 30.4 30.4 30.1 -0.4
1.2 30.8 30.8 30.7 30.6 30.6 30.5 -0.3
2.1 29.7 29.7 29.9 29.9 29.9 30.0 +0.3
2.2 31.5 31.5 31.7 31.8 31.8 31.8 +0.3
2.3 30.6 30.6 30.8 30.8 30.8 30.9 +0.3
3.1 29.7 29.7 29.6 29.4 29.4 29.4 -0.3
3.2 30.9 31.0 30.9 30.8 30.8 30.7 -0.2
3.3 29.5 29.4 29.4 29.3 29.3 29.2 -0.3
5.1 26.9 26.8 26.7 26.2 26.2 Cracked -0.7
5.2 28.6 28.5 28.2 27.9 27.8 Cracked -0.8
Note: No.2.3 means the third sample for the mixture of No.2; + means increased; -means
decreased.
Figure 2.16 The weight change of G2-No.1-3, and G2-No.5 samples

33
2.3.2.3 Compressive Strength
The compressive strength test curves of the G2 samples are plotted as shown in
Figure 2.17 with the mechanical values listed in Table 2.9. Since the samples of G2-No.7
all cracked, their results are not available.
Figure 2.17 The compressive strength of G2-No.1~9 samples
Table 2.9 The mechanical values from Figure 2.17
Nos. Ultimate stress (MPa) Elastic modulus (MPa) Ultimate strain (%)
G2-No.1 28.2 1490 2.11
G2-No.2 18.6 910 2.10
G2-No.3 29.5 1630 2.60
G2-No.4 19.5 1250 1.74
G2-No.5 6.4 290 2.69
G2-No.6 6.4 230 2.80
G2-No.8 19.7 1060 2.00
G2-No.9 26.1 1160 2.63

34
Since the GeoTAC loading frame has a load limit of 2000Ib, the actual compressive
strength for the G2-No.1 mixture samples is larger than 28.2 MPa. Compared to the G2-
No.1 mixture samples, the compressive strength of the G2-No.2 mixture samples is
lower, indicating that the molar ratio of Na/Si around 1.0 is preferable than 1.5. The
unsmoothness for the compressive strength test curves of the G2-No.3 may be due to the
two ends of the samples are not paralleled very well. As such, it is extremely important to
have parallel surfaces in the test in order to avoid partial failure. The compressive
strength for samples of G2-No.5-7 are very low due to its high water/ash ratio. There is
only one difference between the mixture combinations of G2-No.2 and G2-No.8 that the
water/ash ratio for G2-No.8 is 0.35, instead of 0.30. The compressive strength and the
elastic modulus of G2-No.8 are 19.7 MPa and 1060 MPa, respectively, relatively larger
than those of the G2-No.2. The compressive strength of G2-No.9 samples is 26.1MPa,
which is a little smaller than that of the G2-No.1 samples, indicating that the natural
curing method may be better than the water curing method.
2.3.2.4 Thermal Properties
To investigate the thermal effects on the geopolymerization, selected samples of G2-
No.1 and 2 mixtures were exposed to the 500oC (1 hour) heating. The compressive
strength of the samples with and without the heating are compared as shown in Figure
2.18 (a) and (b).
The compressive strength and elastic modulus of G2-No.1 before the heating are
28.8MPa and 1490MPa, respectively; the values are 19.9MPa and 1330MPa,
respectively, after the 500oC (1 hour) heating. While the compressive strength and elastic
modulus of G2-No.2 before the heating are 18.6 MPa and 910MPa, respectively; the
values are 2.7MPa and 50MPa, respectively, after the 500oC (1 hour) heating. The

35
strength and elastic modulus of G2-No.2 mixture after the 500oC (1 hour) heating
decreased largely because of the water bleeding effect.
(a) Samples of G2-No.1 (b) Samples of G2-No.2
Figure 2.18 The compressive strength of selected samples before and after 500oC (1h)
heating.
2.3.2.5 Bleed Water Effect
As discussed in the general observations, some water precipitated at the top of the
G2-No.2 and G2-No.8 samples two days later and the phenomena were recorded with the
photos taken at different dates for the samples of G2-No.2, as shown in Figure 2.19. The
water precipitation continued after the whole samples were exposed to the air (14 days).
Figure 2.19 Water precipitation of G2-No.2 samples

36
The bleed water phenomena can also be observed through the failure patterns of the
samples. As shown in Figure 2.20 and 2.21, the failure patterns of G2-No.1 and G2-No.2
were shown, respectively. It is noted that while the geopolymer cement of G2-No.1
samples are dense and the surfaces (the end surfaces and the broken face) are smooth, the
geopolymer cement of G2-No.2 samples are friable and the surfaces are uneven, and lots
of pores can be seen. Although the samples of G2-No.1 and No.2 have the same
water/ash ratios, the bleed water effect plays a significant role in reducing the
compressive strength of the geopolymer cement. At the same time, the G2-No.2 samples
with water precipitation have a lower compressive strength after 500oC (1hour) heating as
compared with those of the G2-No.1 samples under the same conditions, as can be
observed in Figure 2.18.
Figure 2.20 Failure patterns of G2-No.1 samples without water precipitation
As discussed above, the main reason may be attributed to the high molar ratio of the
sodium/silicate (1.5). Due to the high molar ratio of the sodium/silicate, some alkaline
solution may precipitate and Na2CO3 is produced by CO2 and the precipitated NaOH. The

37
Na2CO3 is harmful to the development of the compressive strength for the geopolymer
cement. As such, further studies are needed in order to investigate the mechanism of the
water precipitation of geopolymer cement.
Figure 2.21 Failure patterns of G2-No.2 samples with water precipitation
2.3.3 KOH and Na2SiO3 Activated Fly Ash Geopolymer Cement (G3)
For this group of samples, only one composition of the mixture combinations was
considered for the KOH and Na2SiO3 activated fly ash geopolymer cement, and the tested
compressive strength and heat resistance were witnessed with much better features than
those for the G1 and G2 specimens. More variables will be considered and further
analyzed in chapter 3.
2.3.3.1 General Observations
It was witnessed that with the appropriate composition of the Group 3 (G3), very
good geopolymer cement was produced with the adhesive character similar like the
organic epoxy, which was observed from Figure 2.22. The geopolymer precursor became
hardened with an early strength half an hour later. As for G3-No.1, no water precipitation
phenomenon was observed.

38
Figure 2.22 The geopolymer cement of G1-No.1 samples
The failure patterns of G3-No.1 sample after 500oC heating and G3-No.2 samples
before 500oC heating are shown in Figure 2.23 and Figure 2.24, respectively, which
indicated that the curing process of the samples of G3-No.1~2 developed well. The
failure patterns of G3-No.5 samples are shown in Figure 2.25 with smooth crack surfaces,
indicating a high compressive strength could be achieved as expected.
Figure 2.23 Failure pattern of G3-No.1 sample (Natural curing for 60 days) after 500
oC
heating.

39
Figure 2.24 Failure pattern of G3-No.2 samples (wet cloth curing for 60 days) before
500oC heating
Figure 2.25 Failure patterns of G3-No.5 samples (water curing for 90 days)
(a) before 500
oC heating
(b) after 500
oC heating

40
2.3.3.2 Effects of Curing Periods
The compressive strength of the samples of G3-No.3-5, which were under a curing
period of 7 days, 60 days and 90 days, respectively, are 11.4MPa,16.6MPa、23.1MPa,
respectively, as shown in Figure 2.26. As for the water curing samples, the compressive
strength develops with the increase of the curing period. The experiments done by
Davidovits (2013) on the pyramid-like stones show that the mechanical properties of
geopolymer develop along with time, and the extent and rate of the geopolymerization
improve due to the age followed by the zeolite-type structure finally. It is also found that
the elastic moduli are 720MPa,1070MPa and 1140MPa, respectively, for the samples of
G3-No.3~5 and it can be predicted that the elastic modulus may keep stable after a curing
period of 60 days.
Figure 2.26 The compressive strength considering different curing periods
2.3.3.3 Thermal properties
After a natural curing period of 60 days, the samples of G3-No.1 were exposed to the
500oC (1hour) heating and the compressive strength of the samples with different cooling
methods are shown in Figure 2.27. From this figure, there is not much difference between

41
these two kinds of cooling methods. The compressive strength after the 500oC (1hour)
heating is still as high as 25.4MPa. It is predicted that the KOH and Na2SiO3 activated
geopolymer cement possesses good heat resistant performance.
Figure 2.27 The compressive strength of samples with different cooling methods after the
500oC(1hour)heating
Note: NC-natural cooling; WC-water cooling.
Figure 2.28 The compressive strength of G3-No. 4 samples
Note: N3-Stand for 3 days after water cooling (WC)

42
The compressive strength of G3-No.4 samples are shown in Figure 2.28. As
compared with the results of G3-No.1 samples, the water curing method may be not
preferable with a negative effect on the development of the compressive strength of the
geopolymer cement. For the results as shown in Figure 2.28, the compressive strength of
the samples stand for 3 days after water cooling is relatively higher than that of the
samples just with water cooling after the 500oC (1hour) heating. It is interpreted that the
compressive strength of the geopolymer cement may recover a little in normal
environment after sudden water cooling.
2.4 Conclusions
Based on the observations of the three groups of geopolymer samples, the following
summaries are identified and concluded:
1. The Na2SiO3 is necessary for the development of geopolymer cement. The NaOH
activated fly ash geopolymer cement has very low compressive strength, implying the
geopolymerization is very low for using the NaOH only.
2. The curing method plays a very significant role for the properties of the
geopolymer. The natural curing method with just the plastic film covered is better than
the wet cloth covered natural curing method and the water curing method. The heating
curing method without sealing will lead to a quicker evaporation of water and then cause
macrocraks on the surface of the samples. Heat curing with good sealing to prevent the
quick water evaporation during the curing in order to avoid cracks occurring on the
surfaces of the samples will be further studied and used.
3. The water precipitation phenomenon was observed for the NaOH and Na2SiO3
activated fly ash geopolymer cement samples, where Na2CO3 was produced by CO2 and
additional NaOH due to a large molar ratio of Na/Si (1.5). Hence, it is better to take the

43
molar ratio of Na/Si as 1.0 to avoid the water precipitation. The water/ash ratio is
preferred to be located between 0.30 and 0.35. However, as an emerging topic in
geopolymer cement, the water precipitation effects should be further studied.
4. The compressive strength develops with the increase of the curing period. The
high compressive strength was accompanied with brittle failure patterns.
5. The KOH and Na2SiO3 activated fly ash geopolymer cement is expected to have a
higher compressive strength than the NaOH and Na2SiO3 activated fly ash geopolymer
cement, as pointed out by many researchers. As the observations are based on limited
samples, more studies are needed to further investigate the characteristics of the KOH
and Na2SiO3 activated fly ash geoplymer cement. Hence, more samples were prepared to
further study the KOH and Na2SiO3 activated fly ash geopolymer cement, especially the
thermo-mechanical properties under the high temperature heating. This will be discussed
in Chapter 3.

44
CHAPTER 3 THERMO-MECHANICAL PROPERTIES OF KOH AND Na2SiO3
ACTIVATED FLY ASH-BASED GEOPOLYMER CEMENT
3.1. Introduction
This chapter presents a further study on the thermo-mechanical properties of class F
fly ash based geopolymer materials prepared using KOH and Na2SiO3 alkaline activators
with different curing and cooling methods. The mechanical properties, including the
compressive strength, shrinkage, weight loss, and chemical composition, are investigated
utilizing several key tools, such as X-ray Diffraction (XRD), Scanning Electron
Microscopy (SEM), and Energy Dispersive X-ray Spectroscopy (EDXS) measurements.
The effects of the water/ash ratio, curing methods, cooling methods, and sealing degree
on the compressive strength and thermal properties of the geopolymer products are
studied and analyzed in details.
3.2 Materials and Experimental Methods
3.2.1 Materials
A low calcium Class F fly ash supplied by Boral Material Technologies, Inc.
(Monticello, Texas, USA) is used as the raw material for geopolymer synthesis. Based on
its chemical composition (Table 2.1 in Chapter 2), the Si/Al molar ratio in this class F fly
ash itself is 2.154, with a specific gravity of 2.46. A sodium silicate solution consisting of
9.07 wt.% Na2O and 29.35 wt.% SiO2 (Aqua Solutions Inc, USA) and a potassium
hydroxide (88% purity quotient, Sigma-Aldrich Co., USA) are selected as the alkali
activators. This fly ash is mainly amorphous with little crystalline inclusions of quartz
(Figure 2.1) and the particle size distribution (PSD) curve of the fly ash determined by
the ASTM standard test method combining both sieving and hydrometer analyses
(ASTM 2010) shows that the median particle size (D50) is 22 µm and this fly ash contains
20% sand-sized (>75 µm) coarse particles (Figure 2.2).

45
3.2.2 Sample Preparation
The KOH pellets are first mixed with the sodium silicate solution with a molarity of
6.66 Mol/L to prepare an alkaline solution about one day in advance to ensure it to cool
down to the room temperature (~22oC). The fly ash raw materials without any further
processing is then blended with the alkaline solution made from KOH and Na2SiO3
solution followed by the manual stirring for several minutes before it is cast in plastic
cylinders (3/4 inches in diameter, 2 inches in length). The geopolymer design mix is
listed in Table 3.1, in which the water/ash ratio is the weight of the total water to that of
the fly ash. This parameter affects the workability of the fly ash based geopolymer
cement. Even though all the cases consider include the 6% crystal SiO2 (Quartz) in the fly
ash, the real active Si/Al ratio is still lower than the Si/Al ratio calculated according to the
composition of the fly ash and alkali activation (KOH and Na2SiO3) due to that there may
exist unreacted fly ash grains wrapped in the geopolymeric matrix.
Table 3.1 Geopolymer mixture combinations
Mixture
No. Water/ash Na2O(SiO2)n/KOH Curing regime
Si/Al
(mol)
Si/M
(mol)
1 0.2 1.6 22oC (24h)--80
oC (24h) 2.40 3.60
2 0.25 1.6 22oC (24h)--80
oC (24h) 2.50 3.09
3 0.3 1.6 22oC (24h)--80
oC (24h) 2.59 2.74
4 0.35 1.6 22oC (24h)--80
oC (24h) 2.69 2.47
5 0.4 1.6 22oC (24h)--80
oC (20h) 2.78 2.27
6 0.25 1.6 22oC (24h)--80
oC (20h) 2.50 3.09
7 0.25 1.6 22oC (24h)--60
oC (20h) 2.50 3.09
8 0.25 1.6 60oC (24h) 2.50 3.09
9 0.2 1.6 80oC (24h) 2.40 3.60
10 0.2 1.6 22oC (24h)--80
oC (20h) 2.40 3.60
Note: All the cases were considered 6% crystal SiO2 (Quartz) in the fly ash; M=(Na, K).
The heat curing method developed by Bakharev (2005) is used for the mixtures of
Nos. 1-4 in Table 3.1: the samples are initially cured for 24 hours at the room temperature
22oC, then cured at 80
oC for another 24 hours, and finally cooled down to the room

46
temperature inside the furnace. To investigate the influence of the heating duration,
samples of mixture Nos. 5-6 and No. 10 are heated to 80oC for 20 hours instead of 24
hours after the 24 hours curing in the ambient environment (room temperature). With the
same initial curing method at the room temperature of 24 hours, a curing temperature of
60oC with 20 hours curing is set for the No.7 samples. To examine whether it is good to
put the samples in the ambient environment for 24 hours before the heat curing, mixtures
No.8 and No.9 are heat cured directly for 24 hours with the temperature of 60oC and 80
oC,
respectively, right after they are cast. Afterwards, all the samples of Nos.1-10 are sealed
at the room temperature with caps to prevent the potential rapid water evaporation before
they are tested. For each mixture, at least 3 samples are prepared.
3.2.3 Geopolymer Synthesis and Characterization
The selected geopolymer specimens are exposed to the 500oC and 800
oC heating
with the same heating regime as shown in Figure 2.3 (Chapter 2). The thermal
expansion/shrinkage coefficient of the selected samples is also measured. The diameter
and length of the cylinder samples are measured at three sections each time for each
sample by electrical Vernier calipers before and after the heating test.
The unconfined compressive strength of the cured (without the 500oC and 800
oC
heating) and heated geopolymer cylindrical specimens are measured using a closed loop
uniaxial test systems with an axial force capacity of 150kN at a constant strain rate of
0.02 in/min (Figure 3.1). The two ends of all the samples are cut to be in parallel and
normal to the cylinder length by the mechanical center. The length of all the geopolymer
cement samples is between 1.6~1.9 inches, about 2.0~2.5 times of the diameter (0.775
inches), which meets the requirements of ASTM standard. Then, a very thin layer of
lubricant coating is applied at both ends of each sample so as to reduce the friction effects

47
and the possible shear stress, which is developed during the test between the sample ends
and the contacting surfaces of the test frame.
Figure 3.1 The unconfined compressive strength test
To better understand the rate and extent of the synthesis process of the geopolymer
products, the microstructural and chemical composition analysis are conducted through
the XRD, SEM and EDXS methods. For each type of the geopolymer mixture, the
fractured pieces from the unconfined compressive testes are selected for further analysis
by the SEM and EDXS. The raw materials and the failed geopolymer end products are
grinded into fine powders with particle sizes ≤38 μm in a McCrone micronizing mill
(McCrone Accessories and Components) for the XRD analysis (He et al. 2012). The
fractured surfaces of the selected pieces are paid more attention than the external surfaces
for the SEM and EDXS analysis because the external surfaces may have different
microstructures when the samples are exposed to the air during the curing process (He et
al. 2012). All the selected pieces are coated with platinum before the SEM and EDXS
examination.

48
3.3 Results and Discussion
3.3.1 General Observation of Geopolymer Cement
The failure patterns of the Nos.1~4 samples without the heat treatment (the 500oC
and 800oC heating) are like the failure patterns of the stone in the compression tests,
which indicates that the compressive strength of these samples are very high, as shown in
Figure 3.2. The fractured surfaces are very smooth-going without irregular interlocking
patterns. It is noteworthy that some discrete pores are observed in the fractured surfaces
and hence more pores can be found inside the bulky failed bodies. Two possible reasons
are accounting for this: (1) the pores are firstly dominated by the water and then left after
the water evaporation; (2) the air bubbles may be introduced during the manual stirring or
pouring into the plastic cylinders (He et al. 2012). The existing pores definitely have
detrimental influence on the mechanical properties. Special processing technologies are
proposed to remove the air using vacuum or suppress the air bubbles using the high
pressure for the de-airing treatment (Zivica et al. 2011).
Figure 3.2 The failure patterns of the Nos.1~4 samples before heating.
Figure 3.3 shows the failure patterns of the samples of No.3 mixture before and after
the heating, as well as the No.3c samples (not completely sealed) after the 500oC heating.
It can be observed from Figure 3.3 that the structure of the samples of No.3 mixture after
the 500oC heating is weaker and the structure of the No.3c samples after the 500
oC
heating seems much weaker (the broken surfaces present powdery characteristics), which
No.1 No.2 No.3 No.4

49
indicates that the geopolymer products have much less compressive strength after the
high temperature heating and the sealing degree also affects the thermo-mechanical
properties of the geopolymer cement since the samples of No.3c are not completely
sealed when curing.
Figure 3.3 The failure patterns of the No.3 and No.3c samples before and after heating
For all the heated geopolymer cement samples (exposure to 500oC or 800
oC), no
spalling phenomenon is observed using either the natural cooling down method or the
water cooling down method (cooled down by the water suddenly right after exposed to
No.3 before heating.
No.3 after 500
oC heating.
No.3c (not completely sealed) after 500
oC heating.

50
500oC or 800
oC). After exposed to the 500
oC heating, the external color of the
geopolymer cement cylinders becomes slightly lighter. Macro-cracks are observed on the
surfaces of the samples of No.5, No. 6, No.7, and No.8 mixture. There are one or two
cracks on No.5 and No.6 specimens, and the width of the cracks is very small. Compared
to samples of No.6, there is no crack on No.2 ones, which means that the curing regime
22oC (24h)--80
oC (24h) is better than 22
oC (24h)--80
oC (20h). Compared with the
samples of No.5 and No.6, there are many cracks observed on the surfaces of No.7 and
No.8 samples (Figure 3.4). It is further found that the 60oC heat curing method (No.8) is
not enough for geopolymerization and results in more cracks, while the 80oC heat curing
(No.9) method is much better.
Figure 3.4 The samples before and after 500
oC, and 800
oC heating.
After exposed to the 800oC heating, the samples of No. 1 mixture expand largely in
both the length and the diameter directions, as shown in Figure 3.4. It is interesting to
find that the color of the external surfaces of the samples varies a lot after the high
temperature exposure. There is no crack found on the surfaces of the heated samples. It
can be inferred that the crystallization structures of the No.1 samples change largely after
the 800oC heating, which would be confirmed by the SEM-EDXS analyses discussed
later.
No.1-500oC No.1 No.7-500
oC No.8-500
oC No.1 No.1-800
oC

51
3.3.2 Factors Affecting the Thermo-mechanical Properties of Geopolymer Cement
3.3.2.1 Effects of the Curing Methods
There are many studies about the influence and mechanism of the heat curing on the
compressive strength of the fly ash based geopolymer (Davidovits 2011; Jiang et al. 1992;
Duxson et al. 2007; Bakharev 2005). Jiang et al. (1992) explained the reason for the need
of the heat treatment is that the activation of fly ash is an endothermic reaction so that the
heat curing is very important for the geopolymerization synthesis of the fly ash based
geopolymer cement. Hardjito et al. (2004) studied the compressive strength of the fly ash
based geopolymer cement with the curing temperature ranging from 30oC to 90 °C and
concluded that the compressive strength of cement increases when the curing temperature
increases. It is also proven that a longer heat curing time improves the degree of
geopolymerization and hence resulted in a higher compressive strength. However, the
increase in the compressive strength beyond 24 hours heat curing is not significant.
Therefore, the heat-curing time is better to be set as less than 24 hours in the practical
applications. Long pre-curing process at the room temperature before the heat treatment
is also beneficial for the strength development of the fly ash based geopolymer cement.
Bakharev (2005) proved that the compressive strength is significantly higher if the
geopolymer cement samples are stored 24 hours at the room temperature before the heat
curing.
The tested results are listed in Table 3.2 with some missing data owing to that: (1)
some specimens are not well cut and hence disregarded; (2) some samples have cracks
after exposed to the high temperature treatment. Based on the available results, it is found
that the heat curing improves the compressive strength and the strength after exposed to
500oC heating of the geopolymer cement samples. Taking the samples with the same

52
water/ash ratio of 0.35 as an example, the strength after the 500oC heating and the
strength reduction rate of the geopolymer cement with the heat curing method (No. 4) are
46.6 MPa and 47.9%, respectively. While for the samples with the normal curing method
and water curing method (G3 samples in Chapter 2), the counterparts are 23.6 MPa,
62.6%, and 20.2MPa and 57.7%, respectively. Hence, it can be concluded that the heat
curing method can develop higher strength cement than the normal curing and water
curing methods. For the samples with the water/ash ratio of 0.20, the samples with the
heat curing method (24 hours at the room temperature and then cured at 80oC for another
24 hours, called 22oC (24h)--80
oC (24h) hereafter) also have much better compressive
strength than the samples with the other two different curing methods. As such, it is
proven that the heat curing is beneficial to the development of the compressive strength
of the geopolymer products and hence the heat performance is enhanced. This
observation has also been documented by many researchers (Davidovits 2011; Jiang et al.
1992; Duxson et al. 2007; Bakharev 2005).
Table 3.2 Effect of curing methods on compressive strength
water/ash=0.35 water/ash=0.2
Curing
methods
Normal
curing
(G3)
Water
curing
(G3)
22oC
(24h)--
80oC (24h)
(No. 4)
22oC
(24h)--
80oC (24h)
(No. 1)
22oC
(24h)--
80oC (20h)
(No. 10)
80oC
(24h)
(No.9)
Compressive
Strength
before heated
(MPa)
63.1 47.8 89.4 113.8 -- 50.6
Compressive
Strength after
500oC heated
(MPa)
23.6 20.2 46.6 95.9 47.6 --
Reduction
rate % 62.6% 57.7% 47.9% 15.7%
Note: Normal curing refers to the curing with the wet cloth covered.

53
The water curing method is proven to be beneficial in the Portland cement curing.
However, the compressive strength and strength after the 500oC heating of the
geopolymer cement under the water curing are lower than those under the normal curing
with the wet cloth covered as shown in Table 3.2. Thus, the water curing method is not
favorable for the geopolymer cement.
3.3.2.2 Effects of the Water/Ash Ratio
To investigate the effects of different water/ash ratios on the mechanical properties
of the geopolymer products, the mixtures of No.1 to No. 4 with the same curing regime
(22oC (24h)--80
oC (24h)) are examined and the tested results are plotted in Figure 3.5 and
listed in Table 3.3. As shown in Figure 3.5, the compressive strength of the tested
specimens is very high. All of them are larger than 80 MPa and the highest one even
reaches up to 110 MPa. The examined geopolymer samples all display brittle failure
features. The elastic modulus for the water/ash ratio of 0.25 and 0.3 are very close with
each other, and they are higher than that with the water/ash ratio of 0.2 and 0.35.
Figure 3.5 Effect of water/ash ratio on compressive strength

54
From Table 3.3, it generally shows that the lower the water/ash ratio, the higher the
compressive strength is. The water/ash ratio affects the volume of pores and the porosity
in the matrix which directly influences the strength of the geopolymer concrete (Kong et
al. 2008b). The compressive strength of the geopolymer cement with the water/ash ratio
of 0.20 is the highest, 113.8MPa. However, the compressive strength of the geopolymer
cement with the water/ash ratio of 0.25 and 0.3 are very close, and it seems that 0.3 is the
optimum water/ash ratio if the fluidity and workability of geopolymer cement are taken
into consideration. This can be further explained by the role of water in the development
of geopolymer cement.
Table 3.3 Effects of the water/ash ratio on the compressive strength
Water/ash ratio 0.2 (No. 1) 0.25(No. 2) 0.3(No. 3) 0.35(No. 4)
Compressive
strength before
heated (MPa)
113.8 103.5 102.2 83.4
Compressive
strength after 500oC
heated (MPa)
95.9 62.7 65.4 46.6
Reduction rate % 15.7% 39.4% 36.0% 44.1%
In the synthesis of the geopolymer products, it is generalized that three essential
steps can be summarized from the complex process consisting of a series of dissolution,
reorientation, and solidification reactions. At first, the amorphous phases from the raw
materials dissolve in the alkali solutions in order to generate the reactive species of silica
and alumina. Then, the active ions (Al3+, Si4
+) transport and condensate into monomers.
Finally, the amorphous or semi-crystalline aluminosilicate polymers are formed through
further polycondensations (He et al. 2012). During the first step, enough water can make
the dissolution of the raw materials much easily in order to generate more reactive
species. In the second step, an appropriate amount of water ensures the active ions and

55
the alkali-activation to transport smoothly. However, in the actual setting process (the
third step), the redundant water will precipitate from the geopolymer slurry or paste.
The added water remains outside of the geopolymeric network, acting as a
lubricating element (Davidovitts, 2011). Although the mechanism of the polymerization
is yet to be fully understood, a critical feature is that water is presented only to facilitate
the workability and it does not become a part of the resulting geopolymer structure. In
other words, water is not involved in the chemical reaction and instead it is expelled
during the curing and the subsequent drying.
It is well accepted that the addition of water decreases the compressive strength.
However, water plays an important role in the dissolution and transportation process,
indicating that the water influences the first two essential steps of the geopolymerization.
There must be a proper range of the water/ash ratio that an optimum compressive strength
of geopolymer cement can be warrantied. The lower the water/ash ratio, the less fluidity
is. Thus, consider workability of the geopolymer slurry and the mechanical properties of
the end products together, it seems that the optimum water/ash ratio is around 0.3 for the
fly ash based geopolymer cement, the same as that for the ordinary Portland cement.
Table 3.3 also shows the compressive strength after the 500oC heating for the class F
fly ash-based geopolymer cement prepared with various water/ash ratios ranging from 0.2
to 0.35. The curing regime for these samples is the same as those without the 500oC
heating. All the samples after the high temperature treatment are naturally cooled down to
the room temperature in the furnace before the compressive tests. The compressive
strength of the final geopolymer cement after the 500oC heating varies according to the
water/ash ratios. Generally speaking, a higher water/ash ratio results in a lower strength

56
after the 500oC heating (Except the water/ash ratio of 0.3). The compressive strength
reduction rates for different mixtures before and after the 500oC heating are different
according to the different water/ash ratios. The compressive strength reduction rate of the
geopolymer cement with the water/ash ratio of 0.2 is 15.7%, while the reduction rate of
the geopolymer cement with the water/ash ratio of 0.35 is 44.1%. It means that the
abundant water decreased greatly the residual compressive strength of the geopolymer
cement. An increase of water results in an increase of the pore pressure by the steam
pressure under high temperatures. If the vaporized water cannot escape fast enough, the
increasing internal pore pressure in the geopolymer matrix will cause cracks, thus reduce
the compressive strength (Shorter GW et al. 1961; Zhao et al. 2011).
The strength of the geopolymer matrix after the 500oC heating with the water/ash
ratio of 0.3 is higher than the strength for the water/ash ratio of 0.25, which indicates that
the water/ash ratio of 0.3 may be the optimal mixture ratio. The pore proportion, pore size,
and pore distribution and connectivity in the geopolymer matrix will influence the
strength after the high temperature heating. The test results indicate that the cement with
the water/ash ratio of 0.3 behaves better heat resistant performance when compared to
that with the water/ash ratio of 0.25. The reason may be that it has the better
characterization of the pore proportion, pore size, and pore distribution and connectivity
so that the vaporized water stream can escape easier and cause less damage to the
structure. This can be also expressed and proven by the SEM micro analysis.
From the Differential Thermal Analysis (DTA) and Thermal Gravimetric Analysis
(TGA) curves, Davidovits proved that more than 70% of the reaction water (almost the
added water) is physically bonded water and evaporates before 100oC (Davidovits, 2011).

57
In fact, during the 80oC heat curing, the loss of this physically bonded water determines
the microporosity of the geopolymer cement (Davidovits, 1988). That maybe one of the
reason why the strength of the geopolymer cement strength after the 500oC heating with
the water/ash ratio of 0.3 is a little higher than that of the geopolymer cement with 0.25
water/ash ratio.
3.3.2.3 Effect of Sealing Degree
Open curing conditions produce high porosity and low compressive strength solid
bodies (Izquierdo et al. 2010). The open air conditions allow the water to evaporate freely,
which reduces the availability of the water for geopolymer matrix to grow. The porosity
after the open curing conditions is probably not homogeneously distributed in the sample.
It is observed in the tests that the pores and cracks are primarily concentrated near the
uncovered surface due to the air exposure. The compressive strength decreases largely
after being cured in the open conditions. Therefore, the degree of sealing (from sealed
completely to open curing conditions) also affects the compressive strength of the
geopolymer cement.
The sealing degree (whether sealing completely or not) also affects the heat resistant
performance of the geopolymer cement. Table 3.4 shows the related results of the
different sealing methods for mixtures of No. 3 and No. 4. All the geopolymer cement
samples showed in this table are cured with the curing regime of 22oC (24h)--80
oC (24h),
and then they are naturally cooled down in the oven after the 500oC heat exposure. The
original compressive strength (without the 500oC heating) of the geopolymer cement
samples with the water/ash ratio of 0.3 and 0.35 are 102.2MPa, and 83.4MPa,
respectively (Table 3.3). From the results shown in Table 3.4, the strength of the
geopolymer cement after the 500oC heating not completely sealed is lower than that of

58
the geopolymer cement sealed completely for the two different water/ash ratios of 0.3 and
0.35. The test results verify that open curing condition is not good for the
geopolymerization process, as documented by the previous studies (Izquierdo et al. 2010).
Table 3.4 Effect of sealing degree on compressive strength
Sealing methods
water/ash=0.3 (No. 3) water/ash=0.35 (No. 4)
Strength after
500oC heated
reduction
rate
Strength after
500oC heated
reduction
rate
sealed completely 65.4MPa 36.0% 46.6MPa 44.1%
not completely sealed 50.3MPa 50.8% 34.5MPa 58.6%
3.3.2.4 Effect of Cooling Methods on Thermal Properties
Two different cooling methods are adopted in this part, the natural cooling down
method and the water cooling down method. For the water cooling down method, the
samples are immersed into the room temperature water right after the high temperature
heating in 500oC. For the samples with the 800
oC heating, only the natural cooling down
method is considered. After all the samples are cooled down to the room temperature by
the saturation in the water for 5 minutes and by the natural cooling down method, they
are put into zipped bags for preventing quick water evaporation until the compression
tests are conducted.
The stress-strain curves of the selected No. 1 samples are shown in Figure 3.6. From
Figure 3.6, the compressive strength and the elastic modulus for the two cooling down
methods after the high temperature heating are obvious smaller than the corresponding
ones without the high temperature heating treatment. It is also observed in Figure 3.6 that
the mechanical properties for the samples with the natural cooling down method are
much better than those with the water cooling down method. Comparatively, much
strength loss occurs when the geopolymer samples are exposed to the high temperature
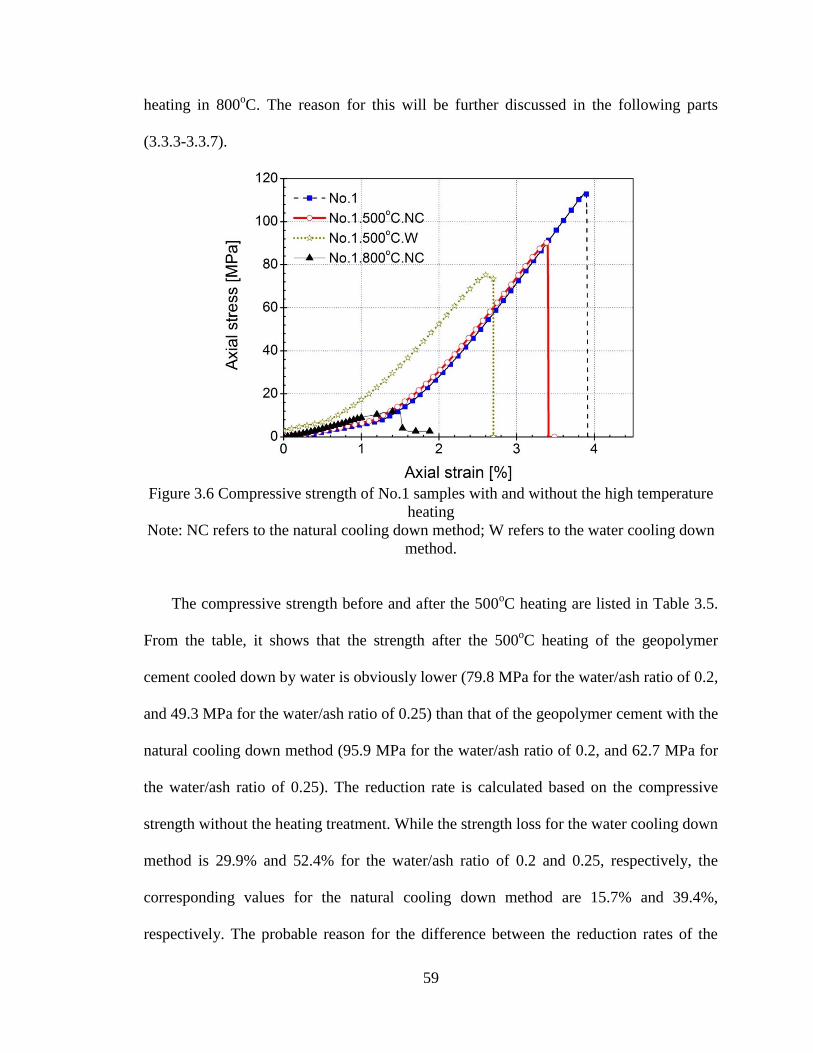
59
heating in 800oC. The reason for this will be further discussed in the following parts
(3.3.3-3.3.7).
Figure 3.6 Compressive strength of No.1 samples with and without the high temperature
heating
Note: NC refers to the natural cooling down method; W refers to the water cooling down
method.
The compressive strength before and after the 500oC heating are listed in Table 3.5.
From the table, it shows that the strength after the 500oC heating of the geopolymer
cement cooled down by water is obviously lower (79.8 MPa for the water/ash ratio of 0.2,
and 49.3 MPa for the water/ash ratio of 0.25) than that of the geopolymer cement with the
natural cooling down method (95.9 MPa for the water/ash ratio of 0.2, and 62.7 MPa for
the water/ash ratio of 0.25). The reduction rate is calculated based on the compressive
strength without the heating treatment. While the strength loss for the water cooling down
method is 29.9% and 52.4% for the water/ash ratio of 0.2 and 0.25, respectively, the
corresponding values for the natural cooling down method are 15.7% and 39.4%,
respectively. The probable reason for the difference between the reduction rates of the

60
compressive strength can be explained that the outside part (external surfaces) of the
geopolymer cement is suddenly cooled down by the water, shrinks largely and then
results in uneven contraction. The uneven contraction leads to a large number of cracks
which decreases the compressive strength of the geopolymer cement samples.
Table 3.5 Effect of cooling methods on residual compressive strength (MPa)
water/ash=0.2 reduction
rate %
water/ash=0.25 reduction
rate %
Original strength 113.8MPa -- 103.5 MPa --
Natural cooling down 95.9 MPa 15.7% 62.7 MPa 39.4%
Water cooling down 79.8 MPa 29.9% 49.3 MPa 52.4%
It is interesting to notice that there is no spalling of the geopolymer samples even
cooled suddenly by water after the high temperature heating. This is different with the
Portland cement concrete which has a high risk of spalling if cooled down by water
suddenly after the high temperature heating. The reason may be that the geoplolymer
binder is more adhesive and it is amorphous to semi-crystalline shaped microstructures,
hence the induced strength loss due to the shrinkage for the geopolymer cement is not as
critical as that for the Portland concrete. Plus, the residual compressive strength is still
competitive, 79.8 MPa for the geopolymer cement with the water/ash ratio of 0.2.
3.3.3 Weight Loss after Elevated Temperature
The weight loss is mainly caused by the water loss. French scientist Joseph
Davidovits proved that the added water does not act in the geopolymerization and
remains outside of the geopolymer network just as lubricating element (Davidovits, 2011).
It is generally considered that three types of water exist in the hardened geopolymer
products: physically bonded water, chemically bonded water and hydroxyl groups OH.
The physical bonded water and chemically bonded water evaporate between 20oC to
100oC, and between100
oC to 300
oC, respectively. When the temperature reaches above

61
300oC, the dehydroxylation of OH groups happens with the subsequent polycondensation
into siloxo bond Si-O-Si, linking neighboring geopolymeric micelles. It is proven that
more than 70% of the reaction water is physically bonded water, which evaporates before
100oC without causing any internal stress and remarkable shrinkage. However, many
micro pores will be produced owing to the empty space left by the water evaporation. The
remaining 30% water, chemically bonded water and hydroxyl groups OH, accounting for
up to 90% of the total shrinkage when the samples are heated from 20oC to 500
oC
(Davidovits, 1988).
It is further verified by Perera and his team at ANSTO in Australia that the water
presents after the curing of the geopolymer cement as three types: “free” water,
interstitial water, and OH groups. The “free” water mainly exists in the intergranular
regions with a thin external film. About 60% of the starting water is lost after heating to
150oC. While after exposed to 300
oC, almost all the remaining interstitial water is lost.
The OH groups constitute a quite low ratio of the starting water. (Davidovits, 2013)
The weight loss of geopolymer cement samples according to different water/ash ratio
under the curing regimes of 22oC (24h)--80
oC (24h), 22
oC (24h)--80
oC (20h) and 80
oC
(24h) is shown in Table 3.6. All the samples are cooled down naturally in the oven by the
elevated temperature exposure. From Table 3.6, it is obvious that the weight loss
increases with the increase of the water/ash ratio since the weight loss is represented
mainly by the water loss of the samples. The weight loss of geopolymer paste samples
with the water/ash ratio of 0.2 is 14.2% between 22oC and 500
oC heating and only 0.5%
between 500oC and 800
oC, which means that the weight loss mainly occurs before the
500oC heating. It is interesting to note that the chemical bonded water and OH groups

62
formed in the geopolymer cement with the 22oC (24h)--80
oC (24h) curing regime (i.e.,
0.5% for No. 1) is more than that of the geopolymer cement with the 80oC (24h) heat
curing regime (i.e., 1% for No. 9), indicating that 24 hours curing at the normal
temperature (22oC) before the heat curing (80
oC) is better for the geopolymerization
process and hence induces higher compressive strength geopolymer cement.
Table 3.6 Weight loss for different mixtures after heating
Curing methods 22oC (24h)--80
oC (24h)
22oC (24h)--80
oC
(20h)
80oC
(24h)
Mixture No. No.1 No.2 No.3 No.4 No.1
0 No.6 No.5 No.9
Water/ash ratio 0.2 0.25 0.3 0.35 0.2 0.25 0.4 0.2
Original weight
(g) 30.3 28.2 28.4 28.0 28.4 28.1 26.9 28.1
Weight after
500oC heating (g)
26.0 23.7 23.3 22.5 24.4 23.6 21.1 24.5
Weight after
800oC heating (g)
25.8 24.2 -- 20.8 24.2
Weight loss after
500oC
14.2
%
16.0
%
18.0
%
19.6
%
14.1
%
16.0
%
21.6
%
12.81
%
Weight loss after
800oC
14.7
%
14.7
% --
22.7
%
13.81
%
Weight loss
500oC-800
oC
0.5% 0.6% -- 1.1% 1%
3.3.4 Thermal Contraction/Expansion
As shown in Figure 3.4, the geopolymer cement samples contracte after exposed to
the 500oC heating and expanded after exposed to 800
oC using the natural cooling down
method (cooled down naturally in the oven after the 500oC or 800
oC heating). While
Figure 3.4 mainly shows the results related to the topic of thermal contraction/expansion
of the No. 1 mixture, more results are listed in Table 3.7. The length of all the samples
before and after the elevated temperature exposure is measured by the Vernier caliper.
The contraction/expansion rate of the geopolymer cement samples for different water/ash
ratios is calculated based on the original length before the high temperature exposure.

63
The geopolymer samples with the water/ash ratio of 0.2 shrink 2.0% between 22oC and
500oC, and expand 9.4% between 22
oC and 800
oC. For the geopolymer specimens with
the water/ash ratio of 0.4, the contraction rate is 3.4% and the expansion rate is 25.2%.
The higher the water/ash ratio, the more deformation of the geopolymer paste is. As such,
the thermal shrinkage/expansion of geopolymer cement is highly affected by the
water/ash ratio.
Table 3.7 The contraction/expansion rate of geopolymer cement according to different
water/ash ratios
Water/ash ratio 0.2 (No.1) 0.25 (No.2) 0.3 (No.3) 0.35 (No.4) 0.4 (No.5)
500oC 2.0% 2.6% 3.1% 3.6% 3.4%
800oC -9.4% -- -- -- -25.2%
500oC-800
oC -11.4% -- -- -- -28.6%
Note: Positive represent contraction and negative represent expansion.
The main reason for the shrinkage when the samples are exposed to the 500oC
heating may be caused by the loss of the chemically bonded water and hydroxyl groups
OH. For the thermal expansion problem, it may be due to the change of the
microstructures for the geopolymer binders when the samples are exposed to as high as
the 800oC heating. This will be further verified by the SEM analysis as discussed later.
Different cooling methods also influence the thermal contraction and the results for
the mixtures of No.1 and No.2 are listed in Table 3.8. From the table, the contraction of
the geopolymer cement samples cooled down by water after the 500oC exposure is higher
than those cooled down naturally.
Table 3.8 The contraction rate of geopolymer cement according to different cooling down
methods
Water/Ash=0.2 (No.1) Water/Ash=0.25 (No.2)
Cooling
methods Natural Cooling Water Cooling Natural Cooling Water Cooling
500oC 2.0% 2.6% 2.6% 3.1%

64
3.3.5 Density and Softening Temperature
It is concluded by Davidovitts (2011) that the thermal insulating values are a function
of the density, which means that a good thermal conductivity requires low density
material. This conclusion is addressed based on the samples with the same compressive
strength. The value of the apparent density of the geopolymer cement (without fillers or
any constraint) is a very important factor. Davidovits (2011) also concluded that
geopolymer has a low apparent density due to its microporous structure. Figure 3.7 shows
that the apparent density increases with the ratio of Si/Al (i.e., the densification of the
geopolymeric structure). Figure 3.7 also shows the softening temperature pints of the
geopolymers. Geopolymers have several dehydroxylation and crystallization phases
before melting. One phase is that the geopolymer matrix softens and induces
recrystallization (or ceramisation) at a certain temperature (Davidovits, 2011). This
softening temperature point is important for high temperature geopolymer applications
and it is lower than the melting point.
Figure 3.7 Apparent density (left) and softening temperature (right) for pure matrix
without fillers (Davidovits 1991)

65
Table 3.8 The density for the geopolymer cements with different water/ash ratios
Water/Ash 0.2 0.25 0.3 0.35
Density (g/cm3) 2.05 2.02 1.96 1.91
From Tables 2.5 and 2.8 in last chapter, the average densities of the G1 and G2
geopolymer samples are 1.6g/cm3 and 1.8g/cm
3, respectively. However, it is found that
the heat resistant performance of G1 samples was worse than that of the G2 samples
because G1 samples did not form good geopolymer cement. In this chapter, the average
density for the geopolymer cement is around 2.0 g/cm3, as listed in Table 3.8. The
apparent density is usually higher than the normal density. According to Figure 3.7, and
3.8, the softening temperature for the geopolymer cement samples discussed in this
chapter is between 500oC and 800
oC. This is verified by the test results that the
geopolymer cement expand or soften or recrystallize between 500oC and 800
oC.
3.3.6 X-Ray Diffraction (XRD) Analysis
Figure 3.8 compares the XRD patterns of the class F fly ash and the No. 1
geopolymer samples before and after the heating (500oC, and 800
oC). Two different
cooling methods (natural cooling down method and water cooling down method) are
adopted for the samples after exposed to the 500oC heating. The XRD patterns of the fly
ash shows a huge broad hump between 8-18˚ 2θ with a few sharp peaks indicated as
quartz (SiO2). It is interpreted that the amorphous phases, calcined silica and alumina,
constitute the major part of this raw material. As for the geopolymer end products, the
broad hump indicates that there is amorphous geopolymer matrix formed. A broad hump
between 18-36˚ 2θ is the characteristic reflection of amorphous geopolymers (Li and Liu
2007; Guo et al. 2010). More discernable XRD patterns are shown in Figure 3.8 (b), in
which a huge and broad hump from amorphous phases is clearly observed at 8-38o 2θ,

66
along with a few sharp peaks identified as crystalline quartz, suggesting a very high
degree of geopolymerization in the KOH and Na2SiO3 activated geopolymer cement
samples. This observation explains why the KOH and Na2SiO3 activated fly ash-based
geopolymer cement possess higher compressive strength, stiffness, and thermal
properties. Furthermore, a few sharp peaks are also observed in the geopolymer products,
indicating that these crystalline phases probably present as the inactive fillers in the
geopolymer synthesis (Zhang et al. 2004; Zhang et al. 2010).
(a)
(b)
Figure 3.8 XRD patterns of fly ash, No.1 samples before and after heating. (Q=quartz,
NC=natural cooling down, W=water cooling down)

67
It can be seen from Figure 3.8 (b) that the heating affects the XRD patterns of
geopolymer samples. The XRD patterns of the geopolymer sample of No.1. 800oC. NC
(natural cooling down after the 800oC heating for 1 hour) have two huge and broad
humps at 8-18o and 18-38
o 2θ, respectively, indicating the presence of the amorphous
phases as well as more pronounced damage. The second broad hump is the same like
other geopolymer samples of No.1 which indicates the amorphous geopolymer matrix.
The first broad hump is like the fly ash raw material, which indicates that the heating will
damage the formed amorphous geopolymer matrix and change back to the fly ash raw
materials, such as amorphous silica and alumina. It is reasonable that the patterns of
No.1.500.W and No.1.500.NC are between the patterns of No.1.800oC.NC and No.1
geopolymer samples.
3.3.7 Characterization of Microstucture (SEM-EDXS)
3.3.7.1 SEM-EDXS of Class F Fly Ash
Figure 3.9 shows the micromorphological features of the class F fly ash raw material.
The Class F fly ash particles are mainly microspheres with sizes from 1 to 20µm, which
verifies the Particle Size Distribution (PSD) analyses (D50=22 µm, Figure 2.3). The
knowledge of the micromorphology of the class F fly ash raw material can help to
identify those nonreactive and unreacted phases present in the geopolymer cement
samples, which will be discussed later. EDXS chemical analyses of the ball indicated by
A (Figure 3.9 (b)) and the whole area of picture (b) are shown in Figure 3.9 (c) and (d),
respectively. From Figure 3.9 (c), it can be seen that the ball contains more Al than Si,
and also some O, Ca, Mg, and Fe, which matches the compositions of SiO2, Al2O3, CaO,
and Fe2O3 in the class F fly ash in Table 2.1. The SEM-EDXS analyses of the class F fly
ash confirm the above compositional analyses by XRD (Figure 3.8).

68
Figure 3.9 SEM micrographs and EDXS analyses of the class F fly ash raw material: (a)
and (b), fly ash; (c) EDXS spectrum of a ball indicated by A in (b); and (d) EDXS
spectrum of the whole area of (b).
(a) (b)
A
The ball contains more
Al, Ca, and Mg
(c)
The whole area of (b)
(d)
(a) (b)
A
The ball contains more
Al, Ca, and Mg
(c)
The whole area of (b)
(d)

69
3.3.7.2 SEM-EDX of No.1, No.2, No.3, No.4, and No.5 Geopolymer Samples
Figure 3.10 shows the microstructure of the No. 1 geopolymer samples. Micropores
and microcracks can be clearly observed on the fractured surface (Figure 3.10 (a)), as
well as in the manifested views in the same figure. The porous microstructure leads to a
good fire resistant performance, as discussed above. Some fly ash particles present as
nonactive fillers between the geopolymer binders (Figure 3.10 (f)), which is further
supported by the EDXS spectrum analysis in Figure 3.11. Due to many unreacted fly ash
balls, the real Si/Al ratio for the whole geopolymer samples seems unfeasible to obtain
yet. The dense and bulky base (Figure 3.10 (d)) is gel-like substances and can be
characterized as geopolymer binders. The semi-spherical surface maybe the interface of
the geopolymer binder and the fly ash ball, where many needle or stripe-shaped particles
are formed (Figure 3.10 (e)). The reason for the presence of many needle-shaped particles
may be due to the high concentration or abundant alkali solution surrounded the fly ash
ball in the geopolymer paste: the unreacted alkali precipitated after the tests and formed
the needle or stripe-shaped particles. This inference can be verified by the neo-formed
particles on the surface of the fly ash ball as shown in Figure 3.10 (f).
Based on the analysis of the microstructure of the sample of No. 1, the as-received
geopolymer products consist of many features: voids, pores, micro cracks, fly ash balls,
dense and bulky geopolymer binders. It is considered as a hybrid mix but rather pure
geopolymers. The porous microstructure proves that it is of a good fire resistant
performance. The neo-formed needle or stripe-shaped particles indicate that the current
geopolymer products may have the capability for the future growth of the compressive
strength in the extended curing.

70
Figure 3.10 The microstructure of the sample No.1 showing the presence of micropores
and microcracks, a fractured fly ash particle (e), fly ash ball (f), and some neoformed
substances (e.g., needle-shaped particles (e), and bulky gel-like geopolymer matrix (f))
A
C B
(a)

71
Figure 3.11 shows the selected EDXS results for the No. 1 geopolymer samples
based on the SEM analysis in Figure 3.10. Figure 3.11 (a) shows the EDXS spectrum
obtained from the whole area in Figure 3.10 (a).
Figure 3.11 EDXS analyses of selected areas from Figure 3.10, the sample No.1: (a) the
spectrum of the whole area in Figure 3.10 (a); (b) and (c) the spectrum of the Areas A and
B in Figures 3.11(d) and (e), respectively; (d) the spectrum of the Area C in Figure 3.10
(f).
geopolymer matrix
unreacted fly ash ball
(a)
(d)
A
C
geopolymer matrix
(c) B
(b)

72
In addition to the major elements (Na, K, Al, O, Si), constituting the geopolymer
binders, the elements of Ca and Fe are also present. It is observed that the whole area
contains more Si than Al, while the fly ash big ball which contains more Al than Si did
not act in the geopolymerization. In addition, the Mg element is not shown in the
spectrum of the whole area, which may be due to its tiny concentration or it is covered by
the peaks of other elements. From the spectrum of the areas of A and B, indicated in
Figure 3.10 (d) and (e), the bulky and gel-like area can be confirmed as the pure
geopolymer binder. The EDXS spectrum obtained from the ball indicated in Figure 3.10
(f) further proves that the big fly ash ball is unreacted in the synthesis process but with
some unreacted alkali on the surface of the ball (element K in the spectrum).
Figure 3.12 shows the SEM micrographs of the geopolymer samples of Nos. 2~5,
and Figure 3.13 shows the EDXS analysis for the selected areas from Figure 3.12.
Generally speaking, unreacted fly ash balls present in all the images for all the different
water/ash ratios and Si/Al ratios. All the geopolymer final products are continuous, bulky
and dense geopolymer matrix with discrete pores and cracks. Two possible reasons are
accounting for the cracks: (1) the major parts of the cracks are caused by the loading
during the unconfined compressive tests; (2) some cracks are caused by the uneven
internal stress or shrinkage due to the water evaporation during the curing. It is observed
that more pores are presented for the samples with the higher water/ash ratio, which may
be due to that a possible larger volume of water gathered in one place and left a larger
void after the water evaporation for such a higher water/ash ratio. The pores and cracks
definitely have detrimental influences on the geopolymer products.

73
Figure 3.12 The comparison of microstructures of the samples of Nos.2~5: (a) and (b),
No.2; (c) and (d), No. 3; (e) and (f), No. 4; (g) and (h), No. 5
B
D
C
A
pores
(a)

74
Figure 3.13 EDXS analyses of selected areas from the Figure 3.12
A
The reacted fly ash ball, geopolymer matrix
B
The big concavity---geopolymer matrix
C
geopolymer matrix
D
geopolymer matrix
(a)
(b)
(c)
(d)

75
It is noteworthy that many semi-spherical concavities left on the fractured surfaces
for all the selected pieces of the geopolymer products. The reason may be that the
physically bounded water exists between the geopolymer binders and the fillers
(unreacted big fly ash balls) like a film. After the loss of the water, the voids around the
fly ash ball will appear. Hence, the fractured surface tends to pass through these voids
and presents many semi-spherical concavities. However, the reacted portion of the fly ash
balls may be bonded on the continuous base.
In Figure 3.12 (b), a particular attention is paid to a small ball as indicated by A.
Further EDXS analysis of this small ball shows that it is a reacted fly ash ball with the
major elements of Na (K), O, Al and Si, which constitute the major parts of the
geopolymer cement. The areas indicated by B in Figure 3.12 (d) refer to a semi-spherical
concavity and a discrete aggregate with smooth and round-shaped surface. The EDXS
spectrum shows that the areas indicated by B are well formed geopolymer binders. The
areas of C in Figure 3.12 (f) show the geopolymer binders with complex and cloudy
shapes, as well as the areas of D in Figure 3.12 (h). These complex shaped materials are
characterized as with the same elements as the pure geopolymers, while they have much
lower compressive strength as compared with that of the pure geopolymers.
Based on the observations of the microstructures for the samples of Nos.1~5 (Figure
3.10~3.13), it is concluded that: (1) the geopolymers for the samples prepared with
different water/ash ratios are not pure geopolymers but rather with some impurities and
discrete pores and cracks of various sizes; (2) for the geopolymer products of No. 1
(water/ash=0.2; Si/Al=2.38), the fractured surfaces seem very continuous without any
complex shapes of geopolymer binders. While for the samples of Nos. 4 and 5 with

76
higher ratios of water/ash and Si/Al, the microstructure surfaces present cloudy and
complex shaped geopolymer binders on the bulky base, which have negative influence on
the compressive strength of the geopolymers as discussed in Figure 3.5; (3) micro pores
can be observed for all the examined geopolymer samples regarding to the different
water/ash ratios adopted. Considering the workability of the geopolymer slurry, the
optimum water /ash ratio can be taken as 0.3.
3.3.7.3 SEM-EDX analysis of No.1.500oC-NC, No.1.500
oC-W, No.3.500
oC-NC, and
No.1.800oC-NC Geopolymer Samples
Figure 3.14 compares the SEM microstructures of the geopolymer samples of No.1
with two different cooling down methods after the 500oC heating. The EDXS spectrums
of the selected interested areas are also shown in Figure 3.14. Similar as the samples
without the high temperature heating, the failure surfaces of the samples with the 500oC
heating have pores, cracks, voids, unreacted fly ash balls and semi-spherical concavities
left by the fly ash balls. Based on the EDXS spectrum analysis shown in Figure 3.14 (e)
and (f), geopolymer binders are well conserved after the high temperature heating, hence
a relatively high compressive strength is still presented as discussed before.
From this figure, it is observed that the fractured surfaces of the No.1.500oC-NC
samples are very smooth, while lots of power-shaped, irregular and small particles are
pronounced on the fractured surfaces of the No.1.500oC-W samples (Figure 3.14 (c)),
indicating that the water cooling down method causes negative effects on some
vulnerable areas where the geopolymer binders are not connected well. However, smooth
failure surfaces are still witnessed for the No.1.500oC-W samples (Figure 3.14 (d)),
which contributes to the high residual compressive strength of the No.1.500oC-W
samples.

77
Figure 3.14 SEM micrographs and EDXS analyses for the samples of No.1.500
oC-NC
and No.1.500oC-W: (a) and (b), No.1.500
oC–NC; (c) and (d), No.1.500
oC-W; (e) EDXS
spectrum of area A indicated in (b); and (f) EDXS spectrum of area B indicated in (c).
A
Geopolymer matrix
B
Geopolymer matrix
A
B
(e)
(f)
A
Geopolymer matrix
B
Geopolymer matrix
A
B
(e)
(f)

78
Figure 3.15 shows the SEM micrographs of the interested failure pieces of
No.3.500oC-NC samples, and Figure 3.16 shows the selected EDXS spectrum for the
interested areas indicated in Figure 3.15.
Figure 3.15 The microstructure of the sample No.3.500
oC-NC.
A
B
C
D

79
Figure 3.16 EDXS analyses of selected areas from the Figure 3.15: (a) EDXS spectrum
for area A indicated in Figure 3.15 (c); (b) EDXS spectrum for area B indicated in Figure
3.15 (c); (c) EDXS spectrum for area C indicated in Figure 3.15 (e); and (d) EDXS
spectrum for area D indicated in Figure 3.15 (f).
A
geopolymer matrix
B
Silicate
C
Silicate
D
Alumina and Silicate
(a)
(b)
(c)
(d)

80
Compared with the microstructures of the No.1.500oC-NC samples, some
distinguishable narrow and long strips or zones are recognized in Figure 3.15 (a) and (b).
Further investigation by the EDXS spectrum analysis of several interested areas indicated
by B and C in Figure 3.15 (c) and (e) shows that the narrow strips are mainly Si and SiO2.
The leather or strip-shaped precipitated materials indicated by D in Figure 3.15 (f) are
consisted by alumina and silicate and this is verified by the EDXS spectrum analysis as
shown in Figure 3.16 (d).
The understanding for the presence of the silicate strips is not clear yet, while its
influence on the mechanical properties of the geopolymer end products are very clear.
From the analysis of the data listed in Table 3.3, the reduction rate of the compressive
strength for the No. 3 samples after the 500oC heating is 36%, while it is 15.7% for the
No. 1 samples under the same conditions. However, further studies are needed to warrant
a full understanding of the presence of the silicate strips.
Figure 3.17 shows the detailed images of the No.1.800oC-NC samples and several
interested areas are further investigated by the EDXS spectrums. From the micrographs
shown in Figure 3.17 (a)~(d), the microstructure after the 800oC heating (No.1.800
oC-
NC) becomes loose, porous and honeycomb-shaped patterns as compared with the
samples without the heating treatment and the samples with the heating treatment, such as
the No.1, No.1.500oC-NC, and No.1.500
oC-WC samples. This micro-level change is
reflected on the macro-level that the samples expanded 9.4% based on the samples
without the high temperature treatment, as shown in Table 3.7. The expanded structures
result in the notably much lower compressive strength (only 12 MPa) which was shown
in Figure 3.6.

81
Figure 3.17 The microstructure of the sample No.1.800
oC-NC.
The continuous and shell-like area indicated by A in Figure 3.17 (d) shows the
existence of the geopolymer binder, as confirmed by the EDXS spectrum in Figure 3.18
B
A
C

82
(a). It is noted that several reacted fly ash balls stick on the porous geopolymer base
(Figure 3.17 (d), Figure 3.18 (b)).
Figure 3.18 EDXS analyses of selected areas from the Figure 3.17: (a) EDXS spectrum
for area A indicated in Figure 3.17 (d); (b) EDXS spectrum for area B indicated in Figure
3.17 (d); and (c) EDXS spectrum for area C indicated in Figure 3.17 (f).
Some neo-formed needle shaped materials extrude or grow on the geopolymer base
and they are identified as the new generated geopolymers by the EDXS analysis (Figure
3.18 (c)), which indicates that the formation of the final geopolymer products can last for
a long duration. While the verified elements from the EDXS spectrum analysis for the
No.1.800oC-NC samples are the same as those for the examined geopolymers without the
geopolymer matrix
A
Reacted fly ash--geopolymer matrix
B
C
geopolymer matrix
(a)
(b)
(c)

83
high temperature heating, the mechanical properties are significantly affected by the
porous and loose microstructures. The main reason may be that the evaporation of the
chemically bonded water and hydroxyl groups OH produces many micro pores and hence
deteriorates the mechanical behavior under the compression tests.
3.4 Conclusions
In this chapter, an experimental study regarding the thermo-mechanical properties of
a geopolymer cement prepared using the class F fly ash and KOH and Na2SiO3 alkaline
activators under different silicate/hydroxide ratios is conducted and presented. Based on
the experimental results, XRD and SEM-EDXS analyses, the following conclusions can
be drawn.
1. The failure patterns of the geopolymer cement samples without the heat treatment
(the 500oC and 800
oC heating) are like the failure patterns of the stone in the compression
tests. The compressive strength of the geopolymer cement samples cured at appropriate
conditions with the water/ash ratio is 0.2 even reaches up to 110 MPa. It is competitive
with the high-strength concrete used in the high-rise buildings.
2. The strength of the geopolymer cement samples with a water/ash ratio of 0.2 after
the 500oC exposure is still as high as 96 MPa. The shrinkage in the longitudinal direction
of the geopolymer cement sample with a water/ash ratio of 0.2 is 2.0% after the 500oC
heating, but the expansion reaches 9.4% after the 800oC heating, while after the 800
oC
exposure, it is 12MPa, which verifies that the softening temperature for the geopolymer
cement samples discussed in this chapter is between 500oC and 800
oC.
3. The heat curing method can develop higher strength cement than the normal
curing and water curing methods. The samples with the heat curing method (24 hours at
the room temperature and then cured at 80oC for another 24 hours) have very good
84
compressive strength. Open curing condition (without sealing or sealed not completely) is
not good for the geopolymerization process.
4. The water/ash ratio of 0.3 may be the optimal mixture ratio if the fluidity and
workability of geopolymer cement are taken into consideration.
5. For all the heated geopolymer cement samples (exposure to 500oC or 800
oC), no
spalling phenomenon was observed using either the natural cooling down method or the
water cooling down method.
6. According to the compositional and microstructural analyses, the as-received
geopolymer products consist of many features: voids, pores, micro cracks, fly ash balls,
dense and bulky geopolymer binders. It is considered as a hybrid mix but rather pure
geopolymers. The porous microstructure proves that it is with a good fire resistant
performance.

85
CHAPTER 4 CONCLUSIONS
Alkali-activators play an important role in the geopolymerization, which determines
the mechanical and thermal properties of geopolymer cements. First, three groups of
geopolymer cements are discussed, which are activated by NaOH activator, NaOH and
Na2SiO3 mixed activators, and KOH and Na2SiO3 mixed activators. Then, a further study
on the thermo-mechanical properties of the class F fly ash based geopolymer materials
prepared using KOH and Na2SiO3 alkaline activators with different curing and cooling
methods are presented. The effects of the water/ash ratio, curing methods, cooling
methods, and sealing degree on the compressive strength and thermal properties of the
geopolymer products are investigated and analyzed in details. Based on the experimental
results, XRD and SEM-EDXS analyses, the following conclusions can be drawn.
1. The Na2SiO3 is necessary for the development of geopolymer cement. The NaOH
activated fly ash geopolymer cement has very low compressive strength, implying the
geopolymerization is very low for using the NaOH only. The compressive strength of
NaOH and Na2SiO3 activated fly ash geopolymer cement is around 30 MPa. The
compressive strength of the KOH and Na2SiO3 activated fly ash geopolymer cement
samples cured at appropriate conditions with the water/ash ratios 0.2 even reaches up to
110 MPa.
2. The strength of the KOH and Na2SiO3 activated fly ash geopolymer cement
samples with a water/ash ratio of 0.2 after the 500oC exposure is still as high as 96 MPa,
while after the 800oC exposure, it is 12 MPa, which verifies that the softening
temperature for the geopolymer cement samples discussed in chapter 3 is between 500oC
and 800oC.
86
3. The heat curing method can develop higher strength cement than the normal
curing and water curing methods. The KOH and Na2SiO3 activated fly ash geopolymer
samples with the heat curing method (24 hours at the room temperature and then cured at
80oC for another 24 hours) have very good compressive strength. Open curing condition
(without sealing or sealed not completely) is not good for the geopolymerization process.
4. The water/ash ratio of 0.3 may be the optimal mixture ratio if the fluidity and
workability of geopolymer cement are taken into consideration.
5. For all the heated geopolymer cement samples (exposure to 500oC or 800
oC), no
spalling phenomenon was observed using either the natural cooling down method or the
water cooling down method.
6. According to the compositional and microstructural analyses, the as-received
geopolymer products consist of many features: voids, pores, micro cracks, fly ash balls,
dense and bulky geopolymer binders. It is considered as a hybrid mix but rather pure
geopolymers. The porous microstructure proves that it is with a good fire resistant
performance.
7. The water precipitation phenomenon was observed for the NaOH and Na2SiO3
activated fly ash geopolymer cement samples, where Na2CO3 was produced by CO2 and
additional NaOH due to a large molar ratio of Na/Si (1.5). Hence, it is better to take the
molar ratio of Na/Si as 1.0 to avoid the water precipitation. The water/ash ratio is
preferred to be located between 0.30 and 0.35. However, as an emerging topic in
geopolymer cement, the water precipitation effects should be further studied.
In this study, good fly ash based geopolymer cement is formed, which can be used in
many applications. Two possible applications are as:

87
1. For the NaOH and Na2SiO3 activated fly ash geopolymer cement, the compressive
strength is around 30 MPa in the ambient environment and the setting time is around 30
minutes. First, this geopolymer cement can be used to form a new geopolymer concrete
by adding coarse and fine aggregates and sands. Second, this geopolymer cement can be
used for concrete recycling with its excellent bonding capacity and this will result in great
economic and environmental benefits and will finally promote sustainable development
of communities.
2. For the KOH and Na2SiO3 activated fly ash geopolymer cement, the compressive
strength and strength after 500oC exposure is as high as 110 MPa, and 96 MPa,
respectively. This high performance geopolymer cement can be used in the high rise
buildings and bridges as alternative structural materials. Further, it also can be used in
heat or fire resistant applications.

88
REFERENCES
Bakharev, T. (2005). “Geopolymeric materials prepared using Class F fly ash and
elevated temperature curing.” Cement and Concrete Research, 35(6), 1224-1232.
Bakharev, T. (2006). “Resistance of geopolymer materials to acid attack.” Cement and
Concrete Research, 35 (4), 658-670.
Barbosa, V.F.F., and MacKenzie, K.J.D. (2003a). “Thermal behavior of inorganic
geopolymers and composites derived from sodium polysialate.” Materials Research
Bulletin, 38(2, 25), 319-331.
Barbosa, V.F.F., and MacKenzie, K.J.D. (2003b). “Synthesis and thermal behavior of
potassium sialate geopolymers.” Materials Letters, 57(9-10), 1477-1482.
Cheng, T.W. (2003). “Fire-resistant geopolymer produced by waste serpentine cutting.”
Proceedings of the 7th International Symposium on East Asian Resources Recycling
Technology, November 10~14, Tainan, Taiwan, 431-434.
Cheng, T.W., and Chiu, J.P. (2003). “Fire-resistant geopolymer produced by granulated
blast furnace slag.” Minerals Engineering, 16(3), 205-210.
Davidovits, J. (1984). “Synthetic mineral polymer compound of the silicoaluminates
family and preparation process.” US Patent 4,472,199.
Davidovits, J. (1988). “Geopolymer chemistry and properties.” Geopolymer 88, First
European Conference on Soft Mineralurgy, Compiegne, France, 1, 25-48.
Davidovits, J. (1991). “Geopolymers: inorganic polymeric new materials.” Journal of
Thermal Anlysis, 37, 1633-1656.
Davidovits, J. (1996). “Properties of geopolymer cements.” Proceedings First
International Conference on Alkaline Cements and Concretes, 1, SRIBM, Kiev,
Ukraine, 131-149.
Davidovits, J. (2013). “Geopolymer chemistry and applications.” Chapter 21 and 22, 3rd
edition. Geopolymer Institute, Saint-Quentin, France. ISBN: 9782951482050.
Davidovits, J. (2009). “Why the pharaohs built the Pyramids with fake stones?”
Geopolymer Institute, Saint-Quentin, France. ISBN: 9782951482043.
Davidovits, J., Davidovits, M., and Davidovits, N. (1994). “Process for obtaining a
geopolymericalumino-silicate and products thus obtained.” US Patent, 5,342,595.
Diaz, E.I., Allouche, E.N., and Eklund, S. (2010). “Factors affecting the suitability of fly
ash as source material for geopolymers.” Fuel, 89(5), 992-996.

89
Duxson, P., Ferna ndez-Jime nez, A., Provis, J.L., Lukey, G.C., Palomo, A., and Van
Deventer, J.S.J. (2007). “Geopolymer technology: the current state of the art.”
Journal of Materials Science, 42(9), 2917-2933.
Foden A, Lyon R, Balaguru P, and Davidovitz J. (1996). “High temperature inorganic
resin for use in fiber reinforced composites.” In: Proceedings of 1st international
conference on composites in infrastructures. University of Arizona; p.166-177.
Guerrieri, M. and Sanjayan, J.G. (2010). “Behavior of combined fly ash/slag based
geopolymers when exposed to high temperatures.” Fire and Materials, 34(4), 163-
175.
Guo, X.L, Shi, H.S, and Dick, W.A. (2010). “Compressive strength and microstructural
characteristics of class C fly ash geopolymer.” Cement and Concrete Composites,
32(2), 142-147.
Hardjito, D., and Rangan, B.V. (2005), “Development and properties of low calcium fly
ash based geopolymerconcrete”, Research Report GC 1, Curtin University of
Technology, Perth, Australia, available at espace@curtin or
http://www.geopolymer.org.
Hardjito, D., Wallah, S.E., Sumajouw, D.M.J., and Rangan, B.V. (2004). “On the
Development of Fly Ash-Based Geopolymer Concrete.” ACI Material Journal,
101(6), 467-472.
He, J., Zhang, J.H., Yu, Y.Z., and Zhang, G.P. (2012). “The strength and microstructure
of two geopolymers derived from metakaolin and red mud-fly ash admixture: A
comparative study.” Construction and Building Materials, 30, 80-91.
Izquierdo, M., Querol, X., Phillipart, C., Antenucci, D., and Towler, M. (2010). “The role
of open and closed curing conditions on the leaching properties of fly ash-slag-based
geopolymers.” Journal of Hazard Material, 176(1-3), 623-628.
Jiang, W., and Roy, D.M. (1992) “Hydrothermal processing of new fly ash cement”.
Ceramic Bulletin, 71(4) 642-647.
Kong, D.L.Y., and Sanjayan, J.G. (2008a). “Damage behavior of geopolymer composites
exposed to elevated temperatures.” Cement & Concrete Composites, 30(10), 986-991.
Kong, D.L.Y., and Sanjayan, J.G. (2010). “Effect of elevated temperatures on
geopolymer paste, mortar and concrete.” Cement and Concrete Research, 40(2), 334-
339.
Kong, D.L.Y., Sanjayan, J.G., and Sagoe-Crentsil, K. (2007). “Comparative performance
of geopolymers made with metakaolin and fly ash after exposure to elevated
temperatures.” Cement and Concrete Research, 37(12), 1583-1589.

90
Li, Z., and Liu, S. (2007). “Influence of slag as additive on compressive strength of fly
ash-based geopolymer.” Journal of Materials in Civil Engineering, 19(6), 470-474.
Lloyd, N., and Rangan, V. (2009). “GeopolymerConcrete—Sustainable Cementless
Concrete.”ACI Special Publication SP-261, 10th ACI International Conference on
Recent Advances in Concrete Technology and Sustainability Issues. American
Concrete Institute, Farmington Hills, MI.
Pan, Z., and Sanjayan, J. G. (2010). “Stress-strain behaviour and abrupt loss of stiffness
of geopolymer at elevated temperatures.” Cement & Concrete Composites, 32(9),
657-664.
Phair, J.W., and Van Deventer, J.S.J. (2001). “Effect of silicate activator pH on the
leaching and material characteristics of waste-based inorganic polymers”, Minerals
Engineering, 14(3), 289-304.
Provis, J.L., Yong, Ch.Zh., Duxson, P., and Deventer, J.S.J.V. (2009). “Correlating
mechanical and thermal properties of sodium silicate-fly ash geopolymers.” Colloids
and Surfaces A: Physicochemical and Eng. Aspects, 336(1-3), 57-63.
Rahier, H., Simons, W., Van Mele, B., and Biesemans, M. (1997). “Low-temperature
synthesised aluminosilicate glasses Part III: Influence of the composition of the
silicate solution on production, structure and properties.” Journal of Materials
Science, 32, 2237-2247.
Rangan, B.V. (2008). “Low-Calcium Fly Ash-based Geopolymer Concrete.” Chapter 26
in Concrete Construction Engineering Handbook, Editor-in Chief: E.G. Nawy,
Second Edition, CRC Press, New York.
Shorter, GW., and Harmathy TZ. (1961). “Discussion of the fire resistance of prestressed
concrete beams.” Proceedings of the Institution of Civil Engineers 20(2): 313-315.
Song X-J., Marosszeky M., Brung M., and Chang Z-T. (2005). “Response of geopolymer
concrete to sulfuric acid attack.” In: Proceedings world congress geopolymer 2005,
Saint-Quentin, Fance. P. 157-160.
Verdolotti, L., Iannace, S., and Lavorgna, M. (2008). “Geopolymerization reaction to
consolidate incoherent pozzolanic soil.” Journal of Materials, 43(3), 865-873.
Xu, H., and Van Deventer, J.S.J. (2000). “The geopolymerisation of alumino-silicate
minerals”, International Journal of Mineral Processing, 59(3), 247-266.
Zhang, G., He, J., and Gambrell R.P. (2010). “Synthesis, Characterization, and
Mechanical Properties of Red Mud-Based Geopolymers.” Transportation Research
Record: Journal of the Transportation Research Board, 1-9.

91
Zhang, S.Z., Gong, K.C., and Lu, H.W. (2004). “Novel modification method for
inorganic geopolymer by using water soluble organic polymers.” Materials Letters,
58(7-8), 1292-1296.
Zhao, R., and Sanjayan, J.G. (2011). “Geopolymer and Portland cement concretes in
simulated fire.” Magazine of Concrete Research, 63(3), 163-173.
Zivica, V., Balkovic, S., and Drabik, M. (2011). “Properties of metakaolin geopolymer
hardened paste prepared by high-pressure compaction.” Construction and Building
Materials, 25(5), 2206-2213.

92
VITA
Fenghong Fan was born and raised in Chenzhou, China. Fenghong Fan received
her Bachelor of Science in Civil Engineering from Hunan University in 2007 and Master
of Science in Bridge Engineering at Hunan University in 2010. She began attending
Louisiana State University in August of 2010, under the guidance of Dr. Steve C.S. Cai,
to pursue her master’s degree. She expects to receive her master’s degree in May 2015.