mechanical and electrical co-simulation …global-sei.com/technology/tr/bn84/pdf/84-21.pdf120 ·...
TRANSCRIPT

120 · Mechanical and Electrical Co-simulation Technology for In-Vehicle Power Systems
AUTOMOTIVE
1. Introduction
In recent years, backed by the tightening environ-mental regulation and user’s demand for better fuel effi-ciency vehicles, systems such as start-stop and energy regeneration have been spreading widely. Some of those systems have new power architecture to be equipped with Lithium (Li) ion batteries or capacitors in addition to a conventional lead-acid battery for improved fuel economy. In 48 V power supply and automated driving systems as well, which have been pressed forward for 2020 and beyond, new power architectures are expected. These architectures require new components with advanced prop-erties, and automotive parts manufacturers are required to supply components giving consideration to the entire power systems.
Against this background, Advanced Automotive Systems R&D Center of Sumitomo Electric Industries, Ltd. started to develop simulation technology in order to quan-tify the relationship between automotive components and vehicle performance (Fig. 1). This technology helps us determine important properties to improve vehicle perfor-mance. This paper introduces the technology to analyze the effect of power components on fuel economy based on our mechanical and electrical co-simulation.
2. Development of Vehicle Simulation
We have been using simulation technology to develop electrical circuits and electromagnetic products(1) and improve their design in order to reduce copper or iron loss. It is expected that the loss reduction improves the fuel economy by reducing engine load for power generation. However, it is difficult to quantify the effect of each component on fuel economy improvement. It is because fuel consumption by power generation greatly depends on vehicle mass and other characteristics, as well as driving conditions such as engine displacement, gear ratio, vehicle speed, acceleration, and road incline.
In order to analyze the effect of power components on fuel economy, we need to take account of the engine load given by the power system. Therefore, we developed a vehicle model that combined mechanical and electrical systems for co-simulation.
3. Creating Plant Models
Firstly, we created plant models of vehicle compo-nents. Plant models express the physical behavior of the component by mathematical formula. The vehicle model consists of plant models. 3-1 Formulation of vehicle components
In order to simulate fuel consumption, it is necessary to understand an energy flow in vehicle systems and express it in mathematical formulas. To do so, we analyzed the relationship of fuel economy and vehicle components. As shown in Fig. 2, we start with the formula that defines fuel economy, and deduced the relations of physical quanti-ties such as force, torque, and electric current.3-2 Design level of abstraction of model
We created plant models based on the result of the analysis shown in Fig. 2. Generally, there is trade-off between analysis precision and execute time. Therefore, we need to design the level of abstraction of the model according to the purpose of analysis and the effect of the component on fuel economy. Since we aimed to evaluate the behavior of the vehicle, we ignored the internal
Mechanical and Electrical Co-simulation Technology for In-Vehicle Power Systems
Koji ARAI*, Yuki SANO, Kenichi HATANAKA and Koichi TAKAYAMA
----------------------------------------------------------------------------------------------------------------------------------------------------------------------------------------------------------------------------------------------------------Car manufacturers and suppliers are offering new systems, such as 48 V power supply or automated driving systems, for 2020 and beyond. Since these systems are closely related to automotive power systems, their deployment makes changes to the power architecture. To analyze requirements for power components, Sumitomo Electric Industries, Ltd. has been developing in-vehicle simulation technology that helps to investigate the relationship between vehicles and their components in performance. This paper introduces the technology to analyze the effect of power components on fuel economy, based on our mechanical and electrical co-simulation.----------------------------------------------------------------------------------------------------------------------------------------------------------------------------------------------------------------------------------------------------------Keywords: automotive, simulation, power system, architecture
Winding wire(iron loss and cupper loss)
DC/DC converter(efficiency)
Wiring harness(electric resistance)
Vehcle performance(fuel economy, acceleration, controllability, and others)
Quantify the relationship between vehicle performance
and their components
Fig. 1. Examples of the relationship between vehicle and its components

SEI TECHNICAL REVIEW · NUMBER 84 · APRIL 2017 · 121
behavior of components and simplified models as much as possible.
We investigated recent trends of automotive environ-mental technologies from articles published by a car manu-facturer(2) and research company.(3) Based on the investiga-tion, we chose the parameters that are highly effective on fuel economy improvement and that are required to control vehicle systems. Then, we implemented the parameters in plant models and ignored the others.
Two examples of plant models, a DC/DC converter and lead acid battery, are shown in Fig. 3. For the DC/DC converter, we created the model with the relational expres-sion of input and output power. It is because the total amount of losses of an internal circuit is important to simulate fuel economy, but the breakdown of losses is not. For the lead acid battery, we created an equivalent circuit model in order to reproduce the transient behavior. It is because the behavior has a significant effect on the amount of charged or discharged power. Additionally, we implemented in the battery model SOC*1 and OCV*2 as parameters used for vehicle control systems. As seen above, we determined the level of abstraction and designed each model.
3-3 Parameter configurationNext, we configured parameters of the models. For
the gear ratio, radius of tire, and capacity of battery, we referred to the specification sheet of the vehicle. For undis-closed parameters, such as transmission efficiency and power generation efficiency, we used typical values found on technical reports and articles.(4) We also used measure-ment data for the efficiency of DC/DC converter, internal resistance of battery, and OCV-SOC curve of a battery. Since detailed data was not available for the characteristics of engine fuel consumption, which is of most importance for the simulation, we actually measured it.3-4 Measurement of engine fuel consumption
characteristicsWe measured engine fuel consumption using the
chassis dynamometer system.*3 With a measurement of fuel consumption in vehicle running at a fixed condition, we obtained the fuel consumption rate for the speed and the driving force. We converted the speed and driving force to the engine rotation speed and torque using the tire radius and gear ratio. By measuring fuel consumption rates under about 300 different types of conditions, we created the engine fuel consumption map (Fig. 4) and implemented this data in the engine model.
4. Creating Controller Models
Recent vehicles are equipped with a lot of electrically controlled systems to improve fuel economy such as start-stop, energy regeneration, fuel cut,*4 and exhaust gas recir-culation.*5 Therefore, we investigated the behavior of these electrical systems and created controller models.4-1 Investigation of vehicle control system
We investigated the service manual of the vehicle and created its state transition diagram. The vehicle has two storage devices and is equipped with start-stop and energy regeneration. We defined four main states in the system: 1) running, 2) energy regeneration, 3) idle reduction, and 4) charging, and each state has sub-states that transit with the SOC of storage devices (Fig. 5). The amount of charge or discharge of the storage devices and the amount of power generation depended on the states. However, transition threshold values between the states could not be specified in the service manual.
= ∗∗
= ∫ −
※Double integration of acceleration
=
∫ ,
Rotation speed [rpm]
Out
put
torq
ue [
Nm
]
Fuel
con
sum
ptio
nra
tio [
g/kW
h]
= + Σ(+
=
Torque for accessories
Driving force
Radiusof tire
Torqueon axle
= Torqueon axle
Drivingtorque
Torque for generation
Torque for accessories
Driving torque
・・・ ・・・
Fig. 2. The analyses of the relations of fuel economy and vehicle components
DC/DC converter
Vin Vout
Iin Iout
Iout
η
Vin*Iin = η*Vout*Iout
Efficiency
+ ー
A SOC calculator
Battery
Current value SOC
SOC
OCV
SOC-OCV curve
Equivalent circuit to express transient behavior
Fig. 3. Examples of Plant Models
Rotation speed [rpm]
Out
put
torq
ue [
Nm
]
Fuel
con
sum
ptio
n ra
tio [
g/k
Wh]
■ Measuring point
Fig. 4. Engine fuel consumption map

122 · Mechanical and Electrical Co-simulation Technology for In-Vehicle Power Systems
4-2 Measurement of vehicle behaviorIn order to define the transition threshold values, we
measured them using the chassis dynamometer system. We prepared several running patterns according to the measurement items, such as constant speed running and repetition of acceleration and deceleration. We measured the behavior of the storage devices, generator, transmis-sion, and others in the running tests. Based on these measurements, we defined the transition threshold values and implemented them in the controller models. 4-3 Creating driver model
The vehicle is operated by the driver through the accelerator and brake pedals. Thus, we created a driver model that controls the accelerator and brake pedals in simulation. According to the input through these pedals, the vehicle components and systems, such as engine, auto-matic transmission (AT), start-stop, and energy regenera-tion, are controlled.
Referring to the vehicle emission tests, we designed a
driver model that controls the pedals with feedback based on the actual error and the target speed. In the vehicle emission tests, for example JC08, NEDC, and FTP,*6 the driver is given a running pattern with the target speed at every second and should drive the vehicle accordingly. As shown in Fig. 6, however, the vehicle model with only feedback control did not accurately follow the target speed, due to the delay in acceleration and the oscillation. Also the instability of the driver model has a bad effect on fuel economy. Therefore, we additionally implemented a feed-forward control in the driver model. It estimates the accel-erator position according to the speed and acceleration of the running pattern. This driver model improved the accu-racy and stability as shown in Fig. 6.
5. Construction of Vehicle Model
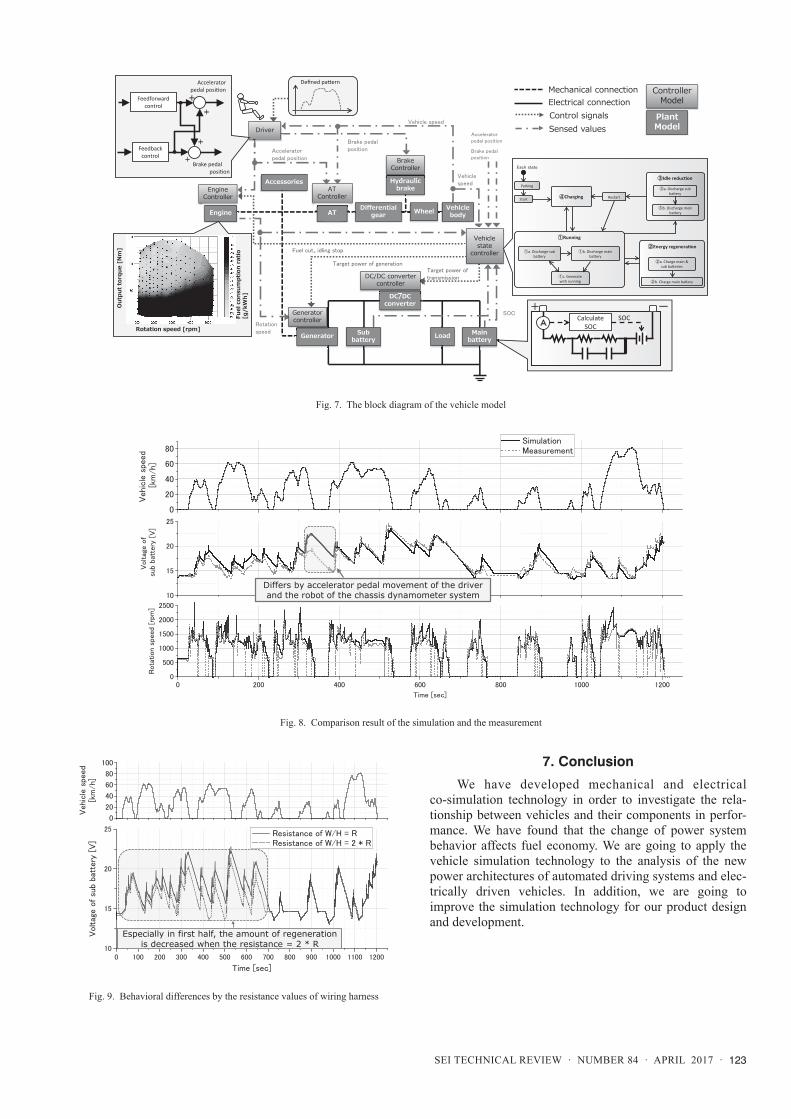
We constructed the vehicle model that combined the plant models and control models. We connected the plant models to each other according to the energy flow analysis described in 3-1. Then, we installed sensor models, for which values necessary for system control had been set. Figure 7 shows the block diagram of the vehicle model. The sensor models send the values to the control models, the control models send signals to the plant models, and the plant models perform according to control signals.
In Fig. 8, solid lines represent the simulation result of driving the JC08 cycle by the vehicle model. The fuel economy obtained by simulation was 16.68 km/L, and the value measured using the chassis dynamometer system was 16.60 km/L. This means that the difference between simu-lation and measurement is merely 0.5%. Although the simulation result is partly different from the actual measurement (dashed lines in Fig. 8), (i.e., the amount of regenerated power differs because of the operation differ-ences between the robot of the chassis dynamometer system and the driver model), the running pattern is reason-ably reproduced as a whole.
6. Simulation Analysis of Effect of Power Components on Fuel Economy
We have analyzed the effect of power components on fuel economy by using the vehicle model shown in Fig. 7. More specifically, we have investigated how the properties of components affect fuel economy by using vehicle simula-tion under various conditions with changed running patterns, power consumption, initial SOC, and other factors.
As shown in Fig. 9, the analyses indicate that an increase in the resistance of the wiring harness means a decrease in the amount of regenerated power. This decrease changes the vehicle behavior and causes a decrease in the fuel economy.
We are going to investigate the effect of the other properties of components including the efficiency of DC/DC converters.
③Idle reduction
Start
Parking
④Charging
Each state
①Running②Energy
regeneration
Restart
IGN OFF
IGN ON
Enginestarted
Do not press accelerator
Press accelerator or vehicle speed = 0 km/h
Vehicle speed = 0 km/h& SOC of each battery is high enough
SOC of battery is lower than the threshold
or vehicle speed≧ 1 km/h
or do not press brake
②b. Charge main battery
①a. Discharge sub battery
Do not press accelerator
Press acceleratorVehicle speed = 0 km/h
& do not press accelertor& SOC of battery is
lower than the threshold
Press acceleratoror SOC of battery when high enough
①b. Discharge main battery
①c. Generate with running
③b. Discharge main battery
③a. Discharge sub battery
②a. Charge main & sub batteries
Fig. 5. Vehicle system’s state transition diagram
Delay at launch because driver does not press the pedal without the error
Only feedback control
Time
Vehicle speed Accelerator pedal position
Oscillation at accelerator pedal
Oscillation at switch decelerate to accelerate
Feedforward + feedback control
Defined pattern
Launch smoothly without delay
No oscillation Switch smoothly decelerate to accelerate
Vehi
cle
spee
d
Driver model
Feedbackcontroller
+ー
Feedforwardcontroller
+
+
+
+
Running pattern
Vehicle speed
Calculate the error
Accelerator pedal positi
Brake pedalposition
PID control
Estimate necessary accelerator position according to speed and acceleration
Fig. 6. Schematic of the driver model
SEI TECHNICAL REVIEW · NUMBER 84 · APRIL 2017 · 123
7. Conclusion
We have developed mechanical and electrical co-simulation technology in order to investigate the rela-tionship between vehicles and their components in perfor-mance. We have found that the change of power system behavior affects fuel economy. We are going to apply the vehicle simulation technology to the analysis of the new power architectures of automated driving systems and elec-trically driven vehicles. In addition, we are going to improve the simulation technology for our product design and development.
Wheel
Accessories
Load
EngineController
Mechanical connectionElectrical connectionControl signalsSensed values
Hydraulic braked li
BrakeController
Vehicle state
controller
Vehicle speed
Brake pedalpositionAccelerator
pedal position
Rotation speed
SOC
Fuel cut、idling stop
Target power of generationTarget power of transmission
Generator
Engine AT
DC/DCconverter
Subbattery
Acceleratorpedal position
Main battery
Vehiclespeed
Rotation speed [rpm]
Out
put
torq
ue [
Nm
]
Fuel
con
sum
ptio
n ra
tio
[g/k
Wh]
+ ー
ACalculate
SOCSOC
Controller Model
Plant Model
Generator controller
ATController
Differential gear
DC/DC
DC/DC converter controller
Driver
Defined pattern
Feedbackcontrol
Feedforwardcontrol
+
+
+
+
Acceleratorpedal position
Brake pedalposition
③Idle reduction
Start
Parking
④Charging
Each state
①Running
①a. Discharge sub battery
①b. Discharge main battery
①c. Generate with running
③b. Discharge meinbattery
③a. Discharge sub battery
Vehicle body
Brake pedalposition
Restart
②Energy regeneration
②a. Charge main & sub batteries
②b. Charge main battery
10
15
20
25
Simulation Measurement
Voltag
e o
f su
b ba
ttery
[V
]
0
20
40
60
80
Vehic
le s
peed
[km
/h]
0 200 400 600 800 1000 12000
500
1000
1500
2000
2500
Rota
tion s
peed
[rpm
]
Time [sec]
Differs by accelerator pedal movement of the driver and the robot of the chassis dynamometer system
Fig. 7. The block diagram of the vehicle model
Fig. 8. Comparison result of the simulation and the measurement
0
20
40
60
80
100
Vehic
le s
peed
[km
/h]
0 100 200 300 400 500 600 700 800 900 1000 1100 120010
15
20
25
Time [sec]
Resistance of W/H = R Resistance of W/H = 2 * R
Voltag
e o
f su
b ba
ttery
[V
]
Especially in first half, the amount of regeneration is decreased when the resistance = 2 * R
Fig. 9. Behavioral differences by the resistance values of wiring harness

124 · Mechanical and Electrical Co-simulation Technology for In-Vehicle Power Systems
Technical Terms*1 SOC: SOC is an abbreviation for “state of charge.” SOC
expresses the present battery level as a percentage to the maximum capacity. For Li batteries, this is strictly managed because overcharge or over discharge makes the batteries explode, ignite, or degrade.
*2 OCV: OCV is an abbreviation for “open circuit voltage.” OCV is the voltage between the battery terminals with no load applied. This differs by the type of battery and changes according to its SOC.
*3 Chassis dynamometer system: A chassis dynamometer system is a measuring instrument for an automotive drive-train. A vehicle runs on the roller and the system puts a load on the roller according to the speed and acceleration of the vehicle.
*4 Fuel cut: Fuel cut is the system for a decrease in fuel consumption. When the driver does not press on the accelerator and the vehicle speed is high enough, the fuel injection is stopped.
*5 Exhaust gas recirculation: The system recirculates a portion of the engine’s exhaust gas back to the intake. This is used for reduction of emissions and improvement of fuel economy of low to middle loaded running.
*6 JC08, NEDC, and FTP: These are test cycles for emissions. JC08 is for Japan, NEDC is for Europe, and FTP is for America.
References(1) T. Kantou et al, “Electromagnetic and Thermal Design Technology for
Reactor Development,” SEI Technical Review, No.70, April 2010, P45 (2010)
(2) M. Takahashi et al, “Development of the ‘i-ELOOP’ Device,” Mazda gihou No.30, P.43 (2009)
(3) Yano Research, “Idle Reduction System Market 2015” (2015)(4) Kohara Gear Industry Co., Ltd., “Gear Technical Documents, 1 the kind
of the gears and the terms, 1.1 the kind of gears,” http://www.khkgears.co.jp/gear_technology/basic_guide/KHK347.html
Contributors The lead author is indicated by an asterisk (*).
K. ARAI*• Advanced Automotive Systems R&D Center
Y. SANO• Advanced Automotive Systems R&D Center
K. HATANAKA• Group Manager, Advanced Automotive Systems
R&D Center
K. TAKAYAMA• Department Manager, Advanced Automotive
Systems R&D Center