measuring what matters for the triple aim - ihi
TRANSCRIPT

4/22/2014
1
Measuring What Matters forthe Triple Aim
Kevin Nolan, Mstat, MA
This presenter has nothing to disclose
April 29, 2014
2
Learning Objective
Gain ideas and inspiration for measuring
the Triple Aim in your organization
A Guide to Measuring the Triple Aim
http://www.ihi.org/knowledge/Pages/IHIWhitePapers/AGuidetoMeasuringTripleAim.aspx
4/22/2014
2
Definition
System designs that simultaneously improve three
dimensions:
Improving the health of the populations;
Improving the patient experience of care (including quality and
satisfaction); and
Reducing the per capita cost of health care.

4/22/2014
3
5Stages of Measurement Development
1. Exploration
2. Selection of practical population measures across the three dimensions and the collection of data
3. Integration of measurement into a learning system to support work on the Triple Aim
Population Measures Projects Project Measures
Population Measures Worksheet
Dimension Proposed Measure Data Source Data plotted on
run chart (Y/N)
Population Health
Experience of Care
Per Capita Cost
6
4/22/2014
4
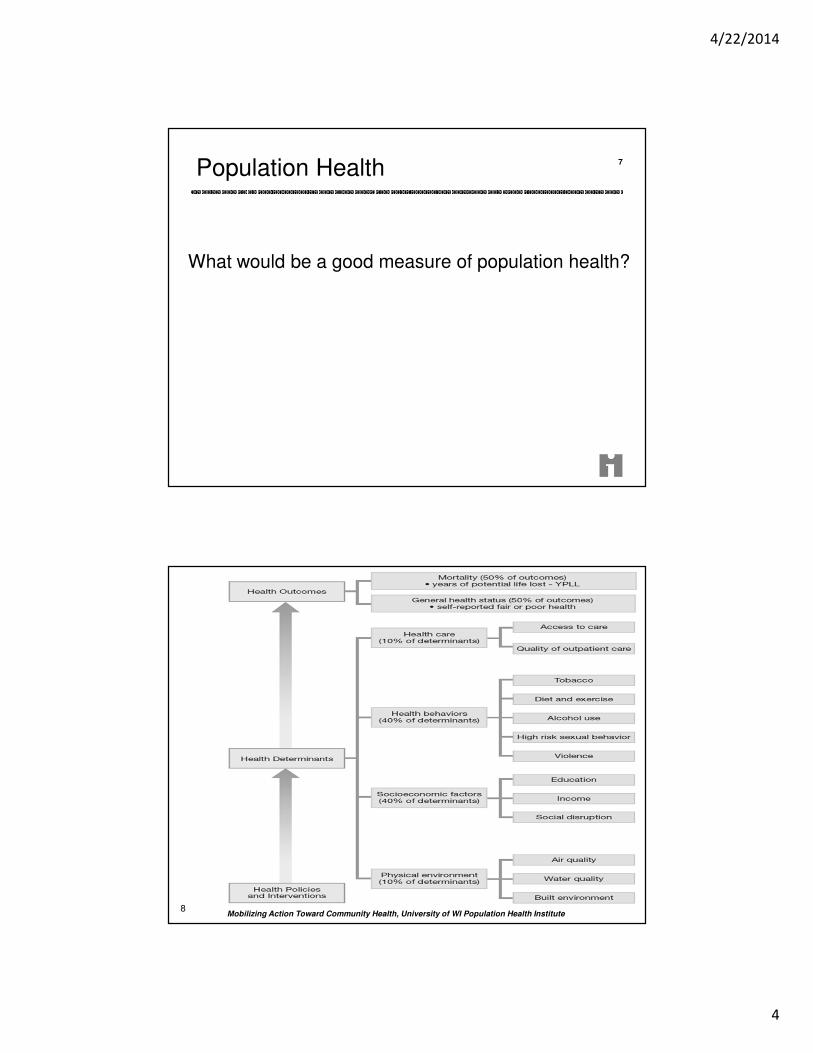
7Population Health
What would be a good measure of population health?
Mobilizing Action Toward Community Health, University of WI Population Health Institute8

4/22/2014
5
9
Disease Burden
Parrish RG. Measuring Population Health Outcomes.
10
Disease Burden
1.
2.
3.
3.
4/22/2014
6
Potential Population Health Measures
1. Health Outcomes: • Mortality: Examples - Years of potential life lost; Life
expectancy; Standardized mortality rates
12
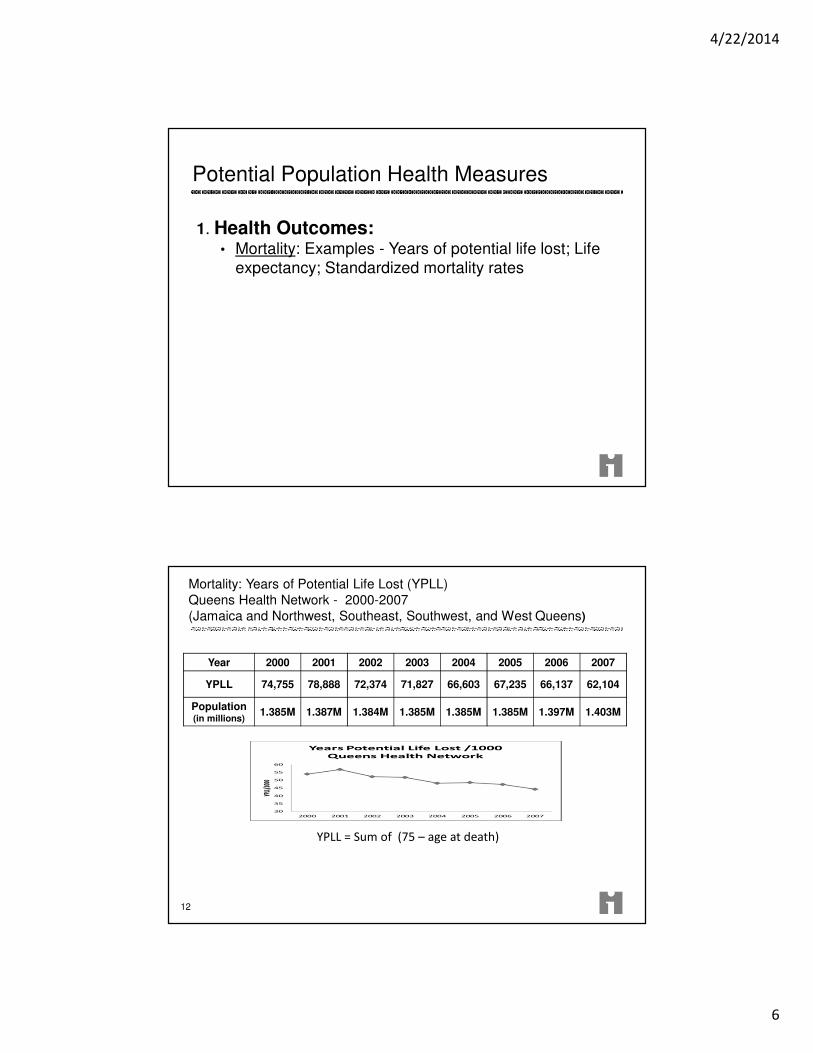
Mortality: Years of Potential Life Lost (YPLL)
Queens Health Network - 2000-2007
(Jamaica and Northwest, Southeast, Southwest, and West Queens)
Year 2000 2001 2002 2003 2004 2005 2006 2007
YPLL 74,755 78,888 72,374 71,827 66,603 67,235 66,137 62,104
Population (in millions)
1.385M 1.387M 1.384M 1.385M 1.385M 1.385M 1.397M 1.403M
YPLL = Sum of (75 – age at death)
4/22/2014
7
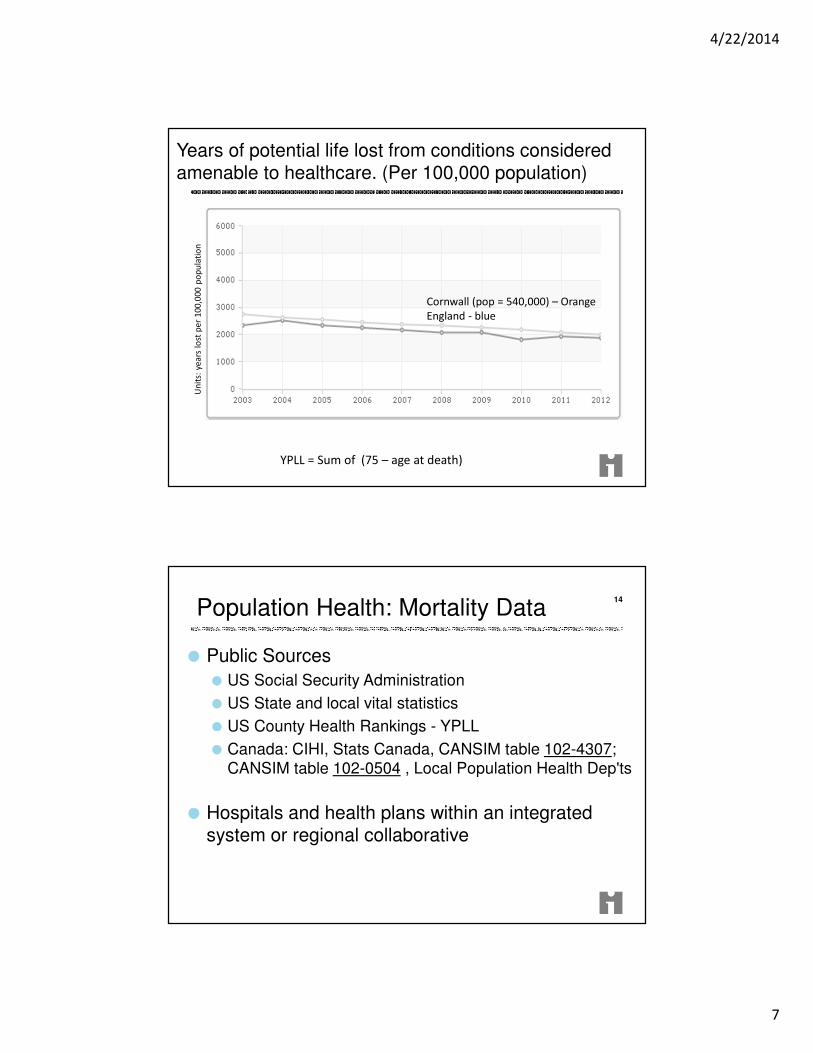
Years of potential life lost from conditions considered amenable to healthcare. (Per 100,000 population)
Cornwall (pop = 540,000) – Orange
England - blue
Un
its:
ye
ars
lo
st p
er
10
0,0
00
po
pu
lati
on
YPLL = Sum of (75 – age at death)
Population Health: Mortality Data
Public Sources
US Social Security Administration
US State and local vital statistics
US County Health Rankings - YPLL
Canada: CIHI, Stats Canada, CANSIM table 102-4307;
CANSIM table 102-0504 , Local Population Health Dep'ts
Hospitals and health plans within an integrated system or regional collaborative
14

4/22/2014
8
Potential Population Health Measures
1. Health Outcomes: • Mortality: Examples - Years of potential life lost; Life
expectancy; Standardized mortality rates
• Health/Functional Status: Examples - single
question health status or multi-domain (e.g. SF-12)
Health Outcome:
Health Status Single Question
Would you say that in general your health is:Excellent, very good, good, fair, poor
CDC Health Related Quality of Life (HRQOL-4)
4/22/2014
9
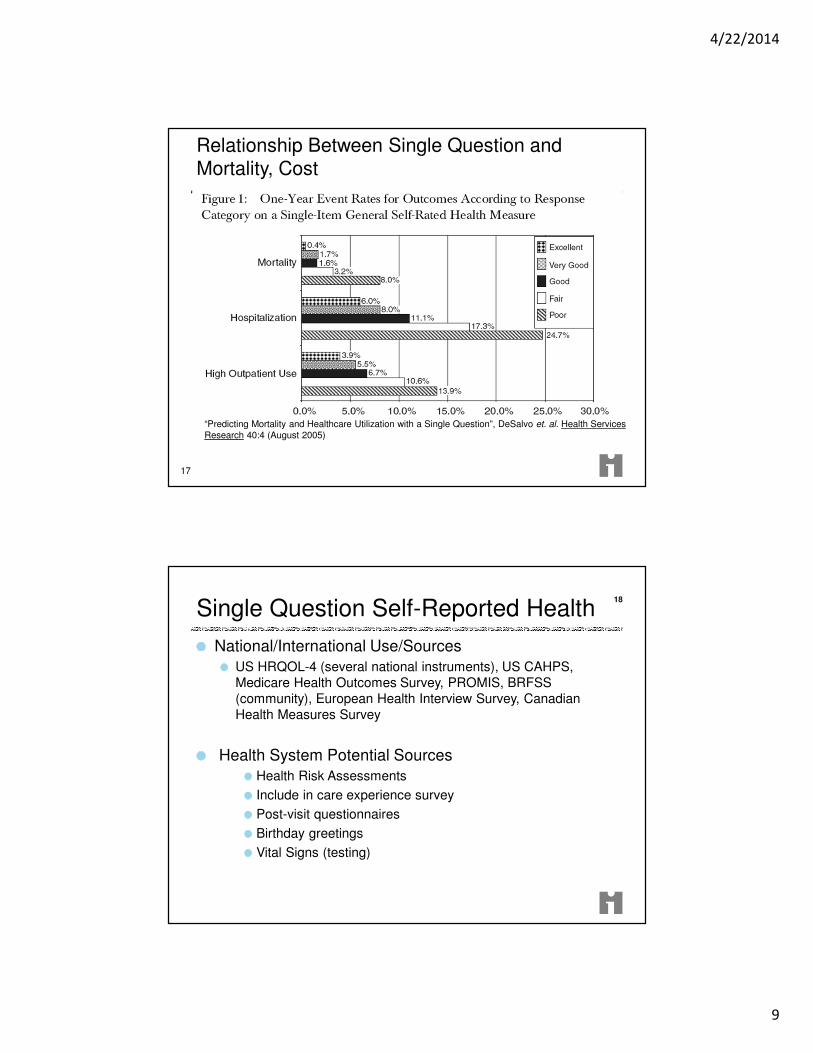
Relationship Between Single Question and Mortality, Cost
“Predicting Mortality and Healthcare Utilization with a Single Question”, DeSalvo et. al. Health Services
Research 40:4 (August 2005)
17
Single Question Self-Reported Health
National/International Use/Sources
US HRQOL-4 (several national instruments), US CAHPS,
Medicare Health Outcomes Survey, PROMIS, BRFSS
(community), European Health Interview Survey, Canadian
Health Measures Survey
Health System Potential Sources
Health Risk Assessments
Include in care experience survey
Post-visit questionnaires
Birthday greetings
Vital Signs (testing)
18

4/22/2014
10
Single Question Health Status
Genesys Health Plan
Gathered on all enrollees at time of enrollment and annual re-enrollment
Potential Population Health Measures
1. Health Outcomes:
• Mortality: Years of potential life lost; Life expectancy;
Standardized mortality rates
• Health/Functional Status: single question (e.g. from CDC
HRQOL-4) or multi-domain (e.g. SF-12)
Note: Healthy Life Expectancy (HLE): combines life
expectancy and health status into a single measure,
reflecting remaining years (e.g. at birth, age 65) of life
in good health

4/22/2014
11
LE and DFLE for men at age 65 in Great Britain, 1981-2002
DFLE (Disability-free Life Expectancy) (UK - General Household Survey)Do you have any long-standing illness, disability or infirmity? By long-standing I mean anything that has troubled you over a period of time or that is likely to affect you over a period of time. Yes/No.
6
Potential Population Health Measures
1. Health Outcomes: • Mortality: Years of potential life lost; Life expectancy;
Standardized mortality rates• Health/Functional Status: single question (e.g. from CDC
HRQOL-4) or multi-domain (e.g. SF-12)
Note: Healthy Life Expectancy (HLE): combines life expectancy and health status into a single measure, reflecting remaining years (e.g. at birth, age 65) of life in good health
For calculation of Life Expectancy and Healthy Life Expectancy (HLE): Sullivan Method http://www.ehemu.eu/pdf/Sullivan_guide_final_jun2007.pdf
Statistics Canada (2013) CANSIM table 102-0122
4/22/2014
12
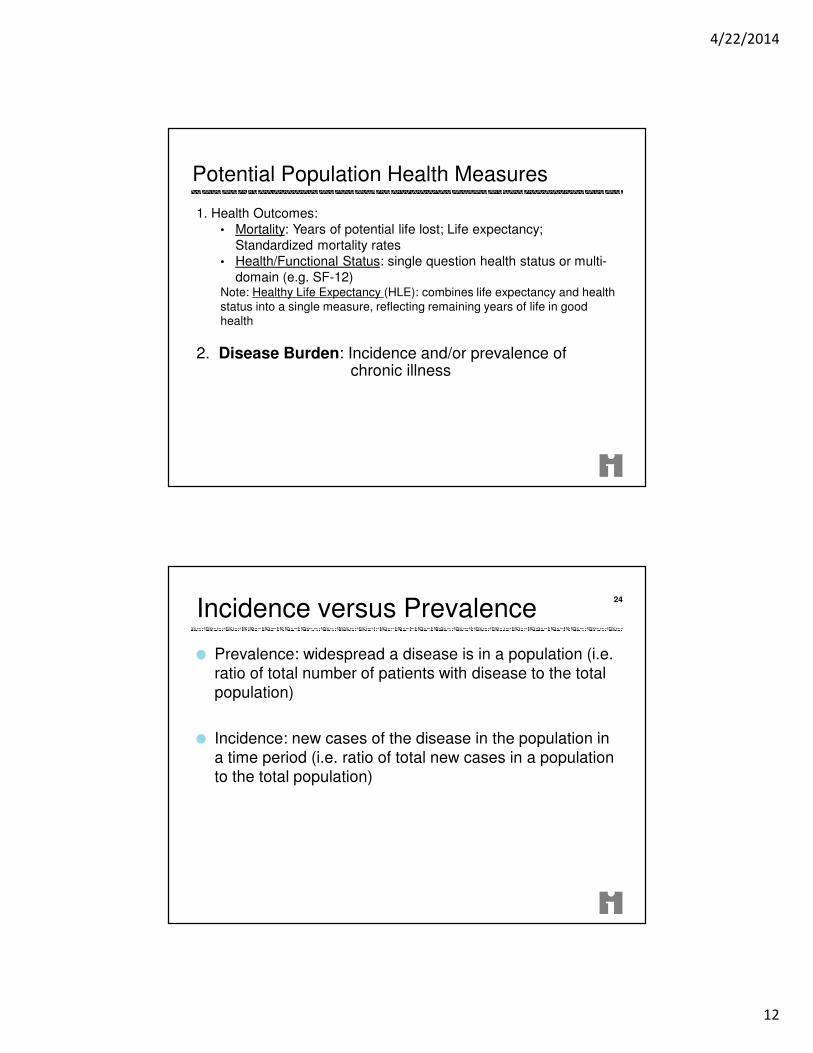
Potential Population Health Measures
1. Health Outcomes:
• Mortality: Years of potential life lost; Life expectancy;
Standardized mortality rates
• Health/Functional Status: single question health status or multi-
domain (e.g. SF-12)Note: Healthy Life Expectancy (HLE): combines life expectancy and health
status into a single measure, reflecting remaining years of life in good
health
2. Disease Burden: Incidence and/or prevalence of chronic illness
Incidence versus Prevalence
Prevalence: widespread a disease is in a population (i.e.
ratio of total number of patients with disease to the total
population)
Incidence: new cases of the disease in the population in
a time period (i.e. ratio of total new cases in a population
to the total population)
24
4/22/2014
13
2
3
4
5
6
7
8
9
10
11
12
Jan-Mar
'10
Apr-Jun
'10
Jul-Sept
'10
Oct-Dec
'10
Jan-Mar
'11
Apr-Jun
'11
Jul-Sept
'11
Oct-Dec
'11
Jan-Mar
'12
Apr-Jun
'12
Jul-Sept
'12
Oct-Dec
'12
Jan-Mar
'13
Apr-Jun
'13
Jul-Sept
'13
Oct-Dec
'13
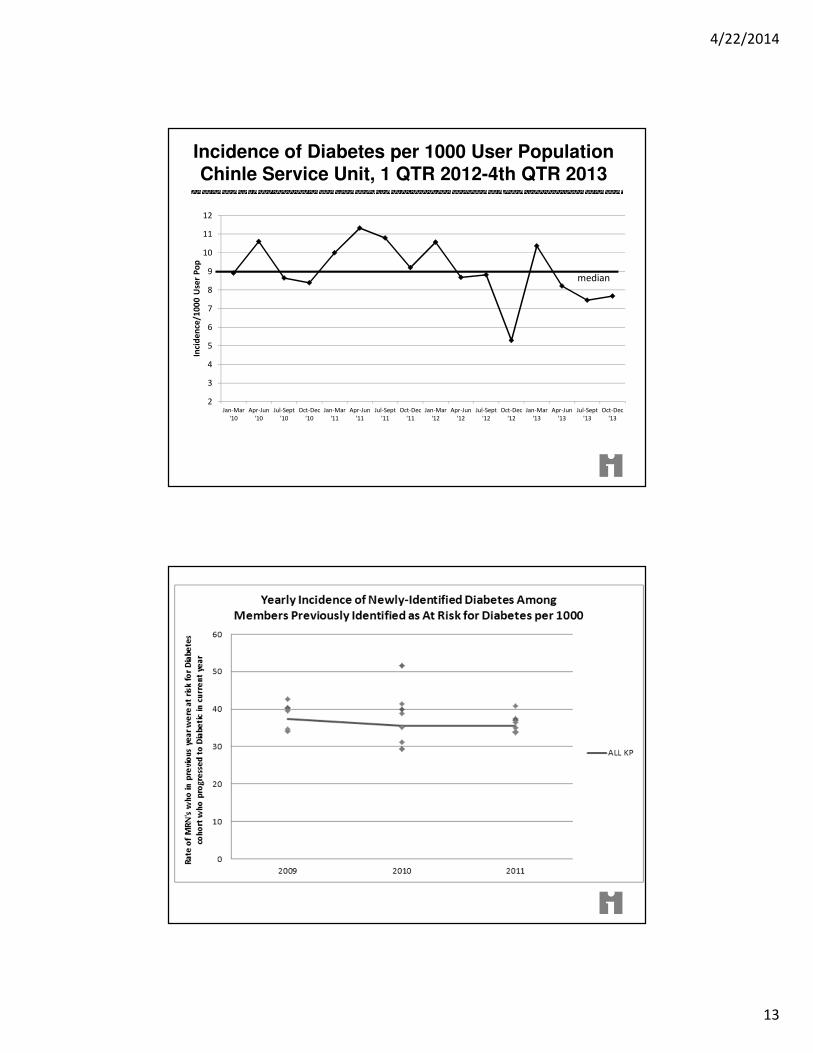
Inci
de
nce
/10
00
Use
r P
op
median
Incidence of Diabetes per 1000 User Population Chinle Service Unit, 1 QTR 2012-4th QTR 2013

4/22/2014
14
Population Health: Data on Chronic Conditions
Claims
Electronic medical records
Disease management registries
Community surveys: for example,
-In the US, Behavioral Risk Factor Surveillance Survey
(BRFSS)
-In Canada, Statistics Canada Community Health Survey
27
Potential Population Health Measures
1. Health Outcomes:
• Mortality: Years of potential life lost; Life expectancy; Standardized mortality rates
• Health/Functional Status: single question health status or multi-domain (e.g. SF-12)
Note: Healthy Life Expectancy (HLE): combines life expectancy and health status into a single measure, reflecting remaining years of life in good health
2. Disease Burden: Incidence and/or prevalence of chronic illness
3. Behavioral and Physiological factors: • Behavioral factors: e.g., smoking, alcohol, physical activity, and diet
• Physiological factors: e.g., blood pressure, BMI, cholesterol, and
blood glucose
Note: Health Risk Assessment (HRA) contains multiple factors.

4/22/2014
15
Bellin Health: Employed Population Health Measure
HRA - Physiological FactorsBellin Results
2011 = 78.7
2012 = 78.5
2013 = 79.3

4/22/2014
16
Potential Sources of Data for Behavioral and Physiological Factors
EMRs
Health Risk Assessments (HRA)
Claims
Community surveys – County Health Rankings/ BRFSS; Statistics Canada 2013
31
Population Measures Worksheet
Dimension Proposed Measure Data Source Data plotted on
run chart (Y/N)
Population Health
Experience of Care
Per Capita Cost
32
4/22/2014
17
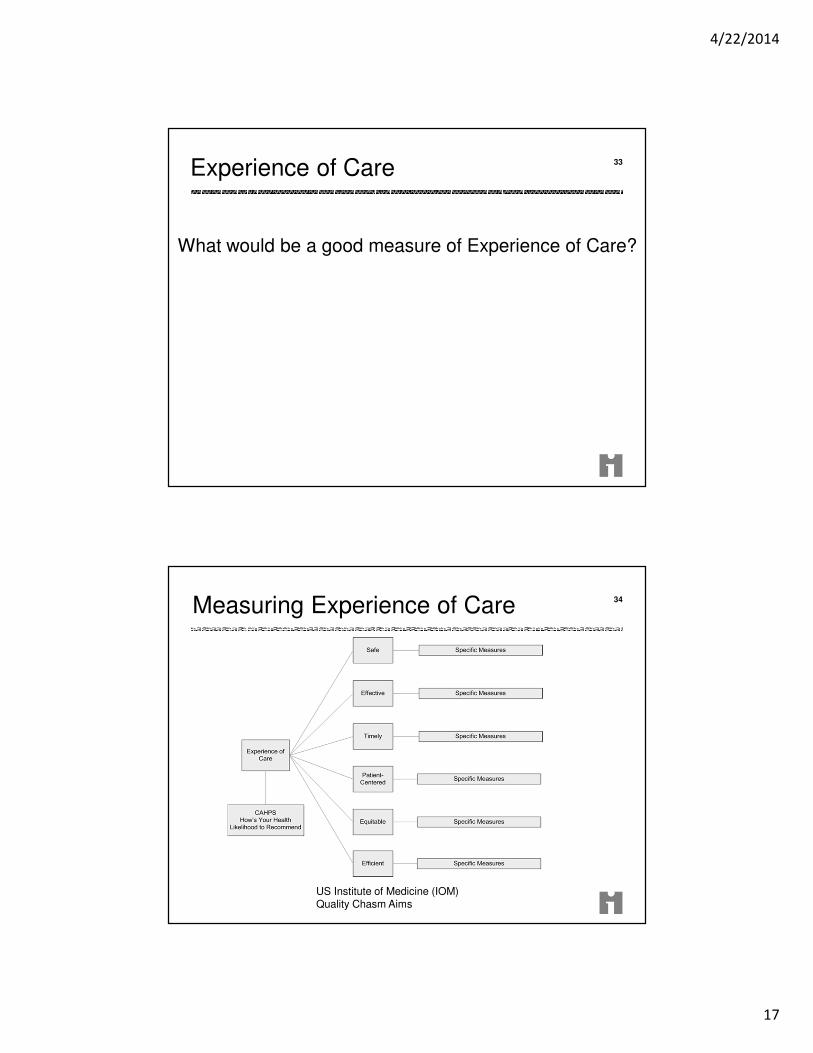
33Experience of Care
What would be a good measure of Experience of Care?
US Institute of Medicine (IOM) Quality Chasm Aims
34Measuring Experience of Care

4/22/2014
18
US Institute of Medicine (IOM) Quality Chasm Aims
35Measuring Experience of Care
Overall Experience of Care: from CAHPS
Health Plan Survey “Using any number from 0 to 10, where 0 is the worst health care possible and 10 is the best health care possible, what number would you use to rate all your health care in the last 12 months?”
https://www.cahps.ahrq.gov/content/products/PDF/CAHPS_AMB_PG_041310.pdf
4/22/2014
19
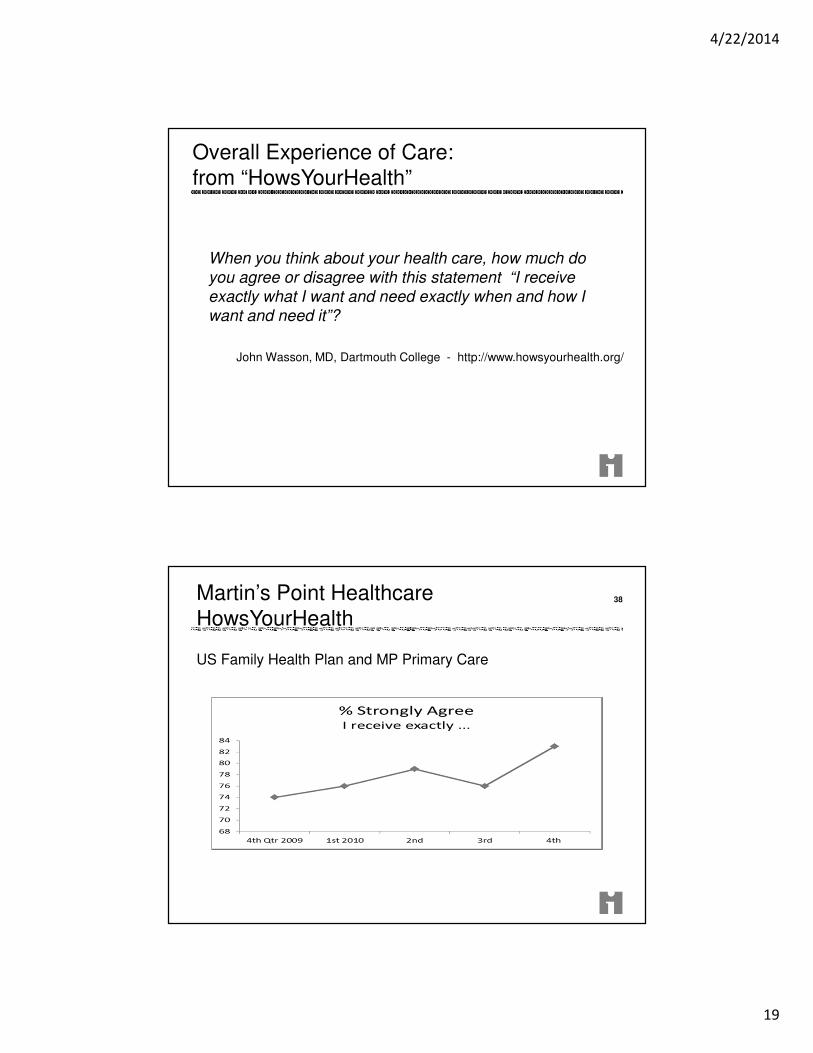
Overall Experience of Care:
from “HowsYourHealth”
When you think about your health care, how much do
you agree or disagree with this statement “I receive
exactly what I want and need exactly when and how I
want and need it”?
John Wasson, MD, Dartmouth College - http://www.howsyourhealth.org/
Martin’s Point Healthcare
HowsYourHealth
US Family Health Plan and MP Primary Care
38
4/22/2014
20
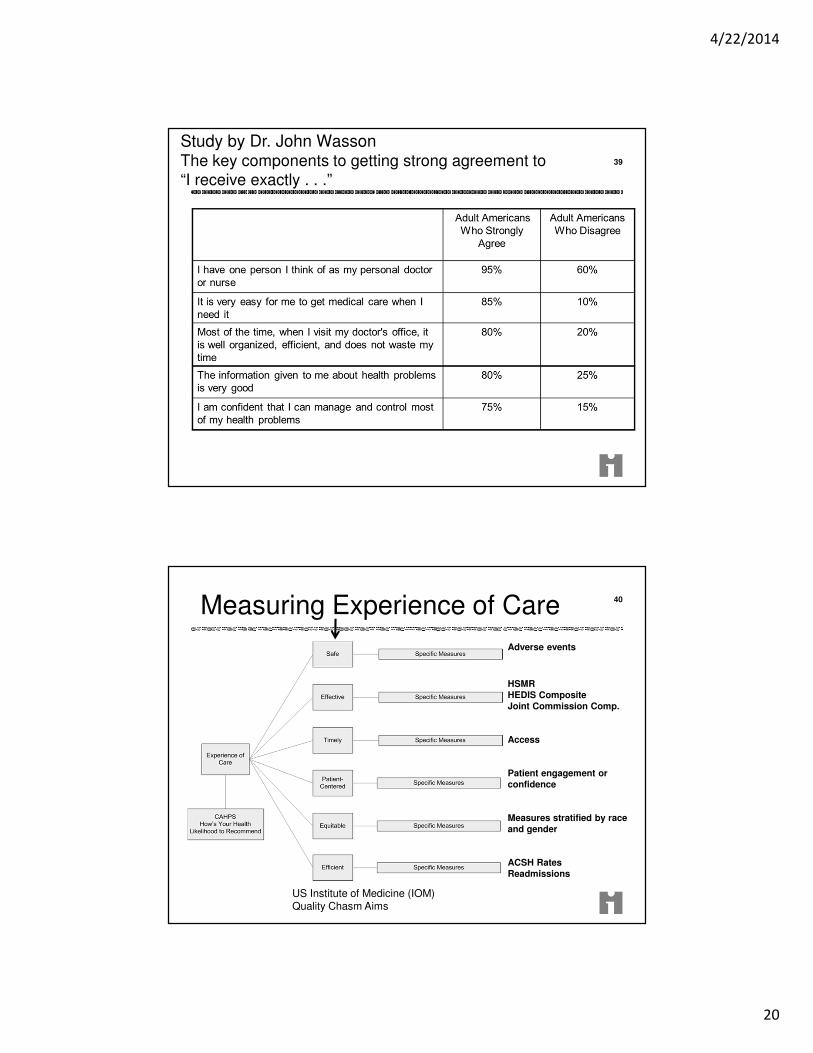
Study by Dr. John WassonThe key components to getting strong agreement to
“I receive exactly . . .”
39
40Measuring Experience of Care
Adverse events
HSMR
HEDIS Composite
Joint Commission Comp.
Access
Patient engagement or
confidence
Measures stratified by race
and gender
ACSH Rates
Readmissions
US Institute of Medicine (IOM) Quality Chasm Aims

4/22/2014
21
CareOregon: Stability of Diabetes and Hypertension (effectiveness)
41
1,780 1,936 2,308
909
1,0281,156
Experience of Care: Key Dimensions - KP Example
42
4/22/2014
22
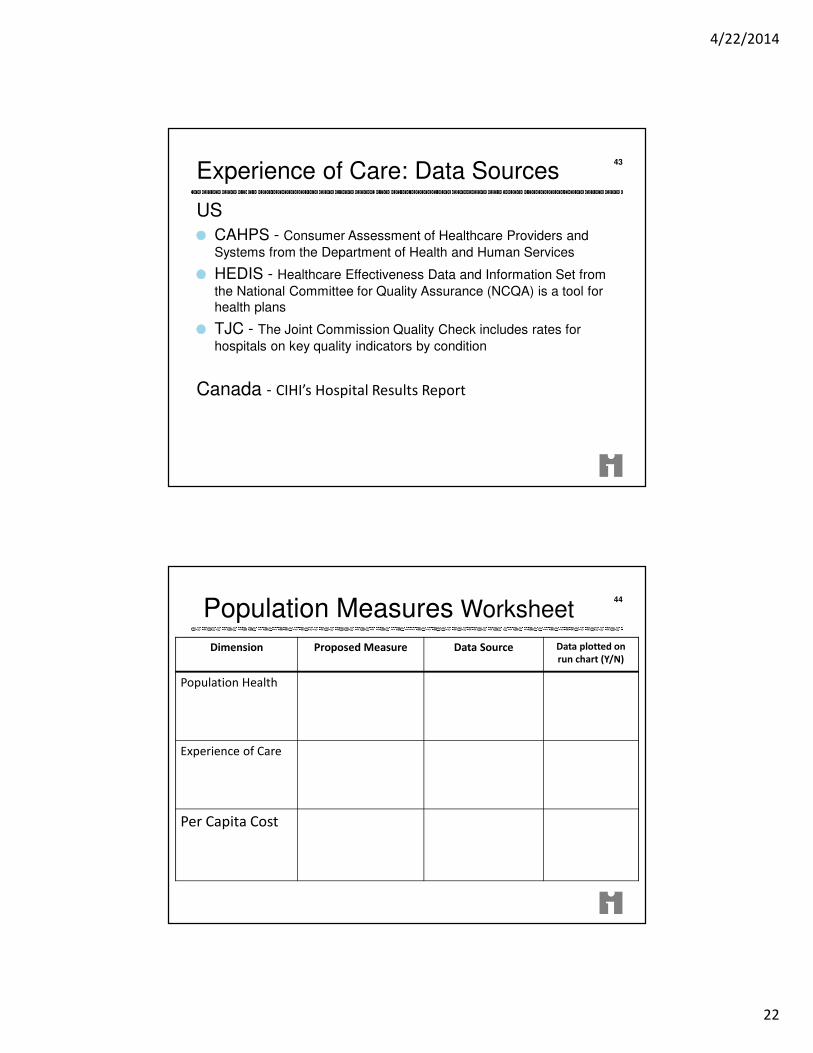
Experience of Care: Data Sources
US
CAHPS - Consumer Assessment of Healthcare Providers and
Systems from the Department of Health and Human Services
HEDIS - Healthcare Effectiveness Data and Information Set from
the National Committee for Quality Assurance (NCQA) is a tool for
health plans
TJC - The Joint Commission Quality Check includes rates for
hospitals on key quality indicators by condition
Canada - CIHI’s Hospital Results Report
43
Population Measures Worksheet
Dimension Proposed Measure Data Source Data plotted on
run chart (Y/N)
Population Health
Experience of Care
Per Capita Cost
44

4/22/2014
23
Potential Population Measures for
Per Capita Cost
1. Total cost per member of the population per month
2. Hospital and ED utilization rate and/or cost
HealthPartners Medical Trend – Health Plan Overall
* trend continues at lower rate
(HealthPartners Commercial Group Fully Insured & Self Insured Per Member Per Month)
4/22/2014
24
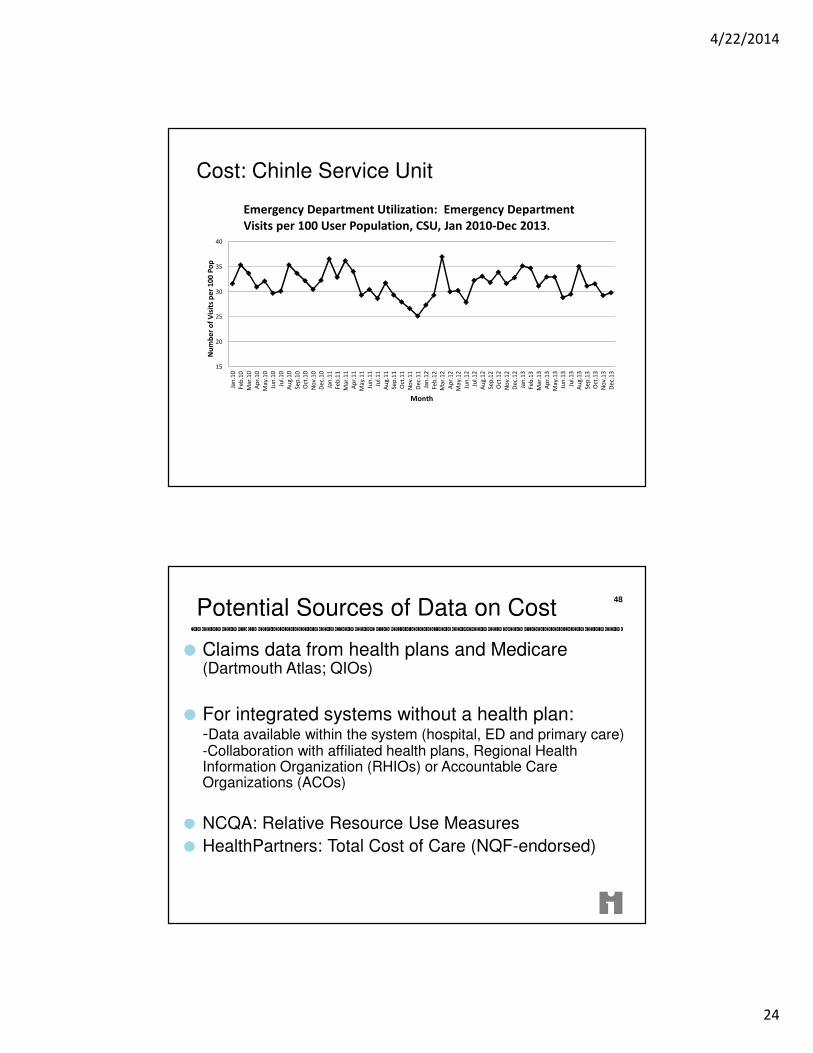
Cost: Chinle Service Unit
15
20
25
30
35
40
Jan
.10
Fe
b.1
0
Ma
r.1
0
Ap
r.1
0
Ma
y.1
0
Jun
.10
Jul.
10
Au
g.1
0
Se
p.1
0
Oct
.10
No
v.1
0
De
c.1
0
Jan
.11
Fe
b.1
1
Ma
r.1
1
Ap
r.1
1
Ma
y.1
1
Jun
.11
Jul.
11
Au
g.1
1
Se
p.1
1
Oct
.11
No
v.1
1
De
c.1
1
Jan
.12
Fe
b.1
2
Ma
r.1
2
Ap
r.1
2
Ma
y.1
2
Jun
.12
Jul.
12
Au
g.1
2
Se
p.1
2
Oct
.12
No
v.1
2
De
c.1
2
Jan
.13
Fe
b.1
3
Ma
r.1
3
Ap
r.1
3
Ma
y.1
3
Jun
.13
Jul.
13
Au
g.1
3
Se
p.1
3
Oct
.13
No
v.1
3
De
c.1
3
Nu
mb
er
of
Vis
its
pe
r 1
00
Po
p
Month
Emergency Department Utilization: Emergency Department
Visits per 100 User Population, CSU, Jan 2010-Dec 2013.
Potential Sources of Data on Cost
Claims data from health plans and Medicare (Dartmouth Atlas; QIOs)
For integrated systems without a health plan: -Data available within the system (hospital, ED and primary care) -Collaboration with affiliated health plans, Regional Health Information Organization (RHIOs) or Accountable Care Organizations (ACOs)
NCQA: Relative Resource Use Measures
HealthPartners: Total Cost of Care (NQF-endorsed)
48

4/22/2014
25
Definition
System designs that simultaneously improve three
dimensions:
Improving the health of the populations;
Improving the patient experience of care (including quality and
satisfaction); and
Reducing the per capita cost of health care.
Potential Triple Aim Population Outcome Measures
Dimension Measure
Population Health
1. Health Outcomes: � Mortality: Years of potential life lost; Life expectancy; Standardized mortality rates
� Health/Functional Status: single question (e.g. from CDC HRQOL-4) or multi-
domain (e.g. VR-12, PROMIS Global-10)
� Healthy Life Expectancy (HLE): combines life expectancy and health status into
a single measure, reflecting remaining years of life in good health
2. Disease Burden: Incidence (yearly rate of onset, average age of onset) and/or
prevalence of major chronic conditions
3. Behavioral and Physiological Factors: Behavioral factors include smoking,
alcohol, physical activity, and diet. Physiological factors include blood pressure, BMI,
cholesterol, and blood glucose.
(possible measure: a composite Health Risk Assessment (HRA) score)
Experience of Care
1. Standard questions from patient surveys, for example:
� Global questions from Consumer Assessment of Healthcare Providers and Systems (CAHPS) or ”How’s Your Health” surveys
� Likelihood to recommend
2. Set of measures based on key dimensions (e.g., US IOM Quality Chasm
Aims: Safe, Effective, Timely, Efficient, Equitable and Patient-centered)
Per Capita Cost 1. Total cost per member of the population per month
2. Hospital and ED utilization rate and/or cost
4/22/2014
26
Measurement Quiz51
A measure of the % of diabetics whose blood pressure is
under control is a good measure for:
A. Population Health
B. Experience of Care
C. Cost
52
The best measure of cost for a Medicare (65 and older)
population is:
A. Inpatient admissions
B. ER utilization
C. Pharmacy costs
D. None of above
Measurement Quiz
4/22/2014
27
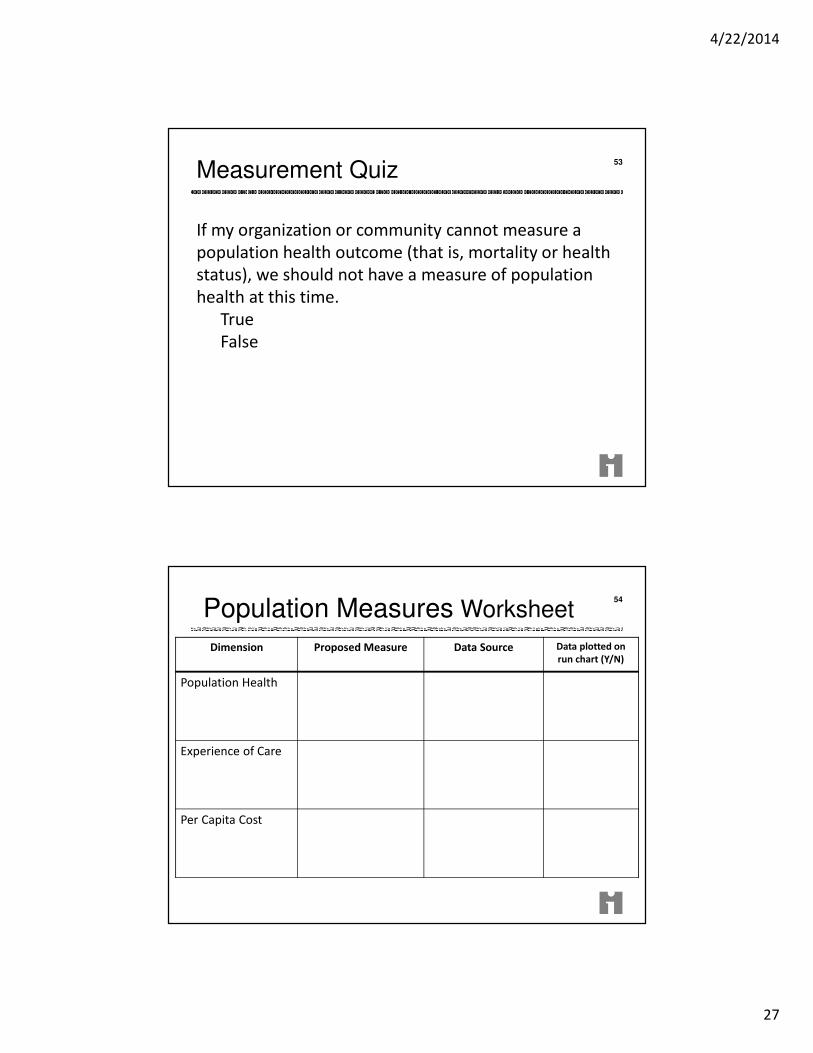
53
If my organization or community cannot measure a
population health outcome (that is, mortality or health
status), we should not have a measure of population
health at this time.
True
False
Measurement Quiz
Population Measures Worksheet
Dimension Proposed Measure Data Source Data plotted on
run chart (Y/N)
Population Health
Experience of Care
Per Capita Cost
54

4/22/2014
28
Selected References
County Health Rankings: Mobilizing Action Toward Community Health:
http://www.countyhealthrankings.org/
Evans RG, Stoddart GL. Producing health, consuming health care. Soc SciMed.1990;31(12):1347–1363.Evans RG, Barer ML, Marmor TR, eds. Why are Some People Healthy and Others Not? The Determinants of Health of Populations. Hawthorne, NY: Aldine De Gruyter; 1994.Kindig D, Stoddart G. What is population health? Am J Public Health. 2003;93(3):380-383.McGinnis JM, Williams-Russo P, Knickman JR. The case for more active policy attention to health promotion. Health Aff. 2002;21(2):78-93.Parrish RG. Measuring Population Health Outcomes. Prev Chronic Dis 2010:7(4). http://www.cdc.gov/pcd/issues/2010/jul/10_0005.htm Stiefel MC, Perla RJ, Zell BL. A Healthy Bottom Line: Healthy Life Expectancy as an Outcome Measure for Health Improvement Efforts. The Milbank Quarterly. 2010;88(1):30-53. DeSalvo, K.B., N. Bloser, K. Reynolds, J. He, and P. Muntner. 2006. Mortality Prediction with a Single General Self-RatedHealth Question. A Meta-analysis. Journal of General Internal Medicine 21:267–75.Crossing the Quality Chasm: A New Health System for the 21st Century (2001) - Institute of Medicine (IOM)Health Partners: Total Cost of Care – www.healthpartners.com/tcoc