measuring video effectiveness - wistiafest 2015
TRANSCRIPT

Video is good for business.


Faith

Faith Data&

Faith Data

Faith
Data

Measuring Video Effectiveness

Play Count

The Heatmap

The Engagement Graph

Hours Watched

Leap of faith

Turnstile

1.2 million emails collected

26% @ MIDDLE
25% @ START
49% @ END
Turnstile Location

24%16% 3.4%
Conversion Rate by Location
CONVERSION @ START
CONVERSION @ MIDDLE
CONVERSION @ END

0
10
20
30
40
50
Start
0 - 1
0%
10 - 2
0%
20 - 3
0%
30 - 4
0%
40 - 5
0%
50 - 6
0%
60 - 7
0%
70 - 8
0%
80 - 9
0%
90 -1
00% End
Turnstile Conversion Rate by Location
2.3x
4.5x

Timeline Actions

Call to Action

Turnstile

Annotations


Faith
Data

Faith
Data

Better data makes it so success and failure are not black boxes.


We’re making a big investment in data.

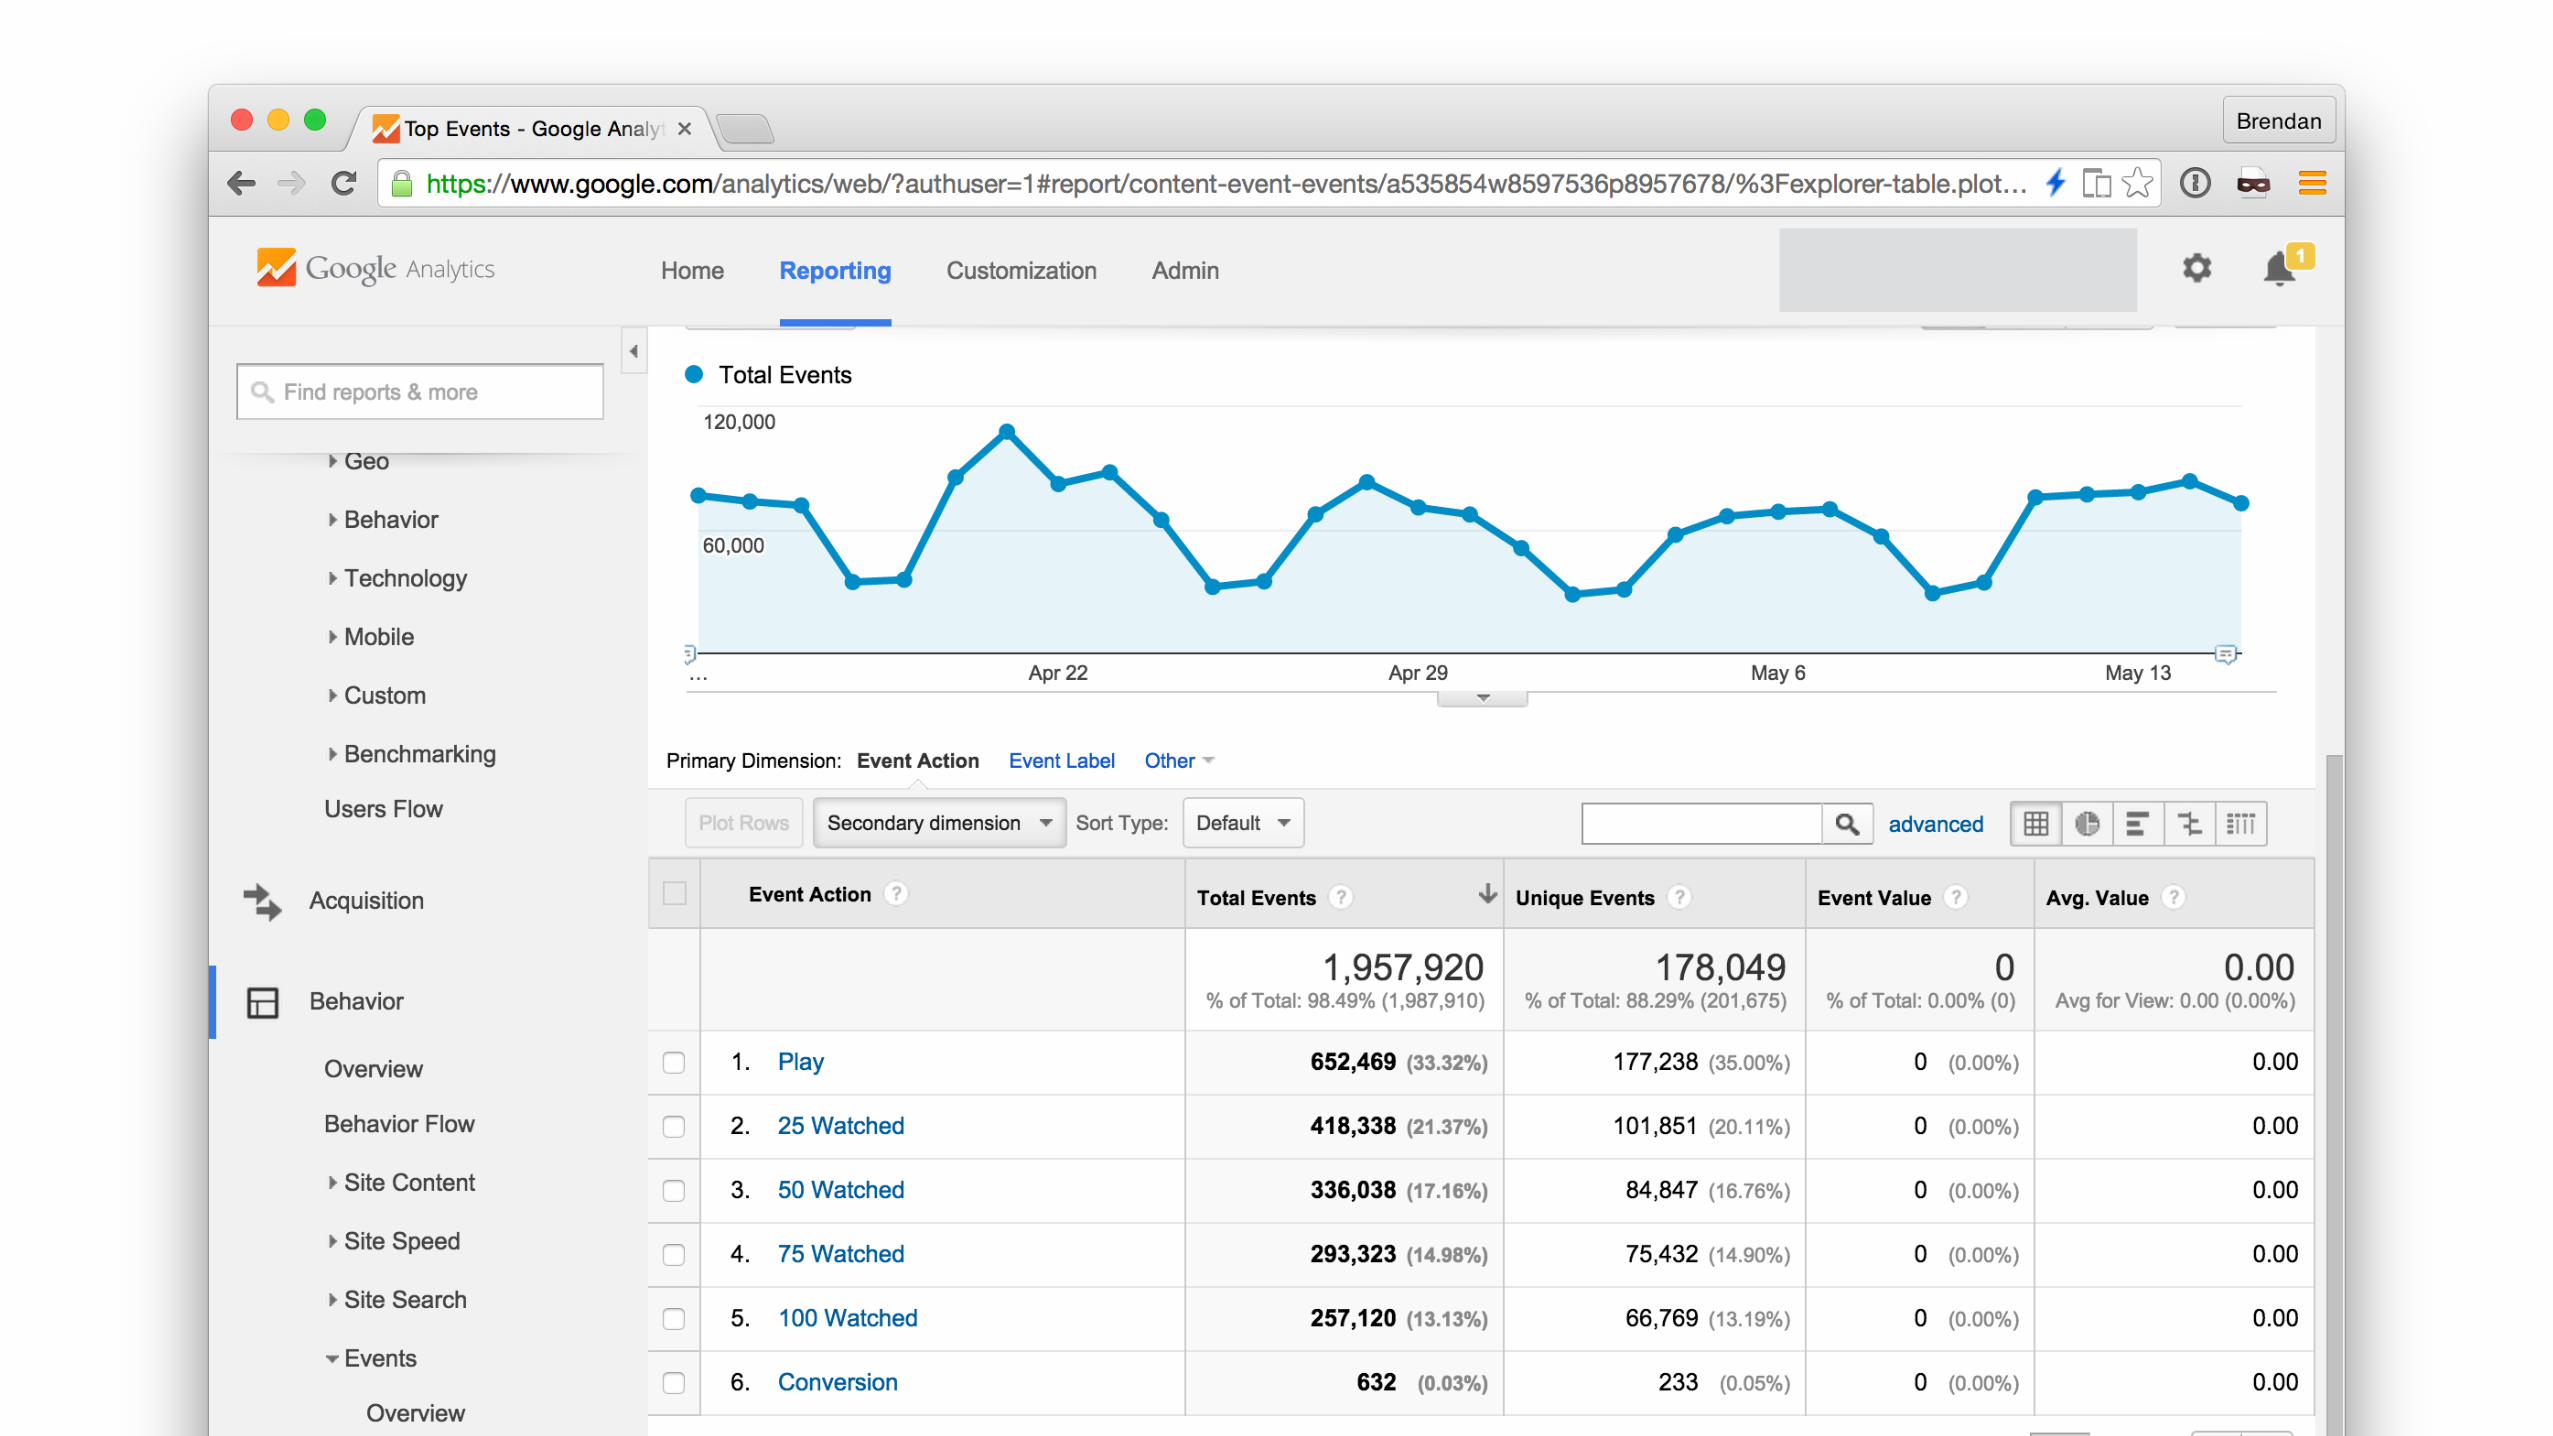
Google Analytics Integration


Trends Page Update


The Data Team


Desktop plays 84%
Mobile plays 16%

50+% mobile16% mobile

0%
10%
20%
30%
40%
50%
60%
12 AM
1 AM
2 AM
3 AM
4 AM
5 AM
6 AM
7 AM
8 AM
9 AM
10 AM
11 AM
12 PM
1 PM
2 PM
3 PM
4 PM
5 PM
6 PM
7 PM
8 PM
9 PM
10 PM
11 PM
Desktop engagement by time of day

0%
10%
20%
30%
40%
50%
60%
12 AM
1 AM
2 AM
3 AM
4 AM
5 AM
6 AM
7 AM
8 AM
9 AM
10 AM
11 AM
12 PM
1 PM
2 PM
3 PM
4 PM
5 PM
6 PM
7 PM
8 PM
9 PM
10 PM
11 PM
Desktop engagement by time of day
39%51%
42%

0%
10%
20%
30%
40%
50%
60%
12 AM
1 AM
2 AM
3 AM
4 AM
5 AM
6 AM
7 AM
8 AM
9 AM
10 AM
11 AM
12 PM
1 PM
2 PM
3 PM
4 PM
5 PM
6 PM
7 PM
8 PM
9 PM
10 PM
11 PM
Mobile engagement by time of day
53%

0%
10%
20%
30%
40%
50%
60%
12 AM
1 AM
2 AM
3 AM
4 AM
5 AM
6 AM
7 AM
8 AM
9 AM
10 AM
11 AM
12 PM
1 PM
2 PM
3 PM
4 PM
5 PM
6 PM
7 PM
8 PM
9 PM
10 PM
11 PM
Mobile vs. Desktop Engagement


New & Returning Views

Returning plays 70%
New plays 30%
3.25 million plays

0
25,000
50,000
75,000
100,000
Sep-11
Nov-11
Jan-1
2
Mar-12
May-12
Jul-1
2
Sep-12
Nov-12
Jan-1
3
Mar-13
May-13
Jul-1
3
Sep-13
Nov-13
Jan-1
4
Mar-14
May-14
Jul-1
4
Sep-14
Nov-14
Jan-1
5
Mar-15
New plays over time

0
75,000
150,000
225,000
300,000
Sep-11
Nov-11
Jan-1
2
Mar-12
May-12
Jul-1
2
Sep-12
Nov-12
Jan-1
3
Mar-13
May-13
Jul-1
3
Sep-13
Nov-13
Jan-1
4
Mar-14
May-14
Jul-1
4
Sep-14
Nov-14
Jan-1
5
Mar-15
Returning plays over time

0
100,000
200,000
300,000
400,000
Sep-11
Nov-11
Jan-1
2
Mar-12
May-12
Jul-1
2
Sep-12
Nov-12
Jan-1
3
Mar-13
May-13
Jul-1
3
Sep-13
Nov-13
Jan-1
4
Mar-14
May-14
Jul-1
4
Sep-14
Nov-14
Jan-1
5
Mar-15
New vs. returning over time

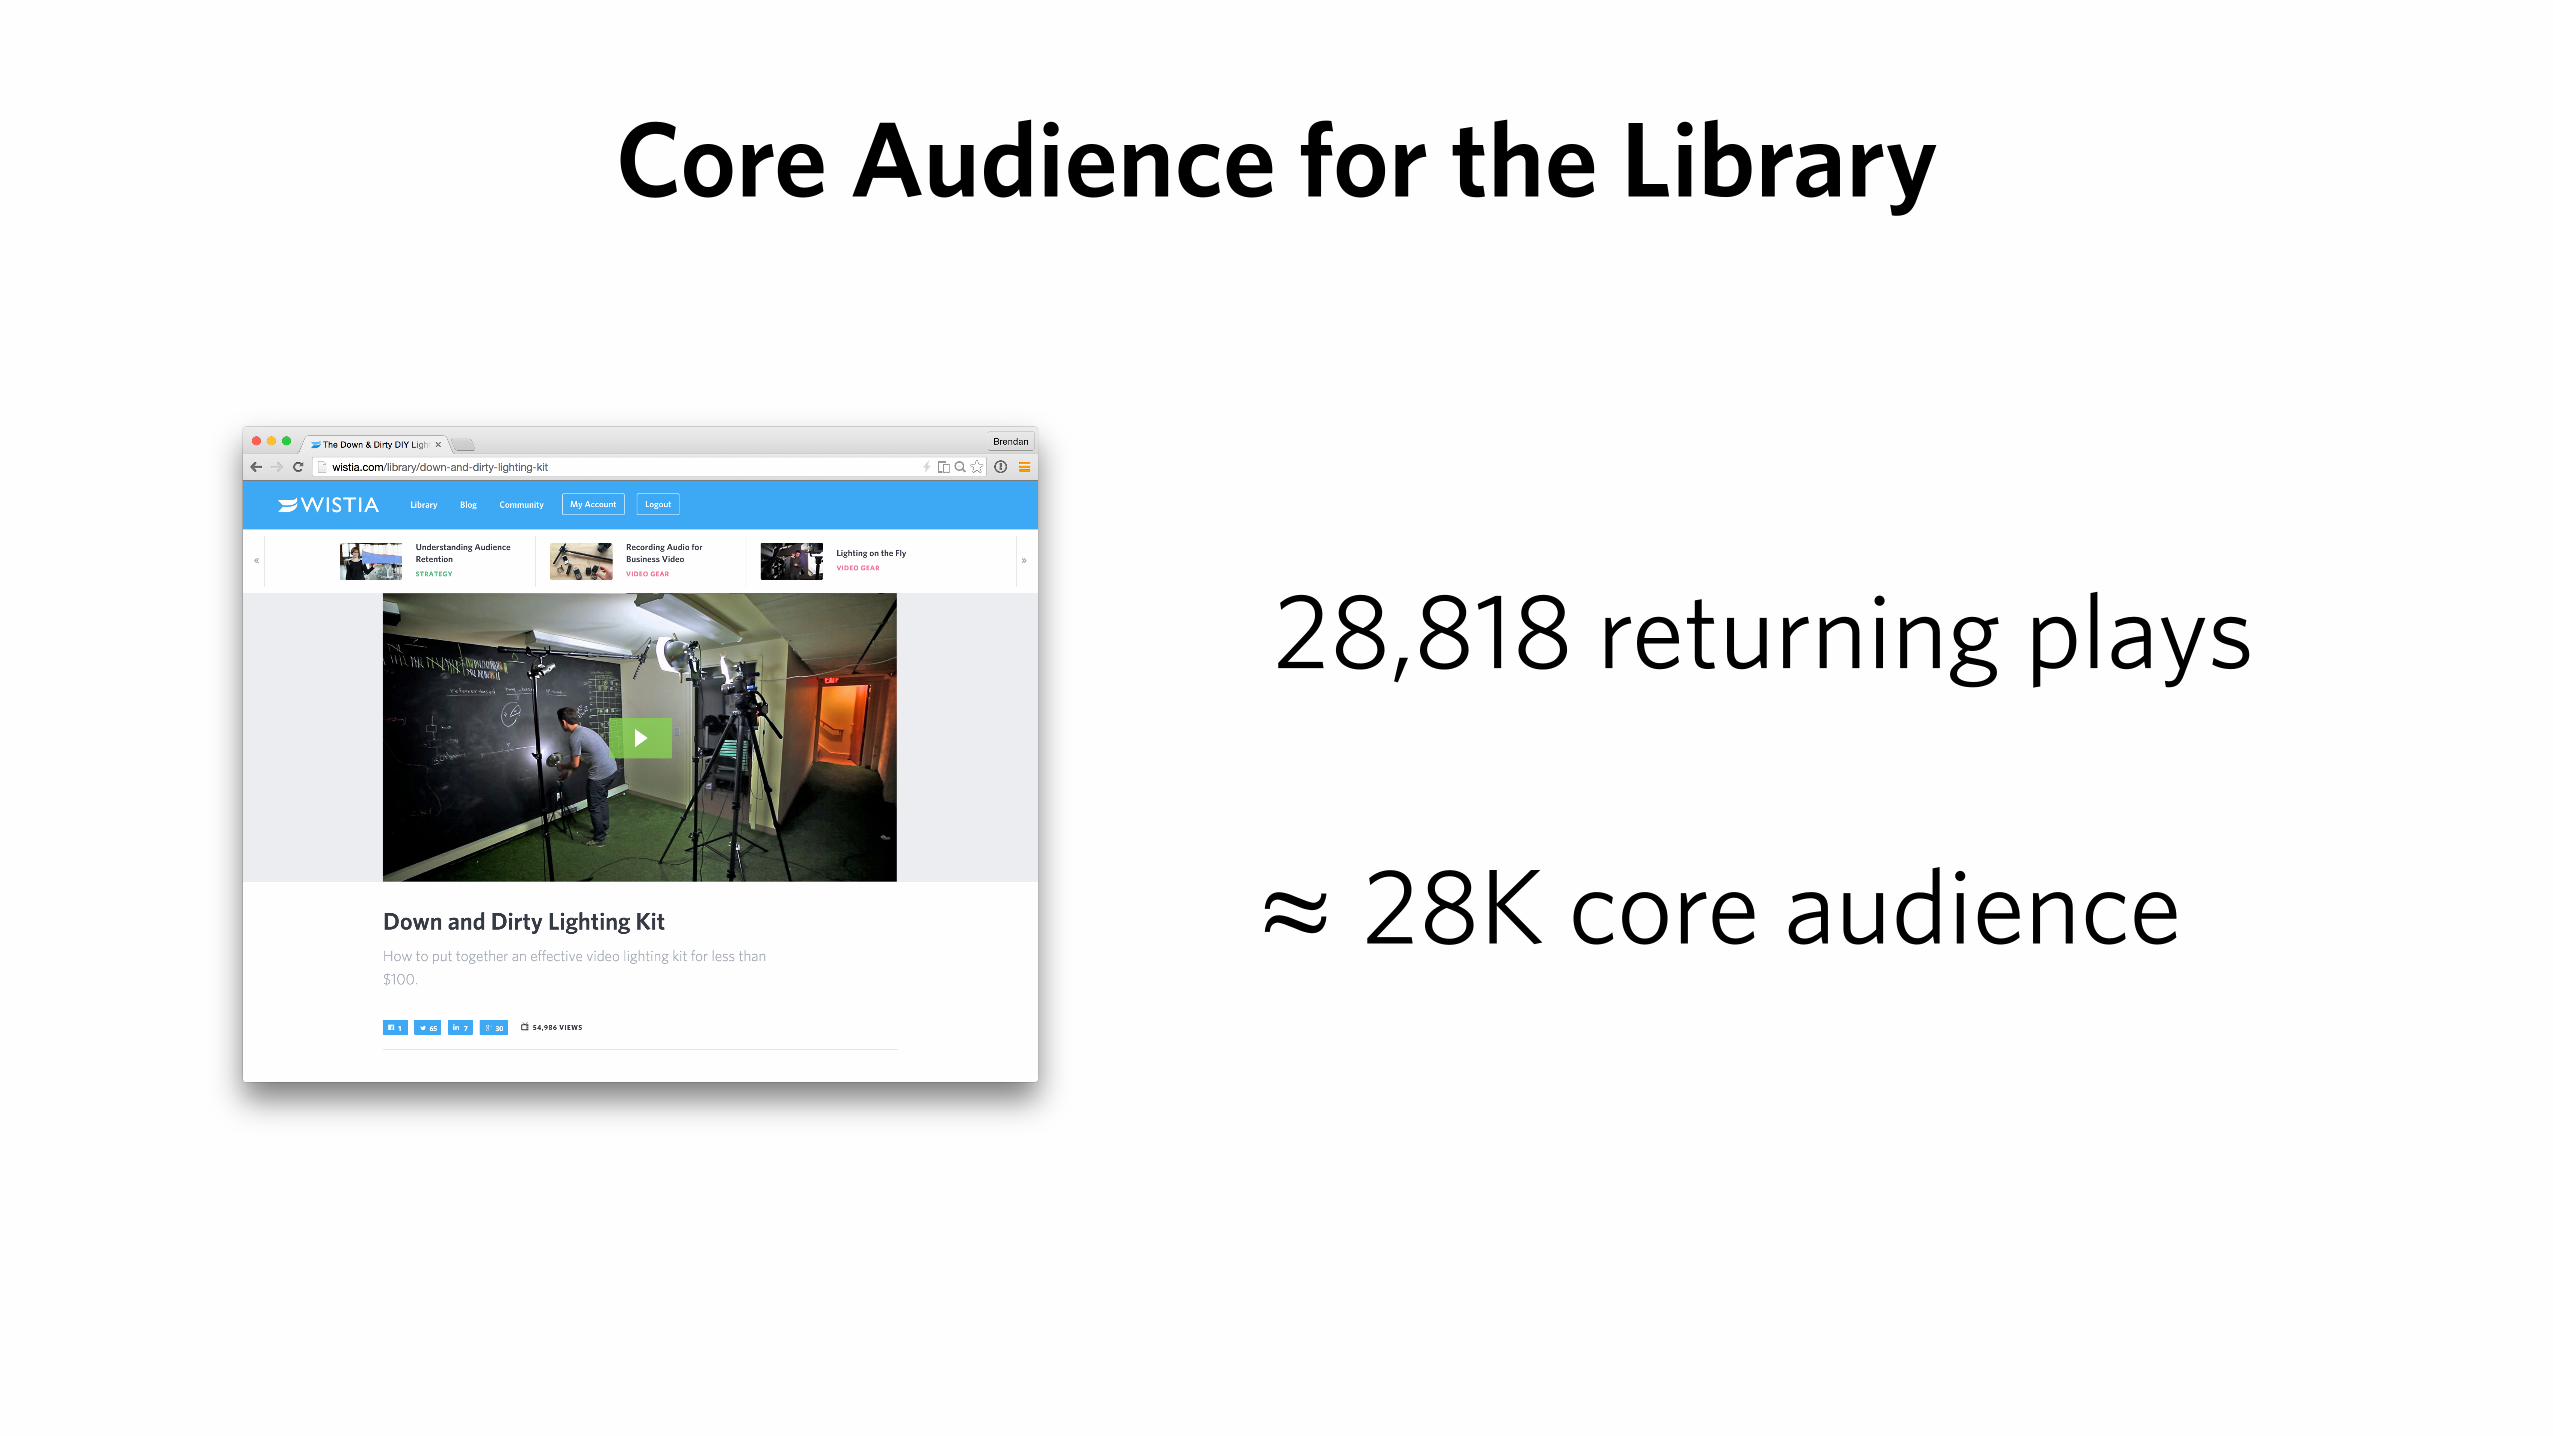
28,818 returning plays
Core Audience for the Library
≈ 28K core audience

4,845 returning plays
28K core audience
1/5 has watched4/5 have not watched


4,148 new8,664 returning
32% new plays

32% new plays 46% new plays
vs.

Wouldn’t it be cool if…

Disclaimers• Only for this audience • Snapshot in time • Data only up through March • This is a test • This data will disappear


We need your help!

Faith Data

Thank you!