measuring upstream: indicators of actions and impacts on ... · measuring upstream: indicators of...
TRANSCRIPT

Measuring Upstream: Indicators of actions and impacts on environments
Boyd Swinburn
School of Population Health, University of Auckland, New Zealand
and
WHO Collaborating Centre for Obesity Prevention, Deakin University, Australia

Overview
• Community-based interventions for obesity prevention
– Experience of measuring actions and impacts in CBIs
• National and global policies and actions
– What is happening for obesity prevention?
– Proposed monitoring framework for measuring actions and impacts for improving food environments and reducing obesity and NCDs (INFORMAA)

Sentinel Site for Obesity Prevention
• 3 CBIs in the Barwon-SW region of Victoria
• Aims:
– To build the evidence on ‘what works, for whom, why, in what contexts, and at what cost?’
– Create ‘proof of principle’
– Build capacity
Colac Geelong
Bell et al. Health Promot Int 2008; 23(4):328-36

Time Measurements
Components: Anthropometry, behaviours, environments
Intervention groups: Impact of interventions, sustainability, population reach
Regional sample: Comparison sample with intervention population, monitoring trends.
1. Support interventions 2. Training and capacity building 3. Evaluation and research
2002 2003 2004 2005
East Geelong – 13-18 y/o “It’s Your Move!”
2006 2007
Colac – 4-12 y/o “Be Active Eat Well” Sustainability
2008 2009
Greater Geelong – Under 5s “Romp & Chomp”
3 CBIs of the Sentinel Site for Obesity Prevention
Linked with 3 sister studies in Fiji, Tonga and Auckland
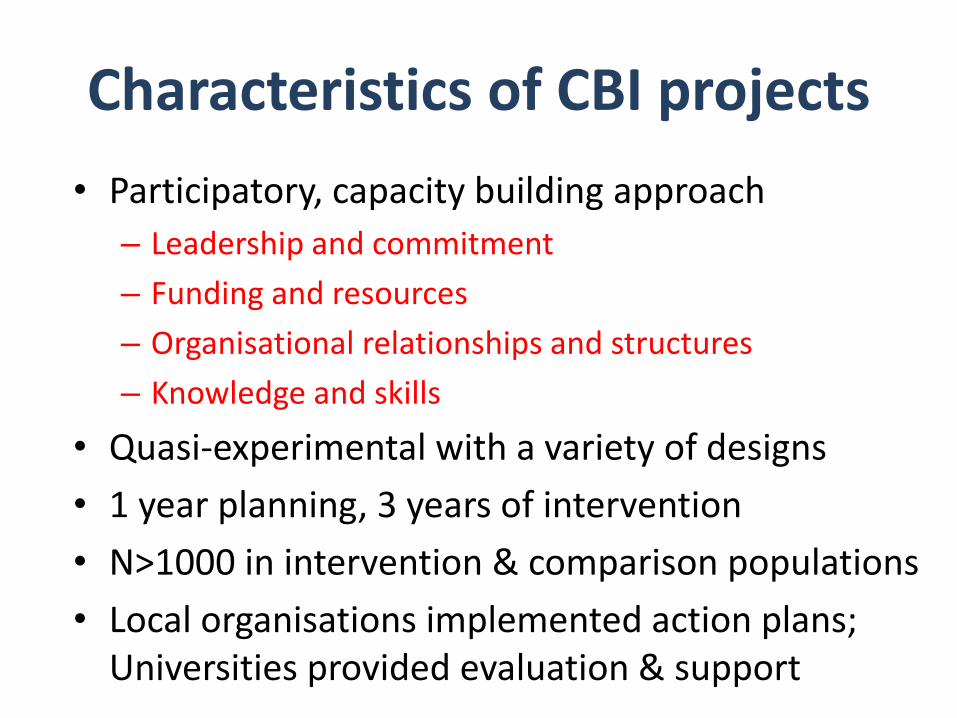
Characteristics of CBI projects
• Participatory, capacity building approach
– Leadership and commitment
– Funding and resources
– Organisational relationships and structures
– Knowledge and skills
• Quasi-experimental with a variety of designs
• 1 year planning, 3 years of intervention
• N>1000 in intervention & comparison populations
• Local organisations implemented action plans; Universities provided evaluation & support

Logic model for interventions
1 Intervention dose is either 1 or 0 (intervention, control) or $$ (economic input – all schools) 2 Capacity is leadership, skills/knowledge, structures, resources 3 Relevant environments are schools, homes, neighbourhoods, churches 4 Weight, BMI, BMI-z, waist, waist:height, %fat, prevalence of o/w+obesity
Intervention
Dose1
Δ Community
capacity2
Δ Environments3
Δ Knowledge,
attitudes, beliefs,
perceptions etc
Δ Behaviours Δ Anthropometry4
INPUTS
POPULATION
MEDIATORS
INDIVIDUAL
MEDIATORS OUTCOMES
MODERATORS
Ethnicity, socio-cultural
factors, gender, age, SES
Δ QoL
Δ QALYs gained
Δ Policy
= Measured = Modelled
Swinburn et al Obes Rev 2011; 12(suppl 2):3-11

Romp & Chomp: Under-5s
• Relative reduction of 1.8 and 2.7 %-points over 3 years (p<0.05)
• Low budget ($100k over 3y)
for 12,000 children
• Changes in behaviours and environments
• State prevalence ing
De Silva-Sanigorski Am J Clin Nutr 2010 91(4):831-840
-4
-3.5
-3
-2.5
-2
-1.5
-1
-0.5
0
Intervention Comparison
2 year olds 3.5 year olds
% o
verw
eigh
t +
ob
ese
(IO
TF)

Be Active Eat Well: 1° schools
• Reduction of ~1kg, 3cm waist over 3y
• Greater effect in lower SES children
• No differences in ‘safety measures’ eg self-esteem, dieting under-weight, etc
-3.5
-3
-2.5
-2
-1.5
-1
-0.5
0BMI z-BMI Weight Waist
Un
its o
f C
ha
ng
e (
Int
ve
rsu
s C
om
p)
p = 0.056
p = 0.017
p = 0.014
p = 0.000
Sanigorski et al Int J Obesity 2008 32(7):1060-7

Economic evaluation of BAEW
• Measure of investment of $ and time into achieving actions
• For every $1 invested by the Dept of Health, the Colac community invested $2.80
• BAEW was cost effective using standard criteria (<$50k per DALY saved)
• 70% of the effect on body weight would need to be maintained to keep it cost-effective

• 5.8 %-points lower relative prevalence over 3 years
• Changes in community capacity
• Changes in school envs
• Few significant changes in behaviours seen
Millar et al Obesity Rev 2011 12(suppl 2): 20-28
Δ%
ove
rwei
ght
+ o
bes
e (W
HO
)
It’s Your Move!: 2° Schools
-4
-3
-2
-1
0
1
2
3
Intervetion Comparison
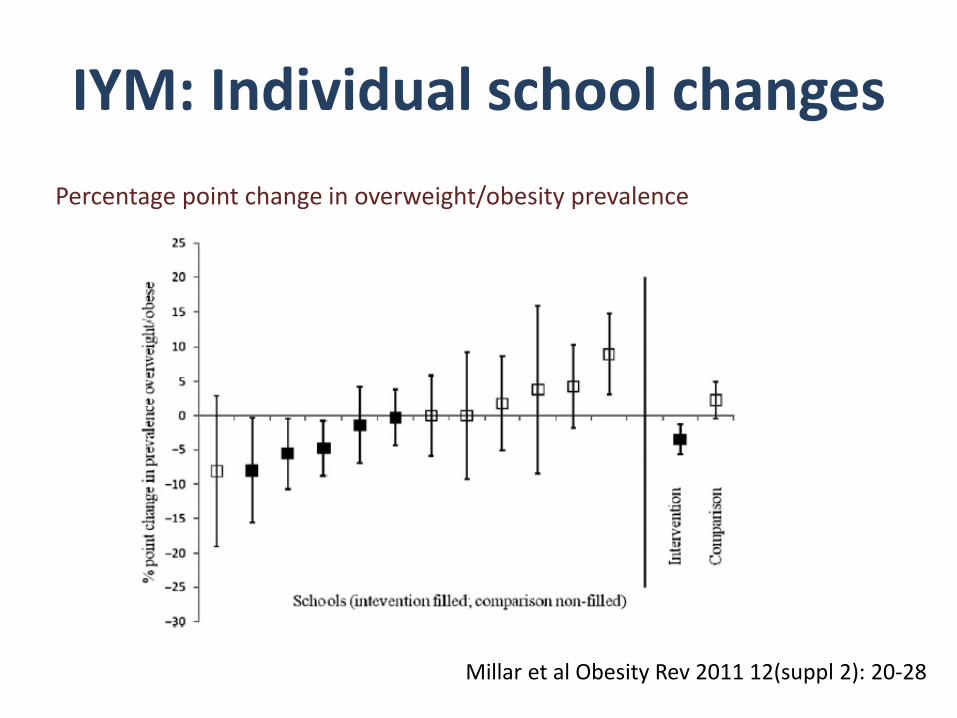
IYM: Individual school changes
Percentage point change in overweight/obesity prevalence
Millar et al Obesity Rev 2011 12(suppl 2): 20-28

05
1015202530
Dimension A
Dimension B
Dimension C
Dimension D
Dimension E
Dimension F
Baseline
Follow-up05
1015202530
Dimension A
Dimension B
Dimension C
Dimension D
Dimension E
Dimension F
Baseline
Follow-up
Community Readiness to Change
Intervention schools Comparison schools
A: community knowledge about the issue B: existing community efforts C: community knowledge of the efforts D: leadership (appointed leaders & influential community members) E: community attitudes F: resources related to the issue

Community Readiness to Change
Level of readiness to change (y axis) 9. High level of community ownership 8. Confirmation/ expansion 7. Stabilization 6. Initiation 5. Preparation 4. Pre-planning 3. Vague awareness 2. Denial/Resistance 1. No awareness
0
1
2
3
4
5
6
7
8
9
Intervention schools Comparison schools

Pacific OPIC study outcomes
0
10
20
30
40
50
60
70In
terv
en
tio
n
Co
mp
ari
so
n
Inte
rve
nti
on
Co
mp
ari
so
n
Inte
rve
nti
on
Co
mp
ari
so
n
Inte
rve
nti
on
Co
mp
ari
so
n
Inte
rve
nti
on
Co
mp
ari
so
n
Australia Fiji -Indigenous
Fiji - Indian New Zealand Tonga
% o
verw
eig
ht/
ob
ese
Baseline
Follow-up
*


Summary from CBI measurements
• Anthropometry provides hard outcomes
• Behaviour changes often hard to detect – Tools for large scale studies are not very sensitive
– Likely (and ideally) multiple small changes across several behaviours
• Environmental indicators are critical (policy target)
• Need socio-cultural indicators of change
• Community measures reflect action
• Economic measures can be used for dose & cost-effectiveness analyses

Upstream actions at national and global levels
• What is happening?
– Private sector fast track (reformulation, pledges, self-regulation etc) ?aims and impacts
– Public sector slow track (some $ investments in CBIs, little policy investment) ?aims and impacts
• UN High Level Meeting on NCDs
– Profile of NCD targets and monitoring raised
– WHO reporting back by end of 2012
– Draft document for consultation

WHO proposed targets & indicators

WHO proposed monitoring framework
• Environments are totally absent
• Responses are health system only
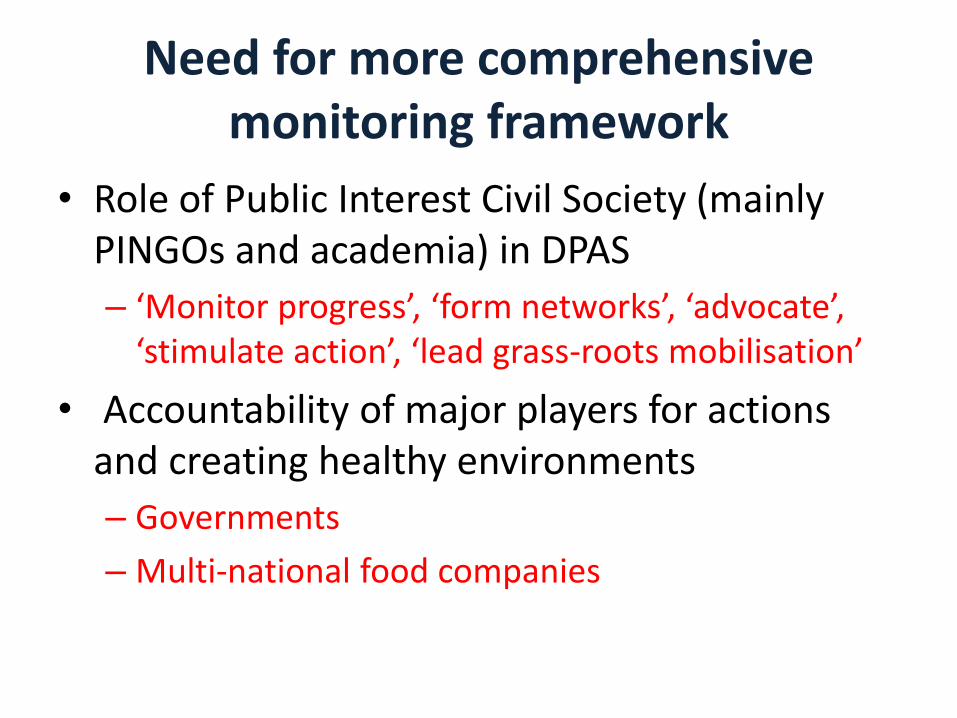
Need for more comprehensive monitoring framework
• Role of Public Interest Civil Society (mainly PINGOs and academia) in DPAS
– ‘Monitor progress’, ‘form networks’, ‘advocate’, ‘stimulate action’, ‘lead grass-roots mobilisation’
• Accountability of major players for actions and creating healthy environments
– Governments
– Multi-national food companies

INFORMAA
• International Network for Food and Obesity/NCD Research, Monitoring and Advocacy for Action
– Global network of public-interest NGOs and researchers that aims to monitor and advocate for public and private sector actions to create healthy food environments and reduce obesity & NCDs
– Auspiced by International Obesity Task Force
– Outcomes: databases; benchmarking; advocacy and research efforts; capacity building

INFORMAA framework
I N F O R M A A WHO
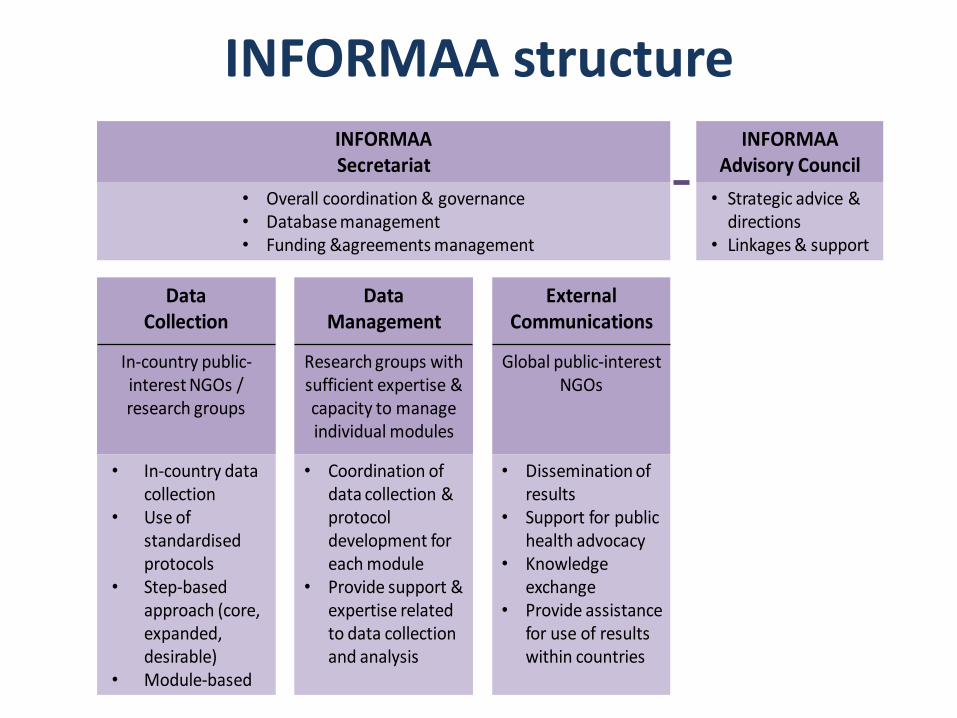
INFORMAA structure INFORMAASecretariat
• Overall coordination & governance• Database management• Funding &agreements management
DataCollection
DataManagement
External Communications
In-country public-interest NGOs / research groups
Research groups with sufficient expertise & capacity to manage individual modules
Global public-interest NGOs
• In-country data collection
• Use of standardised protocols
• Step-based approach (core, expanded,desirable)
• Module-based
• Coordination of data collection & protocol development for each module
• Provide support & expertise related to data collection and analysis
• Dissemination of results
• Support for public health advocacy
• Knowledge exchange
• Provide assistance for use of results within countries
INFORMAAAdvisory Council
• Strategic advice & directions
• Linkages & support
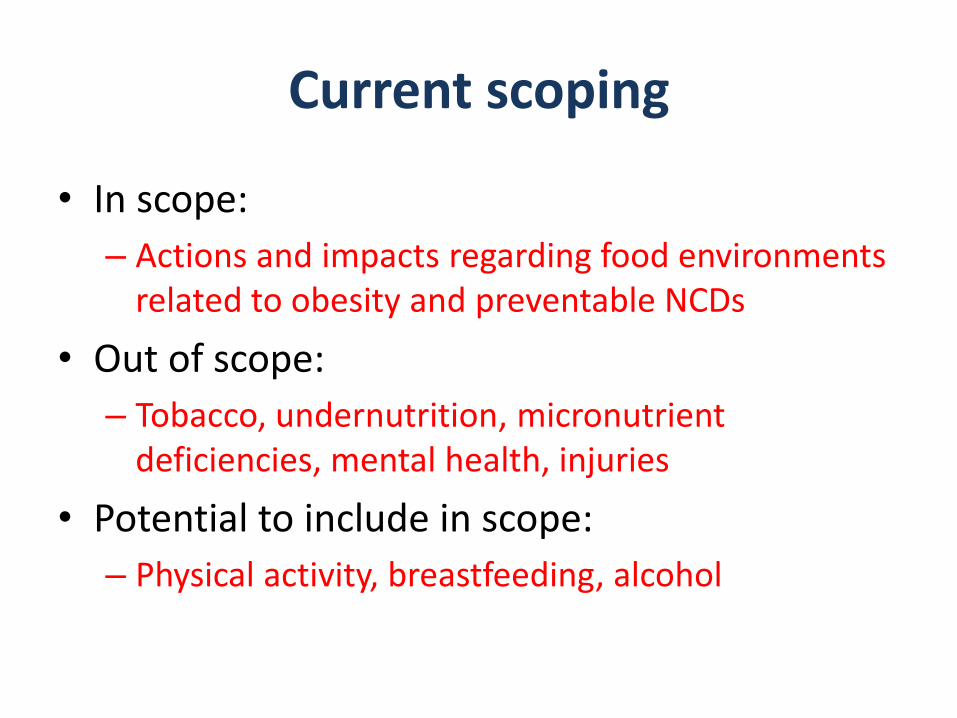
Current scoping
• In scope:
– Actions and impacts regarding food environments related to obesity and preventable NCDs
• Out of scope:
– Tobacco, undernutrition, micronutrient deficiencies, mental health, injuries
• Potential to include in scope:
– Physical activity, breastfeeding, alcohol

Data collection principles
• Standardised protocols for each module
• Stepped approach (WHO STEPS), including a ‘core’ dataset (requiring minimal resources) for all participating countries to collect, and ‘expanded’ and ‘desirable’ datasets (requiring additional resources). This allows countries to select a level of data collection to match their capacity.
• Pragmatic approach with flexibility at the local level
• Regular, repeated data collection

Data management/use principles
• Central database for data storage
• Data shared as a public good, with ‘open access’ for top-line results
• Detailed country-level information owned by the participating country
• Agreements to share the data for research and analysis purposes
• Web-based access to stored data
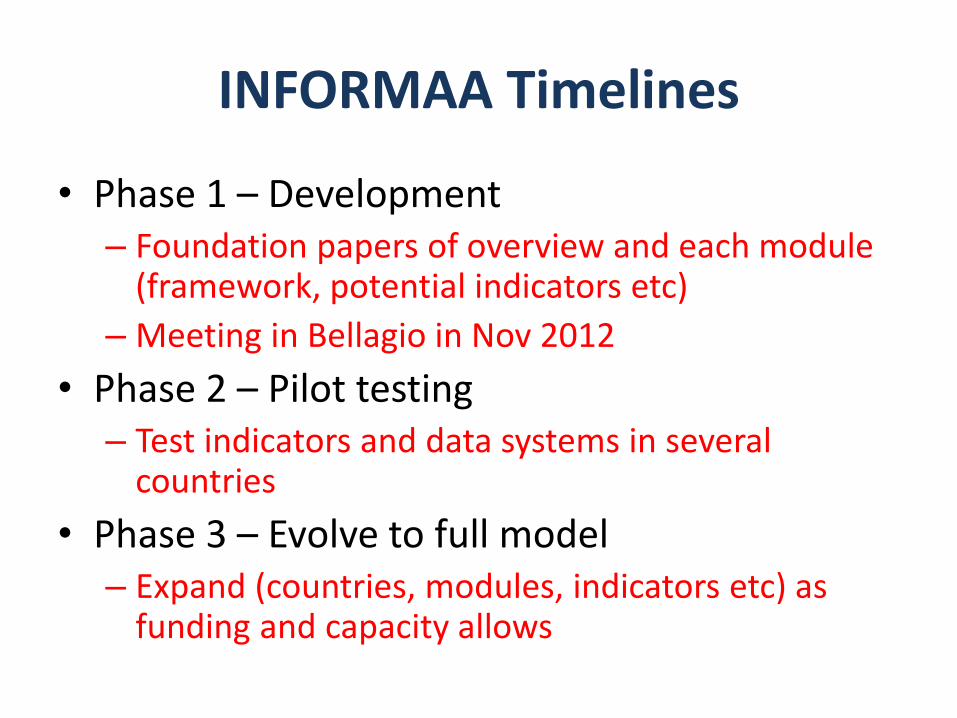
INFORMAA Timelines
• Phase 1 – Development – Foundation papers of overview and each module
(framework, potential indicators etc)
– Meeting in Bellagio in Nov 2012
• Phase 2 – Pilot testing – Test indicators and data systems in several
countries
• Phase 3 – Evolve to full model – Expand (countries, modules, indicators etc) as
funding and capacity allows
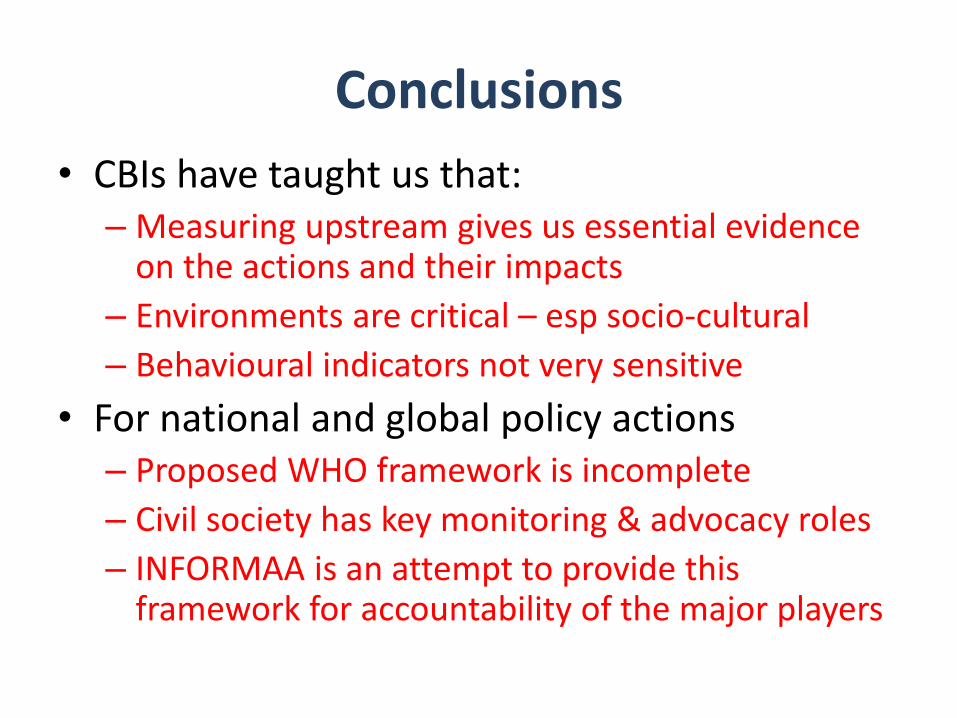
Conclusions
• CBIs have taught us that: – Measuring upstream gives us essential evidence
on the actions and their impacts
– Environments are critical – esp socio-cultural
– Behavioural indicators not very sensitive
• For national and global policy actions – Proposed WHO framework is incomplete
– Civil society has key monitoring & advocacy roles
– INFORMAA is an attempt to provide this framework for accountability of the major players

Acknowledgements
• Deakin team: Gary Sacks,
Marita McCabe, Rob Carter, Andrea de Silva-Sanigorski, Lynne Millar, Marj Moodie, Steve Allender, Peter Kremer, Mel Nichols, Anne Simmons, Mary Malakellis, Louise Mathews, Helen Mavoa, Wendy Snowdon, Kristy Bolton, Catherine Keating, Colin Bell, Max de Courten, and the RA teams for the Sentinel Site
• Others: Bruce Neal, Tim
Lobstein, Shirki Kumanyaki, other INFORMAA team members, IOTF Scientific Advisory Council Members
• Funders: Department of
Health, NHMRC, HRC (NZ), VicHealth, Dept of Health and Ageing, Wellcome Trust, Rockefeller Foundation