measuring the socio-economic footprint of the …
TRANSCRIPT
Analysis built on Renewable energy benefits: Measuring the economics (IRENA, 2016)
MEASURING THE SOCIO-ECONOMIC FOOTPRINT OF THE
ENERGY TRANSITION:THE ROLE OF SUPPLY CHAINS
Disclaimer
This publication and the material herein are provided “as is”. All reasonable precautions have been taken by IRENA to verify the reliability of the material in this publication. However, neither IRENA nor any of its officials, agents, data or other third-party content providers provides a warranty of any kind, either expressed or implied, and they accept no responsibility or liability for any consequence of use of the publication or material herein.
The information contained herein does not necessarily represent the views of the Members of IRENA. The mention of specific companies or certain projects or products does not imply that they are endorsed or recommended by IRENA in preference to others of a similar nature that are not mentioned. The designations employed and the presentation of material herein do not imply the expression of any opinion on the part of IRENA concerning the legal status of any region, country, territory, city or area or of its authorities, or concerning the delimitation of frontiers or boundaries.
© IRENA 2019
Unless otherwise stated, material in this publication may be freely used, shared, copied, reproduced, printed and/or stored, provided that appropriate acknowledgement is given of IRENA as the source and copyright holder. Material in this publication that is attributed to third parties may be subject to separate terms of use and restrictions, and appropriate permissions from these third parties may need to be secured before any use of such material.
Acknowledgements
This brief was prepared by the Policy Team at IRENA’s Knowledge, Policy and Finance Centre (KPFC) under the guidance of Rabia Ferroukhi and was written by Michael Renner, Bishal Parajuli, and Rabia Ferroukhi (IRENA) and Padmashree Gehl Sampath (Berkman Klein Center, Harvard University), with contributions from Xavier García Casals, Arslan Khalid, Diala Hawila, Jinlei Feng and Celia García-Baños.
The macroeconomic modelling (E3ME) results were provided by Hector Pollitt, Jon Stenning, Eva Alexandri, Unnada Chewpreecha and Alistair Smith (Cambridge Econometrics, UK). Valuable review and feedback was provided by IRENA colleagues Elizabeth Press, Dolf Gielen, Nicolas Wagner, Ahmed Abdel Latif and Ricardo Gorini. REmap was prepared by the IRENA Innovation and Technology Centre (IITC).
Cover image: Shutterstock Page 8: John Magrath, Oxfam and Shutterstock Page 13: Shutterstock Page 14: Farmer, India © IWMI/Prashanth Vishwanathan and Shutterstock Page 19: Shutterstock
ABOUT IRENA
The International Renewable Energy Agency (IRENA) is an intergovernmental organisation that supports countries in their transition to a sustainable energy future, and serves as the principal platform for international co-operation, a centre of excellence, and a repository of policy, technology, resource and financial knowledge on renewable energy. IRENA promotes the widespread adoption and sustainable use of all forms of renewable energy, including bioenergy, geothermal, hydropower, ocean, solar and wind energy, in the pursuit of sustainable development, energy access,
2
CONTENTSKey findings ..........................................................................................................................................................................4
1. Why measure the socio-economic footprint of the energy transition? .....................................................5
2. Localisation to deepen domestic supply chains ................................................................................................9
2.1. Understanding the materials and labour requirements .........................................................................10
2.2. Aligning domestic supply chains to energy transition needs ..............................................................13
2.3. Trade sensitivity analysis ..................................................................................................................................15
3. Designing effective policies to maximise transition benefits .......................................................................17
3.1. Facilitating productive interactions between the energy sector and the economy at large ....18
3.2. Reorienting fossil fuel-dependent economies ..........................................................................................18
3.3. Creating a successful industrial policy framework for renewable energy and a broader socio-economic transformation ........................................................................................20
LIST OF FIGURES AND BOXESFigure 1. Global renewable energy jobs, 2012-2017 .............................................................................................5
Figure 2. The embedded nature of the energy system ........................................................................................6
Figure 3. The energy transition and its socio-economic footprint ..................................................................6
Figure 4. Growth of global GDP in the REmap Case relative to the Reference Case, 2018-2050 .........7
Figure 5. Percentage changes in country / regional GDP in the REmap Case relative to the Reference Case, 2050 ......................................................................................................8
Figure 6. Materials required for a 1 MW solar PV plant, a 50 MW onshore wind plant and a 500 MW offshore wind plant ................................................10
Figure 7. Distribution of human resources and occupational requirements along the value chain (50 MW PV project, 50 MW onshore wind, 500 MW offshore wind) ...........................................11
Figure 8. Employment in the overall energy sector, 2016, 2030 and 2050 ..................................................12
Figure 9. Supply chain indicator for entire economy, by selected region and technology .....................14
Figure 10. Percentage change in GDP and employment in moving from full imports to full localisation (relative to the Reference Case), 2030 and 2050 ..........................................16
Box 1. Overview of policies needed to advance the energy transition .....................................................17
Box 2. Declaration of solidarity and just transition ..........................................................................................20
3

Key findings • The energy transition cannot be considered in isolation from the broader socio-economic system. For
the transition to renewable sources and technologies to succeed, policies must be based on a more integrated assessment of the interactions between the evolving energy sector and the wider economy.
• Changes in the energy system have impacts throughout the economy. Globally, the transition promises GDP, job creation and human welfare benefits. As is the case with any economic transition, some regions and countries will fare better than others. Regions with high dependence on fossil fuel exports and/or weak, non-diversified domestic supply chains face an adjustment challenge.
• The extent to which countries can benefit from the energy transition depends on the level of their ambition, their existing socio-economic structures, and the industrial policies they adopt to increase the depth and diversity of supply chains.
• An initial step is to understand the material and human resource requirements of renewable energy technologies, assess them in the context of existing domestic resources and capabilities, and identify ways to maximise domestic value creation by leveraging and enhancing local industries.
• Synergistic interactions between the energy sector and the overall economy are key to maximising socio-economic benefits. Strategic collaboration and co-ordination among governments, the private sector and other domestic stakeholders can mobilise needed investment and promote economy-wide spillovers to build viable domestic supply chains.
• For countries with weak domestic supply chains, measures are needed to augment industrial capabilities within and beyond the energy sector; incubate and develop supplier firms; engage in joint ventures for learning-by-doing processes; step up education and training efforts; and pursue opportunities for regional cooperation and shared advancement.
• For fossil fuel-dependent economies, measures include retraining and alignment of skills and expertise from the fossil-fuel sector with renewable energy needs, such as by using offshore oil and gas expertise in offshore wind development. The accelerating transition also necessitates planning and investments for economic diversification; labour market policies to help people who lose jobs; and appropriate social protection policies for the adjustment period.
• The adoption of a Just Transition Declaration by more than 50 countries at COP 24 in Katowice reflects growing recognition of the importance of balanced outcomes from the transition process. Some countries, such as Spain and China, are translating this concept into policies to address job loss from coal mine closures.
• A sound industrial policy framework can help countries take advantage of the economic opportunities emerging from the energy transition. Fostering domestic industrial capacities is intrinsic to such an approach, as shown by the experiences of Brazil, China, India, South Africa, and other countries. Well-designed incentives are needed to nurture nascent industries, along with preferential access to credit, economic incubators and supplier development programmes.
4
As the costs of renewable energy technologies continue to decline and the deployment of production capacities expands, the transition from fossil fuels to a cleaner, more sustainable energy system is gaining pace and offering substantial socio-economic benefits.
The ongoing work of the International Renewable Energy Agency (IRENA) demonstrates that renewable energy development is already creating substantial employment, which is essential for livelihoods and social welfare in a market economy. The report series,
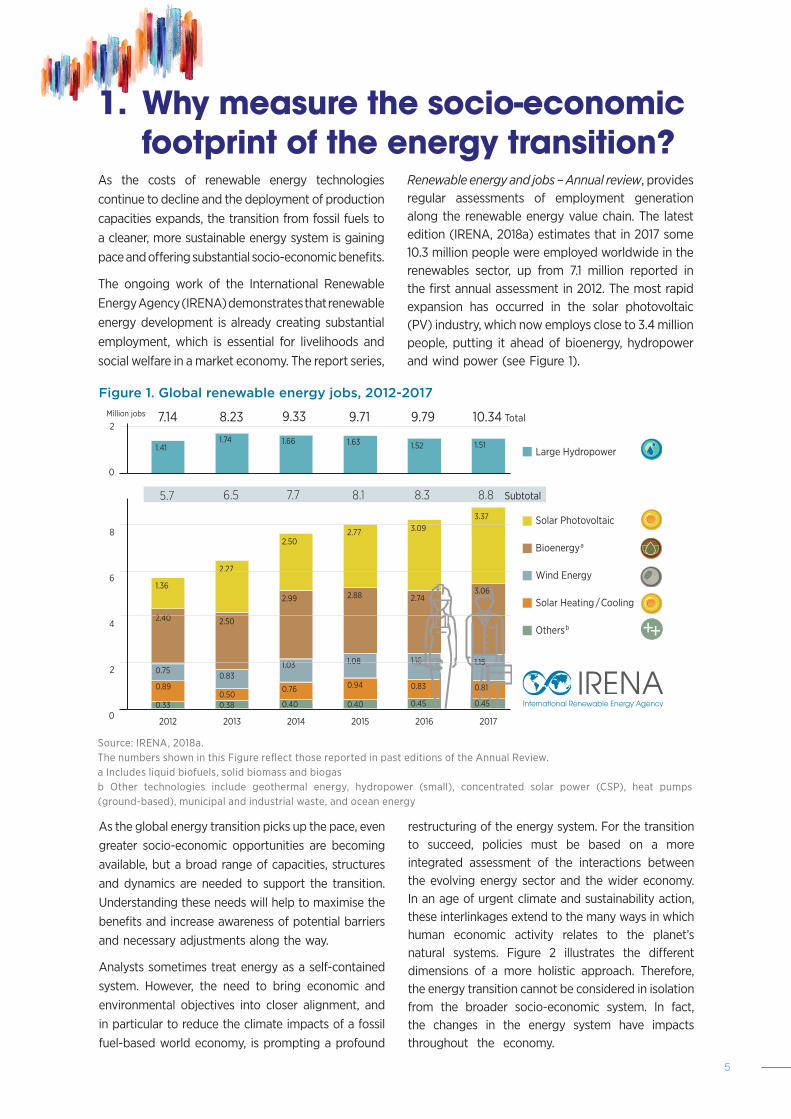
Renewable energy and jobs – Annual review, provides regular assessments of employment generation along the renewable energy value chain. The latest edition (IRENA, 2018a) estimates that in 2017 some 10.3 million people were employed worldwide in the renewables sector, up from 7.1 million reported in the first annual assessment in 2012. The most rapid expansion has occurred in the solar photovoltaic (PV) industry, which now employs close to 3.4 million people, putting it ahead of bioenergy, hydropower and wind power (see Figure 1).
As the global energy transition picks up the pace, even greater socio-economic opportunities are becoming available, but a broad range of capacities, structures and dynamics are needed to support the transition. Understanding these needs will help to maximise the benefits and increase awareness of potential barriers and necessary adjustments along the way.
Analysts sometimes treat energy as a self-contained system. However, the need to bring economic and environmental objectives into closer alignment, and in particular to reduce the climate impacts of a fossil fuel-based world economy, is prompting a profound
restructuring of the energy system. For the transition to succeed, policies must be based on a more integrated assessment of the interactions between the evolving energy sector and the wider economy. In an age of urgent climate and sustainability action, these interlinkages extend to the many ways in which human economic activity relates to the planet’s natural systems. Figure 2 illustrates the different dimensions of a more holistic approach. Therefore, the energy transition cannot be considered in isolation from the broader socio-economic system. In fact, the changes in the energy system have impacts throughout the economy.
1. Why measure the socio-economic footprint of the energy transition?
Figure 1. Global renewable energy jobs, 2012-2017
1.36
2.40
0.75
0.89
0.33
1.41
2.27
2.50
0.83
0.500.38
1.74
2.50
2.99
1.03
0.76
0.40
1.66
2.77
2.88
1.08
0.94
0.40
1.63
3.09
2.74
1.16
0.83
0.45
1.52
3.37
3.06
1.15
0.81
0.45
1.51
7.14 8.23 9.33 9.71 9.79 10.34
5.7 6.5 7.7 8.1 8.3 8.8
Large Hydropower
Solar Photovoltaic
Bioenergya
Wind Energy
Solar Heating / Cooling
Othersb
Total
Subtotal
201720162015201420132012
8
6
4
2
0
2
0
Million jobs
Source: IRENA, 2018a. The numbers shown in this Figure reflect those reported in past editions of the Annual Review.a Includes liquid biofuels, solid biomass and biogasb Other technologies include geothermal energy, hydropower (small), concentrated solar power (CSP), heat pumps (ground-based), municipal and industrial waste, and ocean energy
5
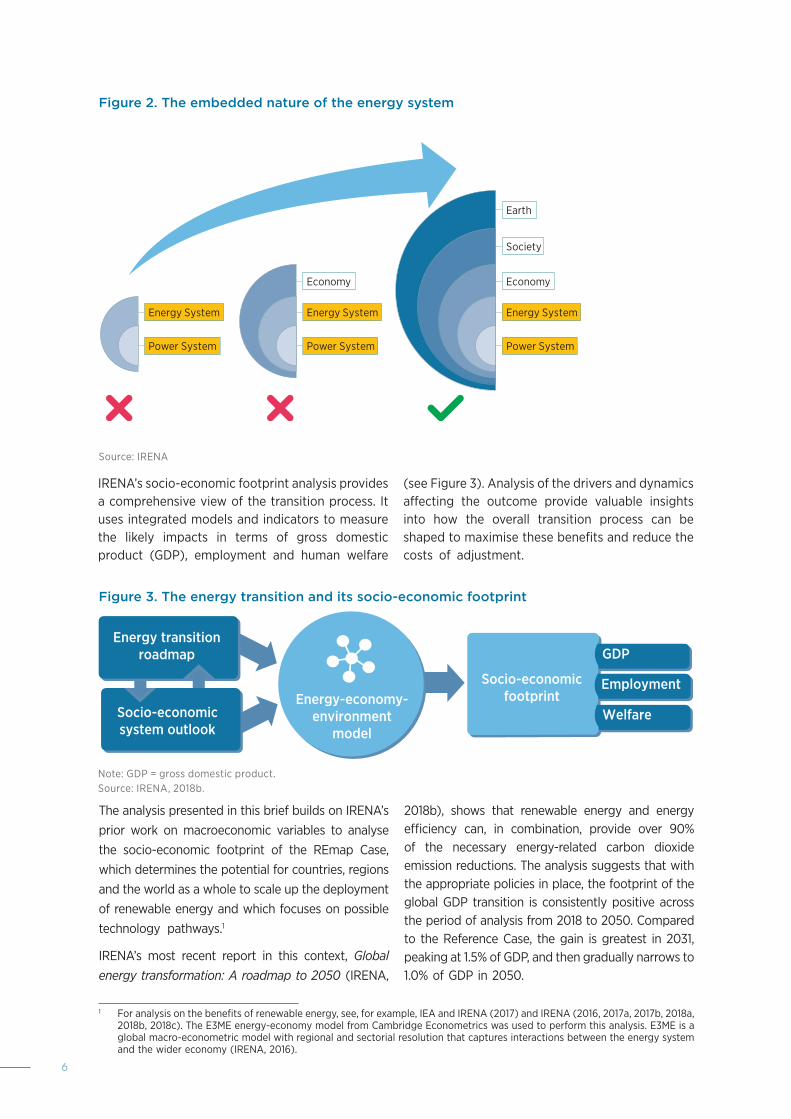
IRENA’s socio-economic footprint analysis provides a comprehensive view of the transition process. It uses integrated models and indicators to measure the likely impacts in terms of gross domestic product (GDP), employment and human welfare
(see Figure 3). Analysis of the drivers and dynamics affecting the outcome provide valuable insights into how the overall transition process can be shaped to maximise these benefits and reduce the costs of adjustment.
The analysis presented in this brief builds on IRENA’s prior work on macroeconomic variables to analyse the socio-economic footprint of the REmap Case, which determines the potential for countries, regions and the world as a whole to scale up the deployment of renewable energy and which focuses on possible technology pathways.1
IRENA’s most recent report in this context, Global energy transformation: A roadmap to 2050 (IRENA,
2018b), shows that renewable energy and energy efficiency can, in combination, provide over 90% of the necessary energy-related carbon dioxide emission reductions. The analysis suggests that with the appropriate policies in place, the footprint of the global GDP transition is consistently positive across the period of analysis from 2018 to 2050. Compared to the Reference Case, the gain is greatest in 2031, peaking at 1.5% of GDP, and then gradually narrows to 1.0% of GDP in 2050.
Figure 2. The embedded nature of the energy system
Figure 3. The energy transition and its socio-economic footprint
Note: GDP = gross domestic product.Source: IRENA, 2018b.
1 For analysis on the benefits of renewable energy, see, for example, IEA and IRENA (2017) and IRENA (2016, 2017a, 2017b, 2018a, 2018b, 2018c). The E3ME energy-economy model from Cambridge Econometrics was used to perform this analysis. E3ME is a global macro-econometric model with regional and sectorial resolution that captures interactions between the energy system and the wider economy (IRENA, 2016).
Source: IRENA
6

The main macroeconomic drivers responsible for the
GDP and employment footprints of the transition
include investment, trade, tax changes, and indirect
and induced effects.2 Figure 4 quantifies the
expected contributions to GDP of these four drivers.
In the short- to mid-term (until 2035) the net positive
impact on global GDP is due mainly to a front-loaded
investment stimulus (energy efficiency and power
sector) and to carbon tax revenues. In the post-2035
period this driver fades in importance.
Figure 4. Growth of global GDP in the REmap Case relative to the Reference Case, 2018-2050
Note: GDP = gross domestic product.Source: IRENA, 2018b.
2 Indirect effects include economic activity and employment in upstream industries that supply and support the core activities of renewable energy deployment. These industries produce intermediate inputs along the value chain. When people who are employed directly or indirectly spend their incomes on a variety of items in the broader economy (such as food, clothing, trans-portation and entertainment), the expenditure gives rise to induced effects.
% di�erence in GDP from Reference Case
1.5
1.0
0.5
0.0
2015 2020 2025 2030 2035 2040 2045 2050
Changes in trade
Indirect and induced eects
Changes in consumer expenditure due to tax rate changes
Changes in investment
Change in GDP
Indirect and induced effects play the most significant role in driving global GDP increases under the REmap Case in the second half of the transition period. This reflects reduced expenditure on energy (main fossil fuels) and reallocation of this spending to other parts of the economy. Larger supply chains lead to increased indirect effects, and increased wages lead to induced effects. As more money is reallocated from energy to other goods and services, benefits increase accordingly. The deployment of energy efficiency measures (which reduce energy consumption permanently) therefore drives a steady increase in the contribution of indirect and induced effects.
As is the case with any economic transition, some regions and countries will fare better than others
due to diverging structures, capacities and dynamics. Figure 5 illustrates that Western Europe and the G20 countries, for example, benefit due to strong domestic supply chains. On the other hand, fossil fuel-based economies – such as the Russian Federation, African members of the Organization of the Petroleum Exporting Countries (OPEC) and other net oil exporters – are negatively impacted due to forgone investment, lower revenues from fossil fuels and smaller indirect and induced effects. The “Rest of Africa” group experiences negative impacts because some of them are high-cost fossil fuel exporters sensitive to the reduction in fossil fuel demand. In addition, they may not be able to take advantage of new opportunities due to weak domestic supply chains and increasing reliance on imports.
7

Chapter 2 of this Brief focuses on an analysis of supply chain aspects. Chapter 3 discusses the need for a just transition that enhances the socio-economic opportunities while minimising the adjustment burdens that weigh on regions and communities dependent on fossil fuels. It sketches the requirements for successful outcomes of industrial policies and concludes that policy makers can support a transition with widely shared benefits through various means. These include i) investing in
economic diversification, ii) sharing initiatives that
build and strengthen domestic supply chains capable
of responding to new economic opportunities,
iii) adopting adjustment and social protection
measures for people dependent on declining
industries (including fossil fuels) and iv) supporting
aspects of the transition that facilitate wider access
to modern energy among regions and communities
that lack such access at present.
Figure 5. Percentage changes in country / regional GDP in the REmap Case relative to the Reference Case, 2050
Note: GDP = gross domestic product.Source: IRENA, 2018b.
% di�erence in GDP from Reference Case
3.53.02.52.01.51.00.50.00.5
1.0
Sout
h Afri
ca
Wes
tem Eur
ope
Rest o
f Eas
t Asia
Sout
hem Eur
ope
Rest o
f Lati
n Amer
icaUnit
ed St
ates
Mexico
Net O
il Importe
rChin
a
Norther
n Eur
ope
Coal-dep
enden
tG20
Brazil
Ocean
ia
Easte
rn Eur
opeArg
entin
a
Sout
heas
t Asia
Canad
a
Net O
il Exp
orter
India
Middle Eas
tRes
t of A
frica
Africa
OPEC
Russia
n Fed
eratio
n
-
-1.5-2.0-2.5-3.0-
8
The characteristics of the energy transition and the specific socio-economic footprint that emerges from it are shaped by various factors. Of foremost importance are policies to support and enable the deployment of renewables, driven by the degree of ambition at the national and global levels. Other factors are rooted in the socio-economic system and the way it evolves during the transition. The extent to which countries can benefit therefore depends on the level of their transition ambition, their existing economic structures and the depth and diversity of supply chains. This brief focuses on the supply chain dimension and provides insights into the role of localisation3. The analysis is carried out for selected regions and countries and will be expanded to the full set of regions / countries in a forthcoming report.
A key aspect shaping the transition’s socio-economic footprint is the manufacture, trade, installation and maintenance of equipment and facilities in support of renewable energy and related measures such as energy efficiency, energy flexibility and system integration. Individual countries and regions differ substantially in the availability of natural resources and industrial capacities to produce relevant goods and services. The countries and regions with the strongest capacity to produce and export these systems can expect to reap great benefits from the transition. Others, especially developing economies and those that depend on fossil fuel exports, rely heavily on imports; hence the direct socio-economic benefits that they can derive from the transition may be limited.
However, industrial policies designed to localise the manufacture and supply of relevant goods and services can overcome these limitations and improve overall socio-economic performance. Such efforts to nurture local industries until they are ready to compete internationally have been applied within almost all
developed countries at one point or another in their economic development (Chang, 2008).
The theory of comparative advantage leads some economists to conclude that it is preferable to locate the production of renewable energy equipment among the lowest-cost producers. In this view, attempting to localise production in a broader set of countries is inefficient. Of course, not every country will be able to localise production in a cost-efficient manner, and localisation does not imply that there is no international integration of value chains at all. However, the factors affecting international competitiveness are complex and dynamic. In an industry as young as the renewable energy sector, the landscape of leading providers of goods and services is forever changing, shaped not only by endowment factors but in fundamental ways by industrial policy measures taken in different countries. Comparative advantage may at times be no more than a fleeting lead.
The appropriate use of industrial policies is regarded as an important way for developing economies to climb the ladder of prosperity (UNECA, 2016). An initial step is to understand the material and human resource requirements of renewable energy technologies, to assess them in the context of existing domestic resources and capabilities, and to identify ways to maximise domestic value creation by leveraging and enhancing local industries. Section 2.1 summarises IRENA findings on inputs required for solar PV and wind plants, and section 2.2 presents a preliminary analysis of the existing strengths of local supply chains in a number of countries / regions and the degree to which they are aligned with energy transition needs. Section 2.3 offers a sensitivity analysis, contrasting existing trade structures with assumptions of full localisation and full import reliance.
3 For this brief, the term “localisation” refers to the local production and local job creation within the country / region or community where the energy transition is progressing.
2. Localisation to deepen domestic supply chains
9
Renewable energy development can drive economic growth, create new jobs and enhance human health and welfare. However, to design effective policies in support of value creation, policy makers need a thorough understanding of materials and labour requirements. IRENA’s Leveraging Local Capacity report series examines these requirements in the solar PV and onshore and offshore wind industries (IRENA, 2017a, 2017b, 2018c), and a solar water heating study will be published in 2019 (IRENA, 2019 forthcoming).
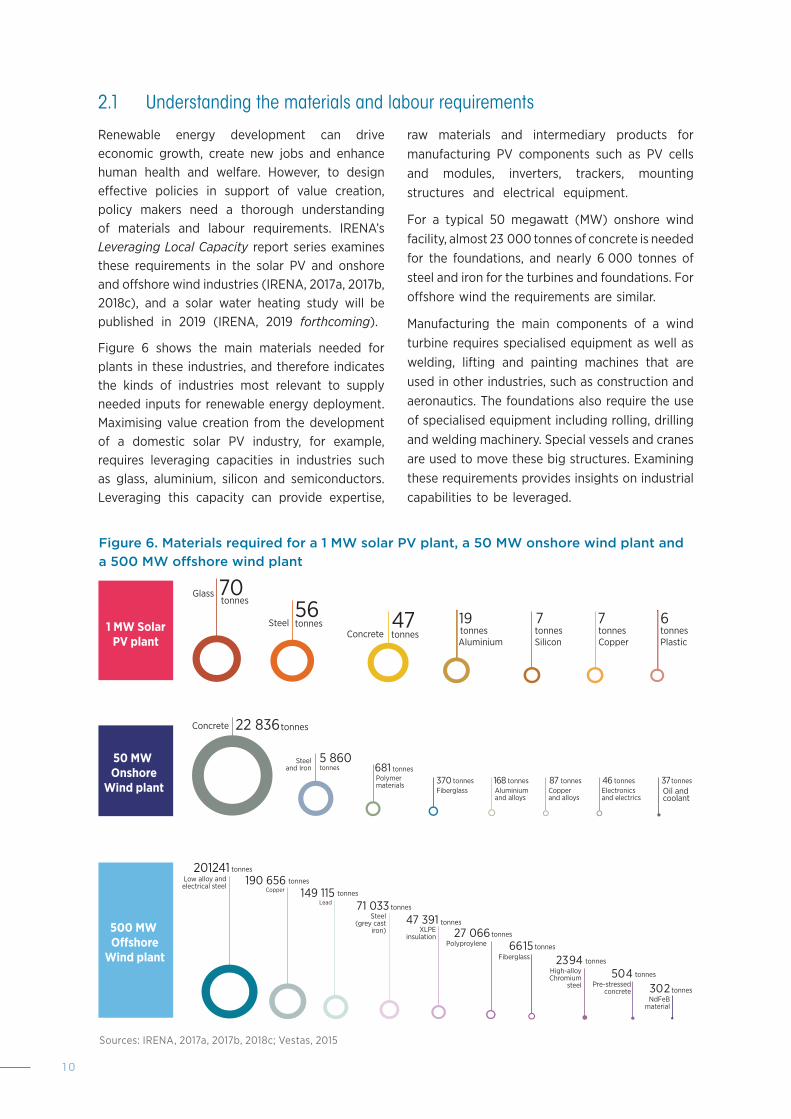
Figure 6 shows the main materials needed for plants in these industries, and therefore indicates the kinds of industries most relevant to supply needed inputs for renewable energy deployment. Maximising value creation from the development of a domestic solar PV industry, for example, requires leveraging capacities in industries such as glass, aluminium, silicon and semiconductors. Leveraging this capacity can provide expertise,
raw materials and intermediary products for manufacturing PV components such as PV cells and modules, inverters, trackers, mounting structures and electrical equipment.
For a typical 50 megawatt (MW) onshore wind facility, almost 23 000 tonnes of concrete is needed for the foundations, and nearly 6 000 tonnes of steel and iron for the turbines and foundations. For offshore wind the requirements are similar.
Manufacturing the main components of a wind turbine requires specialised equipment as well as welding, lifting and painting machines that are used in other industries, such as construction and aeronautics. The foundations also require the use of specialised equipment including rolling, drilling and welding machinery. Special vessels and cranes are used to move these big structures. Examining these requirements provides insights on industrial capabilities to be leveraged.
2.1 Understanding the materials and labour requirements
Figure 6. Materials required for a 1 MW solar PV plant, a 50 MW onshore wind plant and a 500 MW offshore wind plant
Sources: IRENA, 2017a, 2017b, 2018c; Vestas, 2015
50 MW Onshore
Wind plant
500 MW O shore
Wind plant
70Glasstonnes 56
Steel tonnes 47Concrete tonnes
19tonnesAluminium
7tonnesSilicon
7tonnesCopper
6tonnesPlastic
22 836Concrete tonnes
5 860tonnes
Steeland Iron 681 tonnes
Polymermaterials 370 tonnes
Fiberglasstonnes168
Aluminiumand alloys
87 tonnesCopperand alloys
46 tonnesElectronicsand electrics
37tonnesOil andcoolant
201241 tonnesLow alloy and electrical steel 190 656 tonnes
Copper 149 115 tonnesLead 71 033 tonnes
Steel (grey cast
iron)47 391 tonnes
XLPEinsulation 27 066 tonnes
Polyproylene 66 15 tonnesFiberglass 23 94 tonnes
High-alloyChromium
steel50 4 tonnes
Pre-stressedconcrete 30 2 tonnes
NdFeBmaterial
1 MW SolarPV plant
10

The Leveraging Local Capacity report series also generates valuable information for policy makers on the occupational and skill structure along the value chain. Figure 7 shows the labour requirement for solar PV plants and onshore and offshore wind farms.
For the development of a typical 50 MW solar PV project, a total of around 230 000 person-days is required from project planning to manufacturing, installing, operating and maintaining (O&M) as well as decommissioning. The highest labour requirements are in O&M (56%), followed by procurement and manufacturing (22%) and construction and installation (17%). In the procurement and manufacturing segment, factory workers and technicians represent 64% of the labour, followed by engineers (12%). In the O&M segment, construction workers account for
48% of the labour requirements, followed by safety experts (19%) and engineers (15%).
Similarly, for the development of a 50 MW onshore wind project, a total of 144 000 person-days is needed. The labour requirements are highest in O&M (43% of the total), followed by construction and installation (30%) and manufacturing (17%).
For offshore wind, the majority of the labour requirements (totalling 2.1 million person-days for a 500 MW farm) are found in the manufacturing and procurement segment. Existing manufacturing facilities for onshore wind can serve the needs of the offshore sector, as many components are comparable. Significant synergies also exist between the offshore oil and gas industry and the offshore wind sector.
Figure 7. Distribution of human resources and occupational requirements along the value chain (50 MW PV project, 50 MW onshore wind, 500 MW offshore wind)
Sources: IRENA, 2017a, 2017b, 2018c.
Project Planning 2%
Project Planning 1 %
229 055 person-days50 MW solar PV:
144 420 person-days50 MW onshore wind:
2.1 million person-days500 MW o�shore wind:
Project Planning 1% 22% 17%56%
2%
7%
5%
Procurement Manufacturing Transport Installation GridConnection
Operation andMaintenance
Decommis-sioning
17 % 30%
11 %59%
2%
1 %
1 %
43%
24%
11

Figure 8. Employment in the overall energy sector, 2016, 2030 and 2050
Note: T&D = Transport and distribution; RES = Renewable energy sources.
Source: IRENA, 2018b.
These analyses provide an understanding of the requirements of selected transition-related technologies. The depth and quality of domestic supply chains determine a country’s ability to meet these requirements and to reap the benefits of the energy transition. Macroeconomic indicators help measure the strength and depth of domestic supply chains.
With the help of industrial policies, countries will be able to derive significant employment benefits during the energy transition. IRENA’s analysis suggests that under the REmap Case, a total of 76.5 million energy sector jobs will be
in existence by 2050 (see Figure 8), a net gain of 11 million jobs compared to the Reference Case, with additional positive net impacts on economy-wide employment. The energy sector experiences not only significant overall job gains, but also job shifts. Today it employs about 40 million people worldwide, of which one-quarter work in renewable energy. Employment in renewables could expand to 28.8 million people by 2050. Together with energy efficiency and grid enhancement, non-fossil fuel energy would account for about 70% of all energy jobs in 2050, or over 54 million people.
Following the analysis of materials and labour requirements, making the most of this potential requires efforts to ensure that domestic supply
chains are as closely aligned with the energy transition needs as possible. Section 2.2 discusses this further.
Million jobs
Grid Enhancement**
100
68.2
40.5
85.5
64.876.580
80
40
20
0
Energy E�ciencyRenewablesFossil Fuels***Nuclear
Figure 8 Employment in the overall energy sector, 2016, 2030 and 2050
10.0
11.6
11.8
16.1
16.2
12.59.8
28.7
23.6
25.3
23.9 28.8 21.4
28.814.9
8.59.4
300.7 0.70.8 0.8 0.8
2016 - Estimate* 2030
CaseReference
2050
CaseReference
2030
CaseREmap
2050
CaseREmap
* Estimates for jobs in energy e�ciency and grid enhancement are not available for 2016.
** The jobs in grid enhancement make reference to the jobs for T&D grids and Energy Flexibility, Created in the development, operation and maintenance of infrastructure to enable the integration of RES into the grid.
*** Includes all jobs in the fossil fuel industry including in their extraction, processing and consumption.
12
IRENA’s socio-economic footprint analysis presented in the report Global energy transformation: A view to 2050 (IRENA, 2018b) shows that domestic supply chains play a key role in the long-term growth of the economy. A higher domestic share of renewable energy equipment manufacturing supports sustainable growth more readily than an economy that relies on imports to meet the increasing demand for renewables technologies.
To build on this finding, IRENA carried out a quantitative assessment of the strength and depth of local supply chains via macroeconomic indicators for all REmap transition technologies, and for three specific transition technologies (onshore wind, solar PV and concentrated solar power (CSP)) in 2035, the mid-point in the transition period analysed.
The supply chain indicator for all transition technologies, and its value relative to the indicator for the entire economy, is a measure of the economy’s overall alignment with the REmap transition pathway. It is defined as the ratio of total direct and indirect activity in the domestic economy triggered by a given investment relative to that investment.
The result is effectively a set of multipliers, as shown in Figure 9. Several conclusions can be drawn from the analysis:
» While the overall indictors do not vary strongly among the countries shown, significant differences exist among the national multipliers for all transition-related technologies and individual renewable energy technologies. These differences reflect varying depths and capabilities of relevant domestic supply chains.
» The resulting values are higher for China than for the other selected countries / regions. For example, spending USD 1.0 on all types of transition technologies in China is likely to produce an economic multiplier of more than USD 1.6. This reflects the comparatively greater supply chain depth of the Chinese economy and its closer alignment with the needs of the REmap transition case.
» Solar technologies (both PV and CSP) in India stand out as having low supply chain indicators that are not well aligned with the wider national supply chain. Since India’s solar potential is high and solar technologies are expected to play a significant role in India’s energy transition, industrial policies designed to reinforce the domestic supply chains associated with these technologies may be appropriate.
2.2 Aligning domestic supply chains to energy transition needs
13

Figure 9. Supply chain indicator for entire economy, by selected region and technology
Note: Results correspond to the year 2035, the mid-point in the transition. “All transition technologies” refers to those identified in the REmap transition roadmap.
Africa OPEC = Algeria, Angola, Libya, Nigeria; CSP = concentrated solar power; OPEC = Organization of the Petroleum Exporting Countries; PV = photovoltaic
Source: IRENA.
The analysis highlights divergences among national economies in terms of how well they are at present aligned with transition needs and therefore prepared to take advantage of emerging opportunities along the renewable energy supply chain. The degree to which
national economies rely on imported versus domestically-produced inputs is a key aspect. The following section briefly analyses the potential for additional socio-economic gains that greater localisation might bring, examining two different sets of assumptions on trade.
Supp
ly c
hain
indi
cato
r
Western Europe
Overall economy All transition technologies (REmap) Onshore wind PV CSP
China India Africa OPEC RussianFederation
1.8
1.6
1.4
1.2
1.0
0.80.6
0.4
0.2
0.0
14

If the energy transition in a given country is dependent on imports because local industries have not had a chance to develop sufficiently and become competitive, industrial policies may be considered to promote local value creation. To gauge the potential impact of such policies on the transition’s socio-economic footprint, this section presents a preview of a localisation sensitivity analysis of the REmap roadmap.
Localisation processes will inevitably generate relative winners and losers, an outcome triggered by shifts in trade. One country’s imports are another’s exports. But with appropriate policies, overall gains will significantly outweigh losses.4
A key question is where it makes strategic sense to apply industrial policy to protect and nurture local industry, so that the transition delivers net benefits not only to individual countries but also to the wider regions of which they are part.
Conceptually, two groups of target countries / regions could be expected to apply industrial policy to transition technologies:
• Developing countries / regions dependent on imports5 of transition equipment and of goods and services in other areas. Industrial policies that are addressed to transition technologies can be expected to shore up industrial capacity more broadly because of the general strengthening of domestic supply chains.
• For regions with economies dependent on fossil fuels, the challenge is to facilitate the substitution of a fossil fuel-based industrial structure with one that is capable of supporting the energy transition. This implies adjusting existing assets where possible and re-orienting future technological and economic development.
The econometric modelling for the transition pathway assumes that current renewable energy equipment trade structures remain intact – that
is, import dependencies remain unchanged and countries do not seek to expand their domestic production of required inputs. The sensitivity analysis adjusts the trade dynamics to model two additional cases:
» a “full localisation” case under which imports are fully substituted and
» a “full imports” case that assumes no additional domestic production.
This analysis is carried out for selected areas falling into either of the two categories of countries described above. They are South Africa; the “Rest of Africa” grouped together; Latin America except for Argentina, Brazil and Mexico; India; and the Russian Federation.
In the full localisation sensitivity test, all additional investment demand related to energy efficiency, grid flexibility and renewables-based power generation equipment is met entirely by domestic production. In the full imports test, additional investment demand in the transition is met by imports, except in construction and distribution, which are met domestically.
Results for specific countries or regions vary depending on their existing domestic capabilities and supply chains. Figure 10 presents the results of the trade sensitivity analysis for GDP (left panel) and employment (right panel) measured relative to the REmap Reference Case. The individual bars show the difference in outcomes between the full localisation and full import cases. Thus, for example, India could add nearly 2% to its 2030 GDP if it moved from full imports to full localisation.
The point of the analytical exercise is not to propagate such a complete switch – which may be impossible to effect in the real world – but rather to indicate the potential economic gains that can be realised by moving in the direction of deeper domestic supply chains.
2.3 Trade sensitivity analysis
4 Also, losses may be relative in nature, i.e., an economic activity may not increase as much under one scenario as it might have under another. Where losses are absolute, however, careful attention is required to ameliorative measures.
5 UN COMTRADE has been used to identify net importers: detailed HS-6 (Harmonized Commodity Description and Coding Systems) codes were used to focus calculations on key components of renewable equipment. While some Global North regions are net importers of transition technologies in COMTRADE data, the sensitivity assumes that these regions will continue to trade under business-as-usual. 15

Figure 10. Percentage change in GDP and employment in moving from full imports to full localisation (relative to the Reference Case), 2030 and 2050
* Latin America except for Brazil, Argentina and Mexico
Note: GDP = gross domestic product.
Source: IRENA.
Several conclusions can be drawn from these results:
• GDP. Five of the selected regions / countries experience significant increases in GDP between the full localisation and full imports sensitivity tests. Meanwhile, China and Western Europe, which are current exporters of transition-related equipment, would experience a reduction in their GDP relative to a business-as-usual situation. However, the relative improvement in the countries that fare better is higher than the relative reduction in currently exporting countries, because the latter have more diversified supply chains, and exports represent a lower share of their overall economic activity.
• Employment. The results are similar, although the changes are less marked than they are for GDP. This reflects the fact that increased production of transition-related equipment in the areas that benefit under the full localisation scenario is met through
a combination of increased employment and growth in productivity (achieved through economies of scale). The subset of areas that benefit from the full localisation scenario is similar in terms of both GDP and employment, although the ranking of regions varies somewhat, reflecting differences in starting levels of labour productivity (the lower productivity is in the relevant manufacturing sectors, the larger the increase in employment would be expected to be).
The analysis in Chapter 2 indicates the different steps needed to understand the materials and labour requirements for building a renewable energy supply chain, align domestic capacities with these needs, and build awareness of the opportunities inherent in strengthening and deepening supply chains. Chapter 3 considers the types of policies that can help to translate potential socio-economic benefits into reality and address any adjustments needs.
E�ect of localisation on GDP E�ect of localisation on employment
Perc
enta
ge c
hang
e in
GD
P
Perc
enta
ge c
hang
e in
em
ploy
men
t
2.0% %
1.5
1.0
0.5
0.0
-0.5
-1.0
0.25
0.20
0.15
0.10
0.05
0.00
-0.05
-0.10-0.15
Sout
h Afri
caRes
t of A
frica
Rest o
f
Latin
Amer
ica*
India
Russia
n Fed
eratio
n
China
Wes
tern E
urope
Sout
h Afri
caRes
t of A
frica
Rest o
f
Latin
Amer
ica*
India
Russia
n Fed
eratio
n
China
Wes
tern E
urope
2030 2050 2030 2050
16

IRENA’s work has shown that despite global-level net benefits flowing from the energy transition (IRENA, 2018b), not all countries and regions around the world benefit equally – and some, especially the most fossil fuel-dependent areas and those with weak supply chains, face the need for economic adjustment strategies.
A key question concerns the types of policies that are needed so that all countries and regions can share the benefits. IRENA’s socio-economic footprint analysis indicates that industrial capacities, trade structures and the depth and diversity of domestic supply chains are critical elements that determine
the degree to which a given economy can take advantage of transition opportunities. Energy sector-specific policies, enabling and supporting the deployment of capacities, are needed along with broader policies that enhance the technical strengths and structural capacities of an economy (see Box 1).
This chapter first discusses ways to facilitate productive interactions between the energy sector and the overall economy (section 3.1). It then considers measures to help re-orient fossil fuel-dependent economies (section 3.2), and finally examines elements of a successful industrial policy framework (section 3.3).
3. Designing effective policies to maximise transition benefits
Considerable efforts are required to scale-up the deployment of renewable energy - together with energy efficiency - to advance the energy transition and meet climate objectives. To this end, a combination of policy measures is needed focusing on direct support (deployment), integration and enabling environment.
Direct policies and instruments, used to support the development and deployment of renewable energy technologies and products, are typically classified as push, pull, and fiscal and financial. Push policies mandate certain actions such as electricity quotas or the use of solar water heaters or biofuels mandates. Pull policies incentivise certain actions, e.g., through pricing or regulation and fiscal and financial policies and instruments include tax incentives, grants, and subsidies.
Integrating policies incorporate the use of renewables and energy efficiency in the heating and cooling, transport, and power sub-sectors into the larger energy and economic system and
into consumers’ daily lives. They include policies to ensure the development of the infrastructure needed (e.g., transmission and distribution networks, charging stations for electric vehicles, district heating infrastructure); enhance system flexibility; promote sector coupling and to support research, development and demonstration.
Enabling policies include policies that issue clear signals to stakeholders, level the playing field for renewables (e.g., fossil fuel subsidy reforms), manage land use, ensure the reliability of technology, facilitate access to affordable financing at multiple levels and support labour-market needs (through direct measures and through education and training). The development of a local industry can be supported through industrial and trade policies. Finally, renewables can be supported through environmental and climate policies and regulations.
Source: IRENA, IEA and REN21 (2018).
BOX 1. OVERVIEW OF POLICIES NEEDED TO ADVANCE THE ENERGY TRANSITION
17
3.1 Facilitating productive interactions between the energy sector and the economy at largeSeveral interactions between the energy sector and the broader economy determine the outcomes of the energy transition with regard to GDP, employment and overall human welfare.
The first set of interactions determines how the energy transition is planned and implemented. Technical, administrative and managerial skills are essential for developing, using and adapting transition-related technologies. In countries where industry is under-developed, these kinds of capabilities are more likely than not to be absent, and this poses an important challenge to leverage energy transition gains.
The second set of interactions that determine sustainable energy transitions are longer-term feedback loops between energy and broader economic and social welfare. These dictate how greater access to energy creates the kind of broad industry capacity that is necessary for raising productivity and ensuring competitiveness. The design of strategic collaboration and co-ordination among the government, the private sector (especially local firms) and other domestic stakeholders is critically important. If done right, it will mobilise domestic investment needed for the energy transition and promote economy-wide spillovers that allow the emergence of viable supply chains.
However, such goals are not easy to achieve and require steady policy oversight and careful efforts to nurture local capabilities in innovation and manufacturing excellence (Rodrik, 2014). In the absence of a strategic industrial policy framework and capable institutions that can guide and co-ordinate these interactions, the benefits of the energy transition may materialise only partially or perhaps not at all.
The ability to expand renewable energy capabilities in a timely manner and to build underlying industrial capacities hinges to a significant degree on targeted education and skill-training programmes. It also requires a careful alignment of educational institutions and programmes with localising efforts in the renewable energy sector. The lack of such efforts can limit a country’s ability to take full advantage of emerging opportunities in the energy transition.
Countries in which existing natural and technical
resources are limited, or where domestic markets are too small for a viable localisation strategy, may be able to succeed through co-ordinated efforts with like-minded neighbouring countries. Within a given region some countries may emerge as renewable energy leaders on their own, but if others lag too far behind, diverging trajectories can constitute a drag on a dynamic transition process. Adjacent or like-minded countries can, however, join forces and develop collaborations (such as ECOWAS Centre for Renewable Energy and Energy Efficiency) under which each country might contribute innovations in different segments of the value chain for shared advancement. Clear government targets are indispensable for such virtuous outcomes.
3.2 Reorienting fossil fuel-dependent economiesAn important part of the energy transition process relates to notions of what is socially and economically just. The “just transition” discussion is still in its early stages; individual countries and regions and various stakeholders have different and sometimes competing perceptions of its goals and what measures it should entail. However, any such policy not only needs to accentuate the socio-economic gains derived from the expansion of renewable energy, but also to encompass efforts to minimise the adjustment burdens on regions and communities dependent on fossil fuels.
Whether it concerns positive or potentially negative aspects, a just transition policy is principally concerned with reducing diverging outcomes. It will thus seek to pursue structural change in a variety of ways:
» Identify suitable local economic capacities and ways to leverage them in support of renewable energy development;
» Project evolving skills needs in the renewable energy sector and match them with available skills in the local economy;
» Align, to the extent feasible, relevant expertise and skills from the fossil fuel sector with the needs of the renewable energy sector, such as using offshore oil and gas industry expertise in offshore wind development;
» Pursue pro-active planning and investments to drive economic diversification in support of the energy transition;
18
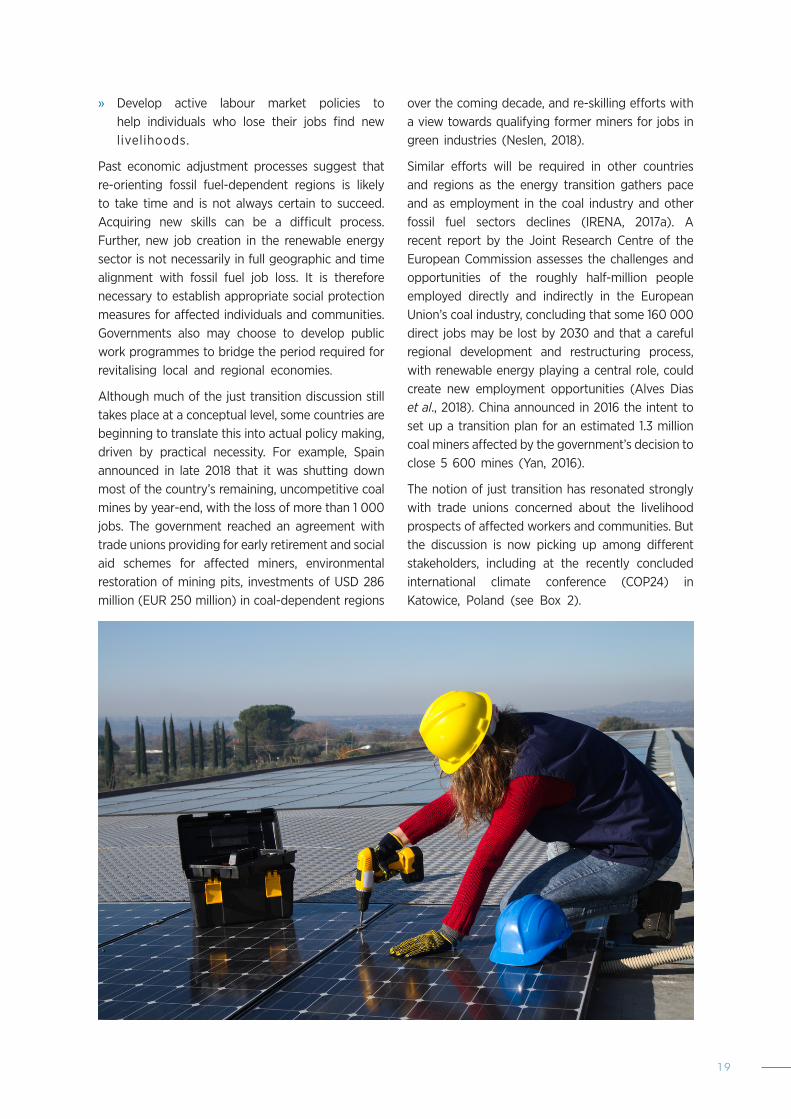
» Develop active labour market policies to help individuals who lose their jobs find new livelihoods.
Past economic adjustment processes suggest that re-orienting fossil fuel-dependent regions is likely to take time and is not always certain to succeed. Acquiring new skills can be a difficult process. Further, new job creation in the renewable energy sector is not necessarily in full geographic and time alignment with fossil fuel job loss. It is therefore necessary to establish appropriate social protection measures for affected individuals and communities. Governments also may choose to develop public work programmes to bridge the period required for revitalising local and regional economies.
Although much of the just transition discussion still takes place at a conceptual level, some countries are beginning to translate this into actual policy making, driven by practical necessity. For example, Spain announced in late 2018 that it was shutting down most of the country’s remaining, uncompetitive coal mines by year-end, with the loss of more than 1 000 jobs. The government reached an agreement with trade unions providing for early retirement and social aid schemes for affected miners, environmental restoration of mining pits, investments of USD 286 million (EUR 250 million) in coal-dependent regions
over the coming decade, and re-skilling efforts with a view towards qualifying former miners for jobs in green industries (Neslen, 2018).
Similar efforts will be required in other countries and regions as the energy transition gathers pace and as employment in the coal industry and other fossil fuel sectors declines (IRENA, 2017a). A recent report by the Joint Research Centre of the European Commission assesses the challenges and opportunities of the roughly half-million people employed directly and indirectly in the European Union’s coal industry, concluding that some 160 000 direct jobs may be lost by 2030 and that a careful regional development and restructuring process, with renewable energy playing a central role, could create new employment opportunities (Alves Dias et al., 2018). China announced in 2016 the intent to set up a transition plan for an estimated 1.3 million coal miners affected by the government’s decision to close 5 600 mines (Yan, 2016).
The notion of just transition has resonated strongly with trade unions concerned about the livelihood prospects of affected workers and communities. But the discussion is now picking up among different stakeholders, including at the recently concluded international climate conference (COP24) in Katowice, Poland (see Box 2).
19

Transition policies need to accentuate the positive (i.e., the opportunities inherent in expanding renewables) while minimising the potentially negative (i.e., the repercussions for fossil fuel-dependent areas). Common to both tasks is the importance of a robust industrial policy framework.
3.3 Creating a successful industrial policy framework for renewable energy and a broader socio-economic transformationStrengthening domestic industrial capacities of relevance to the energy sector needs to be an intrinsic part of the energy transition process. The significant strides made by countries such as Brazil, China and India lend credence to the role of policy making in fostering such capacities7. Practices such as reverse engineering, incremental learning, and prototyping have helped to build manufacturing competence (Chang, 2008). A few important guidelines emerge
from the successful experiences of these countries with regard to promoting domestic manufacturing capacity of relevance to the energy transition:
• Grant incentives to clearly identified activities that can promote maximum spillovers and help the emergence of capacities relevant to the energy sector.
• Make incentives conditional on performance, with clear deadlines and targets for firms and the discontinuation of incentives when firms do not perform. In other words, incentives should be more geared towards letting losers go, rather than picking winners (Rodrik, 2009), because weeding out the non-performers is as important as incentivising good projects.
• Review incentives periodically because the circumstances that lead to improved performance of firms and sectors are different for each country.
At the 24th Conference of the Parties (COP24) to the United Nations Framework Convention on Climate Change in Katowice, Poland in 2018, more than 50 governments adopted the “Solidarity and Just Transition Silesia Declaration” (COP24 Katowice, 2018). The statement acknowledges that “addressing climate change requires a paradigm shift towards building a low greenhouse gas emission and climate resilient economies and societies for all that offers substantial opportunities and ensures continued high growth and sustainable development....” It also recommends that the transition towards a low-carbon future should consider “the imperatives of a just transition of the workforce and the creation of decent work and quality jobs”. The statement also emphasises the intrinsic relationship between climate change action and equitable access to sustainable development and poverty eradication.
A just transition is about capturing these complexities of the necessary transition towards a low-carbon and climate-resilient economy, highlighting public policy needs and aiming to maximise benefits and minimise risks for workers and local communities in this transformation (Popp
et al., 2018). It should recognise the specific needs and unique circumstances of developing countries, people living in poverty and regions / cities that have long relied on fossil fuels for economic growth.
The adoption of this Declaration has given this issue much-warranted political support. With the aim of gaining high-level consensus on the need to tackle social, economic and environmental problems in an integrated manner, the Declaration stresses the following elements:
a. Just transition of the workforce and the creation of decent work and quality jobs to ensure an effective and inclusive transition;
b. Climate-resilient infrastructures and employment opportunities;
c. The role of a participatory and representative process to promote high employment rates, adequate social protection, labour standards and well-being of workers;
d. The need to ensure that the planning and implementation of national climate goals are in line with United Nations sustainable development goals and the creation of decent work and quality jobs.
BOX 2. DECLARATION OF SOLIDARITY AND JUST TRANSITION
7 Bhat (2015: 426) notes that between 2001 and 2010 the growth rate of exports of renewable energy technology-related products in the BRICS countries (Brazil, the Russian Federation, India, China and South Africa) was about four times more than the global growth rate of exports of renewable energy technology-related goods, while imports grew about two-and-a-half times more than those of the world.
20
• Co-ordinate incentives more broadly with the longer-term goals of the industrial strategy to see whether local capacity is emerging in the energy sector as expected, and whether the broader institutional support system is requisite.
Beyond incentives that target infant industries to generate spillovers for learning and innovation within the energy sector, a wider industrial policy framework can promote the science and technology capacity of domestic actors more broadly, generate demand for local products through instruments such as government procurement, promote investment and stimulate exports (see Cimoli et al., 2009). South Africa has developed provisions in its solar PV auctions to encourage sourcing of a portion of inputs from local sources.
Critical components of such a wider framework (Andrioni and Chang, 2016) include:
1) Research, education and training. Ensuring an adequately trained and skilled workforce is an indispensable component of an industrial policy strategy of the sort discussed in this brief. Human talent needs to be nurtured for continued research and innovation in renewable energy technologies, as well as for producing needed inputs of goods and services along the value chain. To meet human resource requirements, education and training policies need to consider the occupational and skills patterns in industries such as solar PV and wind (IRENA, 2017a, 2017b, 2018c).
Prospects for local employment improve to the extent that the provision of education and training / re-training sufficiently matches evolving skills needs. Governments can play a role in co-ordinating the needs and offerings of the renewable energy industry and the education sector, promoting university-industry collaboration and strengthening science education. In Malaysia, the ministries of finance, higher education and human resources have been tasked with co-ordination efforts under the country’s National Renewable Energy Policy and Action Plan.
2) Energy policies with renewable energy components and targets. Industrial policy should have an integrated, long-term strategy for promoting renewable energy. The level of national ambition towards the energy transition sets the overall pace for the deployment of renewable energy technologies. Targets are most effective when accompanied by deployment policies
– entailing feed-in tariffs, premium policies, auctions and other measures – that are tailored to specific country conditions and objectives and that provide a stable and predictable environment for attracting investments. The right mix of enabling and integrating policies depends on the particular circumstances (IRENA, IEA and REN21, 2018). The mix includes the provision of preferential access to credit, the establishment of economic incubators and industry clusters, and industrial policy to build or strengthen existing capacities. Such measures include industrial upgrading programmes, supplier development programmes, promotion of joint ventures and investment promotion schemes.
3) Dedicated renewable energy transition institutions. The successful development and deployment of any sector, especially a relatively new one such as renewable energy, needs dedicated institutions covering the different technical, economic and market commercialisation aspects. Such institutions can help “tip the balance” in favour of renewables. Incentives in this context can include those for production and innovation, similar to those offered in several other sectors, such as public research grants, funding schemes, establishment of green or renewable technology clusters and special green economic zones to promote production and collaboration, green public-private partnerships and collaborative technology development partnerships, among others.
4) Employment and social welfare. Policy makers can ensure that transition benefits extend to the majority of people by investing in economic diversification, pursuing a variety of labour market measures, establishing or strengthening labour standards, and adopting a variety of adjustment and social protection measures targeted at people and communities confronting adjustment challenges.
The types of policies sketched here – integrating measures relating to the energy sector with broader economy considerations, strengthening domestic supply chain capabilities, reorienting fossil fuel-dependent regions, and creating a comprehensive industrial policy framework with strong institutions – allow countries to make the most of the momentous energy transition that is unfolding now and over the next few decades. Taking such measures will turn the challenges presented by the energy transition into an opportunity for substantial socio-economic gains.
21

Alves Dias, P. et al. (2018), EU coal regions: Opportunities and challenges ahead, Joint Research Centre, European Commission, Publications Office of the European Union, Luxembourg.
Andreoni, A. and Chang, H-J. (2016), Industrial Policy and the future of manufacturing. Econ Polit Ind (2016) 43:491–502 DOI 10.1007/s40812-016-0057-2
Bhat, V. (2015), Trade and investment in renewable energy technologies: A Study of BRICs. In: Reddy, S. and Ulgiati, S. (eds). Energy security and development: The global context and Indian perspectives. Springer Verlag. 423-436.
Chang, H.-J. (2008), Bad samaritans: The myth of free trade and the secret history of capitalism, Bloomsbury Press, London.
Cimoli, M. et al. (2006), Institutions and policies shaping industrial development: an introductory note. Working Paper Series. Sant’Anna School of Advanced Studies. Pisa, Italy.
COP24 Katowice (2018), Solidarity and just transition Silesia declaration, https://cop24.gov.pl/fileadmin/user_upload/files/Solidarity_and_Just_Transition_Silesia_Declaration.pdf.
IEA (International Energy Agency) and IRENA (International Renewable Energy Agency) (2017), Perspectives for the energy transition: Investment needs for a low-carbon energy system, IEA and IRENA, Abu Dhabi.
IRENA (2019 forthcoming), Renewable energy benefits: Leveraging local capacity for solar water heaters, IRENA, Abu Dhabi.
IRENA (2018a), Renewable energy and jobs – Annual review 2018, IRENA, Abu Dhabi.
IRENA (2018b), Global energy transformation: A roadmap to 2050, IRENA, Abu Dhabi.
IRENA (2018c), Renewable energy benefits: Leveraging local capacity for offshore wind, IRENA, Abu Dhabi.
IRENA (2017a), Renewable energy benefits: Leveraging local capacity for solar PV, IRENA and Lawrence Berkeley National Laboratory (LBNL), Abu Dhabi.
IRENA (2017b), Renewable energy benefits: Leveraging local capacity for onshore wind, IRENA, Abu Dhabi.
IRENA (2016), Renewable energy benefits: Measuring the economics, IRENA, Abu Dhabi.
IRENA, IEA and REN21 (2018), Renewable energy policies in a time of transition, IRENA, Abu Dhabi.
Neslen, A. (2018), “Spain to close most coalmines in €250m transition deal”, The Guardian, 26 October.
Popp, R., de Pous, P. and Gavanta, J. (2018), How to ensure a just and fast transition to a competitive low-carbon economy for the EU?, Institute for European Environmental Policy, Brussels.
Rodrick, D. (2014), “Green industrial policy”, Oxford Review of Economic Policy, Volume 30, Number 3, 2014, pp. 469–491.
Rodrick, D. (2008), “Industrial policy: Don’t ask why, ask how”, Middle East Development Journal , 1:1, 1-29, DOI: 10.1142/S1793812009000024.
UNECA (United Nations Economic Commission for Africa) (2016), Transformative industrial policy for Africa, UNECA, Addis Ababa, Ethiopia.
Yan, S. (2016), “China plans to cut 1.8 million coal and steel jobs,” CNN Money, 29 February.
References
22

23
www.irena.org
© IRENA 2019