measuring the pmi modeling capability in cad systems: … · • sb1341-12-se-0853, international...
TRANSCRIPT

NIST GCR 15-998
Measuring the PMI Modeling Capability in CAD Systems: Report 2 - Combined Test Case Validation
Douglas C. Cheney International TechneGroup Inc.
Bryan R. Fischer Advanced Dimensional Management LLC
This publication is available free of charge from: http://dx.doi.org/10.6028/NIST.GCR.15-998

NIST GCR 15-998
Measuring the PMI Modeling Capability in CAD Systems: Report 2 - Combined Test Case Validation
Prepared for U.S. Department of Commerce
Engineering Laboratory National Institute of Standards and Technology
Gaithersburg, MD 20899
By Douglas C. Cheney
International TechneGroup Inc.
Bryan R. Fischer Advanced Dimensional Management LLC
This publication is available free of charge from: http://dx.doi.org/10.6028/NIST.GCR.15-998
October 2015
U.S. Department of Commerce Penny Pritzker, Secretary
National Institute of Standards and Technology
Willie May, Under Secretary of Commerce for Standards and Technology and Director

i
Preface The National Institute of Standards and `Technology (NIST) has created a test system to measure conformance of Computer-Aided Design (CAD) software to American Society of Mechanical Engineers (ASME) standards for product and manufacturing information (PMI), specifically geometric dimensioning and tolerancing (GD&T) information. The test system has three main components: test cases, test CAD models, and verification and validation test results. The verification and validation results measure PMI implementation capabilities in CAD software and derivative STEP, JT, and 3D PDF files. All of the test cases, test models, test results, and other presentations are available from the project website: http://www.nist.gov/el/msid/infotest/mbe-pmi-validation.cfm This report is the second of three reports about the test system. The reports can be read independently of each other. • Measuring the PMI Modeling Capability in CAD Systems: Report 1 - Combined Test Case Verification • Measuring the PMI Modeling Capability in CAD Systems: Report 2 - Test Case Validation • Measuring the PMI Modeling Capability in CAD Systems: Report 3 - Fully-Toleranced Test Case Verification Disclaimers The reports were prepared for the Engineering Laboratory of the National Institute of Standards and Technology under the following contracts: • SB1341-12-SE-0860, RECON Services Inc., “PMI Conformance Testing Models” • SB1341-12-SE-0853, International TechneGroup Inc., “PMI and Composite Information Validation
and Conformance Testing” • SB1341-14-SE-0061, International TechneGroup Inc., “PMI Test Cases and Models, Validation and
Conformance Testing” The contents of the reports do not necessarily reflect the views of NIST. NIST and the authors do not make any warranty, expressed or implied, nor assume any legal liability or responsibility for the accuracy, completeness, or usefulness of any information, product, or process included in the reports. Any mention of commercial products is for information purposes only; it does not imply recommendation or endorsement by NIST. The test system can be used without any restrictions. Its use in other software or hardware products does not imply a recommendation or endorsement by NIST of those products. Project Participants • International TechneGroup Inc. (ITI) - test model creation, expert review, verification, validation, and
documentation • Advanced Dimensional Management LLC - test case definition and expert review • RECON Services Inc., Neilsoft Ltd. - test model creation and expert review • Department of Energy Kansas City Plant (operated by Honeywell FM&T), RECON Services Inc.,
Sigmetrix - expert review Cover image: Combined test case

ii
Table of Contents
1 Introduction ........................................................................................................................................... 1
1.1 Model-Based Enterprise and Model-Based Definition .................................................................................. 1 1.2 MBD Verification and Validation ................................................................................................................. 2 1.3 PMI Representation and Presentation ............................................................................................................ 2 1.4 PMI Verification and Validation ................................................................................................................... 4
2 Methodology for PMI Modeling Capability Assessment ...................................................................... 6
2.1 Test Case Definition ...................................................................................................................................... 7 2.2 Test Model Creation ...................................................................................................................................... 9 2.3 Derivative File Creation................................................................................................................................. 9 2.4 Derivative File Validation ........................................................................................................................... 10
3 PMI Translation Capability Results ..................................................................................................... 11
3.1 PMI Representation and Presentation Issues ............................................................................................... 12 3.2 PMI Validation Results ................................................................................................................................ 13
4 Discussion ............................................................................................................................................ 21 5 References ........................................................................................................................................... 22 Appendix A: Test Model Images ............................................................................................................... 24 Appendix B: Representation Variation Examples ..................................................................................... 26 Appendix C: Presentation Variation Examples ......................................................................................... 35
List of Figures Figure 1: Methodology for PMI modeling capability assessment ................................................................ 6 Figure 2: Test case drawing – view 1 ........................................................................................................... 8 Figure 3: Test case drawing – view 2 ........................................................................................................... 8 Figure 4: Example of a representation variation issue ................................................................................ 12 Figure 5: Example of a presentation variation issue ................................................................................... 13 Figure 6: Annotation translation capability results by category and format ............................................... 14 Figure 7: Coordinate system translation capability results by category and format ................................... 15 Figure 8: Product geometry translation capability results by category and format .................................... 16 Figure 9: Supplemental geometry translation capability results by category and format ........................... 17 Figure 10: Model property translation capability results by category and format ...................................... 18 Figure 11: Saved view translation capability results by category and format ............................................ 19 List of Tables Table 1: Characteristics of PMI representation ............................................................................................ 3 Table 2: Characteristics of PMI presentation ............................................................................................... 3 Table 3: Test case PMI constructs ................................................................................................................ 7 Table 4: Model counts by CAD system and format ...................................................................................... 9 Table 5: PMI element counts by type, CAD system, and format ............................................................... 11 Table 6: Annotation validation percentages by category, characteristic and format .................................. 14 Table 7: Coordinate system validation percentages by category, characteristic and format ...................... 15 Table 8: Product geometry validation percentages by category, characteristic and format ........................ 16 Table 9: Supplemental geometry validation percentages by category, characteristic and format .............. 17 Table 10: Model property validation percentages by category, characteristic and format ......................... 18 Table 11: Saved view validation percentages by category, characteristic and format ................................ 19 Table 12: Validation non-issues .................................................................................................................. 20

1
1 Introduction A methodology for measuring the product and manufacturing information (PMI) modeling capability of computer-aided design (CAD) systems has been developed to measure technology readiness and to track progress as functionality gaps are closed. A measurement methodology will enhance the ability of discrete-part manufacturing companies to implement a model-based enterprise (MBE) [1-5]. The use of a clear capability assessment will accelerate MBE technology development by CAD software vendors. This can increase the business opportunities for both manufacturing companies and technology providers. Common practice in discrete-part manufacturing companies is to use CAD systems to create three-dimensional (3D) models that precisely define the shape of their products. The companies derive two-dimensional (2D) drawings from the 3D model that detail the product’s dimensions, tolerances, and other manufacturing information. Manufacturing organizations have typically considered the drawings to be the master product definition for all downstream processes such as simulation, manufacturing, and inspection. Often a 3D model is recreated from the drawing in one or more downstream processes, especially when performed by external suppliers. In some cases, the original 3D model is released with the drawing as a reference document [6]. As the drawing goes through several engineering changes, the 3D model may become outdated because it is not the master design document. Therefore, model recreation from the drawing tends to increase as a product matures. Downstream consumers of the drawing visually interpret the dimensions, tolerances, and other manufacturing information and manually reenter this information into downstream systems. Manually reentering information is a potentially error-prone process. This human interpretation is repeated for each engineering change. Global business requirements are driving companies to produce better and cheaper products in less time to market. Management initiatives target the reduction of risk due to variation and the elimination of all non-value-added tasks throughout the engineering, manufacturing, and sustainment phases of a product’s lifecycle. A leading process improvement initiative today is the concept of MBE [7].
1.1 Model-Based Enterprise and Model-Based Definition
A model-based enterprise (MBE) builds on the foundation that all product data may be integrated into a single model-based definition (MBD). This eliminates the need for 2D drawing generation, the recreation of 3D models, and/or the visual interpretation of drawing data in downstream processes. It improves product quality by eliminating drawing-to-model inconsistencies, unintentional model changes during recreation, and drawing interpretation errors. It decreases overall time to market by enabling direct reuse of the digital product model in downstream software systems. A key component of an MBD is the integration of all the product and manufacturing information (PMI) into the 3D model. Dimensions, tolerances, notes, and other data previously found on a drawing are displayed in the model with direct links to the affected portion of the model’s shape definition or 3D geometry. The data is grouped into multiple saved views to aid visual consumption. More importantly, the visual data is linked to an internal representation that is well defined and structured for automated consumption in downstream software systems. Derivative models, such as STEP (ISO 10303 –known informally as the STandard for Exchange of Product model data) [8-10], JT [11, 12] and 3D PDF [13] files, are created as needed for downstream consumers who do not have direct access to the CAD system in which the native MBD model is defined.

2
1.2 MBD Verification and Validation
In a drawing-based product lifecycle, the drawing is manually checked by a person before release and then visually interpreted by a person during downstream reuse. This results in processes that tolerate low-level variation in the digital data while being fairly controlled. In a model-based process, the checking task is often eliminated on the assumption that a precise native CAD model should be directly reusable in downstream systems without error. This results in processes that are less tolerant of digital data variation while being less controlled. However, if a company is going to rely on an MBD model throughout its product’s lifecycle, the model must be reliable. Therefore, quality checking of the geometry and PMI in the master model, and their equivalent entities in all derivatives, is critical before release to downstream processes. Various automotive, aerospace, and defense industry groups have identified precise geometry and PMI quality criteria for native MBD models and their derivatives. These include:
• Strategic Automotive Special Interest Group (SASIG) Product Data Quality (PDQ) team [14] • PDES, Inc. [15] and ProSTEP iViP [16] collaboration for Long-Term Archival (LOTAR) [17] • Department of Defense’s MBE team [1]
Each group has recently documented these requirements in international, regional, and domestic standards such as:
• Managed Model-based 3D Engineering - STEP ISO 10303-242 [18, 19] • CAD mechanical 3D Explicit geometry information - EN9300-110 [20] • DoD Standard Practice: Technical Data Packages - MIL-STD-31000A [21]
These groups generally agree that the process of quality checking a native CAD model should be called verification. The process verifies that the product definition data is complete, consistent, and conformant to relevant standards. They recommend that the process of determining whether the data in a derivative model is equivalent to the native CAD model should be called validation. The process validates that all data has been translated with any digital variation within acceptable limits specified by the anticipated downstream processes. Due to the complexity of MBD data, it is unrealistic to implement verification or validation using an interactive, manual process. Several CAD applications have been developed to automate verification and validation using the criteria referenced above. While these applications make MBD quality control feasible, they impose an important requirement on the CAD modeling systems: that all MBD data, including 3D geometry and PMI, must be accessible through an application programming interface (API) to third-party developers.
1.3 PMI Representation and Presentation
An MBD must contain sufficient PMI representation so that automated systems, such as machining and inspection, can reuse the information efficiently and correctly in all downstream processes. PMI representation (also known as semantic PMI) includes all information necessary to represent GD&T without any graphical presentation elements. The PMI presentation should also be clearly presented for visual (human) consumers so that they understand and trust the model-based definition. PMI presentation (also known as graphical PMI) consists of geometric elements such as lines and arcs preserving the exact appearance (color, shape, positioning) of the GD&T annotations. The internal PMI representation should be structured and defined so each element is clear, complete, and consistent. The PMI presentation

3
should be organized into saved views with annotations that support cross-highlighting of affected geometry. These two aspects of PMI, representation and presentation, are best understood by considering how their key characteristics are applied to the various components of an MBD. Table 1 and Table 2 list the characteristics of PMI representation and presentation, respectively. The following is an explanation how they apply to the product geometry, coordinate systems, supplemental geometry, annotations, and saved views in an MBD.
Table 1: Characteristics of PMI representation
Table 2: Characteristics of PMI presentation
MBD product geometry is structured to differentiate the geometric entities that define the 3D shape of the product from other entities used as reference, context, or supplemental geometry for annotations. For most discrete-part product models, a solid (closed volume) or shell (open surface) definition provides the highest level of definition for downstream processes. The parametric definition of the model is complete, correct, and useful for revisioning. The explicit definition of topology and geometry is free of defects that impede downstream reuse. The meta-data properties associated with the product model capture basic product management data, such as ownership and lifecycle state. The visibility status and display color of the product geometry are appropriate for visual interpretation by downstream users. MBD annotations have a specified type (dimension, feature control frame, note, etc.) and named parameters (nominal value, tolerance, material modifier, etc.) that facilitate automated interpretation downstream. An annotation’s associated geometry includes all affected surfaces in the product geometry and any supplemental geometry. It does not include any extraneous geometry. This facilitates both automated consumption and visual interpretation, also known as cross-highlighting. The visibility, layout, location, and orientation of the annotation in saved views, along with its color, display name, lines, and text, are appropriate for visual interpretation by downstream users. MBD coordinate systems have explicit named associations with the feature control frames that rely on the datum reference frames they represent. Each coordinate system’s location and orientation accurately represent the datum reference frame. The coordinate system’s visibility in each saved view corresponds

4
to the visibility of its associated annotations. Its color, name, and display text are appropriate for visual interpretation by downstream users. Supplemental geometry is geometric elements that do not belong to the shape of a part. The geometric elements are used to create other shapes or contain information about part features such as hole centerlines. MBD supplemental geometry entities have the correct form or structure for the annotations that references them. For example, the limited area for a datum target defines the portion of the underlying solid face or surface that is inside versus outside. The location, orientation, and size of each supplemental geometry entity complete the conceptual definition of its associated annotations. Its visibility in saved views corresponds to the visibility of its associated annotations. Supplemental geometry color is appropriate for visual interpretation by downstream users. A saved view facilitates the presentation of the model and associated PMI by defining a subset of the PMI and an orientation from which it is viewed. MBD saved views are structured to contain a related set of annotations, with their associated supplemental geometry and coordinate systems, along with the appropriate product geometry. Each saved view may contain the complete geometric definition of the product or a portion defined by a cross section. The contents of a saved view are displayed within a frustum, or pyramid of vision, that is intuitive for visual interpretation by downstream users.
1.4 PMI Verification and Validation
The process of querying PMI data in an MBD model for verification is straightforward as long as the CAD API provides sufficient access to the data. First, the type and properties of each annotation entity are retrieved and compared with those specified in the test case documentation. Second, any relationships between the annotation and other annotations or geometry entities are queried and compared with the specification. Since an MBD model may contain multiple annotations with similar types and properties, it may be necessary also to query the graphic presentation data in order to match reliably each annotation with its specification and to confirm its relationships are correct. The process of comparing PMI constructs between MBD models in dissimilar CAD systems for equivalence validation is more complex. The primary challenge is to correctly match corresponding annotation entities before comparing their characteristics. Because all of the presentation characteristics can vary significantly without changing their meaning or representation, these cannot be reliably used for matching purposes. The test model images in Appendix A illustrate the typical variation between the CAD systems used for this assessment. Reliable annotation matching requires that all product and supplemental geometry entities be matched. Then the subset of annotations entities associated with each set of matching geometry entities are matched and compared. Significant differences in the representation or presentation of matching annotations are reported. Annotations that have been added, removed, or had their geometry associations changed will remain unmatched. Some level of variation during translation is unavoidable, especially when the translator only accesses the PMI representation data in the native CAD model and therefore must reconstitute the presentation data. For validation to be useful, it must identify significant variation that affects downstream reuse (visual or automated) while ignoring negligible variation that does not. For the purposes of this assessment, variation in the following annotation characteristics was considered negligible:
• Text font type, size, and spacing, if readable • Layout • Leader line routing, if not intersecting any text • Arrowhead style, if well-formed

5
Annotation color was not considered negligible because it is sometimes used to encode meaning, such as its semantic validity. The name of an annotation was likewise not considered negligible because it is sometimes used to track inspection requirements in MBE systems outside the CAD model.
6
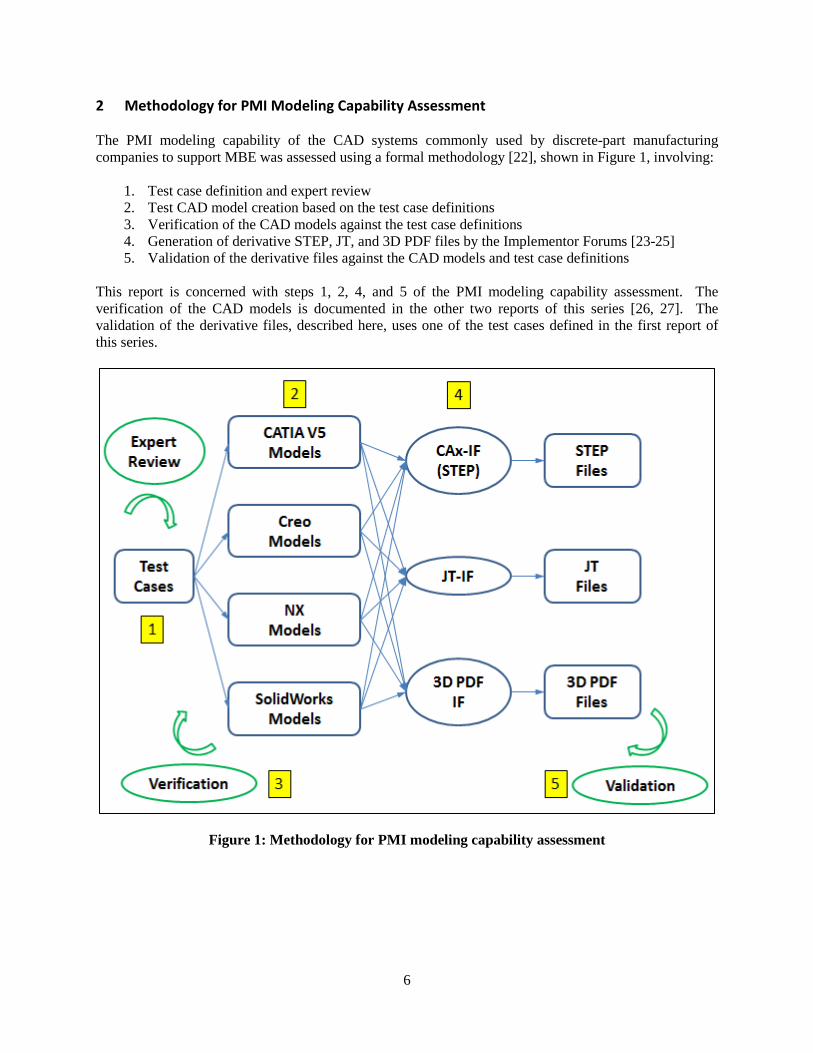
2 Methodology for PMI Modeling Capability Assessment The PMI modeling capability of the CAD systems commonly used by discrete-part manufacturing companies to support MBE was assessed using a formal methodology [22], shown in Figure 1, involving:
1. Test case definition and expert review 2. Test CAD model creation based on the test case definitions 3. Verification of the CAD models against the test case definitions 4. Generation of derivative STEP, JT, and 3D PDF files by the Implementor Forums [23-25] 5. Validation of the derivative files against the CAD models and test case definitions
This report is concerned with steps 1, 2, 4, and 5 of the PMI modeling capability assessment. The verification of the CAD models is documented in the other two reports of this series [26, 27]. The validation of the derivative files, described here, uses one of the test cases defined in the first report of this series.
Figure 1: Methodology for PMI modeling capability assessment

7
2.1 Test Case Definition
For test case generation, an industry expert in geometric dimensioning and tolerancing (GD&T) defined representative PMI constructs allowed by the American Society of Mechanical Engineers (ASME) standards for 2D drawings Y14.5-1994 [28] and 3D models Y14.41-2003 [29]. (Newer versions of both standards are available.) A PMI construct is a group of annotation entities which define an elemental concept, for example: defining a datum feature with a datum feature symbol (one annotation) or controlling the variation of a hole with a size dimension, a feature control frame, and its associated datum features (3 to 5 annotations). The constructs defined for this assessment are listed in Table 3. The constructs were applied to a discrete-part geometry model with approximately ten PMI constructs in the model. The test case is documented with a set of drawings and explanatory text, as shown in Figures 2 and 3. Each Construct Specification in Table 3 appears in the test case drawings.
Table 3: Test case PMI constructs

8
Figure 2: Test case drawing – view 1
Figure 3: Test case drawing – view 2

9
Other industry GD&T experts reviewed the test case for clarity and correctness. The test case was refined based on the expert feedback. All experts agreed that the test case is intended to simply combine constructs in Table 3 and do not define products that are fully-toleranced and/or functional for tolerance purposes. The test case is also not intended to represent best practice in how to apply GD&T to a part. Simpler GD&T strategies could have been used. The test cases are intended to exercise valid presentations of GD&T defined in the ASME Y14 standards.
2.2 Test Model Creation
A team of CAD experts created CAD models for the test case in four CAD systems that were available in early 2013:
• CATIA V5 R21 from Dassault Systemes [30] • Creo 2.0 from PTC [31] • NX 8.0 from Siemens PLM [32] • SOLIDWORKS 2012 from Dassault Systemes [33]
The CAD experts used the above PMI representation and presentation criteria to create models with equivalent meaning, and negligible graphical variation. When it was not possible to satisfy both sets of criteria, the representation was given precedence over the presentation. Images of the test model, each with two saved views, are shown in Appendix A. The PMI constructs in each test model were verified against the test case definition. Any discrepancies that could not be resolved with different modeling technique were documented as system limitations and reported to the CAD vendors.
2.3 Derivative File Creation
The test models were delivered to three industry consortia: CAx Implementor Forum [23], JT Implementor Forum [24], and 3D PDF Implementor Forum [25]. These consortia support the development of CAD implementations of three international standards for MBD: STEP ISO-10303 AP242 [19], ISO JT 1.0 [12], and 3D PDF PRC [13, 34], respectively. The software vendor members of the implementor forums provided neutral file translations as shown in Table 4. (No files were provided by SOLIDWORKS.) The CAD system names have been generalized. These vendors included the three CAD system vendors and eight third-party translator software vendors.
Table 4: Model counts by CAD system and format
10
2.4 Derivative File Validation
The CAD validation software CADIQ 8.0 [35] was used to query the PMI representation and presentation data in a 3D model using the API of each CAD system. The software developer for CADIQ developed and refined algorithms for matching and comparing each data element between models in different CAD systems that were based on the same test case definition. Using this multi-CAD PMI validation technology, a CAD validation specialist automatically compared each derivative model to the native CAD model from which it was translated. Each PMI representation or presentation difference was verified using a freely available visualization tools for each format: IDA-STEP [36], JT2Go [37], and Adobe Reader®. Differences that could not be verified were reported to the validation software vendor as measurement errors. Verified differences were reported to each translation vendor.
11
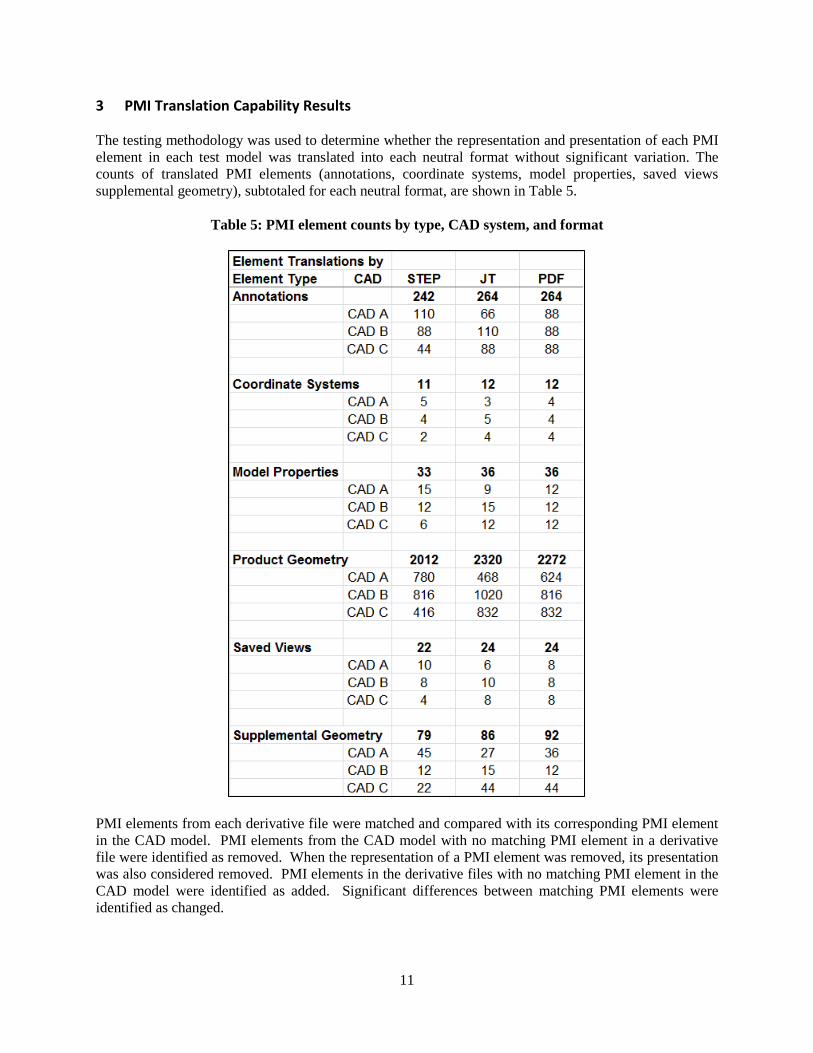
3 PMI Translation Capability Results The testing methodology was used to determine whether the representation and presentation of each PMI element in each test model was translated into each neutral format without significant variation. The counts of translated PMI elements (annotations, coordinate systems, model properties, saved views supplemental geometry), subtotaled for each neutral format, are shown in Table 5.
Table 5: PMI element counts by type, CAD system, and format
PMI elements from each derivative file were matched and compared with its corresponding PMI element in the CAD model. PMI elements from the CAD model with no matching PMI element in a derivative file were identified as removed. When the representation of a PMI element was removed, its presentation was also considered removed. PMI elements in the derivative files with no matching PMI element in the CAD model were identified as added. Significant differences between matching PMI elements were identified as changed.

12
3.1 PMI Representation and Presentation Issues
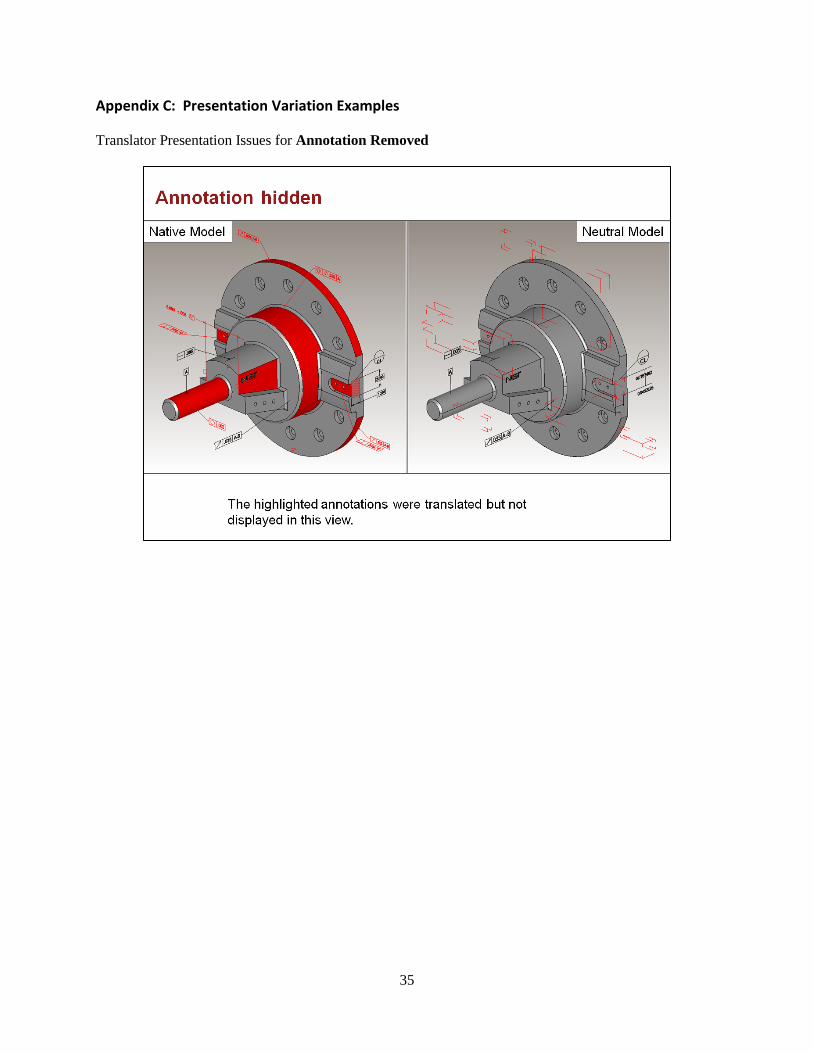
Every translated model had both representation and presentation issues for more than one type of PMI element. There were no translations without significant differences. Appendix B documents one example of each type of representation issue. The graphics in the appendices have been generalized to avoid identifying the specific CAD system or neutral format involved. Figure 4 shows one example from Appendix B. Appendix C documents one example of each type of presentation issues. Figure 5 shows one example from Appendix C.
Figure 4: Example of a representation variation issue

13
Figure 5: Example of a presentation variation issue
3.2 PMI Validation Results
For all derivative files with the same neutral format (STEP, JT, PDF), the above PMI element counts were subtotaled by PMI element type and characteristic (see Table 1 and Table 2). These validation issue counts were used to calculate validation percentages as follows:
𝑅𝑅𝑅𝑅𝑅𝑅𝑅𝑅𝑅𝑅𝑅𝑅𝑅𝑅 𝑃𝑃𝑅𝑅𝑃𝑃𝑃𝑃𝑅𝑅𝑃𝑃𝑃𝑃𝑃𝑃𝑃𝑃𝑅𝑅 = 100 𝑥𝑥 𝑅𝑅𝑅𝑅𝑅𝑅𝑅𝑅𝑅𝑅𝑅𝑅𝑅𝑅 𝐸𝐸𝐸𝐸𝑅𝑅𝑅𝑅𝑅𝑅𝑃𝑃𝑃𝑃 𝐶𝐶𝑅𝑅𝐶𝐶𝑃𝑃𝑃𝑃𝑇𝑇𝑃𝑃𝑃𝑃𝑃𝑃𝑇𝑇𝐸𝐸𝑃𝑃𝑃𝑃𝑅𝑅𝑅𝑅 𝐸𝐸𝐸𝐸𝑅𝑅𝑅𝑅𝑅𝑅𝑃𝑃𝑃𝑃 𝐶𝐶𝑅𝑅𝐶𝐶𝑃𝑃𝑃𝑃
𝐶𝐶ℎ𝑃𝑃𝑃𝑃𝑃𝑃𝑅𝑅𝑅𝑅 𝑃𝑃𝑅𝑅𝑃𝑃𝑃𝑃𝑅𝑅𝑃𝑃𝑃𝑃𝑃𝑃𝑃𝑃𝑅𝑅 = 100 𝑥𝑥 𝐶𝐶ℎ𝑃𝑃𝑃𝑃𝑃𝑃𝑅𝑅𝑅𝑅 𝐸𝐸𝐸𝐸𝑅𝑅𝑅𝑅𝑅𝑅𝑃𝑃𝑃𝑃 𝐶𝐶𝑅𝑅𝐶𝐶𝑃𝑃𝑃𝑃𝑇𝑇𝑃𝑃𝑃𝑃𝑃𝑃𝑇𝑇𝐸𝐸𝑃𝑃𝑃𝑃𝑅𝑅𝑅𝑅 𝐸𝐸𝐸𝐸𝑅𝑅𝑅𝑅𝑅𝑅𝑃𝑃𝑃𝑃 𝐶𝐶𝑅𝑅𝐶𝐶𝑃𝑃𝑃𝑃
𝐴𝐴𝑅𝑅𝑅𝑅𝑅𝑅𝑅𝑅 𝑃𝑃𝑅𝑅𝑃𝑃𝑃𝑃𝑅𝑅𝑃𝑃𝑃𝑃𝑃𝑃𝑃𝑃𝑅𝑅 = 100 𝑥𝑥 𝐴𝐴𝑅𝑅𝑅𝑅𝑅𝑅𝑅𝑅 𝐸𝐸𝐸𝐸𝑅𝑅𝑅𝑅𝑅𝑅𝑃𝑃𝑃𝑃 𝐶𝐶𝑅𝑅𝐶𝐶𝑃𝑃𝑃𝑃
𝑇𝑇𝑃𝑃𝑃𝑃𝑃𝑃𝑇𝑇𝐸𝐸𝑃𝑃𝑃𝑃𝑅𝑅𝑅𝑅 𝐸𝐸𝐸𝐸𝑅𝑅𝑅𝑅𝑅𝑅𝑃𝑃𝑃𝑃 𝐶𝐶𝑅𝑅𝐶𝐶𝑃𝑃𝑃𝑃
The Added Percentage calculations were capped at 100% to avoid skewing the statistics. This was particularly important for translations that introduced a large number of extraneous elements, such as supplemental geometry curves, relative to the number in the CAD models. A final percentage, representing the number of elements translated correctly, was calculated as follows:
𝑁𝑁𝑅𝑅 𝐶𝐶ℎ𝑃𝑃𝑃𝑃𝑃𝑃𝑅𝑅 𝑃𝑃𝑅𝑅𝑃𝑃𝑃𝑃𝑅𝑅𝑃𝑃𝑃𝑃𝑃𝑃𝑃𝑃𝑅𝑅 = 100 − 𝑅𝑅𝑅𝑅𝑅𝑅𝑅𝑅𝑅𝑅𝑅𝑅𝑅𝑅 𝑃𝑃𝑅𝑅𝑃𝑃𝑃𝑃𝑅𝑅𝑃𝑃𝑃𝑃𝑃𝑃𝑃𝑃𝑅𝑅 − 𝐶𝐶ℎ𝑃𝑃𝑃𝑃𝑃𝑃𝑅𝑅𝑅𝑅 𝑃𝑃𝑅𝑅𝑃𝑃𝑃𝑃𝑅𝑅𝑃𝑃𝑃𝑃𝑃𝑃𝑃𝑃𝑅𝑅 Tables 6-11 and Figures 6-11 present the non-zero validation percentages for each PMI element type, category (representation or presentation), characteristic, and neutral format. This level of generalization

14
gives the end-user community an overall summary of capabilities within each neutral format without calling into question any particular translation vendor. The technical details have been shared separately with each translation vendor so they know their opportunity for improvement in the MBE domain.
Table 6: Annotation validation percentages by category, characteristic and format
Figure 6: Annotation translation capability results by category and format
15
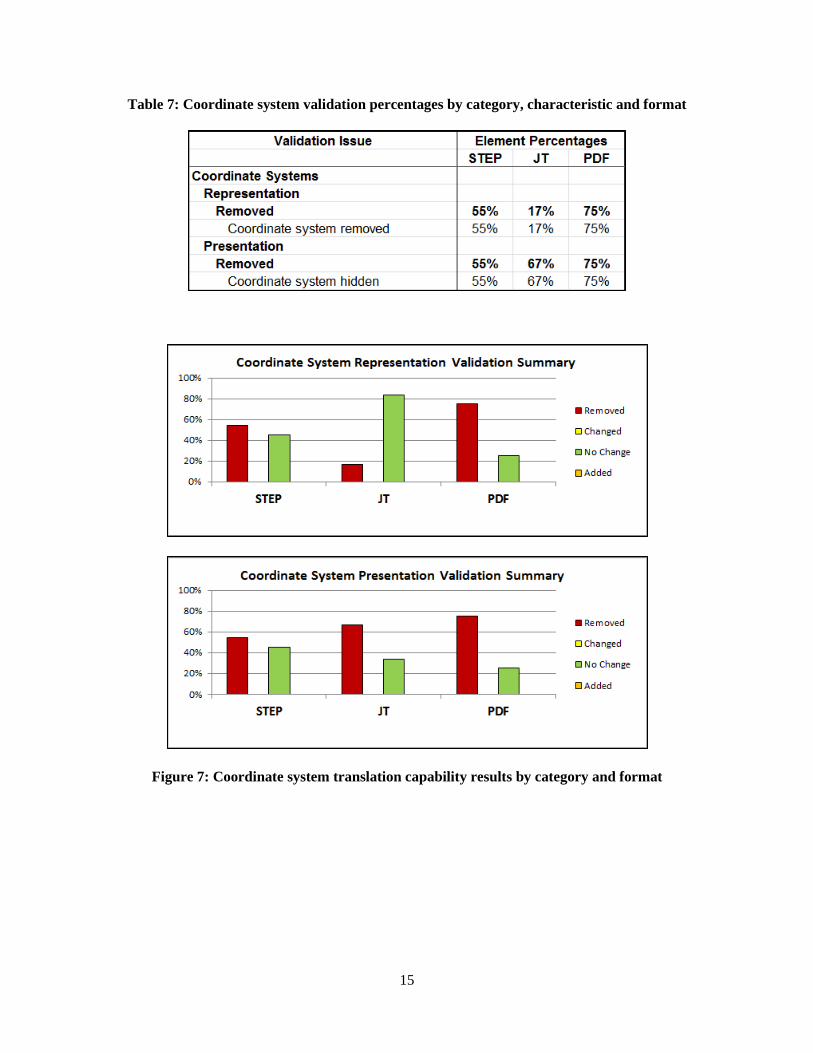
Table 7: Coordinate system validation percentages by category, characteristic and format
Figure 7: Coordinate system translation capability results by category and format
16
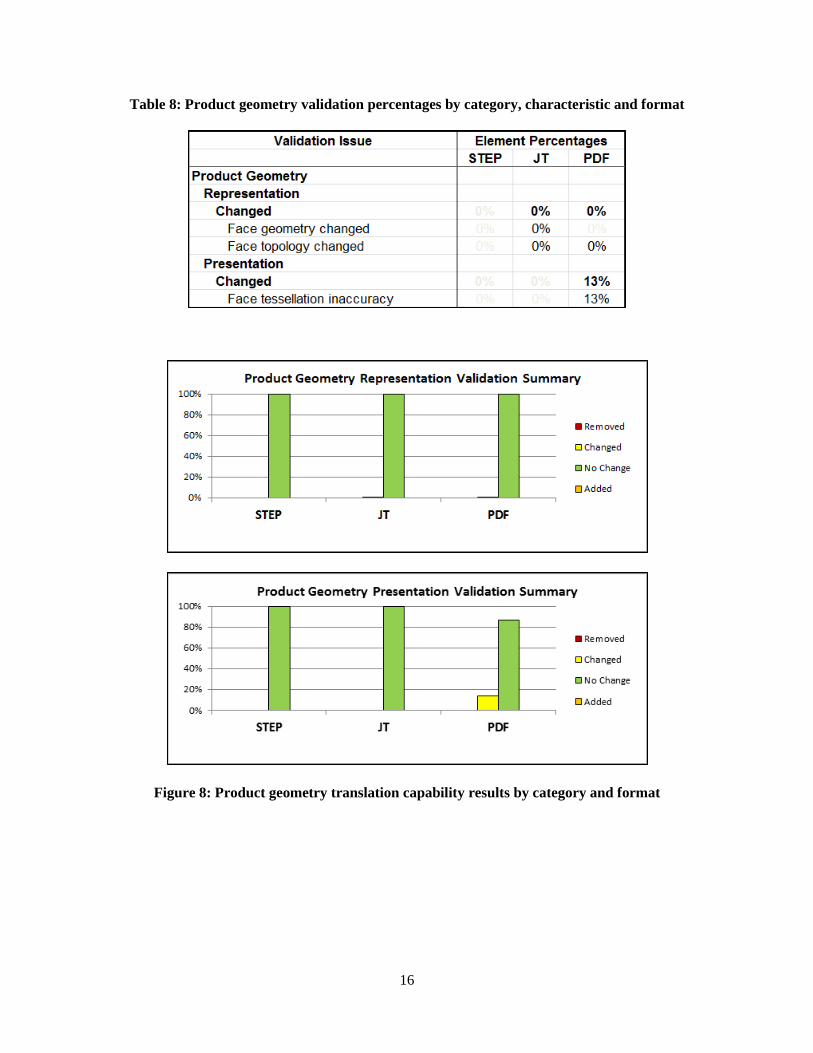
Table 8: Product geometry validation percentages by category, characteristic and format
Figure 8: Product geometry translation capability results by category and format

17
Table 9: Supplemental geometry validation percentages by category, characteristic and format
Figure 9: Supplemental geometry translation capability results by category and format
18
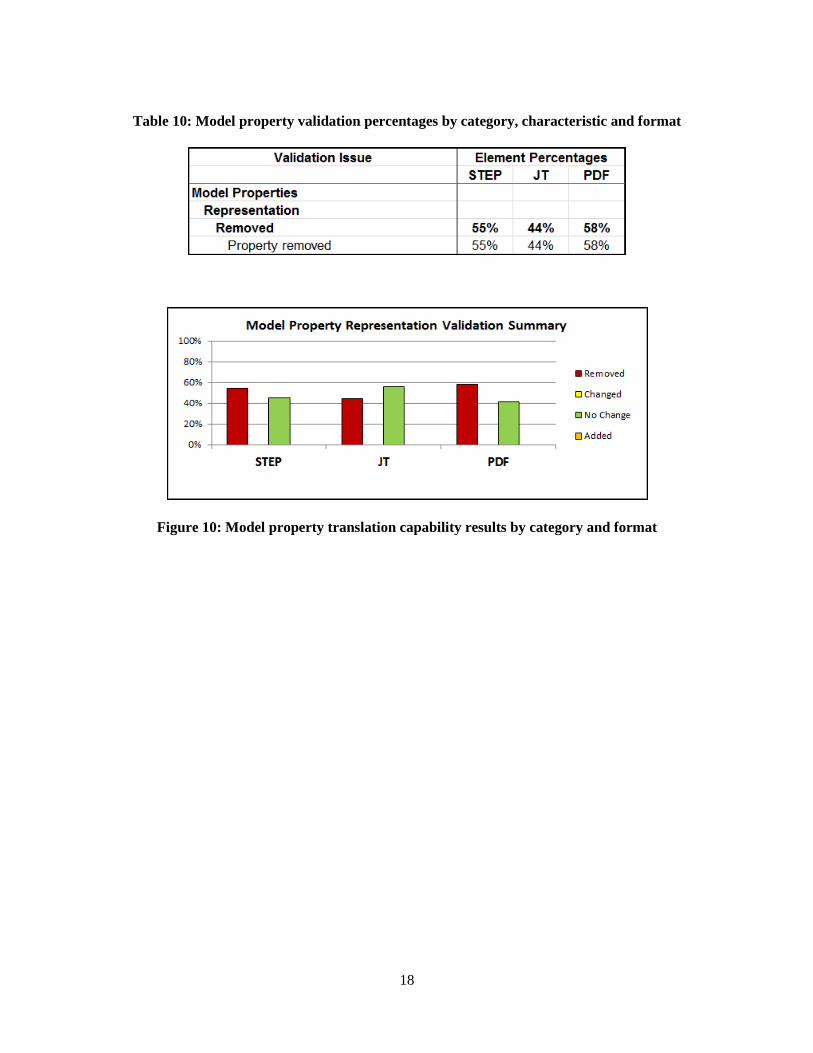
Table 10: Model property validation percentages by category, characteristic and format
Figure 10: Model property translation capability results by category and format

19
Table 11: Saved view validation percentages by category, characteristic and format
Figure 11: Saved view translation capability results by category and format

20
Several validation issues not found in any of the translated models are listed in Table 11 by PMI element type, category and characteristic.
Table 12: Validation non-issues
21
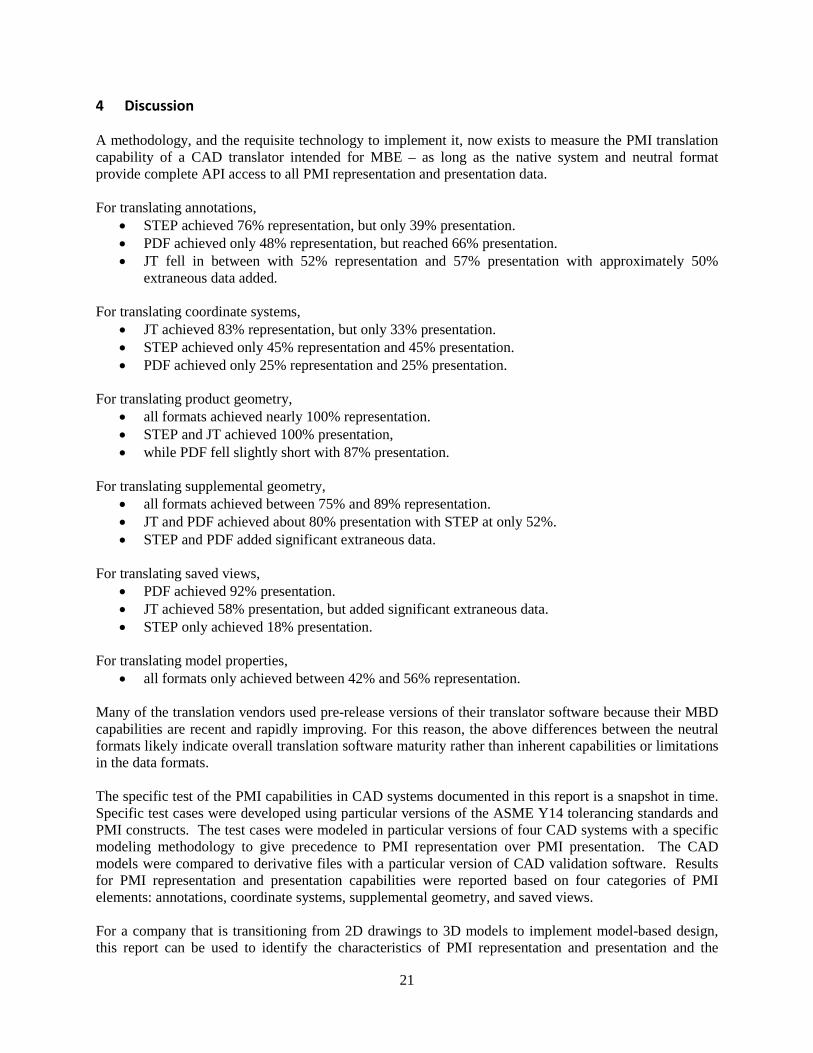
4 Discussion A methodology, and the requisite technology to implement it, now exists to measure the PMI translation capability of a CAD translator intended for MBE – as long as the native system and neutral format provide complete API access to all PMI representation and presentation data. For translating annotations,
• STEP achieved 76% representation, but only 39% presentation. • PDF achieved only 48% representation, but reached 66% presentation. • JT fell in between with 52% representation and 57% presentation with approximately 50%
extraneous data added. For translating coordinate systems,
• JT achieved 83% representation, but only 33% presentation. • STEP achieved only 45% representation and 45% presentation. • PDF achieved only 25% representation and 25% presentation.
For translating product geometry,
• all formats achieved nearly 100% representation. • STEP and JT achieved 100% presentation, • while PDF fell slightly short with 87% presentation.
For translating supplemental geometry,
• all formats achieved between 75% and 89% representation. • JT and PDF achieved about 80% presentation with STEP at only 52%. • STEP and PDF added significant extraneous data.
For translating saved views,
• PDF achieved 92% presentation. • JT achieved 58% presentation, but added significant extraneous data. • STEP only achieved 18% presentation.
For translating model properties,
• all formats only achieved between 42% and 56% representation. Many of the translation vendors used pre-release versions of their translator software because their MBD capabilities are recent and rapidly improving. For this reason, the above differences between the neutral formats likely indicate overall translation software maturity rather than inherent capabilities or limitations in the data formats. The specific test of the PMI capabilities in CAD systems documented in this report is a snapshot in time. Specific test cases were developed using particular versions of the ASME Y14 tolerancing standards and PMI constructs. The test cases were modeled in particular versions of four CAD systems with a specific modeling methodology to give precedence to PMI representation over PMI presentation. The CAD models were compared to derivative files with a particular version of CAD validation software. Results for PMI representation and presentation capabilities were reported based on four categories of PMI elements: annotations, coordinate systems, supplemental geometry, and saved views. For a company that is transitioning from 2D drawings to 3D models to implement model-based design, this report can be used to identify the characteristics of PMI representation and presentation and the

22
capabilities of CAD software that are important to achieve an MBD workflow. The test cases may or may not be representative of the types of PMI that might be typically used. The versions of the CAD systems and tolerancing standards might be newer or older than what a company requires. However, the report clearly identifies a wide variety of PMI representation and presentation issues that can be used to evaluate CAD software and derivative files that are used in an MBD environment. 5 References [1] Model Based Enterprise - Exploring the Digital Tapestry, http://www.model-based-
enterprise.org/. [2] J. Lubell, K. Chen, J. Horst, S. Frechette, and P. Huang, "Model Based Enterprise / Technical
Data Package Summit Report," NIST Technical Note 1753, 2012. [3] J. Lubell, S. P. Frechette, R. R. Lipman, F. M. Proctor, J. A. Horst, M. Carlisle, and P. J. Huang,
"Model-Based Enterprise Summit Report," National Institute of Standards and Technology, NIST Technical Note 1820, 2013.
[4] Model-Based Enterprise Summit 2013, National Institute of Standards and Technology, http://www.nist.gov/el/msid/mbe_2013_presentations.cfm.
[5] Model-Based Enterprise Summit 2014, National Institute of Standards and Technology, http://www.nist.gov/el/msid/mbe2014presentations.cfm.
[6] V. Quintana, L. Rivest, R. Pellerin, F. Venne, and F. Kheddouci, "Will Model-based Definition replace engineering drawings throughout the product lifecycle? A global perspective from aerospace industry," Computers in Industry, vol. 61, pp. 497-508, 2010.
[7] M. Alemanni, F. Destefanis, and E. Vezzetti, "Model-based definition design in the product lifecycle management scenario," The International Journal of Advanced Manufacturing Technology, vol. 52, pp. 1-14, 2011.
[8] ISO 10303-1:1994, "Industrial automation systems and integration - Product data representation and exchange - Part 1: Overview and fundamental principles," International Organization for Standardization, Geneva, Switzerland.
[9] M. J. Pratt, "Introduction to ISO 10303—the STEP standard for product data exchange," Journal of Computing and Information Science in Engineering, vol. 1, pp. 102-103, 2001.
[10] STEP Application Handbook, ISO 10303, Version 3, SCRA, 2006, https://pdesinc.org/downloadable_files/STEPapplicationhandbook63006BF.pdf.
[11] JT Open, Siemens, http://www.plm.automation.siemens.com/en_us/products/open/jtopen/. [12] ISO 14306:2012, "Industrial automation systems and integration - JT file format specification for
3D visualization," International Organization for Standardization, Geneva, Switzerland. [13] ISO 24517-1:2008, "Document management -- Engineering document format using PDF -- Part
1: Use of PDF 1.6 (PDF/E-1)," International Organization for Standardization, Geneva, Switzerland.
[14] ISO/PAS 26183:2006, "SASIG Product data quality guidelines for the global automotive industry," International Organization for Standardization, Geneva, Switzerland.
[15] PDES, Inc. - Advancing the Digital Enterprise, https://pdesinc.org/. [16] ProSTEP iViP Association, http://prostep.org/. [17] LOTAR - Long Term Archiving and Retrieval, http://www.lotar-international.org/. [18] Development of a Convergent Modular STEP Application Protocol Based on AP 203 and AP
214: STEP AP 242 – Managed Model Based 3D Engineering, ASD Strategic Standardization Group, 2009, http://www.ap242.org/.
[19] ISO 10303-242:2014, "Industrial automation systems and integration - Product data representation and exchange - Part 242: Application protocol: Managed Model-based 3D Engineering," International Organization for Standardization, Geneva, Switzerland.
[20] ASD Strategic Standardization Group - Long Term Archiving and Retrieval - LOTAR, http://www.asd-ssg.org/lotar.

23
[21] MIL-STD-31000A, "DoD Standard Practice: Technical Data Packages," U.S. Department of Defense, 2013.
[22] S. P. Frechette, A. T. Jones, and B. R. Fischer, "Strategy for Testing Conformance to Geometric Dimensioning & Tolerancing Standards," Procedia CIRP, vol. 10, pp. 211-215, 2013.
[23] CAx Implementor Forum, http://www.cax-if.org/. [24] JT Implementor Forum, ProSTEP iViP, http://www.prostep.org/en/projects/jt-implementor-
forum.html. [25] 3D PDF Consortium, http://www.3dpdfconsortium.org/. [26] D. Cheney and B. Fischer, "Measuring the PMI Modeling Capability in CAD Systems: Report 1 -
Combined Test Case Verification," National Institute of Standards and Technology, NIST-GCR 15-997, 2015.
[27] D. Cheney and B. Fischer, "Measuring the PMI Modeling Capability in CAD Systems: Report 3 - Fully-Toleranced Test Case Verification," National Institute of Standards and Technology, NIST-GCR 15-999, 2015.
[28] ASME Y14.5-1994, "Dimensioning and Tolerancing - Engineering Drawing and Related Documentation Practices," American Society of Mechanical Engineers, 1994, New York.
[29] ASME Y14.41-2003, "Digital Product Definition Data Practices - Engineering Drawing and Related Documentation Practices," American Society of Mechanical Engineers, 2003, New York.
[30] CATIA, Dassault Systemes, http://www.3ds.com/products-services/catia/. [31] Creo, PTC, http://www.ptc.com/product/creo. [32] NX, Siemens, www.plm.automation.siemens.com/en_us/products/nx/. [33] SOLIDWORKS, Dassault Systemes, http://www.solidworks.com/. [34] ISO 14739-1:2014, "Document management -- 3D use of Product Representation Compact (PRC)
format -- Part 1: PRC 10001," International Organization for Standardization, Geneva, Switzerland.
[35] CADIQ, ITI TranscenData, http://www.transcendata.com/products/cadiq/. [36] IDA-STEP Viewer, LKSoftware GmbH, http://www.ida-step.net/. [37] JT2Go, Siemens, http://www.plm.automation.siemens.com/en_us/products/teamcenter/plm-
platform-capabilities/visualization/jt2go/index.shtml.

24
Appendix A: Test Model Images Combined Test Case 5 Saved View MBD_A
• Clockwise from upper left - Test Models for CATIA V5 R21, NX 8.0, SOLIDWORKS 2012 and Creo 2.0
• Screenshot is of each test model displayed in CADIQ • Annotations and their associated geometry are highlighted in red

25
Combined Test Case 5 Saved View MBD_B
• Clockwise from upper left - Test Models for CATIA V5 R21, NX 8.0, SOLIDWORKS 2012 and Creo 2.0
• Screenshot is of each test model displayed in CADIQ • Annotations and their associated geometry are highlighted in red

26
Appendix B: Representation Variation Examples Translator Representation Issues for Annotation Removed

27
Translator Representation Issues for Annotation Changed

28
Translator Representation Issues for Annotation Changed (cont.)

29
Translator Representation Issues for Annotation Added
Translator Representation Issues for Coordinate System Removed

30
Translator Representation Issues for Product Geometry Changed

31
Translator Representation Issues for Supplemental Geometry Removed

32
Translator Representation Issues for Supplemental Geometry Removed (cont.)
Translator Representation Issues for Supplemental Geometry Added

33
Translator Representation Issues for Supplemental Geometry Added (cont.)

34
Translator Representation Issues for Model Property Removed
35
Appendix C: Presentation Variation Examples Translator Presentation Issues for Annotation Removed

36
Translator Presentation Issues for Annotation Changed

37
Translator Presentation Issues for Annotation Changed (cont.)
38
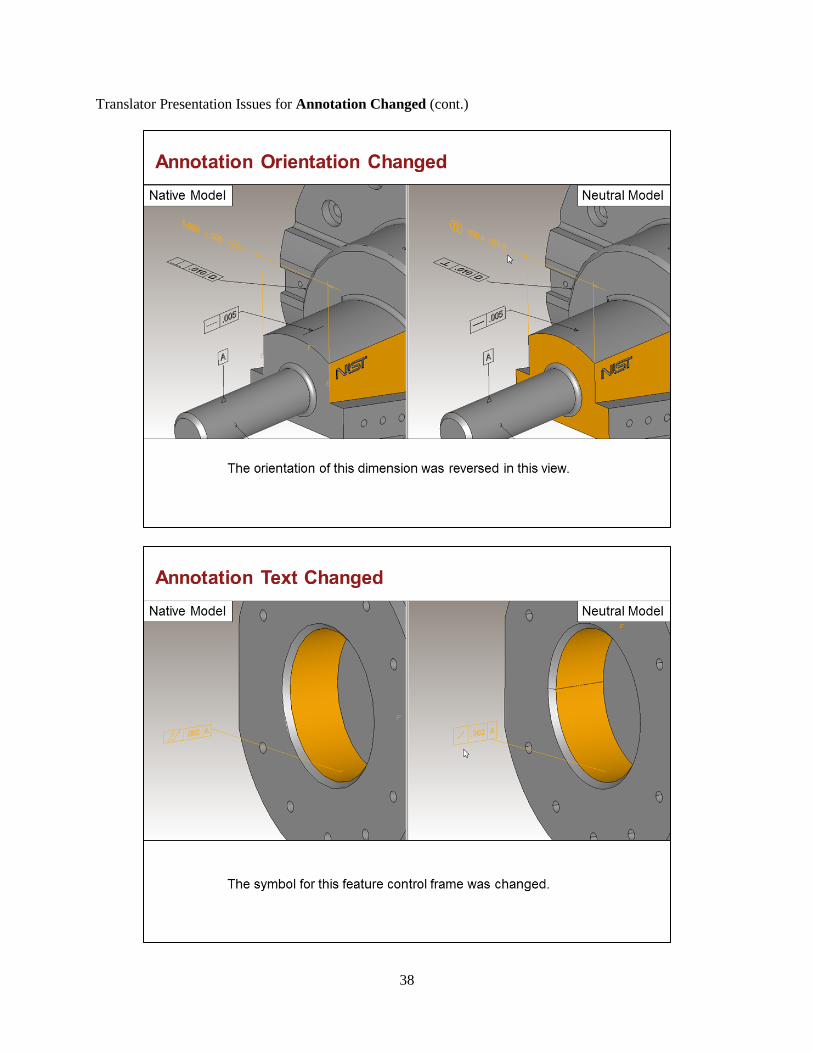
Translator Presentation Issues for Annotation Changed (cont.)

39
Translator Presentation Issues for Annotation Changed (cont.)

40
Translator Presentation Issues for Annotation Added
Translator Presentation Issues for Coordinate System Removed

41
Translator Presentation Issues for Product Geometry Changed
Translator Presentation Issues for Supplemental Geometry Removed

42
Translator Presentation Issues for Supplemental Geometry Removed (cont.)

43
Translator Presentation Issues for Supplemental Geometry Changed
Translator Presentation Issues for Supplemental Geometry Added

44
Translator Presentation Issues for Supplemental Geometry Added (cont.)

45
Translator Presentation Issues for Saved View Removed
Translator Presentation Issues for Saved View Changed
46
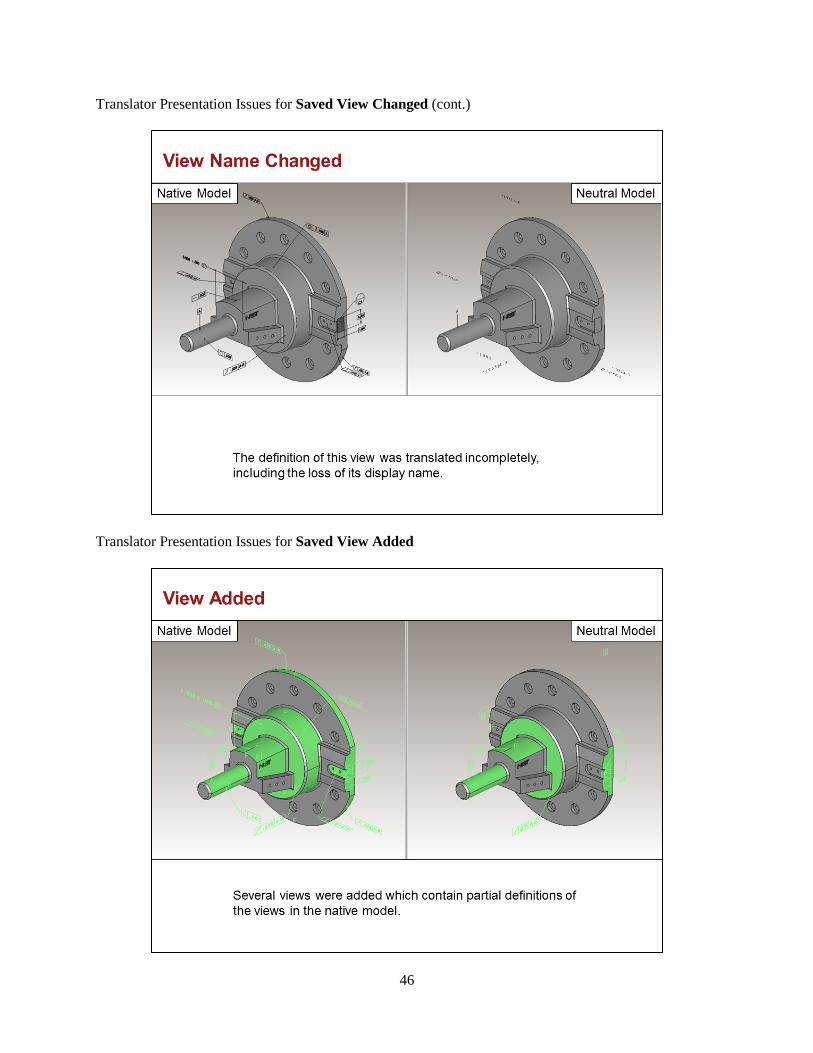
Translator Presentation Issues for Saved View Changed (cont.)
Translator Presentation Issues for Saved View Added