measuring the impact of e†cient household travel … the impact of e†cient household travel...
TRANSCRIPT

Measuring the impact of e�cient household travel decisions onpotential travel time savings and accessibility gains
W.W. Recker a,*, C. Chen b, M.G. McNally a
a Department of Civil and Environmental Engineering, Institute of Transportation Studies, University of California,
Irvine, CA 92697, USAb Department of Tourism Industry, Ming-Chuan University, Taiwan, ROC
Received 20 May 1999; received in revised form 4 September 1999; accepted 14 September 1999
Abstract
Using the conceptual framework of time±space geography, this paper incorporates both spatio-temporalconstraints and household interaction e�ects into a meaningful measure of the potential of a household tointeract with the built environment. Within this context, personal accessibility is described as a measure ofthe potential ability of individuals within a household not only to reach activity opportunities, but to do sowith su�cient time available for participation in those activities, subject to the spatio-temporal constraintsimposed by their daily obligations and transportation supply environment. The incorporation of activity-based concepts in the measurement of accessibility as a product of travel time savings not only explicitlyacknowledges a temporal dimension in assessing the potential for spatial interaction but also expands theapplicability of accessibility consideration to such real-world policy options as the promotion of ride-sharing and trip chaining behaviors. An empirical application of the model system provides an indication ofthe potential of activity-based modeling approaches to assess the bounds on achievable improvements inaccessibility and travel time based on daily household activity patterns. It also provides an assessment ofroles for trip chaining and ride-sharing as potentially e�ective methods to facilitate transportation policyobjectives. Ó 2001 Elsevier Science Ltd. All rights reserved.
1. Introduction
Travel demand theory, whether derived from consumer demand theory or direct demandprinciples, is intrinsically rooted in the notion that travel time is a commodity to be saved. To theextent that travel time is not merely just a surrogate for the actual economic cost of travel, the
Transportation Research Part A 35 (2001) 339±369www.elsevier.com/locate/tra
* Corresponding author. Tel.: +1-949-824-5989; fax: +1-949-824-8385.
E-mail address: [email protected] (W.W. Recker).
0965-8564/01/$ - see front matter Ó 2001 Elsevier Science Ltd. All rights reserved.
PII: S0965-8564(99)00062-2

implication is that the time savings can and will be transformed by the traveler into something ofintrinsic value ± ostensibly either in more time spent on performing activities of economic, orother, value, or in increasing the ``capture space'' of alternative locations for such activities. In the®rst instance, the time savings is implicitly assumed to be generally transferable to any otheractivity, including travel, that may be on the travelerÕs agenda ± in traditional trip-based demandanalysis, while the saving of travel time is an explicit consideration of the modeling process, theallocation of the savings is virtually always an exogenous consideration not addressed. In thesecond instance, the travel time savings is ``mapped'' into a spatial measure of ``reachability'',commonly referred to as accessibility.
Although springing from the same well, concepts of accessibility and travel demand havelargely been treated separately. With the growth and standardization of the travel demandforecasting process and the associated focus on trip making, concepts of accessibility were pri-marily associated with the land use forecasts fronting the process and, to some degree, the policyevaluation which followed the process. Between HansenÕs (1959) early model development andseminal review works 20 years later by Pirie (1979) and Morris et al. (1979), most developmentsand application of accessibility concepts were conducted quite independent of developments andapplications of demand forecasting. Early accessibility studies are almost exclusively concernedwith the spatial aspects of travel decisions (Ingram, 1971; Dalvi and Martin, 1976). Limitations onthe de®nition and estimation of traditional accessibility measures in transportation planning haverestricted applications to the use of simple aggregate indices, temporally independent, whichcannot re¯ect the potential for connectivity between activities. Applications of accessibility con-cepts have, therefore, been limited to such aggregate analyses as land use and facility locationstudies (for example, see Hansen, 1959). Consequently, the impacts of changes of transportationpolicy cannot be expressed easily in terms of accessibility-related e�ects, although the provision ofaccessibility is typically an important goal in the implementation of new transportation policyoptions.
The time±space geography paradigm of Hagerstrand (1970) o�ered the potential to better in-tegrate the spatial and temporal components of travel-related decisions that underpin the conceptsof travel demand and its relationship to accessibility. The approach held potential as a basis fordeductive accessibility measurement and as one of the foundations for inductive diary analysis. Itis commonly referred to as the ``constraint-based approach'' given the de®ning role that spatialand temporal constraints in the formulation; space is typically expressed as a two-dimensionalplane, while time is depicted via a third, vertical axis. Within this three-dimensional space, so-called time±space prisms de®ne the limits of what is accessible. Lenntorp (1976, 1978) extendedHagerstrandÕs approach by developing a model that calculated the total number of space±timepaths an individual could follow given a speci®c activity program (i.e., the set of desired activitiesand durations) and the urban environment, as de®ned by the transportation network and thespatial±temporal distribution of activities. LenntorpÕs PESASP (program evaluating the set ofalternative sample paths) model, noteworthy since it represented the ®rst attempt to operation-alize the theoretical framework advanced by Hagerstrand in a manner that would allow mean-ingful policy evaluation, was followed by two parallel lines of work. The ®rst extendingLenntorpÕs full pattern generation approach, began with CARLA (see Jones et al., 1983) andSTARCHILD (Recker et al., 1986a,b). The second, focussed on the accessibility aspects of thetime-geography approach, is exempli®ed by Burns and Golob (1976) and Burns (1979) who
340 W.W. Recker et al. / Transportation Research Part A 35 (2001) 339±369

examined constraints on individual behavior through a methodological study of accessibility.Burns viewed accessibility as the freedom of individuals to participate in di�erent activities and,with the aid of the space±time prism, investigated the dependence of accessibility on its trans-portation, temporal, and spatial components. Accessibility bene®t measures were constructedbased on di�erent assumptions about how individuals value the opportunities available to them,and these were used to analyze and compare the accessibility implications of a variety of trans-portation, temporal, and spatial strategies.
Both Morris et al. (1979) and Pirie (1979) provided comprehensive reviews of the state-of-the-art. Morris et al. (1979) classi®ed accessibility approaches as conventional (Hansen, 1959), axi-omatic (Weibull, 1976), and user bene®t (Koenig, 1980), but did not include the constraint-basedapproach. Twenty years later, Miller (1999) reconciled these complementary approaches, as wellas the constraints-oriented approach of time-geography, deriving accessibility and bene®t mea-sures that extended the utility formulation of Burns (1979) and were consistent with WeibullÕs(1976, 1980) axiomatic framework. Kwan (1998) provided some empirical assessment of a rangeof accessibility measures.
Pirie (1979) extended his review with a proposal that accessibility be portrayed ``as a condition(a vacancy) in an activity routine which, either deliberately created or formed as a residual,permits travel to and from and participation in one or more activities''. Accessibility, he suggests,could be measured ``in terms of the cost of creating the vacancy'' and that these costs could re¯ectthe degree of ``activity, role, space, and time substitutions incurred''. Pirie suggests that such time-geography approaches as LenntorpÕs PESASP model could provide the framework for such ac-cessibility measurement.
Adaptations and applications of Pirie's approach are numerous (Arentze et al., 1994a,b; Niishiand Kondo, 1992); however, operationization of Hagerstrand's framework to meaningful policyevaluation has proven extremely di�cult, principally because of the complexity of the analyticsembedded in the time±space approach. Most often, studies have either been restricted to de-scriptive analysis or have involved computer-oriented model systems that produce the enumer-ation of feasible time±space paths. Because of the complicated dimensionality of the problem,these latter e�orts have relied principally on exhaustive enumeration or the application of se-quential procedures to reduce the complexity in forming the activity pattern (Kitamura andKermanshah, 1983, 1984; Recker et al., 1986a,b). In a few cases, structural equation systems andsimple multivariate data analysis techniques have been employed to determine the relationshipbetween activity patterns and socio-demographic attributes (Golob, 1985, 1986; Golob andMeurs, 1987). With few exceptions (Koppelman and Townsend, 1987; Golob and McNally, 1997),prior research has focused on the activity patterns of individual members of households; workaddressing the collective travel behavior by household members is quite limited.
Herein, we address PirieÕs proposal with a conceptual framework that incorporates both spatio-temporal constraints and household interaction e�ects into a more meaningful measure of thepotential of a household to interact with the built environment. Taken together, the componentsof the framework can be described by the household activity pattern problem (HAPP) (Recker,1995); the solution patterns reveal personal travel behavior and activity participation within ahousehold context, while preserving the concept that accessibility originates from participation inactivities, that travel constitutes the linkage between activities, and in which all of the requiredcomponents are contained in the activity scheduling problem.
W.W. Recker et al. / Transportation Research Part A 35 (2001) 339±369 341
Within this context, personal accessibility is described as a measure of the potential ability ofindividuals within a household not only to reach activity opportunities, but to do so with su�cienttime available for participation in those activities, subject to the spatio-temporal constraints imposedby their daily obligations and transportation supply environment. The speci®c issue being addressedis not personal accessibility per se, but rather how travel decisions can improve accessibility. Theintent is to identify and measure the potential for interaction that remains after accounting forthe consumption of time±space needed to accomplish an individual's daily demand for in- andout-of-home activities.
The spatial location and temporal availability of activity sites, together with the maximumspeed an individual can travel between sites, establishes the individual's space±time prism; thevolume of this prism encompasses the full range of possible locations at which an individual canparticipate. Once an individual initiates a pattern, the potential action space for subsequent ac-tivities is reduced as a function of characteristics of prior activity (e.g., duration). The aggregationof changes the volume of the time±space prism in Hagerstrand's three-dimensional space for eachindividual brought on by any particular travel/activity decision protocol can be interpreted as anassessment of macroscopic accessibility accruing to the household as a result of that particulardecision regime.
Fig. 1 provides an example to illustrate the calculation of such an accessibility measurementfor a hypothetical member of a household, if the associated activity diary is known. In the caseillustrated, the individual has three out-of-home activities that are to be completed, as well as twoscheduled activities to be completed in the home. The spatio-temporal path, reconstructed fromthe activity diary of this hypothetical individual, is shown by the solid line; its projection onto thespatial plane is represented by the directed line segments. In the ®gure, the shaded prisms en-compass the physical space that can be reached during the periods for which no speci®c activitiesare scheduled. The volumes of these prisms thus o�er a measure of the potential to engage inadditional activities. The ``packaging'' of the activity/travel decisions obviously impact the natureof such prisms contained in any activity pattern; in general, e�cient travel decisions (e.g., tripchaining) tend to increase the potential to engage in additional activities should either the need ordesire arise. An example of this is provided by the pattern shown in Fig. 2, in which Activity 2has been chained with Activity 1 rather than with Activity 3. When compared to the originalpattern, the pattern in this ®gure results in a net gain in accessibility (at the home location), aswell as a ``transference'' of accessibility to a di�erent spatio-temporal location centered about thespatial location of Activity 2. Although not shown in this example, it is easy to imagine a similartransference that could take place between individuals in a particular household if, for example,another member of this particular household assumed responsibility for completing Activity 3. Itis precisely these sorts of considerations that the approach described herein is designed to cap-ture.
The approach illustrated above is of general use in the estimation of the transference of ac-cessibility under a range of relevant policy scenarios. The addition of a temporal dimensionprovides the ability to measure the variation of accessibility by time-of-day, while the analysis ofpersonal accessibility facilitates a better understanding of transference of accessibility amonghousehold members, both in terms of ride-sharing and trip-chaining behaviors. After a presen-tation of the overall model formulation, the potential utility of this approach in policy analysis isdemonstrated using travel survey data.
342 W.W. Recker et al. / Transportation Research Part A 35 (2001) 339±369

2. Activity pattern representation
The household travel-activity decision-making process underlying the proposed activity-basedmeasure of accessibility is based on an extension of the mathematical programming approacho�ered by Recker (1995) in which the HAPP is posed as a network-based routing model incor-porating vehicle assignment, ride-sharing behavior, activity assignment and scheduling, and timewindow constraints. The general approach involves treating the HAPP as an analogy to the so-called pickup and delivery problem with time windows (PDPTW).
In the analogy to the PDPTW, activities are viewed as being ``picked up'' by a particularhousehold member at the location where performed and, once completed (requiring a speci®edservice time) are ``logged in'' or ``delivered'' on the return trip home. Multiple ``pickups'' aresynonymous with multiple sojourns on any given tour. The scheduling and routing protocolrelative to some household objective produces the ``time±space diagram'' commonly referred to intravel/activity analysis.
Fig. 1. Example of individualÕs travel/activity pattern and accessibility prisms.
W.W. Recker et al. / Transportation Research Part A 35 (2001) 339±369 343

The problem is de®ned by a network graph G � �V ;A�, where V is the set of all vertices, and Ais the set of all arcs in the network. Physically, V can be a set of demand nodes, and A can beexplained as the connections between these demand nodes. The standard vehicle routing problem(VRP), that is applied in numerous studies (Golden, 1984; Desrochers et al., 1988; Solomon andDesrosiers, 1988), is de®ned on this graph as the visit to each node once and only once by a stableof vehicles with speci®c capacity constraints. The HAPP is described as: Minimize a hypotheticalobjective function (which generally expresses some ``generalized cost'' to the household in order tocomplete all of the activities needed to be performed by the household members) subject to theconstraints related to transportation supply, time windows, vehicle capacity, and logical connectionbetween activity nodes. The HAPP, which is more complex than a generic VRP, can be de®ned onan expanded graph with the addition of temporary returning home nodes, and the replacement ofthe activity nodes with drop-o� and pick-up function nodes, which physically represent the samelocations as those of the activity nodes, and logically are used to explain di�erent purposes of thattrip. The requirements for the household members to complete all scheduled activities (visiting all
Fig. 2. Example of accessibility gains and transference with more e�cient travel behavior.
344 W.W. Recker et al. / Transportation Research Part A 35 (2001) 339±369

activity nodes), which could be performed either by some speci®c person or by anyone available,are sustained within this model. Each activity in the HAPP must be performed once and only once(equivalent to the de®nition that each vertex of the network in the VRP should be visited once andonly once), and there is a limitation on the time period of performing the activity.
Inclusion of ride-sharing options greatly increases the complexity of the model structure overthat required for a non-ride-sharing formulation. However, the ride-sharing case can be treated byenumerating all possible ride-sharing options of the non-ride-sharing formulation, which is aVRPTW-based problem with budget constraints. Employing a relaxation on the number ofavailable vehicles within a household, the problem with ride-sharing can be reduced to a VRPTW.Furthermore, assuming that the triangle inequality is satis®ed, the solution of VRPTW can beshown to be a lower bound to the original problem.
The resulting HAPP formulation is in the form of a mixed integer linear programming (MILP)model. Details of the original formulation can be found in Recker (1995). The results quoted inthis paper are based on a modi®ed version of the mathematical program developed in that work(in terms of both the de®nition of variables and speci®cation of problem constraints); however,the same general considerations apply. In the present study, the form of the HAPP mathematicalprogram formulation of the travel/activity decisions for a particular household, say i, during sometime period is represented by
minimize U�Zi� � B0i � Zi
subject to AZi6 0;�1�
where
Zi �
V
X
±
U
Y
±
T
H
R
266666666666666664
377777777777777775; V V v
u
�� 0
1
� �; X � X v r
uewf
�� 0
1
� �; U � U a
u
�� 0
1
� �; Y � Y a
uewf
�� 0
1
� �;
T � �Tue P 0�; H � �H vau1
P 0�; R � �Rmaue
P 0�:The outputs Zi of the optimization for each household i are speci®ed by the following decisionvariables: 1
1 The relationships among these decision variables that form the resulting mathematical program are presented in
Appendix A.
W.W. Recker et al. / Transportation Research Part A 35 (2001) 339±369 345
The various sets referenced in the above are de®ned by the following notation:
In Eq. (1) Bi is a vector of coe�cients that de®nes the relative contributions of each of the decisionvariables to the overall disutility of the travel regime to the household. Descriptively, the con-straint sets AZi6 0 for this MILP are classi®ed into six groups:1. Routing constraints that de®ne the allowable spatial movement of vehicles and household
members in completing the householdÕs activity agenda.2. Scheduling constraints specify the relationship of arrival time, activity begin time, and waiting
time, and continuity condition along the temporal dimension.
A � f1; 2; . . . ; j; . . . ; ng The set of out-of-home activities scheduled to be completed bytravelers in the household.
g � f1; 2; . . . ; a; . . . ; jcjg The set of all potential travelers in the household.V � f1; 2; . . . ; v; . . . ; jV jg The set of vehicles available to travelers in the household to
complete their scheduled activities.P � f1; 2; . . . ; u; . . . ; n� The set designating location at which each activity is performed.F � f1; 2g The set of functions that may be performed at an activity node,
with ``1'', representing the eventual ``return home'' portion of atrip associated with a particular activity (a ``delivery'' in the VRPproblem), and ``2'', the trip to a particular activity location (a``pickup'' in the VRP problem). Physically, these functions areperformed at the locations of the associated activity nodes, andlogically, these functions are used to represent those expandednodes associated with the original activity nodes.
V vu Binary decision variable equal to unity if vehicle v 2 V is used to perform activity
u 2 A, and 0 otherwise.X v r
uewfBinary decision variable equal to unity if r (r � 1; . . . ; jcj) household members usevehicle v to travel from a function e 2 F performed at activity node u to a functionf 2 F performed at activity node w, and 0 otherwise.
U au Binary decision variable equal to unity if activity u is performed by household
member a 2 g, and 0 otherwise.Y a
uewfBinary decision variable equal to unity if household member a travels from afunction e performed at activity node u to a function f performed at activity node w,and 0 otherwise.
Tue The time at which performance of function e begins at activity location u; 8ue 3 9 avalue Y a
uewf6� 0, for some a 2 g; w 2 P ; f 2 F :
H tau1
The time at which household member a returns to home from activity u using vehiclev; V v
u , U au 6� 0.
Rvaue
The time at which household member a arrives at node u to perform function e byusing vehicle v; 8ue; a; v 3 9 a value Y a
uewf6� 0, for some w 2 P ; f 2 F and a value
X v ruewf6� 0, for some w 2 P ; f 2 F ; r � 1; . . . ; jcj:
346 W.W. Recker et al. / Transportation Research Part A 35 (2001) 339±369

3. Assignment constraints that are applied to match the relations between activity participationand vehicle usage as well as activity performers (household members).
4. Time window constraints that are used to specify available schedules for activity partici-pation.
5. Coupling constraints that de®ne the relations between vehicle-related variables and member-related variables.
6. Side constraints including budget, capacity, and rules for ride-sharing behavior.The solution vector, Z�n, to Eq. (1) represents the householdÕs utility maximizing behavior with
regard to completing its activity agenda. The solution patterns reveal personal travel behavior andactivity participation within a household context, while preserving the concept that the need fortravel originates from participation in activities, that travel constitutes the linkage between ac-tivities, and in which all of the required components are contained in the activity schedulingproblem.
3. Solution process
The use of a mathematical programming approach o�ers some distinct advantages to activity-based analyses. In addition to its ability to verify the existence and correctness of the complexsolutions arising from activity-travel path formulations, it is arguably the only approach thatinherently accommodates the continuity and consistency requirements governing the series ofactivities and travel links that comprise a traveler's movement through the time and space con-tinuum during a given period of analysis. Despite these strong conceptual advantages, the ap-proach o�ers some serious challenges that must be overcome to enable its practicalimplementation as a tool for policy analysis. Such formulations typically contain a large numberof constraints and variables, and the corresponding computational e�ort increases exponentiallywith the number of constraints and variables. 2 In general, it is extremely cumbersome to solvelarge-scale problems.
Such problems arise principally from the feature that the formulation is of the mixed integerprogramming type, which belongs to the so-called NP-Hard (non-deterministic polynomial time)class of problem; the number of fundamental computations increases exponentially with the sizeof the problem. Consequently, it is practically impossible to solve a large-scale problem in alimited amount of time, using formal solution algorithms. Because of these factors, a heuristicmethod was developed speci®cally to solve the HAPP.
The solution procedure that was employed is divided into a two-stage process. At the ®rst stage,a VRPTW is solved to generate initial feasible solutions; at the second stage, an enumeration oftours with the ride-sharing option is generated subject both to the number of available vehiclesand to a series of ®lters to screen out all illogical connections between activities. Since the feasible
2 In the particular formulation of the HAPP used herein, an augmented network is constructed with nodes that
number four times that of the original related vehicle routing problem. Moreover, additional complexity is associated
with the included indices representing both the vehicles and persons as well as additional constraints on temporal
feasibility and resource budgets.
W.W. Recker et al. / Transportation Research Part A 35 (2001) 339±369 347
solution space of the ®rst stage is larger than that of the second stage and the objective functionsare the same; the solution generated from the ®rst stage is feasible if any solution of the secondstage is feasible. This o�ers a way of reducing the enumeration by eliminating all infeasible initialsolutions.
In the ®rst stage of the solution procedure, a VRPTW-based problem with resource constraintsis constructed with the introduction of a vehicle relaxation concept. The solution procedure forthe ®rst stage is derived from an analysis of constrained shortest path problems and the concept ofopportunities from travel time savings. By adopting a shortest path algorithm, it is possible to ®ndthe locally least-cost tours. Application of relative savings information enables e�cient com-parisons among the possible candidate links to be inserted in the least-cost tours. The combi-nation of a constrained shortest path algorithm and the ``savings method'' produces a hybridheuristic that integrates tour construction and tour improvement. Given a multipartite networkwith N � N nodes, the algorithm is
Step 0. Set: k � 0Step 1. Calculate the savings matrix S:
S � �sij�; sij � �toi � toj ÿ tij� ÿ wij;
where
wij � maxfaj ÿ �Ti � si � tij�; 0gand wij is the minimal required waiting time to go from node i to j; tij the travel time from node i tonode j (o� current location); aj the early time window at node j; Ti the activity begin time at nodei; si is the activity duration at node i.
Step 2. Calculate opportunity cost matrix O:
O � �oij�; oij � maxm;nfsmng ÿ sij:
Step 3. De®ne the initial condition and the recurrence equations:
f0�o� � 0
fk�1�j� � minffk�i� � oij � tij � wijg; 8 j 2 V:
Step 4. Check feasibility of including the next node; if yes, go to 5; otherwise, go to Step 6.Step 5. Set k � k � 1; calculate fk�n� for each node n until all stages are ®nished.Step 6. Calculate the cost for the whole network based on the sum of the constructed tours and
all remaining single vertex tours.Step 7. If no nodes remain, then terminate; otherwise, extract the selected tour from the net-
work and go back to Step 0 with the remaining network.The algorithm begins with an initialization, and then calculates the general savings matrix from
spatial and temporal variables. The opportunity cost is de®ned as the cost of not utilizing least-cost links. As a basis for dynamic programming, the recurrence equation is de®ned from op-portunity cost. The feasibility of connecting the next node into the tour is tested for adherence totime window constraints, and compliance to person±node pairs (which mate an activity node withthe person to perform that activity). The scheduling is handled by ``moving forward'', in which thearrival time at the activity node and the activity begin time are adjusted by advancing the time
348 W.W. Recker et al. / Transportation Research Part A 35 (2001) 339±369

frame to ®nd the ®rst available time point for node insertion. The maximum time to shiftforward and backward are stored for subsequent manipulation of the time window for the nextnode. If inserting the next node into the tour is infeasible or if the resulting savings is negative, anew de®ned cost is calculated that accounts for the spatial and temporal cost of the current andall other single-node tours. Otherwise, combination of nodes continues until the end of thestage.
In the second stage, the heuristic described above is modi®ed by an insertion algorithm de-signed to deal with the large dimensionality of the problem. The algorithm is a modi®cation of thesavings method and based on the concept of ``wasting'', de®ned as the additional travel timeneeded to utilize ride-sharing. The resulting algorithm can be described as follows:
Step 1. Calculate the ``wasting'' of ride-sharing and ``savings'' of trip chaining.Step 2. Sort the wasting and savings of each node-pair in ascending order.Step 3. Select the minimal wasting node-pair to be the ride-sharing option and then apply the
savings method to insert the other nodes into the ®rst node-pair.Step 4. Check the side constraints regarding the time window, budget, load, and vehicle-node-
pair constraints. If violation of the side constraints is detected, select the node-pair with the nextminimal wasting and go to Step 3.
Step 5. Repeat until all of the nodes are exhausted.In combination, these algorithms take particular advantage of the characteristic that available
matching patterns are quite selective and regular, which greatly simpli®es the ride-sharingmatching process through a combination of ``wasting'' and ``savings'' for all available nodes. Fora typical problem involving a household with ®ve members and 20 activities, the solution processis less than 10 s in a standard personal computing environment.
4. Empirical application
Observed activity patterns are the result of decisions made by household members subject torestrictions placed either by transportation supply or resulting from a variety of unobservedfactors that in¯uence travel behavior. The collection of individual travel/activity patterns providesa description of revealed household travel demand. Optimal travel/activity patterns derived fromsolution of the HAPP represent normative behavior that is expected to exist under conditionsconstrained only by spatio-temporal conditions. The gap between the observed and optimal pro-vide a measure of the potential bene®t that may be achieved through elimination of these un-observed restrictions. As such, solution to the HAPP when compared to a base scenario de®nedby the existing, or observed, activity/travel patterns can be used as a performance measure toevaluate the limits of the potential of speci®c policy alternatives that derive their bene®t fromeither imposing or encouraging changes on daily activity/travel patterns.
To demonstrate its potential use in policy evaluation, upper-bounds of two widely-promotedTDM goals, increased ride-sharing and trip chaining, on accessibility and travel time gains areexamined for a sample of residents drawn from the Portland, Oregon region of the United States.Speci®cally, the HAPP model system is used to obtain distributions of potential travel timesavings and changes in an accessibility measure, de®ned by the volume of Hagerstrand space±timeprisms, that would result from optimal activity scheduling, trip chaining, and ride-sharing. These
W.W. Recker et al. / Transportation Research Part A 35 (2001) 339±369 349

potential gains are related to a variety of life-style, socio-demographic, and activity diary variablesthrough ordinary least squares regression.
4.1. Data speci®cation
Since the HAPP model represents activity/travel behavior of the collective members of ahousehold, detailed information is required on travel and activity participation for each member,as well as transportation supply information (including household vehicle holdings and networktravel times). These data were available from the Southwest Washington and Oregon Area 1994Activity and Travel Behavior Survey, which contain su�ciently detailed information, includingcomprehensive travel/activity diaries (with mode availability) and a regional transportation net-work model, for an application of the HAPP model.
The sample drawn for the survey included 2232 households and 5125 persons with a total of67 016 activities and 37 965 trips (each split fairly equally between two consecutive survey days).Available household information includes: household size, household income, type of dwellingunit, and the number of available vehicles. The survey also provides person-level data includingage, gender, employment status, occupation, student status, and driver license status. For thisanalysis, the sample was ®rst segmented according to household size, and two-member, three-member, and four-member households that were headed by adult male±female couples were re-tained for further analysis. 3 As a further simpli®cation, households having non-auto related travelactivities were excluded, and in-home activities were assumed to be completely ¯exible in terms oftheir scheduling. Based on these criteria, the results presented here are for sub-samples of 402, 193,and 153 two-member, three-member, and four-member households, respectively. Summary sta-tistics relating to household and travel characteristics are provided in Tables 1 and 2, respectively.
Network information, in the form of a household-speci®c matrix of travel times between alllocations named in the householdÕs travel diaries, was estimated by generating skim trees based onnon-peak-hour travel times based on the coded network of 1260 Tra�c Analysis Zones, 21 868links, and 9703 nodes. A comparison between network and survey travel times indicated ten-dencies of respondents to round o� reported travel time (to 5 or 10 min categories) and, in mostcases, to report a substantially longer travel time for trips with network travel times that were lessthan 5 min. A two-stage adjustment procedure was used to establish congruence between networkand reported travel times. The ®rst stage involved adjusting the network times, categorized indiscrete time intervals, by the ratio of the mean reported time to network time for each of the threesub-samples analyzed. This global adjustment of network travel time is then further adjusted toaccount for any di�erences in perception of individual households by multiplying the adjustednetwork times associated with that household's activity patterns by the ratio between thehousehold's total reported travel time and total adjusted network travel time for their patterns. 4
Following this adjustment, the sum of the reported travel times will be equal to the sum of thecorresponding network travel times for each household, providing a basis for comparison betweenrevealed and normative behavior.
3 This strati®cation simpli®es analysis and facilitates interpretation of results.4 For a related adjustment, see McNally and Recker (1986).
350 W.W. Recker et al. / Transportation Research Part A 35 (2001) 339±369

4.2. Achievable gains in accessibility and travel time with optimal scheduling, ride-sharing and tripchaining
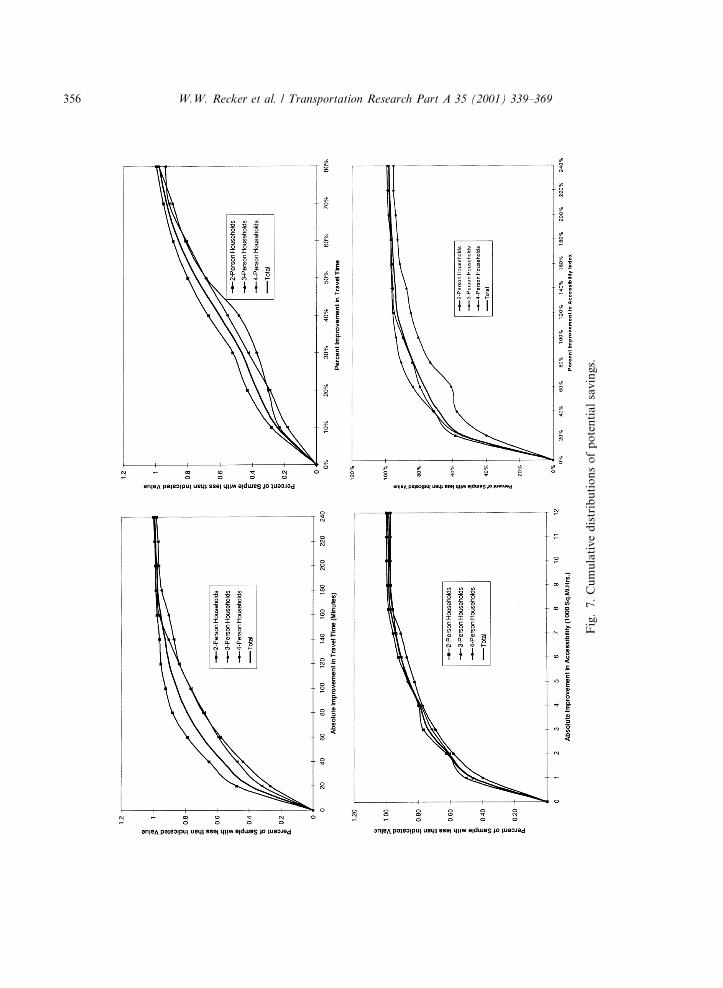
Summary distributions of the potential savings in household travel time and changes in ac-cessibility for each of the three household samples and the total sample are provided in Fig. 3through 7. Figs. 3 and 4 describe the distributions of both the relative and absolute improvementsin travel time associated with optimal scheduling, ride-sharing and trip chaining. The distributionsof absolute travel time savings (Fig. 3) are seen to be similar for the three household groupingsand generally resemble a negative exponential distributions. While a large portion of thehouseholds can be expected to have only minor relative improvement in daily travel time withoptimal scheduling, ride-sharing and trip chaining (almost 40% of the total sample were projectedto have a maximum savings of less than 20 min), almost 30% of sampled households exhibit thepotential for gains in travel time that are in excess of 1 h (Fig. 7). The general positive relationshipin these ®gures between the percentage of households achieving a speci®c potential improvementand household size is speculated as an artifact of a similar general tendency between the size of thehousehold and the complexity of the related activity pattern (i.e., greater household size leads tomore activities and trips, which lead to more complex time±space paths, which lead to a greateropportunity for ®nding e�ciencies). The distributions of relative travel time savings (Fig. 4),as measured by percent improvement in travel time, are generally ¯atter than their absolutecounterparts; a quarter of the total sample would be expected to reduce their daily travel time by
Table 2
Selected mean travel and activity characteristics
Characteristics Household size
2 Person 3 Person 4 Person
Number of out-of-home household activities per person 2.8 2.7 2.9
Number of trips per person 4.0 3.8 4.2
Travel time per person for out-of-home activities (min) 67.7 67.7 67.7
Travel time per trip (min) 19.1 19.5 18.0
Number of out-of-home activities per trip chain 1.88 1.86 1.79
Percent of chains with one activity 57.6 57.1 60.4
Percent of chains with two activities 17.5 18.5 16.4
Percent of chains with three activities 13.4 13.3 14.8
Percent of chains with four or more activities 11.5 11.1 8.4
Table 1
Demographic statistics for sample groups
Household attribute Household size
2 Person (N� 402) 3 Person (N� 197) 4 Person (N� 153)
Median household income $40±$45 K $50±$55 K $40±$45 K
Mean number of vehicles owned 2.0 2.5 2.3
Mean number of licensed drivers 1.9 2.3 2.2
Mean number of employed persons 1.2 1.8 1.8
Mean age of adults in household 53 42 39
W.W. Recker et al. / Transportation Research Part A 35 (2001) 339±369 351

at least a 50% were they to fully exploit available scheduling, ride-sharing and trip chainingoptions.
Just what can be inferred from these results? It is emphasized that no claim is made that the fullextent of travel time savings indicated here are achievable in practical terms. Under usual as-sumptions of rational choice, the observed travel/activity patterns are ``optimal'' in some senserelative to the collection of aspects that form any particular householdÕs utility function. To theextent that the minimization of travel time is an important component of such utility, the resultsgive some indication of the impact of considerations other than those strictly involving the travelaspects (e.g., travel time, auto availability) of activity participation on the householdÕs decisionstructure. Such considerations likely include the appropriateness of grouping/ordering certainactivities, personal tastes on when certain activities are best performed, and uncertainties in-volving activity duration, or even when the need/desire to participate in the activity at all arises.When taken in this light, the results give some measure of the infringement of these latter factors(and, likely, a host of other such factors) on the commonly held principle of travel time
Fig. 3. Distribution of potential household travel time improvements with ride-sharing and trip chaining.
352 W.W. Recker et al. / Transportation Research Part A 35 (2001) 339±369

minimization that is presumed to govern travel decisions. For example, it may be inferred fromthe results that, for approximately 25% of the total sample, considerations other than travel timestand in the way of potential travel time savings of as much as 50% in executing their daily activitypatterns.
Clearly, the potential travel time savings alluded to above have been weighed by the sampleagainst other factors and a determination made that the utility gain from these ``unobserved''factors outweighs the travel time savings. One tangible indicator of the magnitude of the tradeo�represented by this observation is captured in HagerstrandÕs measure of accessibility de®ned bythe cumulative volume of the space±time prisms generated by the travel time savings. To dem-onstrate this, potential gains in both absolute and relative accessibility, as measured by theHagerstrand index, were developed based on optimal scheduling, ride-sharing and trip chainingbehavior. The distributions of potential gains (Figs. 5 and 6) generally follow the same tendenciesnoted for the corresponding travel time distributions. The corresponding cumulative distributions(Fig. 7) indicate, for example, that approximately half the total sample could achieve increases in
Fig. 4. Distribution of potential relative travel time improvements with ride-sharing and trip chaining.
W.W. Recker et al. / Transportation Research Part A 35 (2001) 339±369 353

their accessibility index of 1000 square mile-hours or more; 40%, at least 2000 square mile-hours;25%, at least 3000 square mile-hours; 25%, at least 4000 square-mile-hours; and 15%, at least 5000square mile-hours. By way of perspective, over half the sample could have, at the extreme, eitherspent an additional 20 min in activities at their observed locations by virtue of travel time savingsor, if they chose to maximize accessibility, expanded their search space either for new activities orfor alternative locations for the activities that they performed by as much as 1800 square miles. 5
The actual utility of increased accessibility gained for each household under these circumstancesdepends on the positioning of the accessibility increases (i.e., the added volume(s) of the space±time prism(s) due to optimal scheduling and travel) within the context of each householdÕs pre-scribed activity sequence. Under the view of accessibility represented by the Hagerstrand con-struct, the ability to access the locations of potentially performable activities is a necessary, butnot su�cient, condition for realizing the utility that the location a�ords. Rather, there must also
5 Calculated as the area of the circle de®ning the meridian of the space±time prism (optimal vs. observed) under the
prevailing average network speed (approximately 30 mph).
Fig. 5. Distribution of potential household accessibility improvements with ride-sharing and trip chaining.
354 W.W. Recker et al. / Transportation Research Part A 35 (2001) 339±369

be su�cient time within the prism at that location to actually perform the activity. For example,an activity with the speci®ed duration shown in Fig. 8 can take place only within the shadedportion of the space±time prism displayed in that ®gure. In this example, the added utility ofincreased spatial accessibility is restricted to the area encompassed by the shaded disk, and furtherquali®ed by there being an acceptable location within that disk for performance of the activity.
To provide a more quantitative assessment of the potential value of the accessibility utilitygains that could be achieved by the sample, the construct represented in Fig. 8 was applied to``average'' characteristics of some of the more frequent activity/travel decisions exercised by thesample. Table 3 presents summary statistics on the average travel time (one way) and duration forthe most frequent discretionary activities participated in by the sample, together with the percentof the total sample that could potentially add any of these common discretionary activities (as-suming their average conditions) to their daily activity patterns within the expanded space±timeprisms generated by the travel time savings a�orded by ``optimal'' scheduling and trip chaining.These greatly simpli®ed results indicate that 15% of the sample would have gained su�cient
Fig. 6. Distribution of potential relative accessibility improvements with ride-sharing and trip chaining.
W.W. Recker et al. / Transportation Research Part A 35 (2001) 339±369 355
Fig
.7
.C
um
ula
tiv
ed
istr
ibu
tio
ns
of
po
ten
tia
lsa
vin
gs.
356 W.W. Recker et al. / Transportation Research Part A 35 (2001) 339±369

accessibility to perform an additional personal business or casual entertainment activity; 21%could have performed an additional general shopping activity. Put another way, for the greatmajority of the sample (approximately 80%), the added accessibility that could be gained throughthe most e�cient of travel/activity decisions generally would not be su�cient to translate intotheir participation in any additional out-of-home activity.
Fig. 8. Accessibility prism.
Table 3
``Usability'' of potential travel time savings
Activity type Mean duration
(h)
Mean travel time
(h)
Percent of total sample that could poten-
tially add activity within expanded prism
(%)
General shopping 0.78 0.22 21
Major shopping 1.02 0.34 1
Personal services 1.32 0.24 1
Professional services 1.11 0.30 1
Personal business 0.85 0.24 15
Casual entertainment 0.79 0.25 15
W.W. Recker et al. / Transportation Research Part A 35 (2001) 339±369 357

4.3. Relative roles of instrumental and socio-economic variables in enabling changes in accessibilityand travel time
To gain a better understanding of just how much of a householdÕs potential to achieve gains intravel time savings and accessibility is rooted in demographic structure (e.g., such variables as thepresence of small children, the number of driver's license holders, and other household socio-demographic variables) versus such instrumental variables as the practice of ride-sharing andtrip chaining, a series of regression analyses relating the outcomes of the prescribed optimal
Table 4
De®nition of variables used in regression analyses
Variable Description
HHsize Number of persons in household
Income Annual household income
Children Number of children under 12 years of age in household
Flex-time work Presence of ¯exible work schedule
Multi-job Holds more than one job
# Students Number of full-time students in household
Late activity Presence of activities performed from 12 a.m. to 6 a.m.
# Licensed drivers Number of household members with drivers license
# Vehicles Number of household vehicles
# Activities Total number of household activities
# Trips Total number of household trips
M Ride-sharing Ride-sharing incorporated in optimal pattern
M Chain complexity Di�erence between average trips per chain for optimal and observed patterns
Table 5
OLS results: absolute accessibility improvement
Variable Household size
2 Person (N� 402) 3 Person (N� 197) 4 Person (N� 153)
Children )971.50
Late activity 1029.87�
Multi-job )295.01
# Students )442.72�
# Licensed drivers 929.57
# Vehicles 709.40
# Activities 65.31�
M Ride-sharing
M Chain complexity 769.86 626.92� 745.89�
Constant )139.14� 1791.24 )693.51
R2 0.24 0.11 0.15
Adjusted R2 0.24 0.09 0.13
F-statistic 43.01�� 7.59�� 5.06��
* Signi®cant at 0.10 level. All other coe�cients signi®cant at 0.05.** Signi®cant at 0.05.
358 W.W. Recker et al. / Transportation Research Part A 35 (2001) 339±369

scheduling and travel behavior to sets of instrumental and socio-demograghic variables wereperformed. The notation and de®nition of the variables used in the regression analyses are listedin Table 4. The estimation results are provided in Tables 5 and 6 for accessibility and travel timeimprovements, respectively.
The results indicate that, although signi®cant in reducing absolute travel time for the house-holds (measured in units of total time spent traveling, and not in person±time units), ride-sharinggenerally has no e�ect on increasing accessibility. Rather, it is the introduction of more complextrip chaining of activities that positively impacts the generation of additional accessibility. Thepositive e�ect of ride-sharing on generating travel time savings tends to be enhanced by socio-demographic characteristics that mirror greater ¯exibility in meeting activity participation andtravel (e.g., having more vehicles at the disposal of the household, or a ¯exible work schedule).Gains in accessibility also track such variables, but are seen to be limited more by such con-straining factors as the presence of children or full-time students in the household or holding morethan one job; these latter factors all tend to place ``immovable pegs'' in the space of feasibleactivity patterns.
5. Summary and conclusions
Although accessibility measures have played an important role in transportation planningsince the 1960s, their application is still largely con®ned to the use of aggregate data andaverage spatial distance to construct home-based measurements. Such measurements excludeactivity-based constructs such as trip chaining and the role of temporal and spatial con-straints on accessibility. As such, existing measures are responsive principally to changes inland use and transportation infrastructure. Activity-based analyses provide a framework withwhich to explore alternative structures for accessibility measurements that ameliorates thesede®ciencies.
Table 6
OLS results: absolute travel time improvement
Variable Household size
2 Person (N� 402) 3 Person (N� 197) 4 Person (N� 153)
Flex-time work 13.97�
Late activity 12.34�
# Vehicles 3.69� 15.97
M Ride-sharing 35.14 53.03 27.42
M Chain complexity 5.66 9.38
Constant 14.34 22.08 22.61�
R2 0.19 0.21 0.08
Adjusted R2 0.18 0.20 0.07
F-statistic 22.77�� 16.85�� 6.60��
* Signi®cant at 0.10 level. All other coe�cients signi®cant at 0.05.** Signi®cant at 0.05.
W.W. Recker et al. / Transportation Research Part A 35 (2001) 339±369 359
The incorporation of activity-based concepts in the measurement of accessibility not only ex-plicitly acknowledges a temporal dimension in assessing the potential for spatial interaction butalso expands the applicability of accessibility consideration to a variety of real-world policy op-tions. For example, increased accessibility resulting from trip chaining behavior can be easilyaccounted for in this context; such results cannot be achieved with traditional accessibilitymeasurements.
The empirical application of the HAPP model system provides an indication of the po-tential of activity-based modeling approaches to assess the bounds on achievable improve-ments in accessibility and travel time based on daily household activity patterns. It alsoprovides an assessment of roles for trip chaining and ride-sharing as potentially e�ectivemethods to facilitate transportation policy objectives. The core element of HAPP is ex-tremely complex. Standard mathematical programming methods do not take advantage ofthe characteristics of the problem, thus, solution methods are both cumbersome and im-practical. A new solution process based on dynamic programming methods and modi®ed bydeveloping opportunity costs from the matrix of potential savings in travel and waiting timewas developed and used in this application. Although the solution process simpli®es thecomplex formulation and also accelerates solution time, it undoubtedly can be improvedsubstantially.
There is room for substantial improvement in the scope of application of the modeling ap-proach. Some strict assumptions made in the analysis, if relaxed, would make the approach moreuseful in general. In the future, the modeling process should more properly re¯ect behavioralaspects, uncertainty aspects, and a full GIS-based environment. The ®rst aspect is imperative tofully re¯ect real activity interaction situations, the second is necessary to accommodate the in-herent stochastic nature of activity participation and travel time variation, and the third wouldsupply a better analysis environment. Although the data were processed in a GIS, the programran independently. A full GIS environment would facilitate model application, in general, andwould enable certain aspects such as destination choice to be more accurately speci®ed. Herein,homogeneous behavior was assumed, however, the behavioral aspects which deal with user'sresponse behavior and habit are probably quite di�erent. Further research on user adaptation andhabit would bene®t the activity model. The stochastic nature of both activity participation andtravel time should be considered.
Some of these limitations may re¯ect uncertainty regarding the very core of the choice protocolassumed. For example, the disparity between the so-called ``optimal behavior'' and that observedsuggests that unmeasured constraints are present. The analysis assumes a simultaneous choicestructure. Yet, it is apparent that sub-optimality undoubtedly results when patterns are formed inreal-time ± for example, the occurrence in the evening of an activity that could have been opti-mally scheduled in the morning had it been planned. Casting the approach in a more dynamic (andstochastic) framework would certainly be more realistic; however, the challenges involved areformidable.
In conclusion, the results presented here indicate that sizable time savings could result fromurban trip makers optimizing their travel. To what extent such optimization could reasonablyoccur remains a major unanswered question. Our method merely enables the estimation of po-tential changes in accessibility via PirieÕs ``vacancy creations'', and not the actual measurement ofaccessibility (which in any case is a relative, and not absolute, concept). The constraint-based
360 W.W. Recker et al. / Transportation Research Part A 35 (2001) 339±369

approach utilized merely de®nes the limits on creating these ``vacancies''. It is not a theory, butrather, places physical bounds on whatever theory is valid.
Appendix A. Model formulation
The sets of activity nodes, household members, available vehicles and function for a givenhousehold are de®ned and described as follows:
P � f1; 2; . . . ; nÿ 1; ng;P 0 � f0; 1; 2; . . . ; nÿ 1; n; dg;H � fh1; h2; . . . ; hnÿ1; hng;H 0 � f0; h1; h2; . . . ; hnÿ1; hn; dg;N � f1; 2; . . . ; nÿ 1; n; h1; h2; . . . ; hnÿ1; hng;N 0 � f0; 1; 2; . . . ; nÿ 1; n; h1; h2; . . . ; hnÿ1; hn; dg;g � f1; 2; . . . ; jgjg;m � f1; 2; . . . ; jvjg;c � f1; 2; . . . ; jcjg;F � f1; 2g;
where
P The set of all activity nodes scheduled to be completed by members in the household.P 0 The set of all activity nodes including starting node and ending node.H The set of all temporary returning home nodes associated with each activity node.H 0 The set of all home nodes including starting node and ending node.N The set of all activity nodes and return to home nodes associated with each activity
node.N 0 The set of N together with starting node and ending node.g The set of all of the members in the household.m The set of all of the available vehicles used by members in the household to complete
their scheduled activities.c The set of people in a vehicle (including the driver and the passengers).F The set of functions that could be performed at an activity node, with ``1'', representing
delivery, and ``2'', pickup (physically, these functions are performed at the locations ofthe associated activity nodes, and logically, these functions are used to represent thoseexpanded nodes associated with the original activity nodes).
W.W. Recker et al. / Transportation Research Part A 35 (2001) 339±369 361
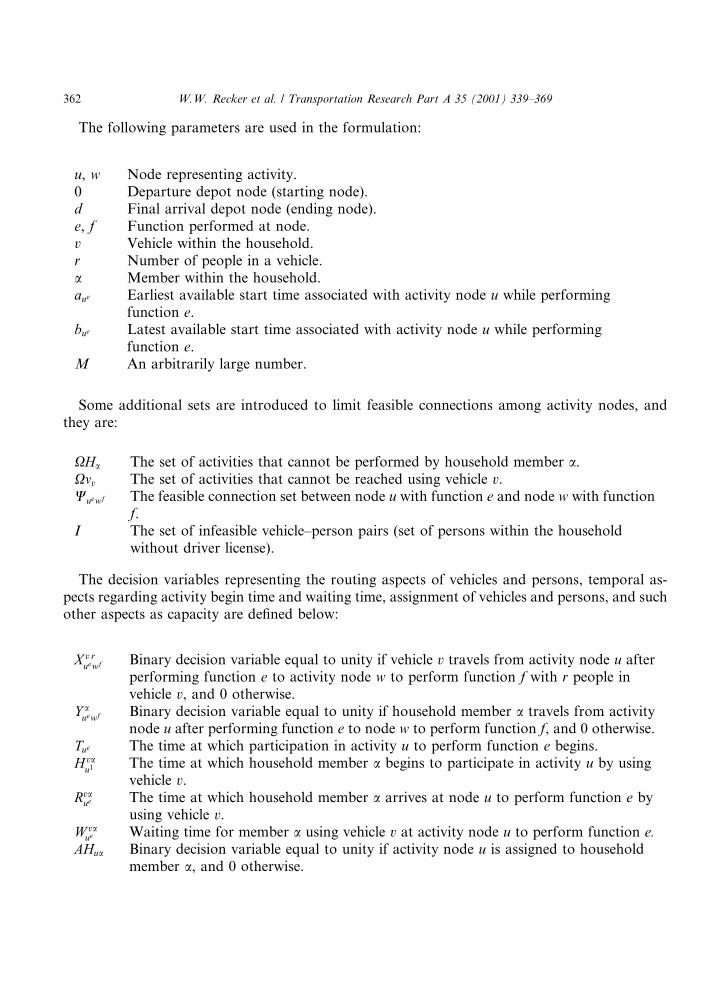
The following parameters are used in the formulation:
Some additional sets are introduced to limit feasible connections among activity nodes, andthey are:
The decision variables representing the routing aspects of vehicles and persons, temporal as-pects regarding activity begin time and waiting time, assignment of vehicles and persons, and suchother aspects as capacity are de®ned below:
XHa The set of activities that cannot be performed by household member a.Xmv The set of activities that cannot be reached using vehicle v.Wuewf The feasible connection set between node u with function e and node w with function
f.I The set of infeasible vehicle±person pairs (set of persons within the household
without driver license).
u, w Node representing activity.0 Departure depot node (starting node).d Final arrival depot node (ending node).e, f Function performed at node.v Vehicle within the household.r Number of people in a vehicle.a Member within the household.aue Earliest available start time associated with activity node u while performing
function e.bue Latest available start time associated with activity node u while performing
function e.M An arbitrarily large number.
X v ruewf Binary decision variable equal to unity if vehicle v travels from activity node u after
performing function e to activity node w to perform function f with r people invehicle v, and 0 otherwise.
Y auewf Binary decision variable equal to unity if household member a travels from activity
node u after performing function e to node w to perform function f, and 0 otherwise.Tue The time at which participation in activity u to perform function e begins.H va
u1 The time at which household member a begins to participate in activity u by usingvehicle v.
Rvaue The time at which household member a arrives at node u to perform function e by
using vehicle v.W va
ue Waiting time for member a using vehicle v at activity node u to perform function e.AHua Binary decision variable equal to unity if activity node u is assigned to household
member a, and 0 otherwise.
362 W.W. Recker et al. / Transportation Research Part A 35 (2001) 339±369
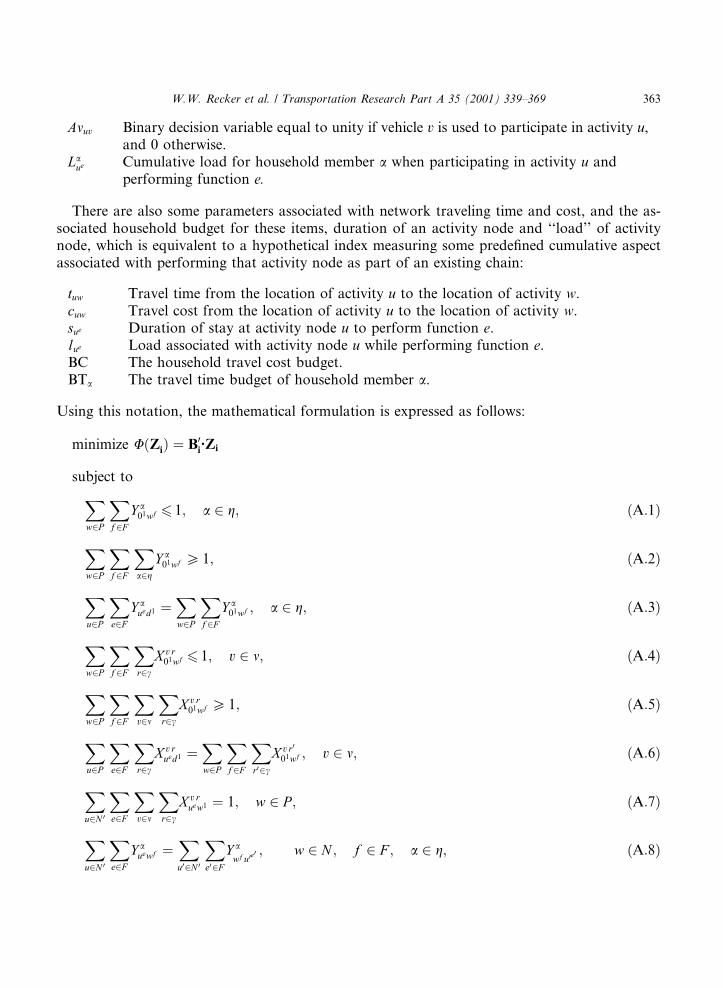
There are also some parameters associated with network traveling time and cost, and the as-sociated household budget for these items, duration of an activity node and ``load'' of activitynode, which is equivalent to a hypothetical index measuring some prede®ned cumulative aspectassociated with performing that activity node as part of an existing chain:
Using this notation, the mathematical formulation is expressed as follows:
minimize U�Zi� � B0i´Zi
subject toXw2P
Xf2F
Y a01wf 6 1; a 2 g; �A:1�
Xw2P
Xf2F
Xa2g
Y a01wf P 1; �A:2�
Xu2P
Xe2F
Y aued1 �
Xw2P
Xf2F
Y a01wf ; a 2 g; �A:3�
Xw2P
Xf2F
Xr2c
X v r01wf 6 1; v 2 m; �A:4�
Xw2P
Xf2F
Xv2m
Xr2c
X v r01wf P 1; �A:5�
Xu2P
Xe2F
Xr2c
X v rued1 �
Xw2P
Xf2F
Xr02c
X v r001wf ; v 2 m; �A:6�
Xu2N 0
Xe2F
Xv2m
Xr2c
X v ruew1 � 1; w 2 P ; �A:7�
Xu2N 0
Xe2F
Y auewf �
Xu02N 0
Xe02F
Y a
wf u0e0 ; w 2 N ; f 2 F ; a 2 g; �A:8�
tuw Travel time from the location of activity u to the location of activity w.cuw Travel cost from the location of activity u to the location of activity w.sue Duration of stay at activity node u to perform function e.lue Load associated with activity node u while performing function e.BC The household travel cost budget.BTa The travel time budget of household member a.
Amuv Binary decision variable equal to unity if vehicle v is used to participate in activity u,and 0 otherwise.
Laue Cumulative load for household member a when participating in activity u and
performing function e.
W.W. Recker et al. / Transportation Research Part A 35 (2001) 339±369 363

Xu2N 0
Xe2F
Xr2c
X v ruewf � r �
Xu02N 0
Xe02F
Xr02c
X v r0
wf u0e0 � r0; w 2 N ; f 2 F ; v 2 m; �A:9�
Xv2m
Xr2c
X v ruewf � r �
Xa2g
Y auewf ; u;w 2 P ; e; f 2 F ; �A:10�
Xv2m
Xr2c
X v rued1 � r �
Xv2m
Xr2c
X v ruew1 � r �
Xa2g
Y aued1 �
Xa2g
Y auew1 u 2 P ; w 2 H ; e 2 F ; �A:11�
Xu2H 0
Xv2m
Xr2c
X v ru1wf � r �
Xu2H 0
Xa2g
Y au1wf ; w 2 P ; f 2 F ; �A:12�
Xa2g
AHua � 1; u 2 P ; �A:13�
ÿ 1ÿ ÿ Y a
u1u2
� �M 6AHua ÿ Y au1u2 6 1
ÿ ÿ Y au1u2
� �M ; u 2 P ; a 2 g; �A:14�
ÿ 1
"ÿXu2N 0
Y au1w1
!� 1
ÿXu2N 0
Xv2m
X v 1u1w1
!#�M 6AHua ÿ
Xu2N 0
Y au1w1
6 1
"ÿXu2N 0
Y au1w1
!� 1
ÿXu2N 0
Xv2m
X v 1u1w1
!#�M ; w 2 P ; a 2 g; �A:15�
Amwv �Xu2N 0
Xe2F
Xr2c
X v ruew1 ; w 2 P ; v 2 m; �A:16�
ÿ 1
ÿXu2N 0
Xe2F
X v 1uew1
!�M 6
Xu2N 0
Xe2F
X v 1uew1 ÿ
Xu02N 0
Xe02F
X v 1w1u0e0
6 1
ÿXu2N 0
Xe2F
X v 1uew1
!�M ; w 2 P ; w 6� u 6� u0; v 2 m; �A:17�
ÿ 1
ÿXu2N 0
Xe2F
X v r0uew1
!�M 6
Xu2N 0
Xe2F
X v r0uew1 ÿ
Xu02N 0
Xe02F
X v rw1u0e
0 6 1
ÿXu2N 0
Xe2F
X v r0uew1
!�M ;
w 2 P ; w 6� u 6� u0; v 2 m; r0 � r � 1; �A:18�
ÿ 1
ÿXu2N 0
Xe2F
X v ruew2
!�M 6
Xu2N 0
Xe2F
X v ruew2 ÿ
Xu02N 0
Xe02F
X v r0
w2u0e0 6 1
ÿXu2N 0
Xe2F
X v ruew2
!�M ;
w 2 P ; w 6� u 6� u0; v 2 m; r0 � r � 1; �A:19�
364 W.W. Recker et al. / Transportation Research Part A 35 (2001) 339±369

ÿ 1ÿ" ÿ Y a
uewf
�� 1
ÿXr2c
X v ruewf
!#�M 6Rva
ue �W vaue � tuw � sue � AHua ÿ Rva
wf
6 1ÿ" ÿ Y a
uewf
�� 1
ÿXr2c
X v ruewf
!#�M ; u;w 2 P ; e; f 2 F ; a 2 g; v 2 m; �A:20�
ÿ 1
"ÿXu2H 0
Y au1wf
!� 1
ÿXr2c
X v ru01wf
!#�M 6H va
u1 � tuw ÿ Rvawf
6 1
"ÿXu2H 0
Y au1wf
!� 1
ÿXr2c
X v ru01 wf
!#�M ;
u0 2 H 0; w 2 P ; f 2 F ; a 2 g; v 2 m; �A:21�
ÿ 1ÿ" ÿ Y a
u1wf
�� 1
ÿXu02H 0
Xr2c
X v ru01 wf
!#�M 6H va
u1 � tuw ÿ Rvawf
6 1ÿ" ÿ Y a
u1wf
�� 1
ÿXu02H 0
Xr2c
X v ru01wf
!#�M ;
u 2 H 0; w 2 P ; f 2 F ; a 2 g; v 2 m; �A:22�
ÿ 1ÿ" ÿ Y a
uew1
�� 1
ÿXw02H 0
Xr2c
X v ruew01
!#�M 6 Tue � tuw � sue � AHua ÿ H va
w1
6 1ÿ" ÿ Y a
uew1
�� 1
ÿXw02H 0
Xr2c
X v ruew01
!#�M ;
u 2 P ; w 2 H 0; e 2 F ; a 2 g; v 2 m; �A:23�
ÿ 1
"ÿXw2H 0
Y auew1
!� 1
ÿXr2c
X v ruew01
!#�M 6 Tue � tuw � sue � AHua ÿ H va
w1
6 1
"ÿXw2H 0
Y auew1
!� 1
ÿXr2c
X v ruew01
!#�M ;
u 2 P ; w0 2 H 0; e 2 F ; a 2 g; v 2 m; �A:24�
W.W. Recker et al. / Transportation Research Part A 35 (2001) 339±369 365

ÿ 1ÿ" ÿ Y a
uew2
�� 1
ÿXr2c
X v ruew2
!#�M 6Rva
w2 � W vaw2 ÿ Tw2
6 1ÿ" ÿ Y a
uew2
�� 1
ÿXr2c
X v ruew2
!#�M ;
u;w 2 P ; e 2 F ; a 2 g; v 2 m; �A:25�
ÿ ��1ÿ AHua� � �1ÿ Amuv�� �M 6Rvau1 � W va
u1 ÿ Tu1 6 ��1ÿ AHua� � �1ÿ Amuv�� �M ;
u 2 P ; a 2 g; v 2 m �A:26�
ÿ 1ÿh ÿ Y a
uewf
�� 1�ÿ Y a0
uewf
�� �1ÿ X v r
uewf �i�M 6Rva
wf ÿ Rva0wf
6 1ÿh ÿ Y a
uewf
�� 1�ÿ Y a0
uewf
�� 1ÿ ÿ X v r
uewf
�i �M ;
u 2 N 0; w 2 P ; e; f 2 F ; a; a0 2 g; v 2 m; �A:27�
ÿ 1ÿh ÿ Y a
uew1
�� 1�ÿ Y a0
uew01
�� 1ÿ ÿ X v r
uew1
�i �M 6H vaw1 ÿ H va0
w01
6 1ÿh ÿ Y a
uew1
�� 1�ÿ Y a0
uew01
��1ÿ X v r
uew1�i�M ;
w;w0 2 H 0; u 2 P ; e 2 F ; a; a0 2 g; v 2 m; �A:28�
ÿ 1ÿh ÿ X v 1
uew1
�� 1�ÿ X v01
uew01
�� 1ÿ ÿ Y a
uew1
�i �M 6H vaw1 ÿ H v0a
w01
6 1ÿh ÿ X v 1
uew1
�� 1�ÿ X v01
uew01
�� 1ÿ ÿ Y a
uew1
�i �M ;
w;w0 2 H 0; u 2 P ; e 2 F ; a 2 g; v; v0 2 m; �A:29�
ÿ 1�� ÿ AHua� � 1ÿ ÿ Y a
uewf
�� �M 6 Laue � lue ÿ La
wf 6 �1� ÿ AHua� � 1
ÿ ÿ Y auewf
�� �M ;
u;w 2 N 0; e; f 2 F ; a 2 g; �A:30�
awf ÿ Twf 6 1
ÿXu2P
Xe2F
Xv2m
Xr2c
X vruewf
!�M P ÿ bwf � Twf ; w 2 P ; f 2 F ; �A:31�
Xu2N 0
Xe2F
Xw2N 0
Xf2F
Xv2m
Xr2c
X vruewf � cuw6BC; �A:32�
Xu2N 0
Xe2F
Xw2N 0
Xf2F
Y auewf � tuw6BTa; a 2 g; �A:33�
Xv2m
Xr2c
X v ruewf � 0; �ue;wf � 62 wuewf ; �A:34�
366 W.W. Recker et al. / Transportation Research Part A 35 (2001) 339±369

X v1u2w2 � 0; u;w 2 N ; v 2 m; �A:35�
X v ru1u2 � 0; u 2 P ; v 2 m; r 2 c; r P 2; �A:36�
X v 1u1w1 � Y a
u1w1 6 1; u;w 2 P 0; fv; ag 2 I : �A:37�Eqs. (A.1) and (A.2) depict the origination of a person tour, and allow the possibility of a memberto stay at home. Eq. (A.3) speci®es that the end of a person tour must be associated with thecorresponding beginning of the person tour. Eqs. (A.4)±(A.6) have the same functions as Eqs.(A.1)±(A.3) but are applied to the vehicle tour variable. Eq. (A.7) states that each activity nodemust be visited by one vehicle while performing the service of the activity. Eq. (A.8) ensures the¯ow conservation constraint between all activity nodes; that is, the number of people going intothe activity node must be equal to the number of people going out of the activity node. The samesituation can be formulated as Eq. (A.9) when applied to a vehicle tour. The coupling constraintsfor the vehicle-routing variable and person-routing variable are speci®ed in Eqs. (A.10)±(A.12).Eq. (A.10) sets up the one-to-one relationship at activity nodes for vehicle-routing variable andperson-routing variable. Eqs. (A.11) and (A.12) allow for the transference of vehicle and memberwhen either arriving at or departing from home nodes. The association of activity and membercan be described by Eqs. (A.13)±(A.15). Eq. (A.13) speci®es that each activity must be performedby one, and only one, member. Eqs. (A.14) and (A.15) set the relation between assignmentvariable and person-routing variable. The relation between assignment variable of vehicle andvehicle-routing variable is speci®ed by Eq. (A.16). Eq. (A.17) addresses the ¯ow conservationconstraint for one-person vehicles (drive-alone vehicle). Eqs. (A.18) and (A.19) describe thechange in the number of people inside a vehicle when stopping at a delivery node and a pickupnode, respectively. Temporal constraints are listed from Eqs. (A.20)±(A.29). Eq. (A.20) ensuresthe continuity of temporal space between activity nodes. Eqs. (A.21) and (A.22) match thetemporal constraint for the links departing from di�erent home nodes when person or vehicletransference is allowed. The same condition can be applied to Eqs. (A.23) and (A.24) for the linksarriving at di�erent home nodes. Eqs. (A.25) and (A.26) describe the relation between arrival timeand activity begin time. The coupling constraints of the arrival time variable for di�erent personsis matched by Eq. (A.27). Eqs. (A.28) and (A.29) ensure that the activity begin time of the homenodes be equal when transference of person or vehicle is allowed. The load budget constraint inEq. (A.30) describes the accumulative load at each activity node. The time window constraint inEq. (A.31) limits the freedom of performing an activity at certain time periods. Eqs. (A.32) and(A.33) specify the budget constraints of travel cost and travel time for each household memberand the whole household, respectively. All illogical connections are listed in Eqs. (A.34)±(A.36).Finally, infeasible person±vehicle pairs are excluded to ensure that a vehicle is used by a quali®eddriver in Eq. (A.37).
References
Arentze, T.A., Borgers, A.W.J., Timmermans, H.J.P., 1994a. Multistop-based measurements of accessibility in a GIS
environment. International Journal of Geographical Information Systems 8 (4), 343±356.
W.W. Recker et al. / Transportation Research Part A 35 (2001) 339±369 367

Arentze, T.A., Borgers, A.W.J., Timmermans, H.J.P., 1994b. Geographical information systems and the measurement
of accessibility in the context of multipurpose travel: a new approach. Geographical Systems 1, 87±102.
Burns, L.D., Golob, T.F., 1976. The role of accessibility in basic transportation choice behavior. Transportation 5,
175±198.
Burns, L.D., 1979. Transportation, Temporal, and Spatial Components of Accessibility. D.C. Heath, Lexington,
MA.
Dalvi, M.Q., Martin, K.M., 1976. The measurement of accessibility: some preliminary results. Transportation 5,
17±42.
Desrochers, M., Lenstra, J.K., Savelsbergh, M.W.P., Soumis, F., 1988. Vehicle routing with time windows:
optimization and approximation. In: Golden, B.L., Assad, A.A. (Eds.), Vehicle Routing: Methods and Studies.
Elsevier, Netherlands, pp. 65±84.
Golden, B.L., 1984. Introduction to and advances in vehicle routing methods. In: Florian, M. (Ed.), Transportation
Planning Models. Elsevier, Amsterdam.
Golob, T.F., 1985. Analyzing activity pattern data using qualitative multivariate statistical methods. In: Nijkamp, P.,
Leitner, H., Wrigley, N. (Eds.), Measuring the Unmeasurable. Nijho� (Martinus), Dordrecht, Netherlands.
Golob, T.F., 1986. A non-linear canonical correlation analysis of weekly trip chaining behavior in Netherlands.
Transportation Research A 20, 385±389.
Golob, T.F., Meurs, H., 1987. A structural model of temporal change in multimodal travel demand. Paper Presented at
the 66th Annual Meeting of the Transportation Research Board, Washington, DC.
Golob, T.F., McNally, M.G., 1997. A model of activity participation and travel interactions between household heads.
Transportation Research B 31 (3), 177±194.
Hagerstrand, T., 1970. What about people in regional science? Papers of the Regional Science Association 24, 7±21.
Hansen, W.G., 1959. How accessibility shapes land use. Journal of the American Institute of Planners 25, 73±76.
Ingram, D.R., 1971. The concept of accessibility: a search for an operational form. Regional Studies 5, 101±107.
Jones, P.M., Dix, M.C., Clarke, M.I., Heggie, I.G., 1983. Understanding Travel Behavior. Gower, Aldershot, UK.
Kitamura, R., Kermanshah, M., 1983. Identifying time and history dependencies of activity choice. Transportation
Research Record 944, 22±30.
Kitamura, R., Kermanshah, M., 1984. A sequential model of interdependent activity and destination choice.
Transportation Research Record 987, 81±89.
Koenig, J.G., 1980. Indicators of urban accessibility: theory and application. Transportation 9, 145±172.
Koppelman, F.S., Townsend, T.A., 1987. Task allocation among household members: theory and analysis. Paper
Presented at the Fifth International Conference on Travel Behavior, Aix-en-Provence, France.
Kwan, M.-P., 1998. Space±time and integral measures of individual accessibility: a comparative analysis using a point-
based framework. Geographical Analysis 30 (3), 191±216.
Lenntorp, B., 1976. Paths in space±time environments. Lund Series in Geography, Series B, vol. 44, Lund.
Lenntorp, B., 1978. A time-geographic stimulation model of individual activity programs. In: Carlstein, T., Parkes, D.,
Thrift, N. (Eds.), Timing Space and Spacing Time, Volume 2: Human Activity and Time Geography. Edward
Arnold, London, p. 162.
Miller, H.J., 1999. Measuring space±time accessibility bene®ts within transportation networks: basic theory and
computational procedures. Geographical Analysis 31 (2), 187±212.
Morris, J.M., Dumble, P.L., Wigan, M.R., 1979. Accessibility indicators for transportation planning. Transportation
Research A 13, 91±109.
Niishi, K., Kondo, K., 1992. Trip linkages of urban railway commuters under time±space constraints: some empirical
observations. Transportation Research B 26, 33±44.
Pirie, G.H., 1979. Measuring accessibility: a review and proposal. Environment and Planning A 11, 299±312.
Recker, W.W., 1995. The household activity pattern problem (HAPP): general formulation and solution. Transpor-
tation Research B 29 (1), 61±77.
Recker, W.W., McNally, M.G., Root, G.S., 1986a. A model of complex travel behavior ± Part 1: theoretical
development. Transportation Research A 20, 307±318.
Recker, W.W., McNally, M.G., Root, G.S., 1986b. A model of complex travel behavior ± Part 2: an operational model.
Transportation Research A 20, 319±330.
368 W.W. Recker et al. / Transportation Research Part A 35 (2001) 339±369

Solomon, M.M., Desrosiers, J., 1988. Time window constrained routing and scheduling problems. Transportation
Science 22 (1), 1±13.
Weibull, J.W., 1976. An axiomatic approach to the measurement of accessibility. Regional Science and Urban
Economics 6, 357±379.
Weibull, J.W., 1980. On the numerical measurement of accessibility. Environment and Planning A 12, 53±67.
W.W. Recker et al. / Transportation Research Part A 35 (2001) 339±369 369